Abstract
The power system (abbreviated as PS for convenience) is one of the indispensable infrastructures in modern society, and its stable operation is crucial for ensuring the normal operation of the national economy and society. With the continuous expansion and complexity of the power grid, power correlation analysis has become increasingly important in the operation, planning, and management of the power system. Temperature is one of the main factors affecting power load (abbreviated as PL for convenience), and how to integrate the periodic characteristics of temperature with load analysis has become a top priority. This article improved the logistic algorithm and applied it to the power correlation analysis of combined load and temperature periodic characteristics and collected four seasonal PL parameters and temperature parameters from January to December 2022. The study analyzed the correlation between PL and temperature periodic characteristics, and also compared the accuracy of PS correlation analysis using the logistic algorithm and improved logistic algorithm. According to the experimental results, it could be concluded that at 1 and 2 o’clock on 1 January 2022, the temperature was at the lowest, both of which were −3 °C, while the PS load was 1000 MW and 1100 MW, respectively. It could be seen that in winter, as the temperature was lower the PL increased. In July 2022, the load and temperature of the PS were continuously increasing, reaching their maximum at 10 o’clock and it could be observed that as the temperature increased, the PL also increased. This was because both low and high temperatures increased the operation of the power equipment, thereby increasing the PL. It was also confirmed that fusing multiple features and adopting an improved logistic algorithm could improve the accuracy of the prediction results. The improved logistic algorithm could be applied to related fields such as PL forecasting and provide a scientific decision-making basis for the power industry. This could also provide a reference for data analysis and prediction in other fields.
1. Introduction
The prediction and control of PL is one of the core issues in the operation of the PS. In PL forecasting, temperature is an important influencing factor because changes in temperature directly affect the electricity demand. Power correlation analysis is a vital issue in the operation and management of the PS. By analyzing various factors that affect PL, it changes in PL can be better predicted and the scheduling and control capabilities of the PS improved. Among them, temperature is one of the important factors affecting the changes in PL and has obvious cyclical characteristics. Therefore, conducting in-depth research on the correlation between temperature periodicity and PL is crucial for improving the accuracy of PS load forecasting and strengthening PS dispatch control. Traditional PL forecasting methods often use time series analysis or neural network models, but these methods have significant limitations when considering the impact of other factors on PL. The power correlation analysis method based on the improved logistic algorithm that integrates the periodic characteristics of load and temperature can more accurately predict changes in PL and improve the operational efficiency and stability of the PS. It can comprehensively consider the impact of various factors on PL, improve prediction accuracy and credibility, and provide important theoretical and methodological support for achieving intelligent scheduling of PS.
Electricity is one of the indispensable basic energy sources in modern society, and the supply–demand relationship of electricity is crucial for ensuring normal operation of the social economy. The intermittency and uncertainty of renewable energy generation may pose significant challenges and complicate the operation of energy microgrids. To overcome these challenges, Zhang Cuo proposed a two-stage coordinated operation method to optimize the coordination of cogeneration, flexible power and heat load, and heat storage under these multiple uncertainties [1]. Machine learning algorithms have been widely used for short-term PL forecasting. Tang Xianlun proposed a multi-layer bidirectional recurrent neural network model based on short-term memory and gated recursive unit to predict short-term PL and verified it on two data sets [2]. Short term PL forecasting plays a crucial role in power supply systems. Wu Fei proposed a new short-term PL forecasting method [3]. The improved logistic algorithm is a classification algorithm that can classify PL data to achieve power correlation analysis.
Load forecasting is crucial for the effective scheduling and operation of PS. Integrating the periodic characteristics of load and temperature can improve the accuracy of PL forecasting, thereby enhancing the credibility and accuracy of power correlation analysis. Ouyang Tinghui proposed a data-driven deep learning framework to predict short-term PL. One year grid load data collected from urban areas in Texas and Arkansas in the United States were used in case studies for short-term load forecasting (one day and one week in advance) [4]. The smart grid can collect a large amount of high-dimensional and multi type data related to grid operation. The application of artificial intelligence technology in smart grids is becoming increasingly evident. Omitaomu Olufemi A conducted a structured review of existing research on common artificial intelligence technologies in smart grids and PS. The review also provided further research challenges for the application of artificial intelligence technology to achieve a true smart grid system [5]. However, the improved logistic algorithm was not analyzed and its improvement points were not elaborated on.
To enhance the accuracy of PL forecasting, this article applied the improved logistic algorithm to the power correlation analysis of the periodic characteristics of load and temperature. The results showed that the improved logistic algorithm had a very good effect. Whether the temperature increased or decreased, the PL increased to a certain extent. This is because high and low temperatures increase the use of power equipment, thereby increasing the load on the PS. The innovation of this article relies on its ability to integrate the periodic characteristics of load and temperature, thus taking into account the impact of multiple factors on PL and improving the accuracy of prediction. The improved logistic algorithm was used for PL forecasting. Compared to traditional logistic algorithms, this algorithm could better fit the periodic characteristics of PL and improve the accuracy of prediction.
2. Power Correlation Evaluation Based on Improved Logistic Algorithm
2.1. Evaluation of Electricity Relevance
Electricity relevance refers to the importance of electricity in social economy and daily life, as well as its close connection with other fields. Electricity is one of the indispensable energy sources in modern society, and it has wide applications in various fields such as industry, agriculture, transportation, communication, medical treatment, education, etc. Therefore, the supply and use of electricity are crucial for the development of society and the economy. Factors such as temperature, humidity, and wind speed can directly affect the electricity demand, thereby affecting the PL; the intensity of social activities and factors such as holidays can also have an impact on electricity load and the changes in seasons can directly affect the electricity demand, thereby affecting the PL.
Electricity is closely related to industrial production. Modern industry cannot do without the support of electricity. In people’s daily lives, various electrical equipment can always be seen, such as televisions, air conditioners, refrigerators, washing machines, etc. The operation of such equipment requires the support of electricity. Industrial production requires a large amount of electric power to drive production equipment. Electricity, as the fundamental energy source for industrial production, is crucial for the development of industry and economic growth. Electricity is not only a source of energy for industrial production, but also a power source for various equipment and machines in the production process [6]. In some developing countries, insufficient electricity supply has severely affected industrial production and restricted economic development.
There is also a close relationship between electricity and transportation. Modern transportation cannot do without the support of electricity [7]. Electricity, as the fundamental energy source for transportation, drives the operation of various means of transportation. For example, electric vehicles, high-speed trains, subways, etc., all require the support of electricity. The demand for transportation is increasing, which requires more electricity supply. Therefore, as the foundation of transportation, electricity is of great significance for the development of transportation and the advancement of urbanization.
Electricity is also closely related to communication technology. The development of modern communication technology requires the support of electricity, such as the internet and mobile phones, for normal operation. The supply of electricity also requires the support of communication technology, such as monitoring, scheduling, and control of PS. Therefore, the development of power and communication technology is mutually reinforcing and closely related.
Electricity is also closely related to environmental protection. The supply of electricity is also rapidly increasing. The traditional thermal power generation method emits a large amount of greenhouse gases and pollutants, bringing great pressure on the environment. Therefore, environmentally friendly power supply methods have also become an important issue in today’s society. The development and utilization of new energy sources, such as solar, wind, and hydropower, have become important ways to address environmental issues in electricity.
As one of the indispensable energy sources in modern society, electricity is closely related to various fields. The supply and use of electricity are crucial for the development of society and the economy. Therefore, how to ensure a stable supply with environmental protection of electricity is one of the important issues facing contemporary society.
2.2. Logistic Algorithm
The logistic algorithm, also known as the logical regression algorithm, is a classification algorithm based on the principle of maximum entropy, which is widely used in various data mining, machine learning, and statistical analysis problems. The logistic algorithm has the advantages of fast computation speed, easy implementation, robustness, strong interpretability, and wide applicability [8]. It is a commonly used classification algorithm. The main idea is to construct a linear function to describe the relationship between the feature and the target variable and compress the output result of the linear function to 0–1 through a sigmoid function (or logistic function) to represent the probability value, in order to achieve the classification of the target variable. The advantage of the logistic algorithm lies in its good interpretability and simplicity, as well as its good classification performance, which can achieve high accuracy in most cases. In addition, due to the inherent characteristics of the algorithm, it is suitable for predicting and classifying binary classification problems.
The basic formula of the logistic algorithm is outlined.
The original logistic algorithm formula is as follows:
Within it, represents the parameters of the control curve, and is the independent variable.
The logistic algorithm with bias terms has the following formula:
Within it, is the bias term, which can be understood as a parameter for adjusting the position of the curve.
The formula for the multi classification logistic algorithm is outlined.
For the case of categories, the formulas are as follows:
Within it, is the number of independent variables, and is the coefficient.
In the analysis of power correlation by integrating the periodic characteristics of load and temperature, traditional logistic algorithms have the following shortcomings:
The multi classification problem cannot be handled well. Traditional logistic algorithms can only handle binary classification problems. For problems with multiple categories, other methods or improvements are needed; it is sensitive to noise and outliers in data sets and is prone to overfitting or underfitting. In practical applications, there are often a lot of outliers and noise, which requires the algorithm to have better robustness and stability. If there are periodic changes in the data, traditional logistic algorithms often cannot capture these changes, so there may be significant deficiencies in model accuracy; when adjusting the parameters of a curve. It is often necessary to manually adjust the parameters, which can be cumbersome for complex problems and may require different parameter adjustments for different datasets.
The traditional logistic algorithm has some limitations in integrating the periodic characteristics of load and temperature in power correlation analysis, and corresponding improvements and optimizations need to be made for specific problems.
2.3. Improved Logistic Algorithm
The improved logistic algorithm is based on the traditional logistic algorithm model and has been optimized to address some of its problems and bottlenecks, so as to improve its prediction accuracy and applicability. Specifically, the improved logistic algorithm can be made better in the following aspects.
Feature engineering: by adopting more reasonable and effective feature selection/extraction methods, more representative features can be obtained, thereby improving the prediction accuracy of the model.
Parameter optimization: by optimizing the model parameters, the model is more in line with the actual situation, thus improving its fitting ability and generalization ability.
Data preprocessing: pre-processing operations such as filling in missing values and standardizing the original data can make the data more standardized and clearer, thereby improving the stability and accuracy of the model.
Ensemble learning: using ensemble learning to combine multiple models can improve the generalization ability and prediction accuracy of the model to a certain extent.
The improved logistic algorithm formula is outlined.
The formula for the improved logistic algorithm based on periodicity is as follows:
Within it, is the cycle control parameter, and is the phase control parameter.
The improved logistic algorithm with time factor has the following formula:
Within it, represents time and can be considered as a special independent variable. is the time coefficient.
The improved logistic algorithm with dynamic parameters has the following formula:
Within it, is a parameter that varies over time.
2.4. Evaluation of Electricity Relevance by Integrating the Periodic Characteristics of Load and Temperature
With the continuous expansion and complexity of the power grid, power correlation analysis has become increasingly important in the operation, planning, and management of the PS. By analyzing and studying the correlation between electricity, load, price, and other factors among different power stations, it can better guide the formulation of electricity market regulation policies, and provide technical support for optimizing scheduling, reliability assessment, fault diagnosis, and other aspects of the PS [9,10]. The operation, planning, and management of the PS are important links in the power industry. It is necessary to fully consider factors such as power demand, technological development, and environmental protection, and take effective measures to ensure the normal operation and sustainable development of the PS.
Temperature is one of the main factors affecting PL. Under the changes in temperature in different seasons and regions, the PL exhibits different cyclical characteristics [11,12]. At the same time, PL is also the result of various factors, such as economic factors, industrial production, weather changes, etc. [13,14]. Integrating the periodic characteristics of temperature with load analysis can more accurately predict future PL and improve the operational efficiency and economy of the PS [15,16]. With the rapid development of machine learning, artificial intelligence, and other technologies, related algorithms have also been widely applied in power correlation analysis and load forecasting. For example, algorithms such as neural networks, support vector machines, regression trees, and logistic regression have achieved good application results in PS. However, there is currently a lack of comprehensive algorithm models and methods for the fusion analysis of temperature periodicity and load [17,18].
In power correlation analysis, the improved logistic algorithm can better handle nonlinear problems and improve prediction accuracy and robustness. Compared to traditional logistic algorithms, the improved logistic algorithm has advantages such as improved accuracy, robustness, faster training speed, support for large-scale data, and better interpretability. Specifically, compared with the traditional logistic algorithm, the improved logistic algorithm optimizes the loss function and regularization terms, and adopts adaptive weight and threshold adjustment strategies, which can better adapt to different data sets and improve the generalization ability of the model [19,20].
The application process of the improved logistic algorithm in power correlation analysis is shown in Figure 1.
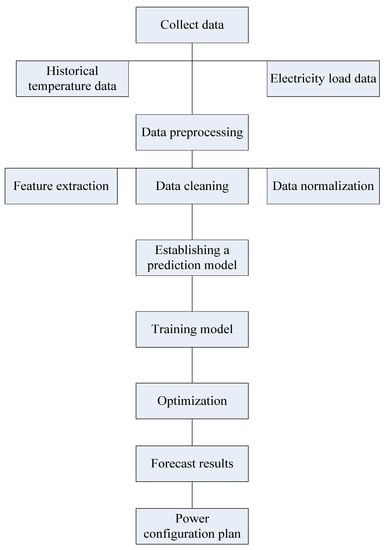
Figure 1.
Application process of improved logistic algorithm in power correlation analysis.
3. Experimental Evaluation of the Power Correlation between the Periodic Characteristics of Load and Temperature
3.1. Experimental Design
- (1)
- Research background and significance
Electricity means the energy form of electrical energy, which refers to the process of converting other forms of energy (such as chemical energy, mechanical energy, thermal energy, etc.) into electrical energy through electrical equipment, as well as the process of converting electrical energy into other forms of energy by electrical equipment [21,22]. Electricity belongs to one of the important infrastructures for the development of modern society, while monitoring and predicting its operating status is crucial for the stability and reliability of electricity supply. Among them, power correlation analysis that integrates the periodic characteristics of load and temperature is an important link in power monitoring and prediction [23]. This article aimed to explore the impact of periodic characteristics of load and temperature on power correlation based on an improved logistic algorithm, thus providing theoretical support for power forecasting.
- (2)
- Experimental purpose
The main purpose of this article was to explore the impact of periodic characteristics of load and temperature on power correlation, and to validate and analyze the improved logistic algorithm. The specific objectives were as follows:
The mathematical model of PL and temperature data was established, and data preprocessing and feature extraction were carried out; based on the improved logistic algorithm, power correlation analysis was conducted and the algorithm was optimized and improved; the impact of periodic characteristics of load and temperature on electricity correlation was analyzed, and its laws and mechanisms were explored; the reliability and effectiveness of the experimental results were verified, thus providing a theoretical basis for monitoring and predicting power supply.
- (3)
- Experimental content
The main content of this article includes data preprocessing, feature extraction, algorithm modeling, model validation, and result analysis. The specific steps are outlined below.
Data collection: Electricity load and temperature data are collected, including daily load data, daily average temperature data, etc.
Data preprocessing: The data is cleaned and preprocessed, including outlier removal, missing value filling, data normalization, and other operations. Data normalization refers to the method of scaling data to a certain proportion, so that it falls into a specific cell, thus facilitating comparison and unified processing between data of different magnitudes and dimensions.
Feature extraction: Time series analysis and wavelet analysis are utilized to extract periodic features of load and temperature data, including daily, weekly, monthly, quarterly, and annual periodicity.
Algorithm modeling: Based on the improved logistic algorithm, the power correlation model is established and optimized, including parameter adjustment and optimization of the objective function.
Model validation: Cross validation and retention methods are used to validate and evaluate the model, and the prediction accuracy and error of the model are calculated. Cross validation is a commonly used model evaluation method used to evaluate the generalization ability of machine learning models.
Result analysis: The impact of periodic characteristics of load and temperature on power correlation are analyzed, and its laws and mechanisms are explored. The experimental results are visualized and explained.
- (4)
- Expected results of the experiment
The following results are expected to be obtained in this article:
A power correlation model with periodic characteristics of load and temperature was established; the impact of periodic characteristics of load and temperature on electricity correlation was analyzed, and its laws and mechanisms were explored; the reliability and effectiveness of the model were verified, thus providing a theoretical basis for monitoring and predicting power supply.
3.2. Evaluation of Regression Model Prediction Accuracy
This article designed four sets of experiments, and compared and analyzed the accuracy of power correlation using the logistic regression algorithm and improved logistic regression algorithm to predict the periodic characteristics of load and temperature. The experimental results are shown in Table 1.

Table 1.
Comparison of the accuracy of two algorithms in predicting load and temperature periodic characteristics on electricity correlation.
As shown in Table 1, by comparing the results of four experimental groups, it could be seen that in the power correlation analysis based on the improved logistic algorithm for integrating load and temperature periodic features, the accuracy of the experimental group that only considered load or temperature periodic features was significantly improved compared to the experimental group that only considered load or temperature periodic features. After adopting the improved logistic algorithm, the accuracy significantly improved. Therefore, in power correlation analysis, integrating multiple features and adopting improved logistic algorithms could improve the accuracy of the prediction results. Therefore, the following text used an improved logistic algorithm to predict the power correlation between the periodic characteristics of load and temperature.
The comparison of improved power correlation evaluation models is shown in Table 2.
Table 2.
Comparison of improved power correlation evaluation models.
3.3. Evaluation of the Correlation between Load and Temperature Periodicity Characteristics and Electricity
In order to analyze the correlation more accurately between load and temperature periodicity characteristics, and electricity, this article recorded the operating data and meteorological data of the PS from 1 January 2022 to 31 December 2022 and then extracted load and temperature as key features. For load characteristics, the hourly load data were taken as the independent variable; for temperature characteristics and the hourly temperature data were used as the dependent variable. At the same time, the periodic characteristics of load and temperature were also extracted to better reflect the correlation between the two. The specific experimental data are shown below.
This article analyzed the PL parameters and meteorological data from 1 January 2022 (holidays) and 4 January 2022 (working days). The experimental results are shown in Figure 2.
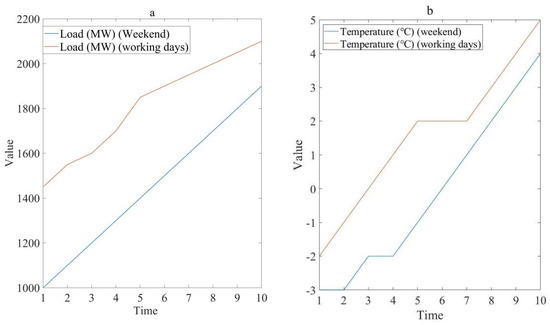
Figure 2.
Periodic characteristic data of load and temperature in January. (a) Load, (b) temperature.
Based on Figure 2a,b, it could be concluded that during holidays, the temperature was the lowest at 1 and 2 o’clock, both of which were −3 °C. The PS load was 1000 MW and 1100 MW, respectively. Overall, during the holiday period in January, the load on the PS continued to increase and the temperature was relatively low. This might be because at weekends, many people chose to rest or entertain at home. This required the use of a large number of household appliances and other electrical equipment, leading to an increase in PL; at the same time, due to the low temperature, people needed to use heating and other electrical equipment, which also increased the PL. During weekdays: At 1 o’clock, the temperature was the lowest, which was −2 °C. The PS load was 1450 MW. Due to many enterprises and institutions entering the working state simultaneously on weekdays, the PL rapidly increased. Overall, it could be concluded that there was a certain correlation between gas temperature and load. The temperature was relatively low, and the PS load also increased.
This article analyzed the PL parameters and meteorological data from 3 April 2022 (holidays) and 6 April 2022 (working days). The experimental results are shown in Figure 3.
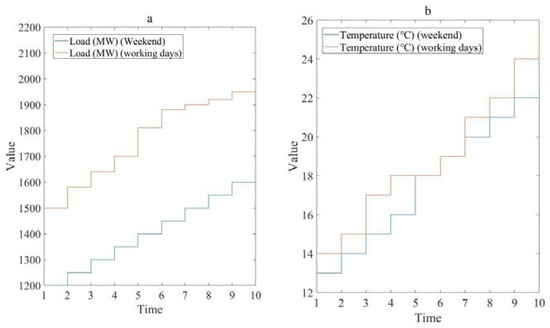
Figure 3.
Periodic characteristic data of load and temperature in April. (a) Load, (b) temperature.
Based on Figure 3a,b, it could be concluded that during holidays, at 10 o’clock, the temperature reached its highest point, which was 25 °C. At this time, the PS load also reached its maximum of 1650 MW. This was because as the temperature increased, people were more likely to use appliances such as air conditioners, leading to an increase in load. During the workday, the temperature reached its highest point at 10 o’clock, which was 26 °C. At this time, the PS load also reached its maximum, which was 2180 MW. This was because more factories and companies entered the working state on weekdays, thereby increasing the load on the PS. In summary, as the temperature increased, the PL also increased.
This article analyzed the PL parameters and meteorological data from 3 July 2022 (weekend) and 4 July 2022 (working day). The experimental results are shown in Figure 4.
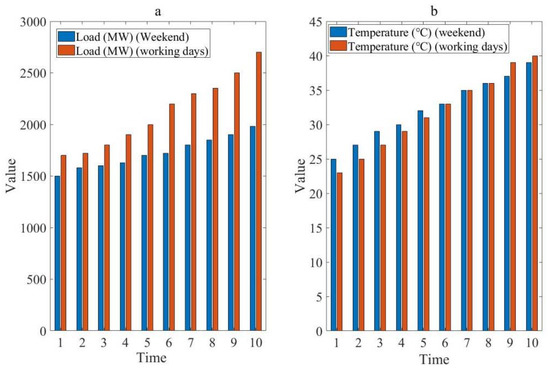
Figure 4.
Periodic characteristic data of load and temperature in July. (a) Load, (b) temperature.
From Figure 4a, it can be seen that the load of the PS is constantly increasing both during weekend breaks and during working hours. This reached its maximum value at 10 o’clock, which was 1980 MW and 2700 MW respectively. Overall, the PS load on weekdays was higher because more power equipment was operating on weekdays. From Figure 4b, it could be seen that the single temperature variable had little to do with weekdays and weekends. However, combining with the load of the PS, it could be seen that as the temperature increased, the load of the PS gradually increased. This was because the weather was hot, and air conditioning and various refrigeration equipment consumed excessive electricity, thereby increasing the load value of the PS.
This article analyzed the PL parameters and meteorological data of 6 November 2022 (weekend) and 7 November 2022 (working day). The experimental results are shown in Figure 5.
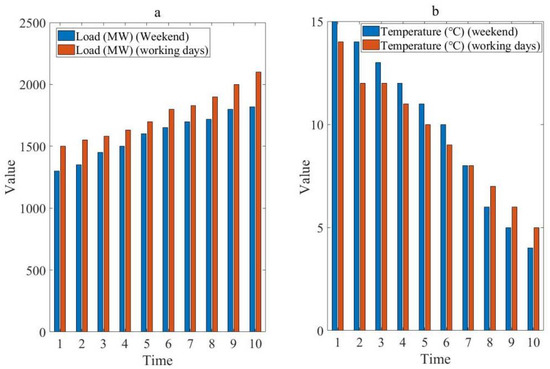
Figure 5.
Periodic characteristic data of load and temperature in November. (a) Load, (b) temperature.
From Figure 5a, it can be seen that the load of the PS is constantly increasing during weekends off time or during working hours. At 10 o’clock, both reached their maximum values, which were 1820 MW and 2100 MW, respectively. This was because in winter, when the temperature was low, the load value of the PS increased with the increase of use of heating appliances. The reason for high values for workdays was due to a large amount of machinery and equipment operating during the workday. From Figure 5b, it can be seen that, combined with the load of the PS, as the temperature decreases, the load of the PS gradually increases. This was because the weather was cold and many people used heating equipment, which led to an increase in the load value of the PS.
3.4. Power Dispatch and Resource Allocation Plan
The power dispatch and resource allocation plan is formulated to ensure the safe and reliable operation of the PS and optimize resource utilization. Its main purpose is to achieve a balanced supply and demand of electricity, ensure the stable operation of the PS, and also fully utilize various resources to improve the efficiency and economy of the PS.
The power dispatch plan needs to adjust the generation plan based on changes in electricity demand to meet the electricity needs of users. The dispatch center needs to grasp timely the changes in power grid load and develop the optimal power generation dispatch plan based on the load prediction results and the power generation plans of each power plant. When formulating a scheduling plan, it is also necessary to consider factors such as the generation cost of each power plant, the power grid transmission loss, and the environmental requirements to ensure the economic and environmental friendliness of the scheduling plan.
The resource allocation plan needs to fully utilize various renewable and clean energy sources, such as solar, wind, hydro, etc., to reduce the emissions and costs of the PS. When formulating resource allocation plans, it is necessary to consider factors such as the distribution of various energy sources, power generation costs, and power supply reliability. In addition, it is also necessary to consider the complementarity and coordination of various energy sources to ensure the stable operation of the PS.
The power dispatch and resource allocation plan also needs to consider the demand and supply situation of the power market. In market-oriented electricity trading, each power company needs to develop its own generation plan and electricity trading plan based on market demand and prices. The power dispatch and resource allocation plan needs to be adjusted based on market transactions and the generation plans of various power companies to ensure the smooth operation of the market and the stability of the PS.
The formulation of power dispatch and resource allocation plans is a complex engineering system that requires coordination and optimization of various links. Only through scientific and reasonable scheduling and resource allocation schemes can the safe and reliable operation of the PS and the maximization of efficiency be ensured.
4. Conclusions
By using an improved logistic algorithm to fuse the periodic characteristics of load and temperature, the trend of PL changes in different seasons and meteorological temperatures can be more accurately predicted. There is a significant cyclical change between load and temperature. Seasonality and daily periodicity are the main factors affecting PL. There is a certain relationship between PL and temperature. Both rising and falling temperatures can lead to an increase in electricity load. After considering cyclical factors, the improved logistic algorithm can more accurately predict the trend of PL changes for different seasons and meteorological temperatures and can effectively avoid the errors and uncertainties existing in traditional correlation analysis methods in the prediction process. In practical applications, in addition to load and temperature, other factors such as economic and social factors also need to be taken into account, to help to improve the prediction accuracy and applicability of the model.
The specific contributions of power correlation evaluation based on the improved logistic algorithm for comprehensive load and temperature cycle characteristics may include the following points outlined below.
Algorithm improvement: Improve the traditional logistic algorithm to adapt to the power correlation evaluation of comprehensive load and temperature cycle characteristics. This may include introducing new feature representation, adjusting algorithm parameters, or designing new loss function to improve the accuracy and performance of the evaluation model in power correlation analysis.
Comprehensive characteristic modeling: Considering the periodic characteristics of load and temperature in the power system, these characteristics are included in the power correlation evaluation model. Through reasonable characteristic modeling, the correlation between load and temperature can be better captured, improving the accuracy and reliability of power correlation evaluation.
Dataset construction: To meet the needs of power correlation evaluation, collection and construction of corresponding datasets, including comprehensive load, temperature, and corresponding correlation labels are required. By conducting reasonable data collection and processing, the quality and effectiveness of the dataset are ensured, providing a foundation for algorithm training and evaluation.
Evaluation model validation: Based on the constructed dataset, an improved logistic algorithm is used for power correlation evaluation and model validation. By comparing with existing models or other methods, verification of the effectiveness and advantages of the improved algorithm for power correlation evaluation of comprehensive load and temperature cycle characteristics can be carried out.
Exploration of application potential: Based on an improved power correlation evaluation model, its application potential in the power system can be explored. For example, this model can be used in fields such as load forecasting, power dispatch, or energy optimization to further validate its practical value and effectiveness.
These specific contributions aim to improve the accuracy, stability, and reliability of power correlation evaluation, and provide better decision-making support for power system operation and management.
Author Contributions
Methodology, J.Z.; Software, K.H.; Validation, J.H.; Formal analysis, J.Y.; Data curation, G.Y.; Writing—original draft, X.Z. All authors have read and agreed to the published version of the manuscript.
Funding
This research received no external funding.
Data Availability Statement
Not applicable.
Conflicts of Interest
The authors declare no conflict of interest.
References
- Zhang, C.; Xu, Y.; Li, Z.; Dong, Z.Y. Robustly Coordinated Operation of a Multi-Energy Microgrid With Flexible Electric and Thermal Loads. IEEE Trans. Smart Grid 2018, 10, 2765–2775. [Google Scholar] [CrossRef]
- Xianlun, T.; Dai, Y.; Wang, T.; Chen, Y. Short-term power load forecasting based on multi-layer bidirectional recurrent neural network. IET Gener. Transm. Distrib. 2019, 13, 3847–3854. [Google Scholar]
- Wu, F.; Cattani, C.; Song, W.; Zio, E. Fractional ARIMA with an improved cuckoo search optimization for the efficient Short-term power load forecasting. Alex. Eng. J. 2020, 59, 3111–3118. [Google Scholar] [CrossRef]
- Ouyang, T.; He, Y.; Li, H.; Sun, Z.; Baek, S. Modeling and Forecasting Short-Term Power Load With Copula Model and Deep Belief Network. IEEE Trans. Emerg. Top. Comput. Intell. 2019, 3, 127–136. [Google Scholar] [CrossRef]
- Olufemi, A.O.; Niu, H. Artificial intelligence techniques in smart grid: A survey. Smart Cities 2021, 4, 548–568. [Google Scholar]
- Zhao, Y.; Foong, L.K. Predicting electrical power output of combined cycle power plants using a novel artificial neural network optimized by electrostatic discharge algorithm. Measurement 2022, 198, 111405. [Google Scholar] [CrossRef]
- Kamila, M. Construction of Environmental Economic Dispatching Model Based on Electricity Market Environment. Acad. J. Environ. Biol. 2021, 2, 401. [Google Scholar] [CrossRef]
- Li, G.; Wang, Q.; Zuo, C. Emergency lane vehicle detection and classification method based on logistic regression and a deep convolutional network. Neural Comput. Appl. 2021, 34, 12517–12526. [Google Scholar] [CrossRef]
- Dong, X.; Deng, S.; Wang, D. A short-term power load forecasting method based on k-means and SVM. J. Ambient. Intell. Humaniz. Comput. 2021, 13, 5253–5267. [Google Scholar] [CrossRef]
- Xia, C.; Zhang, M.; Cao, J. A hybrid application of soft computing methods with wavelet SVM and neural network to electric power load forecasting. J. Electr. Syst. Inf. Technol. 2018, 5, 681–696. [Google Scholar] [CrossRef]
- Li, X.; Zhang, X.; Jiang, W.; Wang, J.; Wang, P.; Wu, X. A Novel Assorted Nonlinear Stabilizer for DC–DC Multilevel Boost Converter with Constant Power Load in DC Microgrid. IEEE Trans. Power Electron. 2020, 35, 11181–11192. [Google Scholar] [CrossRef]
- Martinez-Trevino, B.A.; El Aroudi, A.; Valderrama-Blavi, H.; Cid-Pastor, A.; Vidal-Idiarte, E.; Martinez-Salamero, L. PWM Nonlinear Control with Load Power Estimation for Output Voltage Regulation of a Boost Converter with Constant Power Load. IEEE Trans. Power Electron. 2020, 36, 2143–2153. [Google Scholar] [CrossRef]
- Zhang, W.; Qin, J.; Mei, F.; Fu, J.; Dai, B.; Yu, W. Short-term power load forecasting using integrated methods based on long short-term memory. Sci. China Technol. Sci. 2020, 63, 614–624. [Google Scholar] [CrossRef]
- Hatziargyriou, N.; Milanovic, J.; Rahmann, C.; Ajjarapu, V.; Canizares, C.; Erlich, I.; Hill, D.; Hiskens, I.; Kamwa, I.; Pal, B.; et al. Definition and Classification of Power System Stability–Revisited & Extended. IEEE Trans. Power Syst. 2020, 36, 3271–3281. [Google Scholar] [CrossRef]
- Karami, Z.; Shafiee, Q.; Sahoo, S.; Yaribeygi, M.; Bevrani, H.; Dragicevic, T. Hybrid Model Predictive Control of DC–DC Boost Converters with Constant Power Load. IEEE Trans. Energy Convers. 2020, 36, 1347–1356. [Google Scholar] [CrossRef]
- Venkataramana, V.; Chandra, D.R.; Salkuti, S.R. Short-term electric power load forecasting using factor analysis and long short-term memory for smart cities. Int. J. Circuit Theory Appl. 2021, 49, 1678–1703. [Google Scholar]
- Soriano-Rangel, C.A.; He, W.; Mancilla-David, F.; Ortega, R. Voltage Regulation in Buck–Boost Converters Feeding an Unknown Constant Power Load: An Adaptive Passivity-Based Control. IEEE Trans. Control Syst. Technol. 2020, 29, 395–402. [Google Scholar] [CrossRef]
- Hosseinzadehtaher, M.; Khan, A.; Easley, M.; Shadmand, M.B.; Fajri, P. Self-Healing Predictive Control of Battery System in Naval Power System with Pulsed Power Loads. IEEE Trans. Energy Convers. 2020, 36, 1056–1069. [Google Scholar] [CrossRef]
- Vafamand, N.; Mardani, M.M.; Khooban, M.H.; Blaabjerg, F.; Boudjadar, J. Pulsed power load effect mitigation in DC shipboard microgrids: A constrained modelpredictive approach. IET Power Electron. 2019, 12, 2155–2160. [Google Scholar] [CrossRef]
- Umair, S. Resilience in electric power systems. J. Electr. Eng. Electron. Control Comput. Sci. 2020, 7, 1–6. [Google Scholar]
- Okundamiya, M. Size optimization of a hybrid photovoltaic/fuel cell grid connected power system including hydrogen storage. Int. J. Hydrogen Energy 2020, 46, 30539–30546. [Google Scholar] [CrossRef]
- Sharma, G.; Panwar, A.; Arya, Y.; Kumawat, M. Integrating layered recurrent ANN with robust control strategy for diverse operating conditions of AGC of the power system. IET Gener. Transm. Distrib. 2020, 14, 3886–3895. [Google Scholar] [CrossRef]
- Sharaf, M.; Yousef, M.S.; Huzayyin, A.S. Review of cooling techniques used to enhance the efficiency of photovoltaic power systems. Environ. Sci. Pollut. Res. 2022, 29, 26131–26159. [Google Scholar] [CrossRef] [PubMed]


Disclaimer/Publisher’s Note: The statements, opinions and data contained in all publications are solely those of the individual author(s) and contributor(s) and not of MDPI and/or the editor(s). MDPI and/or the editor(s) disclaim responsibility for any injury to people or property resulting from any ideas, methods, instructions or products referred to in the content. |
© 2023 by the authors. Licensee MDPI, Basel, Switzerland. This article is an open access article distributed under the terms and conditions of the Creative Commons Attribution (CC BY) license (https://creativecommons.org/licenses/by/4.0/).