1. Introduction
According to the International Energy Agency (IEA) and its current projections of energy efficiency, achieving carbon neutrality in buildings by 2050 is anticipated to be challenging [
1]. Notably, approximately one-third of the world’s final energy consumption and nearly 15% of direct CO
2 emissions (comprising 40–48% of both direct and indirect CO
2 emissions) stem from the combined sectors of residential and building construction [
1]. The building envelope, specifically fenestration systems (e.g., windows, curtain walls, skylight devices), is identified as the primary source of heat loss in building construction, responsible for approximately 60% of the overall heat loss [
2]. Consequently, research efforts have intensified in this area to alleviate the energy demand attributed to heating, ventilation, and air conditioning (HVAC) systems. Overall, advancements in enhancing the thermal performance of transparent components of the building envelope can be categorized into three main areas: solar control, thermal resistance, and thermal inertia.
The improvement of solar control systems has been the subject of extensive research involving the integration of smart glazing technologies, such as chromogenic materials (thermochromism [
3], thermotropism [
4], etc.), photovoltaic modules [
5], switchable systems [
6], coating techniques (such as low-e coatings [
7] and laminated coatings [
8]), and so forth. Similarly, efforts to improve the thermal resistance of transparent components in building envelopes have resulted in reduced heat loss. Techniques, such as the use of inert gases within the gap space of multi-glazing systems [
9] as well as the incorporation of low-thermal-conductivity materials like aerogels [
10] and hydrogels [
11], are recognized methods for enhancing thermal resistance. Another approach involves increasing the thermal mass of glazing systems by utilizing thermal energy storage materials, such as phase change materials (PCMs), which can store and release heat during day and night, thereby improving not only energy savings but also indoor thermal management. These techniques have been extensively explored in recent research and were comprehensively reviewed in [
12]. Furthermore, nanoscale analysis of thermal storage materials is also of vital importance. Methods, such as Molecular Dynamics and Monte Carlo simulations, can provide deep insights into the nanoscale thermal capabilities of these materials [
13].
This research primarily focuses on enhancing thermal inertia/mass within glazing systems, specifically by employing phase change materials (PCMs). The PCMs undergo heat absorption and release through phase change cycles, which can occur as a solid-to-liquid transition, known as solid–liquid phase change material (SLPCM), or a solid-to-solid transition, known as solid–solid phase change material (SSPCM), as applicable in glazing systems. The SSPCMs offer several advantages over SLPCMs, including no leakage, less phase segregation, low subcooling, small volume variation, encapsulation-free implementation, extended durability upon thermal cycling (high thermal stability), more consistent optical properties, and less material degradation [
14]. Furthermore, SSPCMs, remaining solid (except when reaching their melting temperature), can be directly adhered to a surface (such as the interior glass pane in the present study) with specific thickness, while the air or inert gas (possessing low thermal conductivity) remains between the indoor and outdoor environments. This arrangement is advantageous because when the SLPCM completely fills the air gap, it diminishes the thermal resistance of the glazing systems to some extent, as the thermal conductivity of SLPCM is higher than that of air unless it has been encapsulated, which will act like an SSPCM. Despite the extensive literature on SLPCM application in glazing units, studies on SSPCMs in smart glazing are limited. Additionally, to the best of the authors’ knowledge, there is no direct experimental research incorporating SSPCMs into glazing systems [
15].
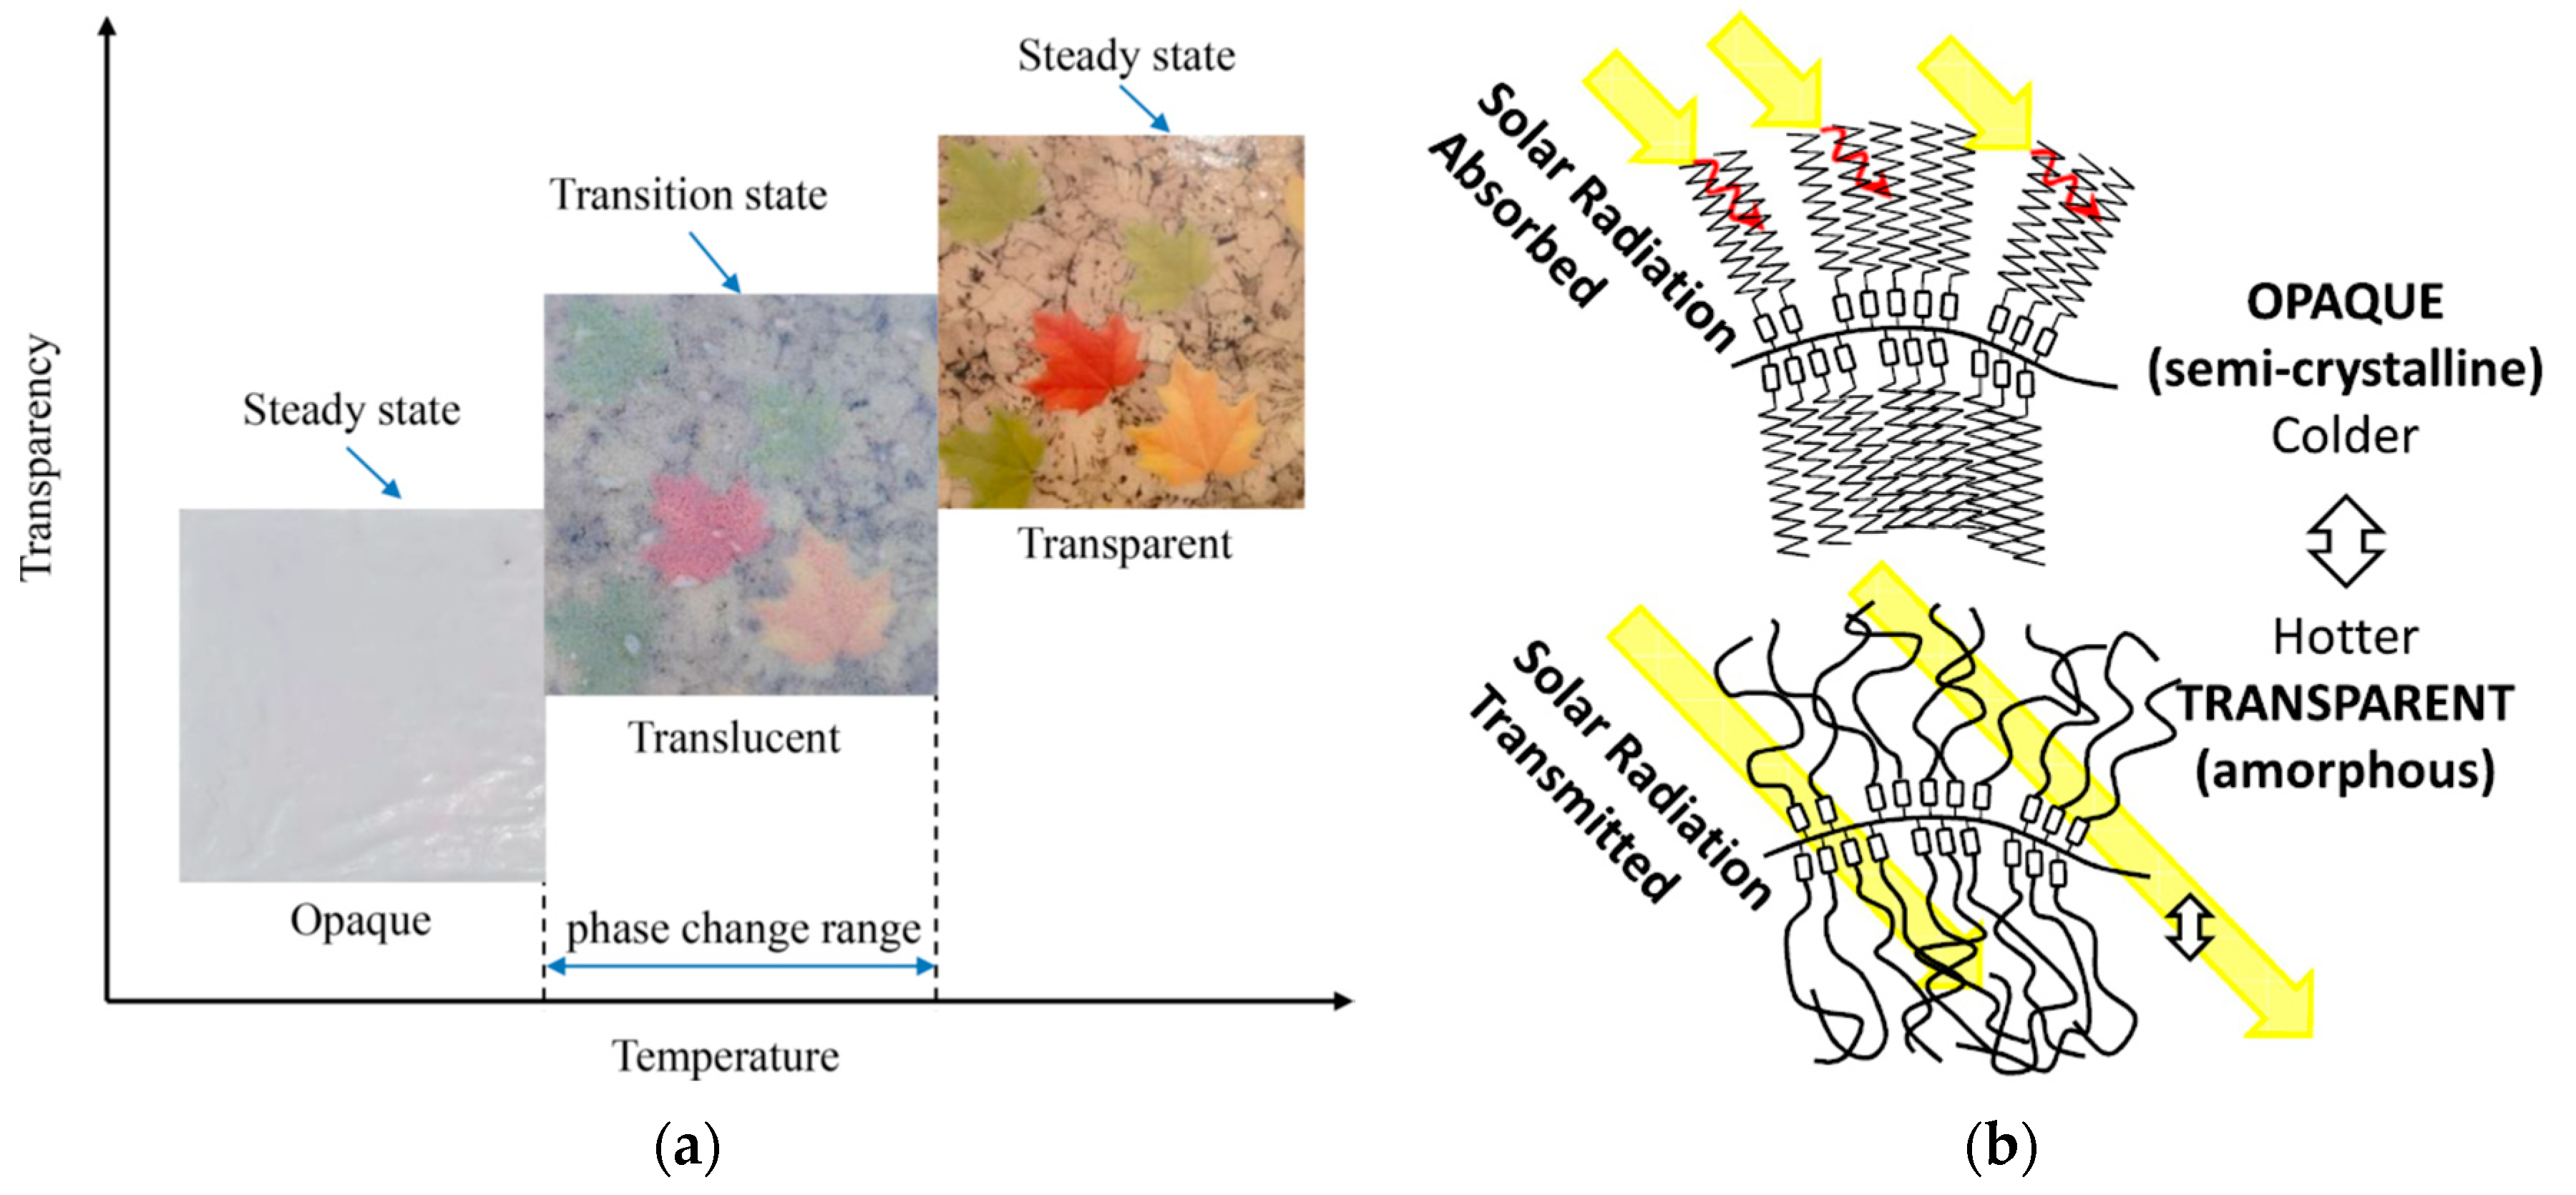
SSPCMs experience a phase transition between opaque (semi-crystalline) and transparent (amorphous) states, wherein only the soft segments melt, supported by the hard segment (polymeric backbone) with a significantly higher melting temperature. Consequently, the SSPCM remains solid during phase transition by melting and freezing the soft segments, which are anchored by the hard segments. The illustration for the phase transition mechanism of Polymeric Graft SSPCM [
15] and the transparency during phase transitioning [
16] are depicted in
Figure 1.
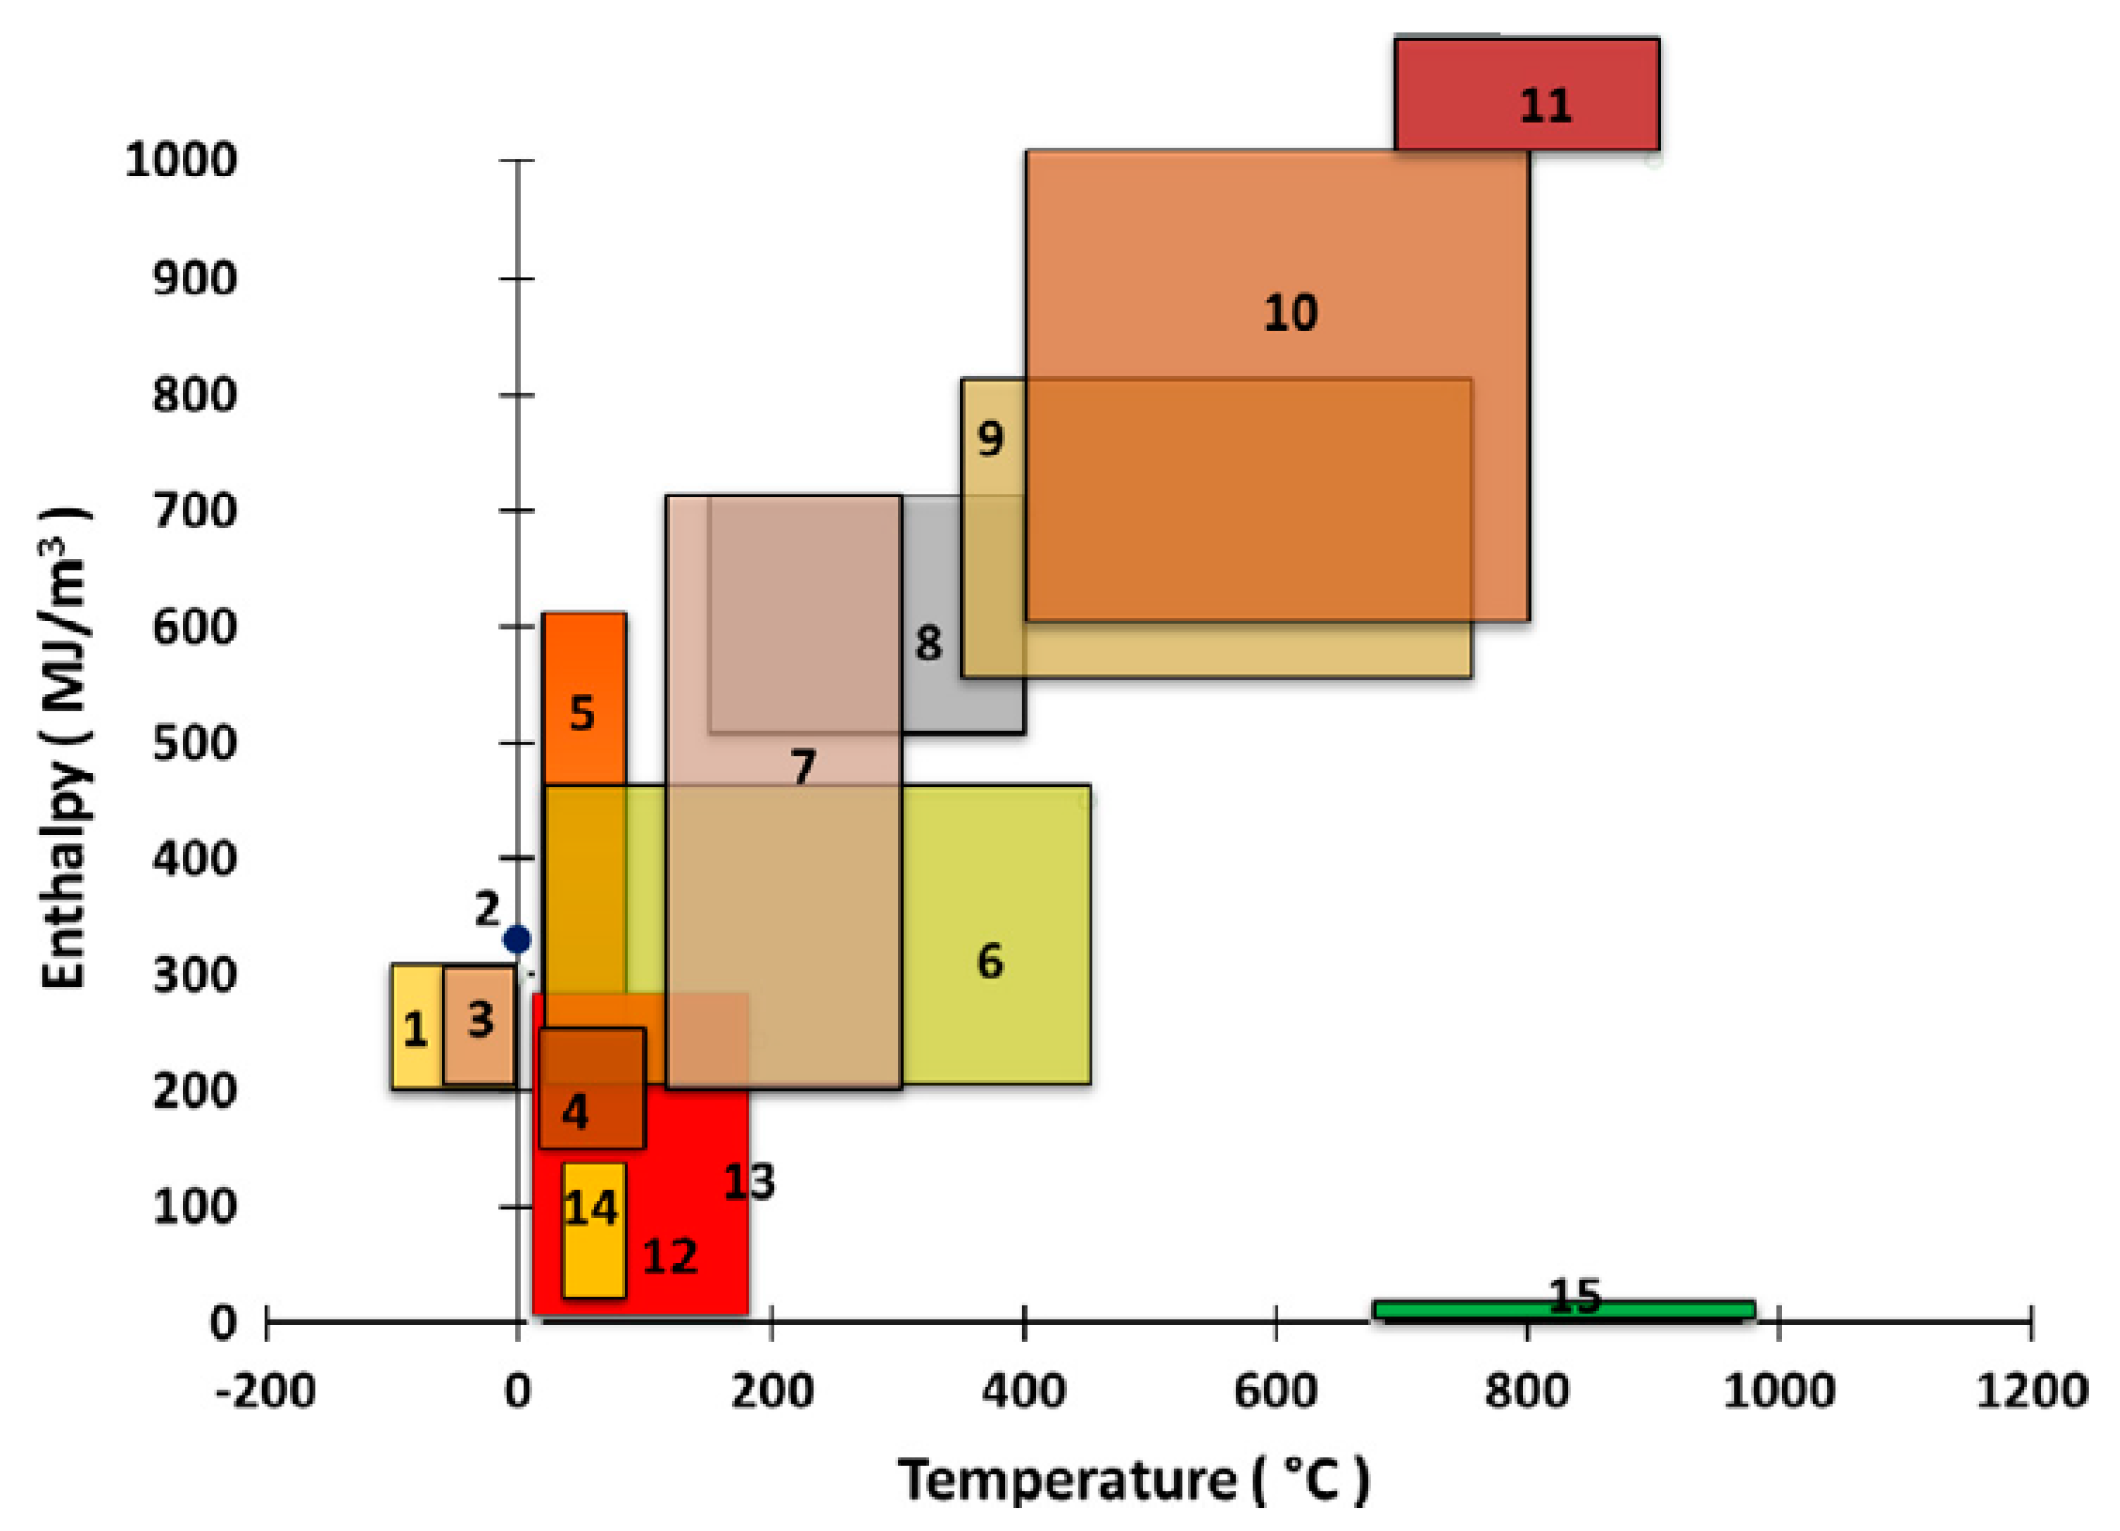
Figure 2 presents the phase transition temperatures and enthalpies for the primary types of SL-PCMs and SS-PCMs. As shown in this figure, the SS-PCMs generally display lower phase transition enthalpies and transition at lower temperatures in relation to the SL-PCMs. The lower enthalpy can be explained by the restricted mobility within SS-PCMs, which hinders crystallization and limits packing efficiency [
14].
As mentioned earlier, a limited number of studies have explored the application of SSPCMs in glazing systems. Fallahi et al. [
14] conducted a review study focusing on the molecular properties and thermal characteristics of SSPCMs for thermal energy storage. That study examined the relationship between molecular structure, phase transition mechanisms, and thermal properties of the four main categories of SSPCMs: polymeric, organic, organometallic, and inorganic. The authors provided guidance for selecting an appropriate SSPCM for various applications based on desired physical, thermal, and mechanical properties, offering a comprehensive list of SSPCMs within each main category. Another review study [
17] discussed the applications of SSPCMs and recent advancements in their thermophysical properties. That study compiled a comprehensive list of organic, polymeric, organometallic, and commercial SSPCMs, along with their thermophysical properties, phase transition temperatures, melting temperatures, molecular characteristics, and thermal behavior. The review serves as a valuable resource for researchers and practitioners interested in utilizing SSPCMs in various applications.
Guldentops et al. [
18] proposed a building enclosure system employing SSPCMs to passively regulate the temperature of a south-facing building in a typical central Massachusetts four-season climate, considering both summer and winter conditions. They conducted an analysis of the energy performance of the system by creating a finite element model. The study identified different optimized systems beneficial for summer and winter seasons separately. However, it was noted that further refinement of extinction coefficients and transition temperatures of the SSPCM is necessary for the system to effectively function in both summer and winter conditions. In a related study, Gao et al. [
15] integrated a thin layer of SSPCM into the interior side of the inner glass of a south-facing double-glazing window (DGW) of an office room. They performed a numerical analysis to assess the annual energy savings achieved by the system. Utilizing the EnergyPlus for their numerical investigation, the authors encountered a limitation as the software lacked the capability to simulate latent energy storage materials undergoing phase transitions. The authors also mentioned that EnergyPlus cannot simulate transparent PCMs. Consequently, they developed an equivalent model to overcome this limitation. The study demonstrated that the implementation of a 3 mm SSPCM led to energy saving improvements in warm, mixed, and cold climates. Furthermore, the authors argued that the energy savings achieved with the DGW equipped with SSPCM (DGW–SSPCM) outweighed those of low-emissivity windows. Additionally, Ma et al. [
19] investigated the integration of both silica aerogel and SSPCM in a glazing system to assess its daylighting and energy performance in a severe cold region of China. For the energy performance analysis, EnergyPlus [
20] was employed, while radiance software [
21] was utilized for daylighting analysis. Similarly to Gao et al. [
15], the authors employed an equivalent model for SSPCM modeling due to EnergyPlus limitations. Through sensitivity analysis, they identified transient temperature, latent heat, absorption coefficient, and refractive index as the most influential parameters. Recommending a 10 mm thickness for silica aerogel in their glazing system, the authors aimed to achieve maximum energy savings while meeting daylighting design standards in China. Their findings suggested the viability of employing DGW–SSPCM in severe cold regions. Moreover, Zhang et al. [
22] investigated a similar glazing system containing silica aerogel within the outer gap space and SSPCM within the inner gap space, emphasizing the effectiveness of SSPCMs over SLPCMs. Through simulations conducted for a 24 h real-time period in very cold climates in Anda City, China, they developed a model to predict the heat transfer of the glazing system. Their results highlighted the significant impact of the SSPCM transition temperature and latent heat on heat transfer, while the absorption coefficient and refractive index had subtler effects. Wang et al. [
16] developed an inverse approach, based on a hybrid model, to represent useful expressions for the extinction coefficient and refractive index of SSPCMs as a function of temperature for the translucent phase and constant values for opaque and transparent phases. Their results for the optical properties of SSPCMs have been implemented in the current study. Recently, Zhang et al. [
22] implemented a two-dimensional numerical parametric study for the influence of optical and thermal properties of a triple-glazed window containing SSPCM within the inner air gap and silica aerogel within the outer air gap using the finite volume method. The study was performed to simulate 24 h of severe cold weather conditions in a city in China. Their sensitivity analysis showed that the thermal efficiency of the glazed window is notably influenced by the melting temperature and the latent heat of PCM, whereas the absorption coefficient and refractive index only have minor effects. In that study, the optimum melting temperature of the PCM was reported as 18 °C, resulting in a 15.4% energy saving rate.
Based on the literature review provided above as well our recent review [
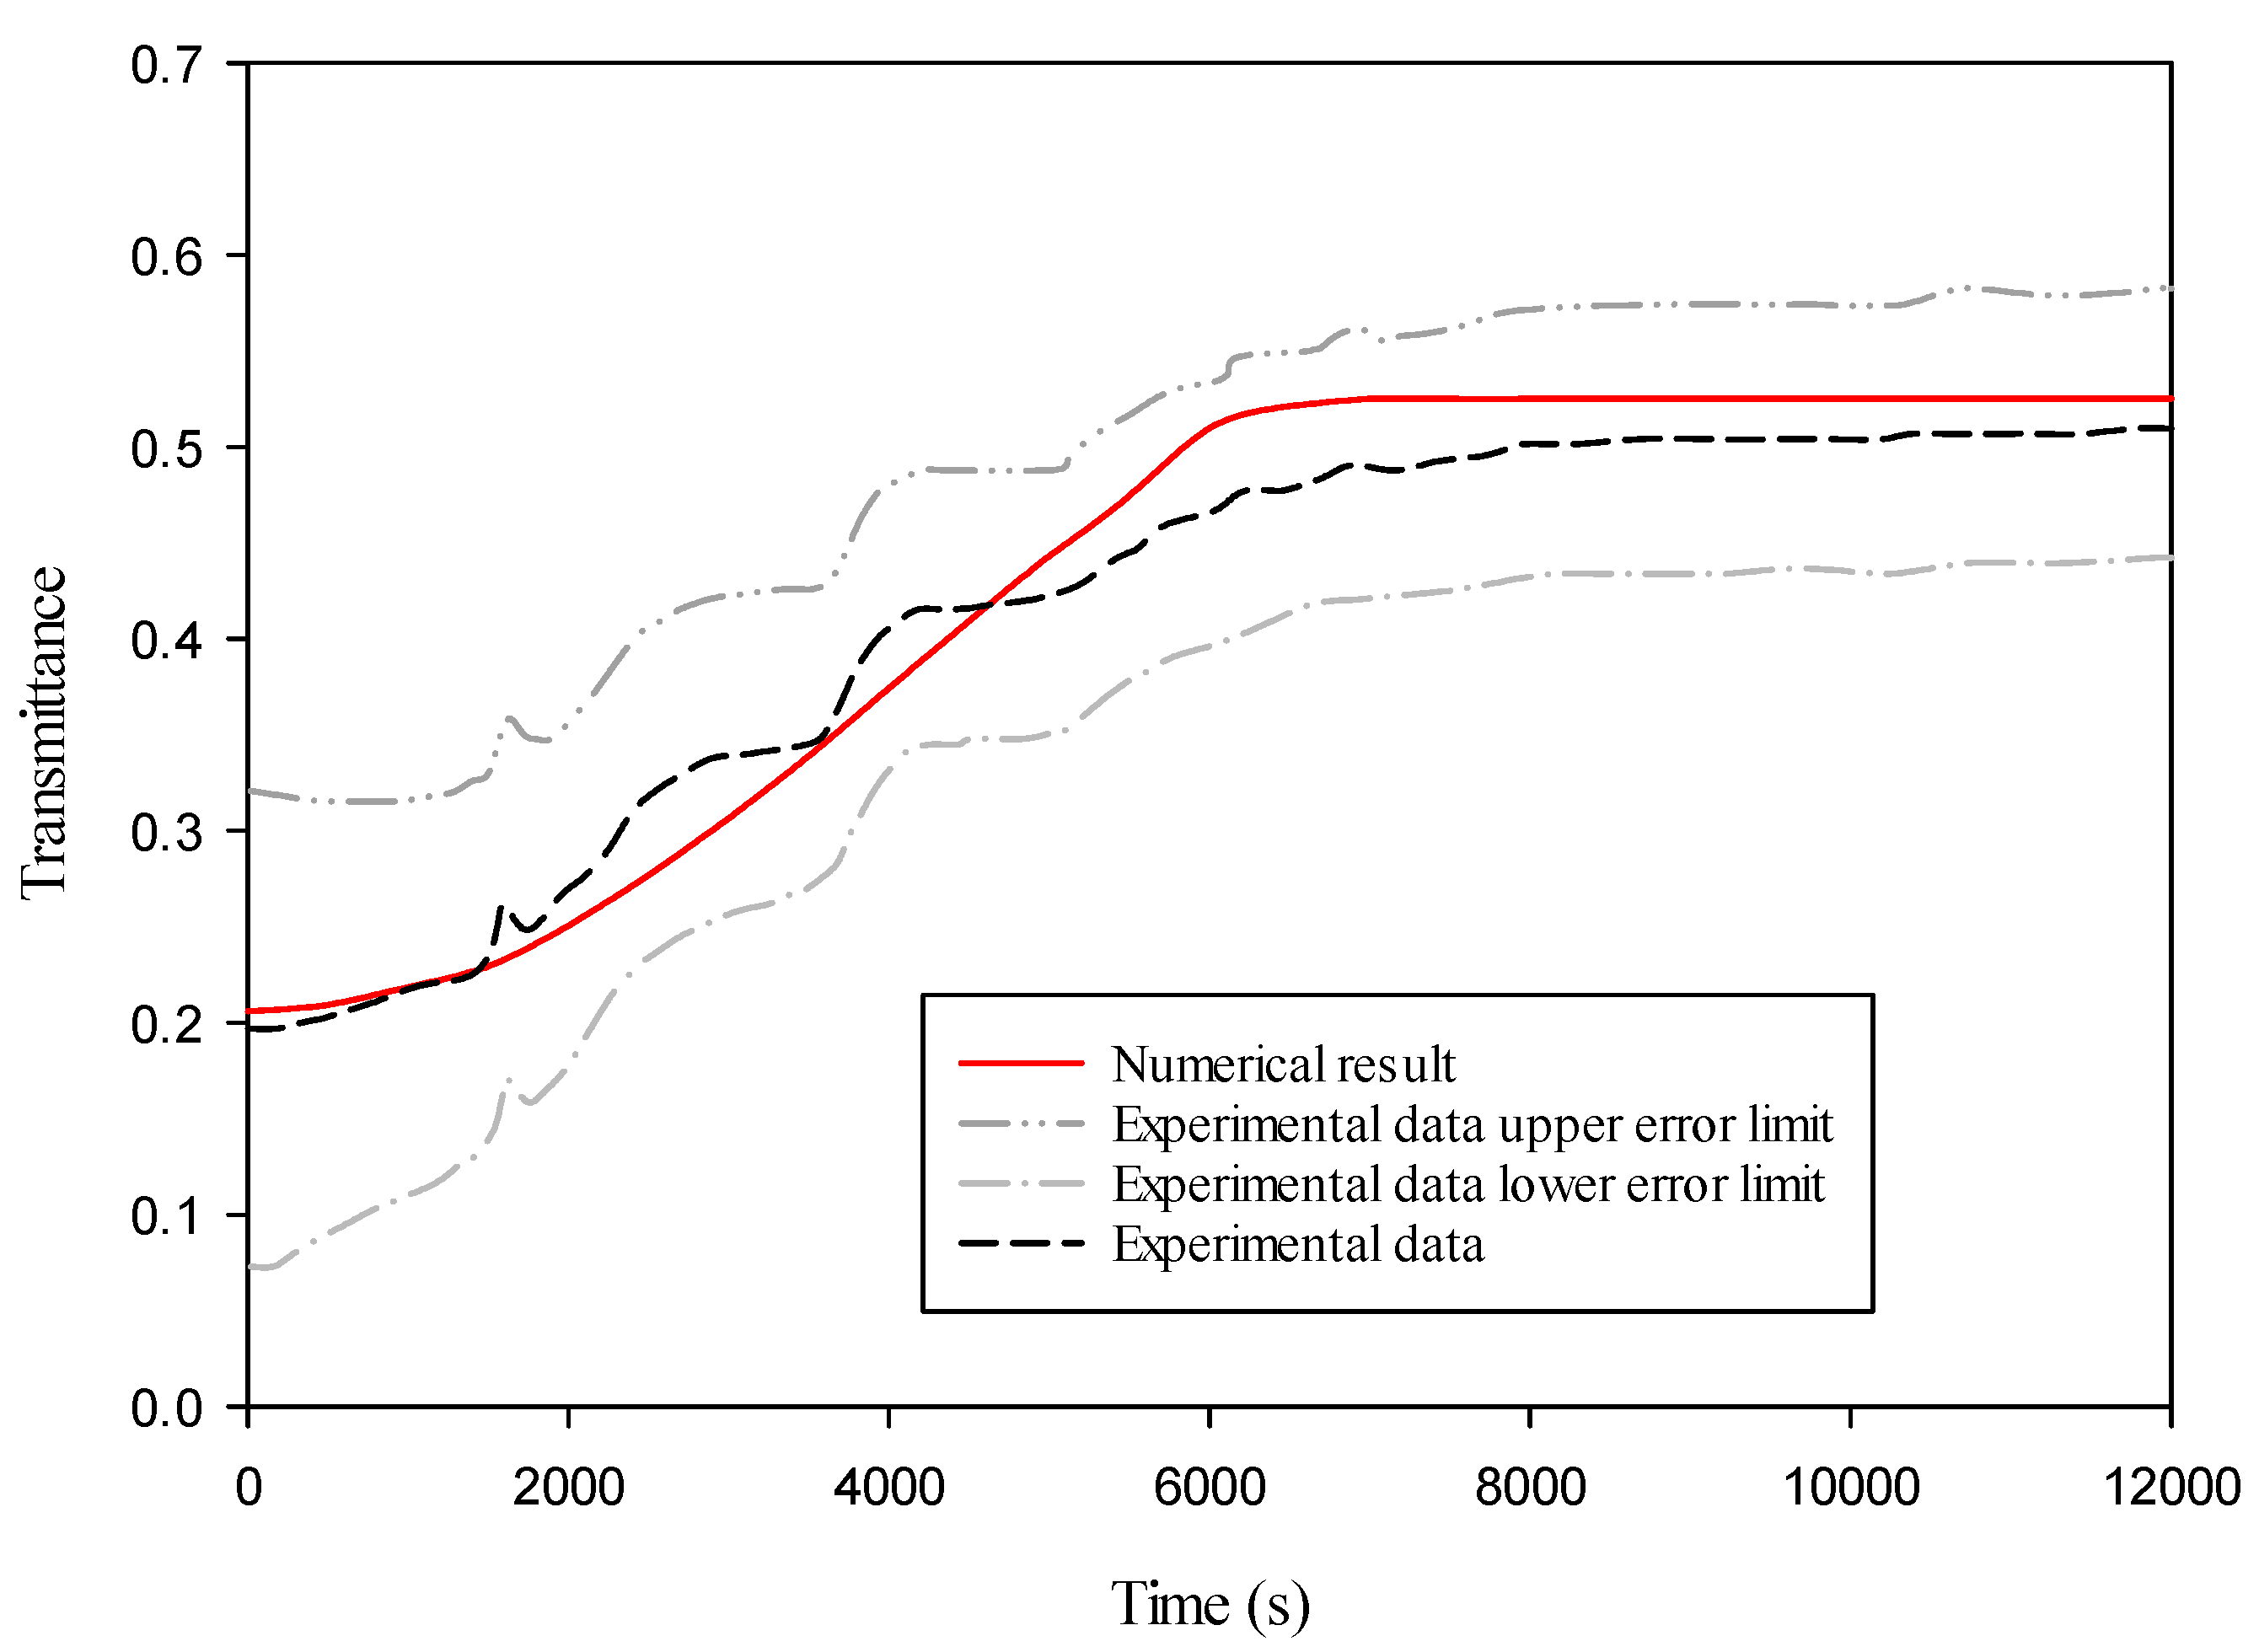
12], it is evident that there are few studies investigating the energy performance of SSPCMs in glazing systems using 3D modeling. The existing numerical models use EnergyPlus, which has some limitations in capturing the phase transition phenomenon within the SSPCM, and hence using an equivalent model has been inevitable, or 2D models that assess the SSPCM behavior when fully filling the air gap space of a triple-glazed window. Therefore, to bridge this gap, the main objective of this study is to develop a 3D model and use it to assess the energy performance of a DGW incorporating SSPCMs. The idea of placing the SSPCM onto the interior pane between the air gap has come up to keep the material’s temperature as high as possible to yield an almost fully transparent window throughout the whole year. Following model validation, a parametric study was conducted by varying the transient temperature and transient temperature range of a south-facing DGW–SSPCM over a 24 h real-time period. The simulations were performed for sunny and cloudy days during the coldest and hottest days of the year 2022 in Miami.
2. Methodology
2.1. Geometrical Details
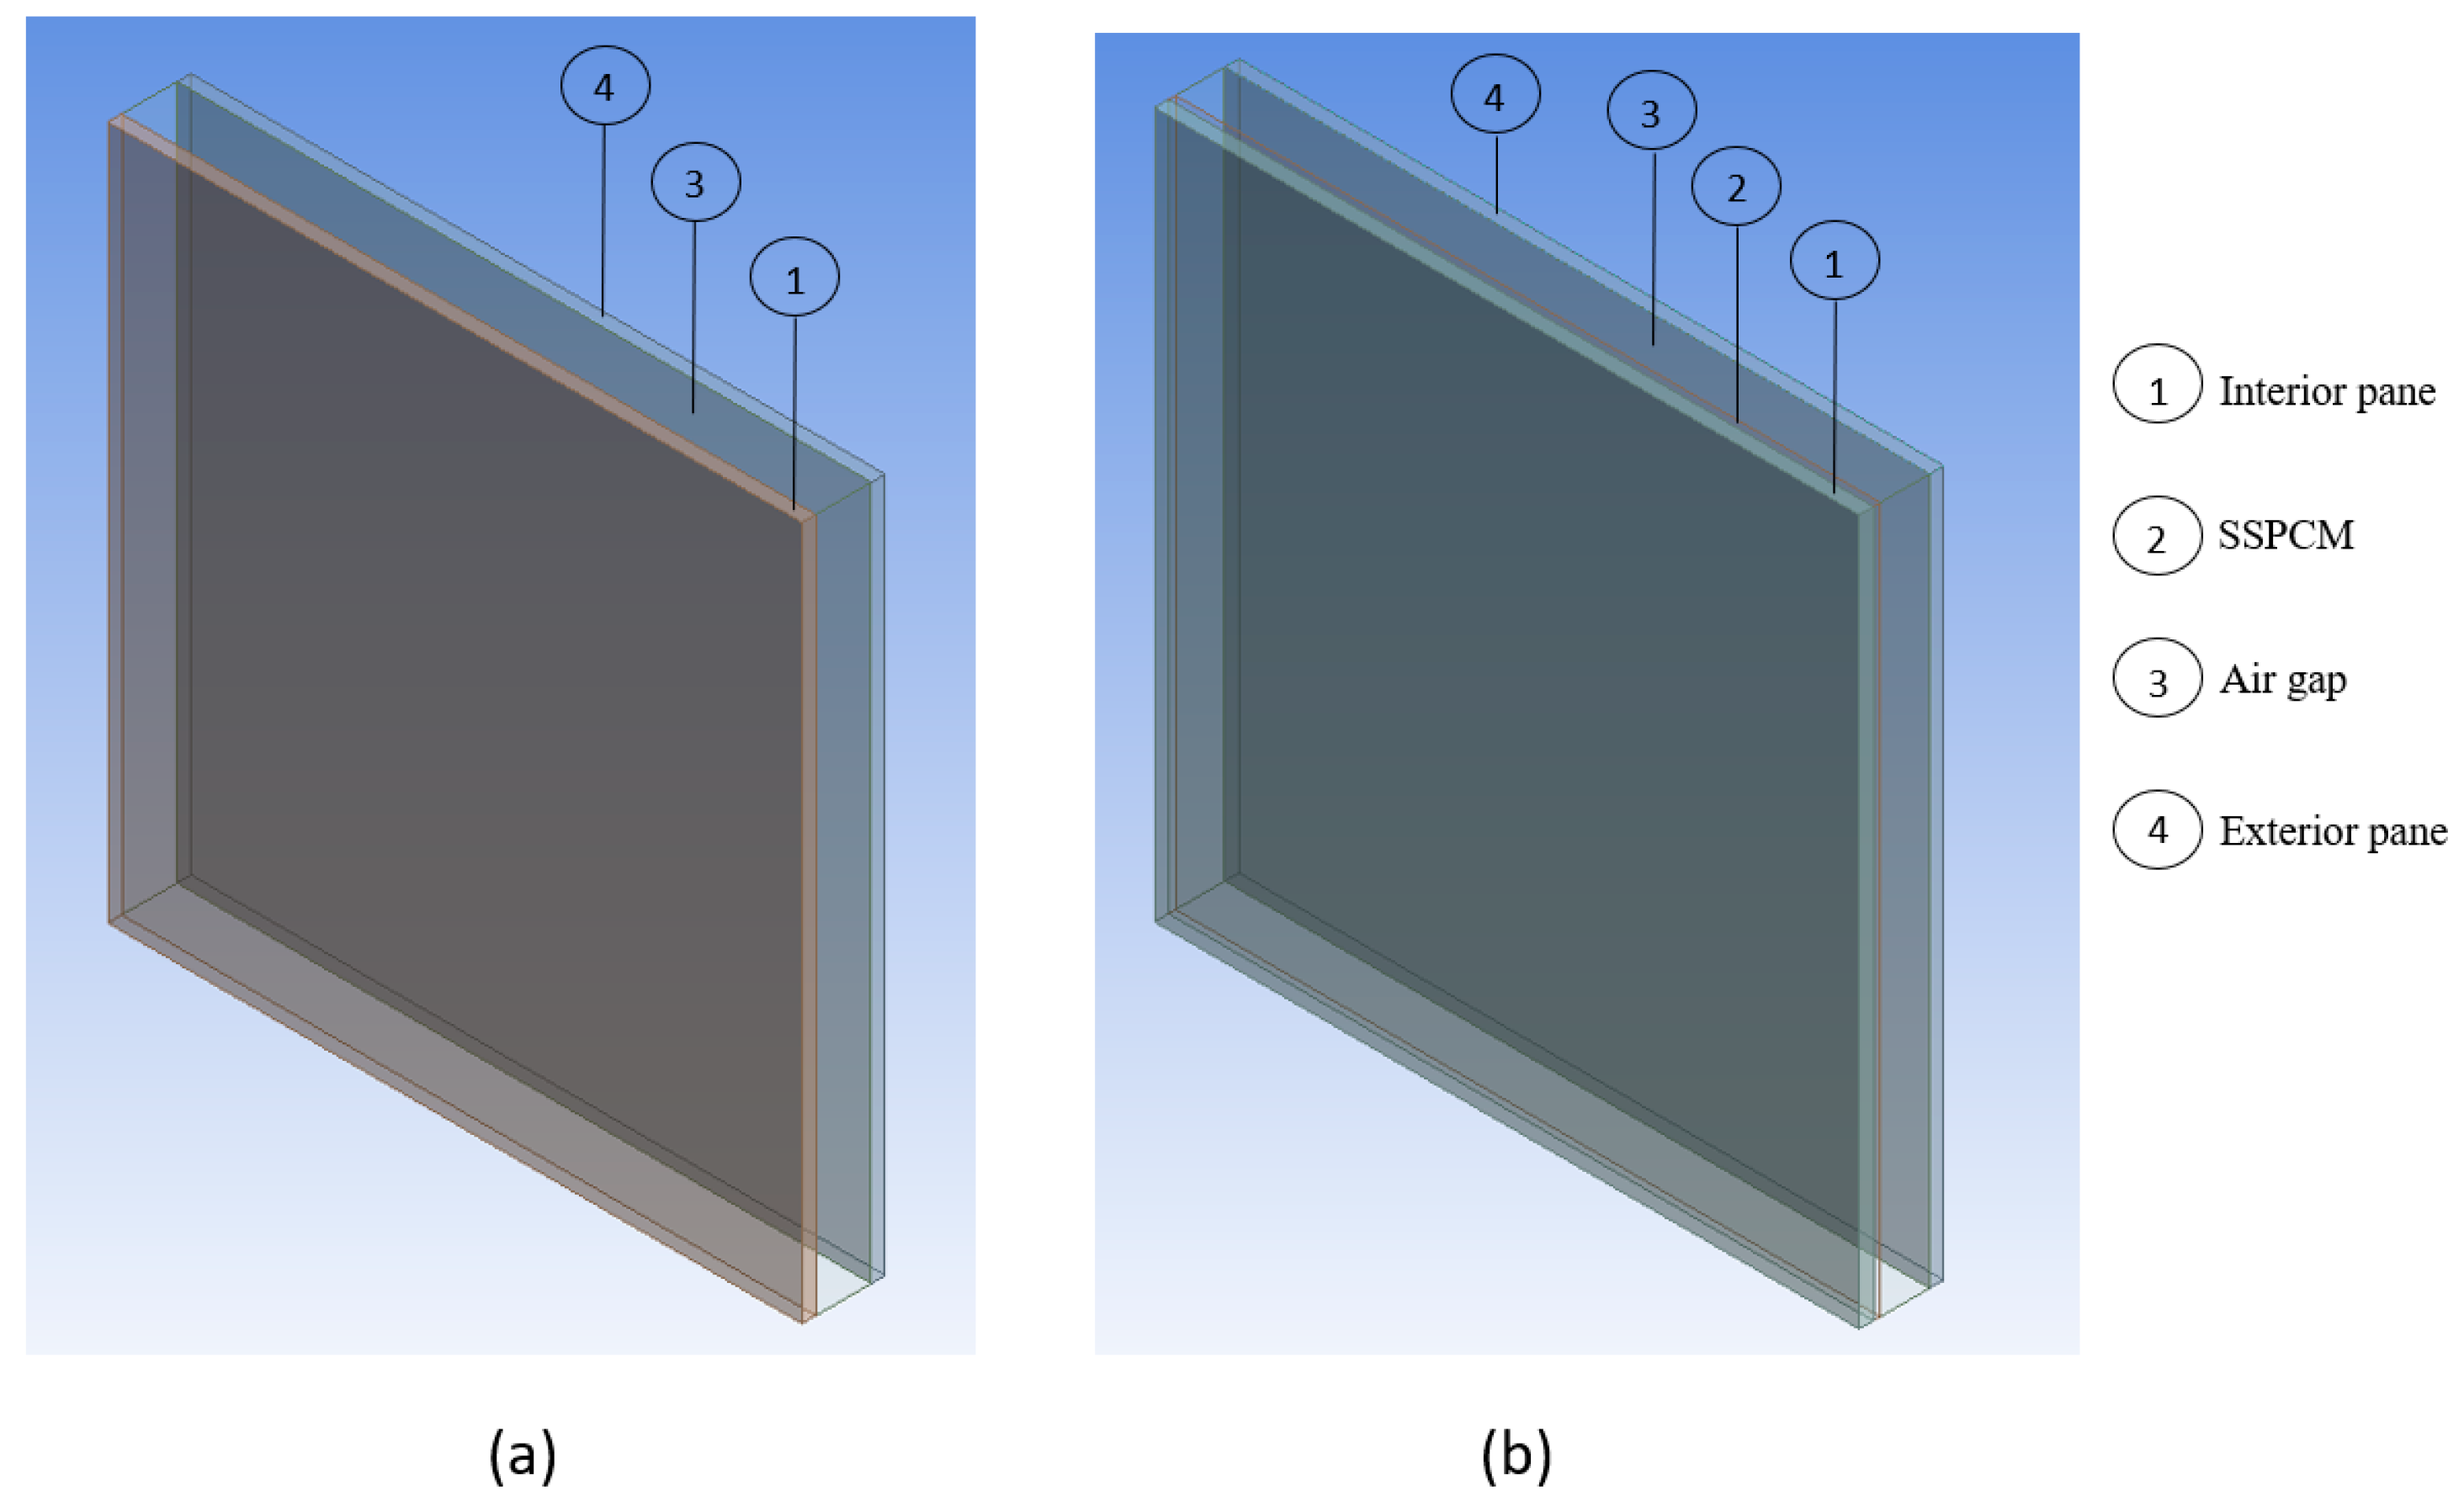
The present study comprises two configurations: a double-glazing window (DGW) as a reference called “DGW–REF” and another DGW equipped with an SSPCM applied to the interior pane within the air gap, called “DGW–SSPCM”. Both DGW–REF and DGW–SSPCM consist of two panes with dimensions of 20 cm long, 20 cm wide, and 4 mm thick. The DGW–REF features a 1.6 cm air gap, as depicted in
Figure 3a, while the DGW–SSPCM includes a 2 mm thick SSPCM, with a mass of 844 g, applied to the interior pane between the panes. This has resulted in a 1.4 cm air gap, as illustrated in
Figure 3b.
2.2. Material Perspective
In this study, a typical 4 mm clear glass with an emissivity of 0.9 [
23] was chosen, and its thermophysical and optical properties were obtained from [
24]. The SSPCM was selected from [
25]. It was concluded that in cases involving typical glazing or PCM-glazed setups, where the refractive indices of all materials are relatively low (<1.5), the influence of internal reflections within the glazed systems is insignificant [
25]. Additionally, the thermophysical properties of the materials utilized in this study are listed in
Table 1. The different phase change temperatures and ranges that have been studied in this paper are provided in
Table 2.
The extinction coefficient is commonly described by the optical thickness (
d) of a substance, as shown in Equation (1) [
26]. In this equation, s represents the actual thickness of the sample, which is set to 2 mm in this study for the SSPCM–DGW cases.
In Equation (1),
and
represent the absorption and scattering coefficients, respectively. In this study, the scattering coefficient is considered isotropic. By using Beer–Lambert’s law for non-gaseous materials, the transmittance of the PCM can be calculated using Equation (4), as [
18]
where
represents the transmittance of the
PCM. Also, the absorption coefficient can be calculated using Equation (3) [
24] and then used to determine the scattering coefficient of Equation (1).
In Equations (1)–(3),
and
represent the transmittance and transparency fraction of the material, respectively. The subscripts
PCM,
tr, and
op represent the phase change material, transparent and opaque, respectively. The refractive index and extinction coefficient for the transparent phase are equal to 1.11 and 25.73 m
−1, respectively [
16], and for the opaque phase, they are equal to 5.33 and 152.82 m
−1, respectively [
16], of the SSPCM [
15].
For the translucent phase, Equations (4) and (5) [
16] are used to provide the average optical property as a function of the transparency fraction. This term is used to replace the term “liquid fraction” as there is no liquid phase in the SSPCM that refers to the fraction of the material within the transparent phase. The value of
is equal to 0 when the SSPCM is totally opaque and 1 when the SSPCM is totally transparent. When the transparency fraction is 0, it means the SSPCM temperature is less than or equal to its lower limit of the transient temperature range (opaqueus temperature) and it is in the opaque phase. Conversely, when it is 1, it means that the SSPCM temperature is greater than or equal to its upper limit of the transient temperature range (transparentus temperature) and it is in the transparent phase. However, when the transparency fraction value is between 0 and 1, it indicates that the SSPCM is in the translucent phase, akin to the mushy zone in SLPCMs. Note that at the border between the opaque phase and translucent phase, the temperature is called “saturated-opaque temperature, T
opaqueus”. Meanwhile, at border between the translucent phase and the transparent phase, the temperature is called “saturated-transparent temperature, T
transparentus”.
2.3. Governing Equations
To model the SSPCM, the enthalpy–porosity model in FLUENT has been employed utilizing a very high viscosity value (equal to 250 Pa∗s, which is much higher than honey’s viscosity range: 6.54–7.01 Pa∗s [
27]) for the SSPCM, resulting in nearly zero velocity within it. In this study, the results are represented by neglecting natural convection effects within the air gap of the DGW for all cases (i.e., DGW–SSPCM and DGW–REF), aiming to analyze the applicability and concept of using SSPCM in glazing systems. Utilizing the Miami climate as an illustrative example under natural climatic conditions, this approach seeks to investigate whether energy savings can be achieved in a glazing system equipped with SSPCM compared to the same system without SSPCM. The governing equations of the current study, considering the Discrete Ordinates (DOs) model for radiation and a solidification/melting model for SSPCM, are as follows.
Mass conservation equation [
26]:
Momentum conservation equation [
26]:
In Equations (6) and (7),
,
,
,
, and
are density, time, velocity vector, pressure, and dynamic viscosity, respectively. It is noteworthy to mention that the source term “
” should be added to the right-hand side of Equation (7) according to the solidification/melting modeling.
is defined as the negative of the porosity function (
), as described by Brent et al. [
28]. The porosity function is formulated in order to make the momentum equations behave according to the Carman–Kozeny equations [
29], which are used to describe fluid flow in porous media. However, this study employs an SSPCM, which lacks internal fluid flow, rendering the source term ineffective in the momentum equations.
In Equation (11), the enthalpy of the
PCM,
H, is calculated as the sum of the sensible enthalpy,
, and latent heat,
, as
where,
In Equation (9), the fractional latent heat of the PCM,
, can be expressed in terms of the PCM’s latent heat of fusion, L. Note that
can vary between 0 (opaque phase),
L (transparent phase), and values between 0 and L when
(translucent phase).
The transparency fraction,
, can be defined as
The term
Sh in Equation (8) denotes the volumetric heat source/sink related to phase change, which is defined as
In this research, the DO model is utilized to simulate the radiation effects as it is the most detailed model for radiation in ANSYS FLUENT [
26]. This model enables the simulation of radiation scattering and absorption across various optical thicknesses. The DO model addresses radiation heat transfer by converting the equation into a transport equation for radiation intensity, solving it for a finite number of discrete solid angles [
26]. Consequently, although the simulation speed is diminished due to the additional equations of the DO model, precision is enhanced.
The radiative transfer equation for an absorbing, emitting, and scattering medium at position
in the direction
is [
26]
The DO model considers the radiative transfer equation in the direction
as a field equation and is written as [
26]
In Equations (14) and (15), I, n, , , . , , and represent radiation intensity, refractive index, position vector, direction vector, scattering direction vector, phase function, solid angle, and the Stefan–Boltzmann constant ( W/m2K4), respectively.
2.4. Weather Conditions
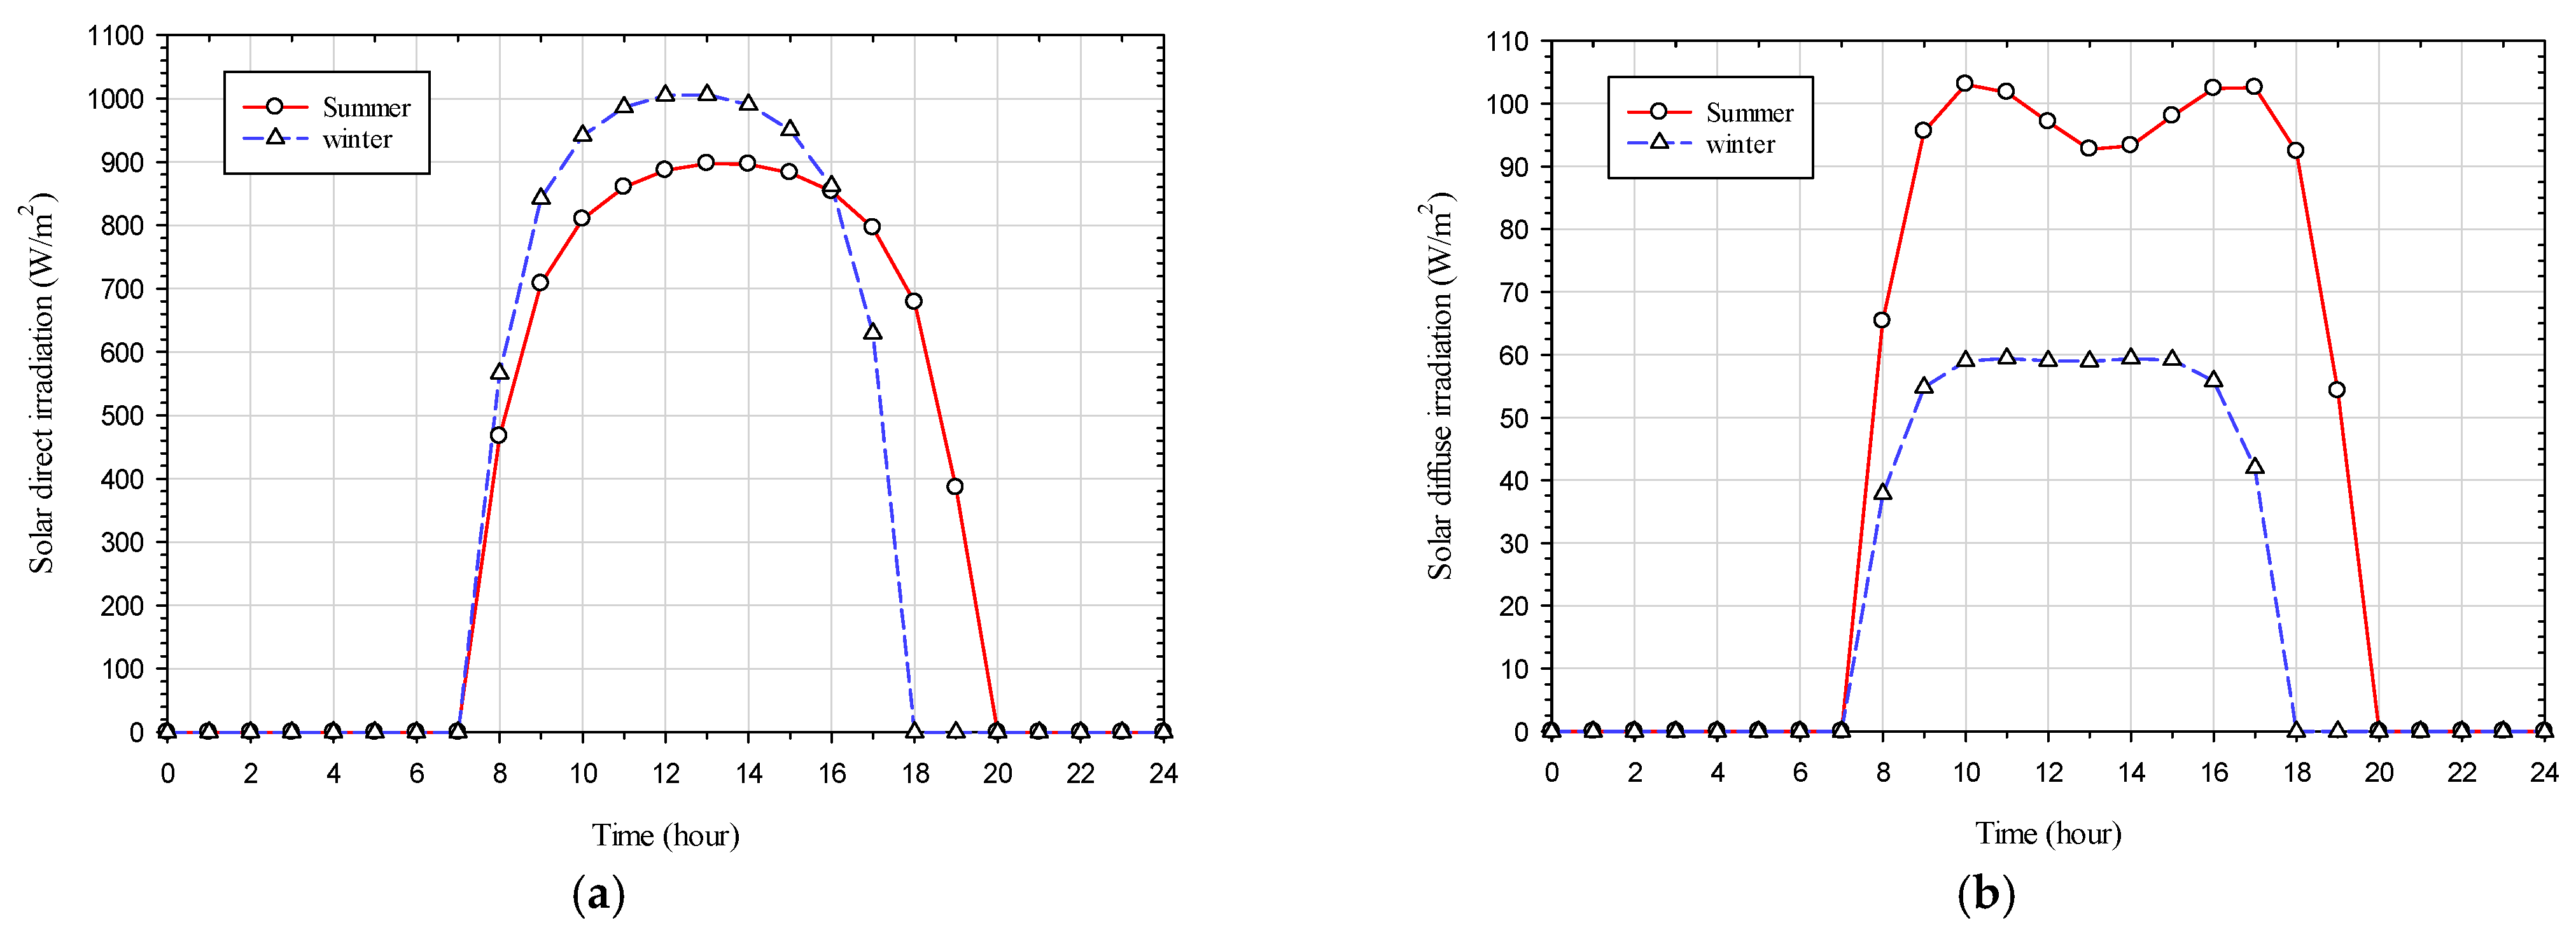
The glazing system in this study represents a south-facing window situated in Miami, with a longitude and latitude of −84.63 (west) and 13.65 (north) degrees, respectively. The time zone in Miami is defined as −5 during Eastern Standard Time (EST) and −4 during Eastern Daylight Time (EDT). Four scenarios for ambient weather conditions have been selected for the coldest (occurred on 30 January) and hottest (occurred on the 18
th of August) days of the year in 2022, encompassing both sunny and cloudy conditions. The ambient weather conditions include hourly wind speed [
30], hourly ambient temperature [
30], hourly solar direct irradiation [
26], hourly solar diffuse irradiation [
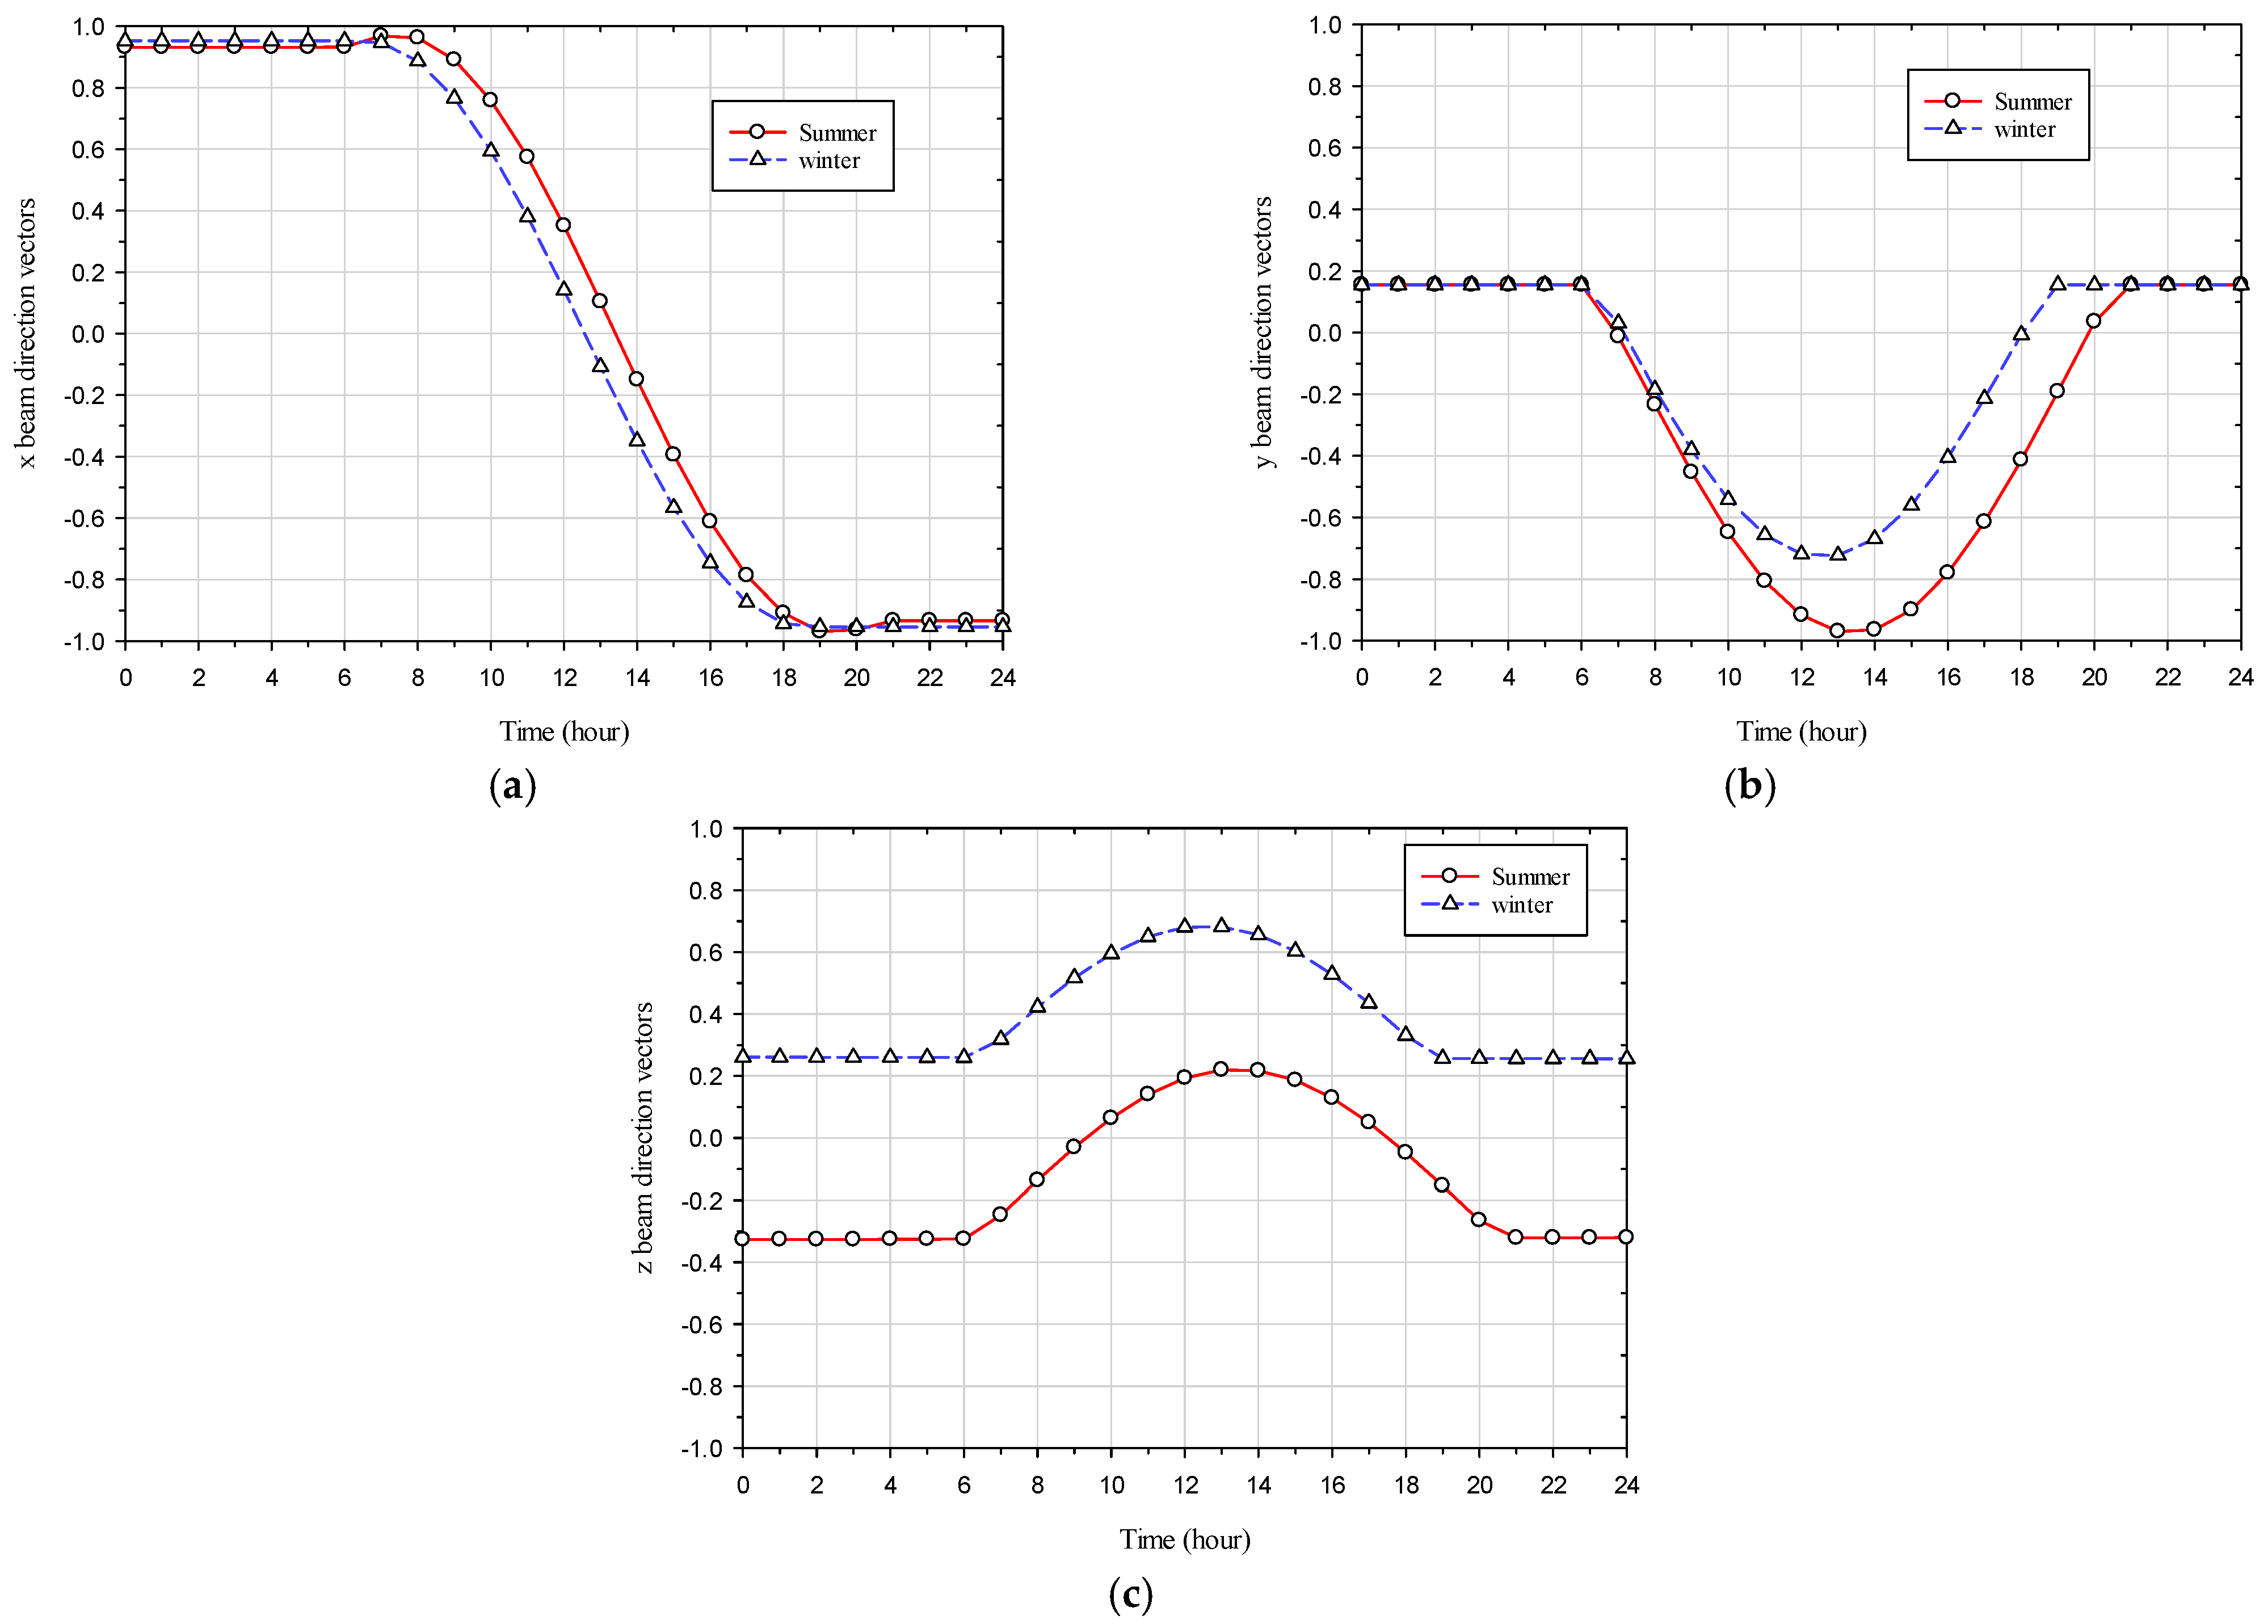
26], and hourly x, y, and z beam direction vectors [
26] (equal to the negative value of the sun direction vector) for the coldest and hottest days, as illustrated in
Figure 4,
Figure 5 and
Figure 6. The geometry’s orientation is such that the +z axis points to the north and the −x axis points to the east, as depicted in
Figure 7.
2.5. Initial and Boundary Conditions
The initial conditions for all parts of the DGW–REF and DGW–SSPCM are set to 26 °C and 24 °C during summer and winter, respectively.
The wall boundary conditions for the side (exterior top, bottom, front, and back) surfaces of the window are set as thermally insulated or adiabatic. The mixed thermal boundary condition including both convection and radiation are set for the indoor and outdoor surfaces of the window. Hence, the parameters, including heat transfer coefficient, free stream temperature, external emissivity, and external radiation temperature, have to be determined for the indoor and outdoor surfaces. Moreover, the semi-transparent boundary condition is set for the radiation boundary condition of the indoor and outdoor surfaces of the window to account for the solar irradiation through the numerical domain. Therefore, the parameters, including direct solar irradiation, diffuse solar irradiation, and x, y, and z beam direction vectors, have to be determined for the indoor and outdoor surfaces. The external emissivity for the typical clear glasses is set to 0.89 for all boundaries. To represent a full sunny day, the sunshine factor is set to 1, while for a cloudy day, this value is set to 0, resulting in a direct solar irradiation value of 0.
Regarding the window’s indoor surface thermal and radiation boundary conditions, the heat transfer coefficient is set to 8.7 W/m
2K [
31]. Both free stream temperature and external radiation temperature are set to 26 °C and 24 °C during summer and winter, respectively. No solar irradiation is set for the indoor radiation boundary condition to obviously not model a direct or diffuse solar irradiation to the indoor surface.
Regarding the window’s outdoor surface thermal and radiation boundary conditions, except for the emissivity, all other boundary conditions are imported into ANSYS FLUENT via User-Defined Functions (UDFs) written in C-programming compatible with the FLUENT library to simulate a full day (24 h). The UDFs are written in piecewise linear functions for the available hourly weather conditions. The hourly ambient temperature is set for the free stream temperature in the thermal boundary condition. In addition, the hourly direct and diffuse solar irradiations as well as hourly x, y, and z beam direction vectors are set in the radiation boundary conditions. The hourly heat transfer coefficient as a function of wind speed and hourly external radiation temperature or sky temperature as a function of ambient temperature have been calculated using Equations (16) and (17) [
32].
4. Results and Discussion
Numerical simulations are conducted for a DGW incorporating a 2 mm layer of SSPCM adhered to the inner pane within the gap space. The simulations are carried out over a period of 24 h in real time, encompassing both sunny and cloudy days during the coldest and hottest days of the year 2022 in Miami.
As shown in
Table 2, numerical simulations were performed for transient temperatures of 10, 15, and 20 °C, along with transient temperature ranges of 1, 3, and 5 °C in winter and transient temperatures of 20, 25, and 30 °C, and transient temperature ranges of 1, 3, and 5 °C in summer. It is noteworthy to say that the transient temperature represents the central temperature within the temperature range. For example, with a transient temperature of 20 °C and a transient temperature range of 5 °C, the opaqueus (equivalent to the term solidus in SLPCM) and transparentus (equivalent to the term liquidus in SLPCM) temperatures are 17.5 °C and 22.5 °C, respectively. The study analyzes the effects of these parameters on the transparency fraction, interior surface temperature, and energy savings.
As provided next, the numerical results are represented in four sections, each of which contains the parametric study results for one parameter, including transparency fraction, interior surface temperature, total heat flux on the interior surface, and energy savings.
4.1. Transparency Fraction
In this section, the variations of the transparency fraction of the SSPCM during summer and winter for the hottest sunny and cloudy days, as well as the coldest sunny and cloudy days, are analyzed.
Figure 9 shows the dependence of the transparency fraction on time for the studied scenarios during summertime on sunny and cloudy days. In
Figure 9a, it is observed that when the SSPCM transient temperature is 20 °C, it remains opaque throughout the day; however, it partially transitions to a translucent state between 12 pm and 4 pm. Conversely, at a transient temperature of 25 °C, a complete phase transition cycle occurs, highlighting the significant influence of transient temperature on the phase transition behavior of the SSPCM and, consequently, the thermal behavior of the glazing system. With the initial temperature of the glazing system set equal to the indoor temperature (26 °C), the transparency fraction of SSPCM decreases from values near 1 during the night as solar radiation is absent at low outdoor temperatures. As shown in
Figure 9a, the gradient of the transparency fraction increases with lower transient temperature ranges, with the transparency fraction transitioning from 1 to 0 in about 3.5 h for a transient temperature range of 1 °C and nearly 4.25 h for a transient temperature range of 3 °C. However, for a transient temperature range of 5 °C, the SSPCM does not transition to the opaque phase, and its transparency fraction reduction gradient is lower than that for the other two conditions above. The gradients are consistent across the three different transient temperature ranges. Around 8:00, as solar radiation starts to take place, the temperature of the glazing system starts to rise, leading to an increase in the transparency fraction. All three SSPCMs with different transient temperature ranges reach the transparent phase, remain transparent for a couple of hours, and then start to transition back to a translucent state due to the temperature and solar irradiation reductions. For SSPCMs with a transient temperature of 30 °C, the transparency fraction never decreases, indicating that the SSPCM remains transparent throughout the day and its temperature never exceeds the opaqueus temperature.
Figure 9b provides the results for the summertime on a cloudy day. The transparency fraction variations before sunrise (around 8:00) are identical to those in
Figure 9a, as expected. The lack of direct solar irradiation at the presence of diffuse solar irradiation causes less overall solar irradiation, resulting in a lower temperature rise of the system and hence a lower transparency fraction increment gradient during the daytime. It is also evident from this figure that for all transient temperature ranges, the transparency fraction remains at 0 and 1 for transient temperatures of 20 °C and 30 °C, respectively. As shown in
Figure 9b, although the SSPCM with a transient temperature range of 1 °C goes through a full phase transition cycle and remains transparent for a couple of hours, it is not the case for the SSPCM with a transient temperature range of 3 °C and 5 °C, as they do not reach the transparent phase. Overall, lower transient temperature ranges have facilitated full phase transition cycles of the SSPCM, allowing the system to fully utilize its latent heat energy storage capacity. Furthermore, the longer the SSPCM remains in its transparent phase, the longer it provides the best visual view for the occupants.
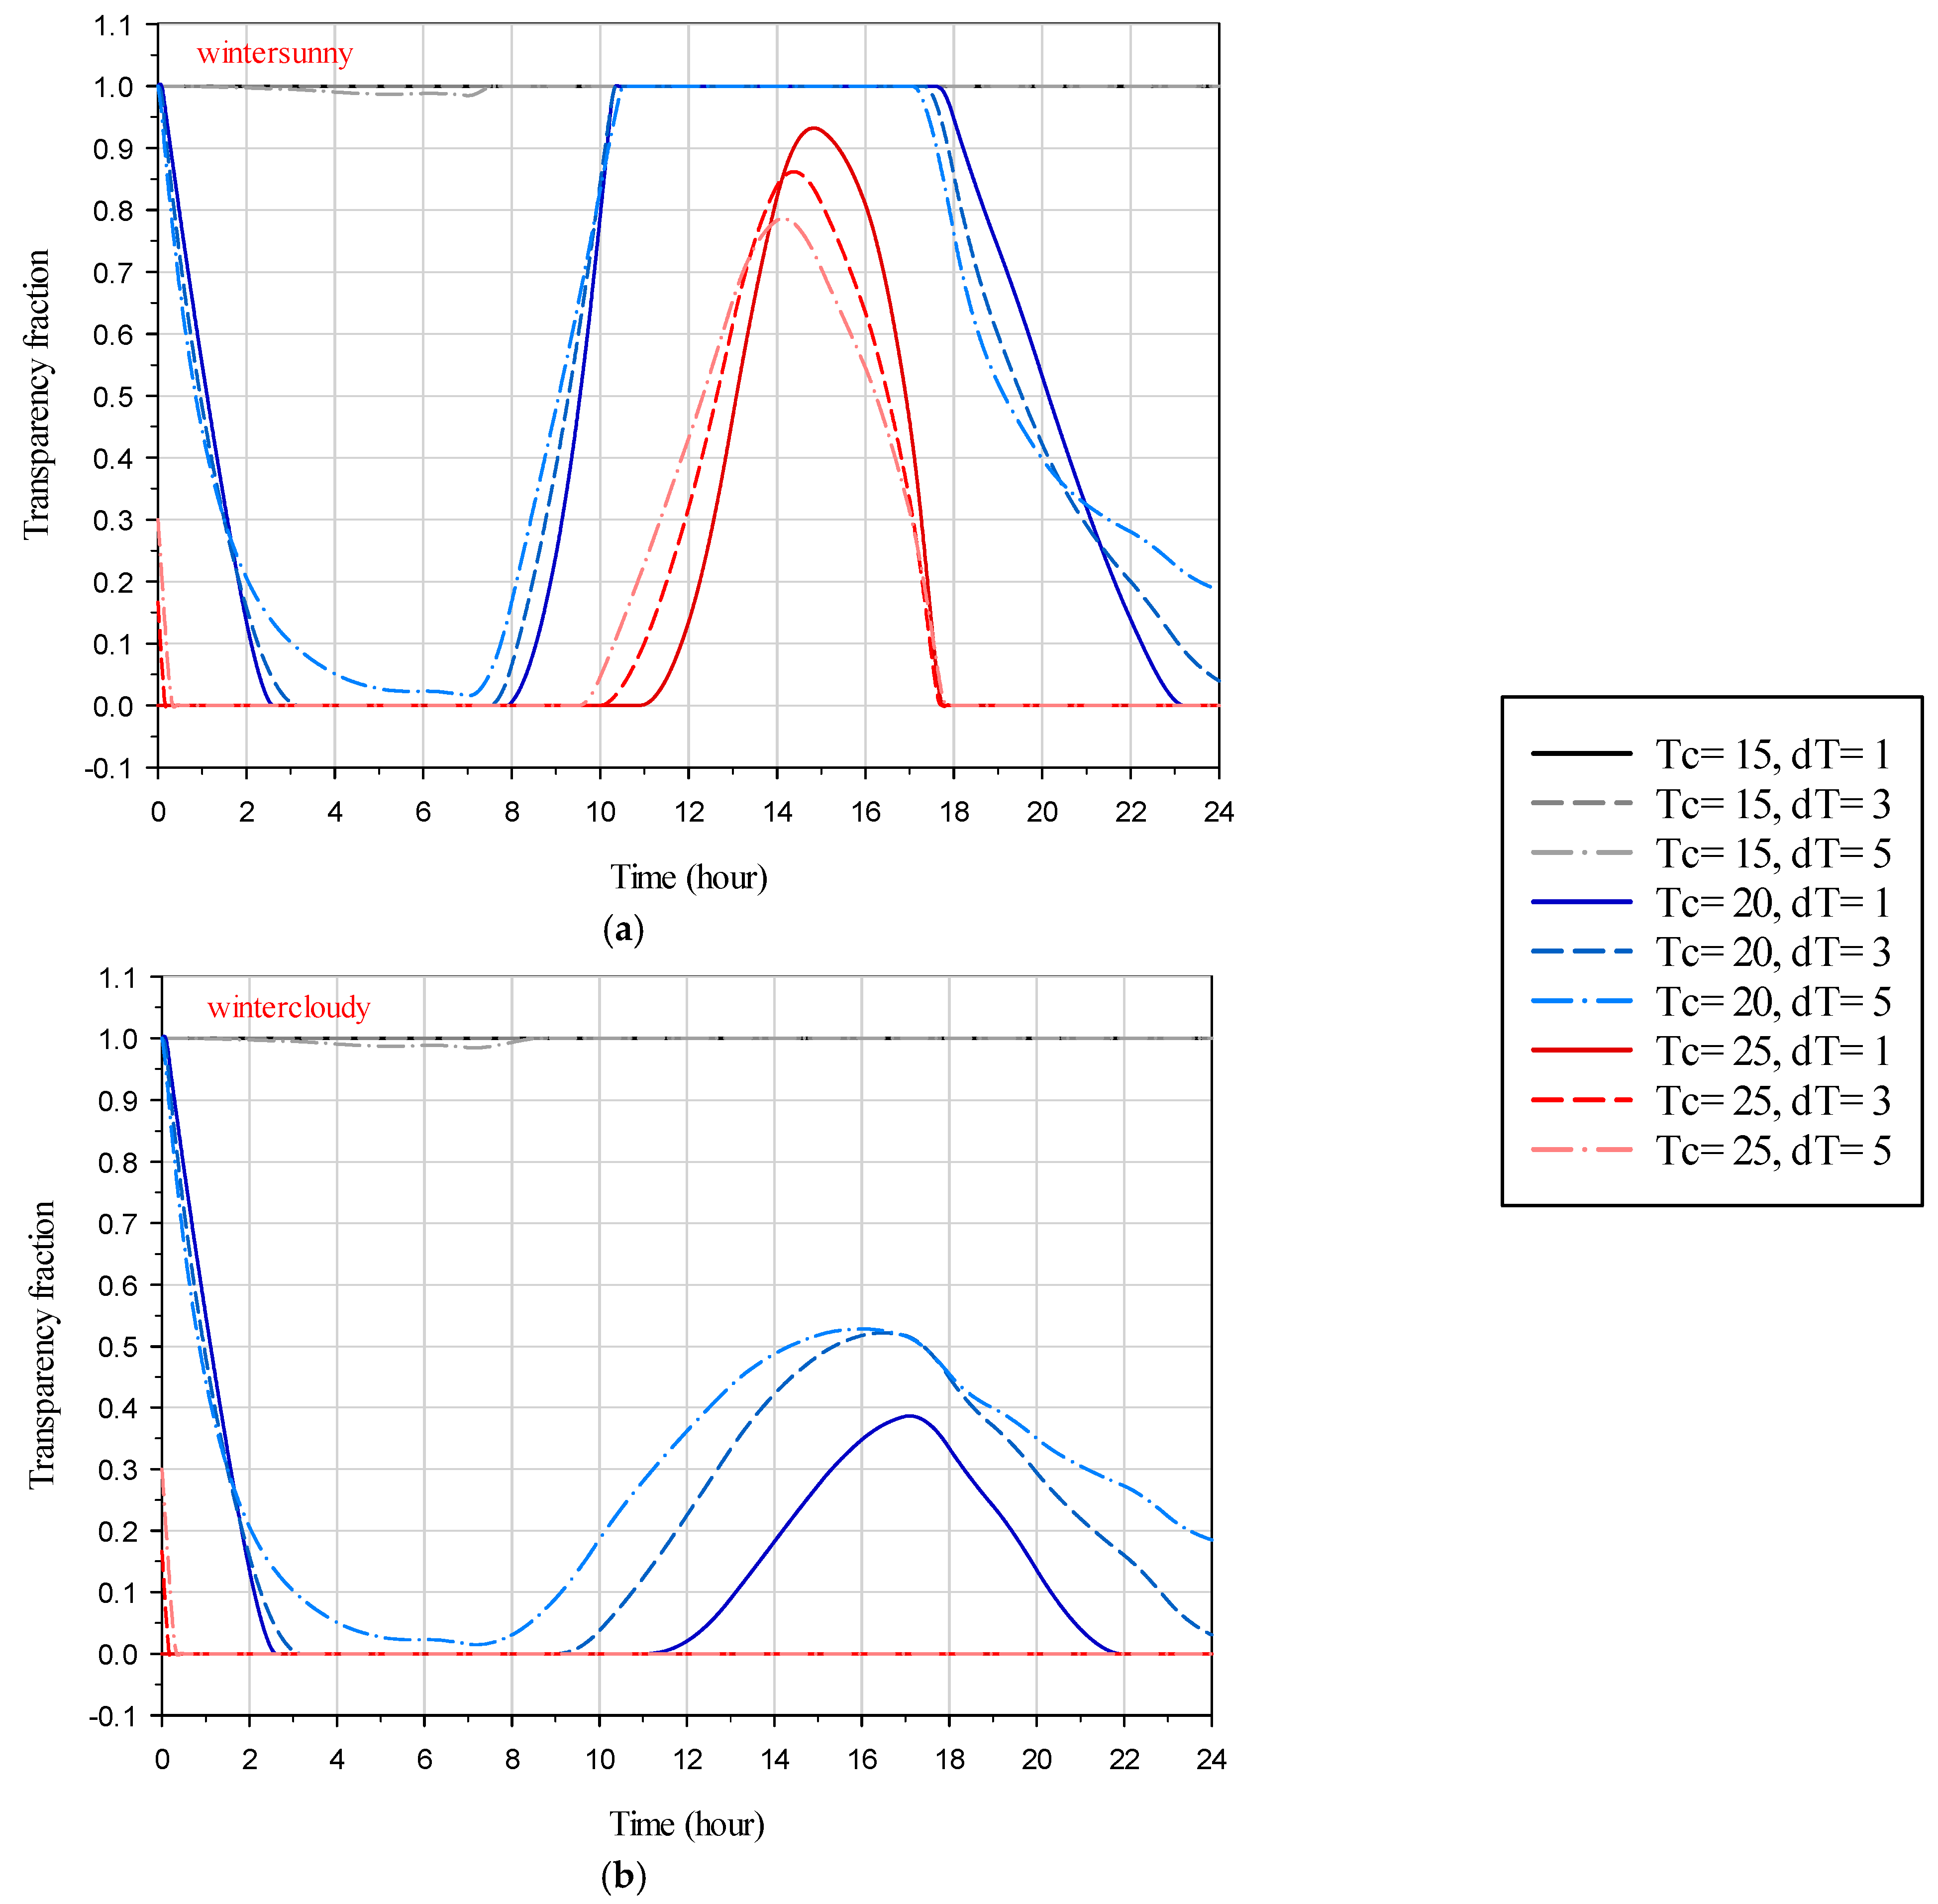
Figure 10 depicts the variations in the SSPCM transparency fraction for the studied scenarios during winter, considering both sunny and cloudy days. It is evident from this figure that the presence of direct solar irradiation on a sunny day greatly affects both the SSPCM temperature and its transparency fraction. Specifically, when the SSPCM transient temperature is 15 °C, on both sunny and cloudy days, the SSPCM remains transparent throughout the entire day. At a transient temperature of 25 °C, the glazing system can utilize the latent heat storage of the SSPCM during sunny days, as the SSPCM undergoes partial phase changes, whereas this is not observed during cloudy days, where the SSPCM remains opaque throughout the day. When the SSPCM transient temperature is set to 20 °C, it undergoes a full phase transition cycle on sunny days, but only a partial phase transition on cloudy days, failing to reach its transparent phase.
Figure 10 also shows that that the effect of transient temperature range on the SSPCM transparency fraction is lower during winter sunny days compared to winter cloudy days. Regarding the provision of a visual view for the occupants, during sunny days in winter, a visual view can be provided during the daytime, whereas on cloudy days, the view would mostly be translucent during the daytime.
4.2. Interior Surface Temperature
In this section, the simulation results related to the variations in the interior surface temperature of the glazing system during the hottest summer and coldest winter days in sunny and cloudy sky conditions are discussed.
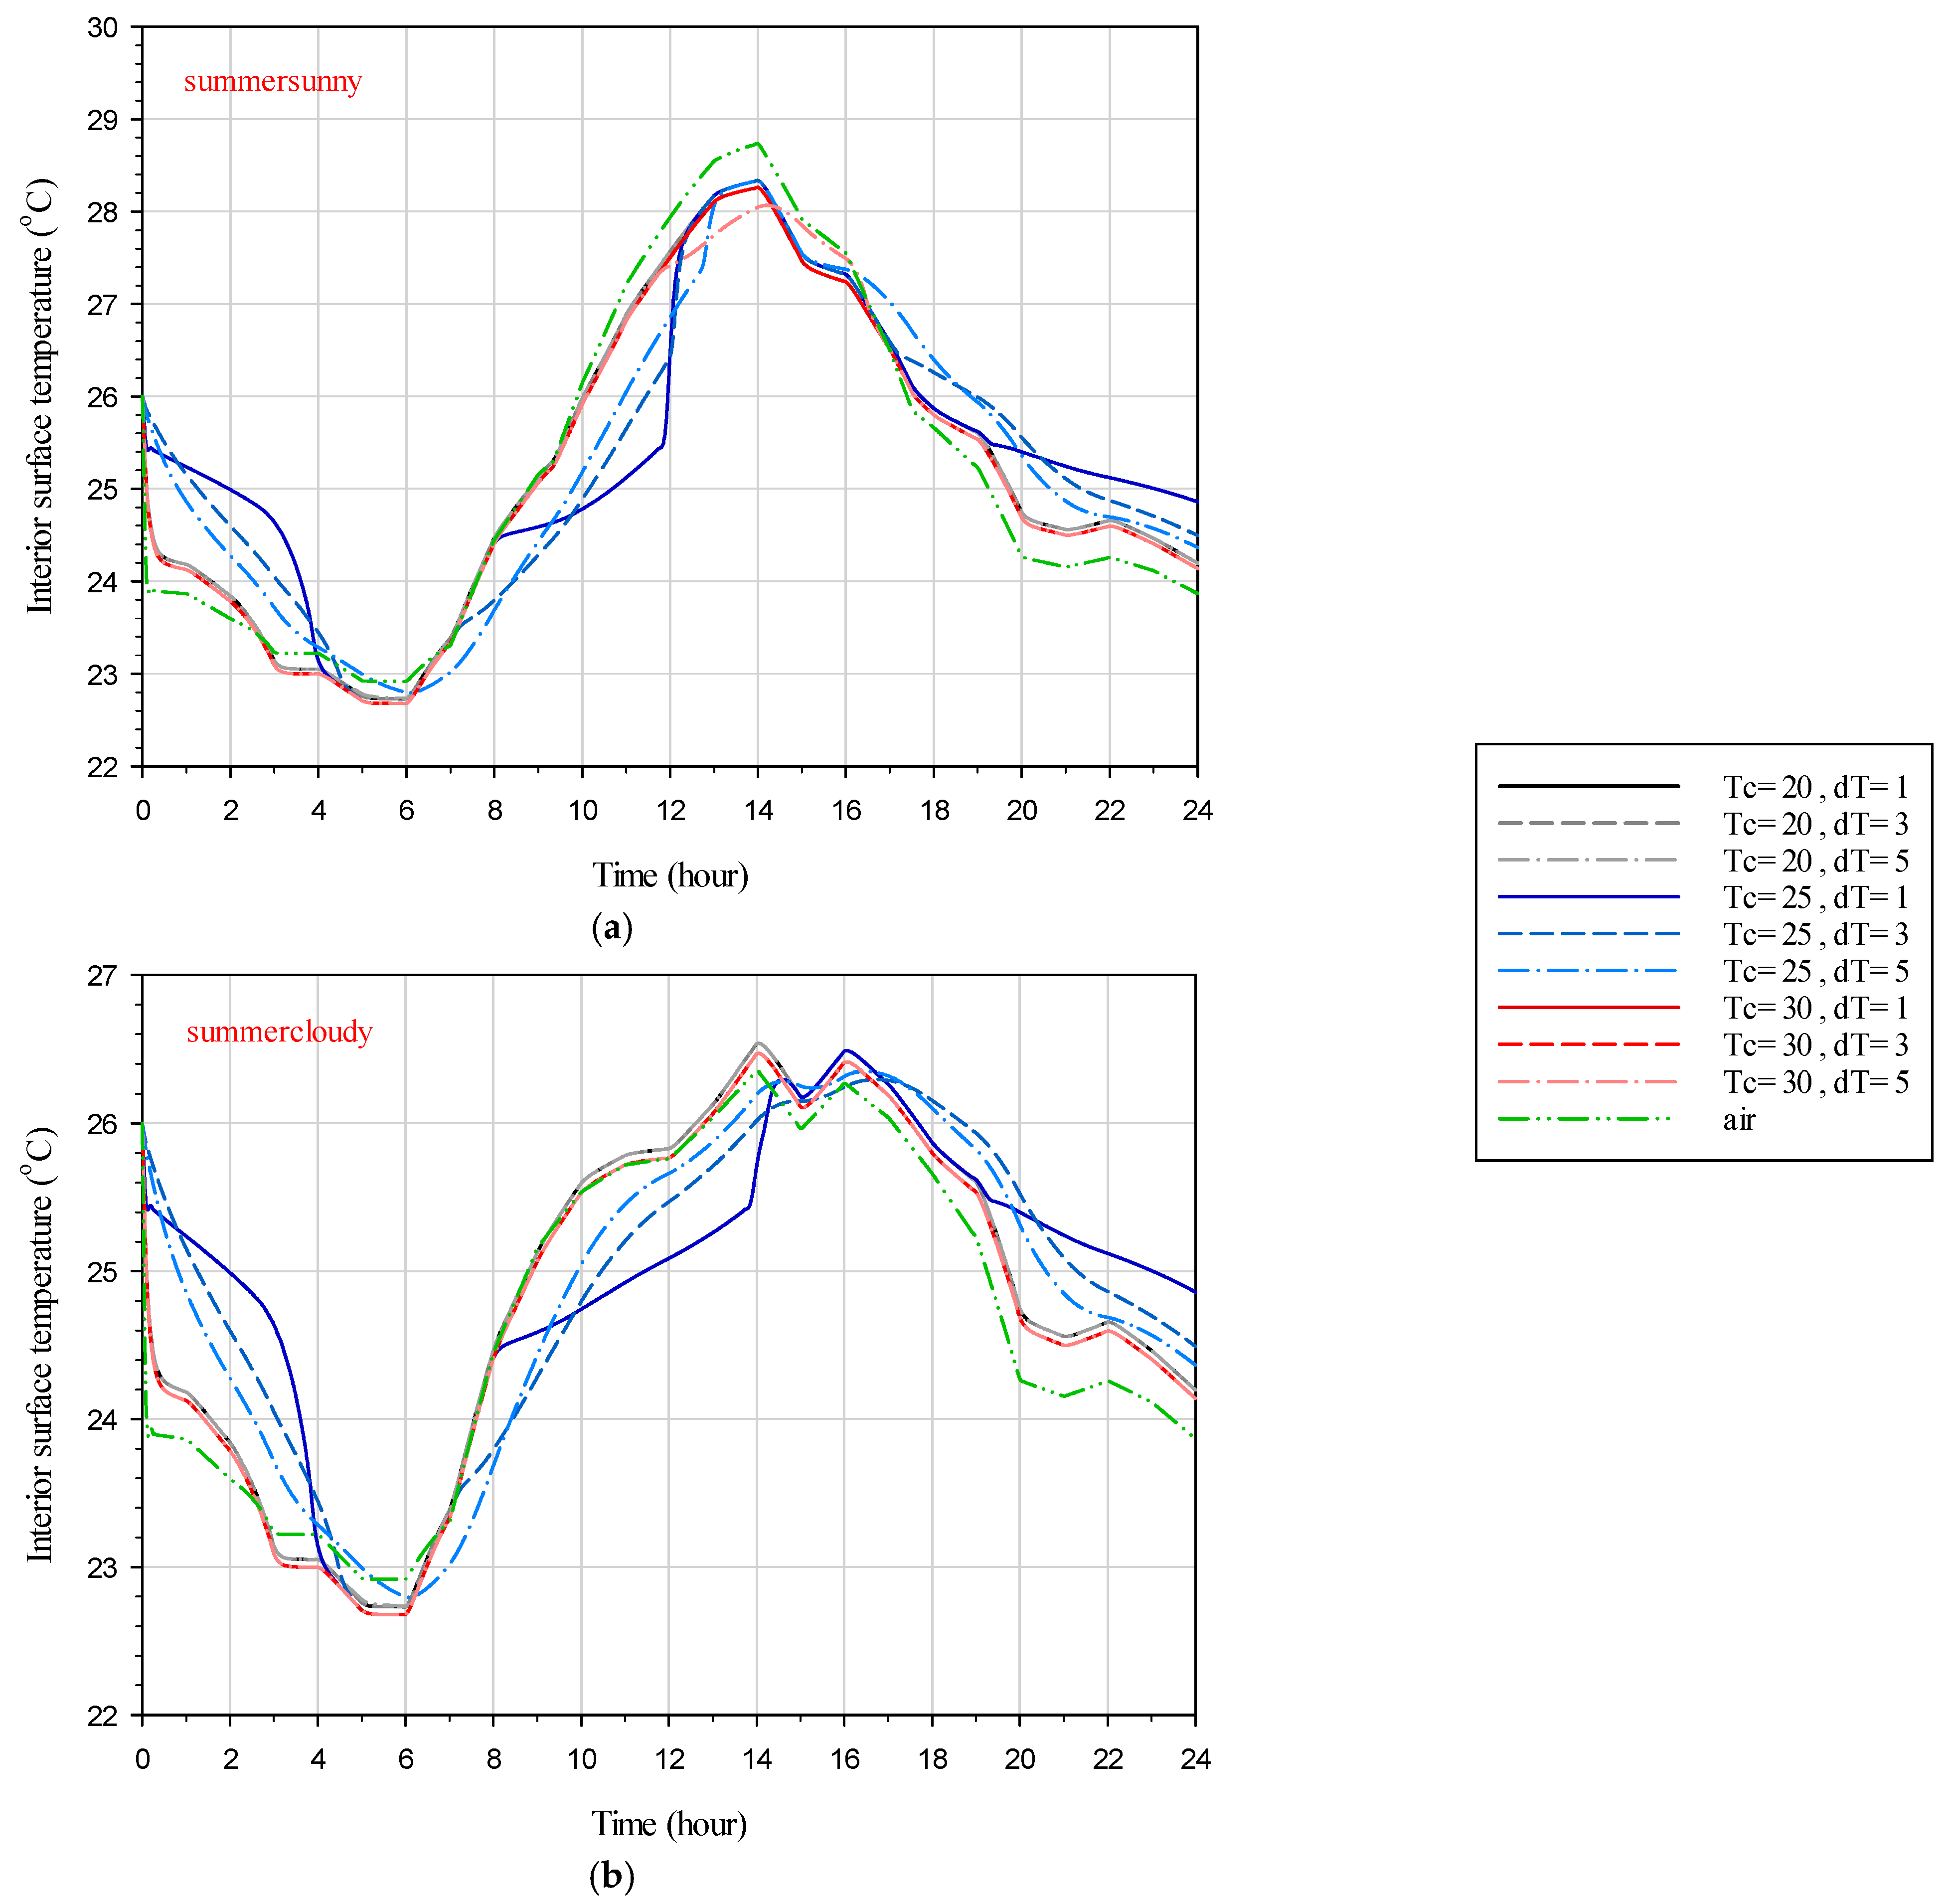
Figure 11 depicts the interior surface temperature distribution during the summer sunny and cloudy days for the studied scenarios of the DGW–SSPCM as well as the DGW–REF (
Table 2). During the summertime, this figure shows that the lower the interior surface temperature, the better the thermal performance of the system. Also, the interior surface temperature for the cases with transient temperature of 20 °C and 30 °C are approximately the same, and the trend is the same for both sunny and cloudy days. This is because in these transient temperatures the SSPCM has not gone through any phase transition, and thus the glazing system cannot benefit from its latent heat storage advantage. In addition, the case with a 20 °C transient temperature results in higher inner temperature as it stays in the transparent phase as opposed to the case with a 30 °C transient temperature. Moreover, in these two cases, the transient temperature range has a subtle impact on the interior temperature due to the lack of SSPCM phase change. Regarding these two cases (i.e., transient temperatures of 20 °C and 30 °C), the thermal performance of the system is different on sunny and cloudy days. On sunny days, even when the SSPCM phase transition does not occur, the thermal performance of the DGW–SSPCM (compared to the DGW–REF) has been increased during the daytime, and it has been decreased during the nighttime due to the blockage of the direct solar irradiation.
On cloudy days,
Figure 11 shows that the thermal performance of the DGW–SSPCM is lower than the DGW–REF during most of the hours of the day. On the other extreme of the rope, the SSPCM with a transient temperature of 25 °C yields different temperature distributions as the phase transition occurs. It is visible that during the daytime, the interior surface of the DGW–SSPCM is lower than the DGW–REF, and at nights it is reversed. During the day, as the solar irradiation comes to light, the SSPCM absorbs heat using its high latent heat advantage and behaves as a promising insulation material by preventing solar irradiation to heat up the interior surface. At night, however, this absorbed heat is released as the ambient temperature drops, resulting in a higher interior temperature at nights. At this transient temperature (i.e., 25 °C), the influence of the transient temperature range becomes substantial. Finally, on both sunny and cloudy days, the transient temperature range effects on the interior surface temperature are visible, as the lower this value is the greater the temperature gradients are. Also, a lower transient temperature range causes lower interior temperature during the daytime and higher interior temperature at night.
Figure 12 displays the variations in interior surface temperature for the DGW–SSPCM and DGW–REF throughout the day in winter for both sunny and cloudy conditions. A higher interior surface temperature during winter indicates better thermal performance of the system. Referring to
Figure 10a, in sunny conditions depicted in
Figure 12a, the SSPCM undergoes phase transition at transient temperatures of 20 °C and 25 °C, resulting in differences in the interior surface temperature between the DGW–SSPCM and the DGW–REF. The presence of the SSPCM leads to lower interior temperatures during the day due to its latent absorption and solar direct irradiation blockage, which is released at night when ambient temperatures drop. However, when the SSPCM does not complete a full phase transition cycle, as seen with the transient temperature of 20 °C, the released heat during the night contributes to the low sensible heat storage capacity of the material. In contrast, at a transient temperature of 25 °C, where the full phase transition cycle occurs, higher interior temperatures at night indicate improved thermal performance of the system using the higher latent heat storage capacity of the material.
In cloudy conditions, demonstrated in
Figure 12b, only the transient temperature of 25 °C results in beneficial temperature distributions, providing higher interior temperatures during the night. Overall, the transient temperature is a critical parameter for optimizing the thermal performance and energy saving potential of the DGW–SSPCM system compared to the DGW–REF. Incorrect selection of the transient temperature can lead to reduced thermal performance and energy efficiency of the system.
4.3. Total Heat Flux on the Interior Surface
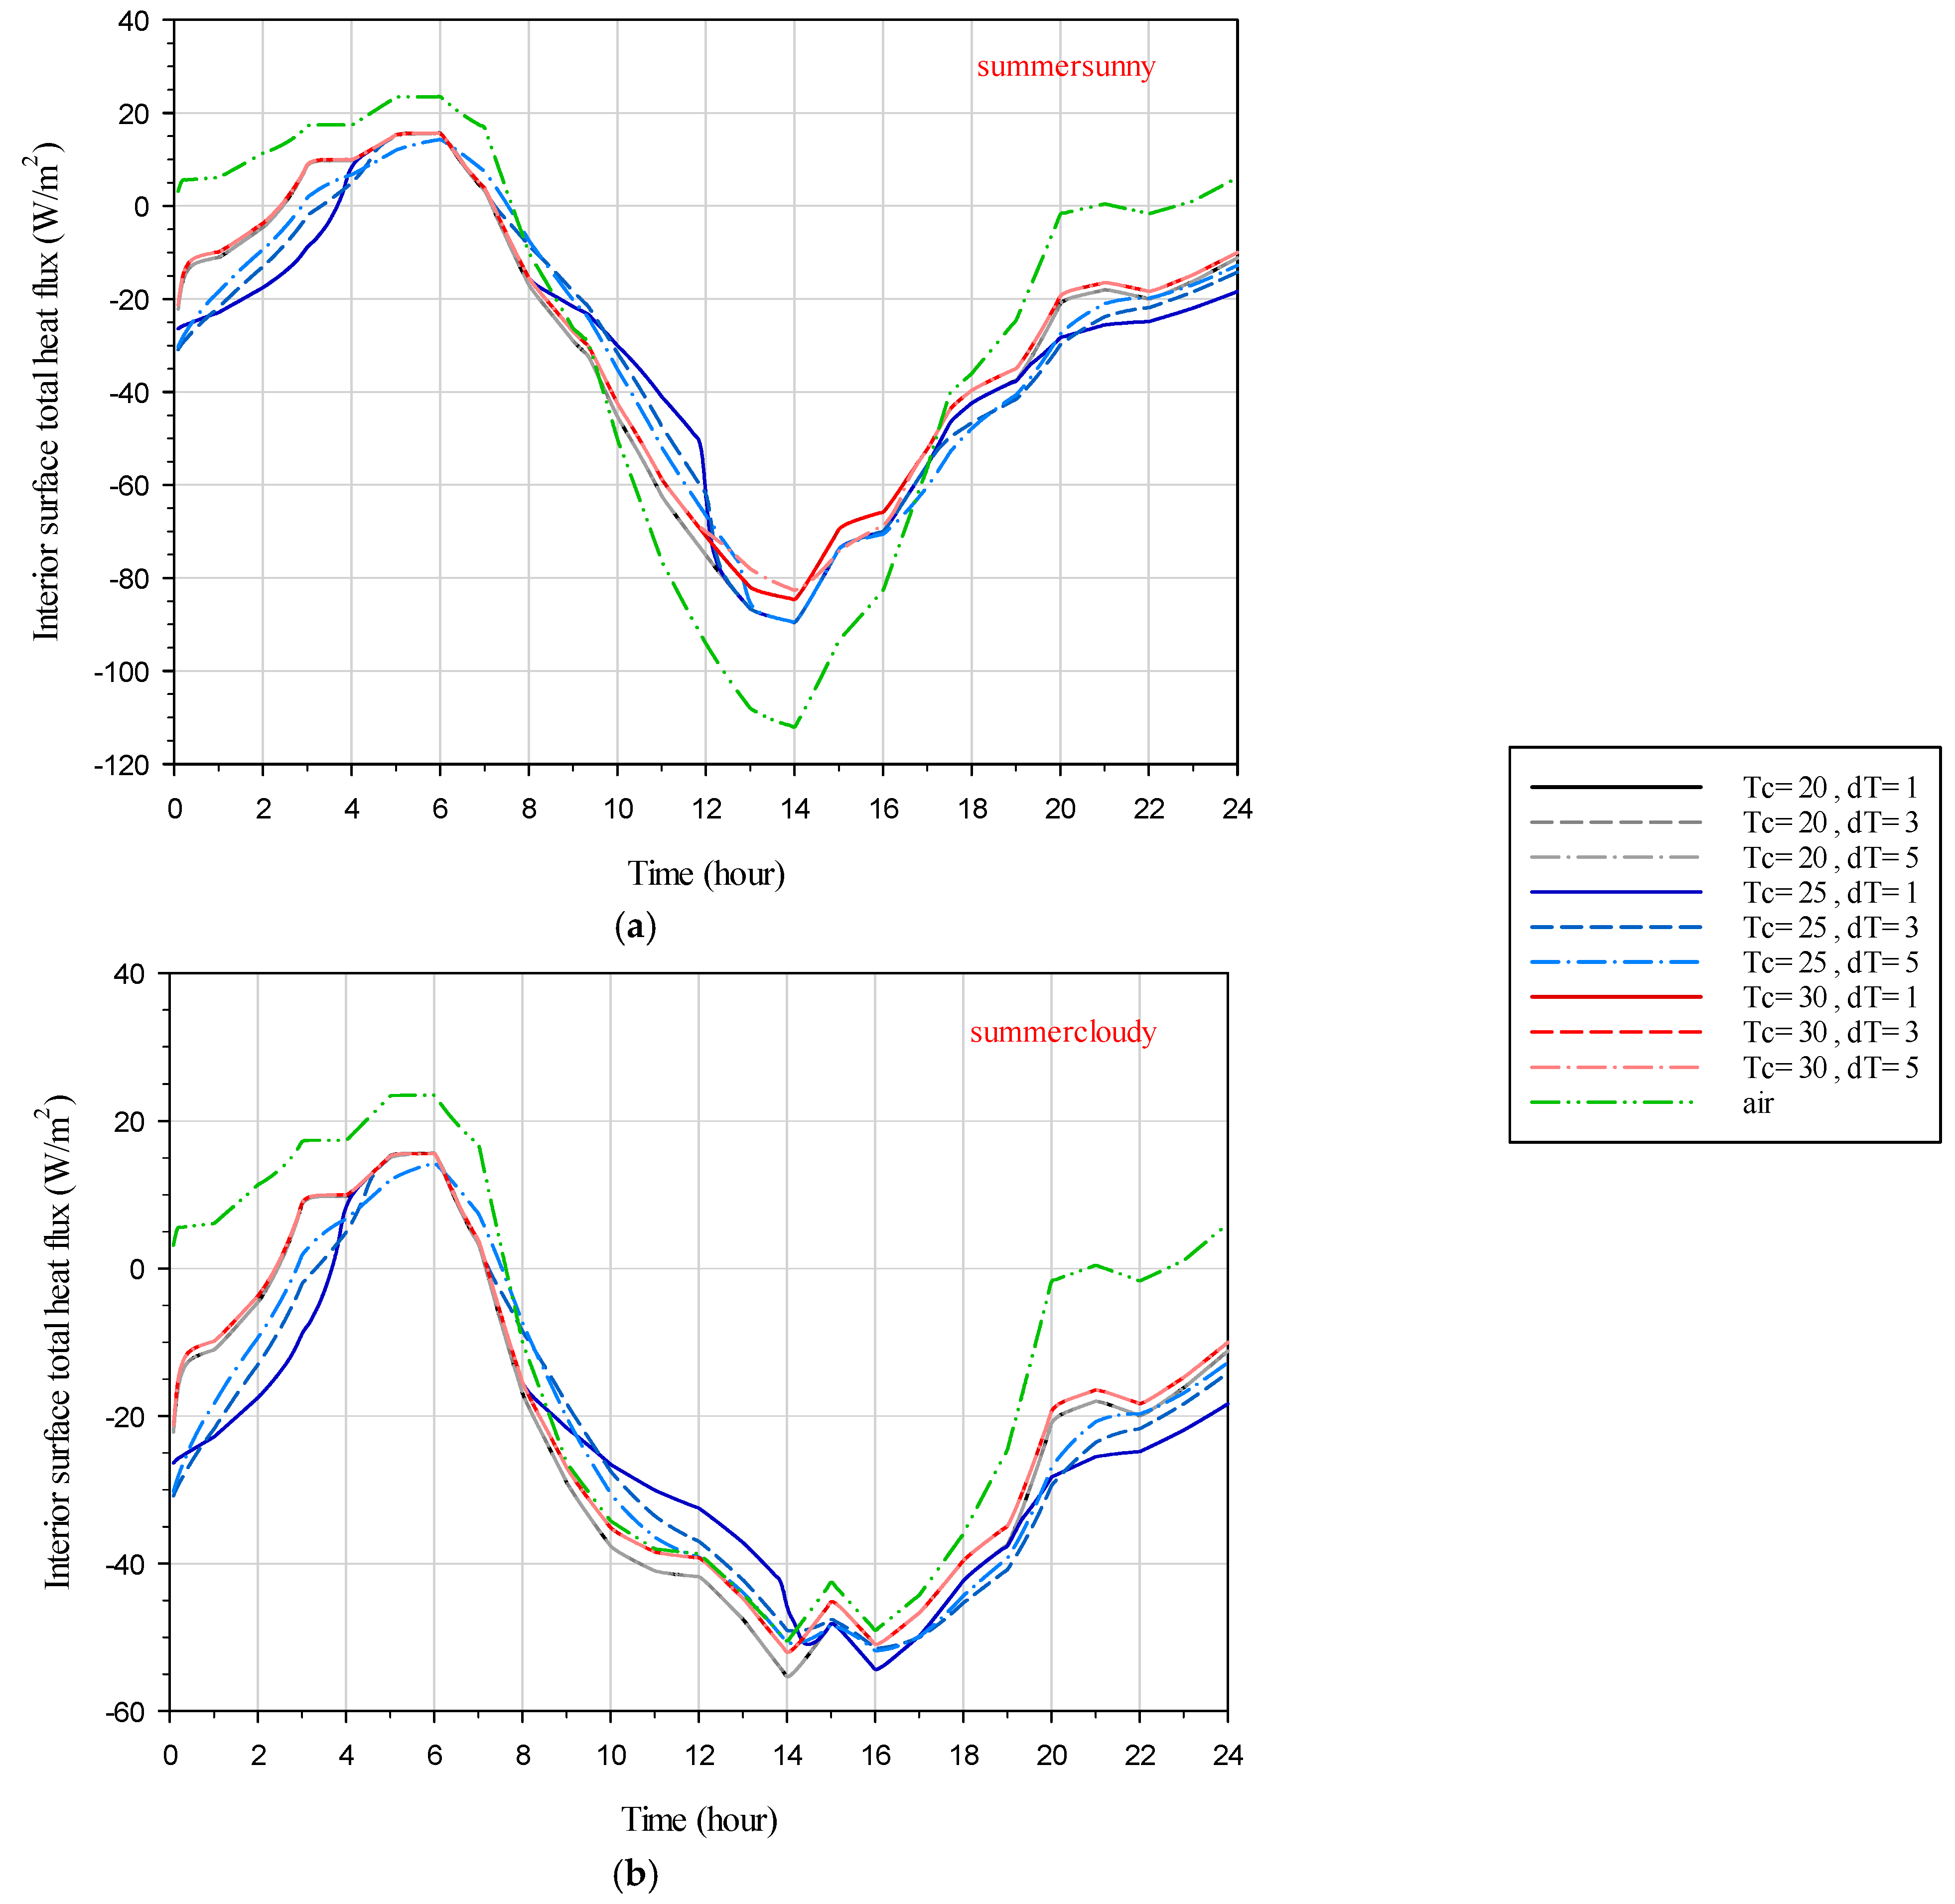
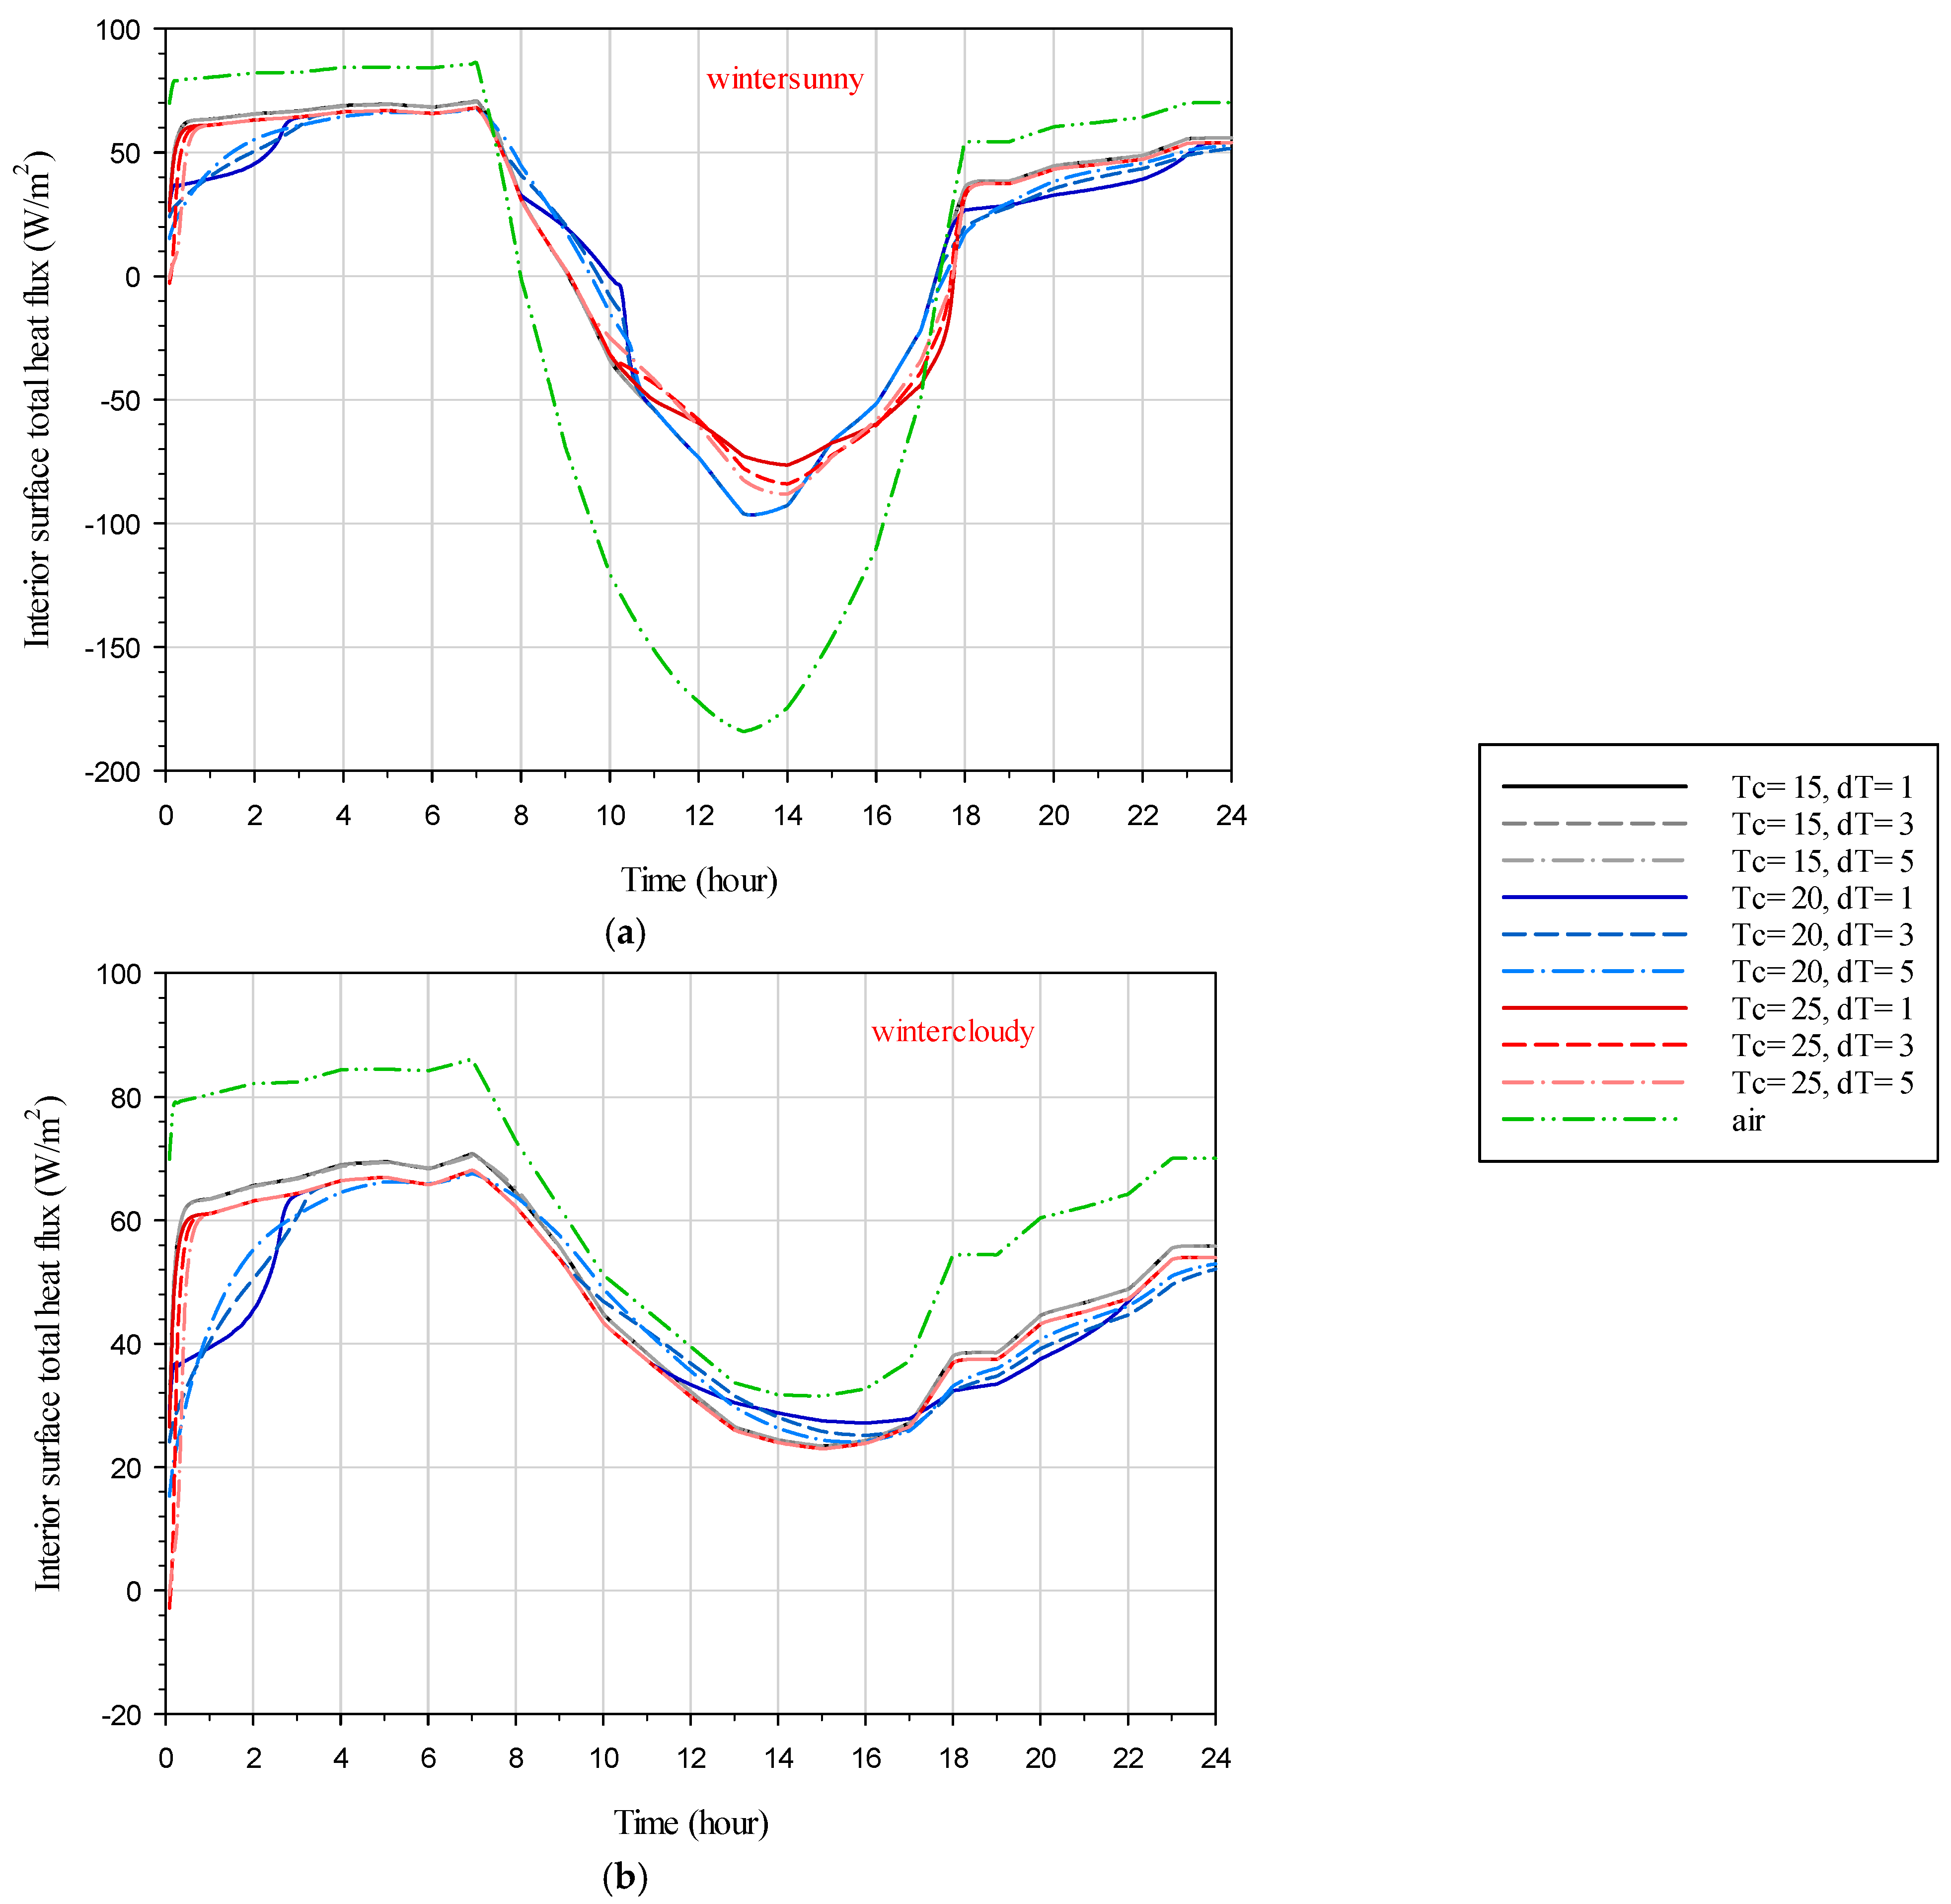
The numerical results for the dependence of the interior surface heat flux on time for the glazing system during the hottest summer and coldest winter days in sunny and cloudy sky conditions are discussed. In
Figure 13,
Figure 14 and
Figure 15, the negative values for the total heat flux represent the heat flux direction from outside to the inside that contributes to the cooling energy loads.
On the contrary, the positive values for the total heat flux represent the heat flux direction from inside to the outside that contribute to heating loads.
In
Figure 13, for the DGW–REF case, the heat flux is observed to flow from outside to inside during the night, while during the day, it reverses direction, flowing from inside to outside. On sunny days, using SSPCM results in reduced heat flux entering the interior during the day due to the blocking of solar direct irradiation. However, during the night, heat flux continues to enter the interior as a result of heat release from the SSPCM, which was absorbed during the day. Even on cloudy days, heat release from the SSPCM to the interior is evident during the night, but the heat entering the interior during the day is approximately similar for both DGW–SSPCM and DGW–REF due to the absence of direct solar irradiation. Interestingly, SSPCMs that have not gone through a phase transition still exhibit heat release to the interior during the night, attributed to sensible heat energy storage. However, SSPCMs with a transient temperature of 25 °C, which experience a phase transition during the day, show higher heat flux entering the interior during the night. Comparing different transient temperature ranges reveals that for cases with a transient temperature of 25 °C, lower transient temperature ranges correspond to higher heat flux entering the interior during the night and lower heat flux exiting during the day.
In
Figure 14, the interior surface total heat flux distribution during the day is depicted for both the DGW–SSPCM and DGW–REF. During winter, the SSPCM can influence the heat flux dynamics, resulting in less overall heat flux being released to the outside during the day, contributing to energy savings. However, it also reduces the amount of heat entering the interior from direct solar irradiation.
Figure 14a shows that less heat enters the interior in the DGW–SSPCM compared to the DGW–REF during the day, while the amount of heat flux escaping from the interior in the DGW–SSPCM is also reduced compared to the DGW–REF. Due to the absence of direct solar irradiation, the heat flux throughout the day is directed outside, and the SSPCM contributes positively by reducing the heat flux escaping from the interior to the outside, leading to energy savings (see
Figure 14b).
4.4. Energy Savings
To quantify the energy savings with the DGW–SSPCM in relation to DGW–REF, the definition of the energy savings given by Equation (20) is used and depicted in
Figure 15 for different scenarios investigated in this paper.
Figure 15 shows that the energy savings during cooling and heating degree hours (i.e., the hours during which both cooling and heating are needed) defined as the interior surface temperature of the inner glass pane is above 26 °C in summer and below 24 °C in winter in the DGW system compared to the reference system (i.e., the DGW–SSPCM system).
Figure 15 displays the heat energy of the studied cases (as determined in
Table 2) over the peak load hours defined above. Furthermore,
Table 5 is provided to summarize the energy savings of all studied cases for various climatic conditions.
During summer, the SSPCM absorbs solar heat radiation, leveraging its high latent heat energy storage capacity during heating and cooling degree hours. For the summer sunny day, over the cooling degree hours occurring between 9:55 and 17:20, the DGW–SSPCM system exhibits lower heat energy entering the building compared to DGW–REF due to the blockage of direct solar irradiation by the SSPCM. The energy savings of cases 1 to 9 (defined in
Table 2) vs. the DGW–REF case on summer sunny days are 17.4, 17.4, 17.4, 24.2, 22.5, 21.1, 22.1, 22.1, and 21.9 percent, respectively. Hence, the highest energy savings of the DGW–SSPCM system vs. the DGW–REF in summer sunny weather conditions occur in case 4, where the transient temperature value and range are 25 °C and 1 °C, resulting in a 24.2 percent energy savings. However, for the summer cloudy day (over the cooling degree hours occurring between 12:55 and 17:05), the DGW–SSPCM system experiences energy loss compared to the DGW–REF system. The energy loss of cases 1 to 9 (defined in
Table 2) vs. the DGW–REF case on summer cloudy days are 10.9, 10.9, 10.9, 3.1, 1.4, 6.3, 4.1, 4.1, and 4.1 percent, respectively. Hence, the lowest energy loss of the DGW–SSPCM system vs. DGW–REF in summer cloudy weather conditions occurs in case 4, where the transient temperature value and range are 25 °C and 1 °C, resulting in a 3.1 percent energy loss.
During winter, the SSPCM retains warm air inside of the building and prevents it from escaping. For the winter sunny day, over the heating degree hours occurring between 16:55 and 9:00, the DGW–SSPCM system demonstrates higher energy savings compared to the DGW–REF system. The energy savings of cases 1 to 9 (defined in
Table 2) vs. the DGW–REF case on winter sunny days are 14.6, 14.6, 14.6, 14.6, 14.6, 14.6, 26.3, 25.4, and 24.0 percent, respectively. Case 7, with a transient temperature value and range of 25 °C and 1 °C, exhibits the best energy savings among other cases, at 26.3 percent. Conversely, for the winter cloudy day, where the temperature remains below 24 °C throughout the day, the entire day is considered as heating degree hours. The energy savings of cases 1 to 9 (defined in
Table 2) vs. the DGW–REF case on winter cloudy days are 20.4, 20.4, 20.4, 26.2, 26.0, 25.3, 23.1, 23.6, and 24.0 percent, respectively. Case 4, with a transient temperature value and range of 20 °C and 1 °C, demonstrates the most energy-efficient system, achieving a 26.2 percent energy savings. While case 7 shows slightly lower energy savings (23.1 percent), it still performs significantly better compared to the DGW–REF system.
Overall, the best SSPCM for the studied south-facing glazing system in Miami is one with a transient temperature value and range of 25 °C and 1 °C, respectively. Choosing an SSPCM with appropriate thermophysical properties and a small thickness applied to the inner glass pane of a DGW within the air gap, resulting in full phase transition cycles along with a lower temperature transient range, could lead to a more energy-efficient glazing system. Despite slightly less energy efficiency during summer cloudy days, the overall energy performance enhancement on other day types during winter and summer compensates for this loss.
