Abstract
Counter-rotating turbines, designed to enhance the performance efficiency of tidal turbines, exhibit variable operational characteristics depending on the axial distance between the front and rear blades. This study encompassed both numerical analyses and performance experiments to establish the optimal design by examining the relationship between flow field alterations and the performance of a counter-rotating tidal turbine with varied axial distances. The blades of the counter-rotating tidal turbine, based on a 10-kW single turbine, were designed utilizing the Blade Element Momentum technique. The turbine blades were assessed for changes in output performance attributed to flow separation by analyzing the velocity distribution and separation points within the flow, demonstrating a maximum power coefficient of 40.3% at a design Tip Speed Ratio of 3. At y/D = 0.3. The counter-rotating tidal turbine achieved a maximum power coefficient of 47%, with performance enhancements of the rear blades driven by the accelerated wake of the front blades. Furthermore, the pressure coefficients of the blades, influenced by their shape, inflow velocity, and angle, were detailed separately for the suction and pressure sides. The study also explored the correlation between the flow characteristics and the output performance of each blade by analyzing the distribution of pressure coefficients.
1. Introduction
Global warming, caused by greenhouse gases from fossil fuel combustion and industrial activities [1], has prompted international organizations to predict the onset of a global boiling era [2]. To counteract this trend, where tropical climates could become more widespread, a significant reduction in greenhouse gas emissions and a curtailment of fossil fuel use are essential. Moreover, there is an urgent need for innovative developments in renewable energy to better adapt to climate change.
Internationally, there is a focus on reducing greenhouse gas emissions, with Europe leading this initiative through the ‘European Green Deal’, which aims to transform the continent into a carbon-neutral entity by 2050 [3]. Additionally, the new climate regime under the Paris Agreement imposes obligations to reduce greenhouse gas emissions, highlighting the energy sector’s role, which accounts for over two-thirds of these emissions [4]. In line with these global efforts, the Korean government is progressively enhancing its development and investment in renewable energy, targeting a 20% renewable energy share by 2030 as part of its strategy to reduce greenhouse gas emissions [5]. However, the challenge remains in transitioning to sustainable energy sources that can achieve decoupling while enhancing energy efficiency, as greenhouse gas reduction is closely linked to industrial activities.
Therefore, Korea must actively leverage its environmental attributes to harness marine energy for greenhouse gas reduction. Marine energy, with its energy density up to 840 times that of wind power, can enhance energy efficiency without impeding economic growth [6]. Thus, transitioning to marine energy is particularly suited for achieving decoupling. Tidal energy, a form of marine energy, enables predictable power generation through the consistent patterns of tidal flows, offering a dependable energy source that operates independently of weather conditions. Additionally, the installation sites for tidal turbines minimally affect free ship navigation and local ecosystems and do not necessitate extensive construction [7]. In contrast, tidal energy is affected by the significant thrust and load acting on underwater structures due to the high density of seawater, necessitating constant repair and maintenance [8], with disadvantages including restrictions on water depth and flow velocity depending on site conditions. However, if these drawbacks are mitigated, it can be considered as an energy source that aligns with government policies regarding greenhouse gas reduction.
These tidal turbines, which extend wind turbine operating conditions underwater, can be categorized based on the direction of the turbine’s rotation axis or the structural characteristics of the blades. Turbines are categorized into horizontal-axis and vertical-axis types based on the axis direction. Horizontal-axis turbines align with the horizontal tidal flow, ensuring efficient operation, although they face challenges as the flow direction reverses [9]. Conversely, vertical-axis turbines, with rotors perpendicular to the tidal flow, may be harder to start but can maintain an efficiency of 25–30%. These turbines generate energy irrespective of the tidal flow direction because the blades rotate by lift or drag [10].
Therefore, various tidal turbine development and demonstration projects are being conducted to utilize the high efficiency of tidal energy. MCT’s SeaGen developed a horizontal-axis single turbine and conducted the world’s first demonstration test at the Skerries site in Anglesey in 2003 [11]. Gorlov developed a vertical-axis turbine as part of the GHT project and evaluated its performance on a barge [12]. In Korea, KIOST has been operating a 20 kW-class helical type vertical-axis turbine in Uldolmok since 2002.
Additionally, to enhance tidal turbine performance, structural modifications to the blades or the addition of auxiliary devices have been explored. One study [13] selected a flexible wing type for the blade’s structural design and measured performance changes in lift and drag with increased camber of a rigid wing. France’s Sabella designed and demonstrated a six-blade MW-class turbine with extended blade tips to adjust the lift-to-drag ratio. DCNS’s OpenHydro sought to enhance performance by installing an open duct, an auxiliary device, on a 500-kW horizontal-axis tidal turbine to increase solidity [14]. Furthermore, EB designed a stingray-shaped tidal turbine, which deviates from conventional turbine blade structures, and tested it in real sea conditions. Another study [15] investigated the modularization of multiple single turbines on one platform to mitigate mutual interference between turbines, and Nautricity designed and demonstrated a tidal turbine with two rotor blades modularized on a single shaft [16].
The counter-rotating tidal turbine designed in this study features front and rear blades rotating in opposite directions within the same tidal flow direction. The wake generated by the front blades, rotating opposite to the blade rotation direction, accelerates the flow speed, contributing to the performance improvement of the rear blades. The efficiency of the turbine blades is a critical factor in the overall efficiency of the power generation system, and even a small performance improvement in the counter-rotating tidal turbine can significantly impact the annual power production of a large-scale power plant [17].
Therefore, this study developed an optimal design by analyzing performance according to the axial distance between the blades of the counter-rotating turbine. Initially, a single turbine blade for tidal power generation was designed using the Blade Element Momentum (BEM) technique, and the reproducibility of the blade design was demonstrated through experiments. This designed single turbine was then used as the basic model for the counter-rotating turbine, and a counter-rotating tidal turbine was designed based on the spacing between the front and rear blades to derive maximum output. Moreover, to analyze the flow characteristics of the counter-rotating tidal turbine according to axial distance, the velocity streamlines and velocity distribution of the flow field were examined. The relationship between flow separation due to flow interference and output performance was considered through the pressure coefficients on the blade surface.
2. Design of Turbine Blade
Since the velocity and tidal range of the tidal power generation area vary depending on the terrain and water depth, each component of the tidal turbine is subjected to various loads. Notably, the rotor blades, which constitute the largest proportion of the tidal turbine components, determine the overall dynamic characteristics of the turbine based on their design shape. The rotor blades of a horizontal-axis tidal turbine rotate in one direction and exhibit characteristics where output and load are biased due to turbulence and waves [18]. Conversely, the counter-rotating turbine features two rotor blades rotating in opposite directions, distributing the load more evenly and, thus, is expected to enhance stable operation and power generation. The rotor blades of the 10 kW-class counter-rotating tidal turbine applied in this study were designed based on a single turbine.
Principle of Design Theory
The Multi Actuator Disc Theory (MADT) proposed by Newman assumes the disc velocity as , reflecting the axial inflow factor ) and the axial outflow factor of the outer disc in the annular wake velocity to calculate the efficiency of the disc based on pressure changes in the flow [19].
The efficiency of the actual disc can be calculated as shown in Equation (1), and represents the formula for calculating the theoretical maximum efficiency for n actual disks, as shown in Equation (2). These equations verify the theoretical maximum efficiency of 59.3%—the Betz limit for one blade—and 64% efficiency for two blades [20]. Moreover, experimental validation of performance efficiency improvements with varying numbers of blades has been verified.
The blades designed in this study utilized the BEM theory. This theory integrates momentum and blade element theories to model the blade’s output and load during the design process effectively. It involves calculating the axial and rotational interference coefficients for a given airfoil and integrating the optimal angle of attack and pitch angle that maximize the lift-to-drag ratio into the blade design [21]. Figure 1 illustrates the design method of the counter-rotating tidal turbine blade, considering flow velocity and force. Here, is the inflow angle, denotes the angle between the chord line and the flow direction at the blade’s leading edge, and is the pitch angle, the angle formed between the blade’s rotation plane and the chord line.
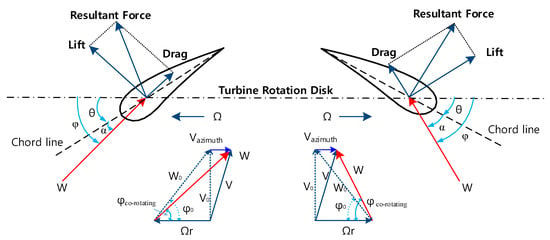
Figure 1.
Flow velocities and forces at a blade element for a counter-rotating tidal turbine.
The hydrodynamic design of the rotor blades involves determining the design variables that can achieve the maximum power coefficient at a specific TSR [22]. Therefore, determining the design variables and TSR requires considering the changes in maximum power coefficient for different rotational speeds and flow velocities of the blades. Importantly, the rear blade of the counter-rotating turbine is significantly affected by the accelerated flow of the wake, making the application of the BEM theory essential to derive maximum output. The blades in this study were designed to obtain the maximum power coefficient by calculating and incorporating the optimal relative flow angles and velocity ratios for each element, and the velocity ratios and relative velocity angles for each blade element are as follows. Equation (3) shows the relationship between local TSR () and relative velocity angle (), while Equation (4) indicates the optimum angle of relative velocity angle () for each local TSR () through the relationship between the chord line and the resultant force by flow velocity (W), as shown in Figure 1. The tip-loss correction factor (), local chord length ( and twist angle () for each element of the blade with a radius of are specified in Equations (5)–(7). Notably, in an ideal flow field where rotor blade wake occurs, as described in Equation (5), the lift-to-drag ratio and tip-loss factor are considered independent, as drag values are omitted regardless of the wake rotation [23].
The hydrofoil of the 10-kW-class counter-rotating tidal turbine based on a single tidal turbine was designed according to the National Renewable Energy Laboratory (NREL) S823. The hydrofoil of the turbine blade was selected according to the rated power, and NREL recommends S823 as a small turbine blade for 2–20-kW-class systems [24]. In particular, the S823 hydrofoil is suitable for tidal current turbines due to its relatively thick cord and root shape among the S-series foils of the NREL. The S-series foils have been verified through various experiments and field performance tests on a 1-MW large tidal current turbine conducted at the European Marine Energy Centre (EMEC) in the UK [25,26].
Both the front and rear blades were developed with the same design variables; however, their profiles and angles of attack () were separately calculated to accommodate different rotational directions. This design approach aimed to achieve a rotor diameter of 2.76 m and an RPM of 55.2, factoring in a design flow velocity of 2.0 m/s, seawater density of 1024 , and a design TSR of 3. Figure 2 illustrates the hydrofoil profiles and the 3D modeling of the blades, extending from the blade root to the tip, employing the BEM theory.
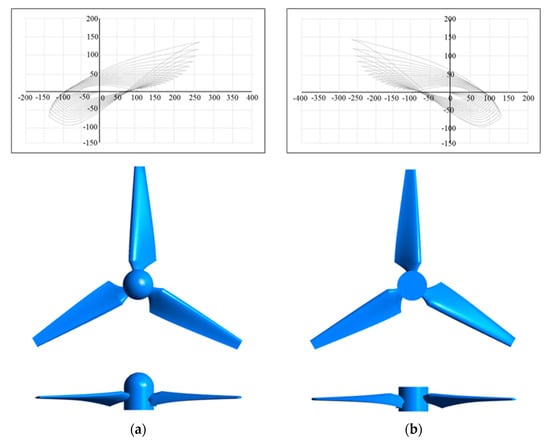
Figure 2.
Hydrofoil profiles and 3D modeling of the blade root to the tip for 10 kW scale CRTT. (a) Front blade; (b) rear blade.
3. Numerical and Experimental Methods
3.1. Numerical Methods
The numerical analysis conducted in this study aimed to evaluate the output performance and flow characteristics of a counter-rotating tidal turbine, focusing on the differential behavior of the front and rear blades relative to their axial distances. This analysis was grounded in the 3D examination of a single tidal turbine blade.
Turbulence effects were considered using the Reynolds-averaged Navier−Stokes (RANS) equations, which provide a foundational approach for understanding the impact of turbulence on the mean flow behavior. The continuity, momentum, and energy equations of fluid flow are given by Equations (8), (9), and (10), respectively.
Here, denotes the fluid density, and represent the velocity and pressure components, is the stress tensor, is the total enthalpy, is the thermal diffusivity, and signifies the stress tensor due to turbulent components.
The shear stress transport (SST) model is particularly adept at predicting flow separation and stall phenomena in complex shapes, such as hydrofoils, offering superior experimental reproducibility over other turbulence models. Specifically, the main flow field employed the model, while the SST model, which also used the model, was employed for the boundary layer regions along the walls. The SST model incorporating this blending function can be extended to integrate automatic wall treatment, thereby accurately representing the transport of turbulent shear stress [27]. Equations (11) and (12) represent the blending function.
Here, denotes the argument of the blending function, represents the inclination of the local blade chord, and denotes the distance from the wall.
The analysis conditions for the numerical turbine model are represented using the boundary conditions and values corresponding to the description, as listed in Table 1. The inlet of the static region was set with a uniform velocity inlet condition, while the outlet was assigned an averaged static pressure condition.

Table 1.
Analysis conditions for a numerical turbine.
The blade flow channel in this study was carefully calibrated to mitigate errors due to boundary layer interference, which can arise from improper control volume sizing. Consequently, it is crucial to appropriately set the analysis domain [28]. Therefore, the flow channel in this study was appropriately set between the inlet and outlet boundaries to ensure solution convergence. Considering the blockage effect for the flow channel of the counter-rotating tidal turbine, the domain field was set with a diameter of −3.5 D to 3.5 D and a length from −3.0 D to 15.0 D in the streamwise direction, based on the rotor hub. The rotor field, within which the rotor blades rotate, was designated with a diameter of 1.5D and a length variable by axial distance ranging from . Bahaj [29] conducted experiments with correction in a cavitation tunnel with a blockage ratio (BR) of 18%, and Schluntz [30] studied the optimization of blockage effects for output improvement using numerical methods. The domain applied in this analysis demonstrated a BR of 6.4%, as illustrated in Figure 3. This BR satisfies the minimum recommendation of 10% by Chen [31], obviating the need for further correction and ensuring stable conditions for performance evaluation.
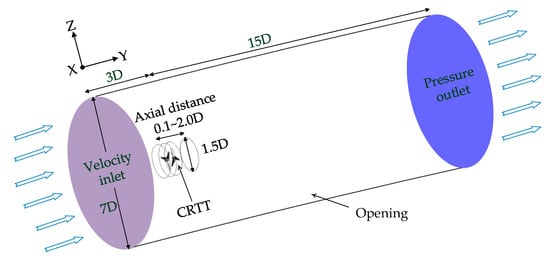
Figure 3.
Computational turbine domain for 10 kW-class CRTT.
The computational grid for the rotating and static regions of the single tidal turbine blade was configured using a bipartitional grid system, as depicted in Figure 4. The blades in the rotating region were meshed with tetrahedral elements, while the rotating region itself employed a multi-zone method combining hexahedral and tetrahedral elements, with the boundary between the two regions managed using prismatic elements. Because the performance of the turbine is assessed based on the torque acting as a vertical component in the direction of rotation, the distance scale along the y-plus from the first grid point to the blade wall boundary is critical [32]. Consequently, the grid was designed to achieve a y-plus value lower than the maximum of 1.3 by employing the first layer thickness option detailed in Table 2. Moreover, the various flow field grids, differentiated by axial distance, varied solely in the size of the rotating region, maintaining identical boundary conditions and grid systems across all configurations.
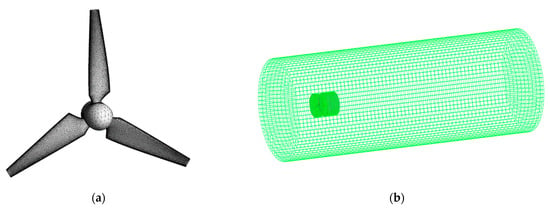
Figure 4.
Three-dimensional grids for CFD analysis. (a) Rotor blade; (b) domain field.

Table 2.
Grid configuration for a single turbine model.
3.2. Experimental Methods
Numerical approaches offer significant cost advantages over experimental methods, but require experimental validation due to their limitations in accurately reproducing actual flow fields and turbulence models. Consequently, the reproducibility of blade design and performance evaluation using the BEM method was demonstrated through performance experiments on a single tidal turbine. Bahaj [29] and colleagues conducted experiments on a horizontal-axis tidal turbine with three blades in a cavitation tunnel and towing tank, presenting methods to evaluate the reproducibility of turbine performance through torque and thrust coefficients within a TSR range.
Figure 5 illustrates the experimental setup for the performance testing of a scale model of a single 10 kW turbine using the S823 hydrofoil. The prototype turbine was downscaled to a 10-W class, featuring a rotor diameter of 0.25 m based on the BEM method. It was designed with a flow velocity of 0.8 m/s and 200 RPM. Therefore, the single turbine and the prototype turbine model utilize the same design theory and hydrofoil, ensuring identical hydrodynamic characteristics.
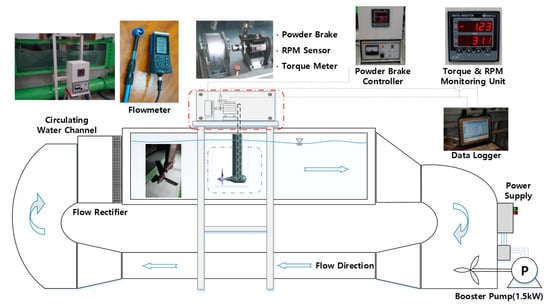
Figure 5.
Small-scale experimental equipment and the measuring apparatus in the circulating water channel at the Ocean Fluid Machinery Lab (Mokpo national maritime university).
The testing was conducted in a circulating water channel (CWC) that closely simulates tidal turbine operating conditions by generating a continuous flow. The dimensions of the test field in the CWC were L2.0 m × W0.80 m × H0.95 m. Flow was recreated using a booster pump (1.5 kW) and a flow rectifier. Turbine performance was measured using a torque meter with a capacity of 20 kg∙cm and an RPM sensor capable of measuring up to 3000 RPM, installed on the torque meter shaft. Additionally, an air-cooled powder brake was utilized to control the turbine’s rotational speed for measuring torque values at different TSRs. Flow velocity was gauged using a flowmeter with a maximum range of 15.0 m/s and an accuracy of ±2.0%, with the measured data being recorded in a data logger.
4. Results and Discussion
4.1. Evaluation of Power Performance
Since the performance evaluation of the tidal turbine was conducted in a CWC, there are limitations in the velocity conditions for each TSR, and the existence of cut-in start conditions reduces the reliability of the performance experiments [33]. Therefore, to ensure the reliability of the performance experiments in this study, the flow velocity in the CWC was fixed, and the torque values at different rotational speeds of the blades were measured using a powder brake. Equation (13) defines λ as the dimensionless tip speed ratio, where N is the number of turbine blades, R is the rotational speed of the blades, and is the inflow velocity. , as defined in Equation (14), was used as the performance indicator of the counter-rotating turbine, and the power coefficient was calculated as the product of the torque () values of the front and rear blades and radial velocity () and was compared to the kinetic energy of the blade’s projected area.
Here, in the kinetic energy of the blade represents the density of water, A is the turbine area, and is the freestream velocity of the fluid.
Due to the complex geometry of the turbine rotor blades, the velocity boundary layer on the surface varies depending on the wall distance. In particular, the power coefficient is calculated using the blade’s torque and radial velocity. Therefore, the blade power coefficient must be evaluated through a mesh dependency test [32]. The power output and power coefficient according to the grid model of a single turbine are shown in Table 3. As demonstrated in Figure 6a, mesh dependency was ensured using various turbine models.

Table 3.
Mesh independence test of the single turbine.
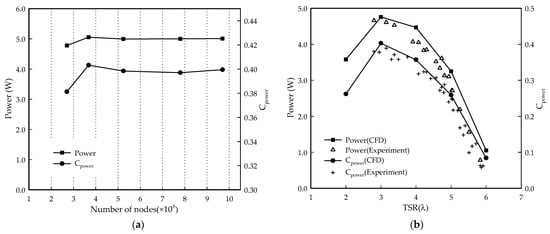
Figure 6.
CFD and experimental results for a single tidal turbine. (a) Mesh independence test; (b) power and power coefficient variation against the TSR.
Figure 6 presents the performance indicators derived from the numerical and experimental models of a 10-kW single turbine. The power and power coefficient, which represent the performance of the turbine, were highest around the design TSR of 3 and lowest at a TSR of 6. In the numerical model, the maximum power coefficient reached 40.3% at a TSR of 3. The performance indicators of the numerical analysis model demonstrated a consistently high distribution [7,10,17]. Additionally, there was approximately a 1% difference in the performance indicators compared to the experimental model for the design TSR3 [20].
The results of the experimental model differed from those of the numerical model due to limitations in flow velocity in the CWC and variations in rotational speeds at different flow velocities between the design and operating conditions of the turbine. Loss of output power also occurred due to the power transmission device or torque meter conversion device in the experimental apparatus. Nonetheless, as the results from both the numerical and experimental models decreased beyond a TSR of 3 and exhibited similar trends, the reliability of the blade design and performance evaluation is considered to be confirmed. Additionally, although the experimental model was designed with a BR of 6.4% to establish stable operating conditions, torque values were not measured below a TSR of 2.0 due to significant resistance from the walls of the CWC. Therefore, it is recommended that a lower BR value is used in future experimental models of the counter-rotating tidal turbine.
The performance analysis of the counter-rotating tidal turbine according to y/D was conducted using a numerical model, and the results are shown in Figure 7. At y/D = 0.3, the counter-rotating turbine exhibited a maximum power coefficient of 47% at a TSR of 3, while the model with the largest distance between turbines, y/D = 2.0, showed a lower power coefficient than the y/D = 0.3 model. Although the power coefficient of the counter-rotating turbine showed an approximate 7% increase compared to a single turbine, it is considered that placing multiple counter-rotating turbines in a tidal power farm would increase the overall output of the farm, providing sufficient competitiveness.
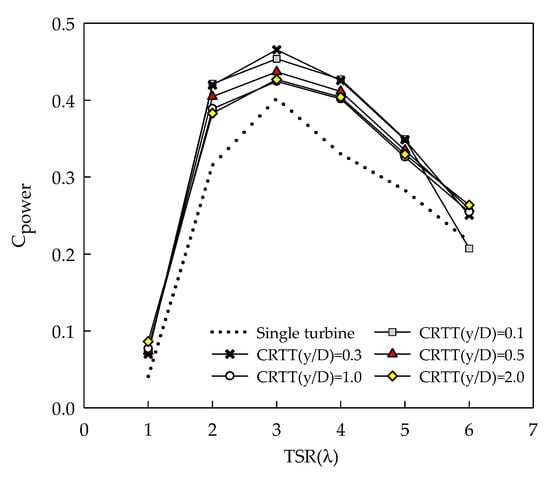
Figure 7.
Power coefficient for CRTT with varying axial distances (y/D).
Figure 8 shows the power coefficient of the counter-rotating tidal turbine for each TSR, separately illustrating the performance changes of the front and rear blades. Overall, the power coefficient of the front blade was higher than that of the rear blade, with the front blade at y/D = 2.0 indicating the highest power coefficient of 35% at TSR of 4. Additionally, in all areas, as the y/D value increases, the power coefficient of the front blade rises, while the power coefficient of the rear blade shows an inverse relationship.
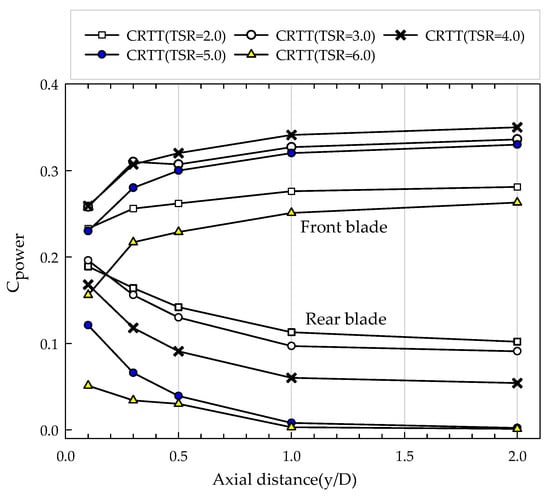
Figure 8.
Comparison of power coefficient variation for the front and rear rotor based on axial distance.
This phenomenon suggests that the rotation of the front blade reduces the flow velocity due to the limited energy within the confined space [34]. The rear blades at y/D = 1.0–2.0 show almost 0% power coefficient under TSRs of 5 and 6, indicating turbine operation loss. Particularly, a TSR of 5 at y/D = 2.0 shows a 32.6% difference in power coefficient between the front and rear blades, indicating the greatest velocity loss between the blades.
4.2. Velocity Streamline and Flow Separation
To analyze changes in the blade flow field, the velocity distribution of local cross-sections was depicted using streamlines. TSRs of 3 and 6, as shown in Figure 9, exhibit similar velocity streamlines near the blade chord line and leading edge. Generally, the boundary layer of the flow changes with the velocity distribution along the curvature of the blade’s suction surface; however, the boundary layers at TSRs of 3 and 6 remain constant. Specifically, the cross-section of the blade at a TSR of 3 demonstrates a stable attached flow extending from the leading edge to the trailing edge.
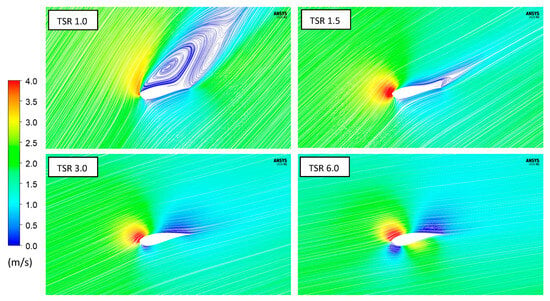
Figure 9.
Variation in velocity-v streamlines of cross-sectional by different TSR for single tidal turbine (x/C = 0.8).
Conversely, the velocity streamlines at a TSR of 1.5 reveal a significant alteration in flow owing to the increased angle of incoming flow to the blade. The elevated velocity at the leading edge heightens the pressure in the flow direction at the trailing edge, creating an adverse pressure gradient. This gradient results in flow separation accompanied by a separation point. Flow separation ensues when the velocity boundary layer of the flow changes, causing the flow to detach from the blade surface at the point where the velocity gradient of the suction surface is = 0. Particularly, the flow field at a TSR of 1.0, as shown in Figure 10, demonstrates developed vortices transitioning to turbulence on the blade’s suction surface. Additionally, the separation point, located at the midpoint of the blade’s suction surface, moves towards the leading edge due to the pressure difference at the trailing edge. This movement concurrently develops flow separation and stall. These phenomena indicate that the sharp performance decline observed at a TSR of 1.0, as shown in Figure 7, is likely due to flow separation occurring on the blade’s suction surface.
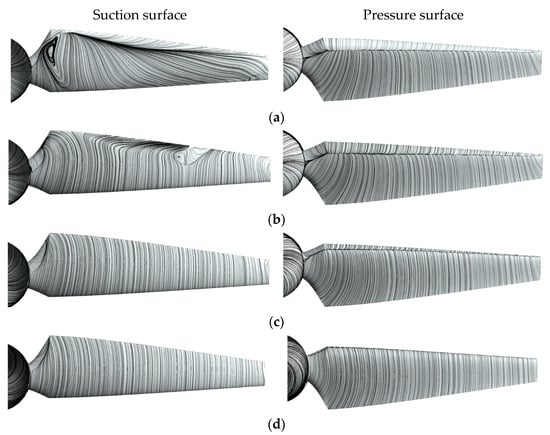
Figure 10.
Flow pattern visualized on blade surface using the velocity streamline for a single turbine (a) TSR of 1.0; (b) TSR of 1.5; (c) TSR of 3.0; (d) TSR of 6.0.
4.3. Flow Velocity Distribution for Counter-Rotating Tidal Turbines
To analyze the correlation between velocity changes and the turbine performance of the counter-rotating turbine for tidal power generation based on axial distance, Figure 11 shows the velocity distribution in the Y-Z plane. The front and rear blades were offset by 60°. In the model with the shortest axial distance, y/D = 0.1, the wake of the front blade displays a high velocity of 1.6 m/s. However, the close proximity leads to the rear blade disrupting the flow, causing the 1.6 m/s wake to spread to the front blade and result in flow interference. This is indicative of a correlation between the diminished power coefficient of the front blade and the flow interference. Moreover, the limited axial distance prevents the rear blade from effectively absorbing energy, thereby diminishing the overall output of the counter-rotating turbine. Consequently, the accelerated wake produced by the front blade does not enhance the performance of the rear blade, but rather contributes to its performance degradation.
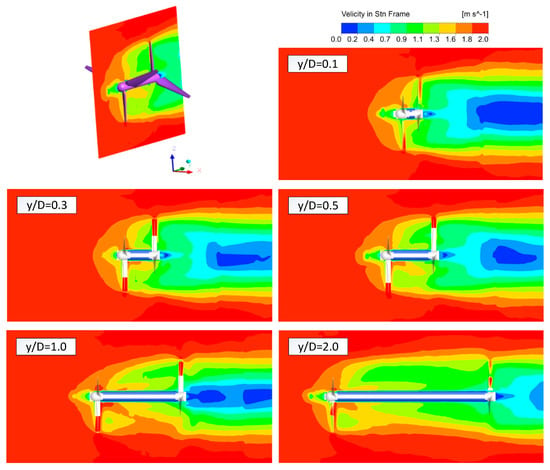
Figure 11.
Velocity distribution contour and flow interactions with varying axial distance (y/D = 0.1−2.0) in the y-direction downstream.
The y/D = 0.3 and y/D = 0.5 models demonstrate an ideal velocity distribution for a counter-rotating turbine. Both models, benefiting from a sufficient axial distance, exhibit reduced resistance flow at the hub top and eliminate rotational hindrance for the front blade. Additionally, the counter-rotating vortex, accelerated by the rotation of the front blade, fully develops in front of the rear blade, substantially increasing the efficiency of the front blade and the overall efficiency of the counter-rotating turbine. Nevertheless, the y/D = 0.5 model records a lower power coefficient than the y/D = 0.3 model because the velocity of the wake accelerated by the front blade decreases to 1.1 m/s.
In the y/D = 1.0 model, the accelerated flow dissipates before the wake from the front blade reaches the rear blade due to the lengthy axial distance, thereby mixing with the surrounding flow boundary layer. This development of the mixing wake lessens resistance to the flow and rotation of the front blade, which consequently alters the power coefficient. While the power coefficient of the front blade improves, that of the rear blade significantly decreases due to the relatively low velocity, thus increasing the difference in power coefficients between the blades. Consequently, the y/D = 2.0 model displays the highest power coefficient for the front blade, as rotational hindrance factors are absent, and the mixing wake fully develops within the velocity boundary layer of the domain, signifying a recovery stage of the velocity.
To analyze the velocity changes due to wake variations more precisely, Figure 12 illustrates the velocity distribution of the annular cross-section in the y/Y aspect. In the y/D = 0.3 model, the velocity generally remains high at 1.6 m/s throughout the entire domain. Additionally, the wake from the front blade reaches the rear blade near y/Y = 1.0 without mixing with the surrounding flow, maintaining distinct velocity boundary layers. Conversely, in the y/D = 0.5 model, the velocity boundary layers of the wake begin to mix at y/Y = 1.0, decreasing to below 1.0 m/s. In the y/D = 2.0 model, the flow mixes with the boundary layer of the domain, fully developing the mixing wake and reducing to 1.1 m/s at y/Y = 0.75, which results in significant velocity loss. This velocity loss due to the mixing wake can be confirmed through the velocity distribution and power coefficient of the flow field, as it sharply reduces the power coefficient of the rear blade and the counter-rotating turbine.
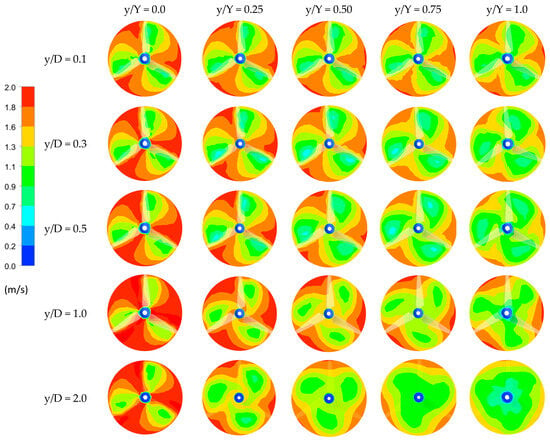
Figure 12.
Sectional velocity distributions versus different turbine axial distances (y/D = 0.1–2.0) in the y-direction downstream.
4.4. Pressure Coefficient
The pressure coefficient () is a dimensionless parameter calculated by dividing the difference between the surface local static pressure () on the blade and the freestream static pressure () by the dynamic pressure. It is primarily used to indicate the pressure distribution on the blade surface. In this study, the distribution of the pressure coefficient () on the suction and pressure surfaces of the blade was used to predict changes in the flow and stagnation point, and to analyze the correlation with turbine performance.
Generally, the pressure on the blade surface is distributed lower than the standard hydrostatic pressure at the leading edge and recovers to the standard hydrostatic pressure towards the trailing edge on the upper surface of the blade. The kinetic energy at the leading edge, where the velocity change rate is close to ‘0’, changes to static pressure at the stagnation point, showing the maximum pressure coefficient. Therefore, after the pressure coefficient at the leading edge of the blade reaches its maximum, the velocity decreases, resulting in a negative pressure, as shown in Figure 13. Additionally, since the stagnation point moves according to the velocity distribution, it has the characteristic of moving from the leading edge on the pressure surface to the trailing edge on the suction surface, where the relative velocity is higher [35]. Here, indicates the local static pressure on the blade surface; indicates the freestream static pressure; and indicates the dynamic pressure.
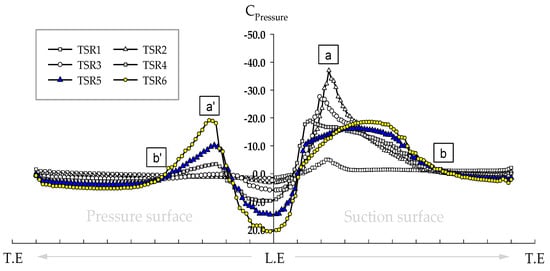
Figure 13.
Sectional pressure coefficient distribution on the 10-kW scale single tidal turbine blade at chord fraction (x/D = 0.8).
Figure 13 shows the pressure coefficient on the surface of the 10-kW single turbine blade for each TSR. The pressure coefficient is plotted on the y-axis, with the suction and pressure surfaces distinguished around the leading edge at x/D = 0.8. The stagnation point in the blade flow field changes the pressure coefficient value according to the boundary conditions and the blade’s cross-sectional shape. Figure 9 shows that, as the TSR increases, the velocity near the leading edge on the pressure surface decreases and moves to the suction surface.
The flow moves from the leading edge to the trailing edge, diffusing in sections a and a’ relative to the stagnation point and significantly reducing the pressure coefficient. Accordingly, the transition from laminar to turbulent flow due to diffusion can be predicted by the pressure coefficient values. In the a-b section at TSR of 2, the pressure coefficient reaches −37.0 due to the flow transition, with a maximum difference of 40.2 compared to the maximum pressure coefficient at the stagnation point. This transition causes adverse pressure distribution, leading to wake formation and flow separation at the leading edge, and a sharp decrease in the power coefficient to 26%, as illustrated in Figure 6. At point b on the suction surface, the pressure coefficient recovers to the standard hydrostatic level, forming an attached flow region. Conversely, the a’–b’ section at a TSR of 6 on the pressure surface registers a pressure coefficient of −19.1 due to the high rotational speed of the blade, recovering to the standard hydrostatic pressure at point b’. This section of the pressure surface develops a shorter transition region and exhibits less fluctuation in the pressure coefficient compared to the suction surface. Furthermore, at a TSR of 1, the flow shows fully developed flow separation due to the low rotational speed of the turbine, with almost no change in the pressure coefficient as the velocity gradient () on the blade surface remains ‘0’. This phenomenon indicates a loss of power generation function for the turbine, with the development of flow separation and transition regions due to the leading edge wake significantly impacting the sharp decrease in the power coefficient.
Generally, the pressure coefficient on the blade surface is determined by the blade’s shape, inflow velocity, and angle of attack. In this study, the boundary condition for the flow velocity in the counter-rotating turbine’s flow field was uniformly set, which meant that the rotational speed of the blade had a more significant impact on the pressure coefficient than variations in the angle of attack. However, the wake generated by the front blade affects the flow velocity and angle of attack along the length of the flow field, leading to diverse distributions of the pressure coefficient on the rear blade. Therefore, to analyze the effects of these varied distributions of the pressure coefficient at different axial distances on the performance of the counter-rotating tidal turbine, the pressure coefficient distributions of the front and rear blades are presented in Figure 14.
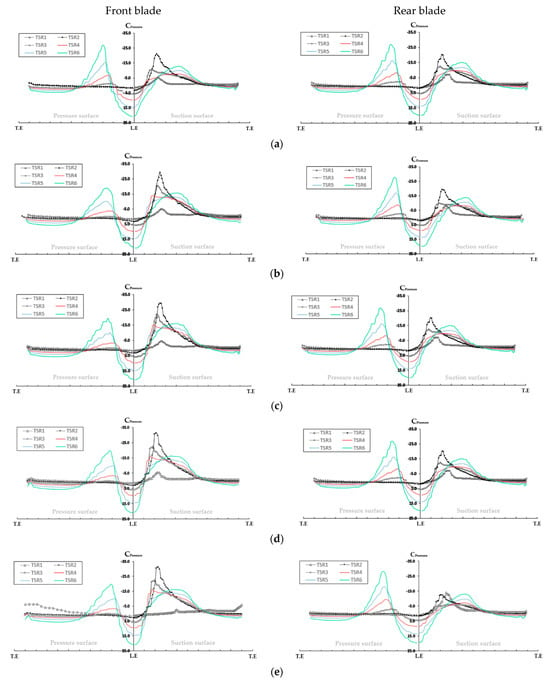
Figure 14.
Variation in pressure coefficient distributions on CRTT’s chord fraction (x/C = 0.8) by an axial distance (a) y/D = 0.1; (b) y/D = 0.3; (c) y/D = 0.5; (d) y/D = 1.0; and (e) y/D = 2.0.
Figure 14 reveals that both the front blade of the counter-rotating turbine and the single blade show a pronounced suction surface tendency in the pressure coefficient, while the rear blade demonstrates a strong pressure surface tendency due to the wake from the front blade. The TSRs corresponding to the minimum pressure coefficients on the pressure and suction surfaces of the front and rear blades mostly align, irrespective of axial distance. However, the rear blades in the y/D = 1.0 and 2.0 models exhibit this minimum pressure coefficient feature at TSR of 1 on the suction surface. Additionally, all front blades of the counter-rotating turbine displayed the minimum pressure coefficient on the suction surface, except for the front blade of the y/D = 0.1 model, which exhibited it on the pressure surface. This anomaly is attributed to the flow interference caused by the narrow spacing between the turbines, as illustrated in Figure 11. The rear blade acts as a barrier to the accelerated wake flow, resulting in flow interference with the front blade and consequently a lower pressure coefficient on the pressure surface compared to the suction surface. Particularly at a TSR of 6, the effects of rapid blade rotation and accelerated wake are evident. The front blade of the y/D = 0.3 model shows a minimum pressure coefficient on the suction surface due to reduced flow interference from the wake, unlike in the y/D = 0.1 model, where the accelerated wake reaches the pressure surface of the rear blade, yielding the maximum efficiency coefficient of the counter-rotating turbine.
Conversely, while diverse velocity distributions of the flow field due to the axial distance were anticipated to significantly alter the pressure coefficient of the rear blade, the pressure coefficients from y/D = 0.1 to 0.7 displayed almost no change. However, the flow fields at y/D = 1.0 and 2.0, observed at a TSR of 6, demonstrated mixing wake diffusion with the surrounding flow, resulting in a minimum pressure coefficient of −28.6 on the pressure surface. Conversely, the pressure coefficient on the suction surface reached its minimum at a TSR of 1, diverging from the conditions observed in other blades. Consequently, the rear blade, afflicted by fully developed vortices due to flow separation, exhibited a very low performance coefficient at TSR of 1, suggesting a complete loss of functional efficacy as a turbine.
Figure 15 illustrates the pressure coefficient distribution at various axial distances for a TSR of 3, where the counter-rotating turbine exhibits its highest performance efficiency. Changes in the pressure coefficient due to variations in axial distance significantly influence the lift−to−drag ratio of the blade and are closely associated with the turbine’s performance. Notably, as the axial distance increases, the pressure coefficient on the front blade tends to decrease. The graph demonstrates that the performance coefficient of the front blade is inversely proportional to the minimum pressure coefficient on the suction surface, improving as the axial distance increases. Conversely, the rear blade maintains the minimum pressure coefficient on the suction surface at y/D = 0.1 across all axial distances, where no mixing wake is developed, and this coefficient is directly proportional to the performance coefficient. Additionally, both the front and rear blades exhibit the lowest pressure coefficients in the y/D = 0.1−0.2 region, and the pressure coefficient remains relatively stable with increasing axial distances. Specifically, the y/D = 1.0 and 2.0 models show that the pressure gradient, , returns to standard hydrostatic pressure at y/D = 0.6−1.0 on the suction surface.
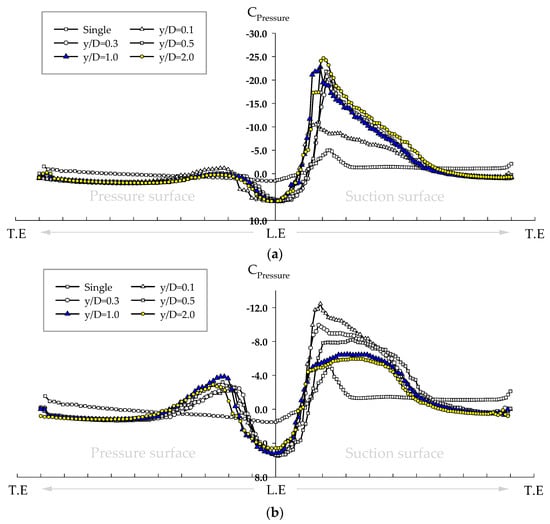
Figure 15.
Comparison of pressure coefficient distribution on CRTT’s chord fraction (x/D = 0.8) at a TSR of 3. (a) Front blade; (b) rear blade.
5. Conclusions
This study proposed a model to optimize the axial distance between the blades of a counter-rotating tidal turbine to enhance output performance and maximize the overall yield of tidal power farms. The design of the counter-rotating turbine, based on a single turbine blade, was validated by comparing numerical analyses with performance experiments using a scaled-down single turbine model. The interaction between flow changes and the performance of the front and rear blades was also examined by calculating the flow velocity distribution and the pressure coefficient in the numerical model. The main conclusions of this study are as follows:
(1) The 10-kW single turbine blade, designed for the counter-rotating tidal turbine, utilized the S823 airfoil and BEM theory. This rear blade, modeled after the single turbine blade, rotates in the opposite direction to the front blade, and all basic design variables are set identically.
(2) Performance experiments were conducted to validate the numerical analysis models and to evaluate the performance of the single turbine blade and the counter-rotating turbine. The turbine blade, scaled down from a 10-kW single turbine, was tested in a CWC. Performance was assessed by measuring torque values at each TSR. The performance indicators of both the numerical and experimental models demonstrated similar trends, with the numerical model achieving a maximum power coefficient of 40.3% and the experimental model achieving 38.4% at the designed TSR of 3, confirming the reliability of the blade design.
(3) The performance evaluation of the counter-rotating tidal turbine, based on the y/D ratio, was performed using the numerical model. This evaluation showed a maximum power coefficient of 47% at a TSR of 3 for the y/D = 0.3 model, indicating an approximate 7% performance improvement over the single turbine configuration. This suggests that significant output enhancement can be expected when applied to a large-scale tidal power farm. Furthermore, the front blade exhibited a higher velocity distribution, and the power coefficients of the front and rear blades displayed an inverse relationship as y/D increased.
(4) The velocity streamlines and flow changes under various operating conditions were analyzed on both the local cross-section and surface of the blades. At a TSR of 1.5, with high rotational speeds, significant changes in velocity streamlines were observed, resulting in adverse pressure, separation points, and flow separations. Furthermore, at a TSR of 1.0, a sudden transition in the flow created large vortices, leading to flow separation and stalling. This was due to the movement of the separation point on the blade’s suction surface, causing a notable decline in performance.
(5) The relationship between flow changes and turbine performance was analyzed by calculating the velocity distribution of the flow cross-section according to the y/D ratio. For the y/D = 0.1 model, the accelerated counter-rotating wake interfered with the rotation of the front blade, reducing the power coefficient. In contrast, the y/D = 0.3 model exhibited the maximum power coefficient and the most ideal velocity distribution. This improved performance was attributed to the sufficiently secured axial distance that reduced the resistance flow at the top of the hub, allowing the accelerated wake to directly impact the front of the rear blade. However, in the y/D = 1.0 and 2.0 models, the energy of the accelerated wake mixed with the surrounding flow boundary layer before being absorbed by the rear blade, resulting in a mixing wake with relatively low velocity and a significant decrease in the power coefficient of the counter-rotating turbine.
(6) Changes in flow and the stagnation point were predicted by analyzing the distribution of the pressure coefficient on the blade surface, which was used to evaluate the performance of the counter-rotating tidal turbine. The highest pressure coefficient value was found at the stagnation point, indicating a recovery to standard hydrostatic pressure towards the trailing edge. The pressure coefficient varied with the rotational speed of the blade and the angle of incoming flow under different operating conditions, reflecting changes due to flow diffusion and separation. Additionally, changes in the pressure coefficient relative to axial distance significantly affected the lift-to-drag ratio of the blade, closely relating to the performance of the counter-rotating turbine.
This study conducted an optimization design for counter-rotating tidal turbines to achieve maximum output from a tidal farm by analyzing the flow characteristics and evaluating the power performance according to the axial distance. However, performance experiments were conducted for single tidal turbines only, which form the basis of counter-rotating tidal turbines, and experiments to validate the performance of counter-rotating tidal turbines were not conducted. In the future, power performance and flow visualization experiments for counter-rotating tidal turbines will be conducted. The results of this study may provide a basis for further optimization research on counter-rotating tidal turbines.
Author Contributions
Conceptualization, C.Y. and H.J.; methodology, C.Y. and H.J.; software, H.J.; validation, C.Y.; formal analysis, H.J.; investigation, C.Y.; resources, C.Y. and H.J.; data curation, C.Y. and H.J.; writing—original draft preparation, H.J.; writing—review and editing, C.Y. and H.J.; visualization, H.J.; supervision, C.Y.; project administration, C.Y. and H.J.; funding acquisition, C.Y. All authors have read and agreed to the published version of the manuscript.
Funding
This research was funded by the Ministry of Oceans and Fisheries (project titled “Establishment of sea test-bed for tidal current energy converters”, project No. 20170333).
Data Availability Statement
Data are contained within the article.
Conflicts of Interest
The authors declare no conflicts of interest.
Nomenclature
| Power coefficient | Maximum efficiency for n actual disks | ||
| Inflow angle | Pitch angle | ||
| Twist angle | BEM | Blade element momentum | |
| TSR | Tip speed ratio | C | Chord length |
| W | Flow velocity | Tip-loss correction factor | |
| r | Radius | D | Diameter |
| Fluid density | Stress tensor | ||
| H | Total enthalpy | Temperature | |
| F | Wall function | GGI | General grid interface |
| SST | Shear stress transport | Radial velocity | |
| T | Torque | A | Turbine area |
| y-plus | CRTT | Counter-rotating tidal turbine | |
| Pressure coefficient | CWC | Circulation water channel | |
| Static pressure | Dynamic pressure |
References
- World Energy Outlook. Overview and Key Findings. Available online: https://www.iea.org/reports/world-energy-outlook-2023/overview-and-key-findings (accessed on 9 April 2024).
- Halawa, E. Sustainable energy: Concept and definition in the context of the energy transition—A critical review. Sustainability 2024, 16, 1523. [Google Scholar] [CrossRef]
- Korea Energy Newspaper. Available online: https://koenergy.co.kr/news/articleView.html?idxno=109209 (accessed on 9 April 2024).
- Korea Environment Corporation. Estimation of National GHG Emission in Waste Sector. Available online: https://www.keco.or.kr/en/lay1/S295T321C331/contents.do (accessed on 9 April 2024).
- 2050 Carbon Neutrality of the Republic of Korea. Available online: https://www.2050cnc.go.kr/base/board/read?boardManagementNo=3&boardNo=347&searchCategory=&page=3&searchType=title&searchWord=%EA%B8%B0%ED%9B%84&menuLevel=3&menuNo=9 (accessed on 9 April 2024).
- Melikoglu, M. Current status and future of ocean energy sources: A global review. Ocean Eng. 2018, 148, 563–573. [Google Scholar] [CrossRef]
- Jo, C.H.; Yim, J.Y.; Lee, K.H.; Rho, Y.H. Performance of horizontal axis tidal current turbine by blade configuration. Renew. Energy 2012, 42, 195–206. [Google Scholar] [CrossRef]
- Jahromi, M.; Maswood, A.; Tseng, K. Long Term Prediction of Tidal Currents. IEEE Syst. J. 2011, 5, 146–155. [Google Scholar] [CrossRef]
- Ko, D.; Chung, J.; Lee, K.; Park, J.; Yi, J. Current policy and technology for tidal current energy in Korea. Energies 2019, 12, 1807. [Google Scholar] [CrossRef]
- Li, Y.; Calışal, S.M. Modeling of twin-turbine systems with vertical axis tidal current turbines: Part I—Power output. Ocean Eng. 2010, 37, 627–637. [Google Scholar] [CrossRef]
- Tatum, S.C.; Frost, C.H.; Allmark, M.; O’Doherty, D.M.; Mason-Jones, A.; Prickett, P.W.; Grosvenor, R.I.; Byrne, C.B.; O’Doherty, T. Wave–current interaction effects on tidal stream turbine performance and loading characteristics. Int. J. Mar. Energy 2016, 14, 161–179. [Google Scholar] [CrossRef]
- Jayaram, V.; Bavanish, B. Design and analysis of gorlov helical hydro turbine on index of revolution. Int. J. Hydrog. Energy 2022, 47, 32804–32821. [Google Scholar] [CrossRef]
- Sitorus, P.E.; Park, J.; Ko, J.H. Hydrodynamic characteristics of cambered NACA0 012 for flexible wing application of a flapping-type tidal stream energy harvesting System. Int. J. Nav. Archit. Ocean Eng. 2019, 14, 100428. [Google Scholar]
- Ocean Tidal and Wave Energy. Available online: https://www.epri.com/research/products/1010489 (accessed on 9 April 2024).
- Jones, I.; Wells, A.K.; Starzmann, R.; Bicshof, S. CFD simulations of the Triton tidal energy platform to analyse the surrounding flow pattern. In Proceedings of the 11th European Wave and Tidal Energy Conference, Nantes, France, 6–11 September 2015. [Google Scholar]
- Clarke, J.A.; Cornor, G.; Grant, A.D.; Johnstone, C.M.; Mackenzie, D. Development of a contra-rotating tidal current turbine and analysis of performance. In Proceedings of the 7th European Wave and Tidal Energy Conference, Porto, Portugal, 11–13 September 2007. [Google Scholar]
- Huang, B.; Shi, J.; Wei, X. Model Testing of a Series of Counter-Rotating Type Horizontal-Axis Tidal Turbines With 500mm Diameter. J. Eng. Gas Turbines Power 2017, 139, 102602. [Google Scholar] [CrossRef]
- Lee, S.; Kim, H.; Son, E.; Lee, S. Effects of design parameters on aerodynamic performance of a counter-rotating wind turbine. Renew. Energy 2012, 42, 140–144. [Google Scholar] [CrossRef]
- Newman, B.G. Multiple actuator-disc theory for wind turbines. J. Wind. Eng. Ind. Aerodyn. 1986, 24, 215–225. [Google Scholar] [CrossRef]
- Lee, N.J.; Kim, I.C.; Kim, C.G.; Hyun, B.S.; Lee, Y.H. Performance study on a counter-rotating tidal current turbine by CFD and model experimentation. Renew. Energy 2015, 79, 122–126. [Google Scholar] [CrossRef]
- Kim, B.S. Multi-MW class wind turbine blade design part I: Aero-structure design and integrated load analysis. Trans. Korean Soc. Mech. Eng. 2014, 38, 289–309. [Google Scholar] [CrossRef]
- Kim, B.S.; Kim, M.E.; Lee, Y.H. Basic configuration design and performance prediction of an 1 MW wind turbine blade. KSFM J. Fluid Mach. 2008, 11, 15–21. [Google Scholar] [CrossRef]
- Hoang, A.D.; Yang, C.J. Design and performance evaluation of a 10kW scale counter-rotating wind turbine rotor. J. Korean Soc. Mar. Environ. Saf. 2014, 20, 104–112. [Google Scholar] [CrossRef]
- NREL Airfoil Families for HAWTs. National Renewable Energy Laboratory (NREL). Available online: https://research-hub.nrel.gov/en/publications/nrel-airfoil-families-for-hawts (accessed on 9 June 2024).
- World Energy Resources Marine Energy 2016. World Energy Council. Available online: https://www.worldenergy.org/assets/images/imported/2016/10/World-Energy-Resources-Full-report-2016.10.03.pdf (accessed on 9 June 2024).
- Alberto, B. State-of-the-art of MW-level capacity oceanic current turbines. J. Nonlinear Eng. 2020, 9, 361–369. [Google Scholar]
- Menter, F.R. Two-equation eddy-viscosity turbulence models for engineering applications. J. Am. Inst. Aeronaut. Astronaut. 1994, 32, 1598–1605. [Google Scholar] [CrossRef]
- Kolekar, N.; Vinod, A.; Banerjee, A. On blockage Effects for a tidal turbine in free surface proximity. Energies 2019, 12, 3325. [Google Scholar] [CrossRef]
- Bahaj, A.S.; Molland, A.F.; Chaplin, J.R.; Batten, W.M.J. Power and thrust measurements of marine current turbines under various hydrodynamic flow conditions in a cavitation tunnel and a towing tank. Renew. Energy 2007, 32, 407–426. [Google Scholar] [CrossRef]
- Schluntz, J.; Willden, R.H.J. The effect of blockage on tidal turbine rotor design and performance. Renew. Energy 2015, 81, 432–441. [Google Scholar] [CrossRef]
- Chen, T.Y.; Liou, L.R. Blockage corrections in wind tunnel tests of small horizontal-axis wind turbines. Exp. Therm. Fluid Sci. 2011, 35, 565–569. [Google Scholar] [CrossRef]
- Hartwanger, D.; Horvat, A. 3D modelling of a wind turbine using CFD. In Proceedings of the NAFEMS UK Conference 2008, Cheltenham, UK, 10–11 June 2008. [Google Scholar]
- Jo, C.H.; Kim, D.Y.; Hwang, S.J.; Goo, C.H. Shape Design of the Duct for Tidal Converters Using Both Numerical and Experimental Approaches (pre-2015). Energies 2016, 9, 185. [Google Scholar] [CrossRef]
- Yang, C.J. Optimal rotor blade design for tidal in-stream energy. J. Korean Soc. Mar. Environ. Saf. 2011, 17, 75–82. [Google Scholar] [CrossRef][Green Version]
- McCarty, M. The Measurement of the Pressure Distribution over the Wing of an Aircraft in Flight. Master’s Thesis, University of New South Wales, Sydney, Australia, 2008. [Google Scholar]
Disclaimer/Publisher’s Note: The statements, opinions and data contained in all publications are solely those of the individual author(s) and contributor(s) and not of MDPI and/or the editor(s). MDPI and/or the editor(s) disclaim responsibility for any injury to people or property resulting from any ideas, methods, instructions or products referred to in the content. |
© 2024 by the authors. Licensee MDPI, Basel, Switzerland. This article is an open access article distributed under the terms and conditions of the Creative Commons Attribution (CC BY) license (https://creativecommons.org/licenses/by/4.0/).