Article

Frequency-Dependent Grounding Impedance of a Pair of Hemispherical Electrodes: Inductive or Capacitive Behavior?

by
José Brandão Faria
1,*,
João Pereira Fernandes
2,
Vitor Maló Machado
1 and
Maria Eduarda Pedro
3
1
Instituto de Telecomunicações (IT), Instituto Superior Técnico, Universidade de Lisboa, 1049-001 Lisbon, Portugal
2
Instituto de Engenharia Mecânica (IDMEC), Instituto Superior Técnico, Universidade de Lisboa, 1049-001 Lisbon, Portugal
3
Instituto de Engenharia de Sistemas e Computadores (INESC-ID), Instituto Superior Técnico, Universidade de Lisboa, 1049-001 Lisbon, Portugal
*
Author to whom correspondence should be addressed.
Energies 2024, 17(13), 3206; https://doi.org/10.3390/en17133206
Submission received: 7 May 2024 / Revised: 20 June 2024 / Accepted: 26 June 2024 / Published: 29 June 2024
(This article belongs to the Special Issue Electromagnetic Field Computation for Electrical Engineering Devices)

Abstract

:
This article is the authors’ last contribution to a trilogy of research papers submitted to Energies’ Special Issue on Electromagnetic Field Computation, aimed at the theoretical analysis and numerical computation of the frequency-dependent complex impedance of hemispherical electrodes. In this work, we consider a pair of distant identical hemispherical electrodes buried in the ground, whose constitutive parameters (conductivity and permittivity) are assigned diverse values. Simulation experiments carried out using a full-wave finite element method, considering different combinations of the earth’s constitutive parameters, reveal that the grounding impedance of the electrode system can exhibit surprisingly varied frequency behavior. For frequencies close to zero, the impedance can start out inductive or capacitive, then go through a number of resonant transitions between inductive and capacitive states, finally tending towards purely resistive behavior. The results are interpreted using theoretical approximations valid for low- and high-frequency regimes.

1. Introduction

Metal electrodes are common parts in measuring systems for detecting voltages and in protection systems where electric currents are injected into material media. They have numerous applications in science, from geophysics to electrical engineering.
Here, we are especially concerned with the subarea of power and energy systems, within electrical engineering, where grounding electrodes play a key role in providing electric protection and safety to people, buildings, and infrastructures; the most notable example being the protection of tall structures, like wind turbines, overhead powers lines, and towers, against lightning discharges (with high-frequency spectral content) [1,2,3,4,5,6,7,8], where design mistakes may have costly consequences.
Another important aspect related to grounding electrodes is their use in dedicated measurement systems designed to assess the electromagnetic properties of the soil in which the electrodes are implanted. In fact, measurements of the grounding impedance between electrodes (dependent on the geometry of the electrodes) are usually carried out with the aim of extracting/predicting values of the conductivity and permittivity of the soil as a function of frequency, from which empirical frequency-dependent soil models can be developed [9,10,11,12,13]. If the conceived relationship between the electrode impedance and the soil parameters is not physically sound, then the parameters predictions from the measurements may be incorrect and the soil models based on them unreliable.
The most common shape for grounding electrodes is the vertical rod. Hemispherical electrodes are rare for earthing purposes; nonetheless, because of its very simple shape, interest in this kind of geometry has been increasing recently.
The analysis of the DC grounding resistance of hemispherical electrodes was extended to cone-shaped air/ground interfaces in [14,15]—a relevant issue for structures implanted in hilly areas.
The analysis of the AC grounding impedance of hemispherical electrodes was developed for the first time, with more or less success, in a series of papers in [16,17,18,19]—a relevant issue for high-frequency electrode modeling and for benchmark purposes.
This article, a continuation of [16,17], considers now a grounding system comprising two equal hemispherical electrodes buried in the ground, one for the injected current and another for the return current. For different combinations of the earth’s constitutive parameters, simulations carried out using a full-wave finite element method (FEM) reveal that the grounding impedance of the electrode system can exhibit surprisingly varied frequency behavior. The revealed features are surprising because the hemispherical electrode geometry has never been treated in-depth in the literature in the framework of time-varying regimes. Ordinary zeroth-order approaches simulate the electrodes’ system using basic RC circuits; magnetic induction effects created by soil currents have been neglected in the analysis, and in at least one case, i.e., [18], the induction effects were even claimed as nonexistent. The balance between capacitive and inductive effects changes along the frequency and depends on the size of the grounding system; the larger the distance between electrodes, the stronger the magnetic induction effects. In any case, for the limit situations of zero and infinite frequencies, the grounding impedance turns purely real.
The work is organized into five sections, the first being introductory. Section 2 offers background material and reviews key results from [16,17]; in addition, the accuracy of the quasi-stationary approximation employed in [17] is assessed by comparing it with a full-wave approximation that accounts for displacement current effects. The core of the work, Section 3, presents numerical results of the frequency-dependent resistance and reactance of the grounding system in the 0–10 MHz range; results are obtained using the full-wave FEM approach, considering simulation experiments where diverse combinations of the ground parameters (conductivity and permittivity) are tested. The numerical results are interpreted and discussed using theoretical approximations applicable to low frequencies and high frequencies. In Section 4, we analyze graphically the trajectories of the complex impedance in the complex plane when the frequency is continuously increased from zero to infinity. Dedicated to the discussion of results and conclusions, Section 5 closes this article.

2. Background and Review

This article is the last of a set of research papers by the authors aimed at the calculation of the frequency-dependent complex impedance of hemispherical electrodes. This section—indispensable background for the present work—is divided into two subsections. In the first, we briefly review and summarize the results already published in the first two papers of the trilogy, [16] (October 2023) and [17] (January 2024). In the second subsection, we assess the accuracy of the results published in [17] based on a quasi-stationary approximation, comparing them with a full-wave approximation that takes into account the effects of the displacement currents ( ε 0 ) .

2.1. Review of Recent Results

Figure 1 shows the electrode geometry utilized in [16], consisting of a solitary hemisphere of radius a, buried just below the air/ground interface, the ground being characterized by its constitutive parameters (assumed invariant), conductivity σ, permittivity ε, and permeability μ = μ 0 = 1.257   μ H / m . The remote electrode carrying the return current is positioned at infinite distance. The hemisphere and the remote electrode are assumed to be perfect electric conductors (PEC).
For DC regimes, inside the ground, the radial electric field E varies with 1/r2 and, consequently, the azimuthal magnetic field H varies with 1/r. Under these circumstances, the electrode resistance, capacitance, and inductance, Rdc, Cdc, and Ldc, respectively, are calculated through [16]
{ R d c C d c L d c } = lim r     { 1 2 π σ ( 1 a 1 r )   2 π ε ( 1 a 1 r ) 1 μ 0 ( r a ) 2 π ln 4 e } =   {   ( 2 π a σ ) 1 2 π a ε }
The result C d c = 2 π a ε corresponds to one half of the capacitance of a full sphere immersed in a homogeneous medium with permittivity ε. The full sphere capacitance, in turn, is a particularization of the most general case of the capacitance of an ellipsoid—see Appendix A. The DC resistance in (1) is related to the DC capacitance through R d c 1 = C d c σ / ε . Noteworthy in (1) is the infinite value of the DC inductance of the solitary electrode, which results from the infinite magnetic energy stored inside the infinite ground r [ a ,   ] .
While for DC regimes the electrode impedance is finite and purely real, for AC regimes the impedance turns infinite for any non-null frequency [16]. In fact, for ω  0, the E-field inside the ground, with radial and polar components, ceases to obey a simple 1/r2 law, the latter being replaced by a radial dependency of the type [16]
1 r j n ( κ ¯ r )
where jn represents nth order spherical Bessel functions and κ ¯ is the frequency-dependent complex wavenumber:
κ ¯ ( ω ) = ( j ω μ σ ¯ ) 1 / 2 ,   where   σ ¯ = σ + j ω ε = σ ( 1 + j ω τ C ) = σ ( 1 + j f f r )
where τ C denotes the ground relaxation time τ C = ε / σ and fr is the associated relaxation frequency f r = 1 / ( 2 π τ C ) .
The line integral of the E-field, with the dependency in (2), along the x-axis from r = a to r = , diverges to infinity, i.e., U ¯ = ,   Z ¯ = . This means that the solitary hemispherical electrode cannot support time-varying currents (and we believe that this holds true for solitary electrodes of any shape); the solitary electrode is indeed an abstraction, i.e., a non-physical concept [16].
Things are completely different when the remote electrode is located at a finite distance from the no-longer solitary electrode. The impedance Z ¯ ( ω ) of the electrode pair is definable and finite, but still dependent on the distance between the electrodes.
In our second work [17], making use of the finite element method, we carried out the numerical evaluation of the frequency-dependent impedance of the hemispherical electrode, taking into account the presence of a remote concentric electrode with large, but finite, radius rext.
To that end, a new variational formulation for the electromagnetic field was developed for 2D axisymmetric geometries with azimuthal magnetic fields (ι-form [17]) and installed into a commercial FEM tool (COMSOL, v6.0)—later validated using complete vector 3D H-form software.
FEM computations of the impedance, resistance, reactance, and inductance of the hemispherical grounding electrode (surrounded by a concentric remote electrode of radius rext) were performed considering an electrode of radius a = 1 m, a soil conductivity of σ = 10 mS/m, and a frequency sweep in the range 0–10 MHz (ordinary range for the analysis of very fast transients, as in lightning discharges). In our calculations, we considered the complex conductivity in (3) to be real σ ¯ = σ + j ω ε , i.e., we neglected displacement current effects, assuming the quasi-stationary approximation × H = σ E to be valid. In this case, the complex wavenumber in (3) can be rewritten as follows:
κ ¯ ( ω ) = ( j ω μ 0 σ ) 1 / 2 = 1 j δ ,     with   δ = 2 ω μ 0 σ
where δ denotes the field penetration depth in the ground (skin depth), a ubiquitous parameter in skin effect studies.
For soil with ε = ε 0 and σ = 10 mS/m, we see from (3) that the relaxation frequency of the ground f r is 180 MHz, well above the upper limit of 10 MHz, thus supporting the quasi-stationary hypothesis. Furthermore, from (4), we see that the smallest value of the skin depth is δ = 1.6 m at 10 MHz, (with a / δ = 0.63 < 1 ), meaning that with these data the skin effect phenomenon is not strong. In Section 2.2, we will closely examine the accuracy of the quasi-stationary approximation.
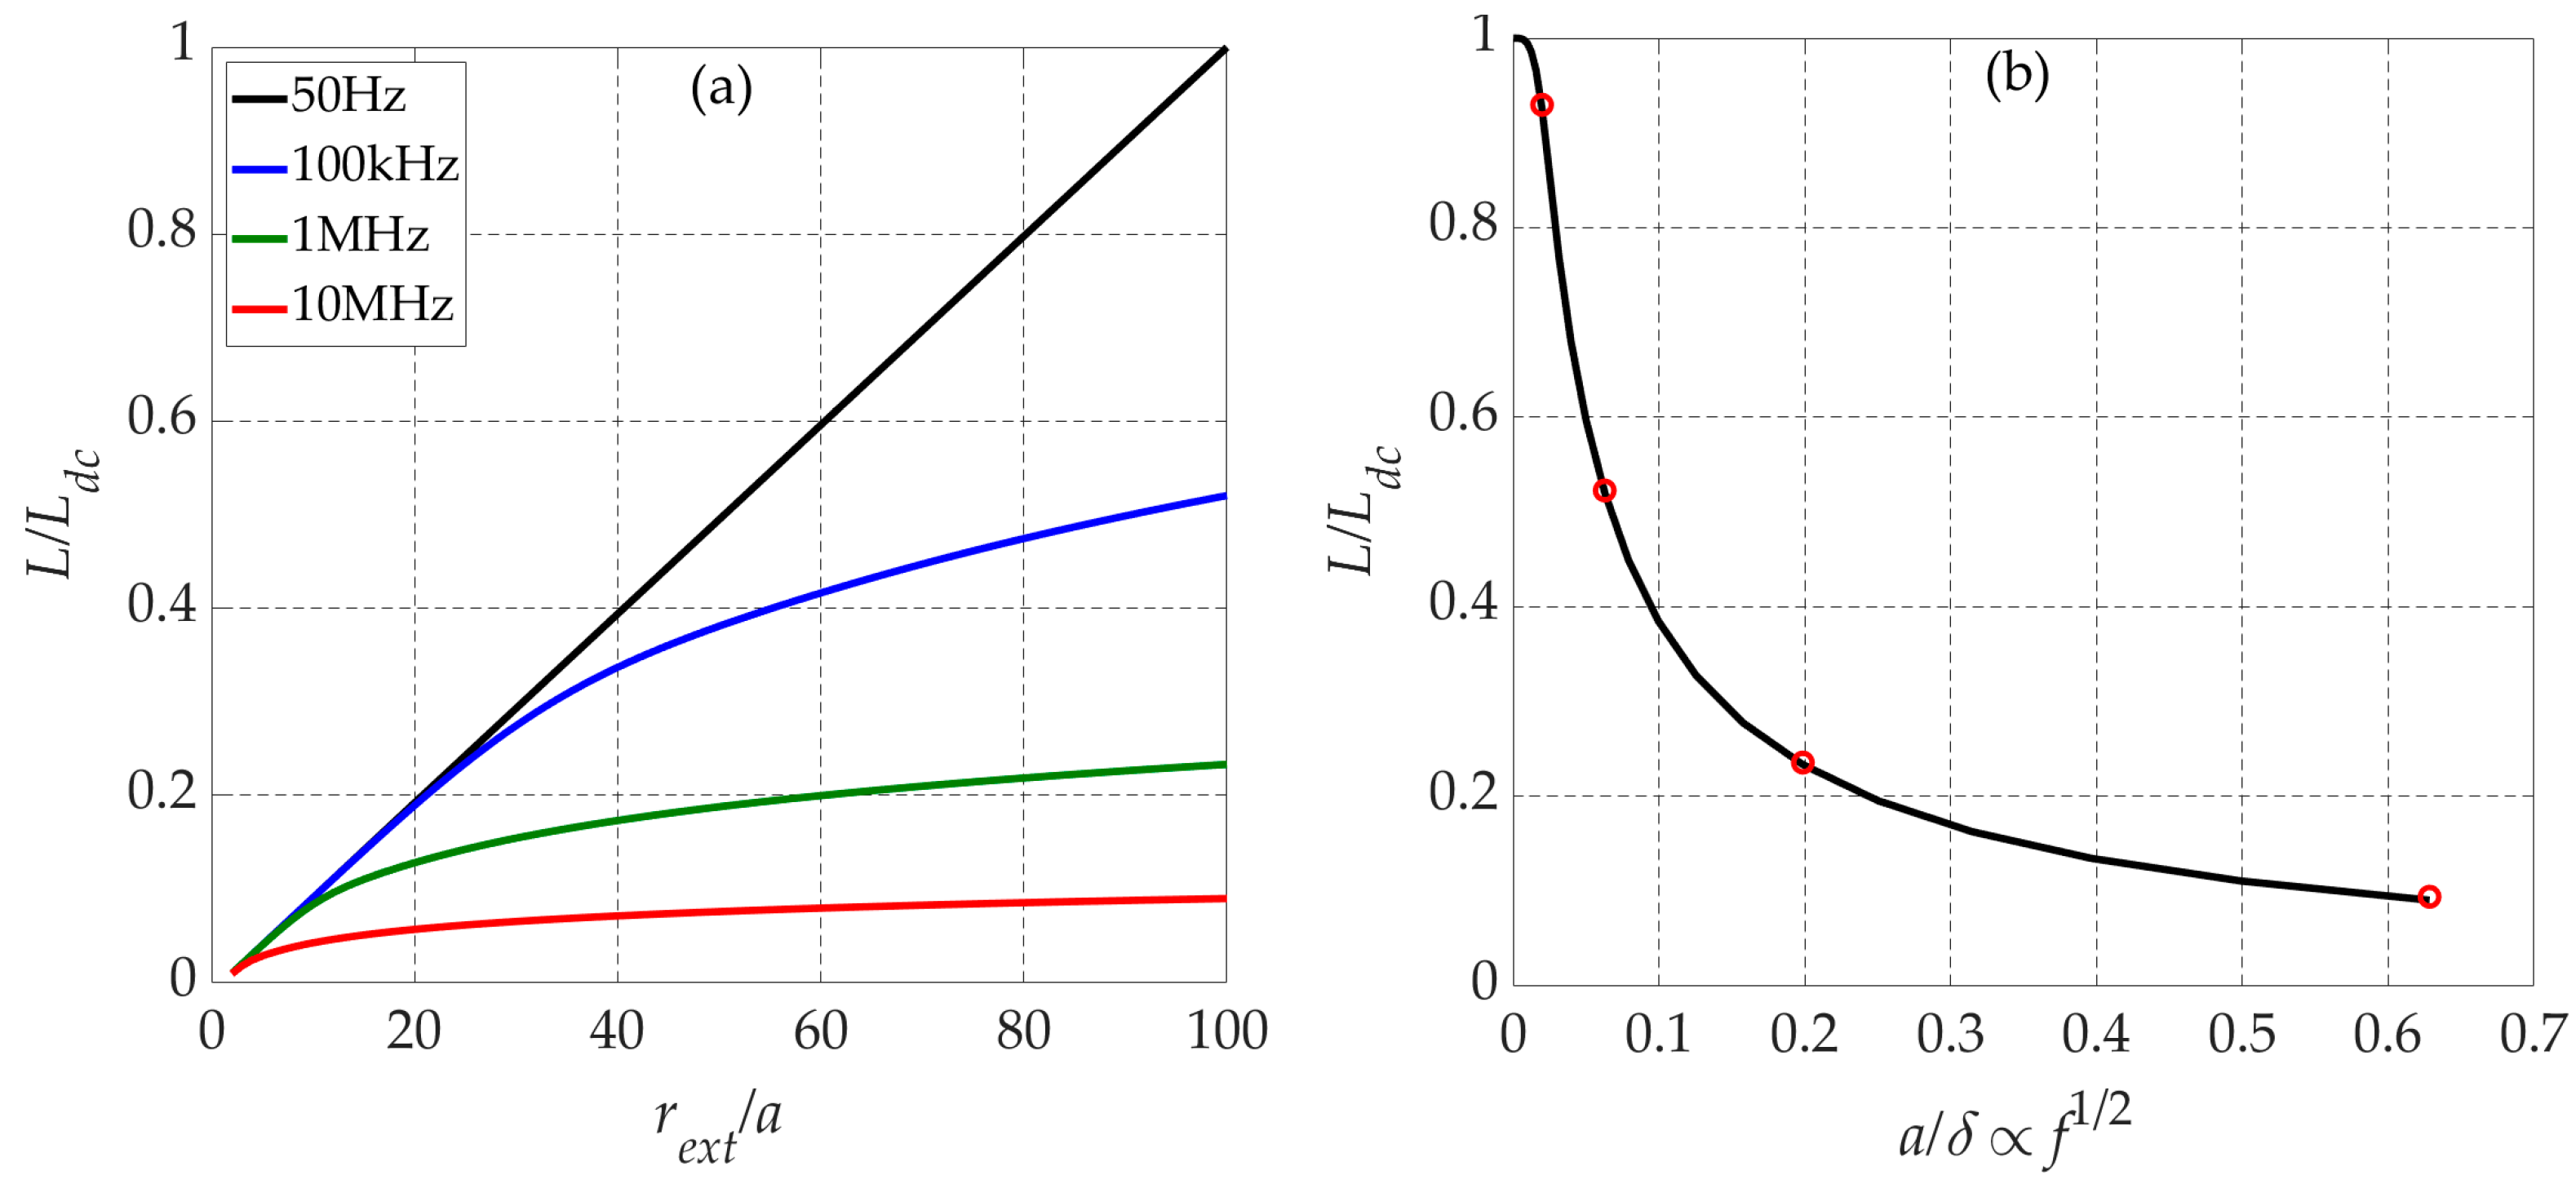
A sample of the simulation results obtained in [17] is presented in the next figures. Figure 2, with two parts, concerns the electrode normalized inductance, Ln = L/Ldc, which is plotted against rext/a (on the left) and against a/δ (on the right). The normalization factor is the DC inductance Ldc = 7.73 μH, for the considered base case rext = 100 a.
Figure 2a shows, for a set of selected frequencies, that the electrode inductance is an ever-increasing function of the distance between the hemisphere and the remote electrode.
Figure 2b shows that the inductance decreases with the frequency (note that the horizontal scale is proportional to the square root of the frequency, the value a/δ = 0.63 corresponding to f = 10 MHz). The decreasing of L with ω is easily explained by taking into account that the electromagnetic field is expelled from the depths of the ground toward its surface as the skin effect builds up when the frequency increases, hence reducing the net volume for magnetic energy storage. In relative terms, the reduction rate is more pronounced at lower frequencies. In fact, from 0 to 100 kHz, the inductance decreases by 48% and, from 100 kHz to 1 MHz, it only decreases by a further 29%.
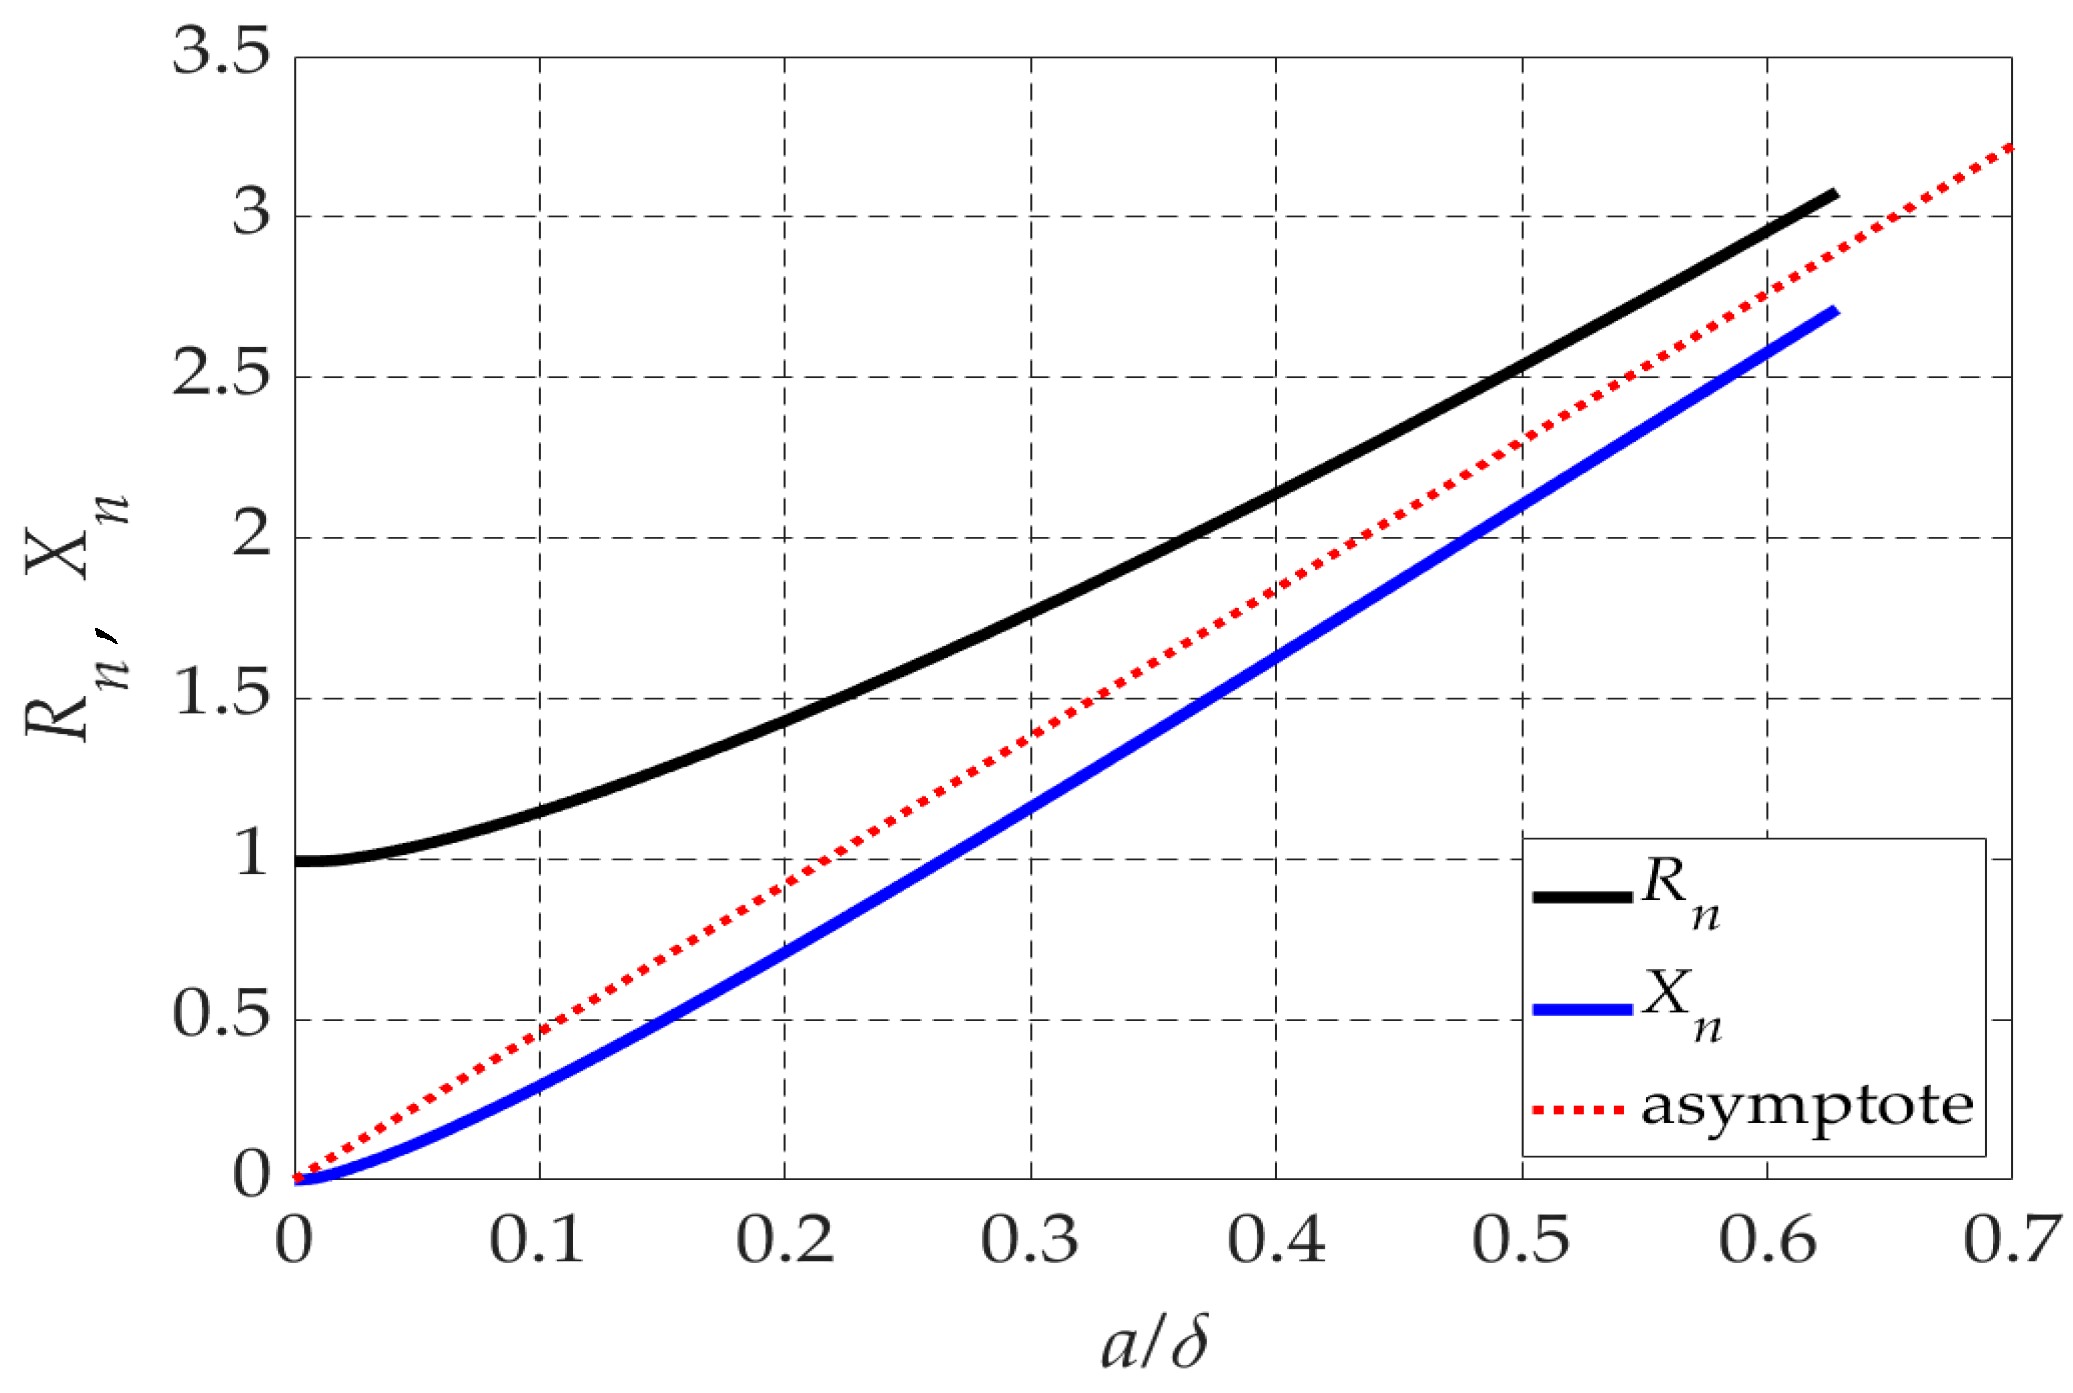
Also, for the base case rext = 100 a, Figure 3 shows the real and imaginary parts of the electrode impedance against a/δ. The curves are normalized such that R n ( ω ) + j X n ( ω ) = Z ¯ ( ω ) / Z ¯ ( 0 ) , with Z ¯ ( 0 ) = R d c = 15.9   Ω . For high frequencies, the resistance and reactance tend asymptotically to one another, both increasing with the square root of the frequency, with a rate determined by the slope of the dotted line in Figure 3, which is provided by [17]
{ Z ¯ ( ω ) = ( 1 + j )   R ( ω ) R ( ω ) = ( 1 2 π a σ ln r e x t a ) a δ   = 1 2 π ω μ 0 2 σ   ln ( r e x t a )
which suggests that, when currents flow very near to the air/ground surface (strong skin effect), the electrode impedance can be calculated by substituting the whole ground volume with an equivalent thin disk of thickness δ (the skin depth) around the electrode of radius a, with outer radius rext [17].

2.2. Validity of the Quasi-Stationary Approximation

To conclude Section 2, we assess the validity/accuracy of the quasi-stationary approximation employed in [17].
The behavior of the grounding system can be interpreted as a combination of two physical mechanisms, magnetic induction effects (skin effect) and electric induction effects (displacement currents). If the ground permeability is set to zero (μ = 0), magnetic induction cannot occur; likewise, if the ground permittivity is set to zero (ε = 0), electric induction cannot occur. The results published in [17] are based on the assumption ε = 0, that is, they can only describe part of the problem.
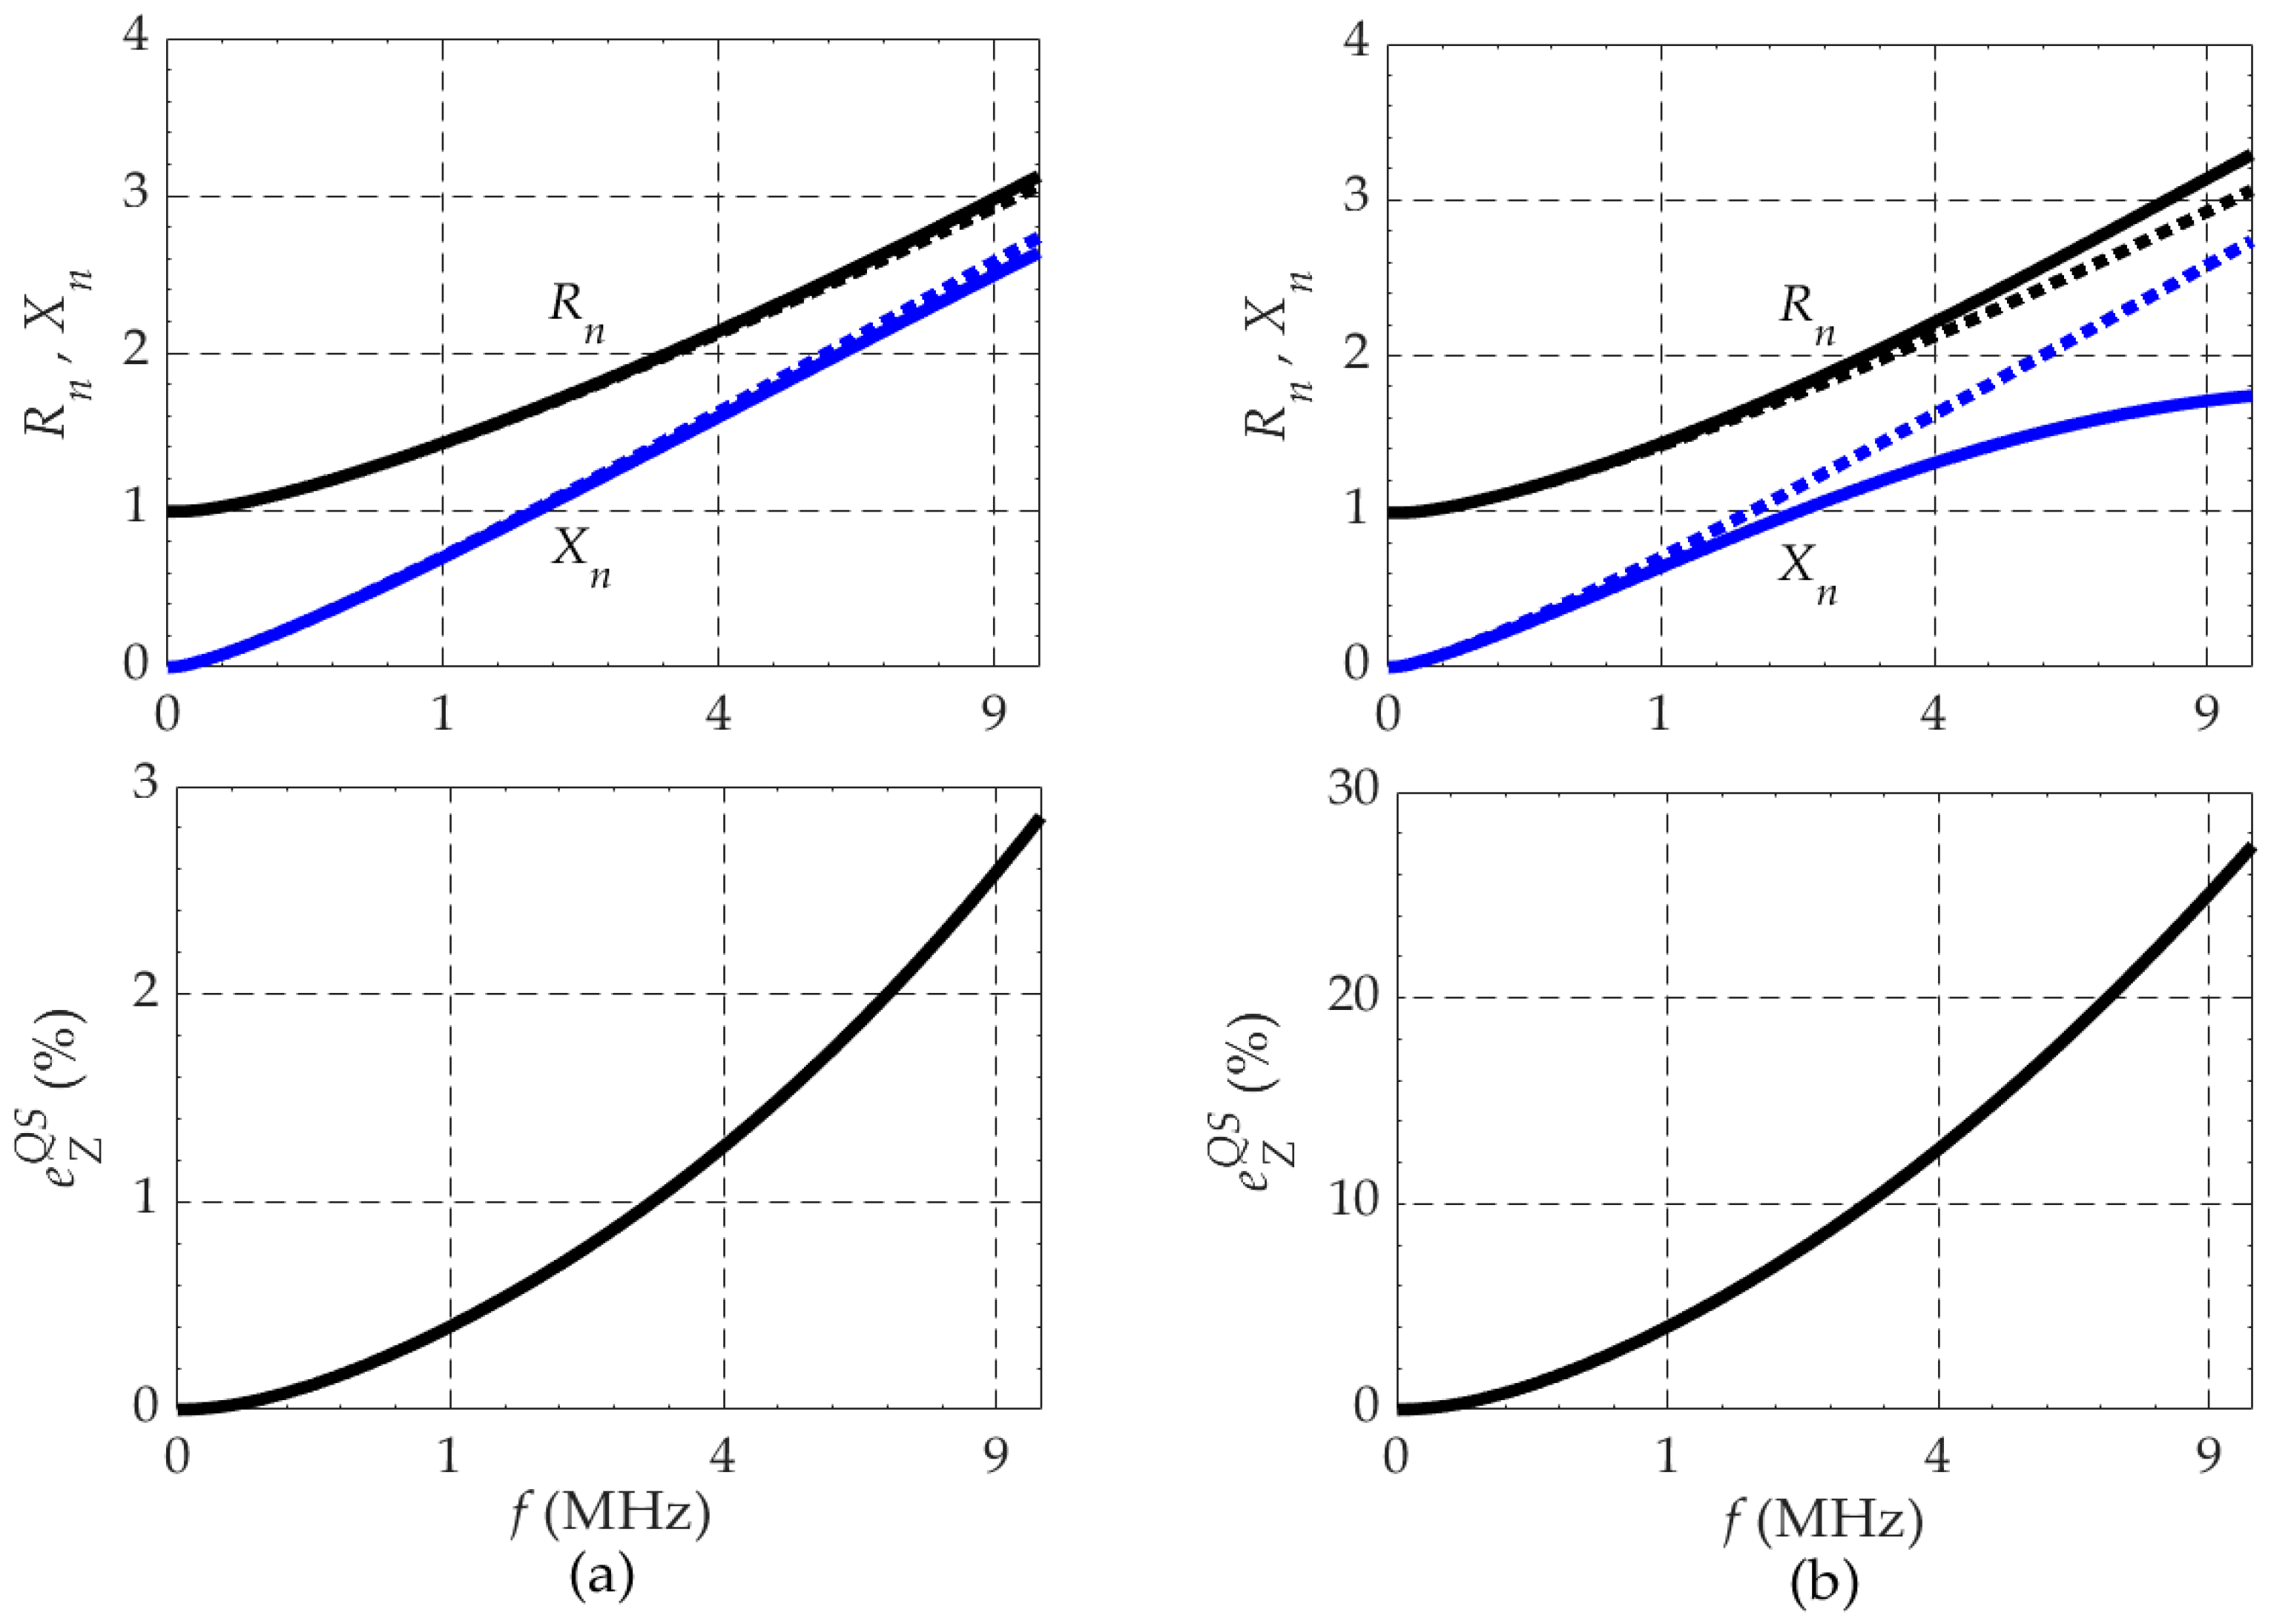
To assess the limits of the validity of the quasi-stationary approximation in [17], we repeated the computation procedure that led to Figure 3, with σ = 10 mS/m, in the 0–10 MHz range, but now we consider a full-wave approach with non-zero values of the ground permittivity, namely, ε/ε0 = 1 and ε/ε0 = 10. The new results for the normalized resistance and reactance against frequency are presented in Figure 4, where the normalization factor is the electrode DC resistance (15.9 Ω).
Impedance values produced by both approaches have been compared and the relative error incurred by using the quasi-stationary approximation was calculated:
e Z Q S ( ω ) = | Z ¯ Q S Z ¯ F W Z ¯ F W |   × 100 %
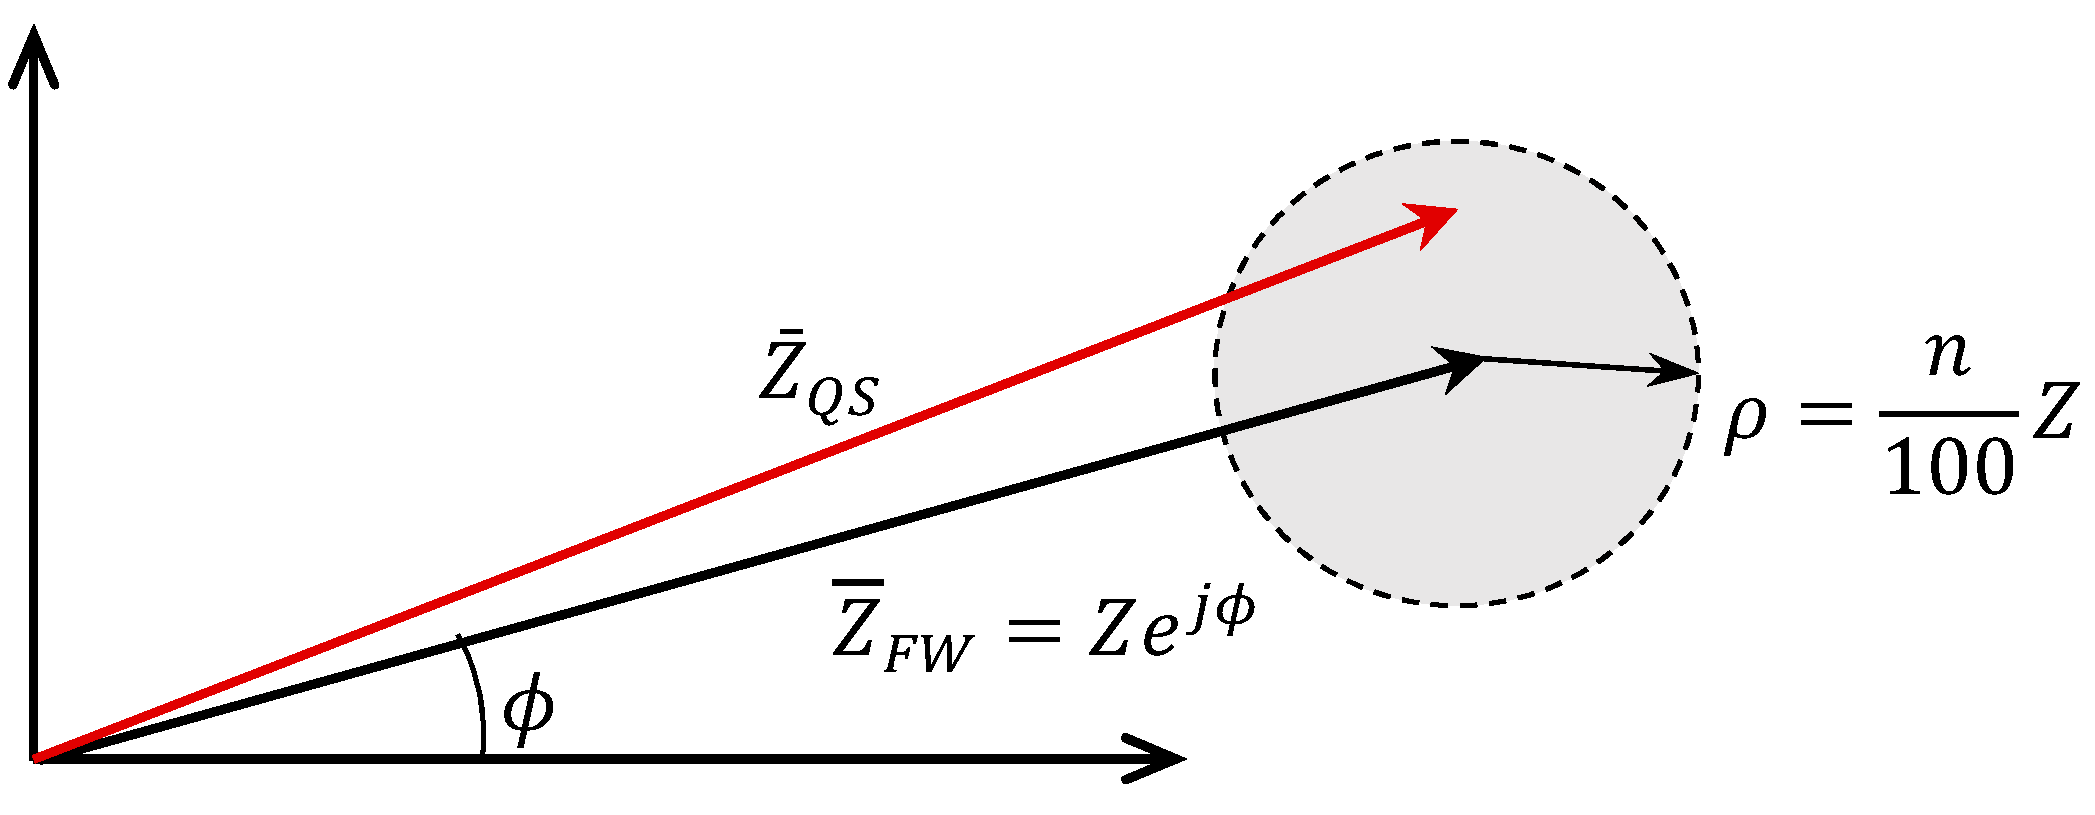
where subscripts QS and FW are reminders for quasi-stationary and full-wave approaches, respectively. Figure 5, in the complex plane, permits the interpretation of the relative impedance error introduced in (6).
The graphs in the left column (Figure 4a) were obtained for the case ε/ε0 = 1, and those on the right column (Figure 4b) for the case ε/ε0 = 10. The plots on the top are normalized graphs of the real and imaginary parts of the full-wave impedance (solid lines) superposed to the corresponding graphs of the quasi-stationary impedance (dotted lines). The plots on the bottom depict the impedance deviations defined in (6). All the graphs utilize a square root scale in the horizontal frequency axis.
The appropriateness of the quasi-stationary approximation is dependent on the condition that the ratio f / f r is small, where f r = σ / ( 2 π ε ) is the relaxation frequency of the ground medium. For a soil with σ = 10 mS/m, we have f r = 180 MHz if ε = ε 0 ; however, for ε = 10 ε 0 , the relaxation frequency decreases to f r = 18 MHz, which is too close to the upper limit (10 MHz) of the observation window.
The curves in Figure 4a, for the case ε / ε 0 = 1 , clearly show that the quasi-stationary approximation performs adequately up to 10 MHz, as errors smaller than 3% are observed. However, the curves in Figure 4b, for the case ε / ε 0 = 10 , reveal that such a good agreement between approximations can only be observed for frequencies below 1 MHz. For higher frequencies, the disagreement between the two approaches becomes more and more notorious; at 10 MHz, the errors are roughly ten times larger.
The QS approximation predicts that the functions R(ω) and X(ω) tend toward one another as the frequency increases but, as the results of the full-wave approximation show, that is not exactly true. As can be seen in Figure 4b, the curves of R(ω) and X(ω) begin to diverge at about 1 MHz.
The QS approximation predicts electrode resistance values smaller than they are, and electrode reactance values higher than they are. Discrepancies increase with the frequency and predominantly affect the electrode reactance, which is understandable, as the reactance is proportional to the subtraction of the average values of stored energies ( W m W e ) a v . In fact, by definition, the QS approximation, with ε = 0, can only take into account the magnetic energy inside the soil (inductive effects, positive reactance). The full-wave approximation, in addition to the magnetic energy, also accounts for the electric energy (capacitive effects, negative reactance).

3. Grounding Impedance of a Pair of Hemispherical Electrodes

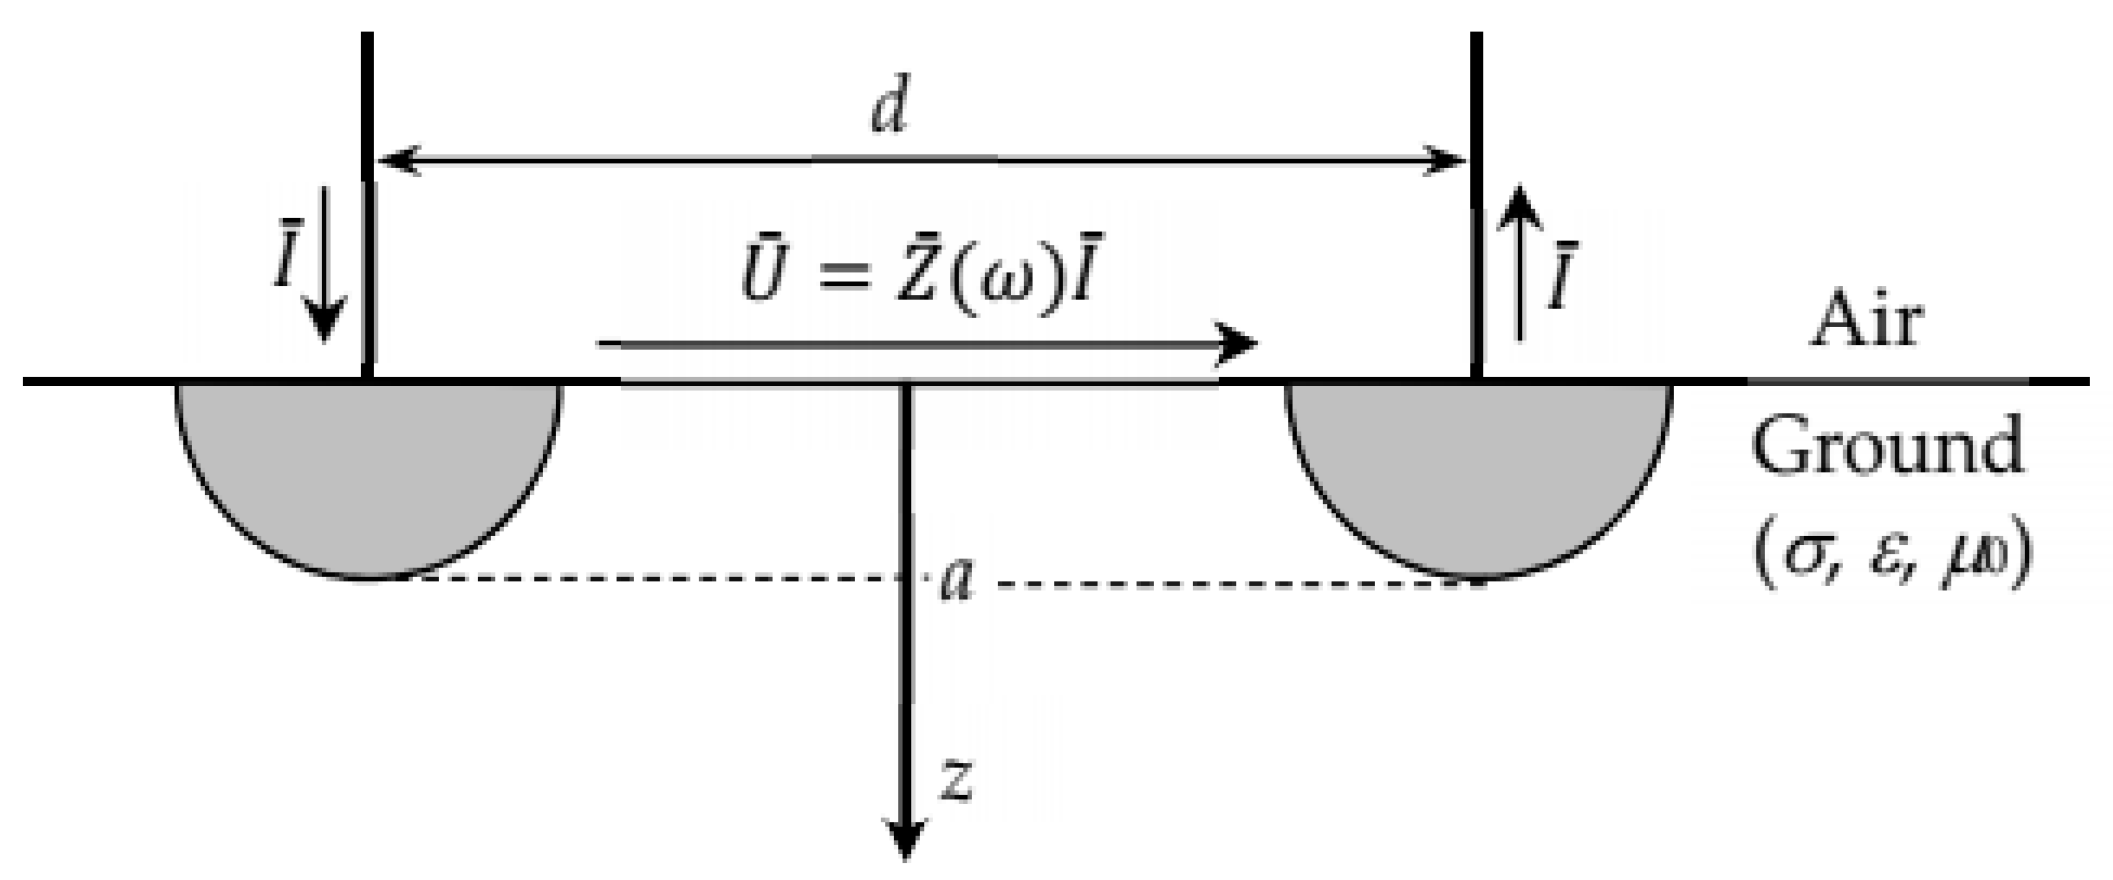
Now, in this section, we present numerical results for the frequency-dependent resistance and reactance of the grounding system in Figure 6, obtained by the application of the full-wave FEM approach to various combinations of the ground parameters.
Ignoring proximity effects (d >> a), considering the current sources as point sources located at the hemispheres centers, allows a simple application of the superposition principle to obtain the overall field solution of the system by summing the fields originated by each of the electrodes with opposite currents, [17]. Consequently, the impedance of the two-electrode system can be easily determined from the impedance of the single electrode (with a concentric remote electrode of radius rext) by simply substituting rext with d and, finally, multiplying the result by 2.
Here we resort to the same formulation for the electromagnetic field (ι-form, FEM) and the same software tool that we employed in [17]. The key difference is the ab initio adoption of the full-wave approximation. We abandon the quasi-stationary approach and assign a complex conductivity to the ground σ ¯ = σ + j ω ε , as in (3), and insert the latter in (4) for redefining the complex wavenumber as follows:
κ ¯ ( ω ) = ( j ω μ σ ¯ ) 1 / 2 = ω 2 μ ε j ω μ σ
where the real term under the square root symbol is related to wave propagation in the medium. With this approach, magnetic induction phenomena (inductive behavior) and displacement current effects (capacitive behavior) are encompassed together.

3.1. Simulation Experiments

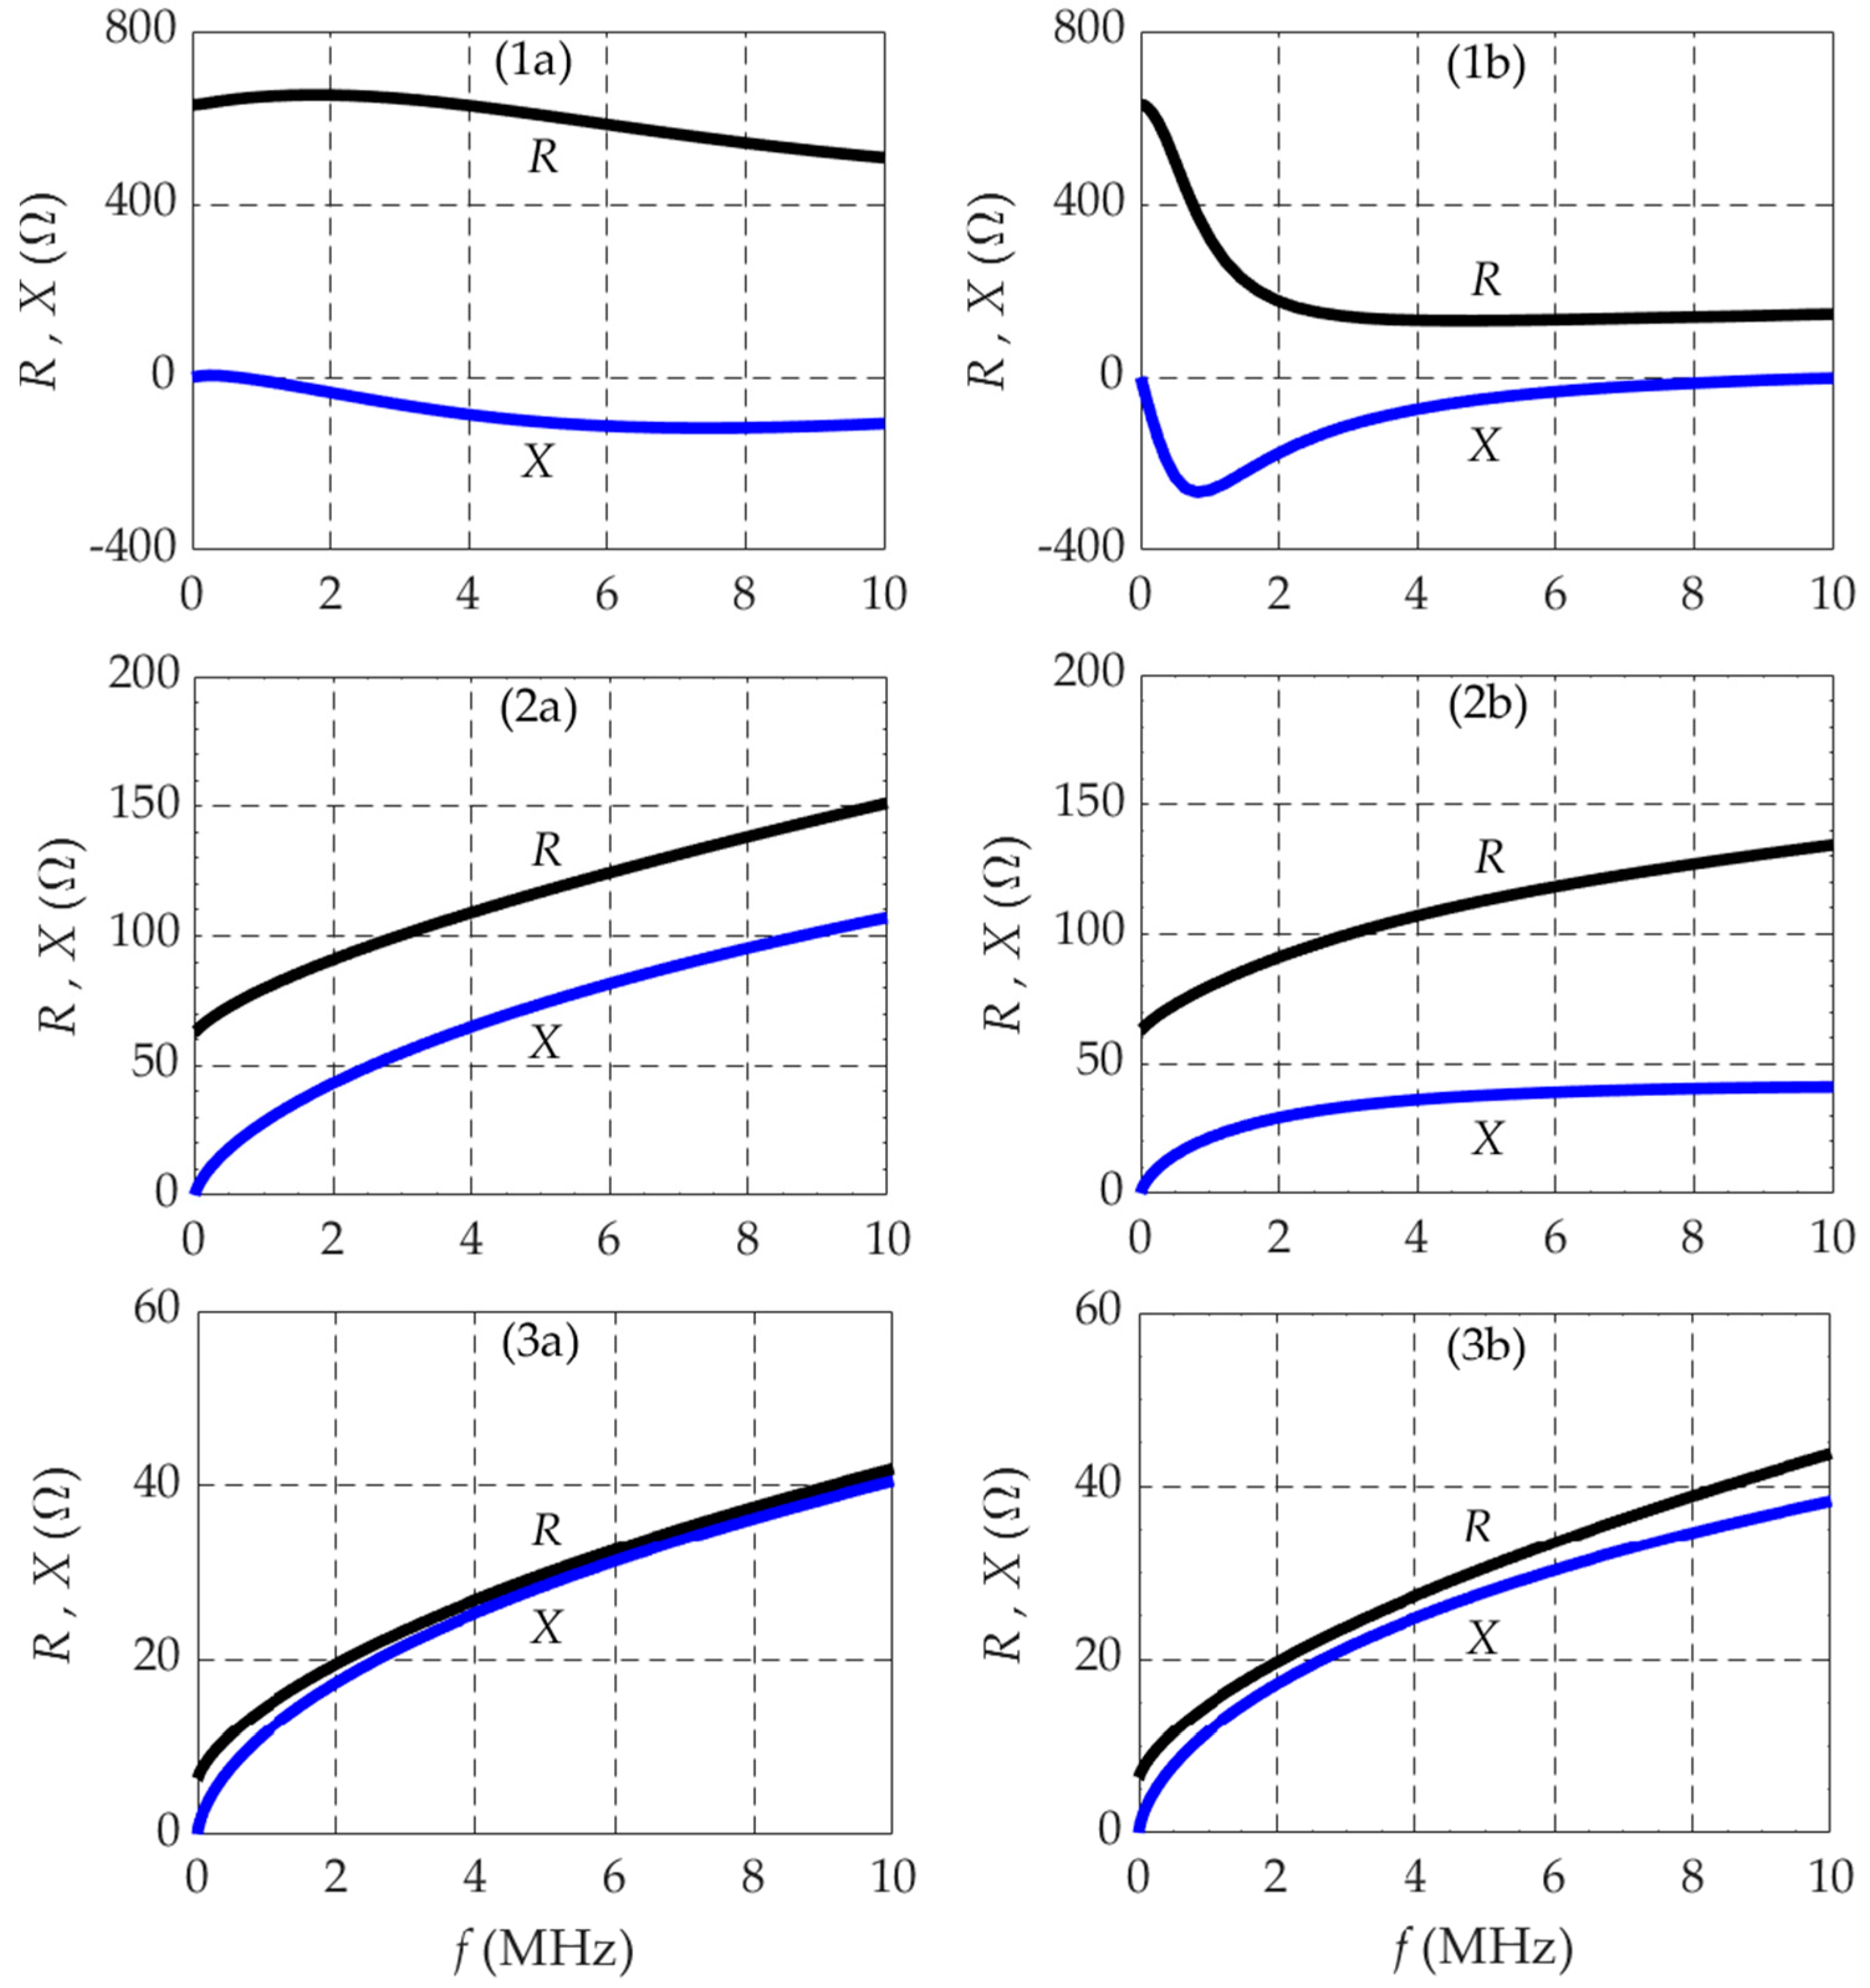
Full-wave FEM numerical simulations were carried out for determining the resistance R ( ω ) = Re ( Z ¯ ) and reactance X ( ω ) = Im ( Z ¯ ) of the grounding system in the range 0–10 MHz. Results were obtained considering three increasing values of the soil conductivity, σ ∈ {0.5, 5.0, 50} mS/m, corresponding to dry, moist, and wet soils, respectively, and, for each of them, two values of the permittivity were examined, ε/ε0 ∈ {1, 10} totaling six distinct cases, namely,
Case   ( 1 a ) :   σ = 0.5   mS / m ,   ε = ε 0 .   Case   ( 1 b ) :   σ = 0.5   mS / m ,   ε = 10 ε 0 Case   ( 2 a ) :   σ = 5.0   mS / m ,   ε = ε 0 .   Case   ( 2 b ) :   σ = 5.0   mS / m ,   ε = 10 ε 0 Case   ( 3 a ) :   σ = 50   mS / m ,     ε = ε 0 .   Case   ( 3 b ) :   σ = 50   mS / m ,     ε = 10 ε 0
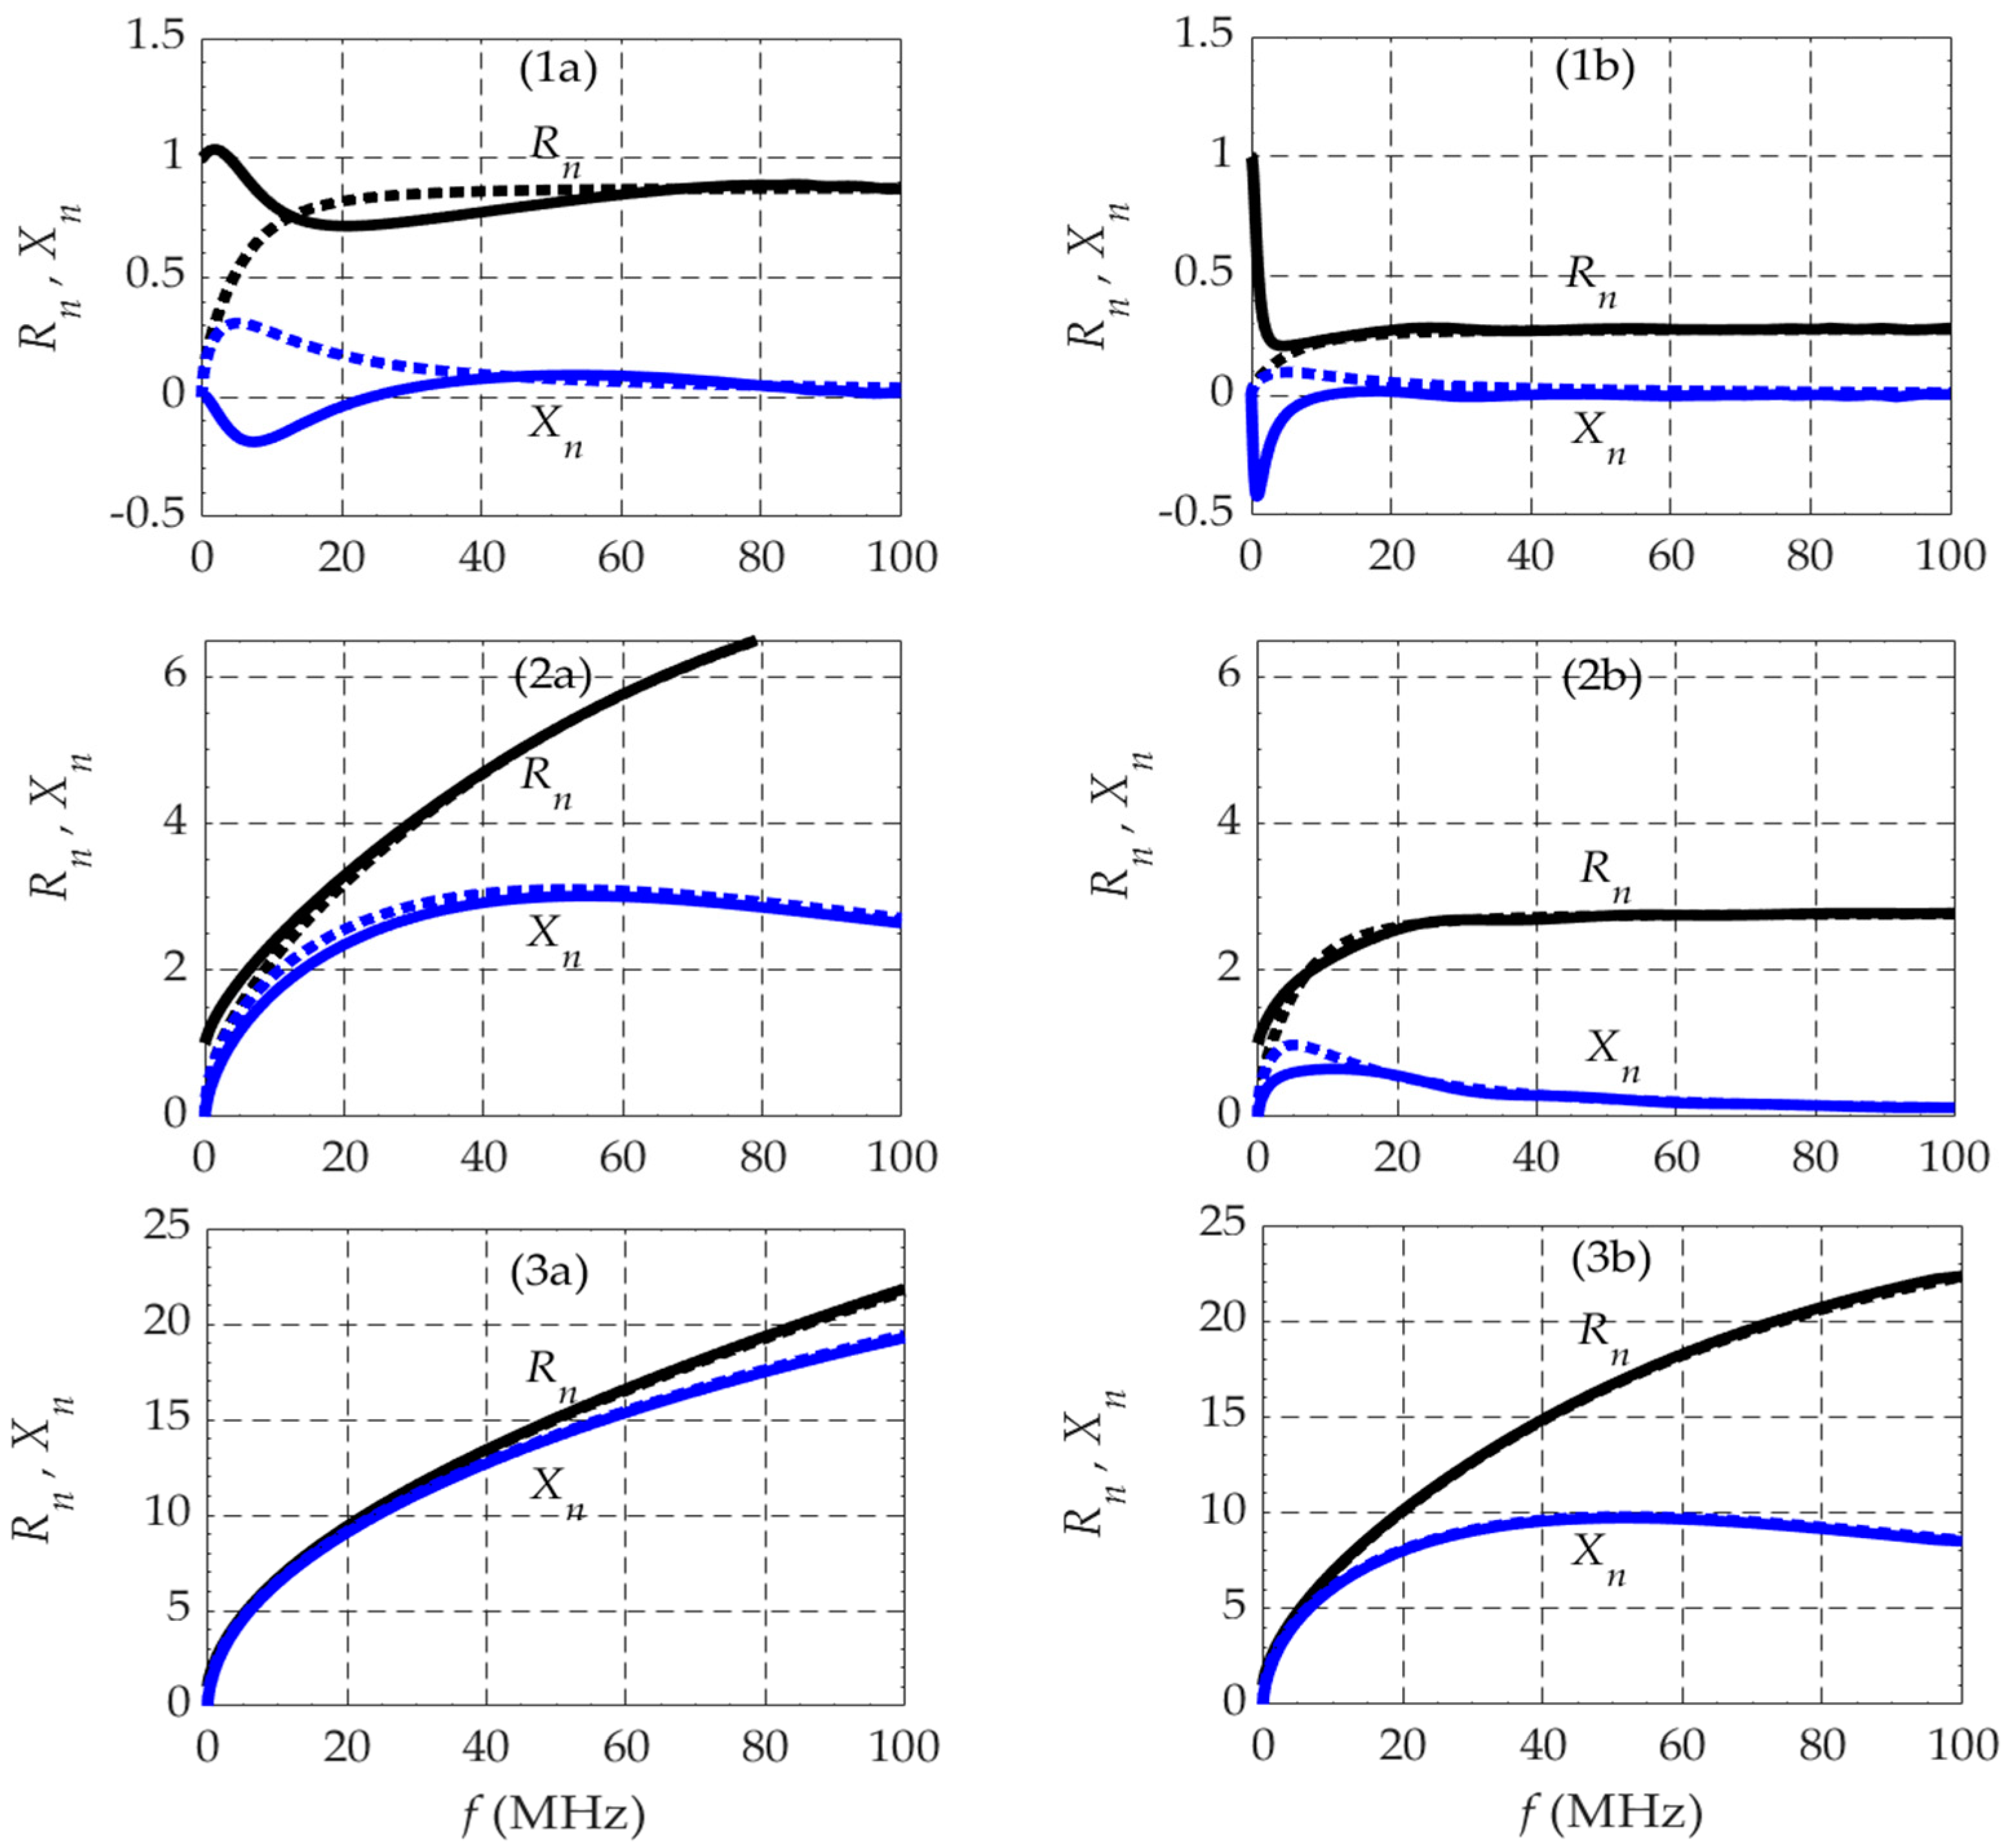
Our simulation experiments produced the results for R(ω) and X(ω) displayed in Figure 7, where a linear scale in the horizontal frequency axis is employed (note that the square root scale is particularly appropriate for graphical results related to the quasi-stationary approximation, which we have abandoned).
Considering the electrode geometry being analyzed (d/a = 100, a = 1 m), observation of the six cases illustrated in Figure 7, for the window 0–10 MHz, permits the following general comments:
For ω = 0, the impedance is purely real (X = 0), the value of R decreasing with increasing ground conductivity (case sequence 1-2-3).
The grounding impedance can be found in the 1st or 8th octants of the complex plane, i.e., R > |X| > 0. For dry soils (cases 1a and 1b), the impedance is found predominantly in the 8th octant, the reactance is negative, and the electrode system exhibits capacitive behavior, (We)av > (Wm)av. For moist and wet ground (cases 2a, 2b, and 3a, 3b), the impedance is found predominantly in the 1st octant, the reactance is predominantly positive, and the electrode system exhibits inductive behavior, (Wm)av > (We)av.
 
We emphasize the word “predominantly” because a closer look at Figure 7(1a,1b) reveals quite interesting details. In Figure 7(1a), near the origin, the behavior is indeed slightly inductive (X > 0); the reactance initiates positively, declines, and at 635 kHz turns negative; then, at 7.3 MHz, it reaches a local minimum and again acquires a positive derivative, crossing the X = 0 reference (resonance) at around 24 MHz (not seen here, but visible ahead in Figure 11 in Section 3.3). In Figure 7(1b), the initial behavior is capacitive with X < 0; the reactance reaches a local minimum at 820 kHz, acquires a positive derivative, and turns inductive at around 10 MHz.
To better grasp the reasons for this behavior, we split our analysis into two parts, one for low frequencies (Section 3.2) focusing on the frequency range up to 100 kHz, another for high frequencies (Section 3.3) where the frequency range is extended up to 100 MHz, well above the range of interest for lightning, but necessary to gain insight into the physics of the problem. We may remark that a spectral range up to 100 MHz, although rare in power systems, is not a fantasy—remember the example of very fast transients in gas-insulated high-voltage switchgears [20,21].
The boundary between cases of low and high frequency is ambiguous and not precisely defined. We make use of the frequency-dependent complex wavenumber κ ¯ ( ω ) in (7) and adopt the following basic rule: if the situation is such that | κ ¯ a |   < < 1 , we may say that it is a low-frequency case; conversely, if | κ ¯ a |   > > 1 , we may say it is a high-frequency case.

3.2. Low-Frequency Analysis

The DC parameters characterizing the grounding system of a pair of hemispherical electrodes (Figure 6) are obtained from those in (1), yielding the following:
{ R d c C d c L d c } =   { 1 π a σ ( 1 a d )   π a ε ( 1 a d ) 1 μ 0 d π ( 1 a d ) ln 4 e } { 1 π a σ π a ε μ 0 d π ln 4 e }
Values of the above DC parameters are presented in Table 1 for the data under consideration, σ { 0.5 ,     5.0 ,     50 } mS/m and ε / ε 0 { 1 ,   10 } . The table also includes values of the following auxiliary dimensionless parameter:
η = R d c L d c / C d c = τ C τ L 1 σ ε μ 0   a d ln ( 4 / e ) ,   with   { τ C = R d c C d c = ε / σ τ L = L d c / R d c              
which will appear later in (12).
For low-frequency (LF) regimes, where the use of the above DC parameters may make sense, we can write an approximated expression for the grounding impedance considering the quasi-stationary impedance R + jωL for the limit case ω 0 , and there replacing the real conductivity σ with the complex conductivity σ ¯ = σ + j ω ε . Thus, we have the following:
Z ¯ L F ( ω ) = R L F + j X L F = { 1 π a ( σ + j ω ε ) + j ω   μ 0 d π ln 4 e 1 R d c 1 + j ω C d c + j ω L d c ,   with   R d c C d c = ε σ = τ C                
which can be translated into an equivalent basic circuit consisting of an inductance L series-connected to a parallel RC.
Figure 8 is a zooming-in of Figure 7, focused on the low-frequency region in the initial range 0–100 kHz, complemented with graphs concerning the LF approximation in (10).
In Figure 8, the curves of the electrode impedance obtained from the full-wave FEM simulations (solid lines) are shown superposed to the curves obtained from the analytical LF approximation (dotted lines). To facilitate comparisons, all the impedance curves are normalized as R n ( ω ) + j X n ( ω ) = Z ¯ ( ω ) / Z ¯ ( 0 ) , with Z ¯ ( 0 ) = R d c , with R d c values in Table 1.
Considering the electrode geometry being analyzed (d/a = 100, a = 1 m), observation of the six cases illustrated in Figure 8, for the window 0–100 kHz, permits the following general comments:
For dry soils (cases 1a and 1b) where Rdc is larger, the electrode impedance is practically real and constant, Z ¯ ( ω ) R d c . The reactance, although very small, denotes capacitive behavior, which increases with the soil permittivity and with the frequency.
For moist soils (cases 2a and 2b), the electrode impedance barely depends on the soil permittivity (Figure 2a and Figure 2b are quite similar); the resistance and the reactance slowly increase with f; the reactance is small but positive, denoting inductive behavior.
The above comments also apply to wet soils (cases 3a and 3b), with the difference that the resistance and the reactance now significantly increase with the frequency.
The accuracy and limits of the applicability of the LF approximation in (10) can be assessed by calculating the impedance relative error defined in (11), like in (6), that is,
e Z L F ( ω ) = | Z ¯ L F Z ¯ F E M Z ¯ F E M | × 100 %
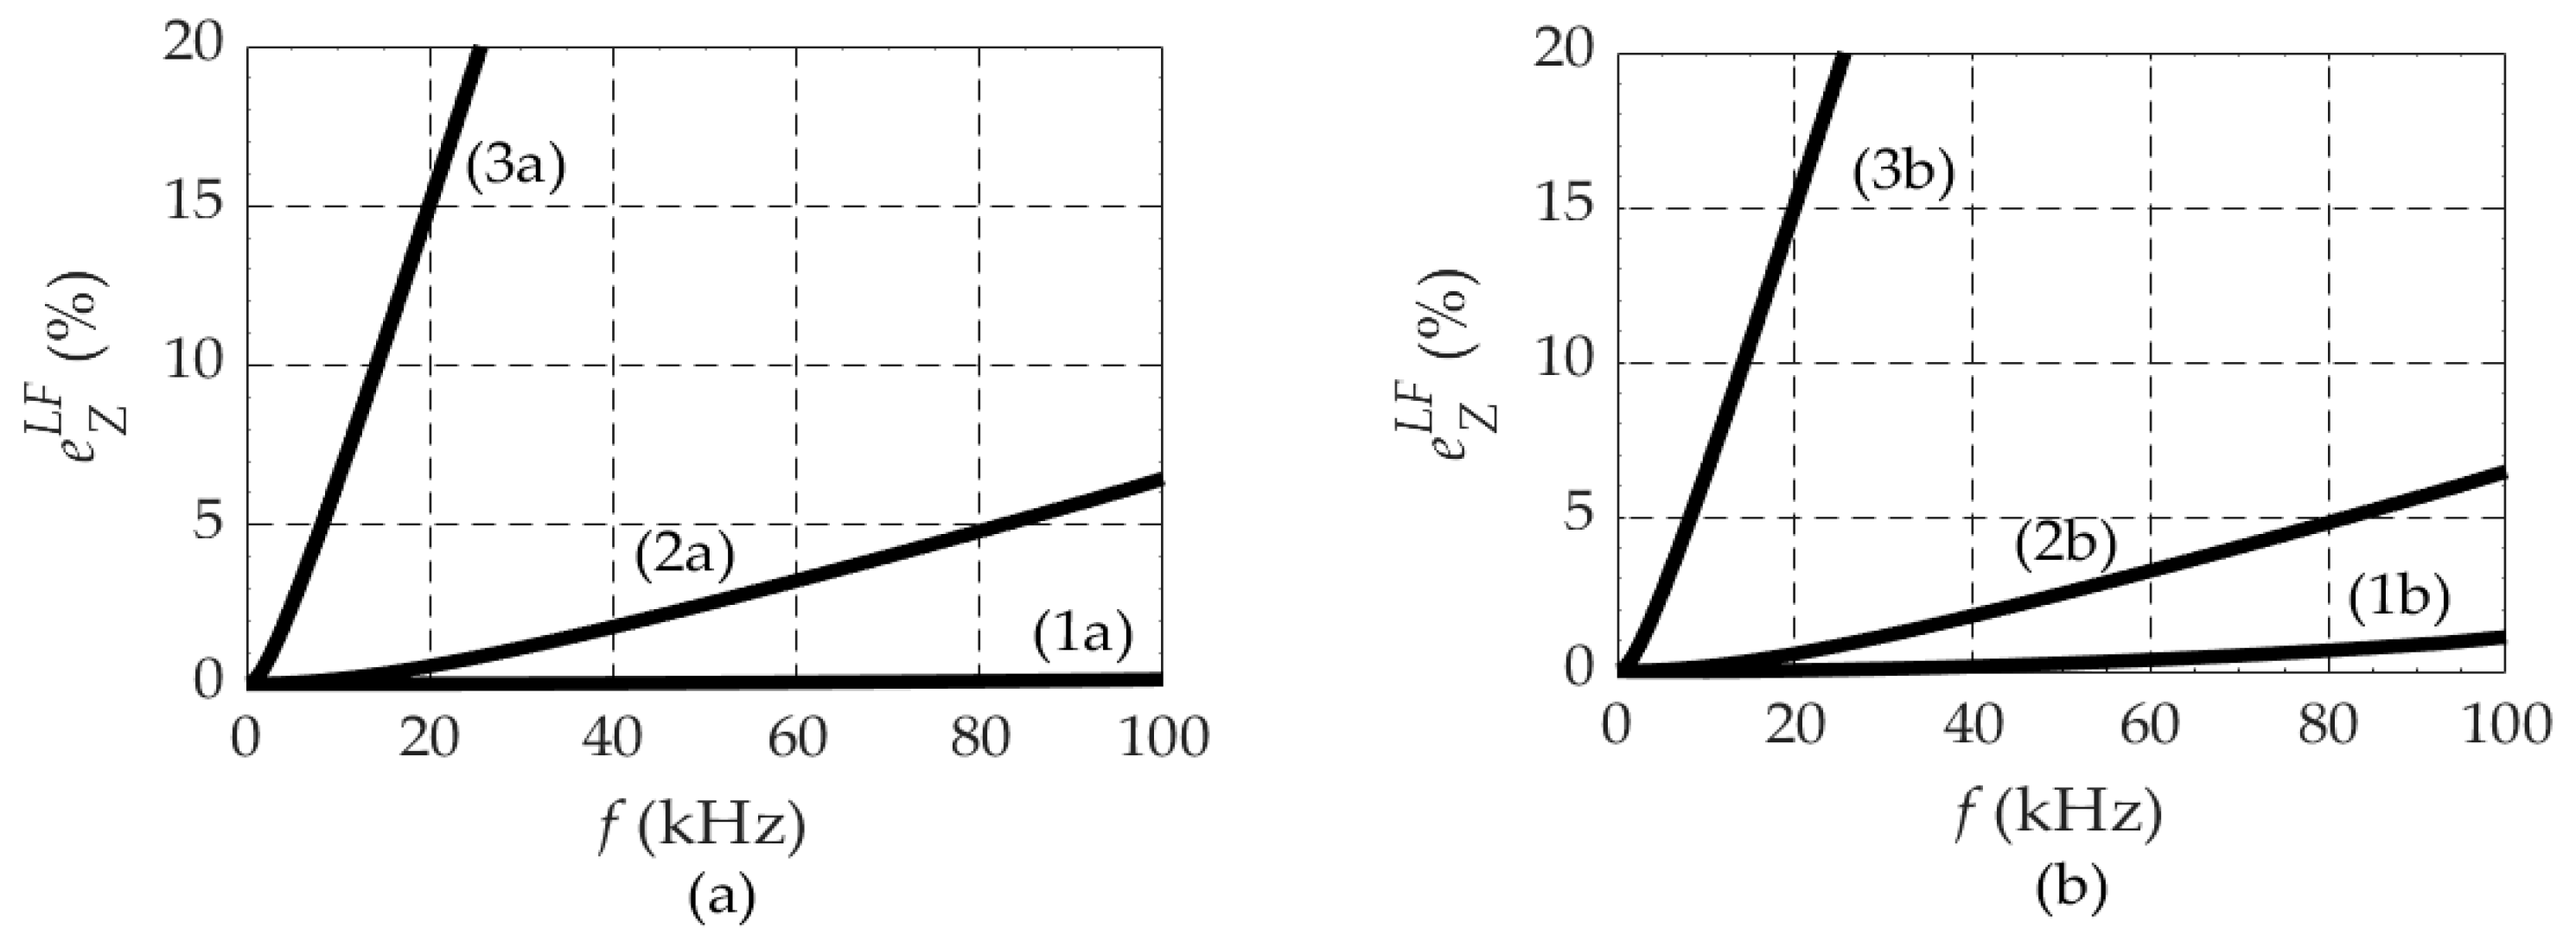
The information in Figure 8 was processed to enable the calculation of the impedance error in (11); the corresponding results are depicted in Figure 9 and show the following:
The error naturally increases with the frequency.
Figure 9a and Figure 9b are practically the same, meaning that the low-frequency error depends very little on the soil permittivity.
The error is negligibly small for the case of dry soils, but significantly increases with increasing soil conductivity. While for moist soils (cases 2a, 2b) the error is smaller than 5% up to 80 kHz, for wet soils (cases 3a, 3b), the error exceeds 15% above 20 kHz.
 
The preceding comments concerning Figure 8 and Figure 9 have a simple physical justification. Let us go back to (10), paying special attention to frequencies close to zero, where ω R d c C d c =   ω τ C < < 1 . The fraction 1 / ( R d c 1 + j ω C d c ) can be recast as R d c / ( 1 + j ω τ C ) , and using the Taylor expansion ( 1 + x ) 1 1 x + x 2 , we find the following:
Z ¯ L F =   R L F + j X L F   ,     { R L F R d c   ( 1 ( ω τ C ) 2 ) X L F ω ( L d c τ C R d c ) = ω ( L d c R d c 2 C d c ) = ω L d c ( 1 η 2 )
and
( d R L F d ω   ) ω 0 0   ,     ( d X L F d ω   ) ω 0 L d c ( 1 η 2 ) = L d c ( 1 τ C τ L )
Figure 9. Graphs of the impedance relative error e Z L F ( ω ) incurred when using the low-frequency approximation. (a) For cases 1a, 2a, and 3a with ε = ε0. (b) For cases 1b, 2b, and 3b with ε = 10ε0.
Energies 17 03206 g009
According to (12) and (13), the grounding resistance RLF(ω) starts at Rdc and remains approximately constant along the frequency axis. On the other hand, the grounding reactance XLF(ω) starts at 0 and increases linearly with ω, the proportionality factor L d c ( 1 η 2 ) being controlled by the parameter η = τ C / τ L introduced in (9).
Depending on the ground constitutive parameters that determine the value of η, one may expect the initial low-frequency behavior of the grounding system to be inductive (η < 1), capacitive (η > 1), or even purely resistive (η = 1). This can be translated to physical terms (geometry and ground properties), with the help of (8) and (9), through the following:
Initial   behavior   { Inductive   if     ζ < a d   Capacitive   if     ζ > a d     ,   with   ζ = ε σ 2 μ 0 ln ( 4 / e ) = η 2 a d
While the area in the right-hand side of the inequalities in (14) depends only on the system geometry, the left-hand side depends only on the soil properties, ζ ( σ , ε , μ 0 ) . Therefore, for large geometries, the initial frequency behavior of the grounding impedance is expected to be inductive in general.
In the present work, with fixed geometry (d/a = 100 and a = 1 m), we have ad = 100 m2. The largest value of ς occurs for the smallest conductivity value (0.5 mS/m) and, in this case, we find ς = 72.9 m2 for ε =ε0 and ς = 729 m2 for ε = 10ε0. The conclusion is that only in the second situation (ε =10ε0—case 1b) will the grounding system exhibit initial capacitive behavior—as can be checked in Figure 8(1b).
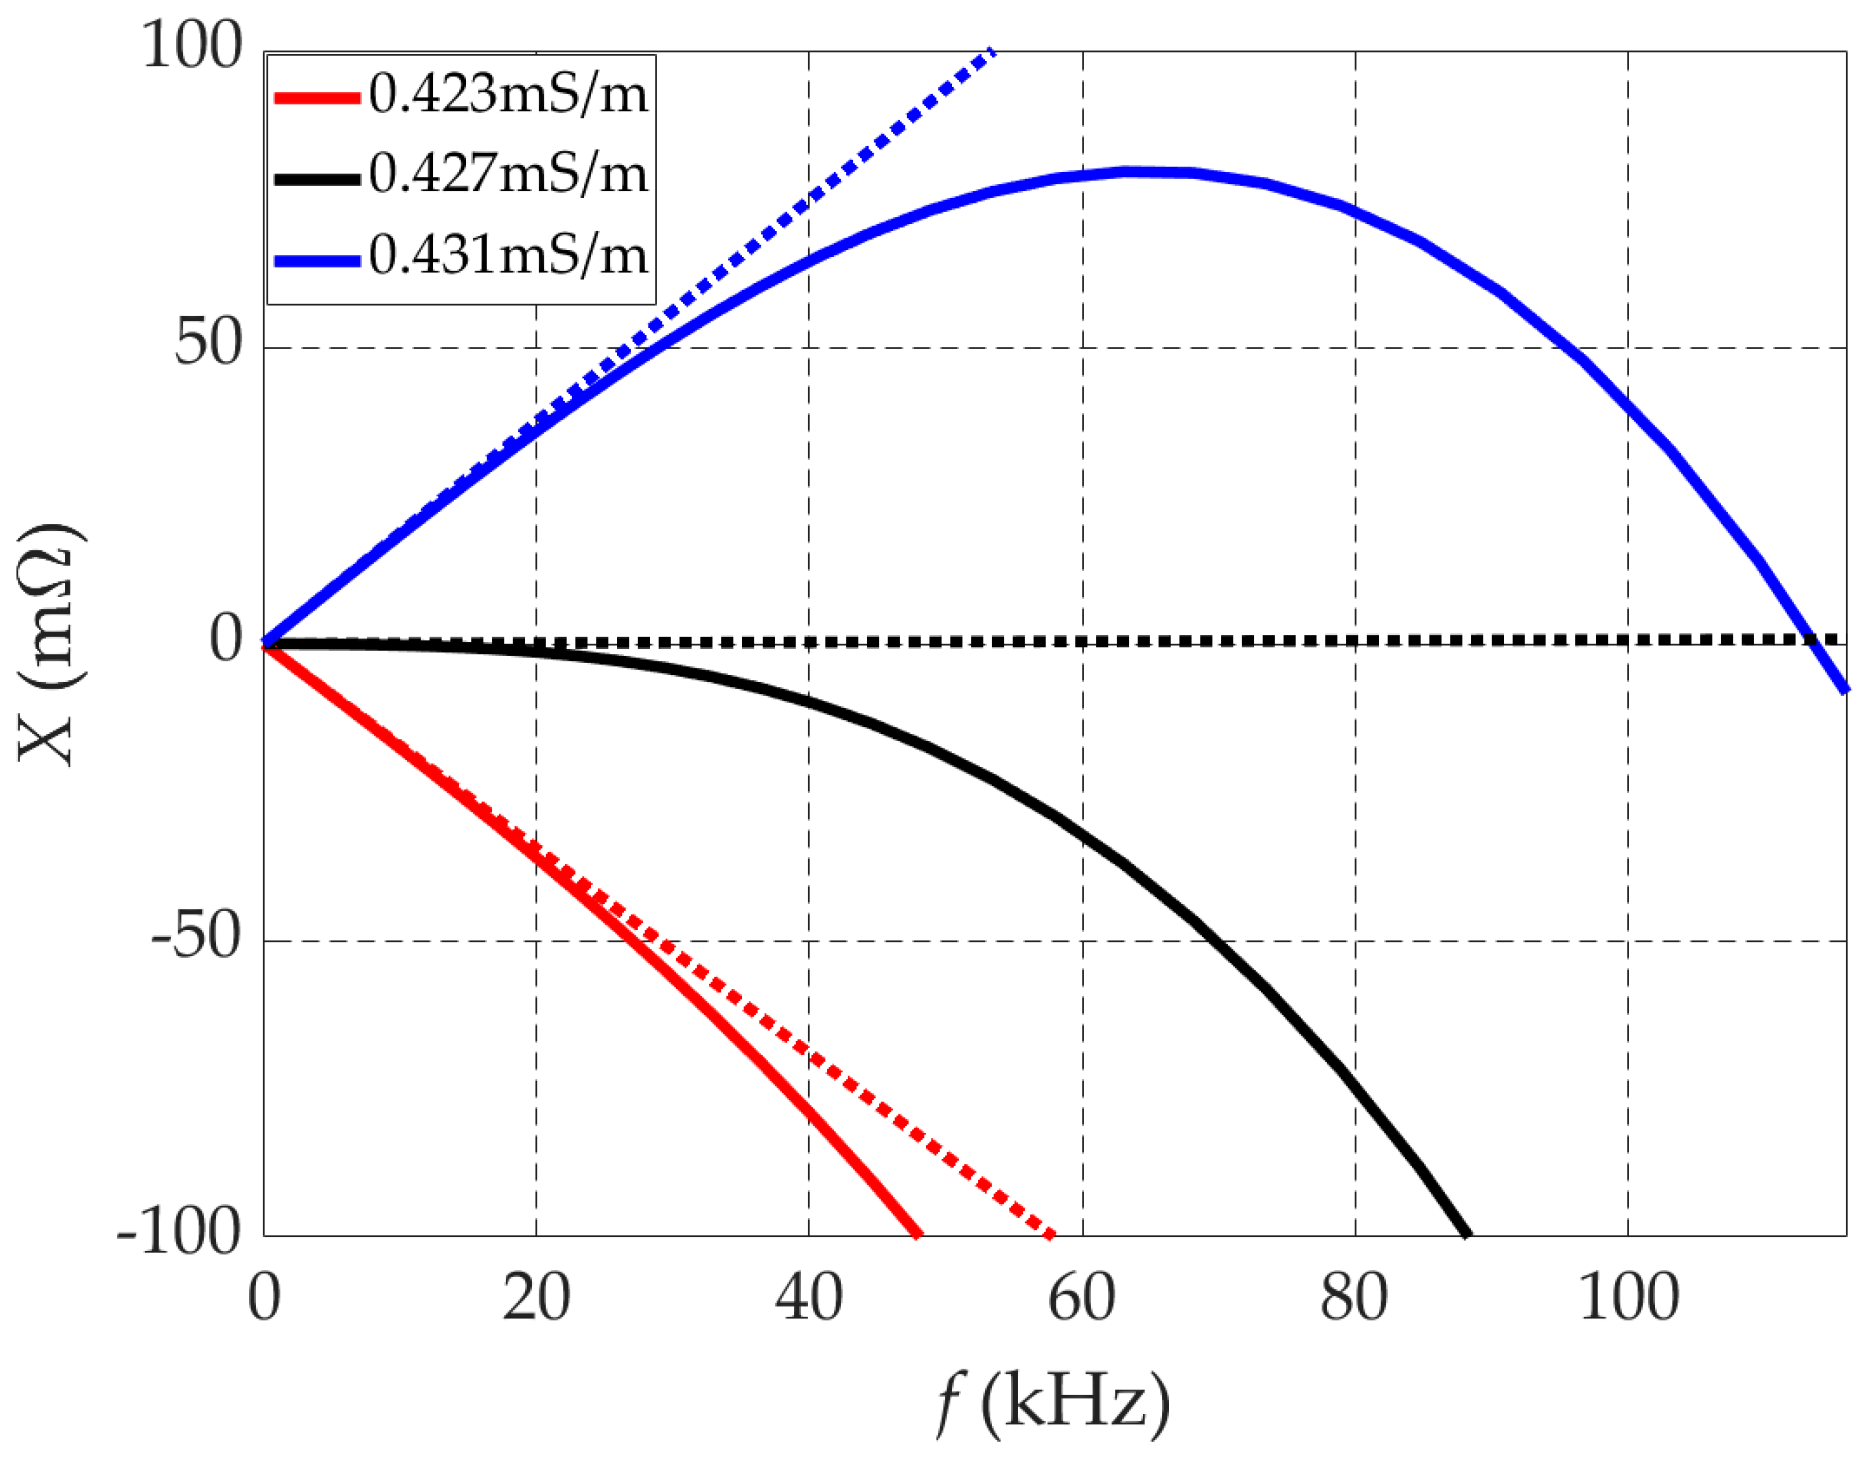
For case 1a, the graph in Figure 8 shows a positive, but quasi-zero, reactance across the frequency range under analysis. This behavior (residually inductive) will only change to capacitive at 635 kHz. To further clarify this aspect, we note that the equality a d = ζ can also occur for ε =ε0 in case the ground conductivity is set at σ = 0.427 mS/m. For higher values of σ, the initial behavior is inductive, while for smaller values it is capacitive—see illustrative frequency plots in Figure 10, where the slope of the rectilinear dotted lines is provided by 2 π L d c ( 1 ς / ( a d ) ) . Note also the resonance point at 115 kHz in the blue curve.
According to Figure 8 and Figure 9, for cases 3a and 3b (wet soil), the LF approximation produces large errors above 20 kHz, with reactance values exceeding resistance values above 60 kHz. In both cases, we have η2 << 1 and from (12) we obtain X L F ( ω ) ω L d c . The problem is that the low-frequency electrode inductance is really not equal to its DC value as the LF approximation assumes—remember the L versus f 1/2 curve in Figure 2b, which shows a significant drop in the inductance value for low frequencies, a drop of almost 50% in the 0–100 kHz range.

3.3. High-Frequency Analysis

For high-frequency (HF) regimes, an analytical approximation for the full-wave complex impedance of our electrode system can be easily derived from the result in (5) pertaining to the solitary electrode. All we should do is to multiply the result in (5) by 2, replace rext with d, and, again, replace σ with σ ¯ = σ + j ω ε , yielding the following:
Z ¯ H F ( ω ) = R H F + j X H F 2 × ( 1 + j ) 1 2 π ω μ 0 2 ( σ + j ω ε )   ln ( d a )
Graphs of the real and imaginary parts of the electrode impedance against the frequency in the 0−100 MHz range are presented in Figure 11. While solid lines concern the results from full-wave FEM simulations, the dotted lines concern the analytical HF approximation in (15). As usually, all the impedance curves are expressed in normalized units: R n ( ω ) + j X n ( ω ) = Z ¯ ( ω ) / Z ¯ ( 0 ) , with Z ¯ ( 0 ) = R d c .
Considering the electrode geometry being analyzed (d/a = 100, a = 1 m), observation of the six cases illustrated in Figure 11 in the extended range 0–100 MHz allows for the following general comments:
Comparing the curves in Figure 11 with the corresponding ones in Figure 7 (0–10 MHz), we see that the capacitive behavior for dry soils does change to inductive but above 10 MHz. Also, for moist and wet soils, the observed steady increase in the inductive reactance does not persist above 10 MHz; at some point, dX/dω turns negative.
As the frequency is progressively increased, the reactance seems to go to zero and the resistance to a constant value. This is particularly visible in the case of dry soils (cases 1a and 1b) where R n ( 1 a ) 0.88 and R n ( 1 b ) 0.28 R n ( 1 a ) / 10 .
Figure 11. Graphical plots of the normalized resistance R(ω) and reactance X(ω) of the grounding system against frequency in the 0–100 MHz range. Solid lines identify the FEM numerical results, dotted lines the approximated analytical results in (15), for different combinations of the ground parameters from cases (1a)–(3b).
Energies 17 03206 g011
The accuracy and limits of applicability of the HF approximation in (15) can be assessed by calculating the impedance relative error defined in (16), like in (11), that is,
e Z H F ( ω ) = | Z ¯ H F Z ¯ F E M Z ¯ F E M | × 100 %
The information in Figure 11 was processed to enable the calculation of the impedance error in (16); the corresponding results are depicted in Figure 12 and show the following:
The error naturally decreases with increasing frequency.
Apart from some ripple, Figure 12a and Figure 12b are rather similar, meaning that the high-frequency error seems to depend non-critically on the soil permittivity.
For high frequencies, the error is negligibly small for the case of wet soils, but significantly increases with decreasing soil conductivity. While for moist soils (cases 2a, 2b) the error is smaller than 5% above 20 MHz, for dry soils (cases 1a, 1b), the error exceeds 10% below 40 MHz.
The ripple observed in the curves (1b) and (2b) for ε = 10ε0 can have two causes. It can be numerical, related to the discretization of the FEM mesh (not very likely, as we carefully tuned the mesh according to the depth of penetration of the field into the soil), or it can be factual, denoting that the impedance value oscillates when approaching its final value, as happens in softly mismatched transmission-line analysis.
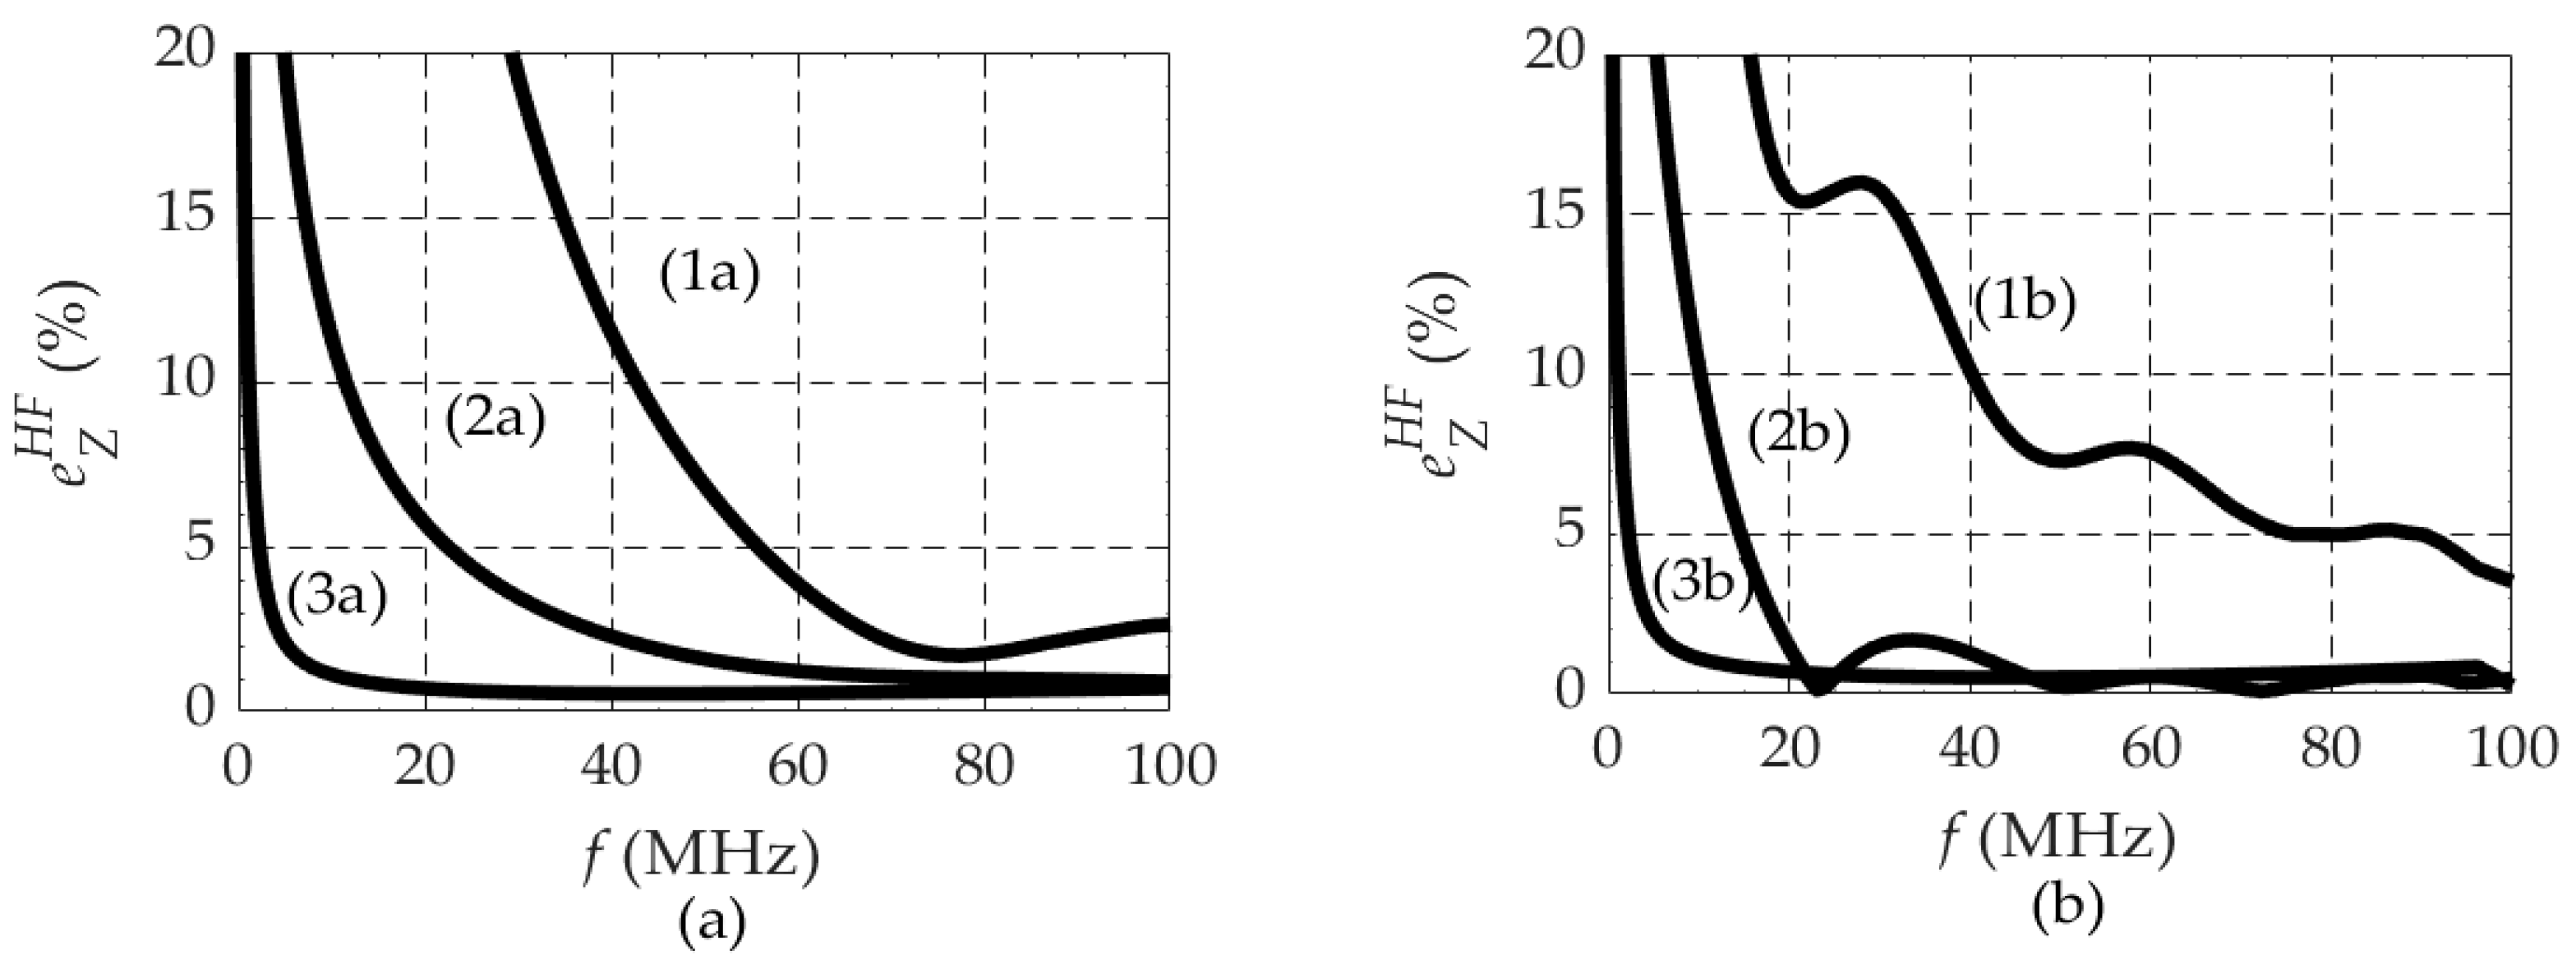
Figure 12. Graphs of the impedance relative error e Z H F ( ω ) incurred when using the high-frequency approximation. (a) For cases 1a, 2a, and 3a with ε = ε0. (b) For cases 1b, 2b, and 3b with ε = 10ε0.
Energies 17 03206 g012
The preceding comments concerning Figure 11 and Figure 12 have a simple physical justification.
Let us go back to (15). Instead of characterizing the ground medium by its complex conductivity σ ¯ ( ω ) = σ + j ω ε , we opt here for its complex permittivity ε ¯ ( ω ) = ε j σ / ω , we can then rewrite (15) simply as follows:
Z ¯ H F ( ω ) = R H F + j X H F = 1 π μ 0 ε ¯ ( ω )   ln ( d a )
This curious result is remarkable. It tells us that the high-frequency impedance of a pair of hemispherical electrodes of radius a, separated from d, can be calculated in the same way as one would calculate the input impedance of an infinitely long two-wire transmission line immersed in an unbounded medium with dielectric losses.
For very high frequencies, the result in (17) can be further simplified by considering that the imaginary part of ε ¯ is negligible. Using the approximation ( 1 x ) 1 / 2 1 + x / 2 , we find the following:
{ Z ¯ H F ( ω ) ( 1 + j σ 2 ω ε )   R   R = Z ¯ H F ( ) = 1 π μ 0 ε   ln ( d a ) { 553   Ω     ( ε = ε 0 )     175   Ω     ( ε = 10 ε 0 )
We see from (18) that, for very high frequencies, the impedance lies in the 1st octant; the grounding system cannot exhibit capacitive behavior. The behavior is slightly inductive, tending in the limit ω to be purely resistive Z ¯ H F ( ) = R .

4. Parametric Analysis in the Complex Plane

We saw in Section 3 that the complex impedance Z ¯ ( ω ) of the electrode system is purely real for ω 0 and for ω , that is,
Z ¯ ( ω ) = R + j 0 ,   { R = R d c 1 π a σ   ,     for   ω = 0 R = R 1 π μ 0 ε   ln ( d a )   ,     for   ω =
In other words: when the complex function Z ¯ ( ω ) is plotted in the complex plane using ω as a variable parameter, the locus of the trajectory begins and ends at points located on the real axis.
We also saw, for low frequencies, that the reactance—which begins at zero—can either evolve positively or negatively. In any case, as ω keeps increasing towards the high-frequency region, the reactance will become positive before it finally dies down to zero monotonously.
Therefore, some resonance situations are expected to occur when the frequency is varied from zero to infinity. The behavior of the electrode system will oscillate a number of times from inductive (positive reactance) to capacitive (negative reactance), or vice versa.
Since the electrode grounding system is physically causal, the real and imaginary parts of the analytic complex function Z ¯ ( ω ) must be interdependent. For increasing values of ω, the succession of resonance episodes along the trajectory of Z ¯ ( ω ) on the complex plane will certainly depend on the coordinates of the beginning and ending points ( R d c , 0 ) and ( R , 0 ) , respectively. In the present section, we attempt to clarify this issue.
Simulations results for three distinct possibilities are presented.
The first considers the usual case where the beginning point of the trajectory is located to the left of the ending point ( R d c <   R ) , the second considers the reverse case ( R <   R d c ) , and the third possibility considers a closed trajectory, with the two points coincident ( R d c =   R ) . The examples that follow refer to the electrode geometry in Figure 6, with a = 1 m and d = 100a. For all the examples, the average value of the pair of resistances R d c and R is kept unchanged (= 200 Ω). For each example, a specific combination of the soil parameters σ and ε is needed, their values being calculated by resorting to (19):
Example   ( a ) :   R d c =   100   Ω   ,   R =   300   Ω     ( σ =   3.18   mS / m   ,     ε / ε 0 = 3.39 )
Example   ( b ) :   R d c =   300   Ω   ,   R =   100   Ω     ( σ =   1.06   mS / m   ,     ε / ε 0 = 30.5 )
Example   ( c ) :   R d c =   200   Ω   ,   R =   200   Ω     ( σ =   1.59   mS / m   ,     ε / ε 0 = 7.63 )
The clockwise-oriented trajectories of the impedance Z ¯ ( ω ) in the complex plane are shown in Figure 13. The arrows indicate ascending values of frequency, and the circles identify the particular point f = 10 MHz (limit of interest for lightning studies).
We may parenthetically note that complex diagrams such as these (sometimes improperly called ‘Nyquist plots’) are increasingly being used as an auxiliary tool in grounding studies [7,8].
The diagram in Figure 13a is a deformed semi-circumference, where the variations in the resistance and reactance are approximately related by Δ X Δ R / 2 ; the impedance behavior is initially inductive (η = 0.25 < 1) and remains inductive.
The diagram in Figure 13b is also a deformed semi-circumference, where the variations in the resistance and reactance are approximately related by Δ X Δ R / 2 ; the impedance behavior is initially capacitive (η = 2.22 > 1); however, before the 10 MHz mark, the trajectory crosses the real axis (resonance) and the impedance turns slightly inductive and ends resistive.
The diagram in Figure 13c is a deformed circumference, where the variations in the resistance and reactance are approximately equal Δ X Δ R ; the impedance behavior is initially inductive (η = 0.74 < 1), then the trajectory crosses the real axis (resonance) and the impedance turns capacitive; again the trajectory crosses the real axis (resonance) and the impedance turns inductive and progresses towards resistive.

5. Discussion and Conclusions

This third paper, on hemispherical grounding electrodes, is the last contribution of the authors to Energies’ Special Issue on Electromagnetic Field Computation for Electrical Engineering Devices.
The first paper was dedicated to the DC and AC analysis of the solitary hemispherical electrode. In it, we theoretically proved the existence of an azimuthal magnetic field in the ground and the need to include the electrode inductance in the analysis of the grounding impedance. Moreover, we also observed that the solitary electrode was in fact an abstraction, as the electrode inductance would grow to infinity when the remote earth was moved further and further away from the center.
Obtaining realistic (finite) values for the grounding impedance would require the presence of two electrodes, one for the injected current and one for the return current.
Thus, the second paper was dedicated to the frequency-domain analysis of a grounding system in which the return current was collected by a second hollow hemisphere concentric with the internal hemispherical electrode. Results were computed numerically using finite element method software for axisymmetric geometries, especially adapted to azimuthal magnetic fields, and considering the simplifying approximation of quasi-stationary fields, that is, assuming that the ground currents were basically conduction currents. With this approach, we found that the grounding impedance had a frequency dependence similar to that observed in typical skin-effect problems, i.e., an inductive type of behavior, with the resistance and reactance increasing with the square root of the frequency, tending towards each other as the frequency increased.
Although we were sure that soils dominated by conduction currents would lead to inductive grounding impedances, we were also aware of reports on the capacitive behavior of grounding electrodes.
Thus, in this third paper, we abandoned the simplifying quasi-stationary approximation. We adopted a full-wave approach, replacing the real ground conductivity with a complex ground conductivity σ ¯ = σ + j ω ε , explicitly enabling the consideration of displacement current effects. In addition, we also chose a more realistic geometry for the grounding system: a set of two identical hemispherical electrodes of radius a, separated by a distance d, as in Figure 6.
Simulation experiments were performed utilizing various combinations of the constitutive ground parameters σ and ε. Computation results regarding the frequency-dependent impedance, resistance, and reactance of the electrode grounding system were obtained for the extend range 0 to 100 MHz.
Numerical results were checked and interpreted with the help of physically based theoretical approximations, one valid for the low-frequency range and another for the high-frequency range. The following conclusions stand out:
For extreme frequencies (zero and infinite), the impedance is purely real:
Z ¯ | ω = 0 = R d c 1 / ( π a σ )   ,       Z ¯ | ω = = R 1 π μ 0 / ε   ln ( d / a )
For very low frequencies, the grounding reactance increases linearly with the frequency:
X ( ω ) ω ( L d c R d c 2 C d c ) = ω R d c ( τ L τ C )
and, consequently, the initial behavior of the system can be inductive, resistive, or capacitive, depending on the geometry (a, d) and on the ground parameters ( σ , ε , μ 0 ) , i.e.,
Initial   behavior   { Inductive   if :     a d > ζ   Resistive   if :     a d = ζ     Capacitive   if :     a d < ζ   ,     with   ζ = ε σ 2 μ 0 ln ( 4 / e )
For very high frequencies, the grounding reactance is slightly positive (inductive behavior), decreasing to zero with 1/ω:
X ( ω )   R   σ / ( 2 ω ε )
In the 0–10 MHz range, the behavior of the grounding system can change state a few times. If the initial behavior is inductive ( τ L > τ C ) , an even number of resonance points is expected, typically 0 or 2. If the initial behavior is capacitive ( τ C > τ L ) , an odd number of resonance points is expected, typically 1.
The authors believe that the frequency behavior of the complex impedance of the hemispherical grounding system reported in this work is not a particularity of hemispherical electrodes. This behavior, a consequence of the combination of two interacting phenomena, magnetic induction and displacement currents, should occur regardless of the shape of the electrodes. Therefore, analyses similar to the one presented here—but for other geometries, such as cylindrical rods or elongated ellipsoids—could be a topic of future interest. Even more important is the future development of reliable algorithms capable of solving the inverse problem of the one solved here. In this work, we evaluated the complex values of the grounding impedance R(ω) + jX(ω) based on enforced soil parameters (σ, ε, and μ = μ0); future work shall focus on the accurate extraction of frequency-dependent values of soil conductivity and permittivity, based on measured/calculated values of R and X, using a soil model that takes into account the simultaneous presence of inductive and capacitive effects.

Author Contributions

Conceptualization, J.B.F.; methodology, J.B.F. and V.M.M.; software, J.P.F.; validation, J.B.F., J.P.F., V.M.M. and M.E.P.; formal analysis, J.B.F., J.P.F., V.M.M. and M.E.P.; investigation, J.B.F., J.P.F., V.M.M. and M.E.P.; writing—original draft preparation, J.B.F.; writing—review and editing, J.B.F.; visualization, J.P.F. and M.E.P.; supervision, J.B.F.; project administration, J.B.F. All authors have read and agreed to the published version of the manuscript.

Funding

This work was supported by FCT—Fundação para a Ciência e Tecnologia, and when applicable co-funded by EU funds, through the Instituto de Telecomunicações, project UIDB/50008/ 2020; through IDMEC, under LAETA, project UIDB/50022/2022, as well as under the research grant UIDB/151091/2021; and through INESC-ID, project UIDB/50021/2020.

Data Availability Statement

Data are contained within the article.

Conflicts of Interest

The authors declare no conflicts of interest.

Appendix A. Capacitance of an Ellipsoid

Consider an ellipse with center at the origin of coordinates, with semiaxes a and b, with a b , whose foci are at a distance a 2 b 2 from the center. The linear eccentricity χ of the ellipse, defined as,
χ = a 2 b 2 a
can vary between 0 and 1. It is 0 when b = a, it is 1 when b / a   0 .
The rotation of the ellipse around its major axis (of length 2a) defines an ellipsoid of revolution, or better saying, a prolate spheroid.
If the spheroid is an electrostatically charged conductor, it will give rise to a potential function obeying the Laplace equation, whose solution can be found by employing elliptic integrals and/or hypergeometric functions, [22,23]. The equipotential surfaces are also spheroids, the orthogonal electric field lines being hyperboles.
The electrostatic capacitance of a prolate spheroid is given by, [22,23],
C = 8 π ε a 2 b 2 ln ( a + a 2 b 2 a a 2 b 2 )
which, using the eccentricity parameter in (A1), can be rewritten compactly as:
C = 4 π ε a χ ln 1 + χ 1 χ
Particularizing the result in (A3) for the limit cases of a sphere ( a = b ,   χ = 0 ) and of a needle or elongated ellipsoid ( a > > b ,   χ 1 ) leads to:
Sphere :     C = 4 π a ε
Needle :     C = 4 π a ε ln ( 2 a / b )
Dividing by 2 the result in (A4) yields the well-known dc capacitance of the hemisphere in (1). In the same manner, divided by 2, the result in (A5) can be used for analyzing elongated hemi-ellipsoidal grounding electrodes; the less-known dc capacitance and resistance of such electrodes are then calculated as:
Hemi - needle :   C = 2 π a ε ln ( 2 a / b )   , R =   ε σ C =   ln ( 2 a / b ) 2 π a σ .  

References

  1. Grcev, L.D. Modeling of grounding electrodes under lightning currents. IEEE Trans. Electromagn. Compat. 2009, 51, 559–571. [Google Scholar] [CrossRef]
  2. Grcev, L. High frequency grounding. In Lightning Protection; Cooray, V., Ed.; IET: London, UK, 2010; Chapter 10; pp. 503–529. [Google Scholar]
  3. Visacro, S.; Alipio, R.; Vale, M.H.; Pereira, C. The response of grounding electrodes to lightning currents: The effect of frequency dependent soil resistivity and permittivity. IEEE Trans. Electromagn. Compat. 2011, 53, 401–406. [Google Scholar] [CrossRef]
  4. Grcev, L.D.; Kuhar, A.; Arnautovski-Toseva, V.; Markovski, B. Evaluation of high-frequency circuit models for horizontal and vertical grounding electrodes. IEEE Trans. Power Del. 2018, 33, 3065–3074. [Google Scholar] [CrossRef]
  5. Salarieh, B.; Silva, J.H.M.; Kordi, B. Wideband EMT- compatible model for grounding electrodes buried in frequency dependent soil. In Proceedings of the International Conference on Power Systems Transients (IPST2019), Perpignan, France, 17–20 June 2019. [Google Scholar]
  6. Salarieh, B.; Silva, J.H.M.; Kordi, B. Electromagnetic transient modeling of grounding electrodes buried in frequency dependent soil with variable water content. Electr. Power Syst. Res. 2020, 189, 106595. [Google Scholar] [CrossRef]
  7. Sherif, O.; Robson, S.; Harid, N.; Thorpe, D.; Haddad, A. On the behavior of vertical ground electrodes under high frequency currents. In Proceedings of the 2022 International Conference on Advanced Electrical Engineering, Constantine, Algeria, 29–31 October 2022. [Google Scholar] [CrossRef]
  8. Azevedo, W.M.; Araujo, A.J.; Filho, J.P. On the transient behaviour of vertical grounding electrodes buried in soils with frequency-dependent electrical parameters. In Proceedings of the 2023 International Conference on Industry Applications, Sao Paulo, Brazil, 22–24 November 2023. [Google Scholar] [CrossRef]
  9. Visacro, S.; Alipio, R. Frequency dependence of soil parameters: Experimental results, predicting formula and influence on the lightning response of grounding electrodes. IEEE Trans. Power Del. 2012, 27, 927–935. [Google Scholar] [CrossRef]
  10. Cavka, D.; Mora, N.; Rachidi, F. A comparison of frequency-dependent soil models: Application to the analysis of grounding systems. IEEE Trans. Electromagn. Compat. 2014, 56, 177–187. [Google Scholar] [CrossRef]
  11. Olsen, R.G.; Grcev, L.D. Analysis of high-frequency grounds: Comparison of theory and experiment. IEEE Trans. Ind. Appl. 2015, 51, 4889–4899. [Google Scholar] [CrossRef]
  12. Sunjerga, A.; Gazzana, D.S.; Poljak, D.; Karami, H.; Sheshyekani, K.; Rubinstein, M.; Rachidi, F. Tower and path-dependent voltage effects on the measurement of grounding impedance for lightning studies. IEEE Trans. Electromagn. Compat. 2019, 61, 409–418. [Google Scholar] [CrossRef]
  13. Datsios, Z.G.; Mikropoulos, P.N.; Staikos, E.T. Methods for field measurement of the frequency-dependent soil electrical properties: Evaluation of electrode arrangements through FEM computations. In Proceedings of the 21st International Symposium on High Voltage Engineering, Budapest, Hungary, 2019; Lecture Notes in Electrical Engineering; Springer: Cham, Switzerland, 2019; Volume 598. [Google Scholar] [CrossRef]
  14. Tan, K.B.; Lu, H.M.; Zhang, Y.; Zuo, W.C. Analysis of the grounding resistance of a hemispheric electrode located on a truncated cone. IEEE Trans. Electromagn. Compat. 2020, 62, 1361–1363. [Google Scholar] [CrossRef]
  15. Sunjerga, A.; Rubinstein, M.; Poljak, D.; Karami, H.; Rachidi, F. Grounding resistance of a hemispheric electrode located on the top of a finite-height, cone-shaped mountain. IEEE Trans. Electromagn. Compat. 2020, 62, 1889–1892. [Google Scholar] [CrossRef]
  16. Faria, J.B.; Pedro, M.E.; Machado, V.M. The complex impedance of the hemispherical ground electrode: An open analytical problem. Energies 2023, 16, 7062. [Google Scholar] [CrossRef]
  17. Machado, V.M.; Fernandes, J.P.; Pedro, M.E.; Faria, J.B. Numerical evaluation of the frequency-dependent impedance of hemispherical ground electrodes through finite element analysis. Energies 2024, 17, 452. [Google Scholar] [CrossRef]
  18. Sunjerga, A.; Rubinstein, M.; Poljak, D.; Despalatovic, M.; Petrovic, G.; Rachidi, F. High-frequency response of a hemispherical grounding electrode. Elect. Power Syst. Res. 2024, 226, 109877. [Google Scholar] [CrossRef]
  19. Faria, J.B.; Machado, V.M. Comments on the high-frequency response of hemispherical grounding electrodes with emphasis on magnetic induction effects. Elect. Power Syst. Res. 2024; submitted for publication. [Google Scholar]
  20. Meera, K.S.; Patro, S.K. Switching and power frequency transients in EHV systems: A review and case study. Power Res. J. CPRI 2014, 10, 1–10. [Google Scholar]
  21. Sun, Q.; Zhang, Z.; Gao, W.; Ding, D.; Ge, Y.; Qu, J. Accurate and rapid 3D full-Maxwell simulations of very fast transients in GIS based on a novel busbar voltage setting method. IEEE Trans. Power Del. 2024; published in early access. [Google Scholar] [CrossRef]
  22. Shumpert, T.H. Capacitance calculations for satellites: Part I. Isolated capacitances of ellipsoidal shapes with comparisons to some other simple bodies. Sens. Simul. Notes 1972, 157, 1–30. [Google Scholar]
  23. Kraniotis, G.V.; Leontaris, G.K. Closed form solution for the surface area, the capacitance and the demagnetizing factors of the ellipsoid. arXiv 2013, arXiv:1306.0509v1. [Google Scholar] [CrossRef]
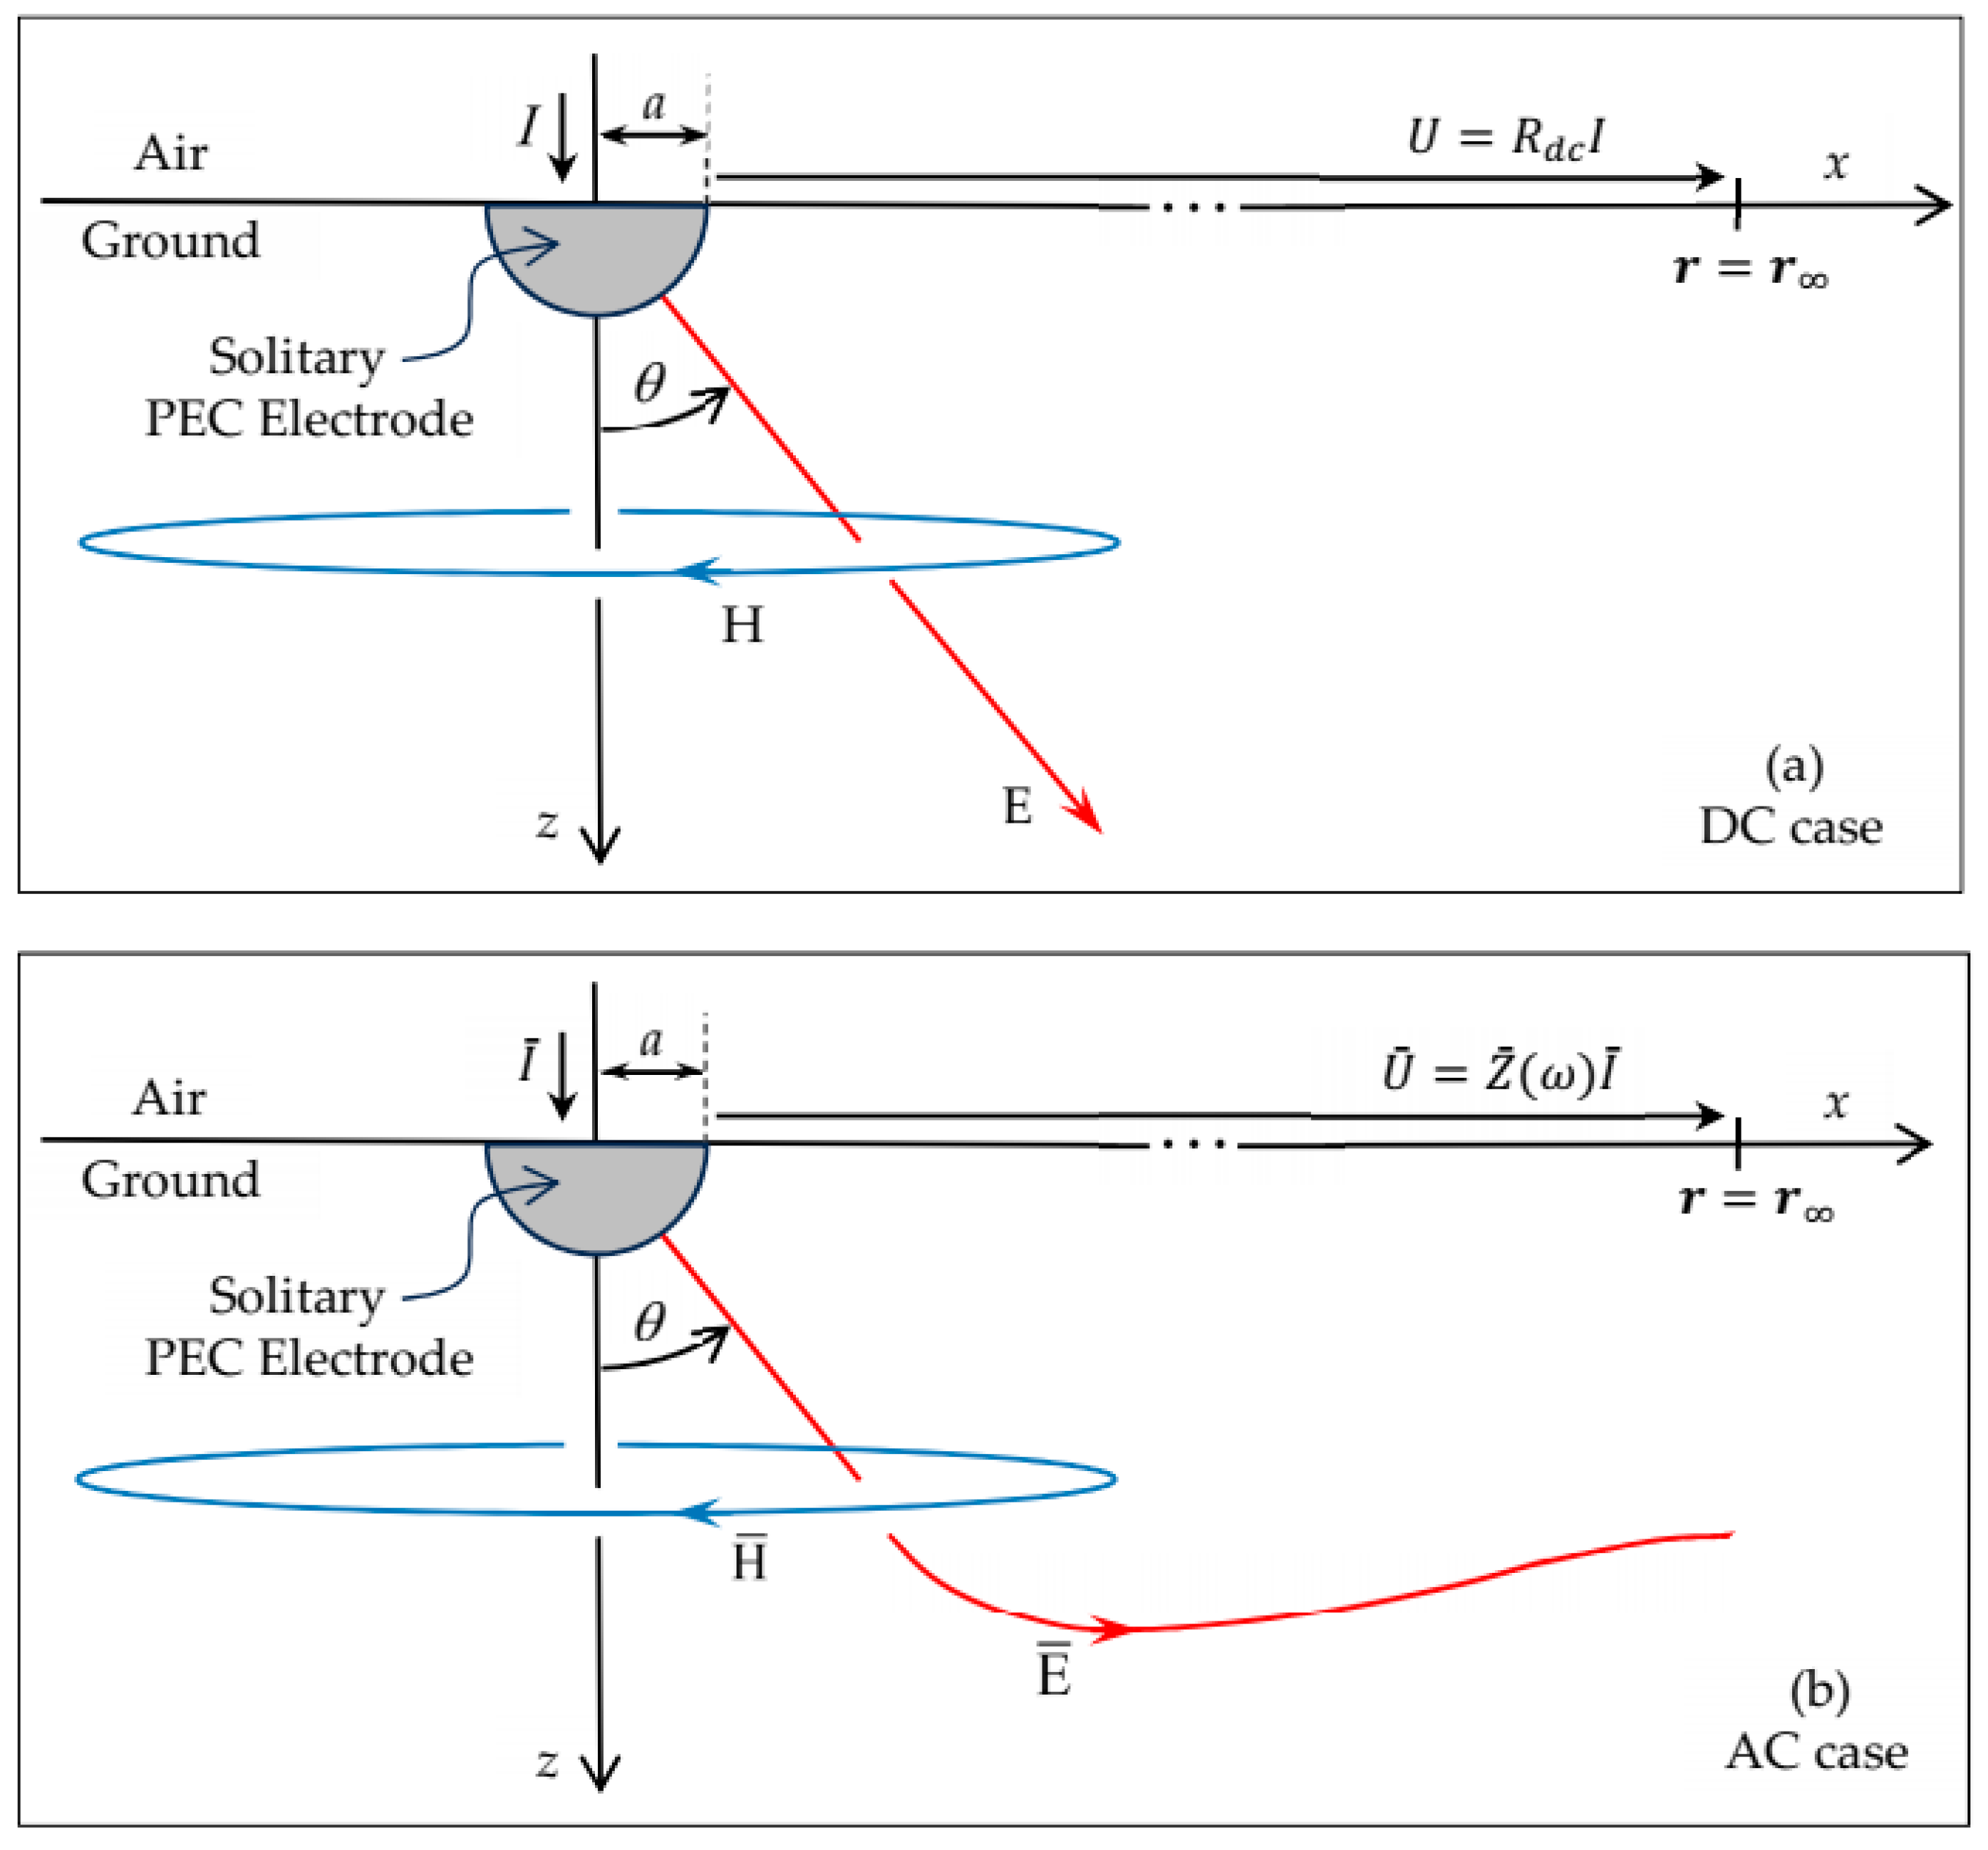
Figure 1. Geometry of the solitary hemispherical electrode with azimuthal magnetic field H. The electrode voltage U is obtained by integrating the E-field along the x-axis (z = 0) from r = a to r = r where the remote electrode is located. (a) In the DC case, the E-field is purely radial and U = Rdc I, where the resistance Rdc is finite. (b) In the AC case, the E-field is not purely radial (a θ -component exists) and U ¯ = Z ¯ ( ω ) I ¯ , where the impedance Z ¯ ( ω ) goes to infinity.
Energies 17 03206 g001
Figure 2. Plots of the normalized electrode inductance L/Ldc. (a) Plot against the ratio rext/a, for the following set of frequencies: 50 Hz, 100 kHz, 1 MHz, and 10 MHz. (b) Plot against the ratio a/δ, for the geometry characterized by rext/a = 100; the four circles identify the points corresponding to the selected frequencies 50 Hz, 100 kHz, 1 MHz, and 10 MHz.
Energies 17 03206 g002
Figure 3. Normalized electrode resistance and reactance as a function of the ratio a/δ, for the case rext = 100 a. The dotted line corresponds to the asymptotic case R(ω) = X(ω) when δ tends to zero (strong skin effect). Note that a/δ = 0.63 corresponds to 10 MHz, for σ = 10 mS/m.
Energies 17 03206 g003
Figure 4. Comparison of quasi-stationary and full-wave results regarding the electrode impedance against the frequency. (a) For the case ε = ε0. (b) For the case ε = 10ε0. On the top: graphs of the normalized real and imaginary parts of the electrode impedance calculated using the full-wave approach (solid lines) and using the quasi-stationary approach (dotted lines). On the bottom: graphs of the impedance error, expressed in percentage, as defined in (6).
Energies 17 03206 g004
Figure 5. Interpretation of the impedance relative error defined in (6). Let Z ¯ F W = Z e j ϕ be the ‘exact’ impedance obtained using the full-wave FEM approach. If the approximated complex impedance vector Z ¯ Q S has its tip inside the shaded circle of radius ρ then the incurred error is smaller than n%.
Energies 17 03206 g005
Figure 6. Grounding system consisting of two identical hemispherical electrodes, with radius a = 1 m, and separation d = 100 a.
Energies 17 03206 g006
Figure 7. Graphical plots of the resistance R(ω) and reactance X(ω) of the electrode grounding system against frequency in the 0–10 MHz range, for different combinations of the ground parameters, cases (1a)–(3a) with ε = ε0, cases (1b)–(3b) with ε = 10ε0. Resistance curves are in black, reactance curves in blue.
Energies 17 03206 g007
Figure 8. Graphical plots of the normalized resistance R(ω) and reactance X(ω) of the grounding system against f in the low-frequency range 0–100 kHz for different combinations of the ground parameters from cases (1a)–(3b). Solid lines identify the FEM numerical results, dotted lines the approximated analytical results in (10).
Energies 17 03206 g008
Figure 10. Graph plots of the grounding reactance for ε = ε 0, considering three neighboring values of the ground conductivity σ = 0.427 mS/m ±   1   % . For σ = 0.427 mS/m (ζ = ad, τC = τL), the initial ω - derivative of the reactance is exactly zero (black curves). For σ = 0.431 mS/m, the derivative is positive (inductive behavior/blue curves). For σ = 0.423 mS/m, the derivative is negative (capacitive behavior/red curves). Solid lines are FEM numerical results of X(ω), dotted lines are approximated results of XLF(ω) from (12).
Energies 17 03206 g010
Figure 13. Impedance trajectories in the complex plane for increasing values of frequency in the range 0–100 MHz. Three possible locations for the beginning and ending points were considered: (a) R d c =   100   Ω = R / 3   . (b) R d c =   300   Ω = 3 R . (c) R d c =   R =   200   Ω   .
Energies 17 03206 g013
Table 1. Grounding system DC parameters.
ε = ε0ε = 10 ε0
σ (mS/m)0.55.0500.55.050
Cdc (pF)28.06280.6
Ldc (μH)15.30
Rdc (Ω)630.363.036.303630.363.036.303
η0.8530.0850.0092.6990.2700.027
Disclaimer/Publisher’s Note: The statements, opinions and data contained in all publications are solely those of the individual author(s) and contributor(s) and not of MDPI and/or the editor(s). MDPI and/or the editor(s) disclaim responsibility for any injury to people or property resulting from any ideas, methods, instructions or products referred to in the content.