1. Introduction
In recent years, powertrain electrification has been proven to be a trustworthy approach to reducing GHG emissions emitted by the road transportation sector. Even if EVs use non-zero-carbon electricity, their massive introduction will contribute to carbon capture. More accessible carbon-capture technologies can be applied to power plants’ exhausts rather than vehicles’ tailpipes. As per the prediction [
1], EV sales have been rapidly growing worldwide in recent years, as shown in
Figure 1 [
2], driven by advancements in battery technologies, a shift toward cleaner energy sources, and fuel cost advantages of EVs [
3].
However, the transition to a fully electric transportation system faces many hindrances, including but not limited to the availability and mining of many rare-earth minerals necessary to build batteries with current technologies (i.e., Li, Co, etc.) [
4], the energy mix used to generate electricity [
5], the environmental impact of battery production and disposal [
6,
7], limited driving range [
8], lack of reliable charging facility [
9], limited lifespan and high battery replacement cost [
10,
11], and reduced payload capacity for electric trucks [
12,
13]. Achieving true sustainability through electrified transportation requires addressing these challenges.
Addressing the limited driving range and early battery fading through state-of-the-art technology is of the utmost priority since these concerns are intertwined with prospective EV buyers’ socioeconomic and psychological behavior. Typically, most original equipment manufacturers (OEMs) offer a warranty for eight years or 160,000 km on the battery life span [
14] (whichever comes first). For most OEMs, the warranty provides cover if and only if the battery operates within 70–80% of its original storage capacity or 70% of its original power capability [
15].
Since battery replacement cost is a significant expense, and since this expense still creates a substantial barrier to customer acceptance, OEMs and academia have been tirelessly working on developing innovative energy management strategies [
16,
17] and powertrain architectures [
18] to decelerate the process of battery health degradation. Battery state of health (SOH) is negatively influenced by several factors [
19], such as abusive driving patterns [
20], extreme weather conditions [
21], and irregular charging patterns [
22], because the battery is the sole energy provider to all the noteworthy energy-consuming systems, such as (a) propulsion system, (b) HVAC system (up to 35%), and (c) steering and braking system (up to 5%), in an EV [
23]. Unlike HEVs, where the energy management system (EMS) can split the combined power demand into two onboard power sources, i.e., ICE and battery, the EMS in an EV must delegate the entire combined power request to the battery [
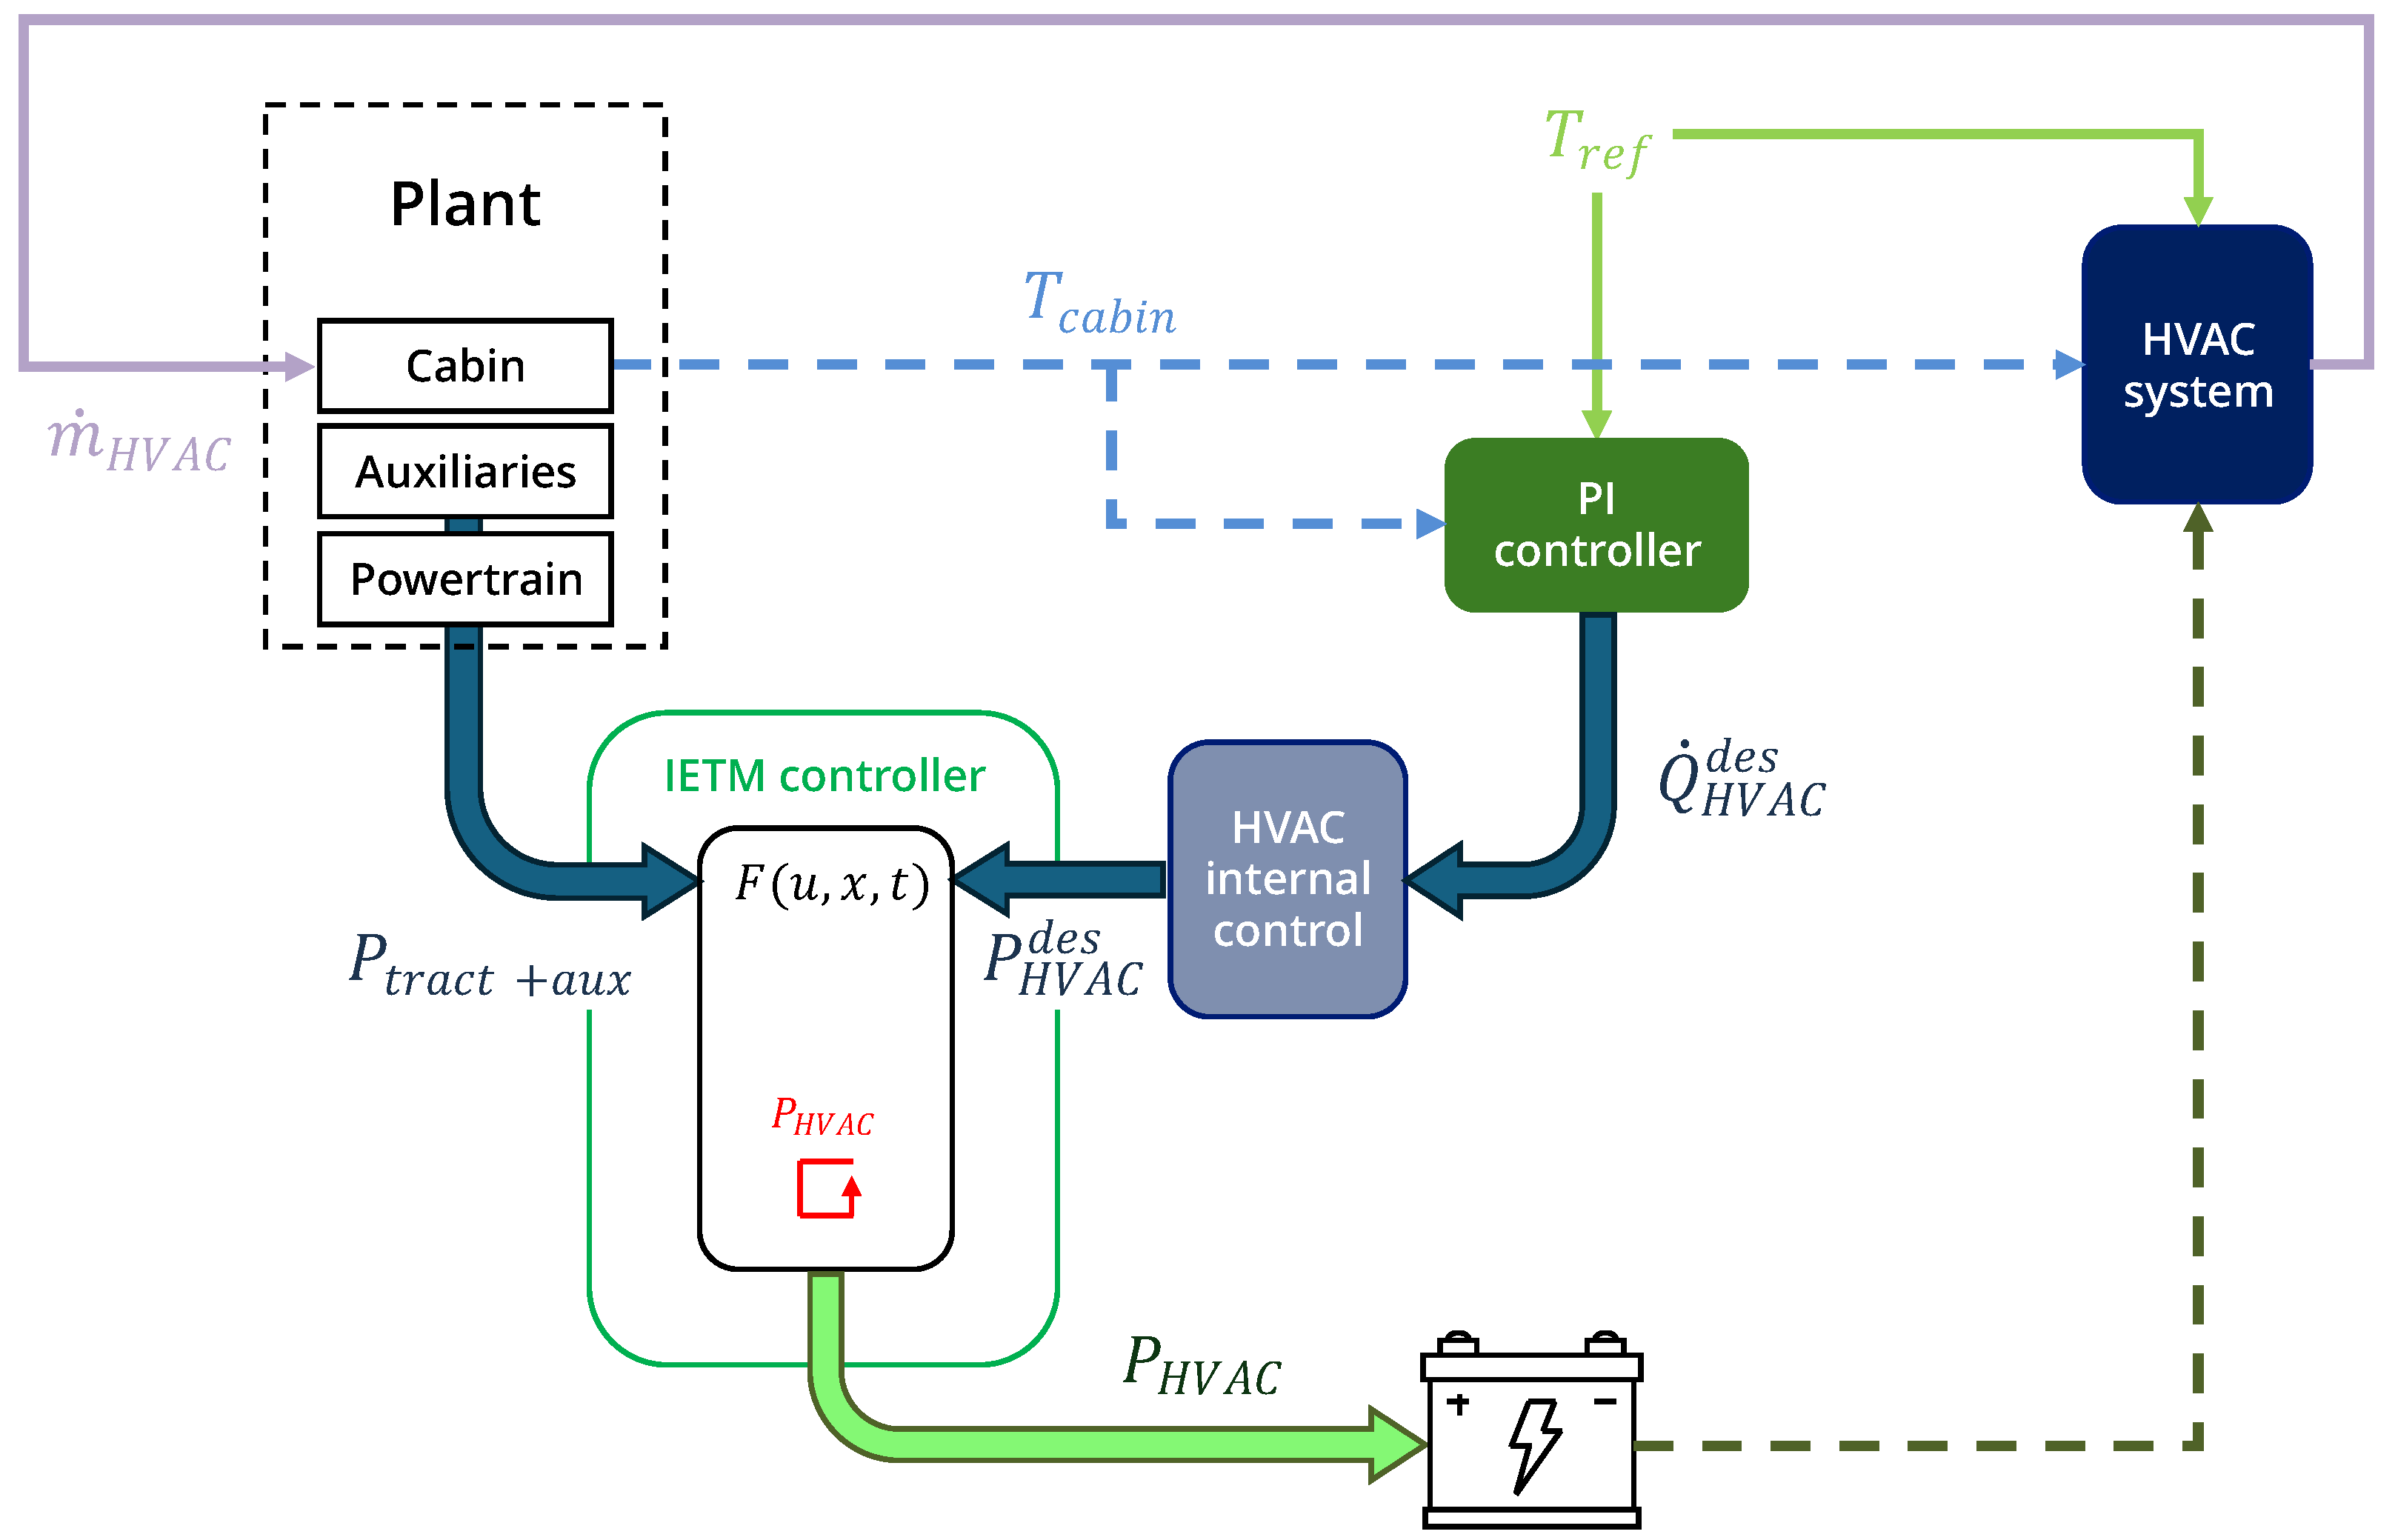
24]. Notably, vehicle manufacturers have the least control over driving style and weather. However, they have complete control over the EMS strategies and algorithms, which decide whether to fully respect the power request from the powertrain, HVAC, and battery thermal system [
25,
26]. EMSs mostly respect the power requested by the powertrain. Still, it may only sometimes respect the power demand from other systems, such as HVAC and battery thermal systems, to reduce the overall load on the battery. With such a feature, EMSs can also be better denoted as integrated energy and thermal management systems (IETMs) since they manage the entire vehicle’s traction and thermal energy consumption in an integrated fashion [
27,
28].
Literature Review
Looking at the necessity of finding an IETM strategy to decelerate the battery’s SOH degradation in an EV, a handful of articles have opted to manage the electrical load on the battery from the HVAC system through an intelligent energy management strategy [
27,
28]. However, the fuel cell EV chosen in [
27] has fewer challenges than a BEV in managing the electrical load on the battery. On another note, the collaborative cabin thermal management problem, presented in [
28], is solved by a real-time speed-prediction-based nonlinear model predictive control (NMPC) but through a high-performance CPU. The real-time implementation of an IETM strategy through a model predictive control (MPC) framework demands additional control-oriented models of the cabin thermodynamics and HVAC system, unlike a typical real-time EMS implementation, on top of control-oriented models of the powertrain dynamics and battery SOH degradation.
The cabin thermal model should be accurate enough to predict the temperature evolution inside the EV’s cabin and computationally cheap enough to be used as a control-oriented model. The literature is full of studies developing various high-fidelity vehicle cabin thermal modeling approaches, such as, but not limited to, AMESim-based [
29], Modelica-based [
30], CFD-based [
31], and coupling of 3D airflow simulation and 1D fluid node-based [
32]. However, such models are computationally expensive and require many parameters to be defined. Lumped-parameter-based models, on the other hand, are a computationally cheap way of modeling vehicle cabin thermal interactions and have emerged as an excellent substitute for high-fidelity thermal models due to their acceptable correlation with measured temperature evolution data [
33] and their conduciveness to real-time controller development [
34].
In a series of consecutive works [
35,
36], the authors recognized that it is possible to reduce the EV’s overall energy consumption if thermal comfort inside the EV’s cabin can be dynamically compromised or adjusted within a permissible range through theoretically optimal control [
35] and real-time rule-based control [
36]. However, both these works focused only on reducing the energy consumption but not on the battery’s SOH degradation. In another series of consecutive works [
37,
38], the authors designed a model predictive climate control (MPCC) strategy to minimize the combined energy usage of the fan, heating, and cooling circuits of the HVAC system [
37] and a traction power-aware MPCC to reduce the battery’s SOH degradation process [
38]. While both works resulted in a real-time implementable control strategy, they required offline pre-calculated look-up tables. MPC leverages the prediction of vehicle load for a short window in the future to dynamically calculate the optimal and permissible deviation in cabin climatic comfort, extending battery lifetime by up to 13.2% and reducing energy consumption by up to 14.4% [
38]. However, the inaccuracy of modeling the cabin thermal system can have a slight impact on the effectiveness of their proposed battery-aware climate control strategy [
39], leading us to believe that a more realistic model of the cabin climate model would be necessary for realistic evaluation of a battery-aware cabin thermal management strategy’s efficacy in improving the energy economy and battery durability. Therefore, lumped-parameter-based cabin thermal models, which are accurate enough to predict realistic cabin temperature evolution, are necessary for developing such a real-time IETM strategy.
Moreover, such studies corroborating the efficacy of battery-aware climate control in decelerating the battery’s SOH degradation should consider the varying SOC vs. open circuit voltage (OCV) relationship with varying battery SOH values. To the best of the knowledge of the authors of this article, varying SOC–OCV relationships have not been included in either traction-aware or battery-aware climate control frameworks for EVs. Moreover, such control frameworks should be validated with realistic cabin thermal plant models.
Looking at the research gaps in the existing literature, such as requiring an accurate enough lumped-parameter cabin temperature evolution model, considering varying SOC vs. OCV relationship with varying battery SOH, and including battery durability improvement as a necessary objective of an ITEM framework, the authors in this article are inspired to present an instantaneous optimization-based framework for the ITEM problem. The article has the following contributions:
It presents an instantaneous optimization framework for IETM without predicting vehicle loads.
It develops an EV plant model incorporating a high-fidelity but real-time-running cabin thermal model and a battery SOH degradation model derived from experimental battery aging data. Since the IETM controller cannot accommodate such a high-fidelity cabin thermal model, an equivalent lumped-parameter model, correlating well with the high-fidelity model, is also created.
The battery SOH degradation model is accompanied by the varying relationships between SOC and OCV corresponding to varying SOH values.
The IETM regulates the actual HVAC power supplied by the battery around the theoretically required HVAC power for maintaining the reference cabin temperature.
The remainder of this paper is organized as follows:
Section 2 describes the longitudinal vehicle dynamics modeling.
Section 3 first delineates the high-fidelity cabin thermal modeling, and then, creates an equivalent lumped-parameter model of the cabin thermal system, which is necessary for the control-oriented model in the IETM.
Section 4 and
Section 5 delve into HVAC modeling and battery capacity degradation modeling, respectively.
Section 6 gives a detailed description of the IETM problem formulation and resolution. The paper delves into the simulation results of the intelligent traction-aware IETM strategy in
Section 7. The concluding remarks are drawn in
Section 8.
2. Forward-Approach EV Modeling
A vehicle plant model is needed to accurately simulate the vehicle’s longitudinal dynamics. The choice fell on a forward-looking vehicle model simulating longitudinal dynamics while following a reference drive schedule with a proportional–integral (PI)-based driver block. Essentially, the driver receives the velocity error between the target speed and the actual vehicle’s speed, as expressed in Equation (
1), as the input, and the driver outputs a traction torque request as the control effort required to minimize the speed error. Before sending it to the actual powertrain, this torque request is processed by the vehicle control unit (VCU), specifically the energy management system (EMS). The traction torque request, which is satisfied by the sole electric motor in the given powertrain architecture, can be calculated as per Equation (
2), and is the basis of calculating the battery power request.
This torque is generated by the electric motor and is transmitted to the drive wheels (
3), where the traction effort is exploited.
The remaining part of the vehicle plant model is based on dynamic equations and efficiency charts related to both electrical (i.e., battery, inverter, electric motor) and mechanical (i.e., electric motor, final drive, wheels) elements involved in the power system. The power is brought to the drive wheels using the traction system, where it releases its final useful effect according to Newton’s second law. The load resulting on the vehicle chassis is given in Equation (
4). This comes from four different contributions, namely: torque delivered to the wheel (Equation (
5)), aerodynamic resistance of the air (Equation (
6)), rolling resistance due to the contact between the tires and road (Equation (
7)), and weight resistance coming from an eventual road inclination (Equation (
8)). Lastly, by writing down the energy balance, including all the rotating masses, one ends up with Equation (
9). For the definitions of all the entries appearing in the formulas reported below, please refer to
Table 1.
where
is the equivalent vehicle mass used in the longitudinal dynamics of the vehicle.
3. Cabin Thermal Modeling
A comprehensive cabin model is necessary to systematically develop and simulate the intended IETM strategy. This model is pivotal for accurately capturing the convoluted dynamics of energy fluxes within the system. This section delineates the key steps essential for constructing a thermodynamic model tailored for automotive cabin environments. Since an automotive cabin operates as an open thermodynamic system, it includes various mass and heat fluxes such as inward and outward air mass flow rates, incoming solar radiation, passengers’ sensible heat, conduction, and a convection heat flux through the cabin’s shell. Each of these listed energy fluxes has been modeled through mathematical expressions coming from the respective physical description of the phenomenon. Notably, while constructing the cabin model, an assumption of dealing with dry air is adopted, neglecting the effect of air humidity.
3.1. Solar Radiation
Solar radiation is a direct incoming heat flux that must be considered, and it can be represented by the heating capacity released per unit area on a flat horizontal surface, i.e.,
. From the theory of electromagnetic waves, it is known that the effective power transferred onto the surface is only the portion carried by the component of the wave transversely impinging, as expressed in Equation (
10). Furthermore, opaque surfaces (e.g., roof) and transparent surfaces (e.g., lateral windows, rear windows, and windshield) have been differentiated while applying the effect of solar radiation.
where
is the effective surface area, 1.6907 m
2, and
is the angle between the impinging radiation and the surface (
). It is unnecessary to account for solar radiation on the lateral doors since its contribution would be negligible as these surfaces are almost vertical. However, for transparent surfaces inside the vehicle cabin, both the radiation transmitted (as per Equation (
11)) and the radiation absorbed in the thickness of the body (as per Equation (
12)) need to be considered. As for the roof, only the portion that is absorbed by the vehicle is considered while modeling.
where
(value =
) and
(value =
) are the windows’ transmissivity and absorptivity, respectively. It is worth mentioning that the radiation absorbed by pieces of the cabin’s shield does not directly affect the energy balance inside the cabin’s volume since it is not transmitted directly inside. However, this portion modifies the thermal state of the cabin’s boundaries, which in turn affects the convection and conduction heat transfer.
3.2. Air Fluxes
The cabin’s energy budget should consider the inward and outward air mass flow rates. The HVAC system regulates the temperature inside the cabin by blowing a controlled air mass () into the cabin. Additionally, a mass flow rate of the cabin’s air is recirculated () and exits the cabin. Finally, there are air leakages () towards the external environment that may occur due to imperfect sealing of the cabin’s shield. All of these contributions have been considered, considering the respective temperatures of the different air fluxes.
3.3. Sensible Heat of Passengers
Various formulas have been proposed in the literature to explain the amount of heat generated inside the cabin due to passengers. These formulas generally correlate the total sensible heat passengers produce with the number of passengers, denoted by
. Equation (
13) presents the formulation adopted in this paper to model sensible heat generation due to passengers [
40]. This formula assumes an average surface area,
(value = 1.8 m
2), and a specific sensible heat,
, for each passenger, expressed in [W/m
2]. This relationship is expressed as follows:
3.4. Conduction and Convection
The cabin shield was divided into four boundary zones, windows, lateral frame, roof, and floor, to account for the impact of convection and conduction heat transfer between the cabin and the external environment. A thermal layer model was created in Simscape
™ for each zone. The convective heat transfer coefficient for the inside was kept constant, while for the outside, a function (Equation (
14)) based on the vehicle’s actual speed was used, as described in reference [
40].
3.5. High-Fidelity Cabin Thermodynamic Model
All contributions to the energy budget that apply to the cabin’s volume were considered using an accurate model implemented in Simulink
® by accessing Simscape
™’s libraries, designed explicitly for gaseous thermodynamic problems. A similar model for the cabin volume of a bus was used as a solid base (as described in reference [
41]) to construct the model. The construction of the model required the creation of two extreme environments by imposing their pressures and temperatures: the cabin environment (using the ‘
Constant Volume Chamber (G)’ block) and the outdoor ambient (using the ‘
Temperature Source (G)’ block). In order to connect these two environments, it was necessary to follow the steps explained below:
Generating the cabin’s shield
Each of the four aforementioned shield zones was modeled with a proper stratigraphy, using technical data from [
42] and the Simscape
™ blocks linked to conduction and convection phenomena (‘
Convective Heat Transfer’, ‘
Conductive Heat Transfer’, and ‘
Thermal Mass’ blocks).
Including external incoming energy contributions
The solar radiation that enters through windows and the solar radiation absorbed by the roof’s outer layer and window glasses are the factors that affect the temperature inside the cabin. To model these factors, the heat flux associated with the internal ambient thread was used for the former and the thermal capacity of the outer layers of material was used for the latter.
Including internal heating capacity generation
The same heat flux block was used to describe the sensible heating power generated by the passengers. This was connected to the cabin’s ambient thread.
Introducing mass exchanges of the cabin’s volume
In this case, the constant mass flow rate block was considered for the air fluxes blown inside and drawn from the cabin (‘Controlled Mass Flow Rate Source (G)’ block). It is possible to introduce a restriction (‘Local Restriction’ block) between the cabin’s volume and the outdoor environment to model the air leakages towards the outdoor environment.
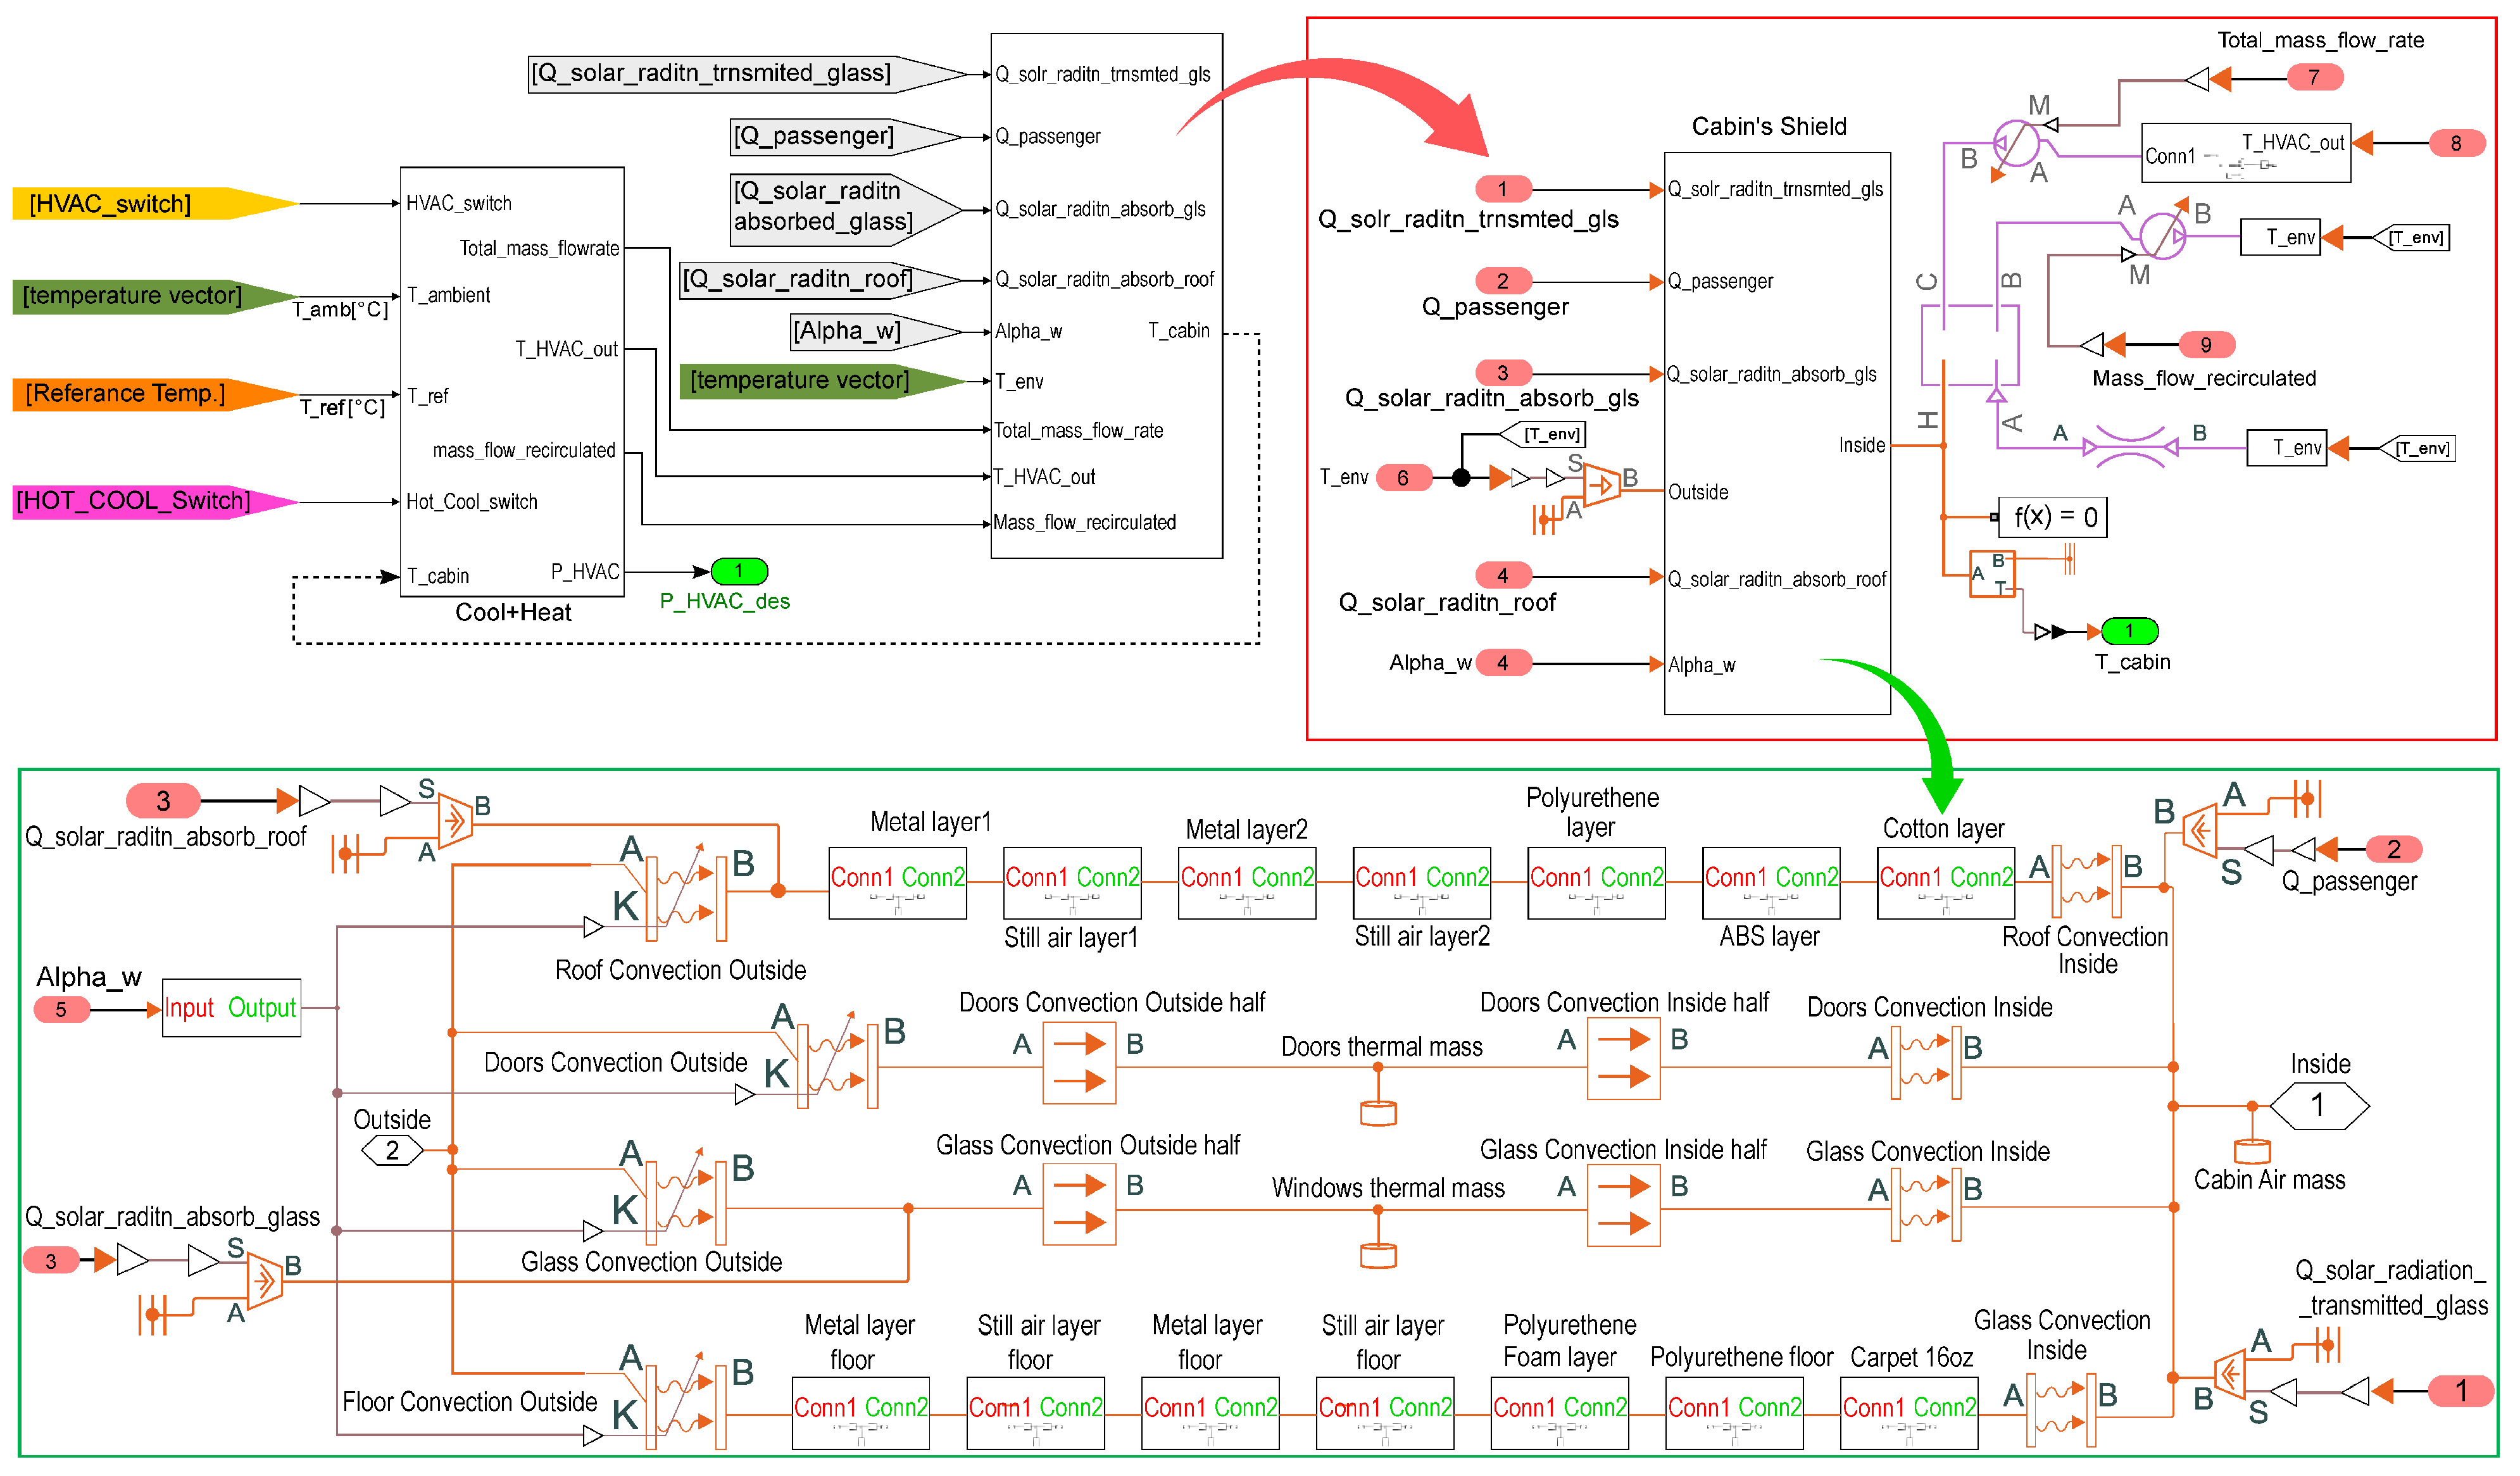
These steps created the high-fidelity model in
Figure 2, which can reasonably grasp the actual cabin thermodynamics. Despite its high reliability, the necessity of exploiting the resolution of partial differential equations to solve the thermodynamic problem at each time step made this model computationally expensive. However, the model’s high accuracy was utilized as the foundation for developing a less computationally intensive model.
3.6. Thermal Comfort Estimation
As per ASHRAE, cabin thermal comfort inside a vehicle’s cabin is a subjective sensation of comfort experienced by the occupants and influenced by the cabin’s air temperature, relative humidity, air speed, and radiant heat [
43]. Because of the vehicle occupants’ proximity to the windows and glass shields, the radiant heat is pivotal in dictating thermal comfort, and radiant heat depends on ambient and cabin interior temperature [
34]. Cabin humidity follows the cabin interior temperature among the remaining factors regarding the rank of importance [
33]. However, only the estimation of cabin interior temperature (
) is prioritized in this paper to retain the simulation’s simplicity and reduce the computational complexity.
3.7. Lumped-Parameter Cabin Thermodynamic Model
Considering the environment enclosed inside the cabin’s shield, one can start from the energy budget coming from the ‘
first law of thermodynamics’, as expressed in Equation (
15), to build a solid foundation for the simpler model. The following formulation considers all the energy contributions explained before.
The two most important assumptions that we brought in to simplify the model so that is lighter and faster are:
Neglecting the cabin shield’s thermal inertia and considering a constant heat transfer coefficient to account for heat transfers through convection and conduction.
Treating the transparent surfaces with a bulk approach.
Assuming a constant air mass inside the cabin.
These three points can lead to an extremely simplified formulation of the thermal problem, expressed by Equations (
16)–(
18).
Thus, upon writing these simplified expressions, one ends up with the following final expression of Equation (
19) deriving from Equation (
15), whose parameters’ meanings can be found in
Table 2.
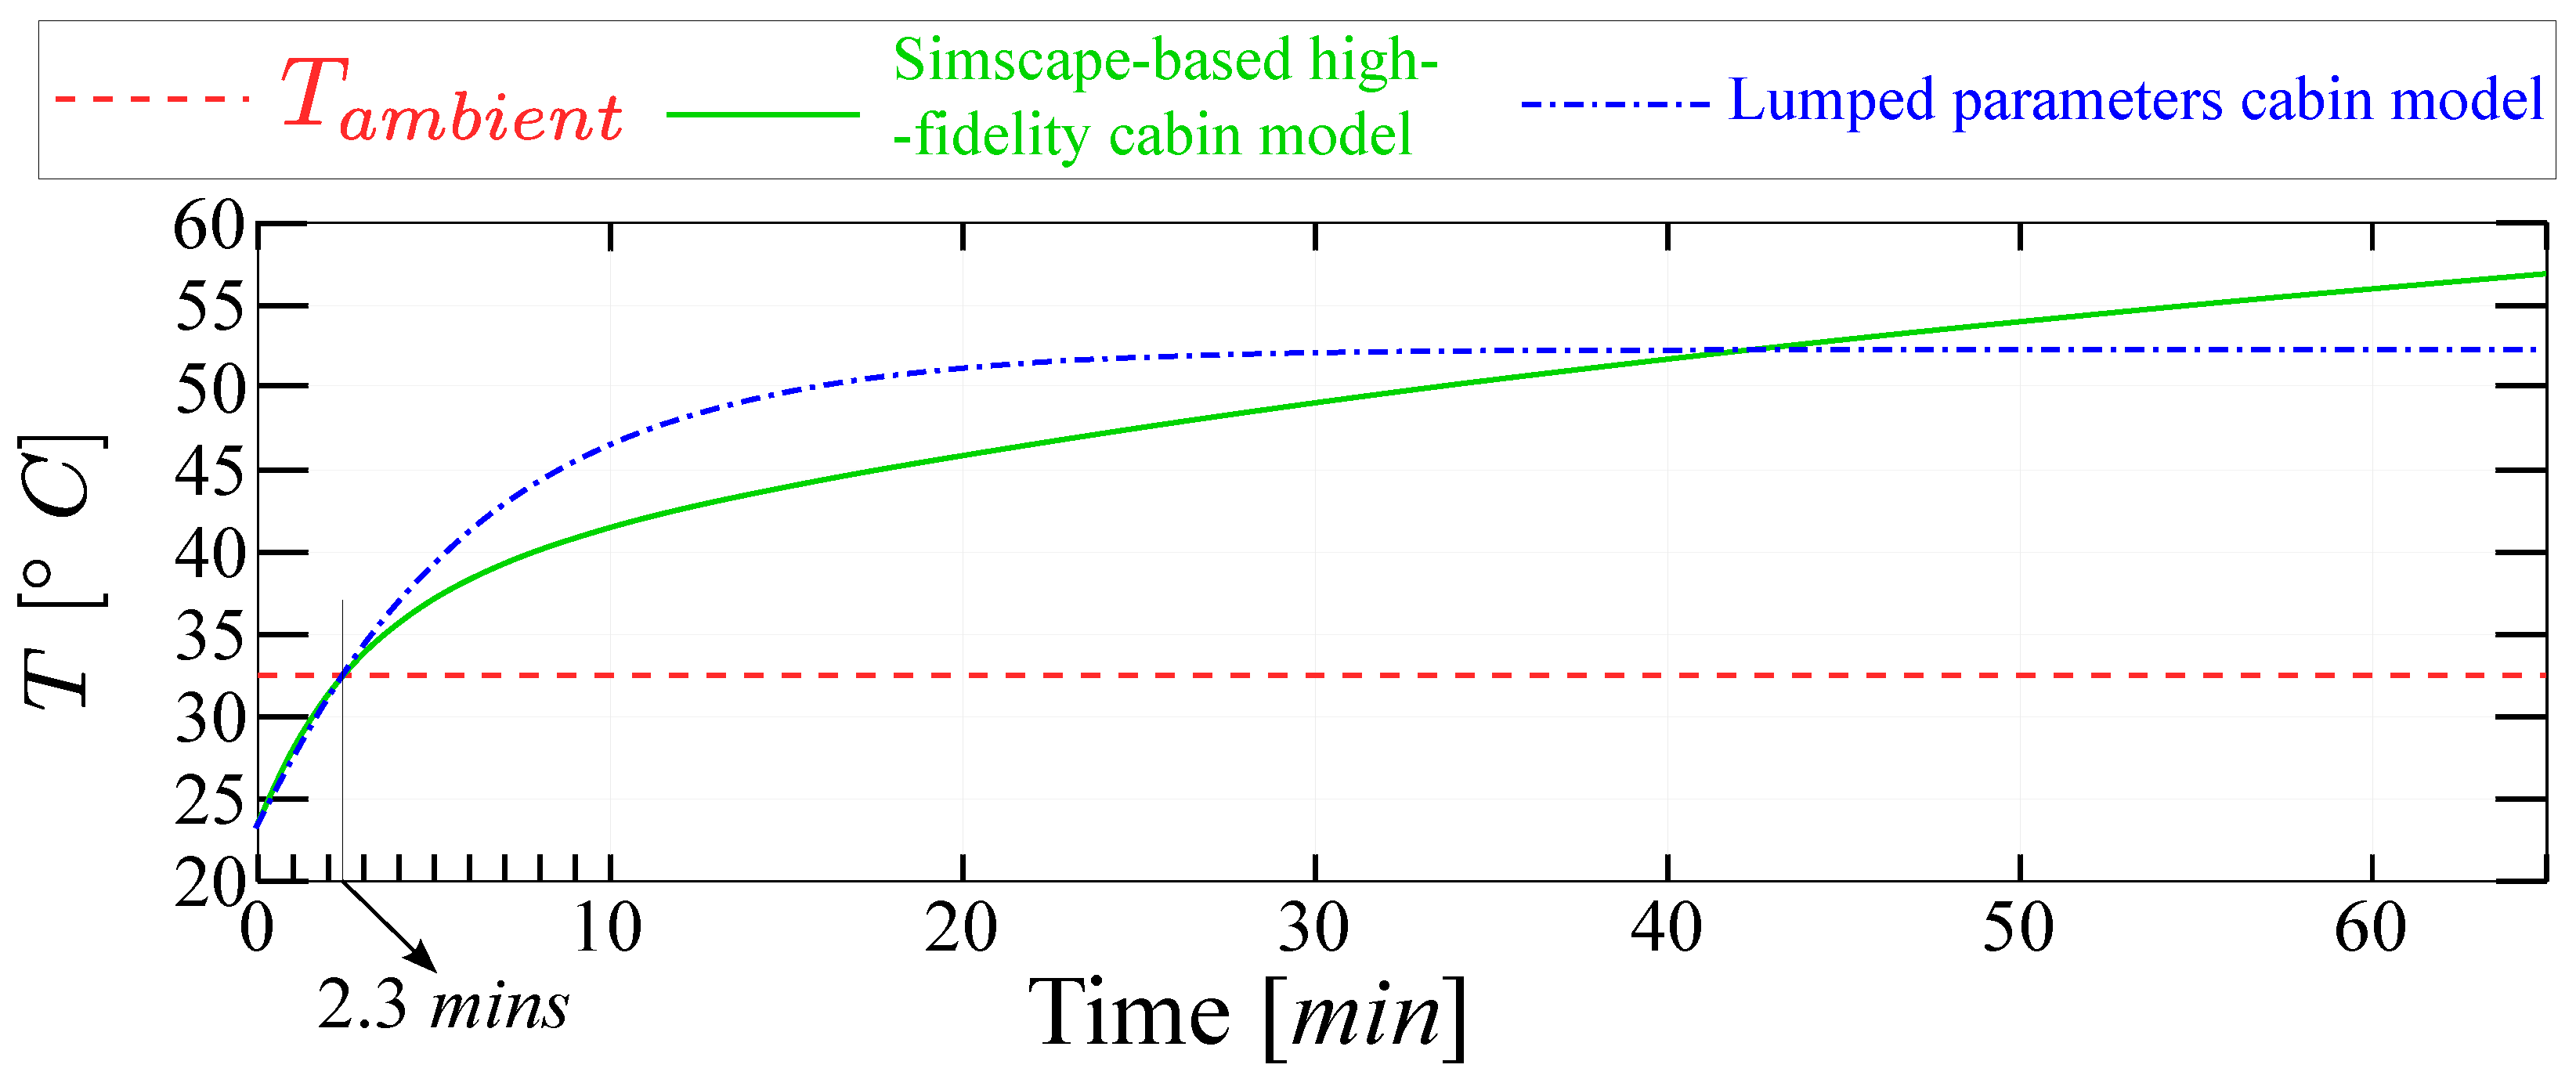
A fine-tuning of these three constants is required to have the best correlation between the temperature evolution of the lumped-parameter cabin thermal model and the high-fidelity Simscape
™ model, as shown in
Figure 3, at least within the temperature range of interest, i.e., hovering between 20 and 30 degrees Celcius. Since the lumped-parameter model correlates very well with the high-fidelity model within the desired temperature range for thermal comfort, the lumped-parameter model can be considered a good substitute for the high-fidelity model.
4. HVAC Modeling
After the cabin’s thermal problem was thoroughly addressed, a model for the HVAC unit, capable of handling the thermal conditions inside the cabin, was implemented. Inspired by [
44], the chosen architecture for the HVAC unit, as reported in
Figure 4, involved two air handling stages executed by two heat pumps: a first stage for cooling and a second stage for heating. The system was modeled using a simplified approach, similar to what had been used in other research [
37,
38], which described the circuit of each heat pump through the coefficient of performance (COP). The design of the HVAC unit proved to be extremely important as it allowed for determining the power required to meet the thermal comfort conditions desired by passengers inside the cabin. By utilizing the psychrometric chart for humid air—although it was assumed that dry air was being dealt with, this was necessary to achieve realistic power consumption figures for the HVAC—the internal control logic of the HVAC system was designed. This ensured that the relative humidity inside the cabin was maintained between 20% and 60% for different reference temperatures, which, according to [
34], is the acceptable range for ensuring passenger comfort.
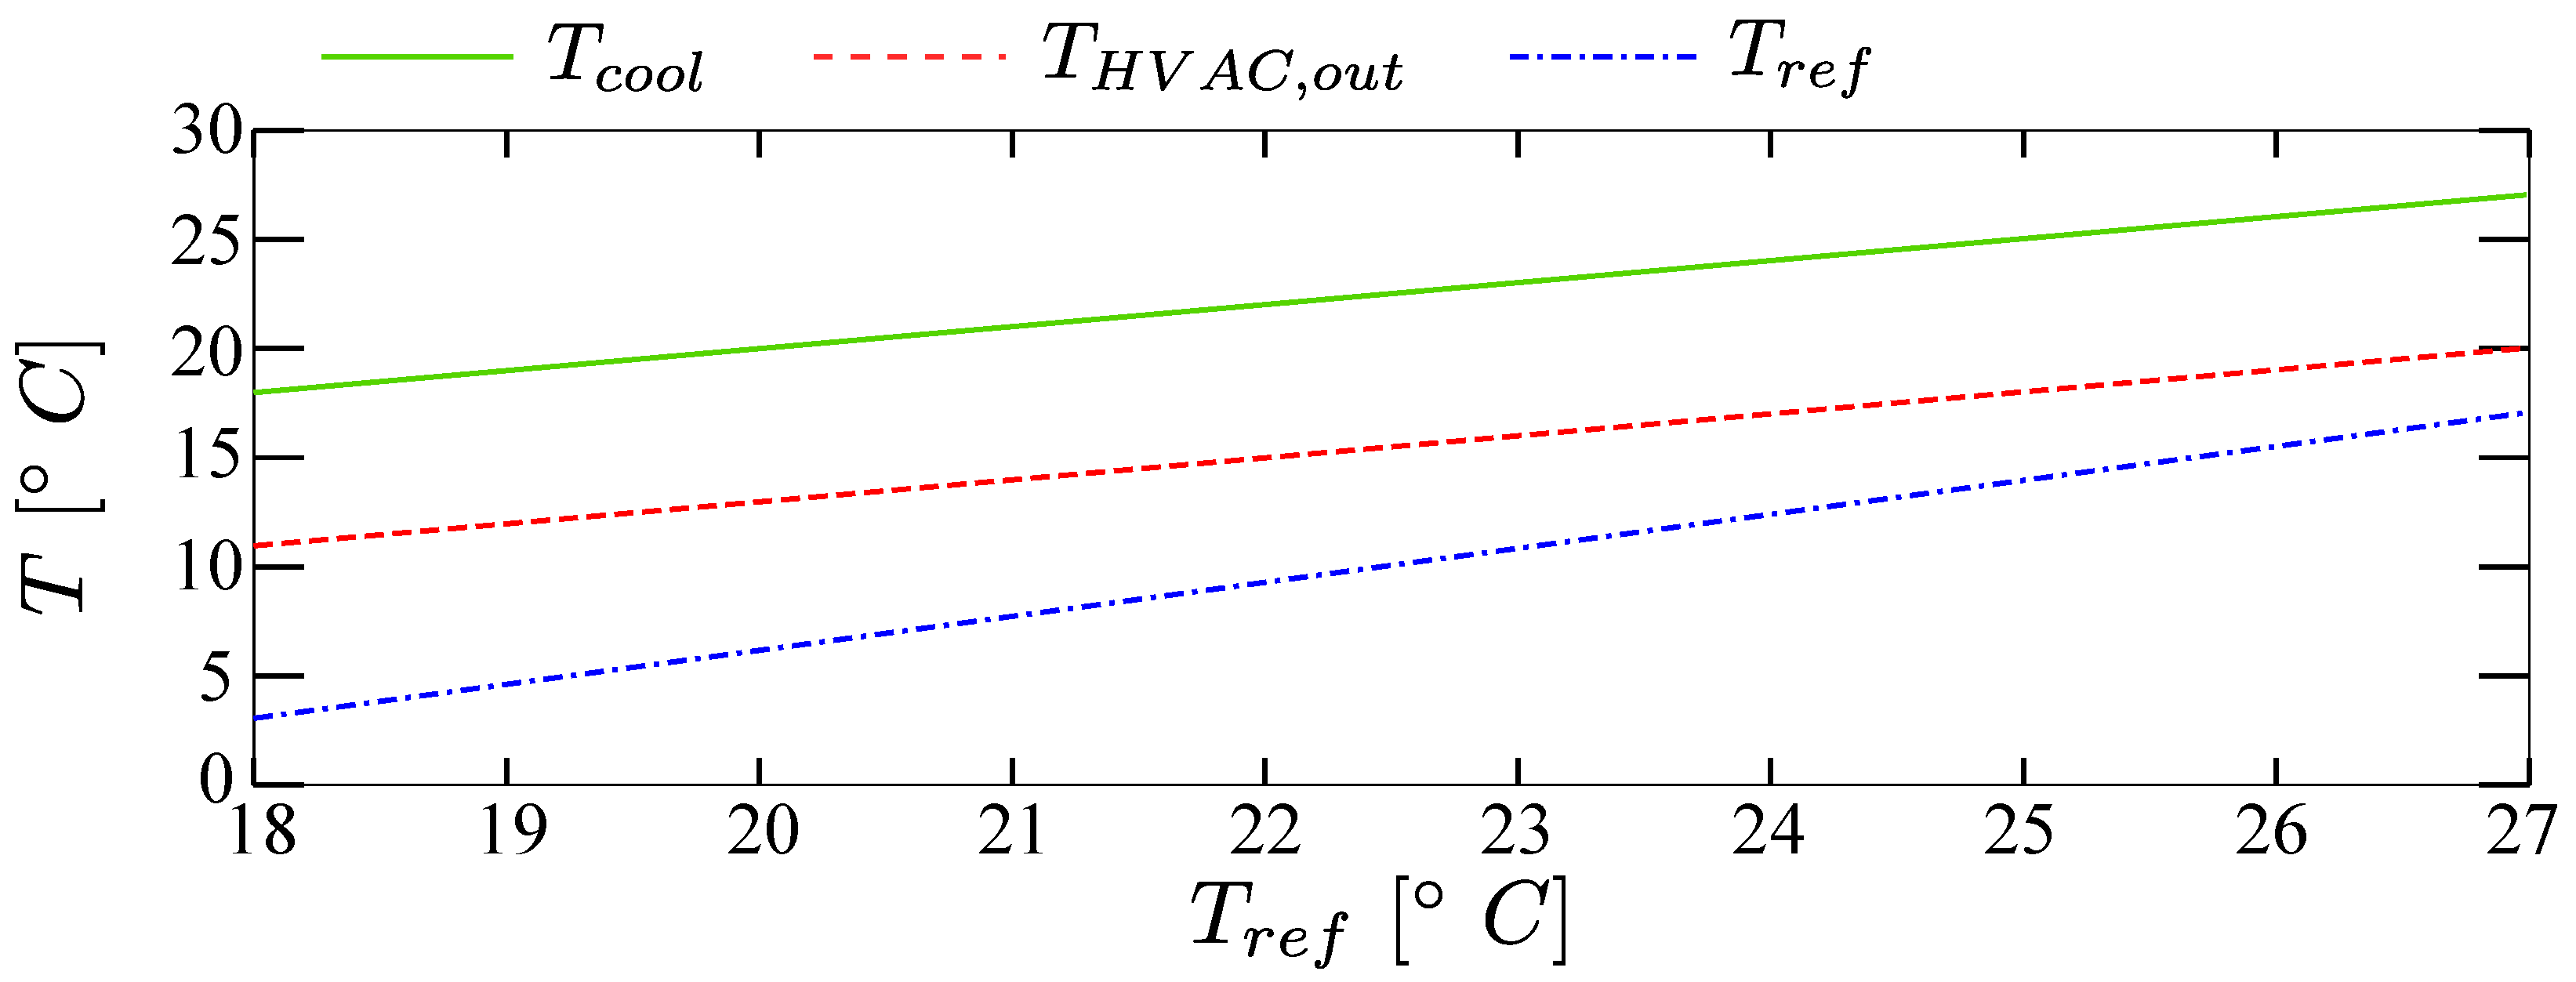
The recirculated mass flow rate, i.e.,
, has been designed as a constant portion of the mass flow rate blown inside, i.e.,
. The rule for the temperature at the outlet of the cooling stage has consequently been designed to fulfill such requirements. Lastly, the temperature of the air directly blown into the cabin has been set 8 °C below the temperature desired. The two internal rules are displayed in
Figure 5.
Equation (
20) expresses the power demand of the HVAC from the battery pack based on the principles of thermodynamics explained earlier.
Given that all terms in Equation (
20) remain constant at a reference temperature, a proportional relationship exists between
and
. Other parameters and symbols used in this equation are described in
Table 3.
5. Battery Fading Modeling
The battery pack has been designed focusing on A123 26650 LiFePO
4 cells. The battery pack’s architecture comprises multiple battery branches connected in parallel, each consisting of a specific number of cells in series. The design was developed to meet the nominal battery characteristics used in a commercially available hatchback BEV [
45,
46]. A semi-empirical battery degradation model, like the one developed in [
47], is included in the vehicle simulation model once the battery design is finalized. The degradation model is based on the Arrhenius equation, typically used in chemistry to describe the velocity of chemical reactions. By leveraging this equation, the capacity loss of the battery can be calculated as a percentage using Equation (
21). However, some constant parameters must be fine-tuned to ensure that the model can adequately fit the empirical evidence of battery degradation. This formulation only captures the variability in battery degradation that arises from different C-rates and temperatures.
The battery management system (BMS) is assumed to keep the battery pack’s temperature constantly at 25 °C. The end of life (EOL) of the battery is considered as the point at which
. The Ah-throughput can be expressed as Equation (
22):
Given the assumptions made, Equation (
23) can be used to determine the number of round-trip cycles for specific operating conditions.
Thus, the rate of battery capacity degradation can be evaluated using Equation (
24), and consequently, the residual battery capacity, i.e.,
, can be updated. The values used for the constants in battery fading modeling is tabulated in
Table 4.
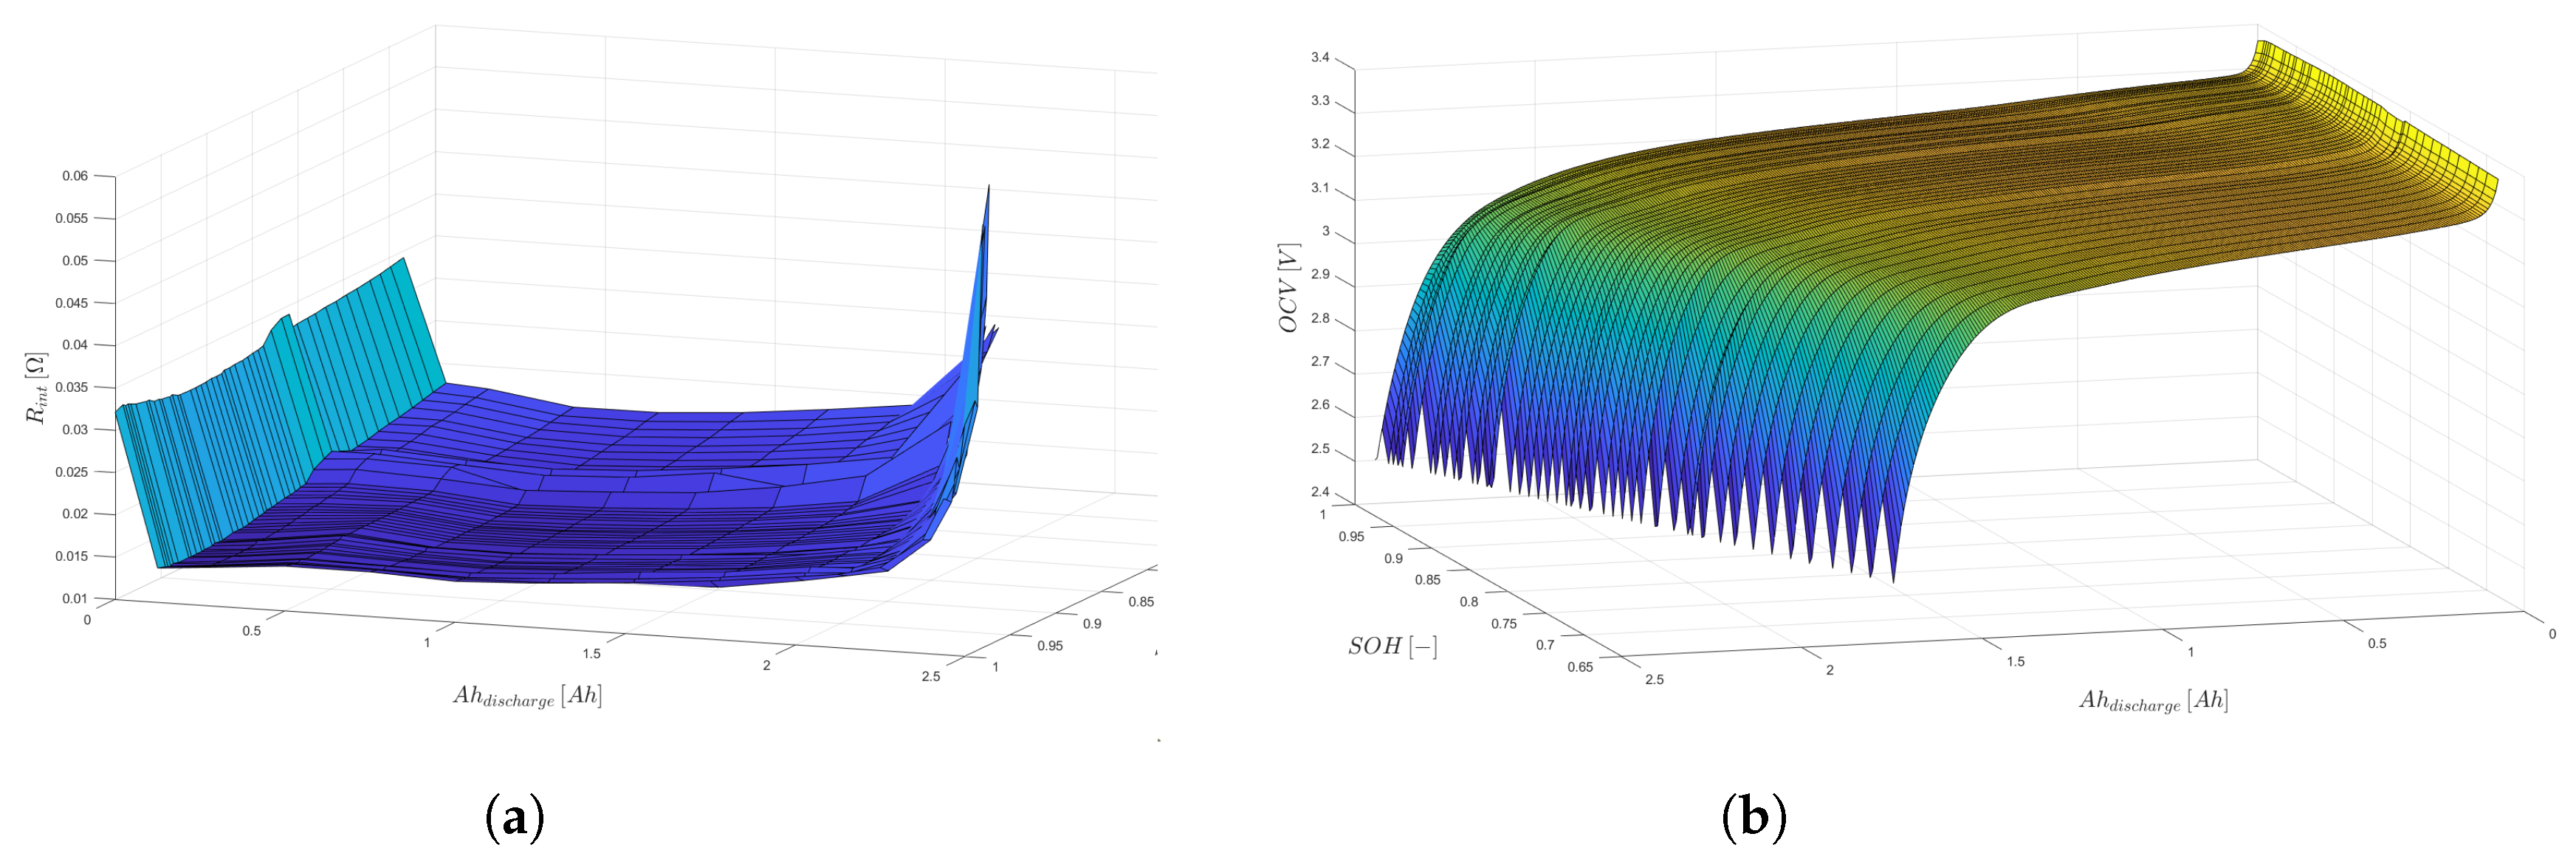
A new battery model has been developed, distinguishing itself from similar research by focusing on the battery’s characteristics. Using results from previous research on battery capacity deterioration, as found in [
47], a description of the battery’s characteristics has been extracted. This description includes the variation in the battery’s open circuit voltage (OCV) and internal resistance, corresponding to two variables: the state of health (SOH) and the state of charge (SOC). These characteristics, over their respective domains, can be observed in
Figure 6a,b.
7. Simulation Results and Discussion
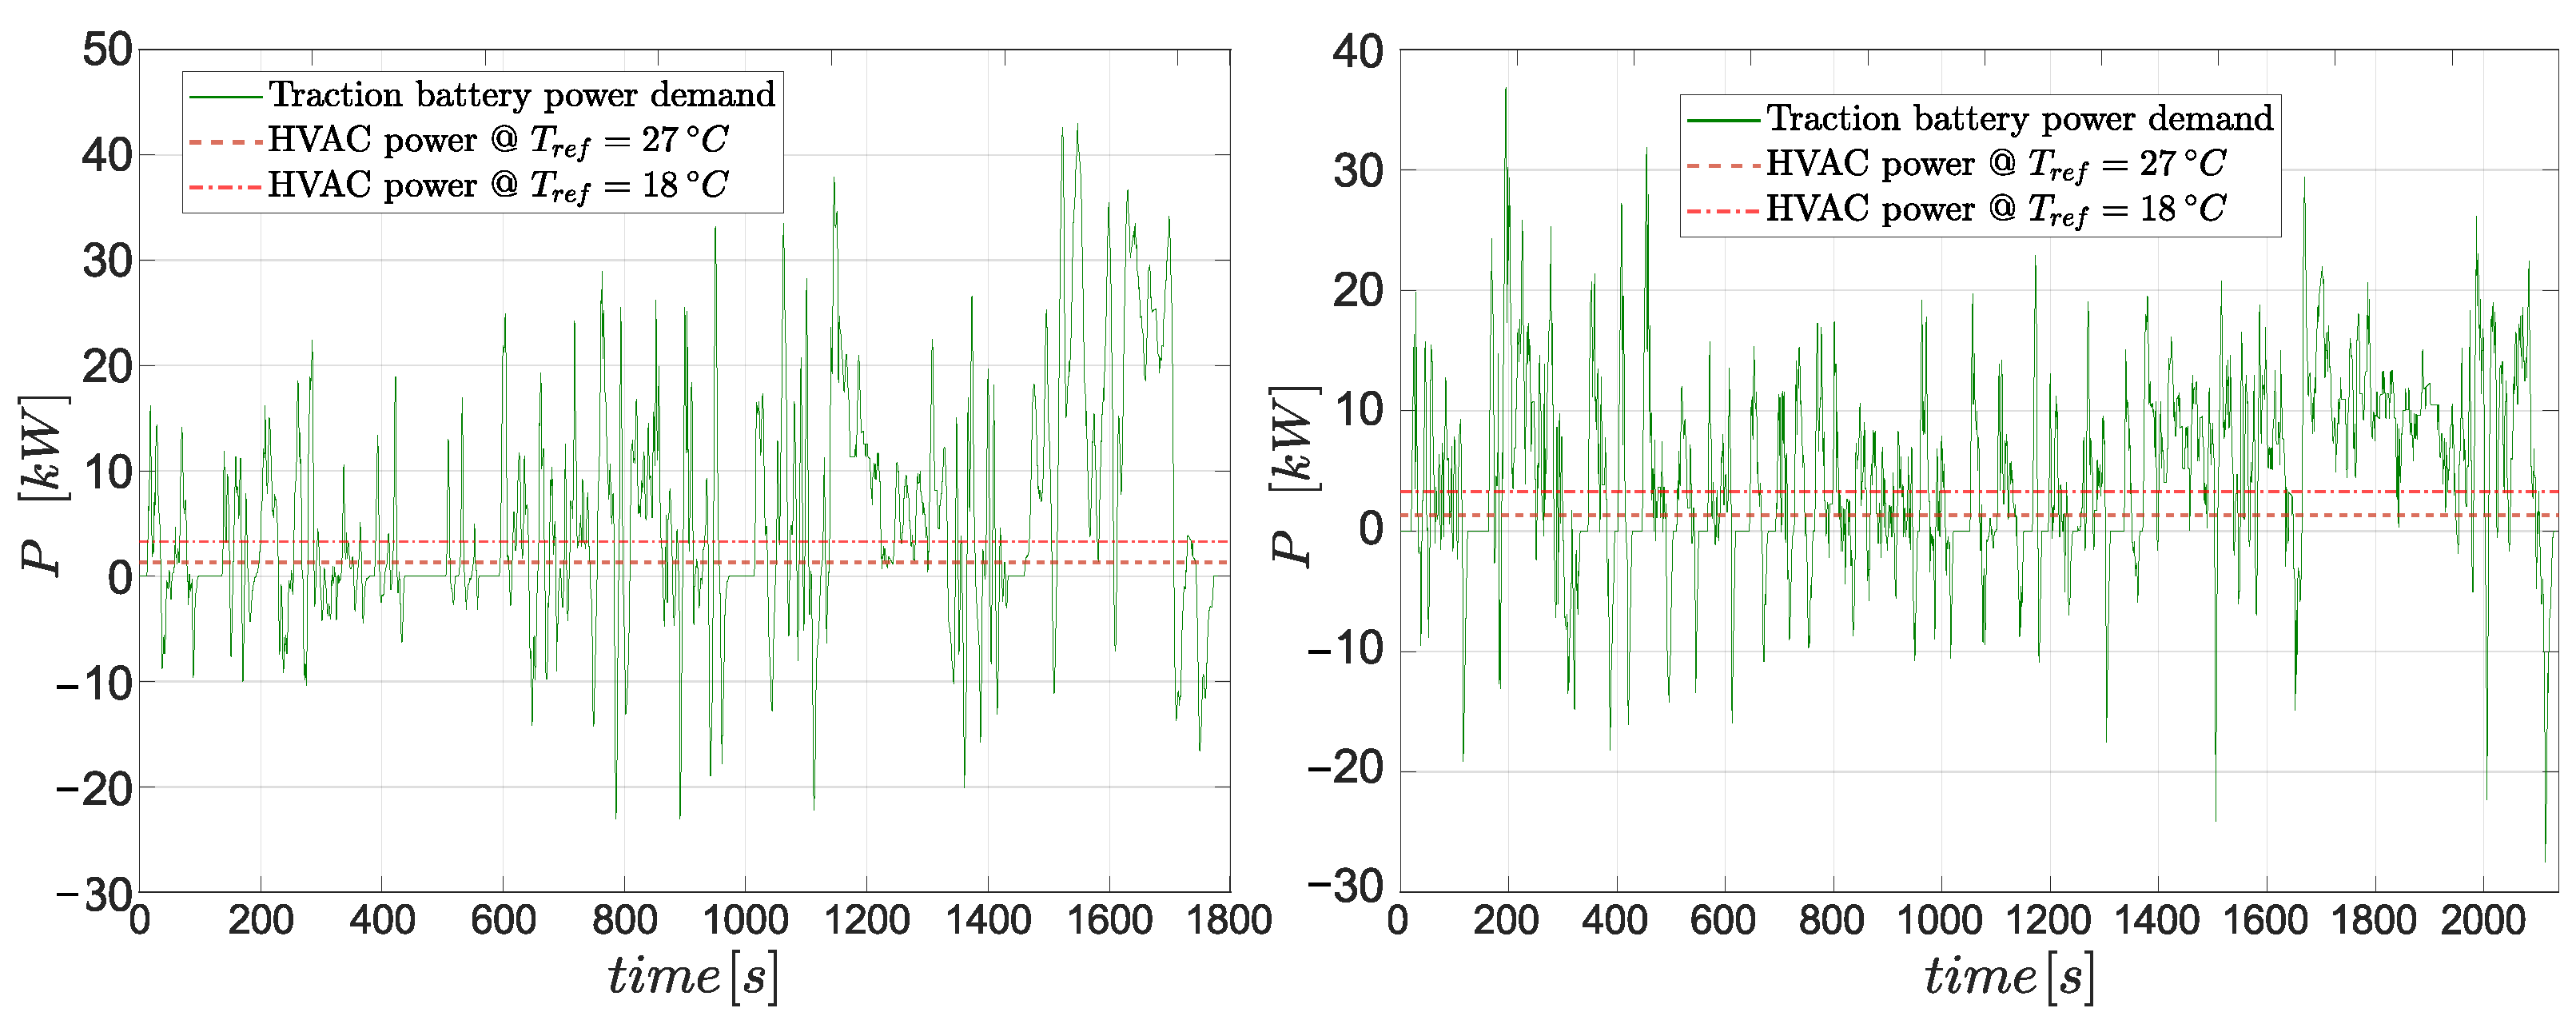
Evaluating the IETM control strategy’s efficacy in reducing battery capacity degradation is necessary, followed by the controller’s implementation. Two driving scenarios, as shown in
Figure 9, representative of European and North American standard drive cycles for energy consumption and pollution measurements, are selected for the simulations:
Figure 9.
Driving scenarios used to validate the efficacy of the proposed IETM strategy.
Figure 9.
Driving scenarios used to validate the efficacy of the proposed IETM strategy.
It is easy to understand that the first driving scenario is more aggressive than the second one by simulating the vehicle model in each scenario with no cabin conditioning (HVAC turned off). From
Table 7, one can deduce that the specific energy required to complete the driving schedule is lower for scenario 2 (
) than for scenario 1 (
).
Four consecutive drive cycles were carried out to quantitatively assess the benefits, followed by measuring the battery capacity drop at the end of the test. Assuming that the battery degradation would repeat identically, it was determined that the SOH degradation resulting from 160,000 km of driving could be obtained by extrapolating the combined degradation caused by the two scenarios. However, the drop in battery SOH caused by the charging phase, which occurs every time the SOC reaches the minimum threshold, i.e., , was not considered. The ambient conditions are characterized by an external temperature of °C and solar radiation of = 1000 W/m2.
Notably,
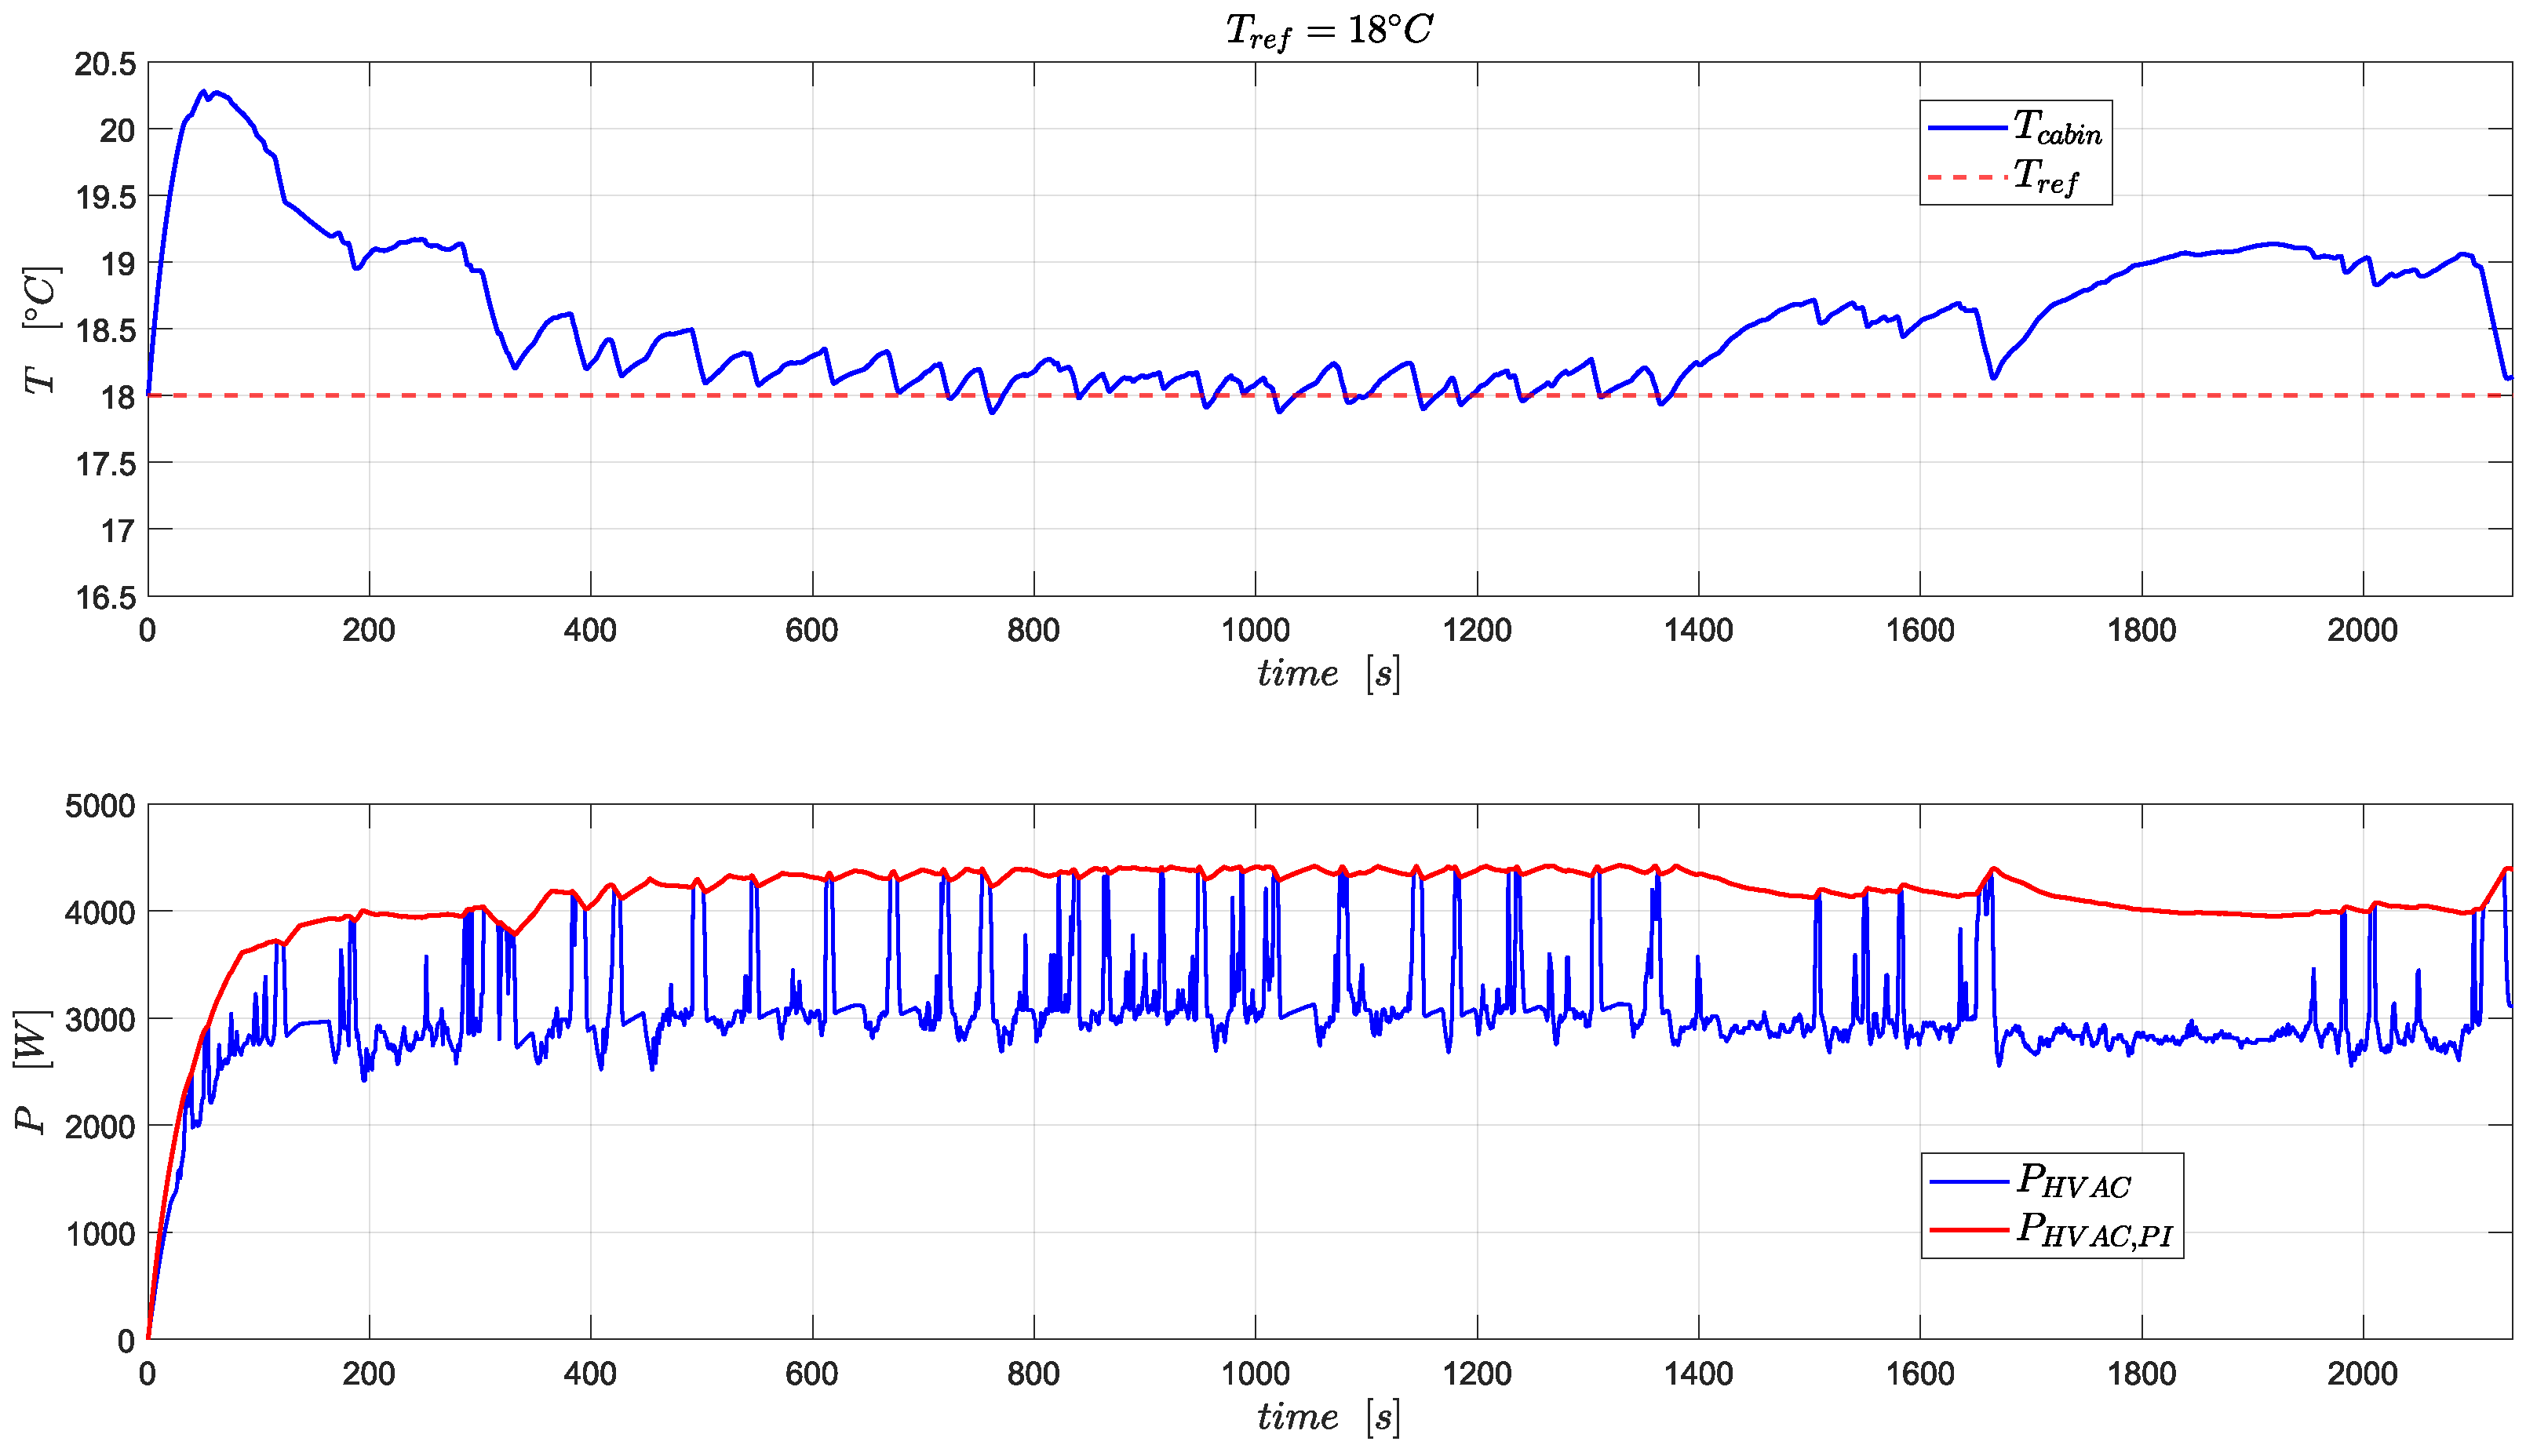
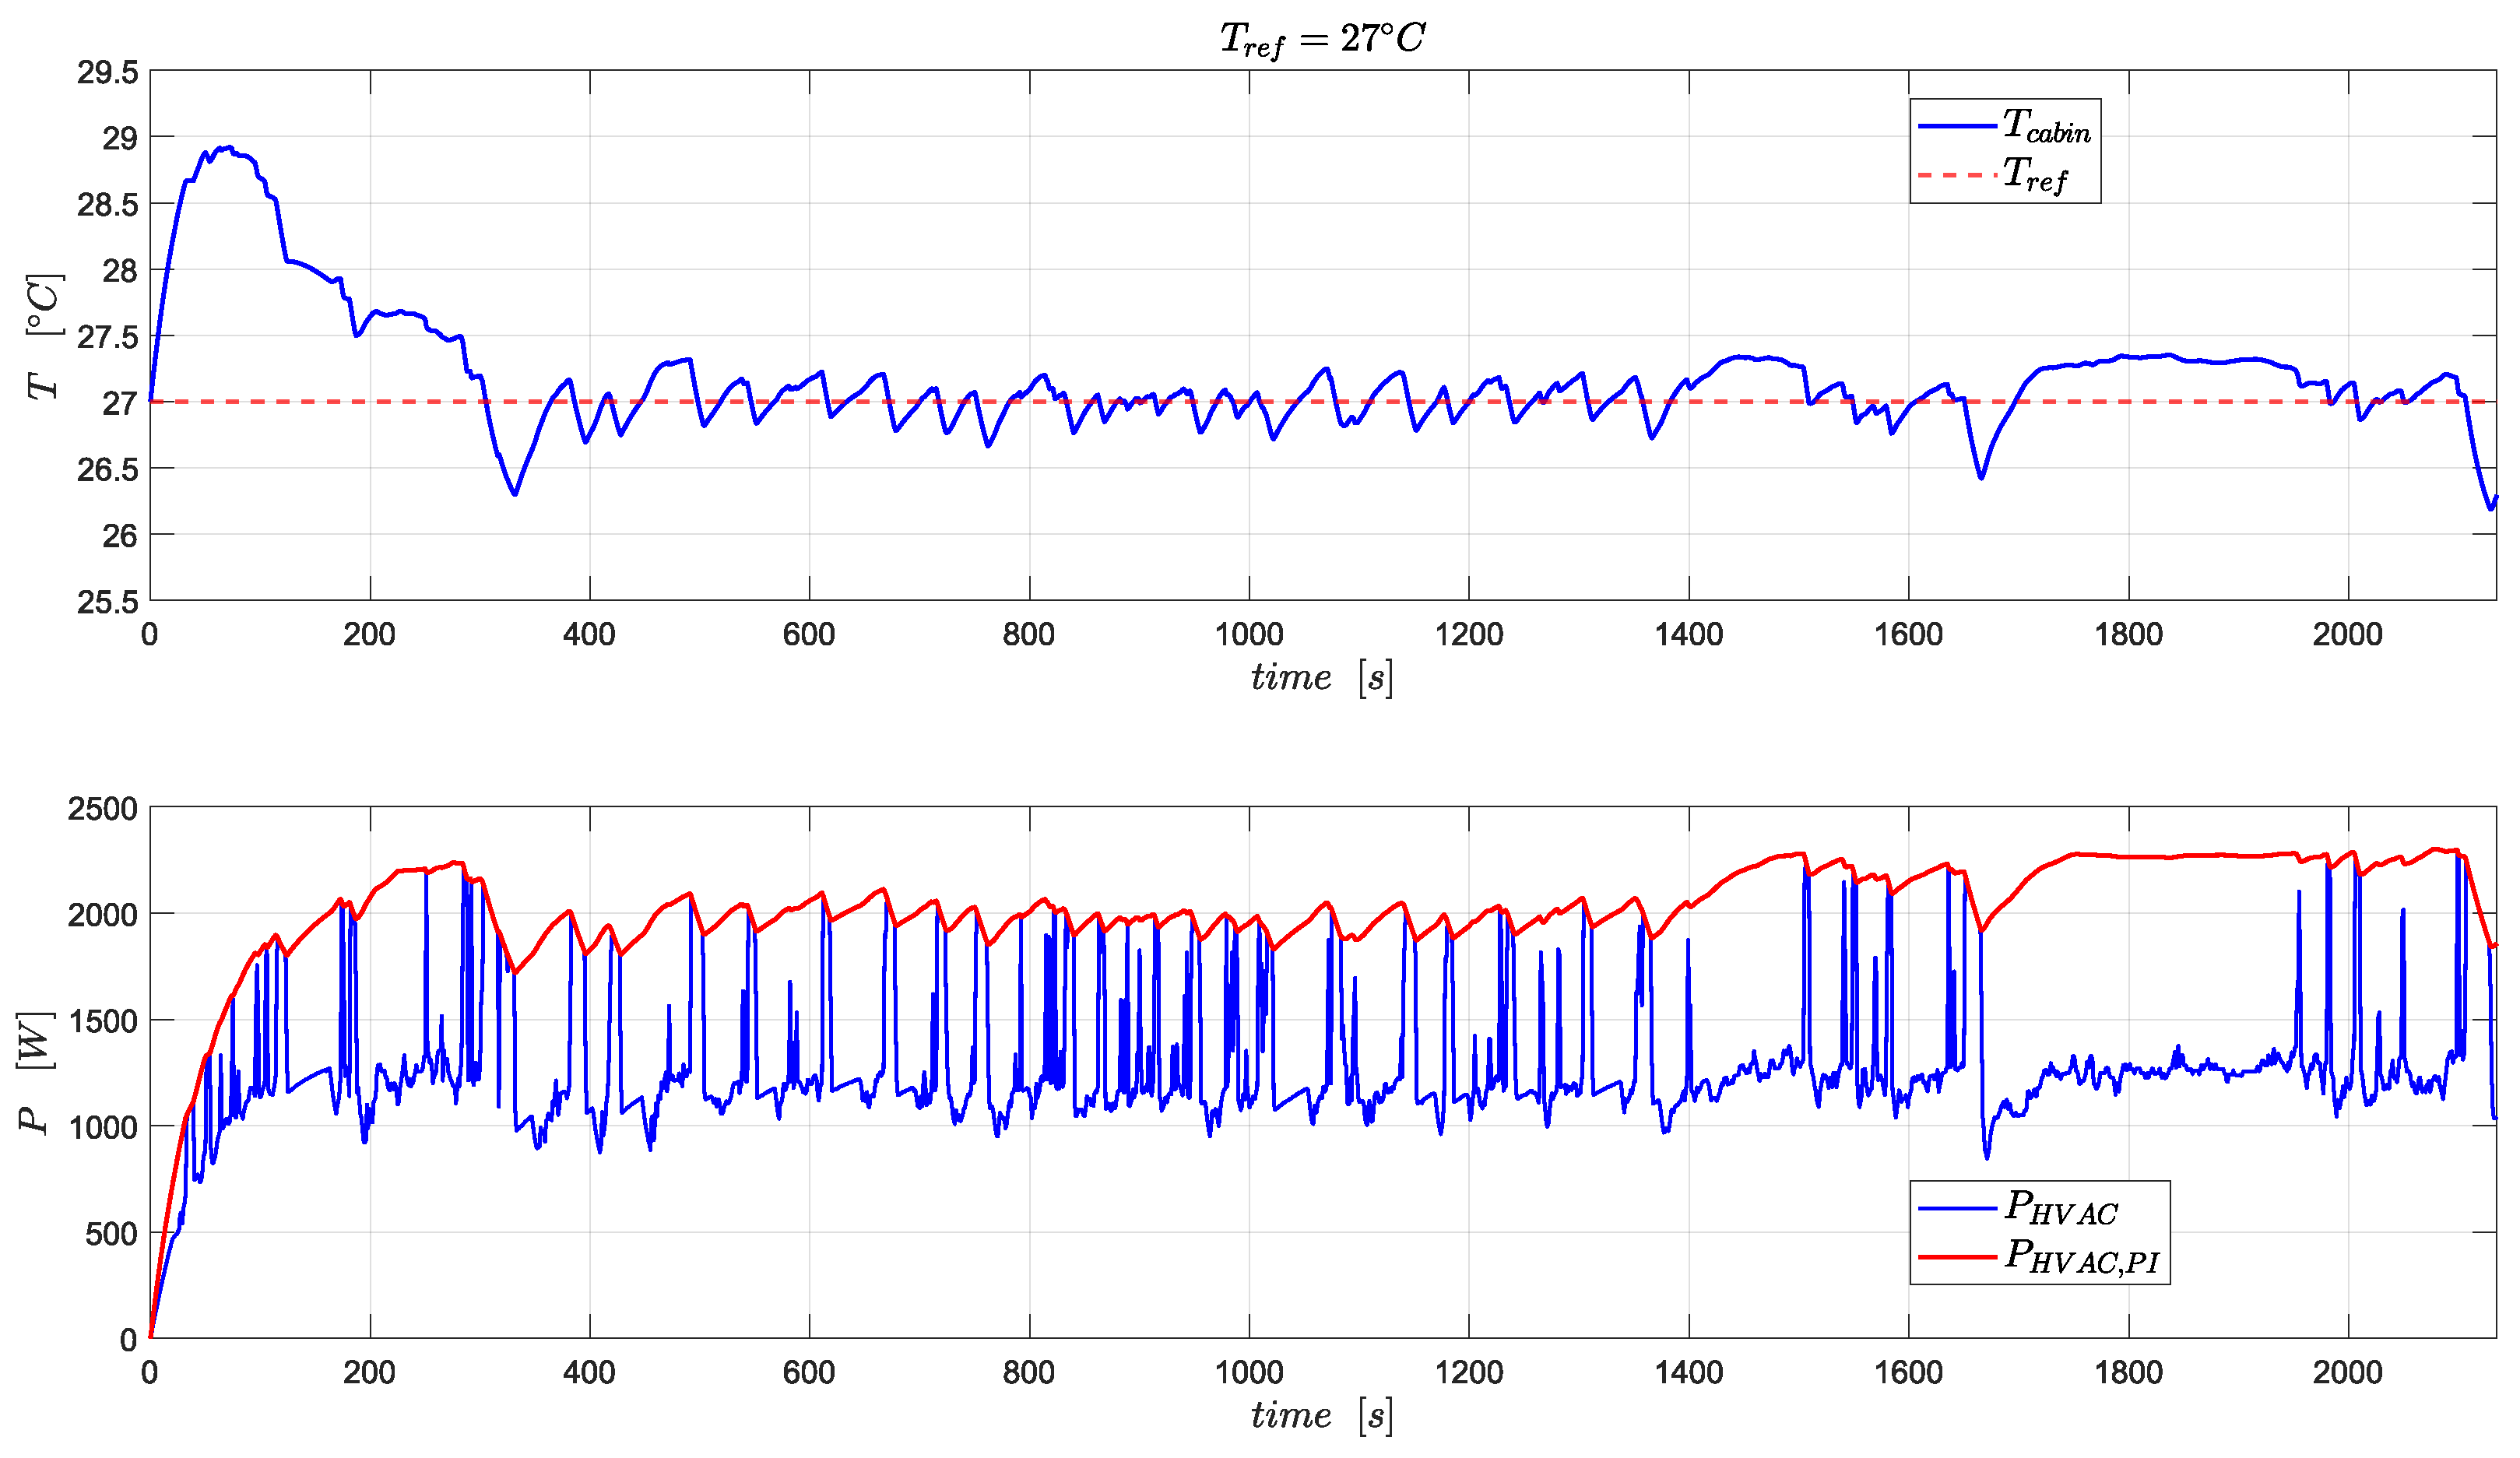
Figure 10 compares the battery power demand from the propulsion and HVAC systems. Although the variation in power demand coming from the HVAC system is much smaller than the traction system, the HVAC power demand varies as a function of reference cabin temperature. The HVAC system ideally requires around 4 kW and 2 kW of power to maintain the cabin at 18 °C and 27 °C temperatures, respectively, during driving
scenario 1, as shown in
Figure 11. The desired power demand for the HVAC system does not change much as the driving
scenario changes, hovering around 4 kW and 2 kW for 18 °C and 27 °C, respectively, as shown in
Figure 12 and
Figure 13 compared to
Figure 11.
It may look like the IETM controller cannot make a difference in the battery’s durability by optimally regulating the HVAC power demand since it has a small share in the overall power demand of the vehicle. However, IETM intelligently cuts down the desired HVAC power demand by approximately
whenever the traction power demand is in the zone of high peaks, as shown in
Figure 11,
Figure 12 and
Figure 13.
As a result of such an optimal reduction in HVAC power demand, the cabin temperature hovers around the reference temperature with a larger response time, meticulously justifying the foundational assumption of this research work, that the cabin thermal system has slower dynamics than the powertrain. After the HVAC system attains its steady-state power, i.e., after 200 s, in
Figure 11,
Figure 12 and
Figure 13, the proposed IETM strategy has caused maximum temperature deviation only (
) of
°C in both driving scenarios. Assuming the order of deviation in controlled cabin temperature from the reference temperature, as shown in
Figure 11,
Figure 12 and
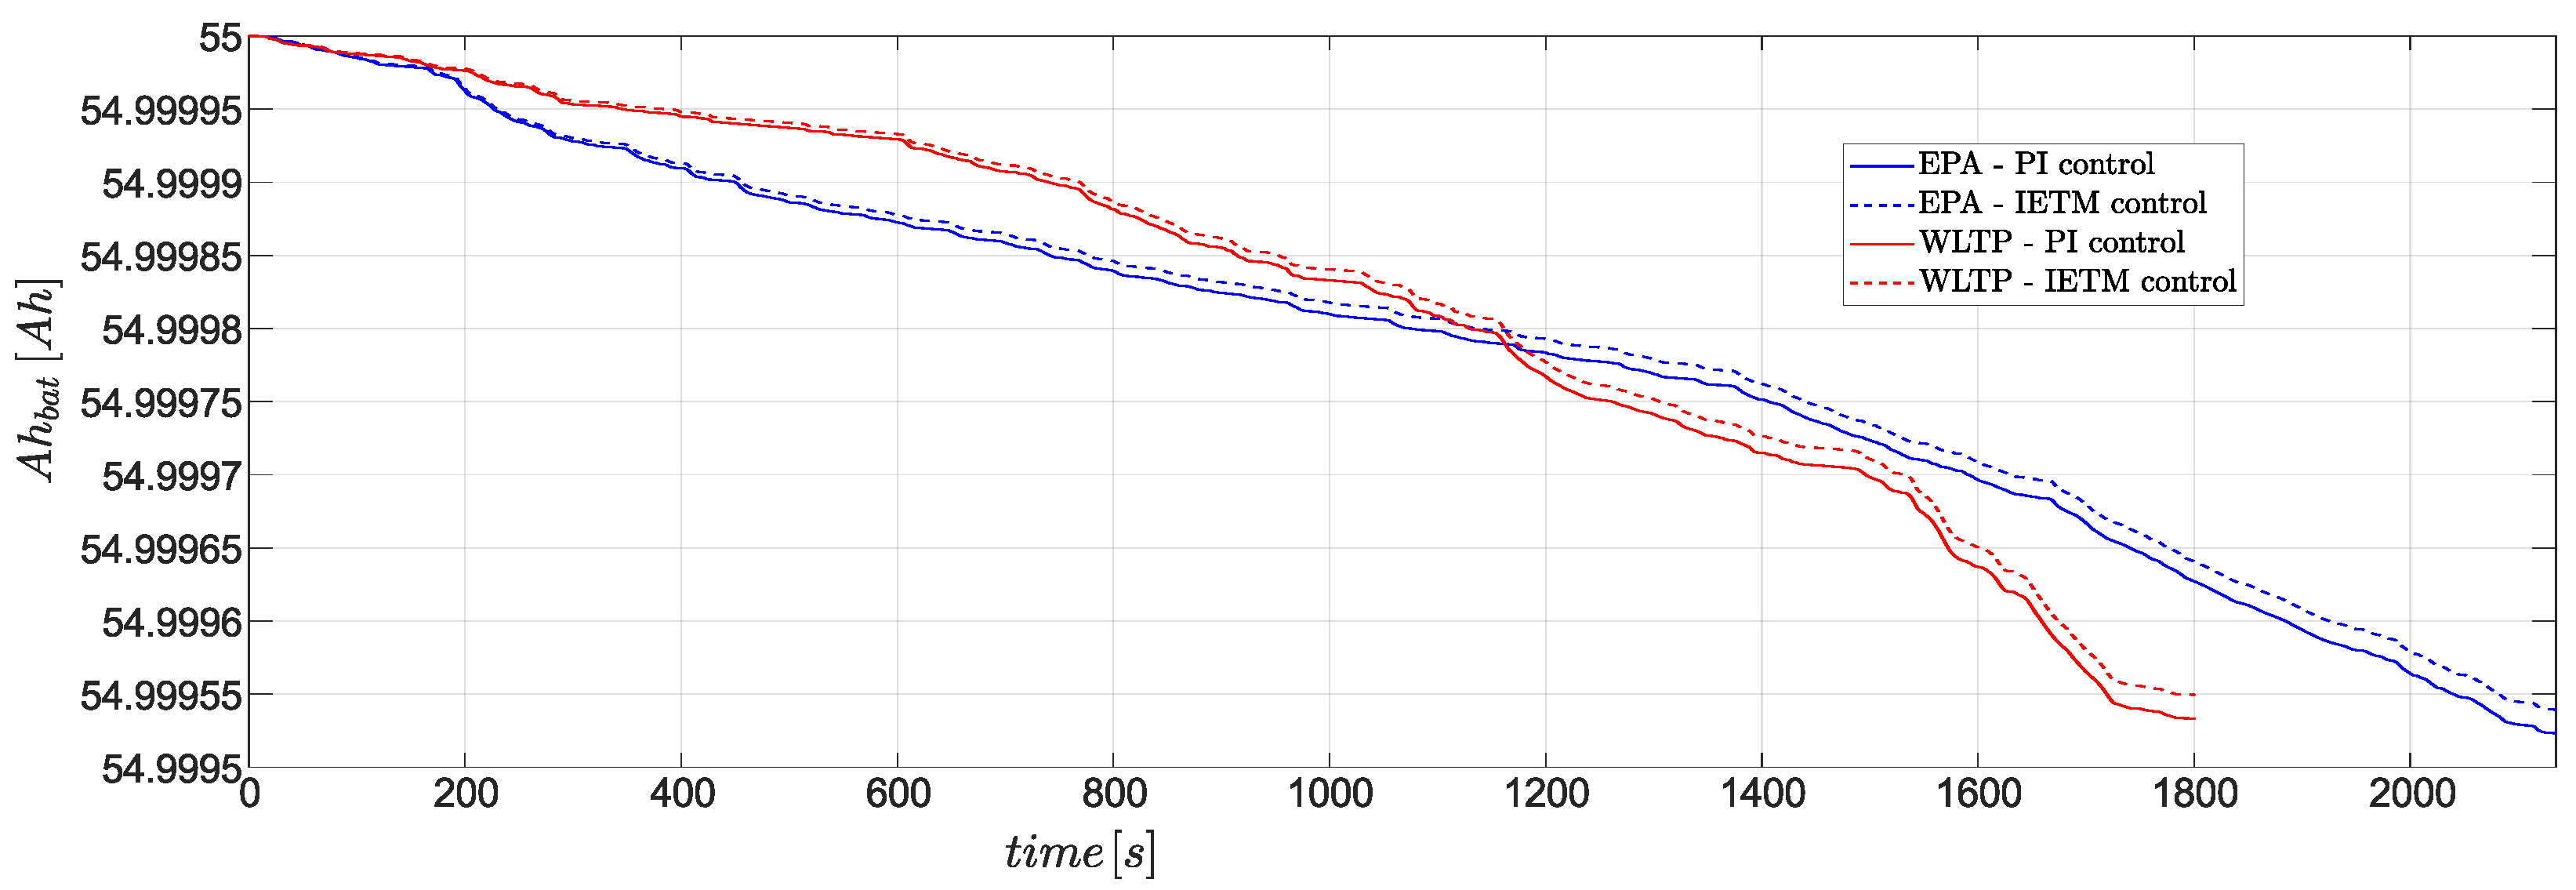
Figure 13, will not be perceived by and will not create any discomfort to the drivers and passengers, the effectiveness of the proposed ITEM control over traditional PI control in decreasing SOH degradation is depicted in
Figure 14. It is evident from the comparison between the
and
trajectories in
Figure 11,
Figure 12 and
Figure 13 that the cumulative HVAC power demand over a drive cycle has been reduced with the proposed IETM strategy, and this is partly responsible for the delay in SOH degradation depicted in
Figure 14. Due to IETM, not only does the cumulative HVAC power decrease, but the peak battery discharge power also decreases, which is also responsible for delaying battery SOH degradation. The figure depicts the savings in SOH for only a single occurrence of both driving scenarios.
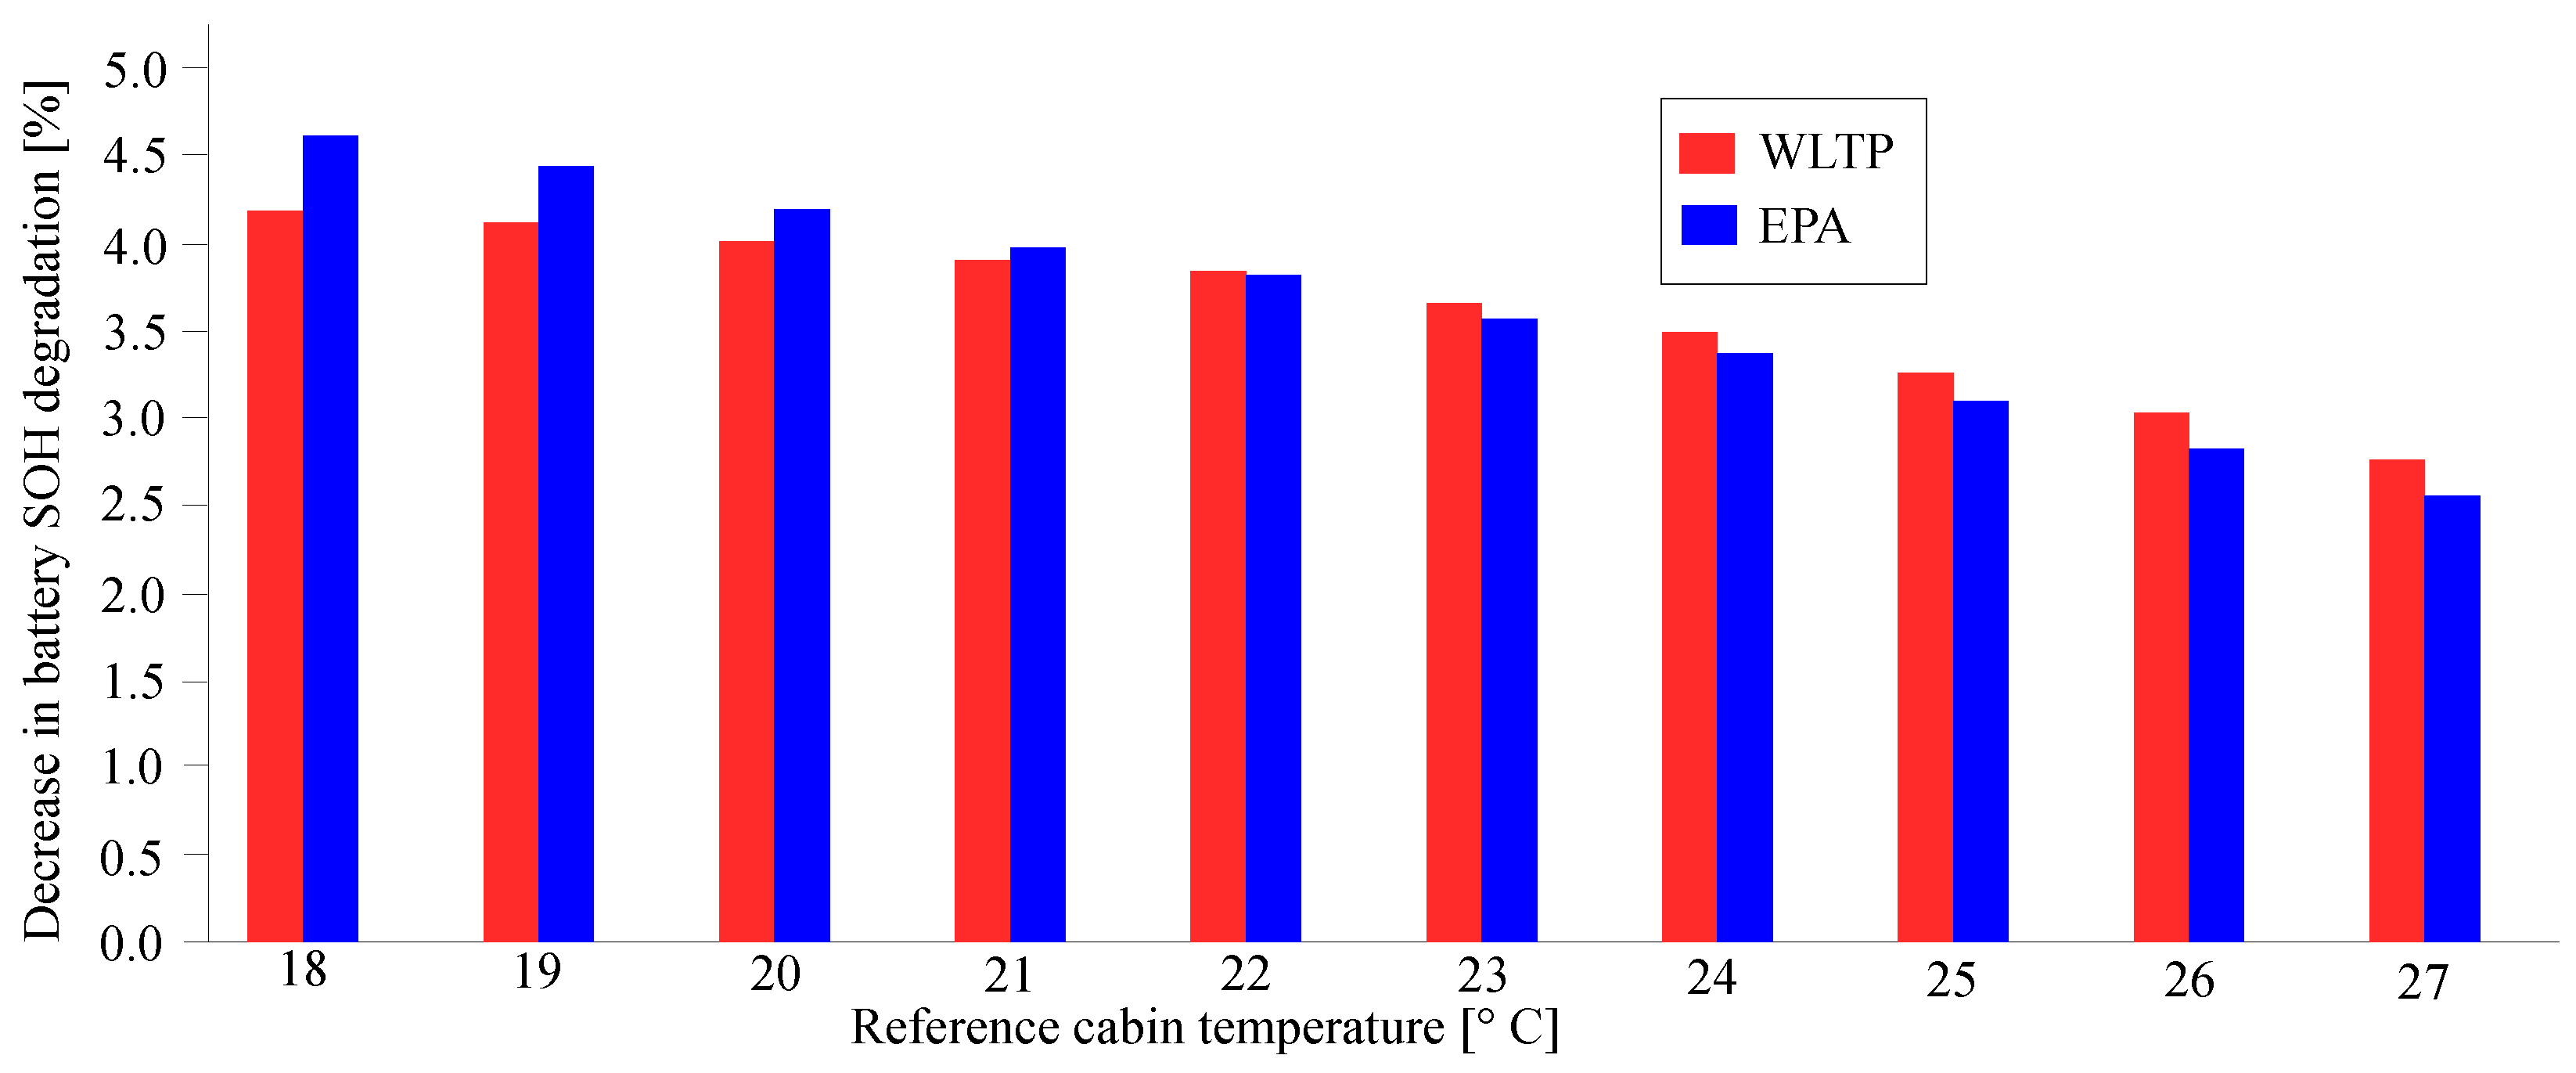
This same test is repeated while maintaining the inside of the cabin’s volume in several comfort conditions, expressed in terms of the reference temperature to be held inside the cabin. The efficacy of the proposed IETM control strategy, quantitatively measured in terms of battery capacity saved after 160,000 km, is summarized in
Table 8 for
scenario 1 and
scenario 2, and depicted in
Figure 15 as well.
The results, expressed in percentage, represent the additional battery capacity found for the battery pack at the end of the 160,000 km using the IETM strategy, as compared to the same distance traveled without the assistance of the controller. The improvements, ranging in the interval between 3.1% and 4.5%, are in line with what one could have expected by such a strategy. Indeed, this is neither a strategy acting on the driving style, nor some improvement in powertrain efficiency. These could have returned higher improvements, minimizing the traction power, which would have meant having a range of values of power to act on that would be far larger than the one required by the HVAC. Aiming to explain the decreasing trend that occurs as the reference temperature within the cabin increases, this is due to the HVAC system’s increased energy consumption necessary to maintain lower temperatures inside the cabin. Then, the IETM control can work on a higher power margin, limiting the damaging effect on the battery when needed, thus leading to greater improvements.
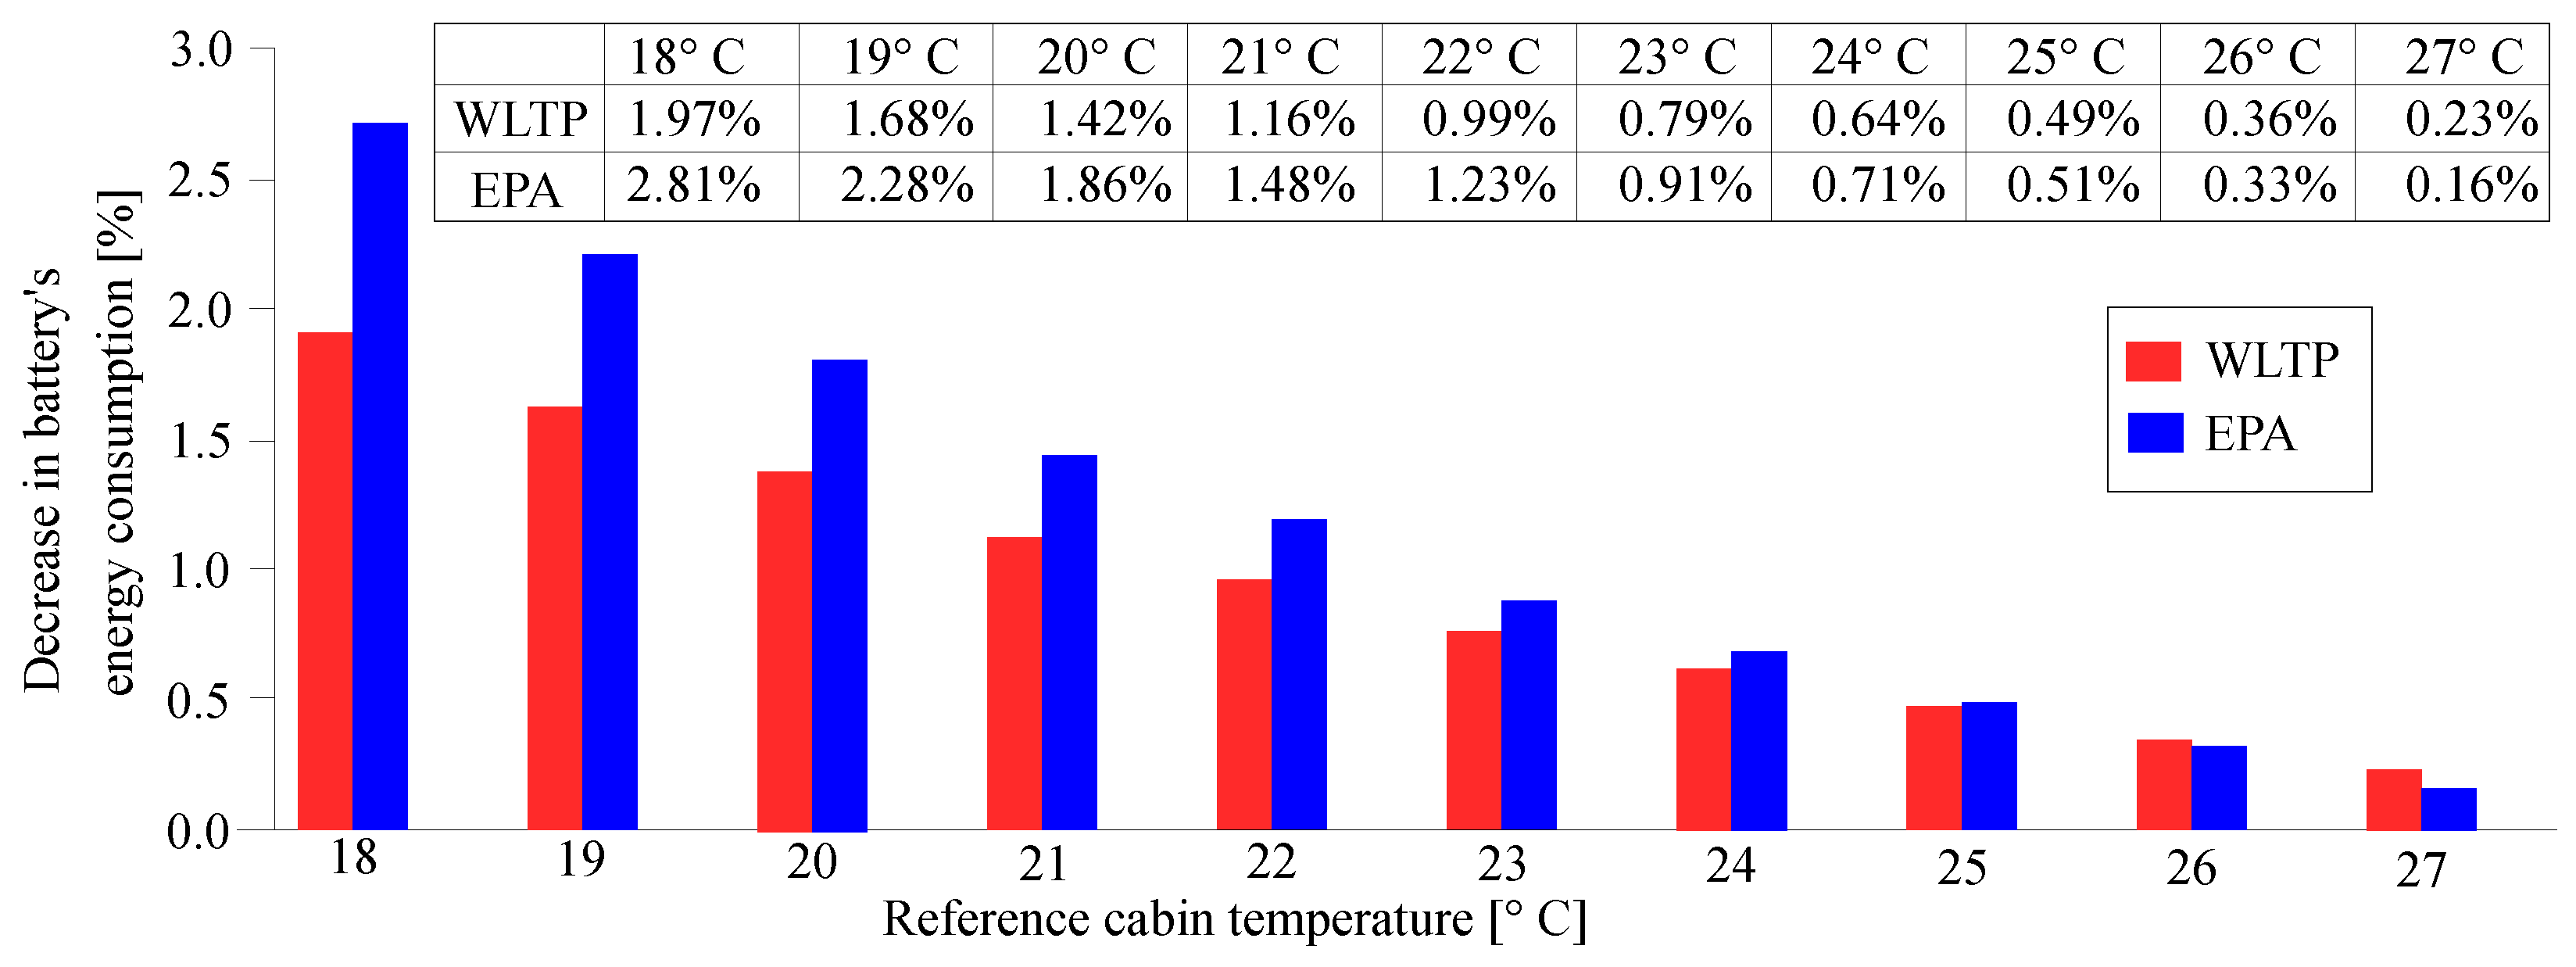
Some other benefits have been found by investigating carefully the outcomes of these tests. The IETM strategy shows a positive impact in terms of energy consumption as well. By monitoring the SOC decrease at the end of each test run, the results obtained are summarized in
Figure 16.
8. Conclusions
This article has made significant strides in enhancing the durability and energy efficiency of battery electric vehicles by introducing an innovative, fast-running IETM. The IETM is effective for improving battery health and energy efficiency in EVs by performing an optimal adjustment of the battery loads. The simulation results prove that:
The proposed IETM decreases the battery health degradation of a well-known commercial EV by as much as 4.6% and improves energy efficiency by as much as 2.8%.
The proposed IETM keeps the actual cabin temperature within a permissible deviation ( °C) from the reference temperature set by the passengers.
The IETM can be easily integrated into any battery-powered powertrain architecture by augmenting a small module of software to the EMS, enforcing BEVs’ jump into the current automotive industry. Furthermore, the IETM’s performance is worthy, considering it is computationally as cheap, especially in more aggressive driving scenarios where its advantages are even more evident. A critical next step could be exploring the feasibility of real-time implementation, upgrading the cabin thermal model with humidity estimation such that thermal comfort can be measured with standardized metrics such as predicted mean vote (PMV) and predicted percentage of dissatisfaction (PPD), and onboard evaluation of the IETM strategy on the vehicle control unit. This approach would provide insights into the real-world applicability and performance of the IETM controller under dynamic driving conditions. This possibility also would enable us to check how far the real advantages coming from the IETM application could be from the ideal one outlined within this research project.


