Abstract
The evaluation of energy input and output processes in agricultural systems is a crucial method for assessing sustainability levels within these systems. In this research, the investigation focused on the input and output energies and related indices in sunflower farms in Khoy County during the agricultural year 2017–2018. Data were collected from 140 sunflower producers through specialized questionnaires and face-to-face interviews. Additionally, artificial neural networks (ANNs), specifically the multilayer perceptron, were employed to predict the output energy. The results revealed that a substantial portion of the total input energy was attributed to chemical nitrogen fertilizer (43.98%), consumable fuel (25.74%), and machinery (8.42%). The energy efficiency (energy ratio) in these agroecosystems was relatively low, measured at 1.57 for seed and 7.96 for seed and straw. These values should be improved. The energy efficiency in seed production was computed at 0.06 MJ·ha−1, while, for the combined seeds and straw, it was 0.57 MJ·ha−1. In particular, seed energy efficiency represents approximately 11% of the overall biological energy efficiency, highlighting that a substantial 89% of the produced energy is associated with straw. The proper use of this straw is crucial, as its improper handling could lead to a drastic decrease in overall efficiency. Furthermore, the explanatory coefficient (R2) and the mean absolute percentage error (MAPE) to predict the output energy with the best neural network were 0.94, and 1.77 for the training data, 0.97 and 1.55 for the test data, and 0.9 and 2.08 for the validation data, respectively; additionally, 0.97 and 0.42 were obtained by an ANFIS.
1. Introduction
The agricultural sector is the most important driver of environmental changes in the world and, at the same time, is highly vulnerable to these changes, often related to various emissions and pollutants entering the soil, water, and atmosphere. Agriculture contributes to the greenhouse effect by emitting methane (CH4), carbon dioxide (CO2), and nitrogen oxides (NOX), leading to phenomena such as eutrophication through nitrogen and phosphorus runoff, water pollution through washing and erosion, global phosphorus or nitrogen pollution, climate change, air pollution, and depletion of the ozone layer [1,2].
Global agriculture is also affected by weather-related disasters such as droughts and floods, mostly caused by agricultural pollution. Despite the adverse environmental effects, agricultural production methods are key ways to achieve food security and end global hunger by improving protein and other nutrients in the diets of food-insecure individuals. In addition to reducing poverty through increased income, sustainable agriculture can provide clean energy and water in low- and middle-income countries. Therefore, smallholders, commercial farmers, and food producers worldwide need to engage in sustainable agricultural activities to ensure secure food systems at the local, national or regional levels [3].
The agricultural sector plays a dual role as both an energy consumer and a producer. Investigating the factors influencing increased energy consumption (input) during agricultural product production reveals potential strategies for optimizing energy utilization. Optimizing energy consumption in agricultural production is especially important given the need to restrict fossil fuel energy consumption, which is a key element in the energy input spectrum, and mitigate its environmental consequences [4].
The amount of energy consumed in different agricultural production systems depends not only on the type of crop being cultivated, but also on the materials used in crop production and the prevailing climatic conditions of the region.
Different agricultural systems exhibit different behaviours in terms of energy resource utilization, resulting in varying energy efficiencies in each production system. This efficiency is typically not universally applicable to other production systems. Therefore, it is necessary to comprehensively examine the specific energy levels for each region and crop to accurately assess and optimize energy consumption. On the other hand, energy consumption in the agricultural sector is on an upward trajectory. Therefore, producers face an urgent need to enhance overall production by optimizing inputs rather than expanding cultivable land.
Energy efficiency is a crucial issue in the context of sustainable agricultural development. The analysis of energy flow is an accepted method for calculating energy indices. Consequently, the flow of materials, chemicals, and fuel used in the production of a specific quantity of food can be expressed in a standardized unit, such as the joule, to facilitate energy calculations [5]. Therefore, exploring the level of energy consumption in agriculture has become a fundamental question [6].
In regard to the total equivalent energy input in the agricultural sector, diesel fuel, chemical fertilizers, and pesticides account for 54%, 24%, and 13%, respectively [7]. Considering the scale and size of Iran’s food system production (total energy input of 31 gigajoules per hectare) [8], even small improvements can provide significant benefits.
Sunflowers, among crop plants, have global significance, being cultivated in diverse geographical latitudes and climatic conditions and playing a crucial role in energy production [9]. Iran, the main sunflower producer with an output exceeding 4380 tons, has a cultivated area of 5686 hectares. In particular, the West Azerbaijan province, specifically Khoy County, contributes 303 hectares to the extensive cultivation areas of this crop.
Despite the considerable potential for sunflower cultivation in the West Azerbaijan province and Khoy County, the economic value of this crop remains relatively low due to its modest yield (1461 and 984 kg h−1 in irrigated and rainfed cultivation, respectively) [10]. Consequently, there is a pressing need to explore solutions to increase productivity.
In recent years, intelligent systems such as ANNs and Adaptive Neuro-Fuzzy Inference Systems (ANFISs) have demonstrated successful applications for complementary calculations. The emergence of new techniques, classified as soft computing or computational intelligence, has found versatile applications across various fields, encompassing classification, pattern recognition, prediction, and modeling processes in diverse scientific disciplines. The distinctive advantage of these methods lies in their ability to directly learn from data, avoiding the necessity to estimate statistical characteristics [11].
An ANN is considered one of the most prominent novel modeling methods used in various research studies [12]. An ANFIS is capable of predicting the relationship between the output and input sets without considering initial knowledge and assumptions, modeling the relationships between the parameters under study and predicting the output related to the desired input [13].
Successful applications have been achieved in resolving problems in natural processes using ANFIS and ANN models. ANNs and ANFISs do not impose limitations on predicted values, unlike linear regression models. These focus on the average, effectively preserving the real variability present in the data [14].
Predictive models for crop yield involve preparing for potential deficiencies and storing additional input, considering managerial and technical factors. This helps optimize the production units, minimizing energy consumption and increasing overall efficiency. Furthermore, this model could easily predict the yield based on enabling us to estimate the optimal consumption model and level of energy consumption [15]. The machine learning approach enables us to identify multiple direct and indirect factors for predicting energy consumption in crop production. A long-term energy performance study can also help in predicting crop production and greenhouse gas emissions based on energy inputs [7].
Numerous studies have been conducted on energy analysis, calculation of energy indices, and prediction of these indices with intelligent systems for various products, such as citrus fruits [16], rice [17], oilseed [18], sugar beets [19], pomegranates [20], wheat [21], cumin and fennel [12], button mushrooms [22], microalgae cultivation [23], and almonds and walnuts [24]. However, to our knowledge, few studies have been performed on the analysis of energy flow in sunflower fields globally.
In other words, the prediction of sunflower output energy using intelligent networks has not been performed yet. Given the importance of oilseed-derived products, particularly sunflower seeds, in the diet of Iranian households, and recognizing the imperative to improve production efficiency from both economic and energy consumption perspectives, it is necessary to evaluate the energy efficiency of sunflower farms in this province. This evaluation, particularly in Khoy County, a key production center for this crop, is crucial for informed planning and policy-making geared towards optimizing sunflower production.
Therefore, the objective of this research is to analyze the energy input and output models and predict the production of sunflower oil seeds using ANN systems and ANFISs, providing the best model.
2. Materials and Methods
2.1. Geographic Characteristics of the Research Area
Khoy County, which covers an area of approximately 2000 km2, is located in the northwestern region of Iran, specifically in the northwest sector of the West Azerbaijan province (38°45′ N, 45°15′ E). It shares borders with Maku to the north, Marand to the east, Salmas to the south, and Turkey to the west (Figure 1). Furthermore, this county is organized into four districts, including five cities, 11 rural districts, and a total of 222 villages within its limits.
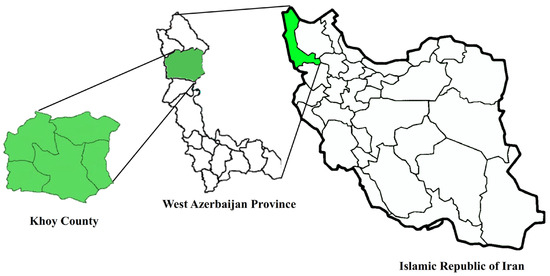
Figure 1.
Geographical location of the study area.
2.2. Data Collection Method
The data essential for this research were collected through a combination of direct visits and the completion of questionnaires by sunflower farmers in Khoy County (Figure 2). The research methodology employed a two-stage method of simple random sampling. In the first stage, farmers were randomly chosen from the pool of rural residents within the study area. The appropriate sample size was determined using the Cochran formula [25], as follows;
where ‘n’ represents the sample size (140 in this study), ‘N’ is the statistical population size of sunflower farmers in the region, ‘t’ is the acceptable confidence coefficient obtained from the table assuming a normal distribution of the desired property, ‘s2’ is the estimated variance of the study property in the population (in this case the variance of energy balance in the study area) and ‘d’ is the acceptable margin of error for the proportion being estimated.
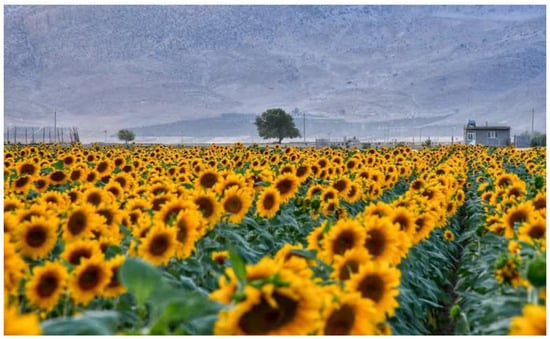
Figure 2.
A sunflower farm in Khoy County.
After collecting the data, the mean of each variable was calculated, and, based on the energy equations collected from various sources (Table 1 and Table 2), they were converted to MJ·ha−1. Notably, human labor input was calculated from the total hours of labor spent on various agricultural operations, including plowing, disking, leveling, fencing, seed sowing, fertilizing, pesticide application, irrigation, harvesting, and transportation.

Table 1.
Basic status of farms.

Table 2.
Energy equivalents for input and output values in sunflower fields.
Additionally, the input of machinery and equipment included the working hours of the machinery and tools used from planting to harvesting and transport in the field. Furthermore, fuel input was the amount of gasoline and diesel used for various operations, such as plowing, planting, irrigation, fertilizing, harvesting, and transportation per hectare.
Chemical fertilizer is one of the essential inputs in agriculture, and it was considered as pure amounts in the study area. Pesticide input includes the consumption of herbicides, fungicides, and insecticides used in the study area and was evaluated under the variable of chemical poisons.
Water input was assessed using the conversion coefficient of the amount of irrigation water to the energy input per MJ·ha−1 (Table 1). This variable was considered to be an independent one. The seed input was recorded for each hectare of sunflower cultivation and, after multiplying by the conversion factor, it was calculated in MJ·ha−1 (Table 2). In addition, crop yield and residues were recorded as the output energies of various farms.
2.3. Energy Indices
Energy indices, energy efficiency, and net energy gain were obtained using the formula reported in [26], as presented in Table 3.

Table 3.
Coefficient of energy indices.
2.4. Neural Network
Using the data obtained from the questionnaires, the ANN model was implemented using Matlab 2016a software. The structure of the employed model aimed to predict the output energy in the cultivation of oil sunflowers in Khoy County based on the energy of the input factors. To achieve this, all data were divided into three sets: training (50% of the data), testing (25% of the data), and validation (25% of the data).
A multilayer perceptron neural network was used in the backpropagation algorithm. The network consisted of an input layer with eight neurons (representing input energies) and an output layer with one neuron (representing output energy). Additionally, one and two hidden layers were employed at five different levels of neuron count (2, 4, 6, 8, and 10). Figure 3 illustrates the structure of the multilayer perceptron. In this study, the Levenberg–Marquardt algorithm was used for weight adjustment in the ANN. This algorithm was chosen for its quick network training and minimizing of the error level, making it one of the most widely used algorithms in this field.
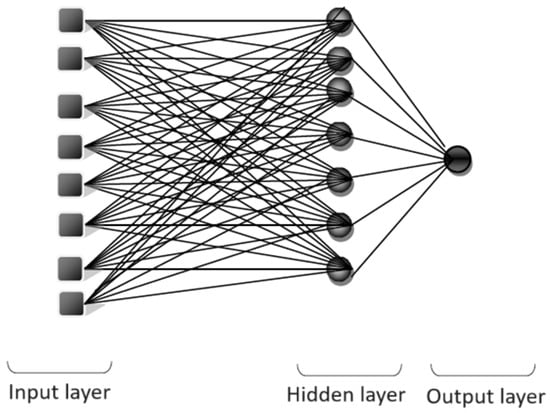
Figure 3.
Multilayer perceptron structure for prediction of the output energy for the sunflower oil product.
2.5. Adaptive Neuro-Fuzzy Inference System (ANFIS)
To manage cognitive uncertainty, a novel approach has emerged by integrating neural networks with fuzzy logic, giving rise to a scientific term known as Neuro-Fuzzy. In a typical ANFIS, the network processes 2, 3, or 4 input variables to generate a model [33]. However, the conventional ANFIS is constrained by a maximum of 5 input variables, as expanding beyond this threshold results in an increased rule number and computational time. This limitation poses a challenge in effectively modeling outputs based on an increased number of inputs [18].
To address this constraint, innovative techniques such as data clustering can be employed [33]. In this study, the input variables, as shown in Figure 4, were combined pairwise, and each pair entered a standard ANFIS. In the second stage, ANFIS 5 combined the predicted values of ANFIS 1 and 2, and ANFIS 6 combined the predicted values of ANFIS 3 and 4. Finally, the predicted values of ANFIS 5 and 6 were combined as input for ANFIS 7, and the output of ANFIS 7 represented the predicted energy value of the oil seed sunflower production. All ANFIS structures were evaluated and examined with triangular (trimf), bell-shaped (gbellmf), and Gaussian (gaussmf) membership functions using MATLAB 2017 software with two and three inputs.
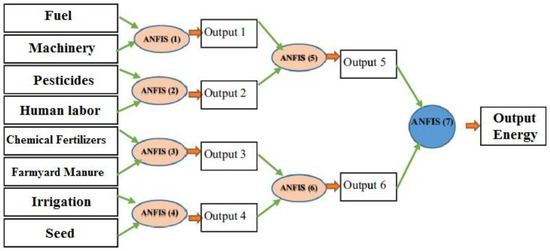
Figure 4.
Three-level ANFIS structure to predict the output energy of sunflower oil product.
For reasons of uniformity of the ANFIS structure and the presence of eight inputs, the input energy of the fertilizers was divided into two parts: chemical fertilizers and animal manure.
2.6. Evaluation of Model Performance
To assess the predictive capabilities of the models developed in this study, statistical indices such as the coefficient of determination (R2) and the mean absolute percentage error (MAPE) were used (Equations (2) and (3)).
Formulas for R2 and MAPE are commonly used in regression analysis to assess how well a model predicts the observed results. They provide insights into the goodness of fit and the accuracy of the model predictions.
Here, Zi and Ti represent the actual and predicted values, respectively. The smaller the value of R2 and MAPE, the better the model predicts the relationship between independent and dependent variables [17].
2.7. Data Analysis
For data analysis and the visualizations, Excel 2017 and MATLAB 2017 software were used.
3. Results and Discussion
3.1. Energy Flow
The input and output energies in the production of sunflowers in the study area and their energy equations are presented in Table 4. Furthermore, each input and output contribution to the energy values is illustrated in Figure 5.

Table 4.
Amounts of inputs and outputs in Sunflower fields of Khoy County.
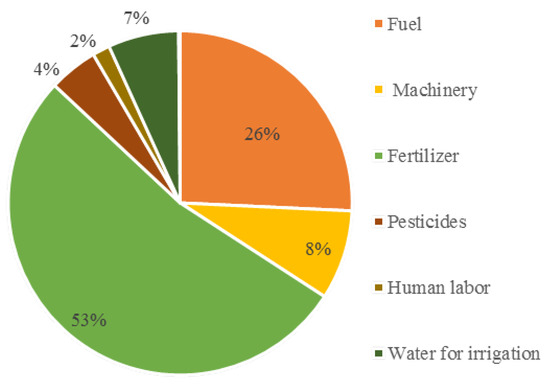
Figure 5.
Contribution of each input to the total input energy.
The total energy required for cultivation was 31,001.61 MJ·ha−1. Among various inputs, chemical fertilizers had the highest contribution, constituting 16,369.83 MJ·ha−1 (52.8%). Furthermore, nitrogen fertilizers, in particular, contributed the most to the total energy input, with 13,635 MJ·ha−1 (43.98%).
The second largest input was fuel, accounting for 145.16 L·ha−1, representing 25.74% of the total energy consumption in sunflower farms. Taking into account the significant use of machinery in sunflower cultivation in the region, machinery constituted the third most consumed input at 2610.20 MJ·ha−1 (8.42%).
Sunflower cultivation in the Khoy region was completely irrigated, requiring an average of 3271.2 L·ha−1 of each growing season, equivalent to 6.65% of the total energy input. Furthermore, pesticides contributed 1425.67 MJ·ha−1 (6.65%) to the total energy input in sunflower cultivation. Among pesticides, herbicides (mostly Paraquat) with an average of 3.33 L·ha−1 (3.10%) had the highest share among various pesticides. Furthermore, human labor accounted for 509.76 MJ·ha−1, representing 1.64% of the total energy input in sunflower cultivation. Harvesting operations had the highest share of labor energy use, contributing 1.27% to the total. Furthermore, based on questionnaire data analysis, the average energy production in sunflower farms in Khoy was 246,666.67 MJ·ha−1. Approximately 11% of this energy was associated with seeds, and the remaining 89% was related to the stalks and husks produced (Figure 6).
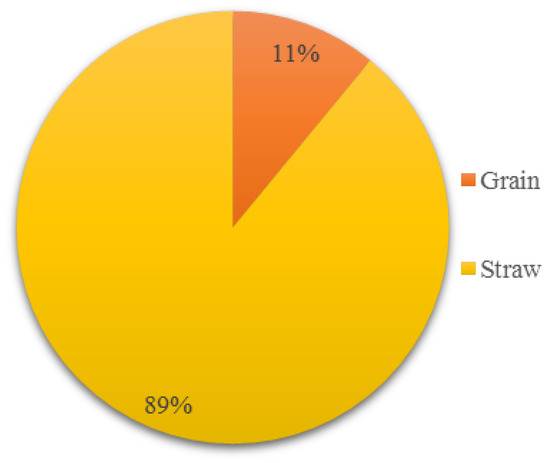
Figure 6.
Contribution of each of the outputs to the total output energy.
3.2. Energy Indices
The share of each energy category from the total energy produced is presented in Table 5. The results indicate that direct and indirect energy shares from total energy consumption in sunflower production are 27.39% and 72.61%, respectively.

Table 5.
Classification of the type of energy consumption and the share of each in the production of sunflower oil.
Only 1.64% of the total input energy in sunflower cultivation is supplied by renewable resources, while the remaining 98.36% comes from non-renewable energy sources. These findings reveal that fossil fuels, machinery, and chemical pesticides constitute a significant portion of the energy consumption, which is non-renewable. In contrast, human labor and seeds contribute a relatively small share of renewable energy sources.
The overconsumption of non-renewable energy resources in conventional agricultural systems and their long-term physical, chemical, and biological effects on the soil can lead to the instability of these agricultural systems. Therefore, it is essential to develop technologies and design new agricultural systems, considering the specific policies of policy makers, to create more efficient and environmentally friendly production systems [34].
The energy indices for sunflower production have been calculated in two distinct states, namely seed and biological (comprising both seed and straw) (Table 6). The energy ratio, indicative of energy efficiency, was determined to be 1.57 for seed production and 7.96 for the combined production of seeds and straw.

Table 6.
Energy indices of sunflower oil production in Khoy County.
Energy efficiency in sunflower seed production was calculated as 0.06 MJ·ha−1, and the total energy for seeds and straw was calculated at 0.57 MJ·ha−1. This means that, for every MJ of energy consumption, 0.06 kg of sunflower seeds are produced. The energy efficiency was approximately 11%, indicating that approximately 89% of the energy produced was related to the straw.
In the absence of proper utilization of this straw, energy efficiency would decrease significantly. In other studies on various products, the energy efficiency for cumin and fennel was 0.66 and 0.52 MJ·ha−1, respectively [12], and for button mushrooms, it was 0.01 MJ·ha−1 [22]. The net energy added for seeds and seeds + sprout was 17,748.39 MJ·ha−1 and 215,665.06 MJ·ha−1, respectively. In particular, the results of this study are specific to sunflower production in a particular research context and may not be generalizable to other fields or agricultural products. Considering the limitations of the study is important when interpreting the results.
It is essential to take into account broader concepts in the findings. Although energy consumption efficiency and environmental impacts are crucial considerations, other factors such as economic viability, social effects, and nutritional value may also be important when deciding on product production [12]. Therefore, a comprehensive and holistic approach that considers multiple factors may be necessary to ensure sustainable and responsible product production.
3.3. Prediction of Output Energy
3.3.1. Neural Network
To predict the output energy in oilseed sunflower production, this study employed ANN models; specifically, multilayer artificial neural networks utilizing the error backpropagation learning method were utilized.
The optimization process involved exploring various network structures, including those with one and two layers and featuring two, four, six, eight, and ten neurons in the hidden layer. These structures were systematically trained, tested, and validated to determine the most effective artificial neural network configuration for modeling the output energy in oilseed sunflower production.
The results are presented in Table 7. Based on the modeling results, the model with eight inputs, one hidden layer with six neurons, and one output was identified as the best structure. Tanh sigmoid activation functions in the hidden layers and linear activation in the output layer were employed for the optimal network. The chosen model, which shows determination coefficients (R2) of 0.97, 0.94 and 0.90 together with MAPE values of 1.55%, 1.77% and 2.08% for testing, training, and validation data, respectively, has been identified as the optimal configuration. This model is proven to be the most reliable for accurately predicting the output energy of sunflower oil based on the input energy variables used in the study. Figure 7 shows the distribution of actual and predicted data by the model for both training and testing data.

Table 7.
ANN error parameters with different structures to predict sunflower output energy.
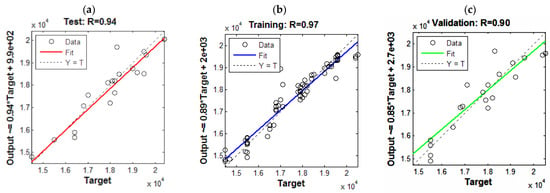
Figure 7.
Correlation between the predicted and actual output energy values in test (a) training (b) and validation (c) data.
Previously, Nabavi-Pelesaraei et al. [17] reported the prediction of output energy and greenhouse gas emissions in rice production using an ANN. They identified the ANN model with a 12-6-8-1 structure as the best for predicting output energy, achieving an R2 range of 0.524 to 0.999 for energy input and environmental effects in training the ANN models. Similarly, Nabavi Belouz et al. [35] used an ANN to predict output energy and greenhouse gas emissions in greenhouse tomato production. The results indicated that a network with an input layer comprising 12 neurons, two hidden layers each with 34 neurons, and an output layer with 1 neuron was the optimal model. Furthermore, Ghasemi-Mobtaker et al. [21] estimated the output energy and greenhouse gas emissions in wheat production. They noted that the best results for performance estimation were obtained using a multilayer perceptron network with two hidden layers, with an R2 of 0.520 and 0.962, respectively.
3.3.2. Adaptive Neuro-Fuzzy Inference System (ANFIS)
To model the output energy of the sunflower oilseed, various membership functions, including trimf, gbellmf, and gaussmf, were used. The specifications of the best model for modeling with an ANFIS are presented in Table 8, and the correlation between predicted and calculated values for the final ANFIS is depicted in Figure 8. The results indicated that the statistical indices R2 and MAPE for the final ANFIS were 0.97 and 4.2, respectively. This shows the high capacity of the multilevel ANFIS in predicting the energy produced through oilseed sunflower cultivation in Khoy County. Similar results have been reported for predicting output energy in the cultivation of rapeseed [18], wheat [21], and cumin and fennel [12]. These findings highlight the great potential of multilevel ANFISs in predicting energy consumption in various agricultural crops.

Table 8.
Error parameters for predicting sunflower output energy using a three-level ANFIS.
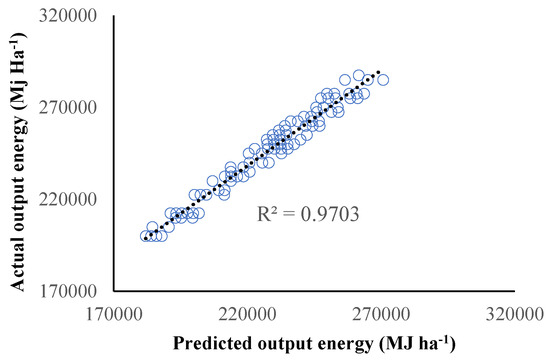
Figure 8.
Correlation of the predicted ANFIS values and actual energy output of sunflower oil.
3.3.3. Comparison between ANNs and ANFISs
Based on the indicators evaluated in Table 6 and Table 7, as well as Figure 7 and Figure 8, the predicted R2 values of the ANFIS model are higher than those of the ANN model. Accordingly, it seems that, compared to the ANN, the predicted values by the ANFIS have a better correlation with the actual output energy values. However, considering another parameter used for model performance comparison (MAPE), the ANFIS predicts values with a lower error percentage compared to the artificial neural network.
Another important factor in selecting the best model is the computational time during the learning phase. The overall computational time of the ANFIS is significantly less than that of the ANN, especially when compared to the multilayer artificial neural network [17]. Therefore, it is evident that the ANFIS exhibits a superior efficiency in predicting energy output in oilseed sunflower cultivation.
As mentioned in previous sections, the main inputs in the energy consumption of oilseed sunflower farms are chemical fertilizers and diesel fuel, which significantly impact production costs and environmental damage. Hence, it is recommended to reduce the consumption of these inputs through appropriate substitution.
Using the proposed models, it becomes possible to predict the effects of reducing fuel and fertilizer consumption in regard to sunflower oil seeds. In the prediction of energy production, the impact of reducing fuel and fertilizer consumption is readily apparent.
The results offer valuable information for future farm planning efforts, enabling the optimization of energy consumption and subsequently improving economic efficiency and overall performance. Furthermore, given the high credibility of these models, there is a reduction in the risk associated with long-term planning, providing an additional assurance to farm planners in making informed decisions.
4. Conclusions
Examining the energy dynamics in oilseed sunflower cultivation in Khoy County reveals that the input and output energy for these ecosystems were 31,001.61 and 246,666.67 MJ·ha−1, respectively. Key contributors to total input energy include chemical nitrogen fertilizers, consumed fuel, and machinery. Notably, indirect energy surpasses direct energy, and non-renewable resources outweigh renewable resources. This indicates a significant reliance on non-renewable energy sources in the region. This emphasizes the imperative to transition to renewable energy sources to improve sustainability in oilseed sunflower production. The seed energy efficiency of approximately 11% highlights the substantial energy contribution of straw. Energy efficiency, which constitutes approximately 11% of the overall efficiency of biological energy, highlights that a significant 89% of the energy produced energy was associated with the straw component. The proper utilization of this straw is paramount, as neglecting its use could lead to a drastic decrease in overall energy efficiency. In comparison between ANNs and ANFISs, the latter stands out for its notable speed and accuracy, reflected in a high-correlation coefficient (R2 = 0.97). This could make a multilevel ANFIS a valuable tool for managers, offering the capability of accurately predict the energy output of large-scale agricultural production systems within the agricultural sector.
Author Contributions
Conceptualization, H.L.N., E.T. and V.R.S.; methodology, H.L.N. and V.R.S.; software, M.T.; validation, V.R.S. and M.T.; formal analysis, J.T.; investigation, H.L.N.; resources, V.R.S., E.T. and A.S.; data curation, J.T.; writing—original draft preparation, V.R.S., E.T., J.T. and A.S.; writing—review and editing, V.R.S., A.S., E.T., J.T. and A.S.; visualization, E.T. and V.R.S.; supervision, E.T. and V.R.S.; project administration, E.T. and V.R.S. All authors have read and agreed to the published version of the manuscript.
Funding
This project was financed by University of Mohaghegh Ardabili and also, this research was financed by the NAWA—Polish National Agency for Academic Exchange under the Ulam NAWA Program (Project No. BPN/ULM/2021/1/00231) at Wroclaw University of Environmental and Life Science (UPWr) in Poland. The APC is financed by Wrocław University of Environmental and Life Sciences.
Data Availability Statement
Data are contained within the article.
Acknowledgments
The authors are highly thankful to UPWr and the University of Mohaghegh Ardabili for providing facilities to complete this research work and write this report.
Conflicts of Interest
The authors declare no conflict of interest.
References
- Godfray, H.C.J.; Garnett, T. Food security and sustainable intensification. Philos. Trans. R. Soc. Lon. B Biol. Sci. 2014, 369, 20120273. [Google Scholar] [CrossRef] [PubMed]
- Mostashari-Rad, F.; Ghasemi-Mobtaker, H.; Taki, M.; Ghahderijani, M.; Saber, Z.; Chau, K.-W.; Nabavi-Pelesaraei, A. Data supporting midpoint-weighting life cycle assessment and energy forms of cumulative exergy demand for horticultural crops. Data Brief 2020, 33, 106490. [Google Scholar] [CrossRef] [PubMed]
- Adegbeye, M.; Reddy, P.R.K.; Obaisi, A.; Elghandour, M.; Oyebamiji, K.; Salem, A.; Morakinyo-Fasipe, O.; Cipriano-Salazar, M.; Camacho-Díaz, L. Sustainable agriculture options for production, greenhouse gasses and pollution alleviation, and nutrient recycling in emerging and transitional nations-An overview. J. Clean. Prod. 2020, 242, 118319. [Google Scholar] [CrossRef]
- Nabavi-Pelesaraei, A.; Rafiee, S.; Hosseini-Fashami, F.; Chau, K.-w. Artificial neural networks and adaptive neuro-fuzzy inference system in energy modeling of agricultural products. In Predictive Modelling for Energy Management and Power Systems Engineering; Elsevier: Amsterdam, The Netherlands, 2021; pp. 299–334. [Google Scholar]
- Khanali, M.; Kokei, D.; Aghbashlo, M.; Nasab, F.K.; Hosseinzadeh-Bandbafha, H.; Tabatabaei, M. Energy flow modeling and life cycle assessment of apple juice production: Recommendations for renewable energies implementation and climate change mitigation. J. Clean. Prod. 2020, 246, 118997. [Google Scholar] [CrossRef]
- Zhang, L.; Pang, J.; Chen, X.; Lu, Z. Carbon emissions, energy consumption and economic growth: Evidence from the agricultural sector of China’s main grain-producing areas. Sci. Total Environ. 2019, 665, 1017–1025. [Google Scholar] [CrossRef]
- Sharafi, S.; Kazemi, A.; Amiri, Z. Estimating energy consumption and GHG emissions in crop production: A machine learning approach. J. Clean. Prod. 2023, 408, 137242. [Google Scholar] [CrossRef]
- Elahi, E.; Weijun, C.; Zhang, H.; Abid, M. Use of artificial neural networks to rescue agrochemical-based health hazards: A resource optimisation method for cleaner crop production. J. Clean. Prod. 2019, 238, 117900. [Google Scholar] [CrossRef]
- Debaeke, P.; Casadebaig, P.; Flenet, F.; Langlade, N. Sunflower crop and climate change: Vulnerability, adaptation, and mitigation potential from case-studies in Europe. Ocl. Oilseeds Fats Crops Lipids 2017, 24, 15. [Google Scholar] [CrossRef]
- Iran, M.o.A.o. Report on the Area, Production, and Performance of Agricultural Products in the Agricultural Year 2020–2021; IPAD: Washington, DC, USA, 2022. [Google Scholar]
- Alam, A.; Mohanty, A. Predicting Students’ Performance Employing Educational Data Mining Techniques, Machine Learning, and Learning Analytics. In Proceedings of the International Conference on Communication, Networks and Computing, Gwalior, India, 8–10 December 2022; pp. 166–177. [Google Scholar]
- Mirzaei, J.; Parashkoohi, M.G.; Zamani, D.M.; Afshari, H. Examining energy use efficiency and conducting an environmental life cycle assessment through the application of artificial intelligence: A case study on the production of cumin and fennel. Results Eng. 2023, 20, 101522. [Google Scholar] [CrossRef]
- Tahmasebi-Boldaji, R.; Ghazanfari, S.; Kuyakhi, H.R.; Boldaji, N.T.; Torki, M. Experimental investigation of ultrasonic cycle/magnetic stirrer (UC/MS) effect on water/α-Al2O3 nanofluid stability and thermal conductivity and its ANFIS/PSO modeling. Results Eng. 2023, 19, 101284. [Google Scholar] [CrossRef]
- Malami, S.I.; Anwar, F.H.; Abdulrahman, S.; Haruna, S.; Ali, S.I.A.; Abba, S. Implementation of hybrid neuro-fuzzy and self-turning predictive model for the prediction of concrete carbonation depth: A soft computing technique. Results Eng. 2021, 10, 100228. [Google Scholar] [CrossRef]
- Veza, I.; Panchal, H.; Paristiawan, P.A.; Idris, M.; Fattah, I.R.; Putra, N.R.; Silambarasan, R. Improved prediction accuracy of biomass heating value using proximate analysis with various ANN training algorithms. Results Eng. 2022, 16, 100688. [Google Scholar] [CrossRef]
- Işık, E.; Inallı, M. Artificial neural networks and adaptive neuro-fuzzy inference systems approaches to forecast the meteorological data for HVAC: The case of cities for Turkey. Energy 2018, 154, 7–16. [Google Scholar] [CrossRef]
- Nabavi-Pelesaraei, A.; Rafiee, S.; Mohtasebi, S.S.; Hosseinzadeh-Bandbafha, H.; Chau, K.-w. Integration of artificial intelligence methods and life cycle assessment to predict energy output and environmental impacts of paddy production. Sci. Total Environ. 2018, 631, 1279–1294. [Google Scholar] [CrossRef] [PubMed]
- Mousavi-Avval, S.H.; Rafiee, S.; Sharifi, M.; Hosseinpour, S.; Shah, A. Combined application of life cycle assessment and adaptive neuro-fuzzy inference system for modeling energy and environmental emissions of oilseed production. Renew. Sustain. Energy Rev. 2017, 78, 807–820. [Google Scholar] [CrossRef]
- Boroujeni, M.S.; Dizaji, H.Z.; Soleimani, M. Evaluation of environmental impacts and energy use of sugar beet production and predicting the Yield using ANN and ANFIS in Chaharmahal and Bakhtiari province of Iran. J. Mech. Res. Agric. Mach. 2020, 9, 107–118. [Google Scholar]
- Jargan, H.; Rohani, A.; Kosari-Moghaddam, A. Application of modeling techniques for energy analysis of fruit production systems. Environ. Dev.Sustain. 2022, 24, 2616–2639. [Google Scholar] [CrossRef]
- Ghasemi-Mobtaker, H.; Kaab, A.; Rafiee, S.; Nabavi-Pelesaraei, A. A comparative of modeling techniques and life cycle assessment for prediction of output energy, economic profit, and global warming potential for wheat farms. Energy Rep. 2022, 8, 4922–4934. [Google Scholar] [CrossRef]
- Taherzadeh-Shalmaei, N.; Rafiee, M.; Kaab, A.; Khanali, M.; Rad, M.A.V.; Kasaeian, A. Energy audit and management of environmental GHG emissions based on multi-objective genetic algorithm and data envelopment analysis: An agriculture case. Energy Rep. 2023, 10, 1507–1520. [Google Scholar] [CrossRef]
- Kazemi, N.; Parashkoohi, M.G.; Mohammadi, A.; Zamani, D.M. Environmental life cycle assessment and energy-economic analysis in different cultivation of microalgae-based optimization method. Results Eng. 2023, 19, 101240. [Google Scholar] [CrossRef]
- Beni, M.S.; Parashkoohi, M.G.; Beheshti, B.; Ghahderijani, M.; Bakhoda, H. Application of machine learning to predict of energy use efficiency and damage assessment of almond and walnut production. Environ. Sustain. Indic. 2023, 20, 100298. [Google Scholar] [CrossRef]
- Cochran, W.G. Sampling Techniques; John Wiley & Sons: Hoboken, NJ, USA, 1977. [Google Scholar]
- Uzunoz, M.; Akcay, Y.; Esengun, K. Energy input-output analysis of sunflower seed (Helianthus annuus L.) oil in Turkey. Energy Sources B Econ. Plan. Policy 2008, 3, 215–223. [Google Scholar]
- Singh, H.; Mishra, D.; Nahar, N. Energy use pattern in production agriculture of a typical village in arid zone, India––Part I. Energy Convers. Manag. 2002, 43, 2275–2286. [Google Scholar] [CrossRef]
- Singh, H.; Mishra, D.; Nahar, N.; Ranjan, M. Energy use pattern in production agriculture of a typical village in arid zone India: Part II. Energy Convers. Manag. 2003, 44, 1053–1067. [Google Scholar] [CrossRef]
- Fluck, R.C. Energy in Farm Production; Elsevier: Amsterdam, The Netherlands, 2012. [Google Scholar]
- Ozkan, B.; Kurklu, A.; Akcaoz, H. An input–output energy analysis in greenhouse vegetable production: A case study for Antalya region of Turkey. Biomass Bioenergy 2004, 26, 89–95. [Google Scholar] [CrossRef]
- Singh, S.; Mittal, J. Energy in Production Agriculture; Mittal Publications: Delhi, India, 1992. [Google Scholar]
- Hülsbergen, K.-J.; Feil, B.; Biermann, S.; Rathke, G.-W.; Kalk, W.-D.; Diepenbrock, W. A method of energy balancing in crop production and its application in a long-term fertilizer trial. Agric. Ecosyst. Environ. 2001, 86, 303–321. [Google Scholar] [CrossRef]
- Khoshnevisan, B.; Rafiee, S.; Iqbald, J.; Shamshirbande, S.; Omid, M.; Anuarf, N.; Abdul Wahabg, A. A comparative study between artificial neural networks and adaptive neuro-fuzzy inference systems for modeling energy consumption in greenhouse tomato production-a case study in Isfahan Province. J. Agr. Sci. Technol. 2015, 17, 49–62. [Google Scholar]
- Hemmatian, B.; Casal, J.; Planas, E.; Hemmatian, B.; Rashtchian, D. Prediction of BLEVE mechanical energy by implementation of artificial neural network. J. Loss Prev. Process Ind. 2020, 63, 104021. [Google Scholar] [CrossRef]
- Belouz, K.; Nourani, A.; Zereg, S.; Bencheikh, A. Prediction of greenhouse tomato yield using artificial neural networks combined with sensitivity analysis. Sci. Hortic. 2022, 293, 110666. [Google Scholar] [CrossRef]
Disclaimer/Publisher’s Note: The statements, opinions and data contained in all publications are solely those of the individual author(s) and contributor(s) and not of MDPI and/or the editor(s). MDPI and/or the editor(s) disclaim responsibility for any injury to people or property resulting from any ideas, methods, instructions or products referred to in the content. |
© 2024 by the authors. Licensee MDPI, Basel, Switzerland. This article is an open access article distributed under the terms and conditions of the Creative Commons Attribution (CC BY) license (https://creativecommons.org/licenses/by/4.0/).