Article

Equivalent Thermal Conductivity of Topology-Optimized Composite Structure for Three Typical Conductive Heat Transfer Models

1
School of Materials Science and Engineering, Baise University, Baise 533000, China
2
School of Physics and Electronics, Nanning Normal University, Nanning 530100, China
*
Author to whom correspondence should be addressed.
Energies 2024, 17(11), 2558; https://doi.org/10.3390/en17112558
Submission received: 8 May 2024 / Revised: 22 May 2024 / Accepted: 23 May 2024 / Published: 24 May 2024

Abstract

:
Composite materials and structural optimization are important research topics in heat transfer enhancement. The current evaluation parameter for the conductive heat transfer capability of composites is effective thermal conductivity (ETC); however, this parameter has not been studied or analyzed for its applicability to different heat transfer models and composite structures. In addition, the optimized composite structures of a specific object will vary when different optimization methods and criteria are employed. Therefore, it is necessary to investigate a suitable method and parameter for evaluating the heat transfer capability of optimized composites under different heat transfer models. Therefore, this study analyzes and summarizes three typical conductive heat transfer models: surface-to-surface (S-to-S), volume-to-surface (V-to-S), and volume-to-volume (V-to-V) models. The equivalent thermal conductivity ( k eq ) is proposed to evaluate the conductive heat transfer capability of topology-optimized composite structures under the three models. A validated simulation method is used to obtain the key parameters for calculating k eq . The influences of the interfacial thermal resistance and size effect on k eq are considered. The results show that the composite structure optimized for the V-to-S and V-to-V models has a k eq value of only 79.4 W m−1 K−1 under the S-to-S model. However, the k eq values are 233.4 W m−1 K−1 and 240.3 W m−1 K−1 under the V-to-S and V-to-V models, respectively, which are approximately 41% greater than those of the in-parallel structure. It can be demonstrated that k eq is more suitable than the ETC for evaluating the V-to-S and V-to-V heat transfer capabilities of composite structures. The proposed k eq can serve as a characteristic parameter that is beneficial for heat transfer analysis and composite structural optimization.

1. Introduction

Thermal conductivity is the ability of an object to conduct heat. It is an important thermal property for materials, especially for solid-state heat transfer. Although there are numerous methods for measuring thermal conductivity, there are generally two basic techniques: steady-state methods and transient or non-steady-state methods [1]. However, no method can be applied to all application fields, measurement ranges, accuracies, or sample shapes and sizes [2,3]. At present, the research and testing of thermal conductivity are no longer limited to a single material due to the development of composite materials. Effective thermal conductivity (ETC) has become an important parameter for evaluating the heat conductive capability of composite materials. The measurement, prediction, and optimization of the ETC are important research topics in the field of composite materials [4,5].
The ETC commonly represents the effectiveness of the overall thermal conductivity of dispersed composites [5] and can be experimentally tested using the steady-state heat flow method [1] or laser flash analysis (LFA) [6]. Current studies have tended to focus more on theoretical calculations and predictions of ETC, such as for particle/fiber dispersed composites [7] and porous composites [8]. However, challenges remain in improving the accuracy and applicability of calculations and predictions of the ETC due to the generally uneven distributions and random orientations of composite materials [9,10]. In addition, the conductive heat transfer models of the abovementioned composite materials and experimental test methods mainly consider the heat conduction between two specific planes within a specific distance, which corresponds to the basic definition of thermal conductivity. For different composite material application scenarios, such as heat conduction/dissipation in electronic devices [11] and conductive heat regeneration in solid-state caloric cooling devices [12], there will be different conductive heat transfer models and requirements. The methods of heat transfer enhancement and heat transfer capability evaluation will also be different.
The heat flux flows along the path with the minimum thermal resistance when heat is transferred inside an object. Optimizing the heat flux by reducing thermal resistance is the key to enhancing conductive heat transfer [13]. To avoid the limitations of a single material with a low thermal conductivity, many studies have investigated composite materials and optimized composite structures. For the heat transfer optimization of dispersed composite materials, the addition of high-thermal-conductivity materials, such as nanomaterials [14,15] and carbon nanotubes [16,17], enhances the local heat flux, leading to larger thermal conductivity. In some studies of porous composites, metal foams and networks were constructed to improve the continuity of the heat conductive path, which ensured a certain heat transfer capability while meeting functional requirements [18,19]. In the field of electronic device cooling, heat sinks are important for thermal management, because heat can dissipate quickly to ensure the normal operation of core components. It is also necessary to optimize the heat conductive path and composite material layout [11,20]. In the field of solid-state refrigeration, materials with a high caloric effect have a low thermal conductivity and require the insertion of high-thermal-conductivity materials to improve heat transfer from the substrate to cold/hot ends and heat regeneration between substrates, thus establishing an adequate temperature span and achieving a sufficient cooling performance [12,21]. To summarize, the key to enhancing the conductive heat transfer of composites is to construct an efficient and continuous heat conductive path [22]. Currently, there are many powerful methods for optimizing the layout and structure of conductive composites, such as constructal theory [23], topology optimization [24], genetic algorithms [25], and bionic optimization [26], etc. These methods can form efficient and continuous heat conductive paths and have been widely studied and applied in the field of heat transfer enhancement.
However, the heat transfer models for the abovementioned scenarios are different, and the optimized composite structures of a specific object will vary when different optimization methods and criteria are employed. A comparison of different conductive heat transfer models and a unified characteristic parameter for heat transfer capability are lacking in the literature. The aforementioned ETC for evaluating the heat transfer capability of dispersed composites is under a surface-to-surface (S-to-S) heat transfer model [5]. The heat transfer model of heat sink/dissipation is volume-to-surface (V-to-S) [27], and that of solid-state refrigeration is V-to-S or volume-to-volume (V-to-V) [12]. Therefore, the widely used ETC is not suitable for evaluating the heat transfer capabilities of different composite structures under different conductive heat transfer models. Specifically, for a topology-optimized composite structure under a V-to-S or V-to-V heat transfer model, the heat flow direction and heat flux of any part inside can be uneven, unstable, and inconsistent due to the special structural configurations and boundary conditions. In addition, there must be thermal resistance at the interface between different materials in actual composites [28]. How to incorporate and consider the influence of interfacial thermal resistance in the evaluation method is also important.
Therefore, it is necessary to investigate a suitable method and parameter for evaluating the heat transfer capability of composites, which can serve as a characteristic parameter that is beneficial for heat transfer analysis and structural optimization. Through analyzing and summarizing the typical conductive heat transfer models, this study proposed the use of the equivalent thermal conductivity ( k eq ) defined in this paper to evaluate the heat transfer capabilities of different composite structures under different conductive heat transfer models. The key parameters of k eq were obtained via numerical simulation. The characteristics and influencing factors of k eq were investigated considering the heat transfer models, interfacial thermal resistance, and size effect. A discussion and suggestions were provided to demonstrate the feasibility of using k eq as a guiding parameter for conductive heat transfer enhancement.

2. Conductive Heat Transfer Models and Structural Optimization

This section mainly investigates and discusses three typical conductive heat transfer models, S-to-S, V-to-S, and V-to-V, for three-dimensional composites, as well as the interfacial thermal resistance caused by the actual multimaterial condition. The related studies and optimizations of surface-to-line and surface-to-point models under two-dimensional conditions [29,30] are similar to those of volume-to-point (VP) and volume-to-surface models [31,32,33], which can be regarded as simplifications of three-dimensional conductive heat transfer models.

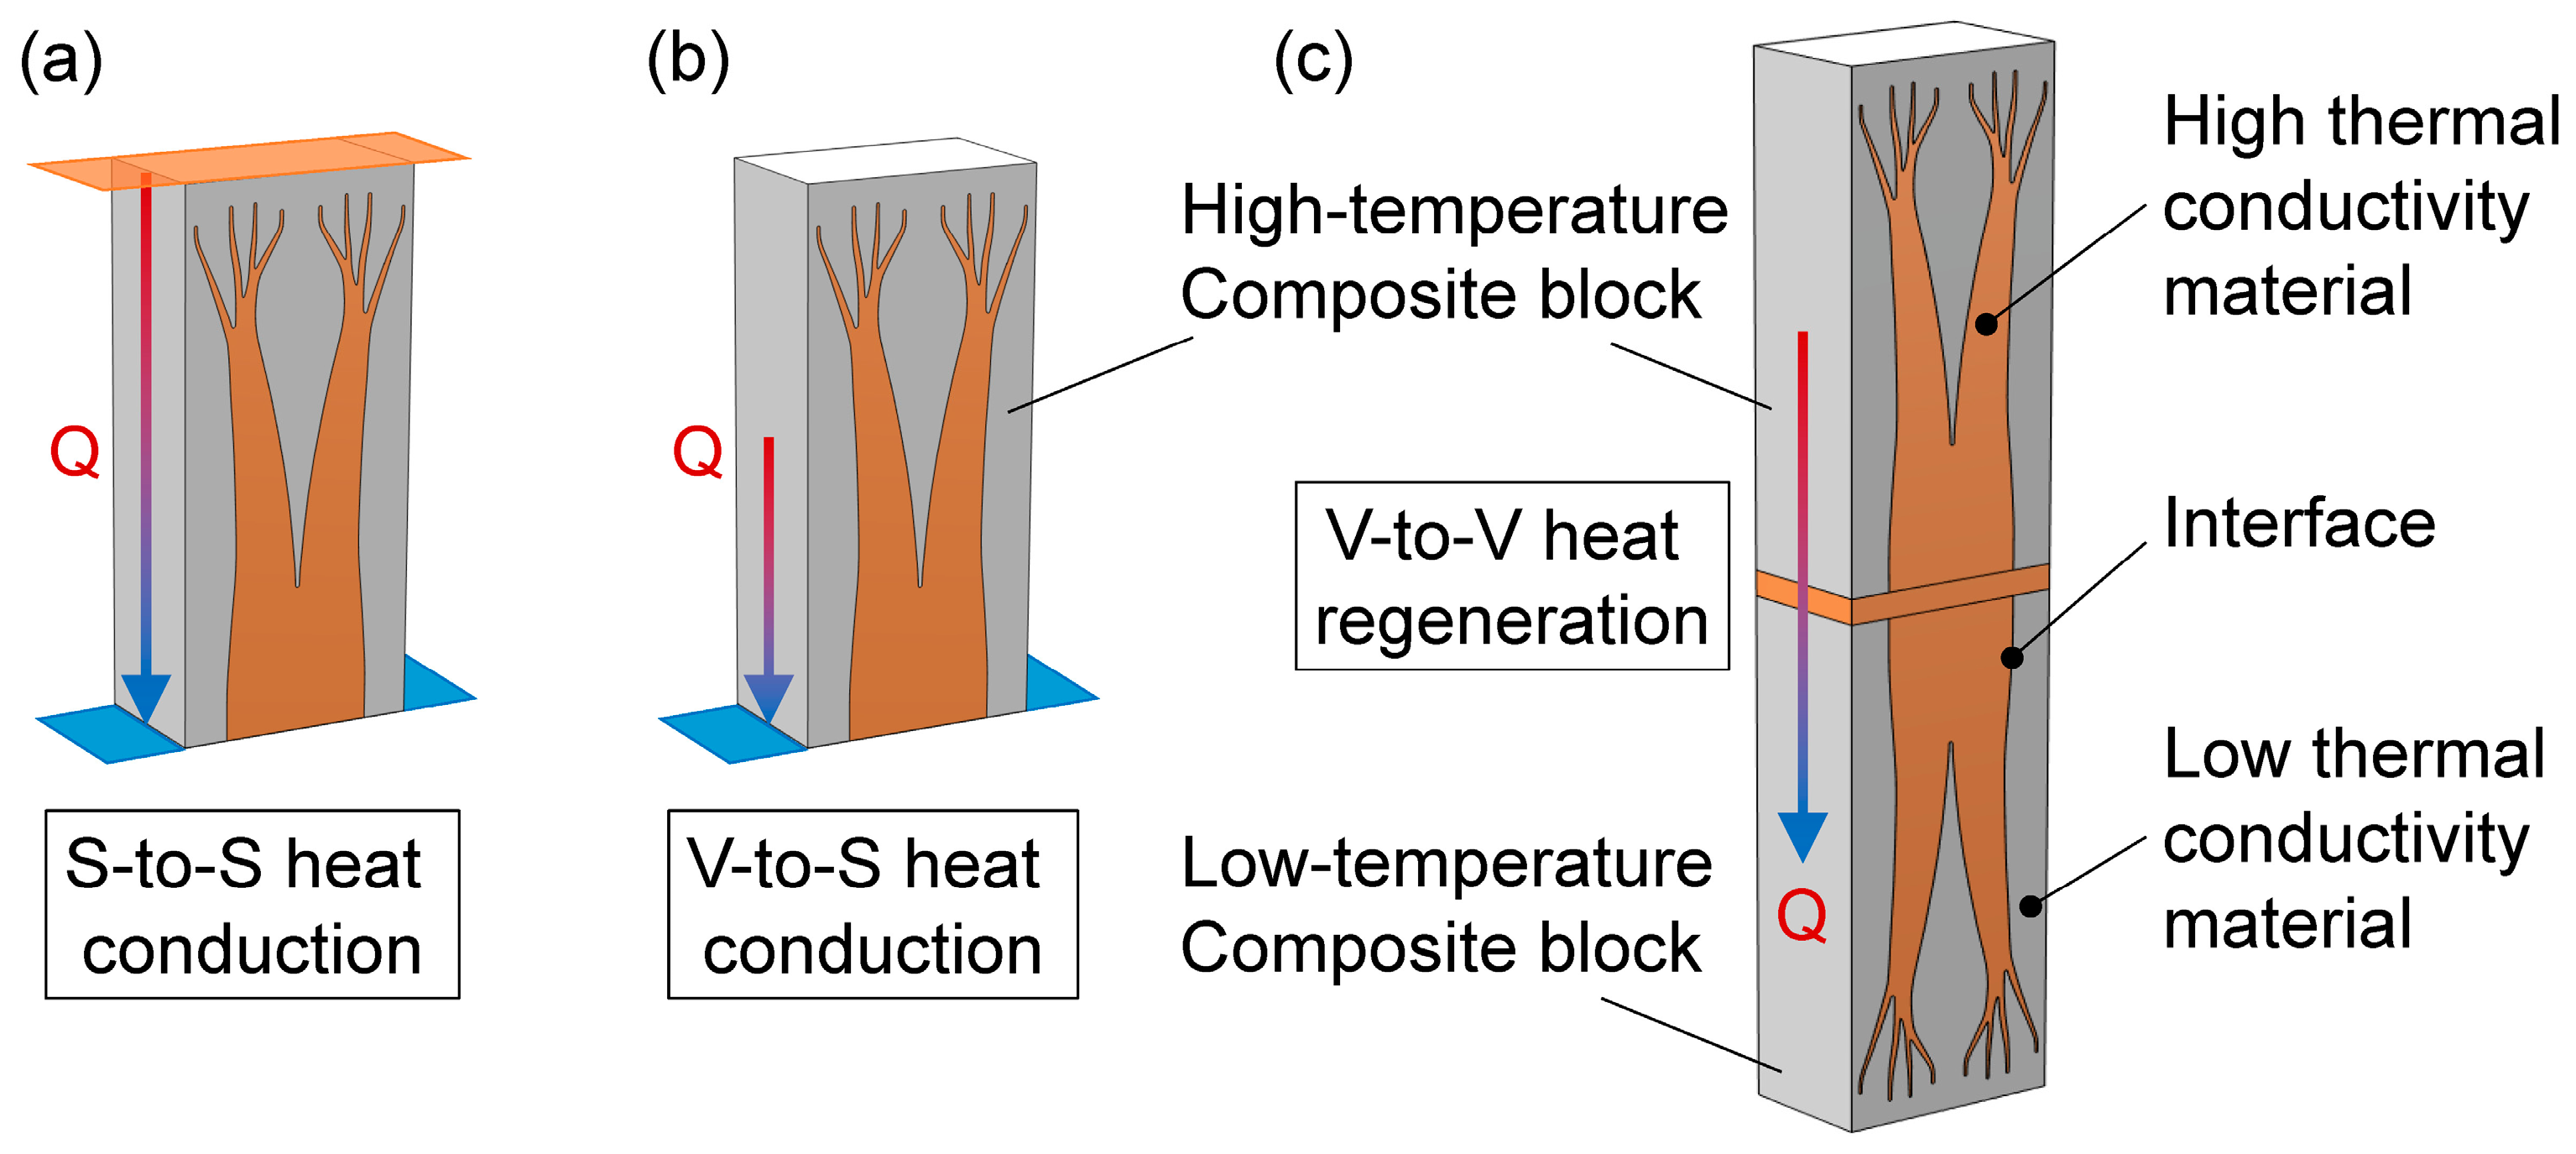
2.1. Surface-to-Surface Heat Transfer Model

The steady-state heat flow method for measuring thermal conductivity is typically an S-to-S conductive heat transfer model, which is based on Fourier’s law of heat conduction [1]. As shown in Figure 1a, a sample with a uniform thickness is inserted between two flat plates and pressurized. The temperatures of the plates are adjusted to the desired set points and measured when a steady-state condition is reached, which occurs when the heat flow rate is equal at each point of the layered system. The thermal conductivity can be calculated from the heat flow rate, temperature difference, thickness, and area of the sample, which mainly considers the steady-state heat transfer capability from one surface to the other surface.
For composite materials under the S-to-S conductive heat transfer model, the addition or insertion of high-thermal-conductivity materials or insulation materials is widely used to change the overall heat transfer capability of composites. Typical composite structures include: the dispersed particle/fiber composite (Figure 1b), the in-parallel composite (Figure 1c), and the in-series composite (Figure 1d). Among dispersed composites, the porous structure of the metal foam [34] and skeleton [35] can provide certain heat conductive paths, which is a functional and heat conductive optimization scheme. In-parallel composites are mainly used in continuous block-like composite structures for heat conduction enhancement [36], and in-series composites are mainly used in multilayer thermal insulation [37]. The difference lies in the different roles of these two processes in heat transfer. The in-parallel composite shown in Figure 1c, where high-thermal-conductivity materials are inserted along the desired direction of heat flow, has continuous heat conductive paths that enhance heat transfer by forming a “highway” of heat flow, thus improving the overall heat transfer capability. In contrast, in-series composites with different functional materials, such as composites of structural material and insulation material, as shown in Figure 1d, have a layered blocking configuration perpendicular to the direction of heat flow, which is obviously not beneficial for heat transfer and leads to “reverse optimization”. In general, the ETC of the abovementioned composites can be tested using the steady-state heat flow method through appropriate sample preparation when considering only the overall S-to-S heat transfer capability [5].

2.2. Volume-to-Surface Heat Transfer Model

The well-known ‘‘volume-to-point’’ (VP) problem has been identified and studied the most in the literature [31,38,39]. In this study, the VP problem is classified as a V-to-S heat transfer model [32,33], because VP problems rarely transfer heat to a single point and actually transfer heat to a limited small surface [39]; this can be considered an extreme case of V-to-S heat transfer. To simplify their investigation, most V-to-S heat transfer models are studied using a simple three-dimensional cuboid [32,40], which can be further simplified into a two-dimensional model. A topology optimization framework based on the solid isotropic material with penalization (SIMP) method can be adopted to design the microstructures. Numerical implementation is based on finite element and sensitivity analyses. Optimization of the density distribution can be realized by a set of topology optimization programs, including a two-dimensional program [24] and three-dimensional program [41]. The topology optimization method for heat conduction problems can be described as follows [42]:
K T = F min C x = T T K T = j = 1 N x j p   t j T   k j   t j subject   to : V x = f V 0 0 < x min x j 1
where K is the global thermal conductivity matrix. T and F are the global temperature and heat flux vectors. x is the vector of the relative densities, which are the design variables. C x represents the least dissipation of the structural heat transfer potential capacity. min C x is the objective function of the topology optimization. N is the number of square finite elements used to discretize the rectangular design domain. x j and p are the element density and the penalization power, respectively. t j and k j   are the element temperature vector and thermal conductivity matrix, respectively. V x , f and V 0 are the volume of the high-thermal-conductivity material, prescribed volume fraction, and design domain volume, respectively. x min is the minimum density (set to 0.001) to avoid mathematical singularity.
The topology optimization programs are performed in MATLAB 2016a. The optimization flowchart is shown in Figure 2. Considering the symmetric simplification of a three-dimensional model, the two-dimensional example shown in Figure 3a is chosen for this study, and this example was optimized, studied, and applied for solid-state magnetic refrigeration in the previous study [42]. The volume fraction of copper (381 W m−1 K−1), a high-thermal-conductivity material, is 34%, whereas gadolinium is a low-thermal-conductivity material (10.6 W m−1 K−1). The optimization result of the composite structure is shown in Figure 3b. Under the same conditions, the three-dimensional optimization result is not exactly the same as that of the two-dimensional simplified model, as shown in Figure 3c; however, the structural trend is generally consistent.
According to the above two-dimensional and three-dimensional topology-optimized composite structures, for the V-to-S heat transfer model, the high-thermal-conductivity material in the composite structure develops and extends from the bottom surface to the top in a tree-like shape. The branches multiply and become thinner as they approach the distal end, fully extending to the top side of the domain. The structures obtained by mathematical optimization are consistent with the growth patterns of trees in nature and can be considered as a preferred configuration for heat or mass transfer by natural selection [43,44]. When heat is transferred in such a complex composite structure with a special shape, the heat flow rates and directions at different positions are different. The heat flow will move in the direction with low thermal resistance; that is, the heat from low-thermal-conductivity materials will tend to flow to nearby high-thermal-conductivity materials. Then, the converged heat is quickly transferred by the high-thermal-conductivity material to the desired boundary. From the perspective of the width of the heat conductive path, as heat gradually transfers and converges toward the desired boundary, the higher the heat flow load is, the wider the efficient heat conductive path should be. This conforms to the rule of setting the width of the main and branch roads [45], which is highly beneficial for heat transport.
Therefore, for the V-to-S heat transfer model and topology-optimized composite structures with specific shapes, the parameters involved in Fourier’s law of heat conduction, such as the temperature difference, length, and heat flow rate, are different and uneven. As a result, the heat transfer capability of topology-optimized composite structures cannot simply be evaluated or tested like the ETC under the S-to-S heat transfer model. The more complex and refined branching structure of the three-dimensional composite, as shown in Figure 3c, may create challenges in modeling and engineering applications [46]. For the convenience of modeling and investigation, this study stretches the result of a two-dimensional topology-optimized composite structure to a three-dimensional cuboid. This simplification method has been studied numerically and experimentally in several studies and has been proven to be effective at improving heat transfer capability [42,47].

2.3. Volume-to-Volume Heat Transfer Model

As described in the Introduction, the V-to-V heat transfer model is used for the conductive heat regeneration process of solid-state refrigeration and heat conduction/dissipation between heat sinks and solid-state electronic devices. For instance, to increase the temperature span of solid-state caloric cooling devices and achieve a significant cooling effect, it is necessary to establish a heat regeneration process, after which, the solid blocks undergo step-by-step heat regeneration [12,48]. When two cuboid blocks that require heat regeneration are composed of the same materials and size, the V-to-V composite structure can be simplified to a mirror combination of the topology-optimized V-to-S composite structure, as shown in Figure 4c; this structure was applied in a solid-state magnetic refrigerator and consisted of gadolinium and copper [42]. For cases where the material, shape, and size of the volume are different, each volume should be optimized separately. The heat transfer capability of the V-to-V model is unknown and requires further investigation and evaluation.

2.4. Interfacial Thermal Resistance Model

Inserting high-thermal-conductivity materials into low-thermal-conductivity materials inevitably results in an interface between the two materials [42,47]. Several studies have investigated the influences of interface compatibility, bonding, and contact effects on the heat transfer process of composite materials [28,49]. The heat conduction mechanisms of different types of materials are different, leading to thermal resistance, including phonon scattering [50]. In addition, due to the influence of the preparation process, there may be problems such as poor contact effects, gaps, and impurities at the interface, which can generate additional thermal resistance [51,52]. For the topology-optimized composite structure shown in Figure 4, when the thermal resistance generated by the interface is significant, the applied composite structure may not achieve the expected ideal effect of heat transfer enhancement. The interfacial thermal resistance can be an important factor affecting the heat transfer process. Therefore, taking the model and materials shown in Figure 4, this study adopts an equivalent thin resistive layer model to implement the imperfect interface. The effects of three different interfacial thermal resistance conditions are investigated, namely, coating with thermal grease, fusion casting bonding, and ideal conditions without interfacial thermal resistance.

3. Evaluation of Equivalent Thermal Conductivity

According to the summary and analysis of conductive heat transfer models, heat transfer capability evaluations of topology-optimized composite structures under V-to-S and V-to-V models cannot simply be obtained via theoretical calculations or experimental tests. Therefore, this section provides the expression of the equivalent thermal conductivity ( k eq ) and the definition of each parameter. The numerical simulation method with experimental validation is introduced to obtain the parameters for calculating k eq .

3.1. Definition of Equivalent Thermal Conductivity

To avoid confusion, the term “equivalent thermal conductivity” in some other papers is the same as effective thermal conductivity (ETC) [36]. However, the equivalent thermal conductivity k eq in this study represents a different meaning for evaluating the heat transfer capability of topology-optimized composite structures under different heat transfer models. In accordance with Fourier’s law of heat conduction, the expression of thermal conductivity should include parameters such as the temperature difference, length, area, and heat flow rate. Therefore, considering the different conductive heat transfer models, k eq is expressed as follows:
k eq = q · L eq T high , avg T low , avg A
where q represents the heat flow rate through a specific heat transfer surface with an area of A . L eq represents the equivalent heat transfer length. T high , avg represents the volume-averaged temperature of a high-temperature block. T low , avg represents the average temperature of a low-temperature surface or block for the V-to-S or V-to-V model.
For the V-to-S and V-to-V models, the heat flow rate, heat transfer length, and temperature are different at any position of the topology-optimized composite structure at any time during the heat transfer process. The key for calculating k eq is to determine their average values. Among these parameters, the heat flow rate and average temperature at each time point can be obtained via numerical simulation. L eq can be calculated by taking the center points of blocks that have a regular shape or symmetrical structure. As an example of a cuboid block under the V-to-S model, L eq is equal to the distance between the central point and the heat transfer boundary surface. The calculation of L eq will be complex in situations where the volume is irregular or the surface is not a whole or a plane. Taking a relatively simple example, the L eq of a cuboid block for the well-known VP problem, which is a limiting situation of the V-to-S model, can be obtained by setting up and solving the triple integral for the average distance to a point or a relatively small surface on the boundary.

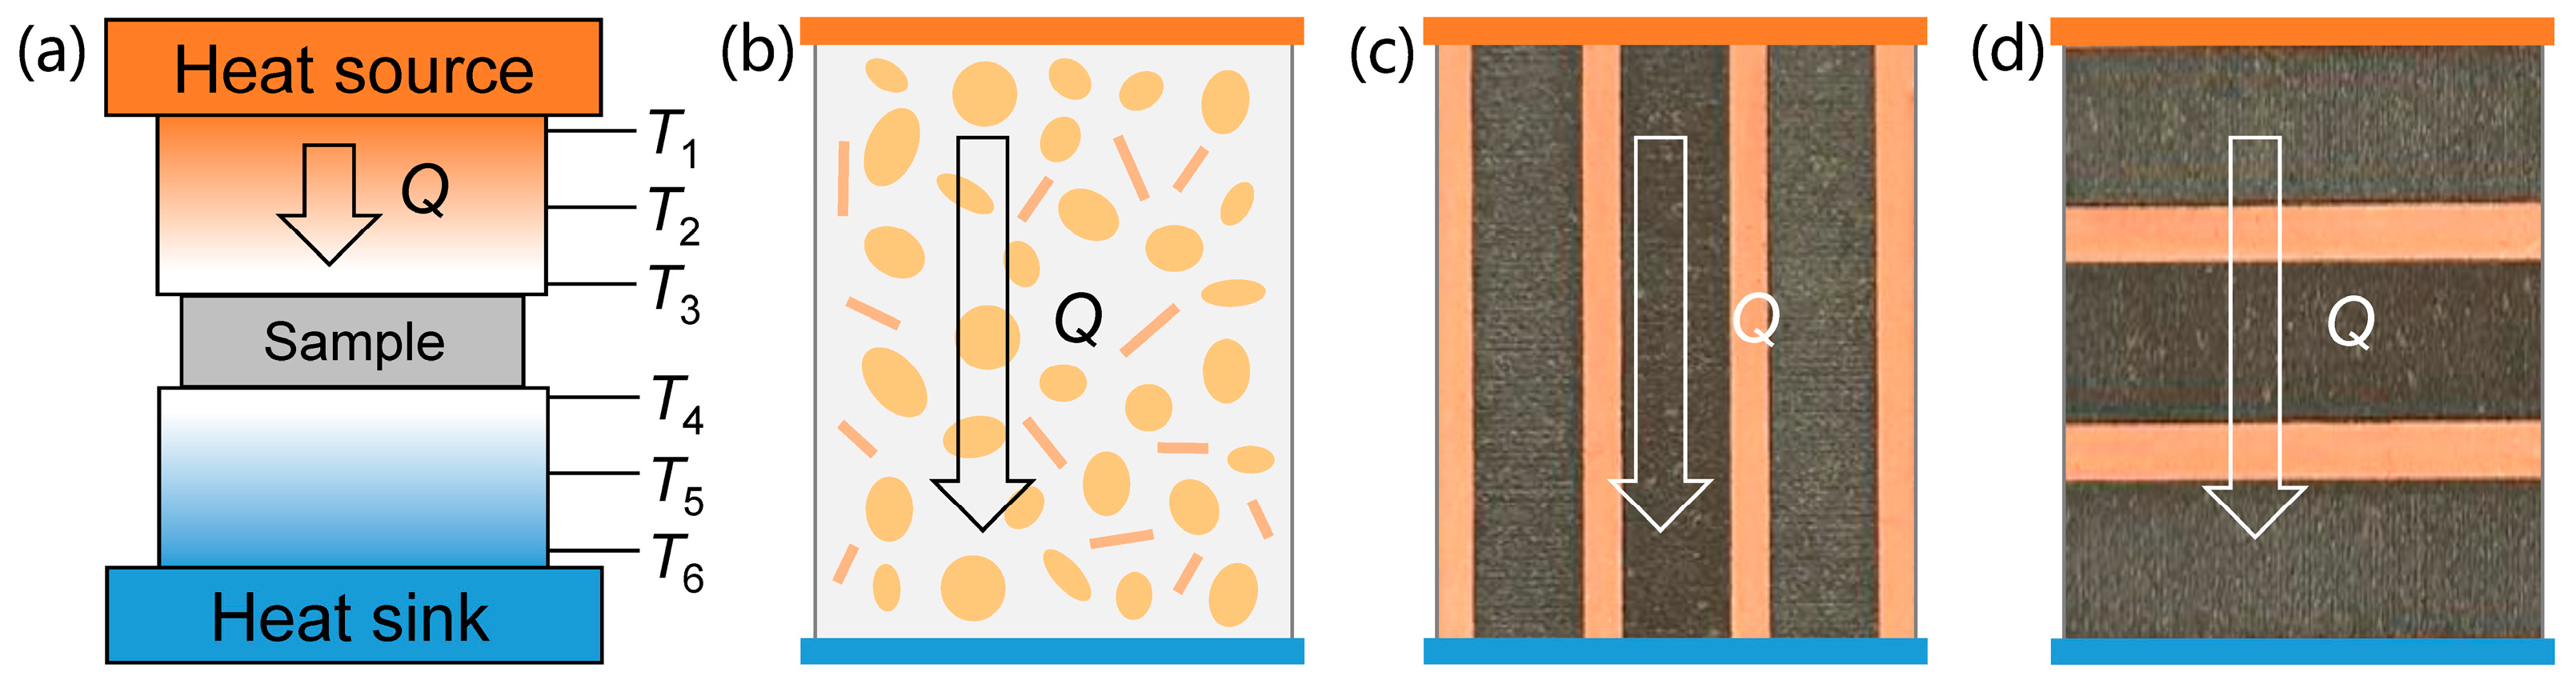
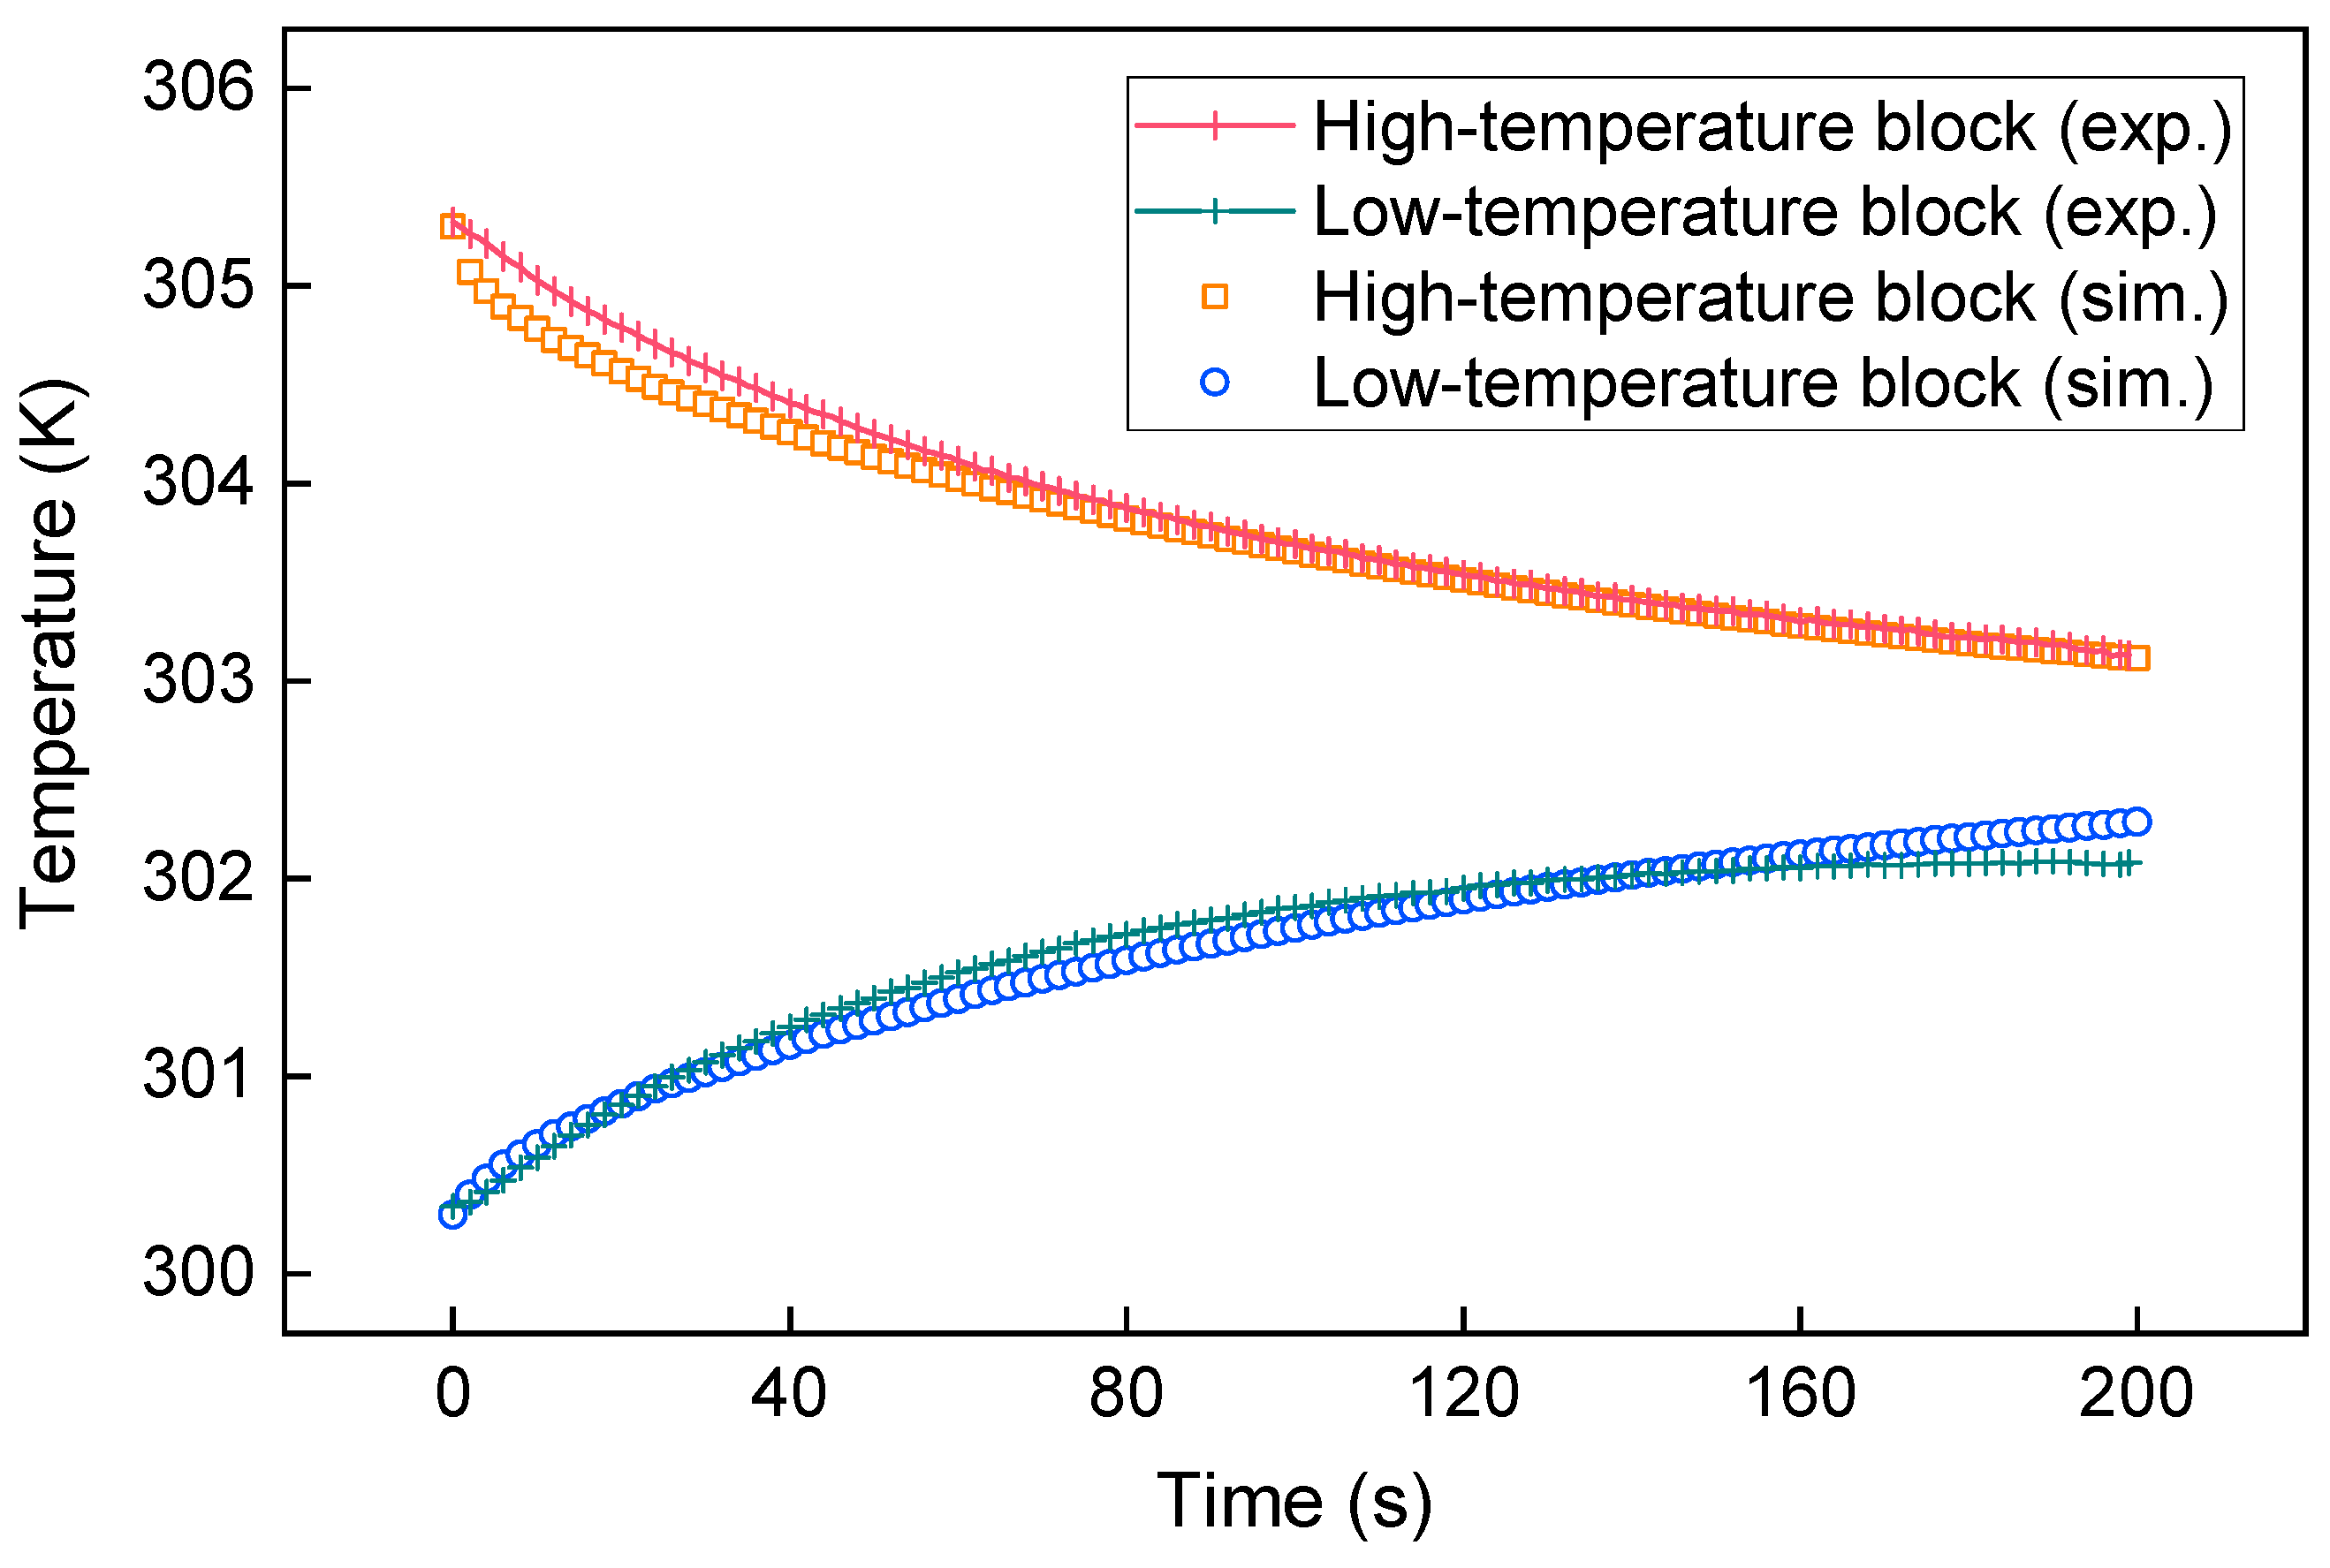
3.2. Simulation Method and Experimental Validation

The simulations were performed using the Heat Transfer in Solids module in COM-SOL Multiphysics 6.2 software that describes heat transfer by conduction. In this study, the Heat Transfer in Solids module solves for the following main equation:
ρ C p T t + q = 0
where ρ is the density. C p is the specific heat capacity at constant stress. T is the absolute temperature. t is the time. q is the heat flux by conduction.
The simulation method is used to establish a physical model of the complex composite structures and heat transfer processes for different heat transfer models; then, the parameters in Equation (2) can be monitored and obtained for calculating k eq . Another advantage of using the simulation method is that the interfacial thermal resistance can be considered by setting an equivalent thin resistive layer in the simulation to implement an imperfect interface between two materials. The available options to specify the resistive behavior of the equivalent layer are Layer resistance (the default), Layer conductance, and Layer thermal conductivity and thickness. In this study, the Layer resistance option was selected, and the interfacial thermal resistance could be realized by entering corresponding values. The three conductive heat transfer models were applied to a specific composite structure, as shown in Figure 4, by setting different boundary conditions as follows:
  • For the S-to-S model: a fixed temperature of the upper surface as T high , a fixed temperature of the lower surface as T low , an initial volume temperature of the block, and thermally insulated for the whole external surface.
  • For the V-to-S model: an initial volume temperature of the single block as T high , a fixed temperature of the lower surface as T low , and thermally insulated for the whole external surface.
  • For the V-to-V model: an initial volume temperature of the upper block as T high , an initial volume temperature of the lower block as T low , and thermally insulated for the whole external surface.
An example of a V-to-V simulation is shown in Figure 4c. The size of each block was 40 × 16 × 8 mm3. The thermal conductivities of copper and gadolinium were set to 381 W m−1 K−1 and 10.6 W m−1 K−1, respectively. All the external surfaces were considered to be thermally insulated. The boundary condition of the simulation was a preset temperature difference of 5 K between the high-temperature block and low-temperature block, which was realized by setting the initial volume temperatures of the two blocks. A transient calculation was performed using a time-step of 0.1 s to monitor the volume-averaged temperatures of the blocks and the heat flow rate through the middle cross-section at each time step. The mesh element size was set to extra fine. Both mesh independence and time-step independence were verified, and the error of the results was within 0.1%.
The reliability of the simulation for the heat transfer process was validated by experiments in a previous study [53]. The experimental setup is shown in Figure 5. The initial temperature difference between the high-temperature block and low-temperature block was 5 K, which was controlled by an electric heater pasted on the high-temperature block. Each block had three main temperature-measuring points set with calibrated K-type thermocouples. All the external surfaces were wrapped with thermal insulation material during the contact heat transfer process. The internal contact surfaces were coated with a thin layer of thermal grease. When the initial temperature difference of 5 K between the separate high- and low-temperature blocks was obtained, the test started after two blocks contacted each other. The temperature variations were monitored and recorded by an Agilent 34972A data acquisition unit connected to a computer. The ranges and accuracies of the sensors and instruments employed in the experiment are listed in Table 1.
The temperature variations of the heat conduction experiment and simulation are presented in Figure 6. The results showed that the temperature variations in the experiment and simulation were generally consistent. The simulation model could be validated by the experimental results.

4. Results and Discussion

4.1. Results of Equivalent Thermal Conductivity under Three Heat Transfer Models

Using the block size and topology-optimized composite structure shown in Figure 4, numerical simulation, parameter monitoring, and k eq calculations are conducted under the three conductive heat transfer models: S-to-S, V-to-S, and V-to-V. First, the heat transfer process and characteristics are analyzed as the time-dependent results of the temperature distribution, heat flow direction, and heat flux distribution shown in Figure 7. Figure 7a shows that the temperature gradually changes from the middle position to the end side as the two blocks exchange heat, resulting in an uneven temperature distribution within each block. The temperature of the high-thermal-conductivity material copper changes first, then the temperature change of the nearby low-thermal-conductivity material gadolinium is promoted, and finally, both become uniform. The heat flow contour in Figure 7b shows that a high heat flux is mainly concentrated on the tree-like copper. The heat flux converges closer to the “main road” to a greater extent. The overall heat flux gradually decreases over time due to the decrease in the temperature difference. As shown by the arrows in the heat flow direction in Figure 7b, the heat from gadolinium is preferentially transferred to the nearby copper in the upper high-temperature block. In contrast, the heat from the upper block is preferentially transferred toward the end side of the lower block through the tree-like copper. During this process, heat diffuses from the copper to the surrounding gadolinium. The above phenomenon conforms with the analysis of the topology-optimization principle for efficient heat transport in Section 2.2. The heat flow moves in the direction with low thermal resistance from the low-thermal-conductivity material to the nearby high-thermal-conductivity material. Subsequently, the converged heat is rapidly transferred by the high-thermal-conductivity material to the desired boundary. The width of the heat conductive path adapts to the local heat flux density, leading to efficient heat transfer.
By monitoring the average temperature of each block and the heat flow rate of the above V-to-V heat transfer process, the k eq variation with time is calculated according to Equation (2), as shown in Figure 8. The average temperature difference decreases with time, resulting in a decrease in the heat flow rate. However, k eq decreases rapidly and tends to a fixed value with a uniform temperature distribution. This is mainly due to the large preset temperature difference near the middle monitoring surface of the heat flow rate, which leads to an abnormally large heat flow rate in the early stage of heat transfer. Therefore, the stable value of 240.3 W m−1 K−1 is taken as the k eq value for the V-to-V model under such conditions. This method of taking the k eq value is used throughout this study. This is consistent with thermal conductivity being an inherent thermophysical parameter of materials.
Using a similar method, the k eq of the topology-optimized composite structures under the S-to-S and V-to-S models is also simulated and calculated. Specifically, when the temperature and distance of the two boundary surfaces are constant, k eq under the S-to-S model, which is equal to the ETC for such conditions, can also be calculated by referring to Equation (2). As shown in Figure 4, the corresponding boundary conditions are set for a single topology-optimized composite block, namely, setting a constant temperature on the upper and lower surfaces of the S-to-S model and setting the initial volume temperature of the block and a constant temperature on the lower surface of the V-to-S model. In addition, the k eq results for the in-parallel structure shown in Figure 1c with the same block size, material, and volume ratio are also added to the comparison. Finally, the k eq comparisons of the two composite structures under the three conductive heat transfer models are shown in Figure 9.
According to Figure 9, the k eq value of the topology-optimized composite structure under the S-to-S model is only 79.4 W m−1 K−1, which is significantly smaller than that of the in-parallel composite structure. The composite structures optimized for the V-to-S and V-to-V models exhibit a poor heat transfer capability under the S-to-S model. However, the topology-optimized composite structure has a good heat transfer capability under the V-to-S and V-to-V models, with k eq values up to 240.3 W m−1 K−1, which is far greater than the volume-weighted average thermal conductivity of 136.5 W m−1 K−1, which is composed of 34% copper (381 W m−1 K−1) and 66% gadolinium (10.6 W m−1 K−1). The k eq of the topology-optimized composite structure is approximately 41% greater than that of the in-parallel structure under the V-to-S and V-to-V models, indicating efficient heat transfer enhancement for the V-to-S and V-to-V models. The main reason for this is that the optimization boundary conditions are different for the topology-optimized and in-parallel composite structures. The branch of the tree-like copper in the topology-optimized composite structure does not contact the upper surface, as shown in Figure 3b, resulting in a discontinuous heat conductive path between the upper and lower surfaces. The heat flow is obstructed by a low-thermal-conductivity material layer. In contrast, the in-parallel structure has a more effective heat conductive path, because the copper sheets are directly connected to the upper and lower surfaces, which can achieve a volume-weighted average thermal conductivity 72% greater than that of the topology-optimized composite structure. Therefore, it is inappropriate to use the ETC of the S-to-S model to evaluate the heat transfer capability of topology-optimized composite structures. The k eq proposed in this study is more suitable for topology-optimized composite structures under the V-to-S and V-to-V heat transfer models.

4.2. Influence of Interfacial Thermal Resistance on Equivalent Thermal Conductivity

Section 4.1 investigates k eq under ideal conditions without considering the interfacial thermal resistance. However, the interfacial thermal resistance should be accounted for in actual applications. Therefore, two typical cases of imperfect interface conditions are adopted to study the influence of the interfacial thermal resistance on k eq , namely, coating with thermal grease and fusion casting bonding. According to the previous study [54], the interfacial thermal resistance is 8 × 10⁻⁵ m2 K W−1 for coating thermal grease and 3.74 × 10⁻⁵ m2 K W−1 for fusion casting bonding. The k eq results considering different interfacial thermal resistance conditions of the topology-optimized composite structure under three conductive heat transfer models are shown in Figure 10.
Figure 10 shows that the influence of the interfacial thermal resistance on the topology-optimized composite structure under the S-to-S model is relatively slight, whereas that under the V-to-S and V-to-V models is significant. This is mainly attributed to the fact that the main thermal resistance of the topology-optimized composite structure under the S-to-S model is not only the interfacial thermal resistance, but also the thermal resistance layer formed by the low-thermal-conductivity material, as discussed in Section 4.1. For the V-to-S and V-to-V models, the efficient topology-optimized composite greatly reduces the thermal resistance in the structural configuration; thus, the introduced interfacial thermal resistance can result in significant thermal resistance, leading to a sharp decrease in k eq . According to the principle of heat transfer, the heat transfer rate depends on the part with the largest thermal resistance. The interfacial thermal resistance in topology-optimized composite structures can be considered as a guardrail on the roadside of the heat conductive path, reducing the efficiency of the heat transfer from low-thermal-conductivity materials to high-thermal-conductivity materials. Therefore, it is important to reduce the interfacial thermal resistance and its influence on the heat transfer enhancement effect of topology-optimized composite structures, and, if necessary, adjust the topology optimization based on the influence of the interfacial thermal resistance [55].

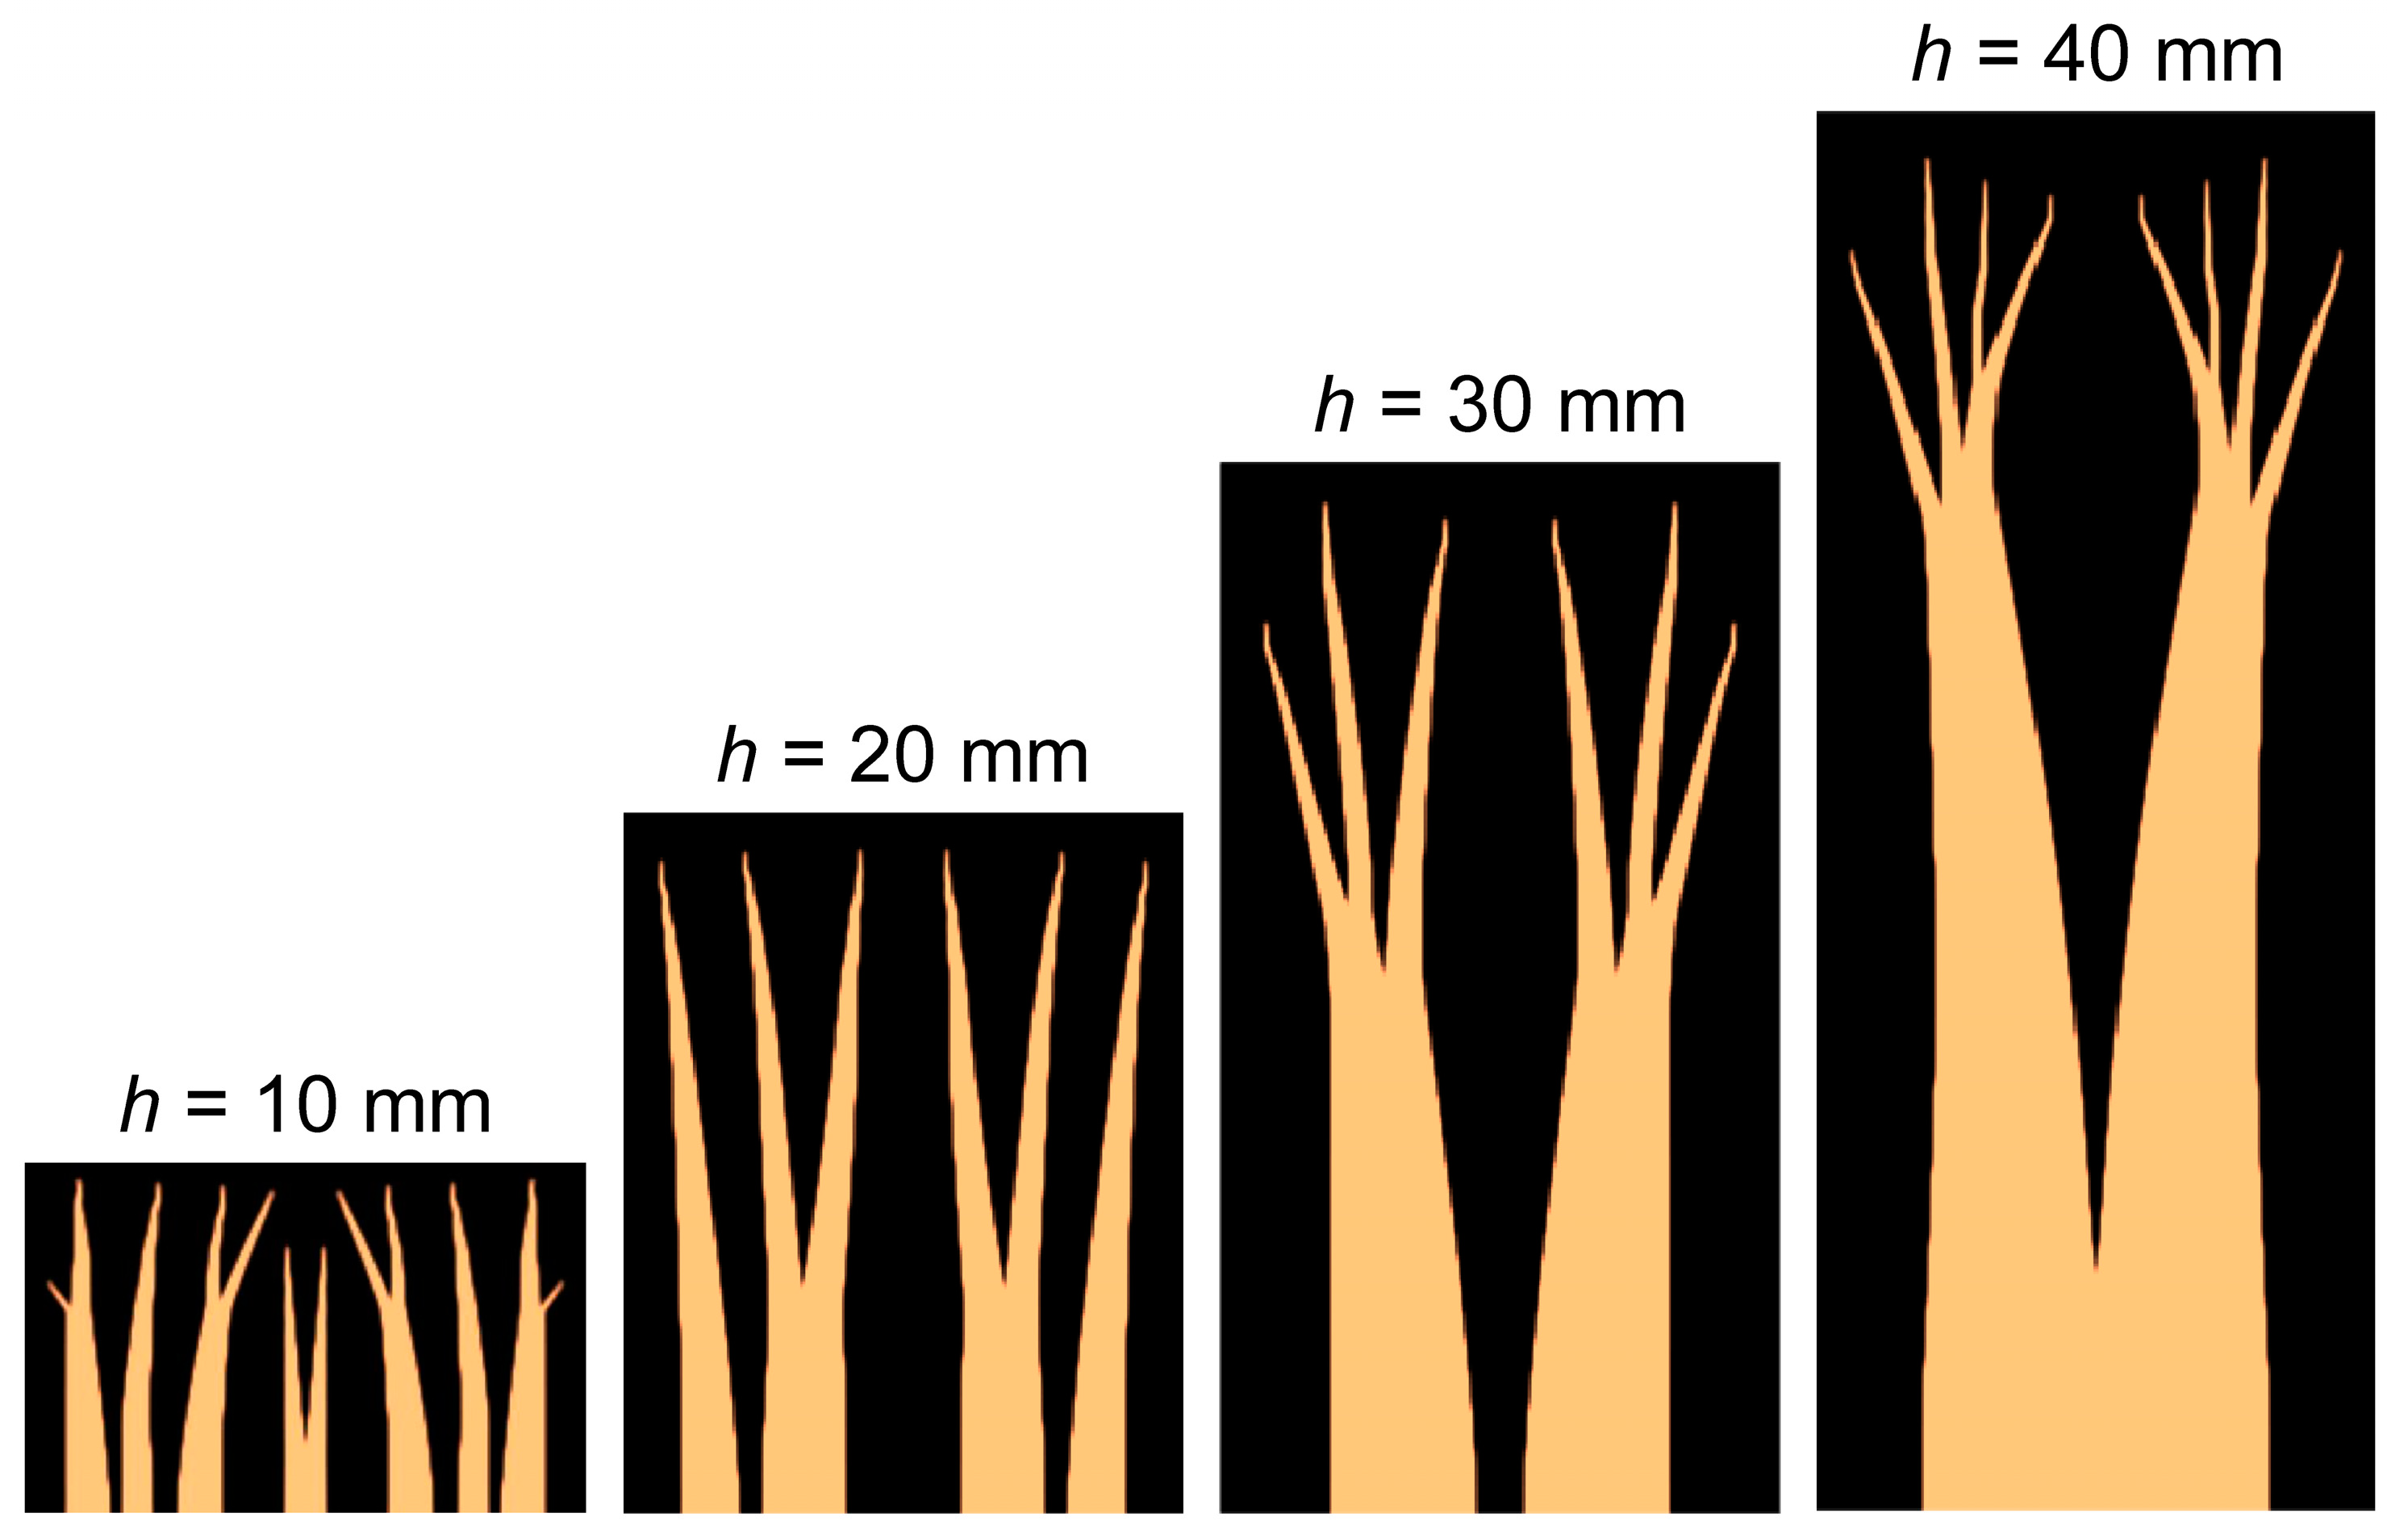
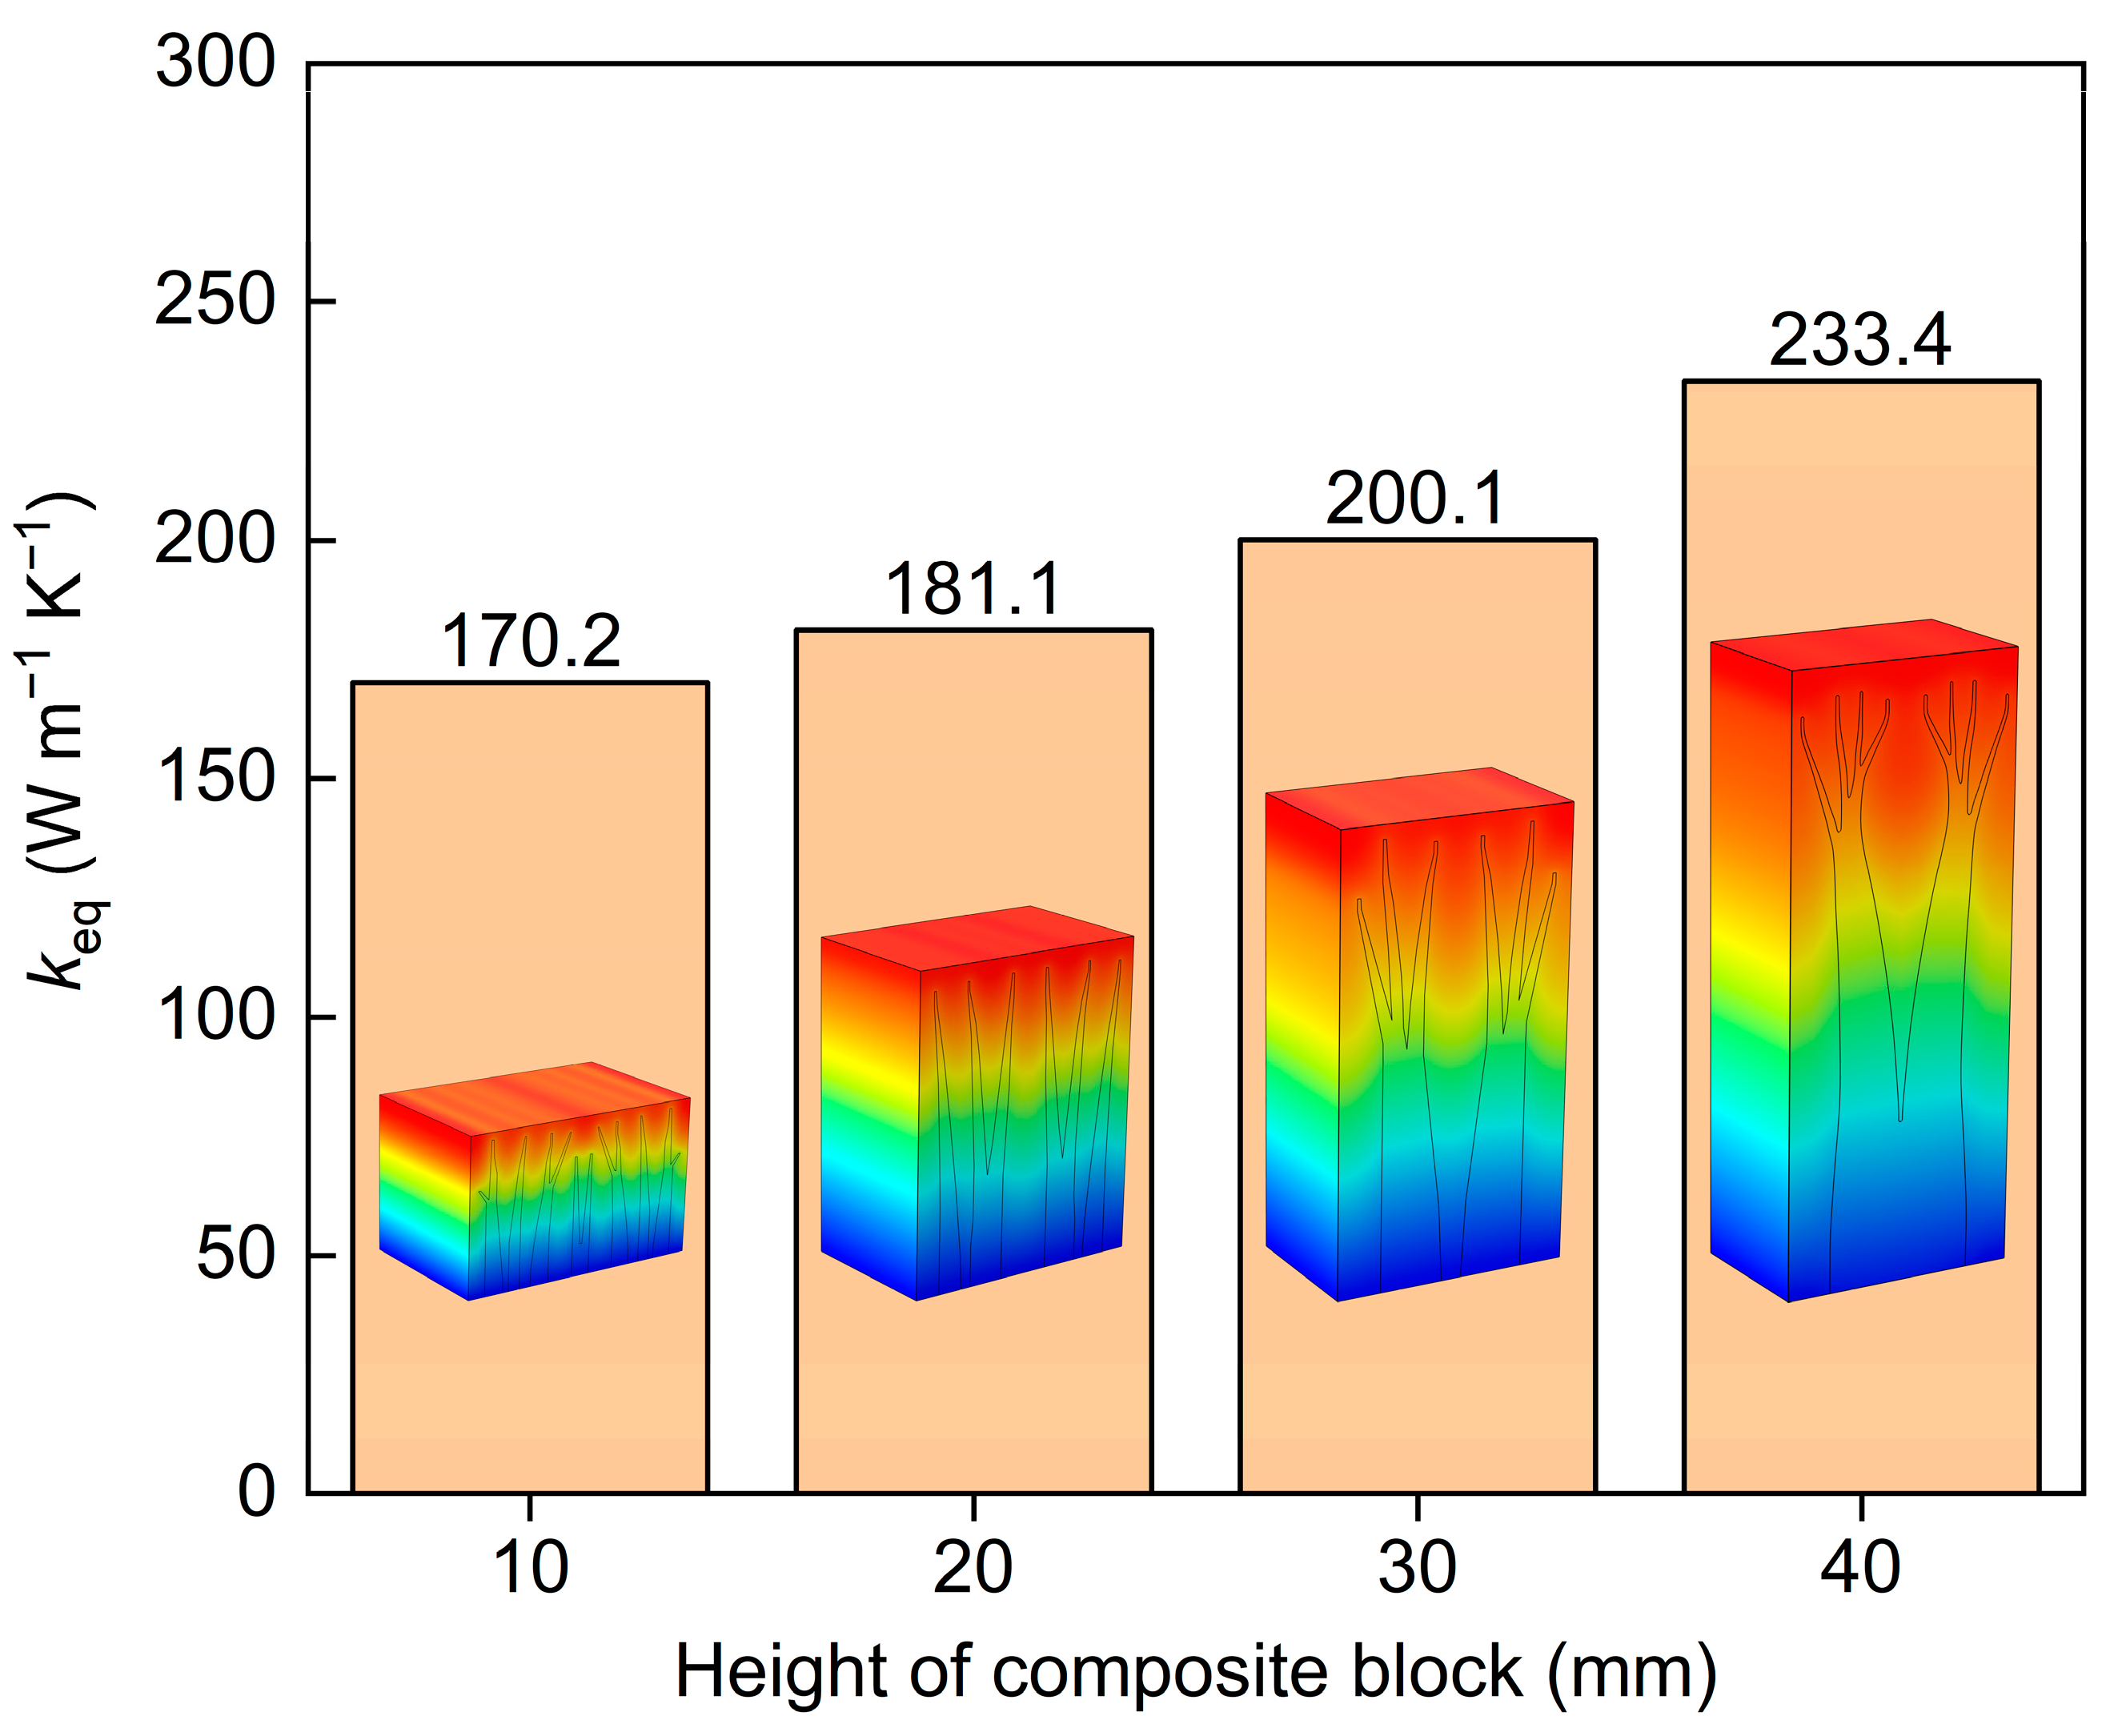
4.3. Influence of Size Effect on Equivalent Thermal Conductivity

Topology-optimized composite structures with different block sizes are different when using the same optimization method described in Section 2.2. The impact of different block sizes on k eq should be investigated. For the V-to-S model shown in Figure 3, the topology-optimized composite structures obtained when only the height of the block is changed are shown in Figure 11. The composite structure at a height of 40 mm was introduced in detail in Section 2.2. As the height decreases, the number of end-side branches of the composite structure decreases, and the number of independent branches increases as each branch becomes thinner. The composite structures gradually tend to be in-parallel sheet-like structures, especially for the 10 mm height composite structure. This is attributed to the decreases in the aspect ratio and heat transfer length, which cause high-thermal-conductivity materials to tend to be evenly spaced in a multibranch form.
Through simulations and calculations, the k eq values of topology-optimized composite structures with different block heights are shown in Figure 12. As the height increases, k eq increases. This may be different from the usual understanding and can be explained by the definition and expression of k eq . k eq is the combined influencing result of the heat flow rate, equivalent heat transfer length ( L eq ), and average temperature difference. The L eq of a 40 mm height block is four times greater than that of a 10 mm height block, which means that the influence of L eq is more significant to k eq , as shown in Figure 12. This is attributed to the fact that k eq can evaluate whether a good heat transfer efficiency can still be obtained over longer heat transfer lengths. The heat conductive path of a high-thermal-conductivity material can converge the heat flow and efficiently transport heat, demonstrating a good overall heat transfer capability and showing an advantage in reducing the structural thermal resistance. The greater the structural thermal resistance (i.e., mainly the heat transfer length), the more obvious the effect of topology optimization, which is ultimately reflected by k eq . To avoid confusion, it is recommended to compare and analyze the k eq of different composite structures under the same optimization objective and specific size. In summary, Figure 12 shows that the use of topology-optimized structures has a significant effect on heat transfer enhancement, because the k eq values are significantly greater than the volume-weighted average thermal conductivity of 136.5 W m−1 K−1.

5. Conclusions

To adapt to research on the heat transfer enhancement of composite materials, it is necessary to investigate a suitable method and parameter for evaluating the heat transfer capability of optimized composites under different heat transfer models, which can serve as a characteristic parameter that is beneficial for heat transfer analysis and structural optimization. Therefore, this study analyzed and summarized three typical conductive heat transfer models, namely, surface-to-surface (S-to-S), volume-to-surface (V-to-S), and volume-to-volume (V-to-V) models. The equivalent thermal conductivity ( k eq ) was adopted to evaluate the conductive heat transfer capability of different topology-optimized composite structures. A validated simulation method was used to obtain the key parameters for calculating k eq . By comparing k eq among the three conductive heat transfer models, considering the interfacial thermal resistance conditions and size effect, the main results are as follows:
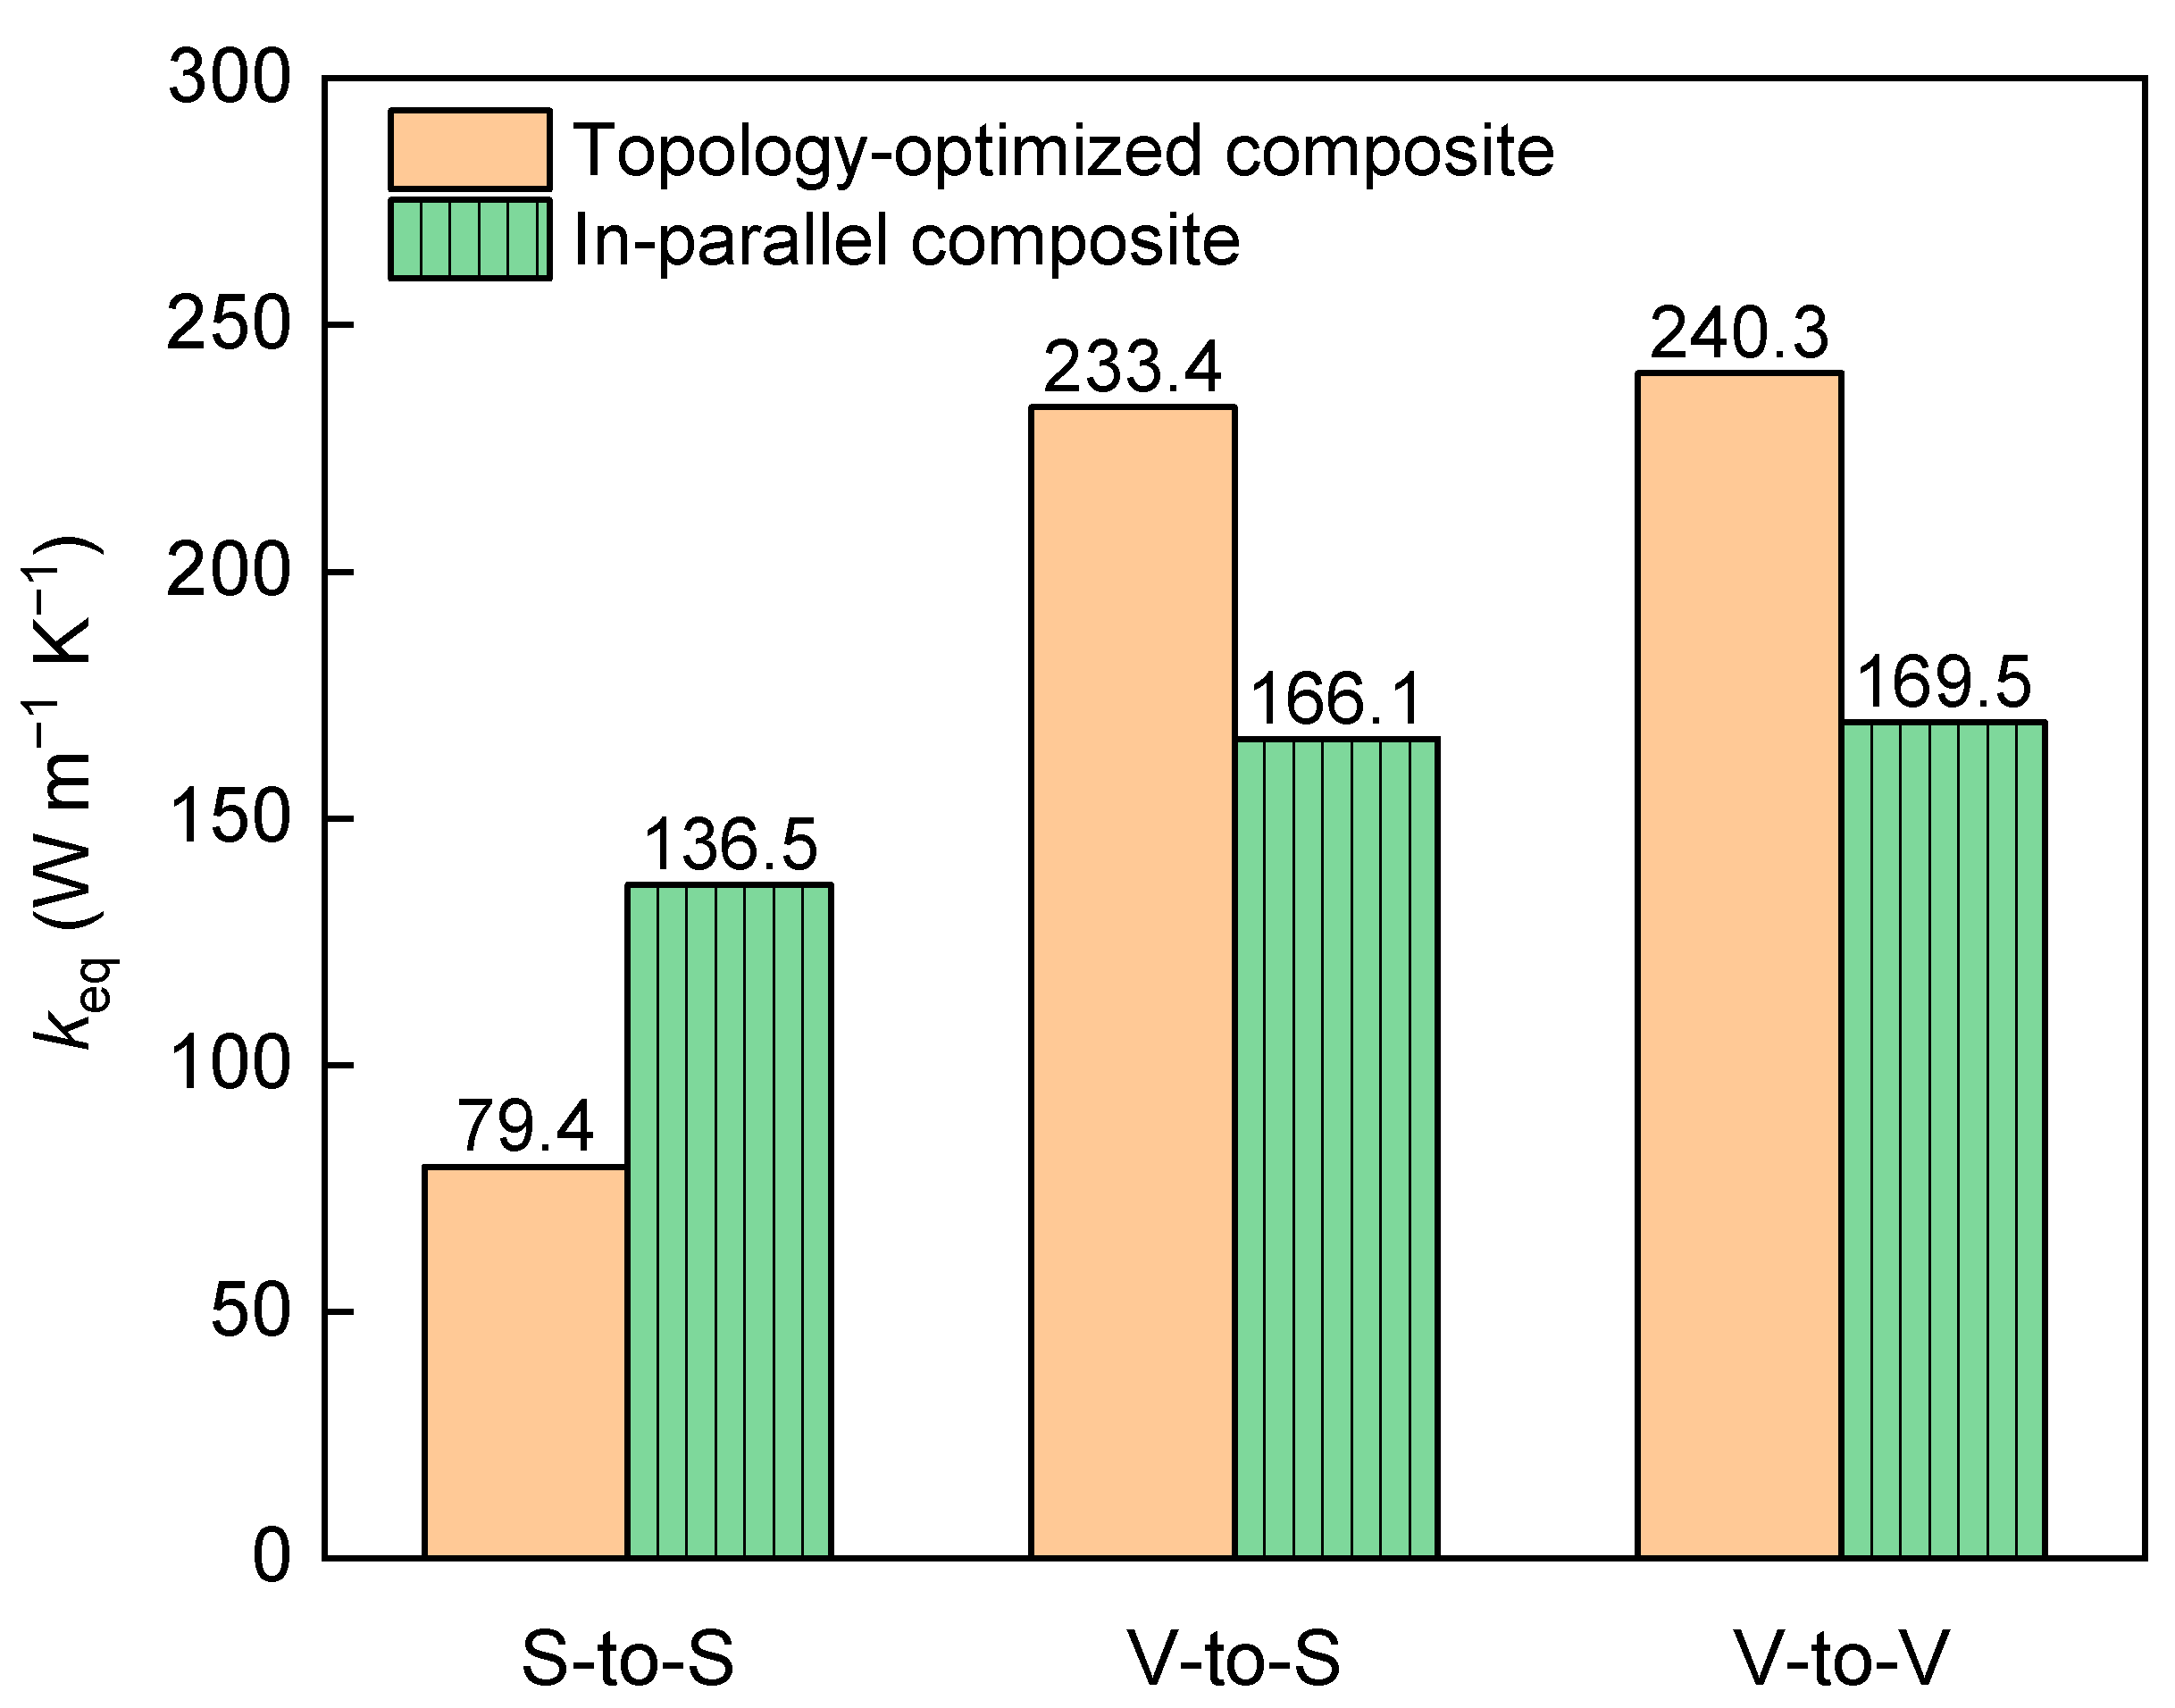
  • The composite structure optimized for the V-to-S and V-to-V models has a k eq value of only 79.4 W m−1 K−1 under the S-to-S model. However, the k eq values are 233.4 W m−1 K−1 and 240.3 W m−1 K−1 under the V-to-S and V-to-V models, respectively, which are approximately 41% greater than those of the in-parallel structure. Therefore, the widely used effective thermal conductivity (ETC) for the S-to-S model is not appropriate for evaluating the heat transfer capability of topology-optimized composite structures. The k eq proposed in this study is more suitable for the V-to-S and V-to-V models.
  • The influence of the interfacial thermal resistance on k eq is significant, leading to a sharp decrease in k eq . It is important to reduce the interfacial thermal resistance and its influence on the heat transfer enhancement effect of topology-optimized composite structures, and, if necessary, adjust the topology optimization based on the influence of interfacial thermal resistance.
  • The size effect has a certain impact on k eq . It is recommended to compare and analyze the k eq of different composite structures under the same optimization objective and specific size.
To conclude, the optimization methods for heat transfer composite structures should be different for different conductive heat transfer models and boundary conditions. The aim of optimization is to obtain a better heat conductive path and minimize the influence of interfacial thermal resistance. The k eq proposed in this study can be a suitable parameter to evaluate heat transfer capability. The k eq calculation and analysis methods can serve as references for conductive heat transfer enhancement and structural optimization.

Author Contributions

Conceptualization, B.L. and J.H.; methodology, B.L.; validation, B.L.; investigation, B.L. and J.H.; data collection and visualization B.L.; writing—original draft preparation, B.L.; writing—review and editing, J.H.; supervision, J.H.; project administration, J.H.; funding acquisition, B.L. and J.H. All authors have read and agreed to the published version of the manuscript.

Funding

This research was funded by the National Natural Science Foundation of China (grant number 52206002), the Science and Technology Program of Guangxi (grant number AD23026045), and the National Natural Science Foundation of China (grant number 52366001 and 52161032).

Data Availability Statement

The original contributions presented in the study are included in the article, further inquiries can be directed to the corresponding author/s.

Acknowledgments

The authors thank Yaoguang Huang, Jing Wang and Zhihong Ma, Baise University, for their kind suggestions.

Conflicts of Interest

The authors declare no conflicts of interest.

References

  1. Yüksel, N. The review of some commonly used methods and techniques to measure the thermal conductivity of insulation materials. In Insulation Materials in Context of Sustainability; IntechOpen: Rijeka, Croatia, 2016. [Google Scholar] [CrossRef]
  2. Sliwa, T.; Leśniak, P.; Sapińska-Śliwa, A.; Rosen, M.A. Effective thermal conductivity and borehole thermal resistance in selected borehole heat exchangers for the same geology. Energies 2022, 15, 1152. [Google Scholar] [CrossRef]
  3. Yang, G.; Cao, B.Y. Three-sensor 2ω method with multi-directional layout: A general methodology for measuring thermal conductivity of solid materials. Int. J. Heat Mass Transf. 2024, 219, 124878. [Google Scholar] [CrossRef]
  4. Li, Z.; Yang, Y.; Gariboldi, E.; Li, Y. Computational models of effective thermal conductivity for periodic porous media for all volume fractions and conductivity ratios. Appl. Energy 2023, 349, 121633. [Google Scholar] [CrossRef]
  5. Zhan, C.; Cui, W.; Li, L. A fractal model of effective thermal conductivity of porous materials considering tortuosity. Energies 2023, 16, 271. [Google Scholar] [CrossRef]
  6. Hay, B.; Filtz, J.R.; Hameury, J.; Rongione, L. Uncertainty of thermal diffusivity measurements by laser flash method. Int. J. Thermophys. 2005, 26, 1883–1898. [Google Scholar] [CrossRef]
  7. Chen, B.; Kan, A.; Chen, Z.; Zhang, J.; Yang, L. Investigation on effective thermal conductivity of fibrous porous materials as vacuum insulation panels’ core using Lattice Boltzmann method. Energies 2023, 16, 3692. [Google Scholar] [CrossRef]
  8. Huang, Q.; Hong, D.; Niu, B.; Long, D.; Zhang, Y. An interpretable deep learning strategy for effective thermal conductivity prediction of porous materials. Int. J. Heat Mass Transf. 2024, 221, 125064. [Google Scholar] [CrossRef]
  9. Wang, J.; Carson, J.K.; North, M.F.; Cleland, D.J. A new approach to modelling the effective thermal conductivity of heterogeneous materials. Int. J. Heat Mass Transf. 2006, 49, 3075–3083. [Google Scholar] [CrossRef]
  10. Xiao, T.; Zhang, Q.; Yang, X.; Hooman, K.; Li, G. Influence of solder condition on effective thermal conductivity of two-directional random fibres: Pore-scale simulation. Int. J. Heat Mass Transf. 2023, 202, 123715. [Google Scholar] [CrossRef]
  11. Baig, M.M.; Hassan, S.F.; Saheb, N.; Patel, F. Metal Matrix Composite in Heat Sink Application: Reinforcement, Processing, and Properties. Materials 2021, 14, 6257. [Google Scholar] [CrossRef]
  12. Zhang, Y.; Wu, J.; He, J.; Wang, K.; Yu, G. Solutions to obstacles in the commercialization of room-temperature magnetic refrigeration. Renew. Sustain. Energy Rev. 2021, 143, 110933. [Google Scholar] [CrossRef]
  13. Bejan, A.; Lorente, S. The constructal law and the thermodynamics of flow systems with configuration. Int. J. Heat Mass Transf. 2004, 47, 3203–3214. [Google Scholar] [CrossRef]
  14. Hekimoğlu, G.; Sarı, A.; Gencel, O.; Tyagi, V.V. Thermal conductivity enhancement of silica fume based composite thermal energy storage material using different carbon nanomaterials. Energy Build. 2022, 257, 111789. [Google Scholar] [CrossRef]
  15. Shchegolkov, A.V.; Nachtane, M.; Stanishevskiy, Y.M.; Dodina, E.P.; Rejepov, D.T.; Vetcher, A.A. The Effect of Multi-Walled Carbon Nanotubes on the Heat-Release Properties of Elastic Nanocomposites. J. Compos. Sci. 2022, 6, 333. [Google Scholar] [CrossRef]
  16. Meng, F.; Du, W.; Du, X.; Zhu, B.; Liu, K.; Li, S. Simultaneously enhanced thermal conductivity and mechanical performance of carbon nanotube reinforced ZK61 matrix composite. J. Magnes. Alloys 2023. [Google Scholar] [CrossRef]
  17. Shchegolkov, A.V.; Shchegolkov, A.V. Synthesis of Carbon Nanotubes Using Microwave Radiation: Technology, Properties, and Structure. Russ. J. Gen. Chem. 2022, 92, 1168–1172. [Google Scholar] [CrossRef]
  18. Feng, G.; Pan, G.; Feng, Y.; Zhang, X.; Qiu, L. Topology optimization of controllable porous microstructure with maximum thermal conductivity. Int. J. Heat Mass Transf. 2024, 220, 124990. [Google Scholar] [CrossRef]
  19. Zhang, F.; Feng, Y.Y.; Feng, W. Three-dimensional interconnected networks for thermally conductive polymer composites: Design, preparation, properties, and mechanisms. Mater. Sci. Eng. R Rep. 2020, 142, 100580. [Google Scholar] [CrossRef]
  20. Zhang, J.; Wu, X.; Song, M.; Chen, K. An effective method for hot spot temperature optimization in heat conduction problem. Appl. Therm. Eng. 2023, 227, 120325. [Google Scholar] [CrossRef]
  21. Greco, A.; Aprea, C.; Maiorino, A.; Masselli, C. A review of the state of the art of solid-state caloric cooling processes at room-temperature before 2019. Int. J. Refrig. 2019, 106, 66–88. [Google Scholar] [CrossRef]
  22. Li, B.T.; Hong, J.; Tian, X.Y. Generating optimal topologies for heat conduction by heat flow paths identification. Int. Commun. Heat Mass Transf. 2016, 75, 177–182. [Google Scholar] [CrossRef]
  23. Chen, L.G.; Feng, H.J.; Zhang, F.Y.; Ge, Y. Constructal design for composite heat dissipating structure composed of an “arrow”-shaped high conductivity channel and an externally connected “T”-shaped fin. Int. Commun. Heat Mass Transf. 2024, 153, 107341. [Google Scholar] [CrossRef]
  24. Wu, J.; Sigmund, O.; Groen, J.P. Topology optimization of multi-scale structures: A review. Struct. Multidiscip. Optim. 2021, 63, 1455–1480. [Google Scholar] [CrossRef]
  25. Avendano, P.A.; Souza, J.A.; Adamatti, D.F. Construction of conductive pathways using genetic algorithms and constructal theory. Int. J. Therm. Sci. 2018, 134, 200–207. [Google Scholar] [CrossRef]
  26. Dang, H.; Zhang, Q.; Lu, Y.; Zhang, X.; Ma, W.; Zhang, X. Optimizing the heat source layout of chips using bionic method: Reduction of junction temperature. Int. J. Heat Mass Transf. 2022, 197, 123321. [Google Scholar] [CrossRef]
  27. Modrek, M.; Viswanath, A.; Khan, K.A.; Ali, M.I.; Al-Rub, R.K. Multi-objective topology optimization of passive heat sinks including self-weight based on triply periodic minimal surface lattices. Case Stud. Therm. Eng. 2023, 42, 102684. [Google Scholar] [CrossRef]
  28. Ruan, K.; Shi, X.; Guo, Y.; Gu, J. Interfacial thermal resistance in thermally conductive polymer composites: A review. Compos. Commun. 2020, 22, 100518. [Google Scholar] [CrossRef]
  29. Guo, K.; Qi, W.; Liu, B.; Liu, C.; Huang, Z.; Zhu, G. Optimization of an “area to point” heat conduction problem. Appl. Therm. Eng. 2016, 93, 61–71. [Google Scholar] [CrossRef]
  30. Cai, H.; Li, X.; Xie, C.; Guo, K.; Liu, H.; Liu, C. Area-to-point heat conduction enhancement using binary particle swarm optimization. Appl. Therm. Eng. 2019, 155, 449–460. [Google Scholar] [CrossRef]
  31. Zhao, T.; Wu, X.; Guo, Z.Y. Optimal thermal conductivity design for the volume-to-point heat conduction problem based on adjoint analysis. Case Stud. Therm. Eng. 2022, 40, 102471. [Google Scholar] [CrossRef]
  32. Burger, F.H.; Dirker, J.; Meyer, J.P. Three-dimensional conductive heat transfer topology optimisation in a cubic domain for the volume-to-surface problem. Int. J. Heat Mass Transf. 2013, 67, 214–224. [Google Scholar] [CrossRef]
  33. Zhao, T.; Sun, Q.H.; Xin, Y.L.; Chen, Q. A generalized Benders decomposition-based algorithm for heat conduction optimization and inverse design. Int. J. Heat Mass Transf. 2023, 211, 124224. [Google Scholar] [CrossRef]
  34. Zhang, C.; Kong, X.; Wang, X.; Du, Y.; Xiao, G. A predicting model for the effective thermal conductivity of anisotropic open-cell foam. Energies 2022, 15, 6091. [Google Scholar] [CrossRef]
  35. Feng, G.; Qiu, L.; Feng, Y.; Zhang, X. Topological design of open-cell microstructure with optimal effective thermal conductivity. Int. J. Heat Mass Transf. 2023, 214, 124427. [Google Scholar] [CrossRef]
  36. Liu, Y.; Xu, P.; Wang, T.; Liu, C. Variabilities and their upper and lower bounds of the equivalent thermal conductivity and resistance defined by the entransy dissipation rate. Int. J. Heat Mass Transf. 2021, 170, 120990. [Google Scholar] [CrossRef]
  37. Sutheesh, P.M.; Chollackal, A. Thermal performance of multilayer insulation: A review. IOP Conf. Ser. Mater. Sci. Eng. 2018, 396, 12061. [Google Scholar] [CrossRef]
  38. Almogbel, M.; Bejan, A. Conduction trees with spacings at the tips. Int. J. Heat Mass Transf. 1999, 42, 3739–3756. [Google Scholar] [CrossRef]
  39. Chen, X.; Yao, W.; Zhou, W.; Zhang, Z.; Li, Y. A general differentiable layout optimization framework for heat transfer problems. Int. J. Heat Mass Transf. 2023, 211, 124205. [Google Scholar] [CrossRef]
  40. Min, K.; Oh, M.; Kim, C.; Yoo, J. Topological design of thermal conductors using functionally graded materials. Finite Elem. Anal. Des. 2023, 220, 103947. [Google Scholar] [CrossRef]
  41. Liu, K.; Tovar, A. An efficient 3D topology optimization code written in Matlab. Struct. Multidiscip. Optim. 2014, 50, 1175–1196. [Google Scholar] [CrossRef]
  42. Lu, B.; Wu, J.; He, J.; Huang, J. Heat transfer optimization of a fully solid state micro-unit regeneration magnetic refrigerator. Int. J. Refrig. 2019, 98, 42–50. [Google Scholar] [CrossRef]
  43. Bejan, A. Shape and Structure, from Engineering to Nature; Cambridge University Press: Cambridge, UK, 2000. [Google Scholar]
  44. Bejan, A.; Zane, J.P. Design in Nature: How the Constructal Law Governs Evolution in Biology, Physics, Technology and Social Organization; The Knopf Doubleday Publishing Group: New York, NY, USA, 2012; ISBN 9780307744340. [Google Scholar]
  45. Bejan, A. Street network theory of organization in nature. J. Adv. Transp. 1996, 30, 85–107. [Google Scholar] [CrossRef]
  46. Lei, T.; Alexandersen, J.; Lazarov, B.S.; Wang, F.; Haertel, J.H.; De Angelis, S.; Sanna, S.; Sigmund, O.; Engelbrecht, K. Investment casting and experimental testing of heat sinks designed by topology. Int. J. Heat Mass Transf. 2018, 127, 396–412. [Google Scholar] [CrossRef]
  47. Subramaniam, V.; Dbouk, T.; Harion, J.-L. Topology optimization of conductive heat transfer devices: An experimental investigation. Appl. Therm. Eng. 2018, 131, 390–411. [Google Scholar] [CrossRef]
  48. He, J.; Wu, J.; Zhang, H.; Zhang, Y.; Lu, B. Numerical simulation of a fully solid-state micro-unit regeneration magnetic refrigerator with micro Peltier elements. Appl. Therm. Eng. 2021, 186, 116545. [Google Scholar] [CrossRef]
  49. Węglewski, W.; Pitchai, P.; Chmielewski, M.; Guruprasad, P.J.; Basista, M. Thermal conductivity of Cu-matrix composites reinforced with coated SiC particles: Numerical modeling and experimental verification. Int. J. Heat Mass Transf. 2022, 188, 122633. [Google Scholar] [CrossRef]
  50. Chen, Q.; Yang, K.; Feng, Y.; Liang, L.; Chi, M.; Zhang, Z.; Chen, X. Recent advances in thermal-conductive insulating polymer composites with various fillers. Compos. Part A Appl. Sci. Manuf. 2024, 178, 107998. [Google Scholar] [CrossRef]
  51. Song, J.N.; Zhang, Y. Effect of an interface layer on thermal conductivity of polymer composites studied by the design of double-layered and triple-layered composites. Int. J. Heat Mass Transf. 2019, 141, 1049–1055. [Google Scholar] [CrossRef]
  52. Burger, N.; Laachachi, A.; Ferriol, M.; Lutz, M.; Toniazzo, V.; Ruch, D. Review of thermal conductivity in composites: Mechanisms, parameters and theory. Prog. Polym. Sci. 2016, 61, 1–28. [Google Scholar] [CrossRef]
  53. He, J.; Ya, C.; Tang, X.; Ma, L.; Wu, J.; Lu, B. Numerical study of a cascade cycle for the reciprocating solid-state magnetic refrigerator. Appl. Therm. Eng. 2023, 219, 119695. [Google Scholar] [CrossRef]
  54. Lu, B.; Huang, Y.; Huang, J.; Ma, Z.; Wang, J.; He, J. Influence of the interfacial thermal resistance of a gadolinium-copper bimetal composite on solid-state magnetic refrigeration. Int. J. Refrig. 2023, 153, 90–98. [Google Scholar] [CrossRef]
  55. Lorenzini, G.; Barreto, E.X.; Beckel, C.C.; Schneider, P.S.; Isoldi, L.A.; Dos Santos, E.D.; Rocha, L.A. Geometrical evaluation of T-shaped high conductive pathway with thermal contact resistance for cooling of heat-generating medium. Int. J. Heat Mass Transf. 2017, 108, 1884–1893. [Google Scholar] [CrossRef]
Figure 1. Schematic diagram of the surface-to-surface heat transfer model with different composite structures: (a) steady-state heat flow method for measuring thermal conductivity, (b) dispersed particle/fiber composite, (c) in-parallel composite, and (d) in-series composite.
Energies 17 02558 g001
Figure 2. The flowchart of topology optimization approach [42].
Energies 17 02558 g002
Figure 3. Schematic diagram of the topology optimization: (a) the design domain and boundary conditions, (b) the optimized two-dimensional composite structure, and (c) the optimized three-dimensional composite structure.
Energies 17 02558 g003
Figure 4. Schematic diagram and comparison of the three conductive heat transfer models: (a) S-to-S model, (b) V-to-S model, and (c) V-to-V model.
Energies 17 02558 g004
Figure 5. Experimental setup for validating the simulation [53].
Energies 17 02558 g005
Figure 6. Comparison of temperature variations in experiment and simulation [53].
Energies 17 02558 g006
Figure 7. Time-dependent results of the V-to-V heat transfer for the topology-optimized composite blocks: (a) temperature distribution and (b) heat flow direction and heat flux distribution.
Energies 17 02558 g007
Figure 8. Time-dependent results of the average temperature, heat flow rate and k eq of the V-to-V heat transfer for the topology-optimized composite blocks.
Energies 17 02558 g008
Figure 9. k eq results of the topology-optimized and in-parallel composite blocks under three conductive heat transfer models.
Energies 17 02558 g009
Figure 10. k eq results of the topology-optimized composite structure under different interfacial thermal resistance conditions and three conductive heat transfer models.
Energies 17 02558 g010
Figure 11. Topology optimization results of the composite structures with different heights.
Energies 17 02558 g011
Figure 12. k eq results of the V-to-S model of topology-optimized composite blocks with different heights.
Energies 17 02558 g012
Table 1. The ranges and the accuracies of the sensors and the instruments [53].
Sensor/InstrumentTypeRangeAccuracy
Thermocouplecalibrated K-type200–533 K±0.3 K
Data acquisition unitAgilent 34972A±1 ms/±0.05 K
DC power supplyMS3010D0–30 V±1%
Disclaimer/Publisher’s Note: The statements, opinions and data contained in all publications are solely those of the individual author(s) and contributor(s) and not of MDPI and/or the editor(s). MDPI and/or the editor(s) disclaim responsibility for any injury to people or property resulting from any ideas, methods, instructions or products referred to in the content.

