Article

Numerical Investigation and Experimental Verification of the Thermal Bridge Effect of Vacuum Insulation Panels with Various Cavities

1
Merchant Marine College, Shanghai Maritime University, Shanghai 201306, China
2
College of Material Science and Technology, Nanjing University of Aeronautics and Astronautics, Nanjing 211106, China
*
Author to whom correspondence should be addressed.
These authors contributed equally to this work.
Energies 2025, 18(3), 467; https://doi.org/10.3390/en18030467
Submission received: 20 December 2024 / Revised: 16 January 2025 / Accepted: 18 January 2025 / Published: 21 January 2025

Abstract

:
Vacuum insulation panels (VIPs) with cavities can be used in many applications, but their thermal bridge effect can be pronounced. In order to investigate the thermal bridge effect of VIPs with cavities, a numerical model was used for an analysis of the thermal bridge effect. The occurrence of the thermal bridge effect was investigated in nine groups of VIPs with different sizes and shapes of cavities. The results were experimentally verified. The results show that the effective heat transfer coefficient of VIPs decreases by 1.9% with an increase in the number of cavity sides, and the thermal bridge effect is much smaller with a larger number of cavity sides. The authors also found that an increase in the radius of the cavity tangent circle resulted in a more pronounced thermal bridge effect, with the effective thermal conductivity of the VIP increasing by 11.4%. In addition, the results obtained from the numerical analysis were verified by a simulation using COMSOL software (version 6.1). This study provides a reference for the variation rule of the thermal bridge effect in VIPs and reveals the numerical laws between the different parameters when the thermal bridge effect occurs.

1. Introduction

Global climate change is one of the major challenges facing the world today. Greenhouse gas emissions are the main cause of global warming [1]. As global energy demand continues to grow, the problem of energy shortage is becoming increasingly serious [2,3]. Therefore, energy-saving and emissions reduction technology has received attention in China and around the world [4]. There is a social trend of applying materials with new environmental protection capabilities, low energy consumption, and high heat insulation performance [5]. If such materials can be applied and promoted, this will greatly reduce the consumption of fossil energy and reduce the pressure on the natural environment [6].
Among the many insulation materials that have emerged, vacuum insulation panels with optimal insulation performance are one of the best solutions to achieve energy-saving and emissions-reduction goals [7,8]. VIPs have low thermal conductivity, typically between 0.003 and 0.004 W/(m·K) [9]. Currently, VIPs are widely used in construction, refrigerators, refrigerated containers, cold-chain transport, and other fields [10,11].
VIPs usually consist of a core material, an envelope, and an absorbent. Most of the core materials are micro/nanoporous matrices such as powders, foams, fibers, etc. [12,13,14]. The outer layer of the VIP is wrapped with a barrier film. The thermal insulation of VIP is directly affected by the barrier properties of this barrier film. According to the classification of materials, there are aluminized films with better barrier properties and metalized films with better densification. The difference in thermal conductivity between the barrier film and core material makes it more difficult for heat flow to pass through the core material, leading to the thermal bridge effect seen in VIPs.
The insulation performance of VIPs is affected by the thermal bridge effect; in recent years, many scholars have studied the thermal bridge effect with VIPs. For example, Márcio et al. [15] investigated the edge thermal bridge effect through experimental and numerical analysis. They developed and compared numerical models with experimental results under steady-state and unsteady-state boundary conditions. Their results quantify the impact of equivalent thermal conductivity on the edge thermal bridge effect. Sprengard et al. [16] conducted numerical simulations of VIPs with different thicknesses to determine the thermal bridge effect with different influencing factors. They also calculated the effect of linear thermal transmittance on the thermal resistance of different panels. Mao et al. [17] measured the insulation performance of VIPs by utilizing effective heat conductivity. The results show that an increase in the thickness of the metal foil and a decrease in VIP thickness leads to an increase in the thermal bridge effect as well. In addition, other scholars have studied the thermal bridge effect on the application of VIPs. For example, Lorenzati et al. [18] researched the thermal bridging effects of jointed VIPs. For an insulated system using VIP panels, they proposed a method to measure the effect of thermal bridges on overall energy efficiency and validated it with experimental results. Lakatos et al. [19] found the applicability of the formation of thermal bridge effects to be limited when they tested the insulation properties of protected vacuum insulated panels. The results show that the use of VIPs reduces the U-value relative to a solid brick wall by at least 70%. Liang et al. [20] studied the thermal bridge effect in a single vacuum insulation panel. They researched the formation of the thermal bridge effect due to the presence of gaps in the gases using insulation box experiments and verified that the thermal bridge effect is affected by the barrier film. The results showed that the thermal bridge effect caused various impacts at various locations of the insulated decorative panels. Although these studies adopt different research methods, they are all based on VIP panel shape fixation. Unlike those studies, the research object of this paper is VIPs with a cavity structure, the panel shapes and sizes of which are variable under different boundary conditions. The relationship between the thermal bridge effect of VIPs and the shape or size of the cavity is the focus of this paper.
This paper first introduces the reasons for the formation of the thermal bridge effect. Through numerical calculations and analyses, the change rule of the effective heat transfer coefficient is derived when the number of cavity sides and the inner tangent circle radius of the cavity are changed. Thus, a quantitative analysis of the magnitude of the thermal bridge effect is presented. Next, a thermal bridge effect measurement experiment is designed by changing the shape and size of the cavity structure. Finally, the COMSOL software is used to simulate the thermal bridge effect and compare the changes in the maximum and minimum temperatures of the heated surface when different physical parameters are changed. The experimental results are compared with the mathematical calculations to verify the laws derived from the mathematical calculations.

2. Materials and Methods

2.1. Calculation and Analysis of the Thermal Bridge Effect

2.1.1. Thermal Bridge Effect of VIPs

Traditional insulation panels (TIPs) are made of homogeneous materials. Since the thermal conductivity value in the center of the TIP is equal to that in each part of the TIP, there is no thermal bridge effect due to differences in thermal conductivity. However, the thermal conductivity of the barrier film is higher than that of the core material. The heat flow can then flow along the barrier film instead of only flowing through the center of the panel. Figure 1 shows a schematic illustration of the thermal bridge effect in TIPs and VIPs.

2.1.2. VIP with Cavity

The conventional VIP is a single panel that lacks a cavity structure, which seriously limits the application of VIPs. VIPs with cavities can be used in more applications, but the existence of a cavity structure will increase the thermal bridge effect. A quantitative study of this increase is needed.
To make the calculation more straightforward, the shape of the cavity is assumed to be a regular polygon. Let the number of regular polygon sides be n, the length of each side of the regular polygon be l, and the tangent circle radius of the regular polygon be r. The vertices of the regular polygon are connected to the center of the tangent circle. The resulting line segment divides the regular polygon into n isosceles triangles. l is the base of each isosceles triangle. r is the height of each isosceles triangle. The angle of the vertex of the isosceles triangle is set to be θ. Taking the regular hexagon as an example, the cavity structure of the VIP is schematically illustrated in Figure 2.
θ = 2 π n
l = 2 r tan θ 2 = 2 r tan π n
The area of the cavity is calculated as follows:
S cav = n l r 2 = n r 2 tan π n
The perimeter of the cavity is calculated as follows:
L c a v = n l = 2 n r tan π n
The area of the VIP with a cavity is calculated as follows:
S = l p w p S c a v = l p w p n r 2 tan π n
where lp is the length of the VIP and wp is the width of the VIP. The perimeter of the VIP with a cavity is calculated as follows:
L = 2 l p + w p + L c a v = 2 l p + w p + 2 n r tan π n

2.1.3. Effective Heat Transfer Coefficient

The traditional method of calculating insulation performance is expressed in terms of the heat transfer coefficient in the non-edge area of the panel, which can be described as follows:
U c o p = δ p λ c o p + 1 h i + 1 h e 1
In Equation (7), hi and he are the heat transfer coefficients of the cold surface and hot surface, respectively. The effective heat transfer coefficient due to the thermal bridge effect can be expressed as follows [21]:
U e f f = U c o p + L S ψ e d g e + i = 1 n 1 S χ p o int
In most instances, the thermal bridge effect at the corners is much smaller than that at the edges, so the last term of the equation in Equation (8) may be neglected [21]. Thus, the edge linear heat transmittance ψedge is used as an important index for analyzing the thermal bridge effect.
The material of the barrier film is assumed to be homogeneous and continuous. Let the thickness of the barrier film be δb. Let the thermal conductivity of the barrier film be λb, and let it be constant in any direction. Let the hot plate temperature be Te and the cold plate temperature be Ti. An analytical model is shown in Figure 3. A section of the micro-unit on the barrier film is taken as the object of analysis. Φ3 represents the heat flow entering the micro-unit along the x-direction. Φ4 represents the heat flow exiting the micro-unit along the x-direction. Φ1 represents the heat flow entering the micro-unit through the surface of the barrier film. Φ2 represents the heat flow through the micro-unit entering the core material.
In a steady state:
ϕ 1 + ϕ 2 + ϕ 3 + ϕ 4 = 0
Using the differential equation, Equation (9) changes to:
λ b δ b d T x d x x λ b δ b d T x d x x + d x + h e ( T e T x ) d x U c o p δ p 2 δ b T x T z d x = 0
while dividing both sides of Equation (10) by dx at the same time and dividing both sides by λbδb at the same time. Then, we employ the following equation:
d T x d x 2 + h e λ b δ b T e h e λ b δ b + U c o p δ p λ b δ b T x + U c o p δ p λ b δ b T z = 0
This can be expressed as:
d T x d x 2 N e 2 T x + B T z = A e T e
Similarly, the equation in the y-direction and on the other side of the VIP can be expressed as:
d T y d y 2 N i 2 T y + B T z = A i T i
In Equations (12) and (13), we define Nm, Am, and B as:
N m = h m λ b δ b + U c o p δ p λ b δ b
A m = h m λ b δ b
B = U c o p δ p λ b δ b
Equations (12) and (13) constitute a system of nonhomogeneous second-order linear differential equations, which are expressed in terms of matrices:
d T x d x 2 d T y d y 2 N e 2 B B N i 2 × T x T y = A e T e A i T i
Based on the differential equations and boundary conditions, the edge linear heat transmittance can be expressed as:
ψ edge = 1 1 + U c o p h i δ p × U c o p h e δ p × λ b δ b δ p + λ b δ b h i   +   h e
Combining Equations (5)–(7) and (18) gives:
U e f f = 1 δ p U c o p + 1 h i + 1 h e + 2 l p + w p + 2 n r tan π n l p w p n r 2 tan π n × λ b δ b 1 + U c o p h i δ p + U c o p h e δ p δ p + λ b δ b h i   +   h e
According to Equation (19), the parameters affecting the effective heat transfer coefficient of a VIP with a cavity were obtained. These include the thermal conductivity of the center region (Ucop), external environment (h), size (wp, lp) and thickness (δp) of the VIP, thickness (δb) of the barrier film, thermal conductivity (λb) of the barrier film, tangent circle radius of the cavity (r), and number of cavity sides (n). Among them, r and n are independent parameters, which are not affected by other parameters. Therefore, in this paper, we will investigate the effects of r and n on the thermal bridge effect of VIPs.

2.1.4. Analysis of Thermal Bridge Effect

Table 1 shows the boundary conditions. The material of the barrier film is selected as a two-layer aluminized film and the core material is selected as glass fiber. The dimensional data of VIP are provided in the subsequent experimental measurements in this paper. By substituting each parameter in Table 1 into Equation (19), the effective heat transfer coefficient Ueff with respect to r and n can be expressed as:
U e f f = 0.0659 + 0.9231 × 10 3 × 1.2 + 2 n r tan π n 0.09 n r 2 tan π n
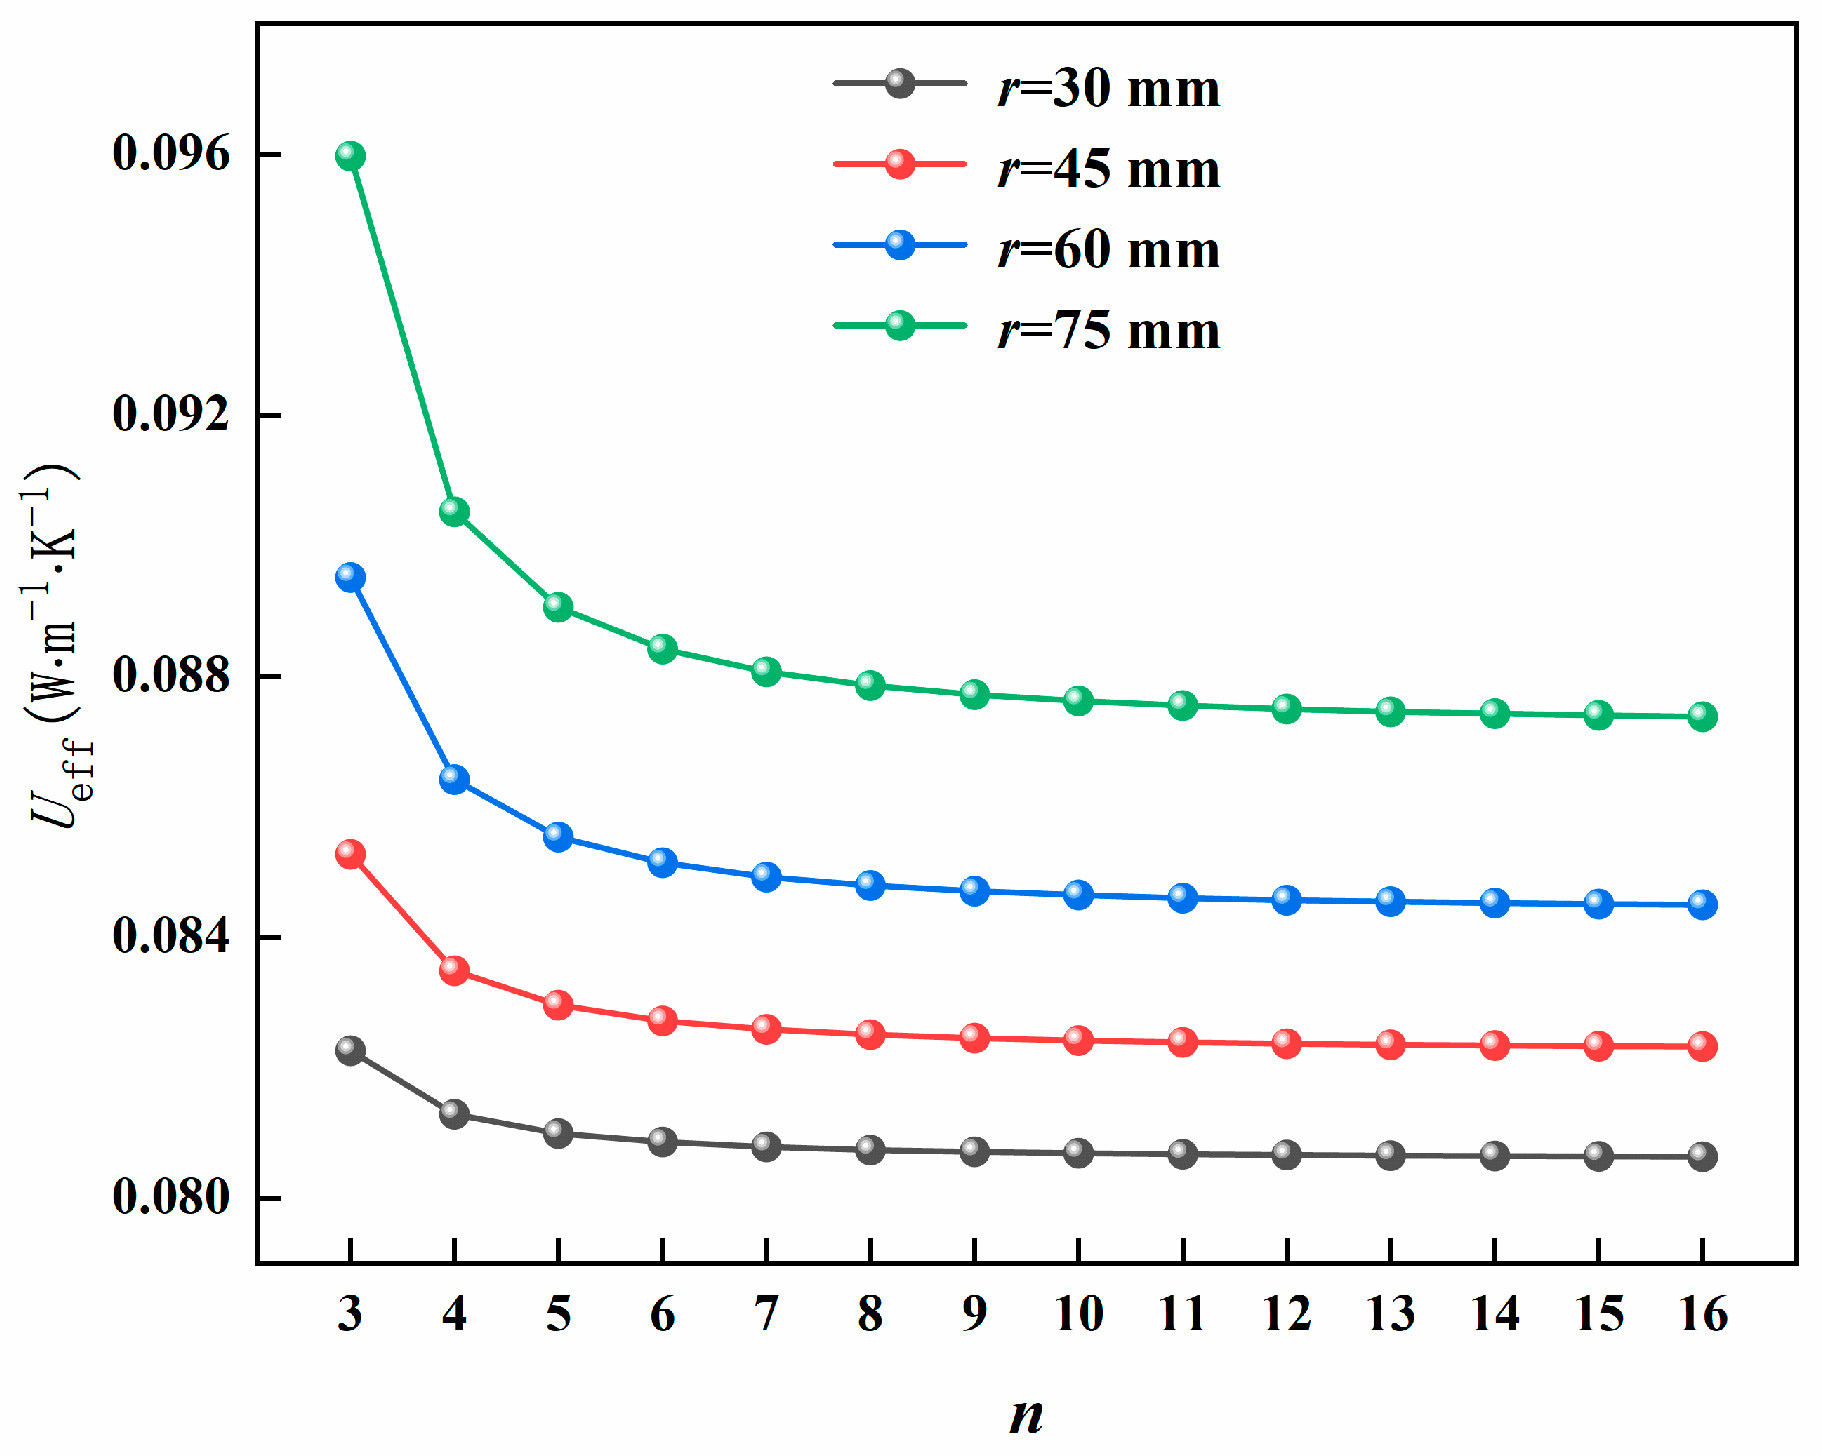
The number of cavity sides n is an important parameter affecting Ueff. To facilitate an analysis of the effect caused by the variation of n, r is set as a constant value, which is taken to be 30 mm, 45 mm, 60 mm, and 75 mm, respectively. n and Ueff are regarded as independent and dependent variables. Their variation relationship is plotted according to Equation (20), as shown in Figure 4.
As can be seen from Figure 4, n has a significant impact on the thermal bridge effect of a VIP with a cavity. When r is a constant value, the effective thermal coefficient is at a maximum when the shape of the cavity is a regular triangle, and the thermal bridge effect causes the most impact. The value of the effective heat transfer coefficient decreases as the number of sides increases. This is because the distance l (Equation (2)) between the center of the VIP panel and each cavity side is getting shorter. Thus, the heat on the barrier film on the hot surface of the VIP is transferred farther along the barrier film to the sides of the cavity, which makes the VIP less susceptible to the impact of the thermal bridge effect. When the cavity shape changes from a regular triangle to a regular quadrilateral, the effective heat transfer coefficient is reduced by more than 1%. When the shape of the cavity changes from a regular octagon to a regular nonagon, the effective heat transfer coefficient is reduced by less than 0.1%. Therefore, it can be concluded that the cavity shape is ideal when the number of sides is eight or more.
The tangent circle radius r is also an important parameter affecting Ueff. Since the cavity shape cannot exceed the range of the VIP, the range of values of r is also affected by a parameter, i.e., the radius of the circumcircle ro. ro must be shorter than the length or width of the VIP. It is expressed as follows:
r o = r 2 + l 2 2 = r 2 + r tan π n 2 < min l p 2 , w p 2
According to Figure 4, taking the values of n as 3, 4, 5, 6, 7, and 8, the range of values of r when substituting into Equation (21), respectively, are:
r < 0.075 ,   n = 3 r < 0.106 ,   n = 4 r < 0.121 ,   n = 5 r < 0.130 ,   n = 6 r < 0.135 ,   n = 7 r < 0.139 ,   n = 8
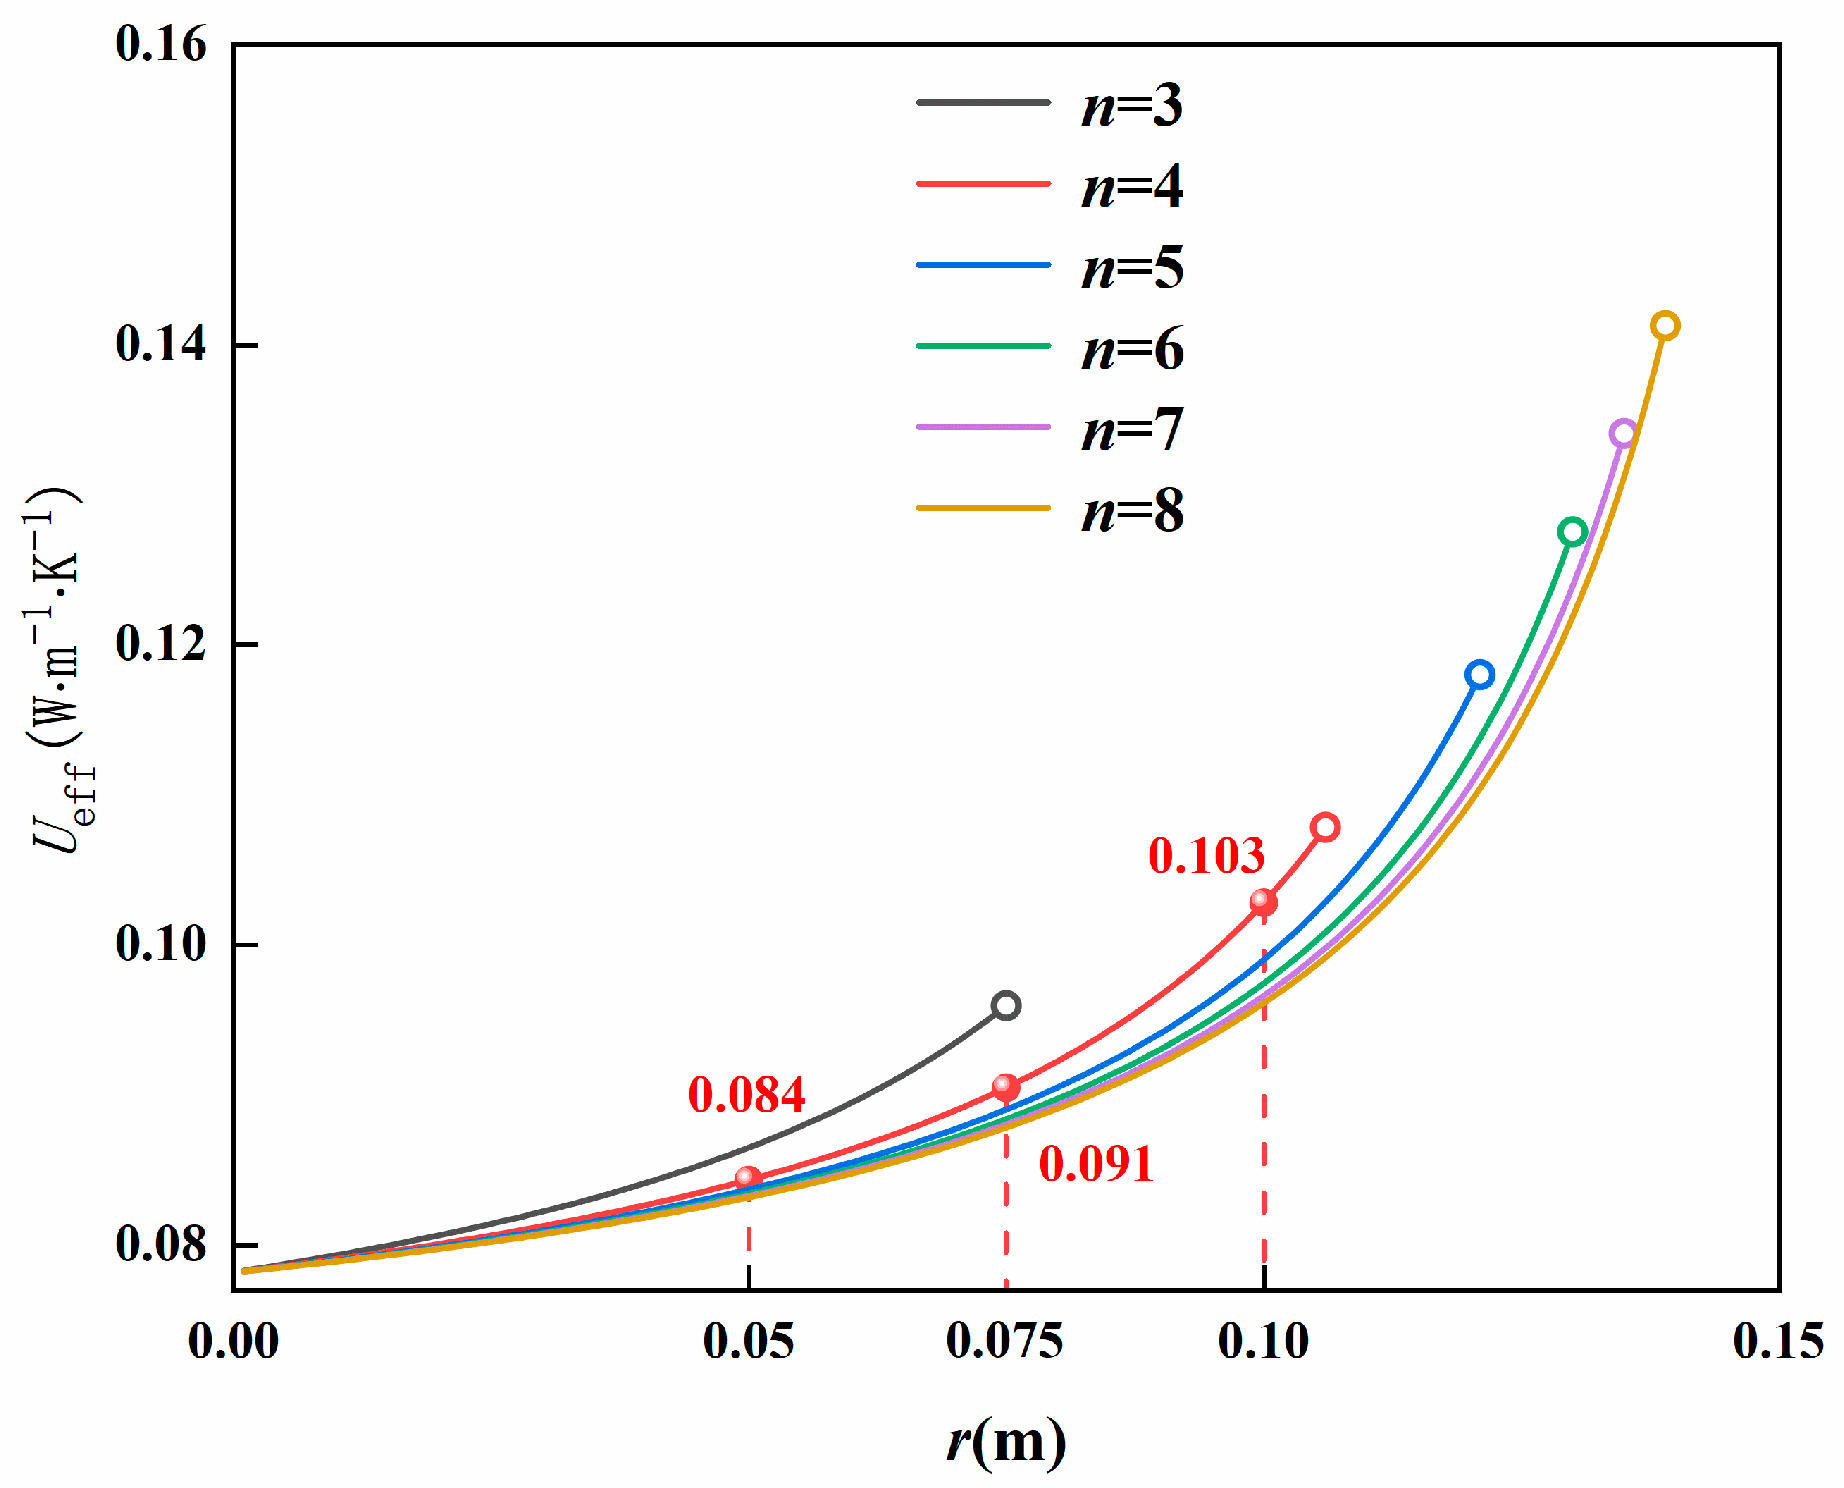
where r and Ueff are regarded as independent and dependent variables. The variation relationship is plotted according to Equations (20) and (22), as depicted in Figure 5.
From Figure 5, it is evident that r has a significant impact on the thermal bridge effect of the VIP. The Ueff of the VIP is proportional to the tangent circle radius in the case of a fixed cavity shape. With an increase in r, the rate of increase of Ueff becomes faster. This is because the increase in r also makes the distance l (Equation (2)) from the center of the VIP on each side of the cavity increase. Therefore, the distance from the heat transfer on the VIP hot-surface barrier film to the sides of the cavity is reduced, and the influence of the thermal bridge effect is also more pronounced. At n = 4, the effective heat transfer coefficient increases by 9.6% for 0.05 < r < 0.75 and by 13.1% for 0.075 < r < 0.10. Therefore, it can be concluded that the smaller the tangent circle radius of the cavity, the more its influence can be reduced.

2.2. Experimental Verification

2.2.1. Experimental Apparatus

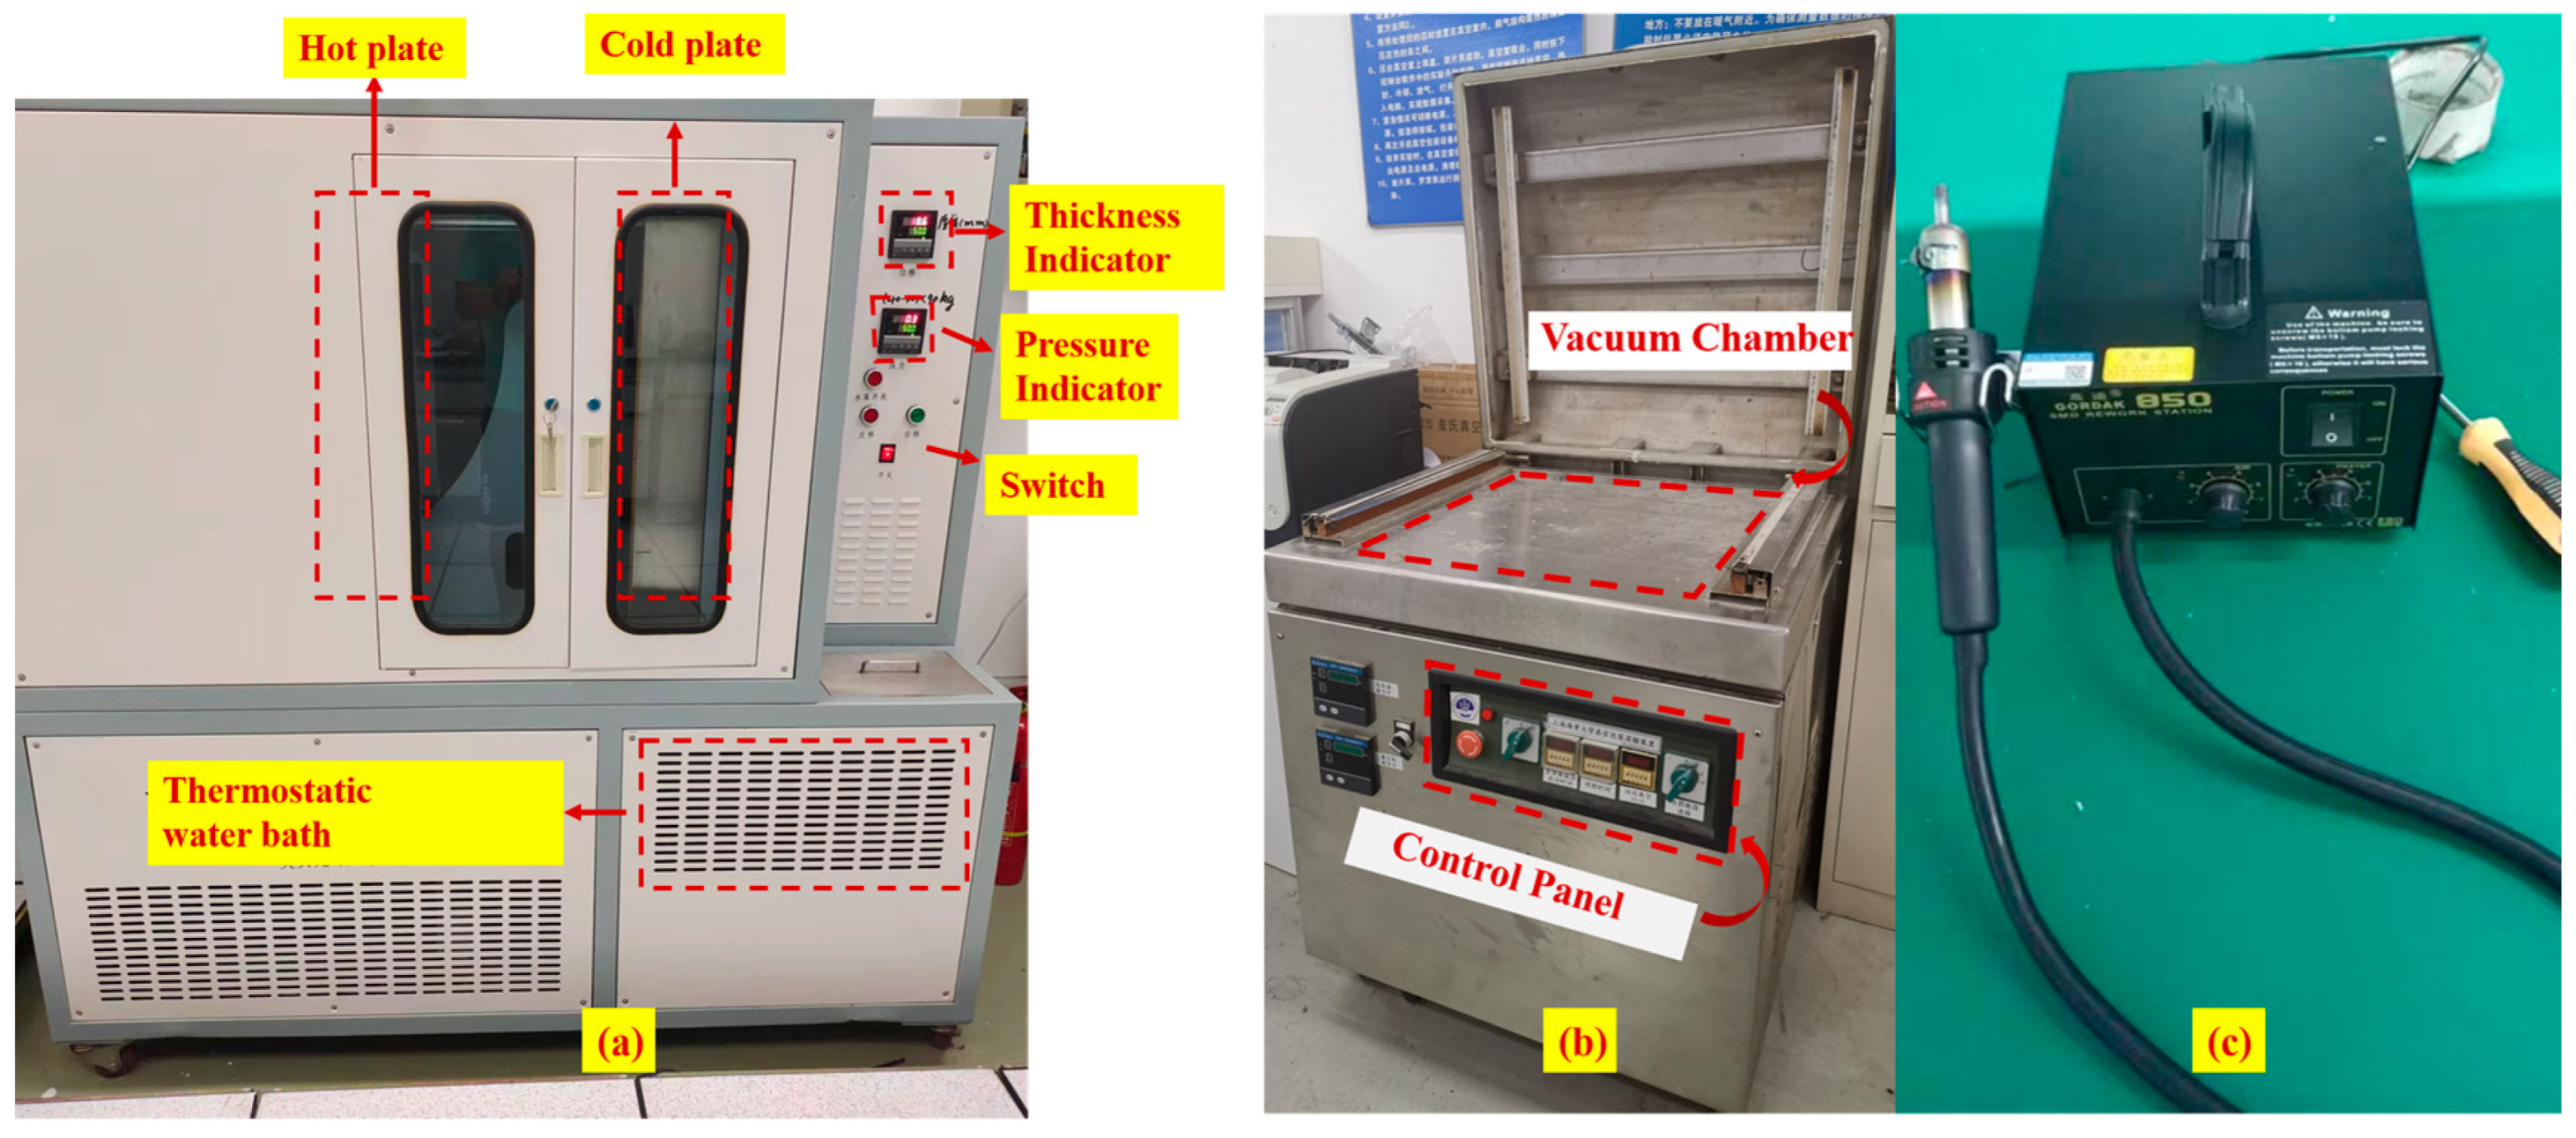
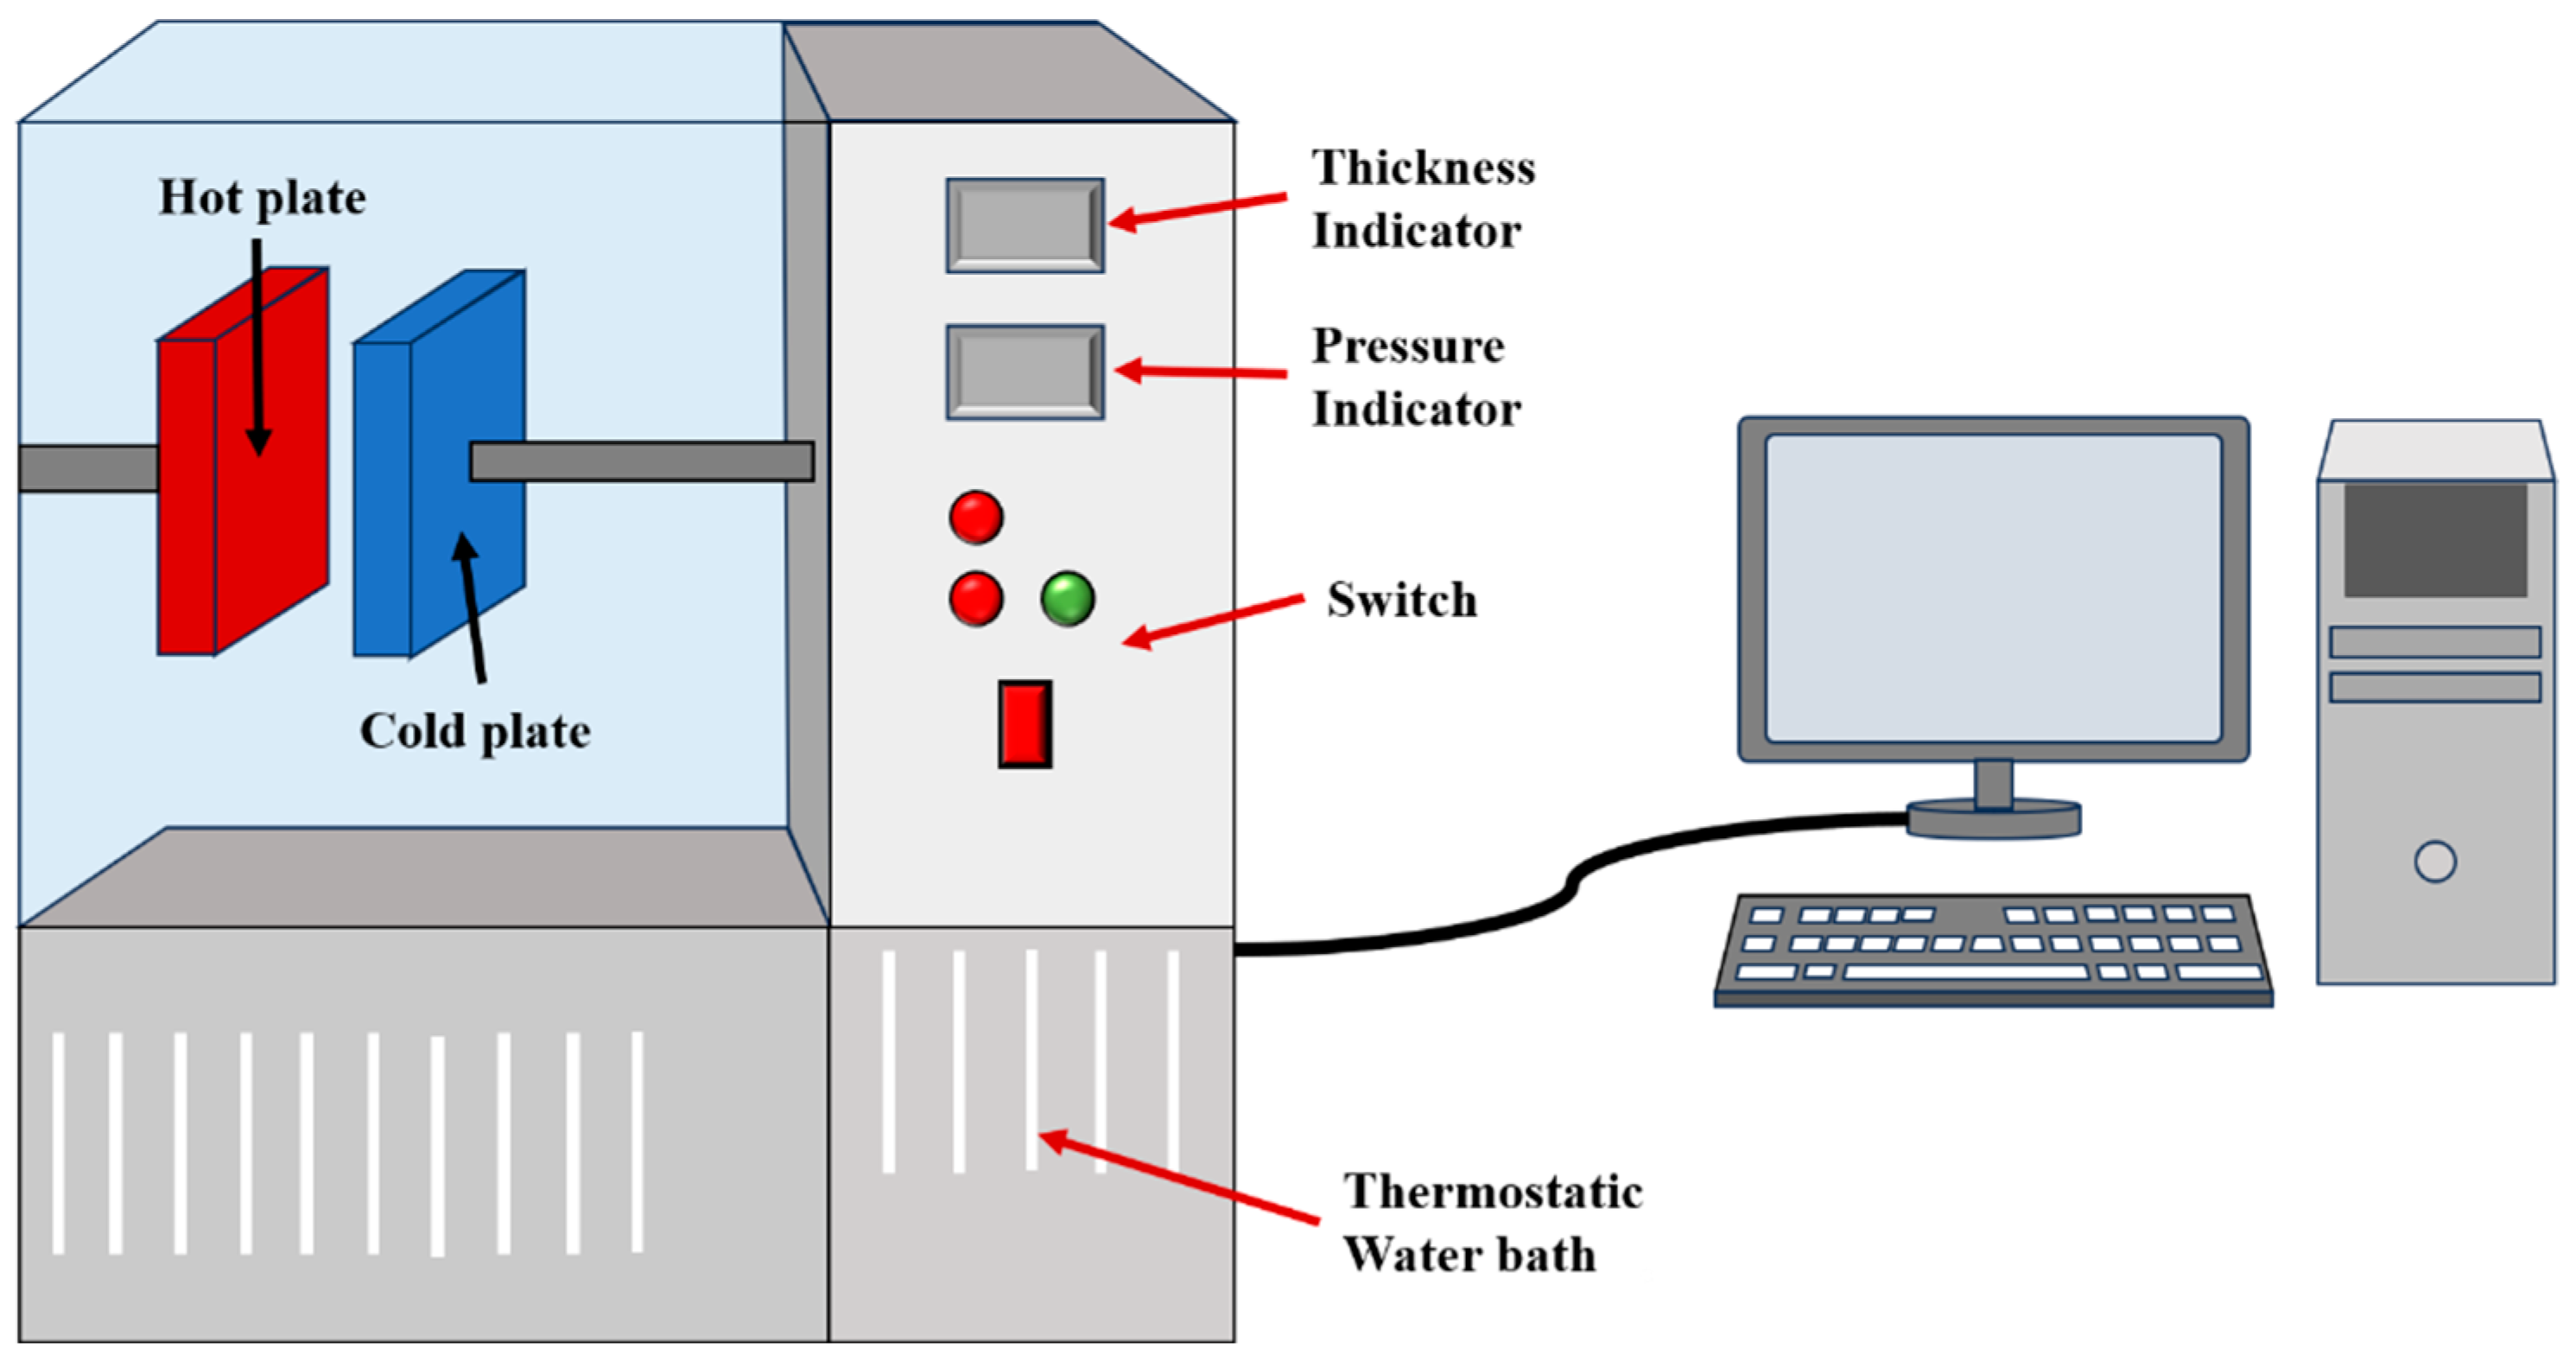
Experimental measurements were made to verify the calculated effective heat transfer coefficients of VIPs with cavities. We measured the thermal conductivity of the specimen, as shown in Figure 6a, with a measuring apparatus [25]. Figure 7 is a schematic diagram of the measuring apparatus. During the experiment, the specimen was first put between a hot plate and a cold plate, and then the temperatures of the two plates were adjusted by the control system to produce a certain temperature difference between them. Under steady-state conditions, the heat transfer coefficient of the specimen can be counted by measuring the input power Φ of the heater and the temperature difference ∆T set by the cold and hot plates on both sides of the specimen. The temperature needs to be precisely controlled and monitored during the experiment to ensure the accuracy of the data [26]. The effective heat transfer coefficient of the specimen can be derived as follows:
U exp = ϕ S Δ T
The experimental equipment was set to a hot-plate temperature of 308 K and a cold-plate temperature of 288 K before we measured the thermal conductivity of the VIP. The experimental environment was a laboratory with an air temperature of (296 ± 2) K and a relative humidity of (50 ± 5)%.

2.2.2. Preparation of Experimental Materials

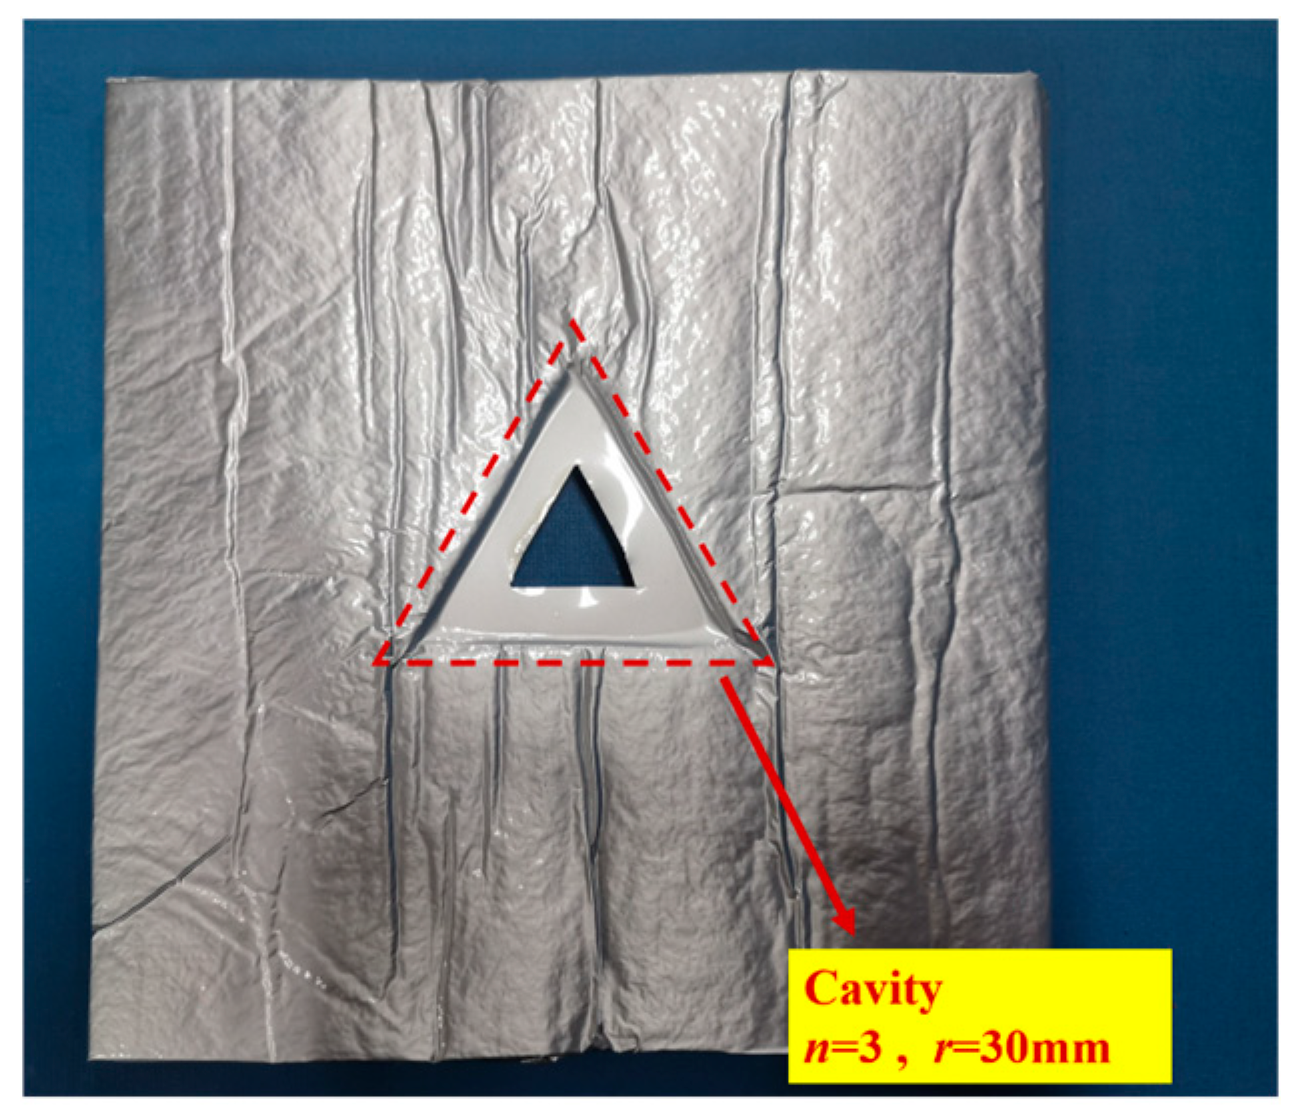
VIPs with cavities that met the experimental conditions were fabricated as experimental specimens to meet the needs of a quantitative study of the thermal bridge effect. Firstly, to study the effect of the number of sides n of the cavity, six groups of specimens with a radius of the tangent circle of r = 30 mm were fabricated; the parameters of each group of specimens are shown in Groups I–VI in Table 2. In addition, to investigate the effect of the radius of the tangent circle r, four groups of specimens with a cavity in the form of a square were fabricated, and the parameters of each group of specimens are shown in Groups II and VII–IX in Table 2. To control other variables, VIPs with parameters of 300 mm × 300 mm × 30 mm were used for all nine sets of specimens. The specimen of group I is shown in Figure 8.
The process of making a VIP with a cavity is as follows: first, the glass-fiber core is cut to the size required for each set of experiments listed in Table 2, with a cavity of the corresponding size and shape cut out of the middle of the core. Second, the core is dried in an electric drying oven at atmospheric pressure. Third, the barrier film, cut to the appropriate size, is heat-sealed on three sides. The heat-sealing equipment is shown in Figure 6b. Fourth, the barrier film is placed in the vacuum chamber area, and the treated core is set to a heat-sealing time of 10 s [27]. A vacuum pump, motor, vacuum chamber, two sealing strips, and other components make up the vacuum-packaging machine [28]. Fifth, the lid of the apparatus is covered for heat sealing, and the barrier film is formed into a pouch after three iterations of heat sealing. Sixth, we place the treated core into the barrier film [29]. At this point, we position it in the area of the vacuum chamber, as shown in the figure, and we heat-seal and evacuate the unsealed side of the barrier film. The operation panel sets the time of vacuuming to 10 min and the time of heat-sealing to 10 s. Finally, we use the heat-sealing device, model W.E.R 8500, to heat-seal the barrier film at the cavity, as shown in Figure 6c. We cut the barrier film at the cavity to meet the application requirements.

2.2.3. Measurement Uncertainties

The experimental apparatus and data collection methods determine the accuracy of the data obtained from experimental measurements. Regarding the uncertainty of the VIP heat transfer coefficient measurements, a corresponding study was made by Lorenzati et al. [30]. They found that to obtain ± 3% accuracy in the measurements analyzed, the temperature difference between the cold plate and hot plate of the experimental setup must be equal to at least 13 K or higher. Therefore, the cold plate temperature and the hot plate temperature in this experimental setup are 288 K and 308 K. The temperature difference is 20 K, which is higher than the minimum of 13 K. In addition, the thermocouples on the cold plate and the hot plate, the thickness sensor to measure the VIP thickness, and the Vernier caliper used to measure the size of the VIP all have uncertainties. All these uncertainties are shown in Table 3.
The relative uncertainty for each group of experiments was estimated [31] after considering the measurements and boundary conditions for each group of experiments.
E = U exp Δ T Δ T 2 + U exp Δ ϕ ϕ 2 + U exp Δ S S 2 U exp × 100 %

3. Results and Discussion

Before starting the measurement of a VIP with a cavity, we measured the thermal conductivity of a VIP without a cavity. Its length, width, thickness, the materials of the barrier film and core material, and the handling of the specimen were the same as in experimental groups I–IX. The thermal conductivity of the center region was obtained from this measurement and is recorded in Table 1.

3.1. Influence of the Number of Cavity Sides

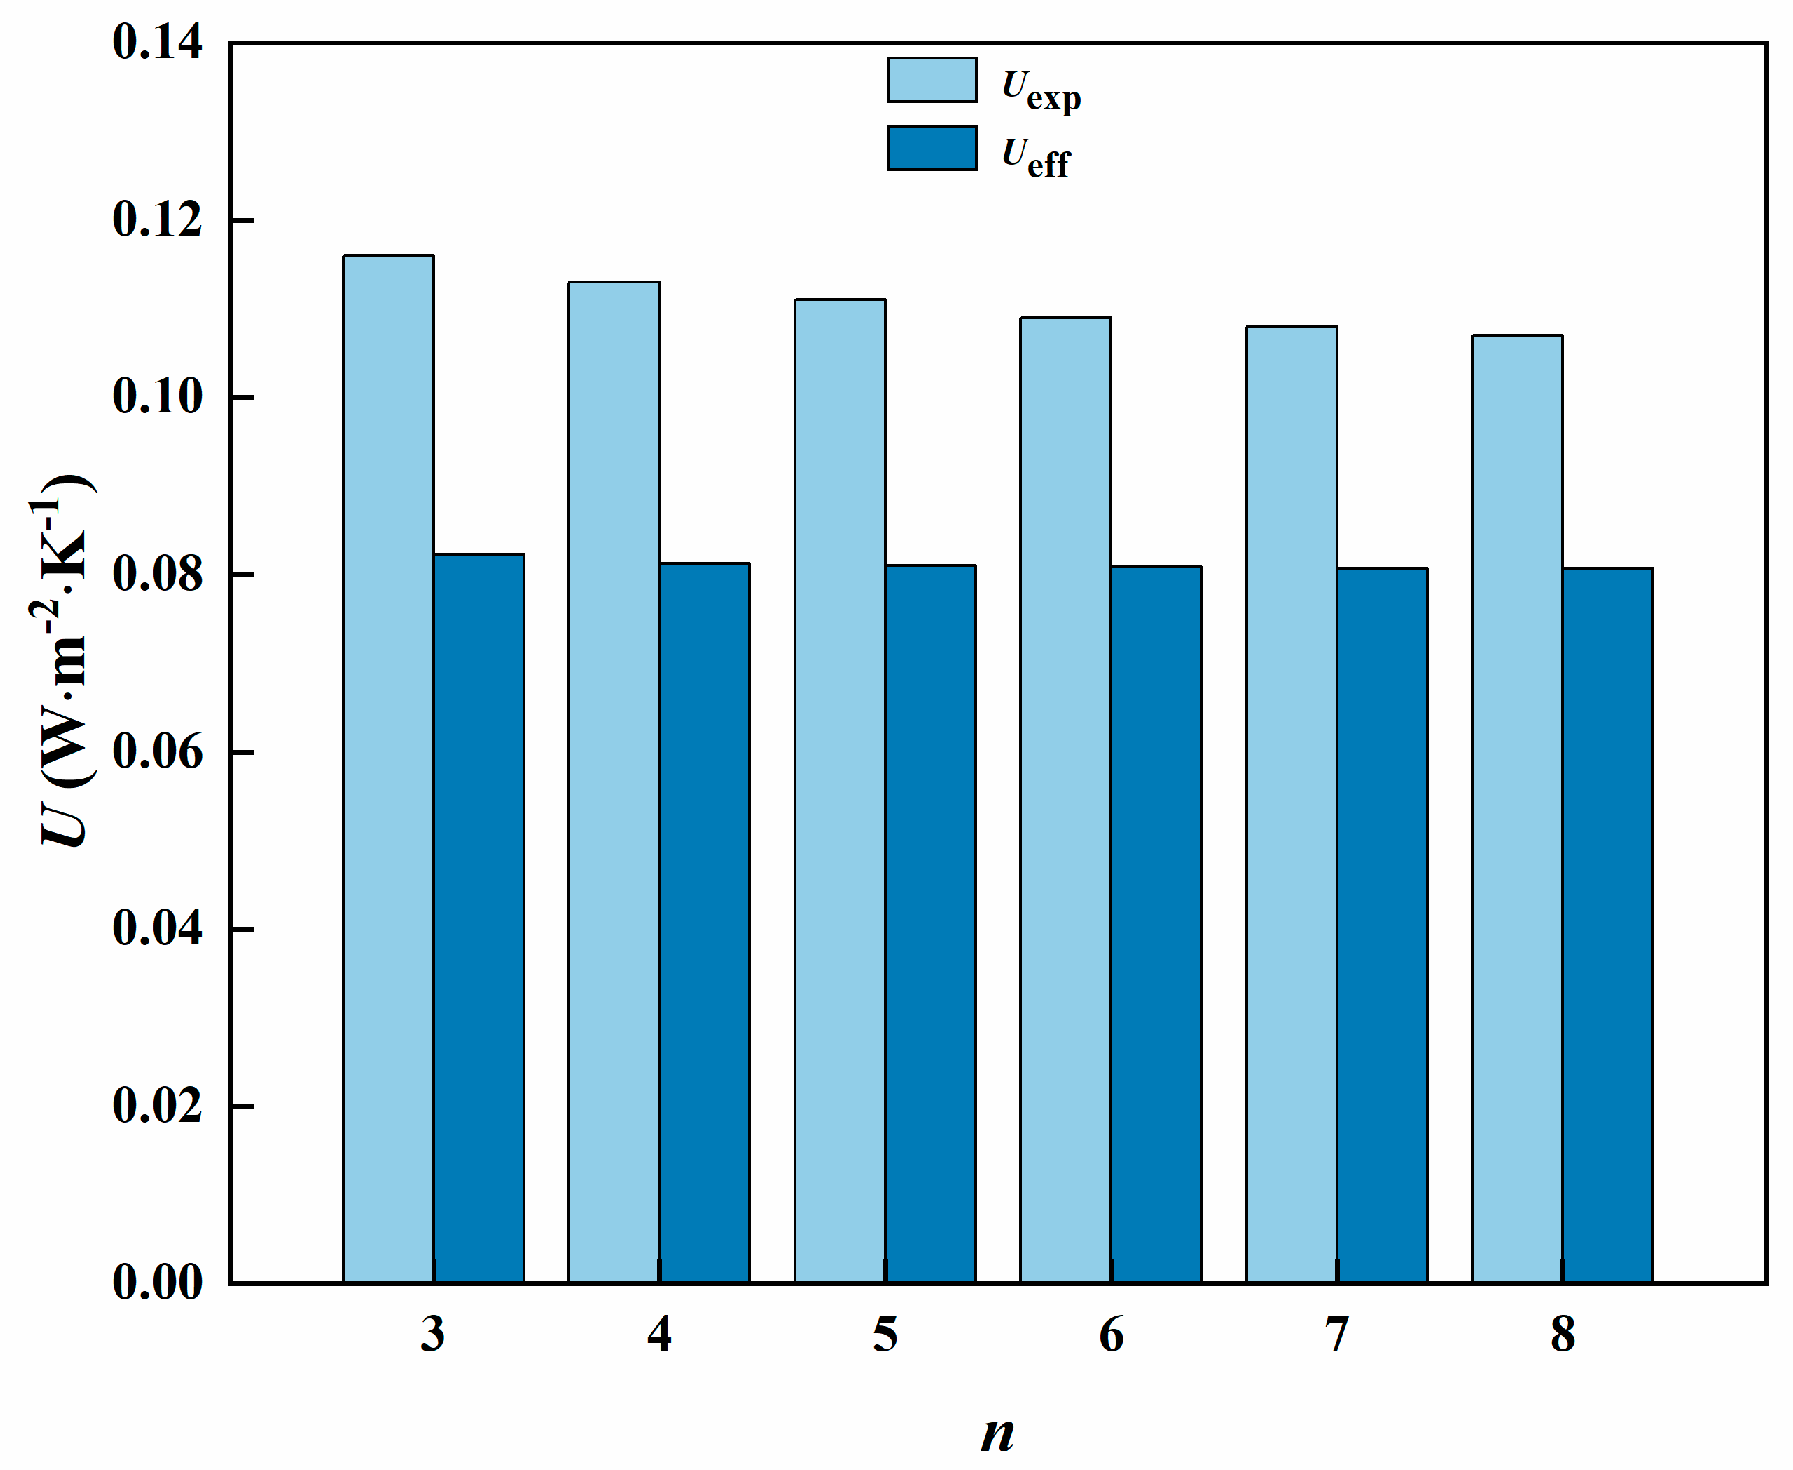
The number of sides n has a significant influence on the thermal bridge effect. Figure 9 illustrates a comparison of the calculated and experimental values of effective heat transfer coefficients for experimental groups I–VI. The experimental values are higher than the computed values. This error arises because the thermal bridging effect at the corners is neglected to ensure the feasibility of the numerical calculations. Another reason is that there is air between the specimens with the hot plate and cold plate, and heat will be emitted from the air. This variation in experimental values verifies the law derived from numerical calculations. In other words, because the increase in n makes the l (Equation (2)) between the centers of the VIPs on both sides of the cavity decrease, the distance of heat transfer on the barrier film becomes longer. The effective heat transfer coefficient decreases by 1.9% when n increases. When r and the other boundary conditions are constant, the effective heat transfer coefficient of a regular triangle shape is the highest. The thermal bridge effect is negatively correlated with n. These experiments prove that to improve the insulation performance of the VIP, the number of cavity sides should be maximized.

3.2. Influence of the Tangent Circle Radius of the Cavity

Similarly, the tangent circle radius r has a significant influence on the thermal bridge effect. Figure 10 illustrates a comparison of the calculated and experimental values of effective heat transfer coefficients for experimental groups II and VII–IX. The experimental values obtained were slightly higher than the calculated values. The reason for the discrepancy is the same as that described in Section 3.1. The variations in the experimental values verify the law obtained from the numerical calculations. That is, because the increase of r makes the l (Equation (2)) between the centers of the VIPs on both sides of the cavity also increase, the distance of heat transfer on the barrier film becomes shorter. As r increases, the effective thermal conductivity increases by 11.4%. With n and other boundary conditions constant, the effective heat transfer coefficient of the VIP with a cavity with a radius of the tangent circle of 30 mm is the lowest, and the effective transfer coefficient when r = 75 mm is the highest. The thermal bridge effect is positively correlated with r. This experiment proves that to improve the insulation performance of VIP, the tangent circle radius of the cavity should be minimized.

3.3. Simulation of the Thermal Bridge Effect

3.3.1. Influence of the Number of Sides of the Cavity

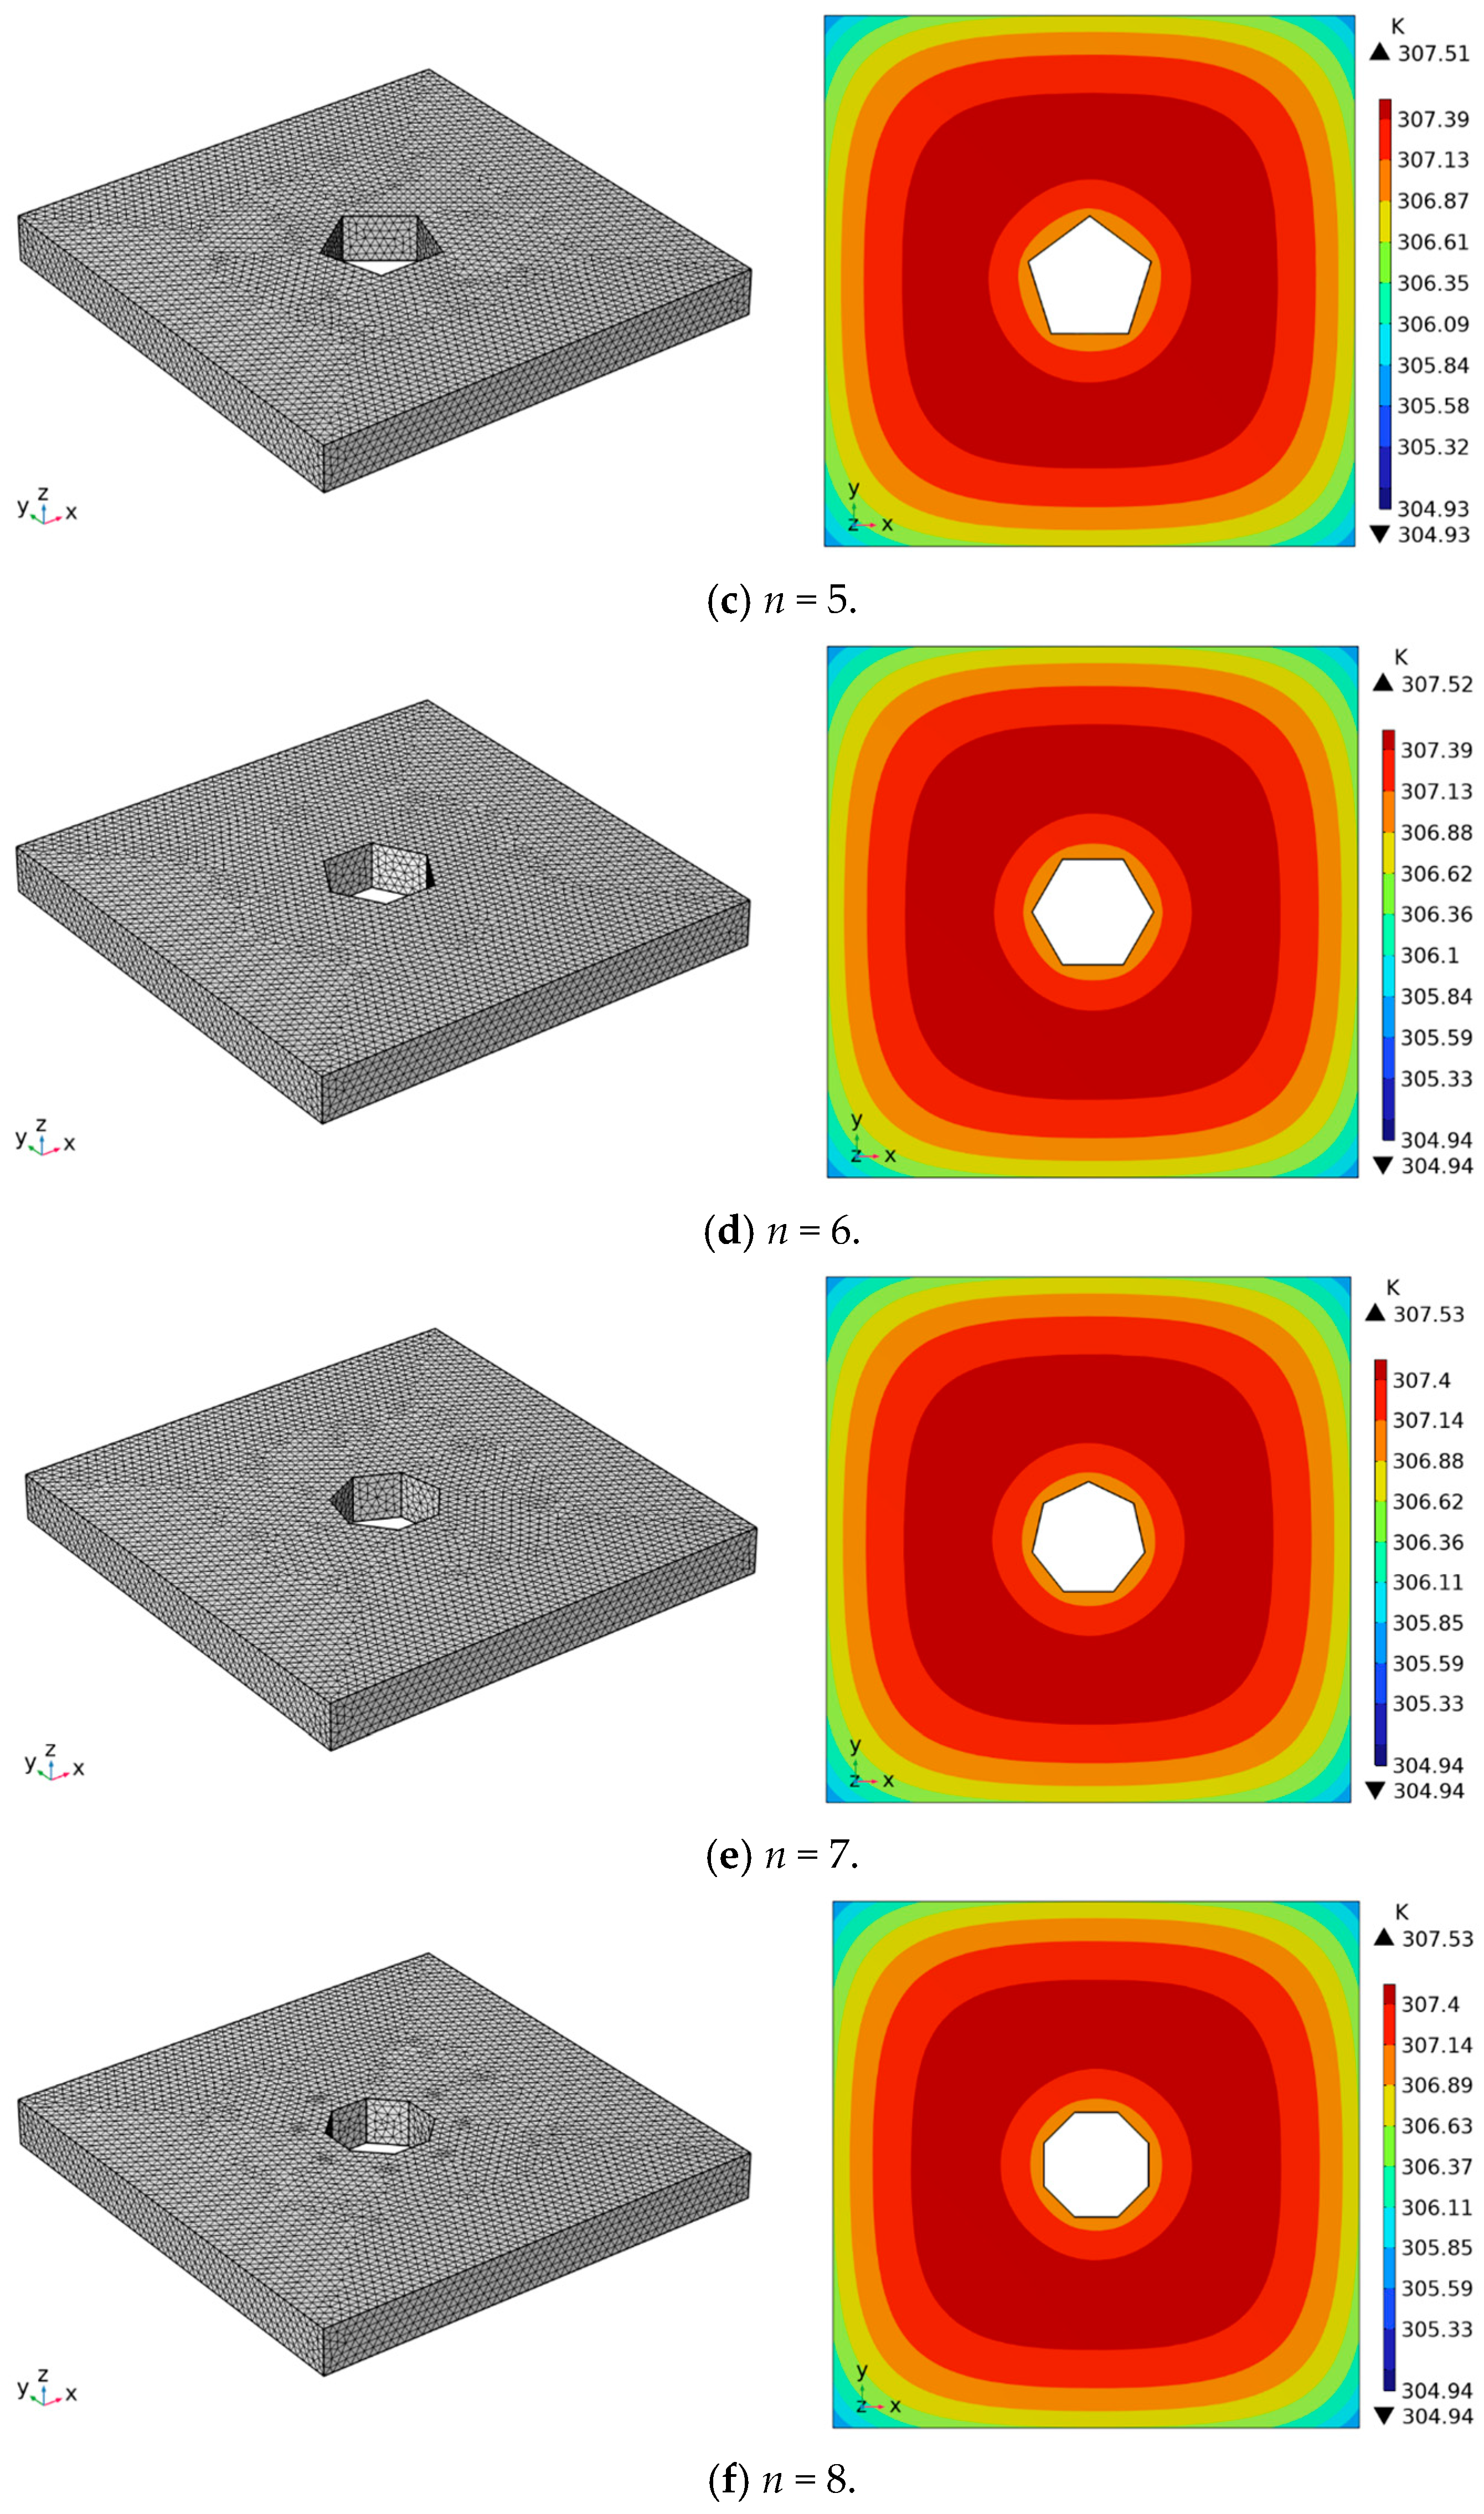
This study was conducted on VIPs with cavities, and COMSOL software was used to simulate the edge thermal bridge effect of the VIP. To study the influence of n, r was set to a constant value of 30 mm. Taking the values of n as 3, 4, 5, 6, 7, and 8, six physical models were established. The size and heat transfer coefficients of the VIPs are shown in Table 1. The accuracy of the simulation has high requirements, so the most refined grid division in the simulation software was used. The number of units divided by the six working conditions is shown in Table 4. The result of meshing is shown in Figure 11. We made the following assumptions:
  • The materials of the air and the VIP are isotropic;
  • The effect of the viscosity of air on the simulation is not considered;
  • Air is assumed to be an ideal gas, and its properties are independent of temperature and pressure;
  • The side surfaces of the VIP are assumed to be insulated and do not exchange heat with the air.
Figure 11. The grid models and the isothermograms of the hot surface of the VIP, where r = 30 mm: (a) n = 3; (b) n = 4; (c) n = 5; (d) n = 6; (e) n = 7; (f) n = 8.
Energies 18 00467 g011aEnergies 18 00467 g011b
Table 4. Parameters of the grid, where r = 30 mm.
Shape of the Cavityn = 3n = 4n = 5n = 6n = 7n = 8
Number of
domain units
193,376195,579197,348197,240197,267197,624
Number of surface units14,44814,21614,48814,34414,40614,468
Number of edge units543520521522525524
Number of freedom degrees for the solution272,412275,123277,756277,406277,544278,038
Number of internal freedom degrees included29,98929,48030,02729,74229,87329,996
To make the meshing more feasible, the diaphragm layer was simplified as pure aluminum foil, and its parameters were set as shown in Table 1. Te and Ti are the temperatures of the hot and cold plates. The physical models were simulated using the energy equation after they had been established. The finite volume method was employed to solve the steady-state heat transfer equation. Table 4 presents the statistics for the number of freedom degrees.
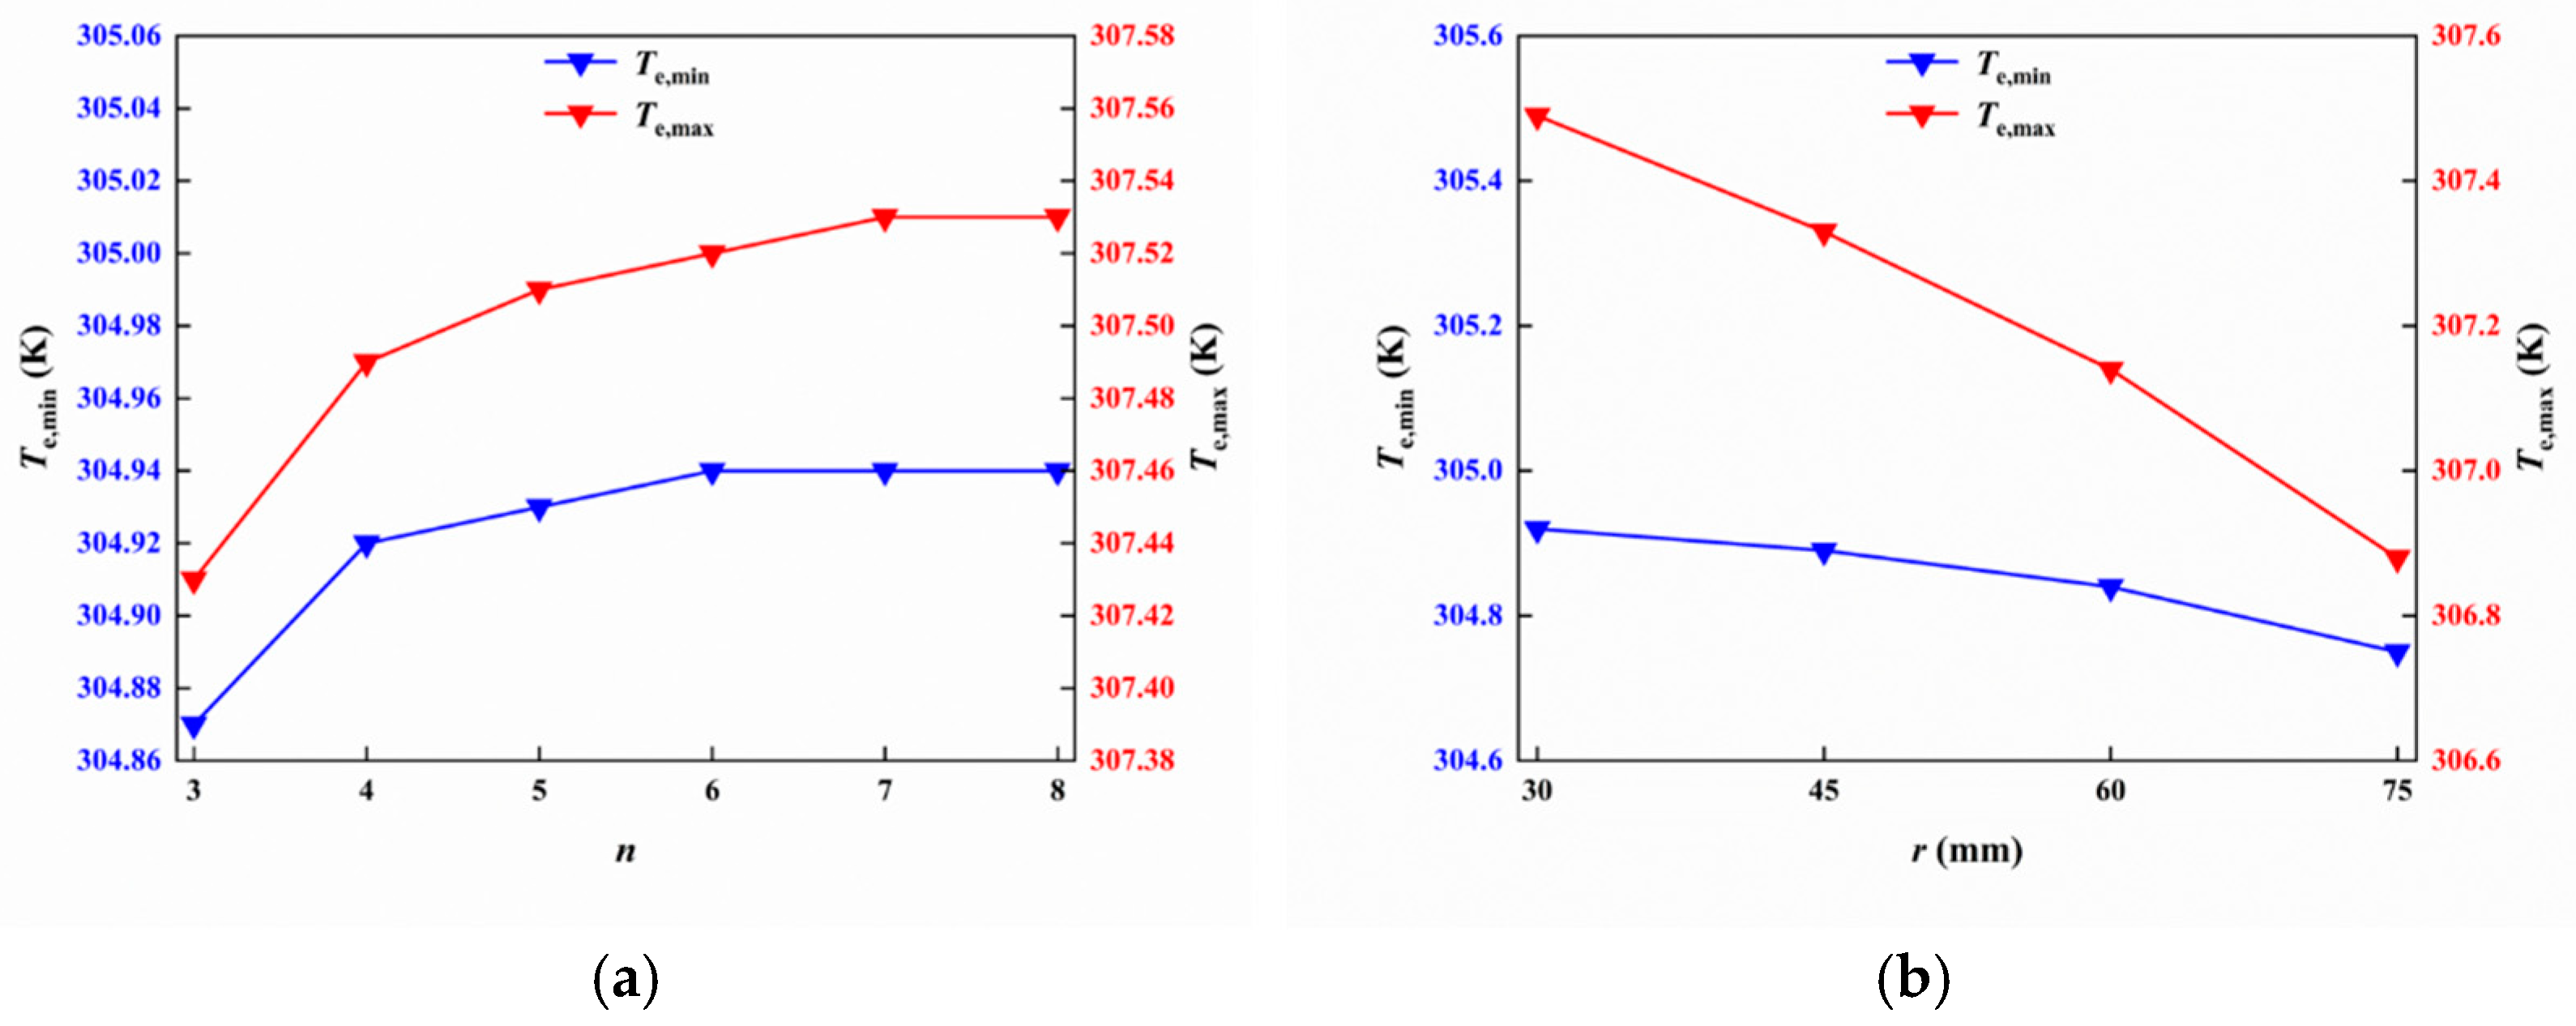
Six steady-state simulations were used. On the hot surface, the temperature was lower closer to the sides, which is because of the occurrence of the thermal bridge effect. Heat flow is more easily transferred to the cold surface through the sides. Simulations were performed for the six physical models, and their isothermograms are shown in Figure 11. Different cavity shapes produce different thermal bridging effects. With a gradual increase in n, the isotherms at the sides of the cavity become darker in color, which is due to the decreasing thermal bridge effect of the cavity. The maximum and minimum hot surface temperatures become higher as n gradually increases. This is due to a reduction in the thermal bridge effect and a gradual increase in the insulation performance of VIPs. Figure 12a represents the variations in the maximum and the minimum hot surface temperatures. Te,max and Te,min are the lowest when n = 3, and the increase in n makes them also increase. The variations in Te,max and Te,min illustrate that the influence of the thermal bridge effect decreases with increasing n. Te,max is closer to the initial temperature, and the insulated performance of VIP becomes better gradually. The simulation results verify the conclusion drawn from the numerical calculations in Section 2.1.4, namely, that increasing the number of cavity sides decreases the thermal bridge effect.

3.3.2. Influence of the Tangent Circle Radius of the Cavity

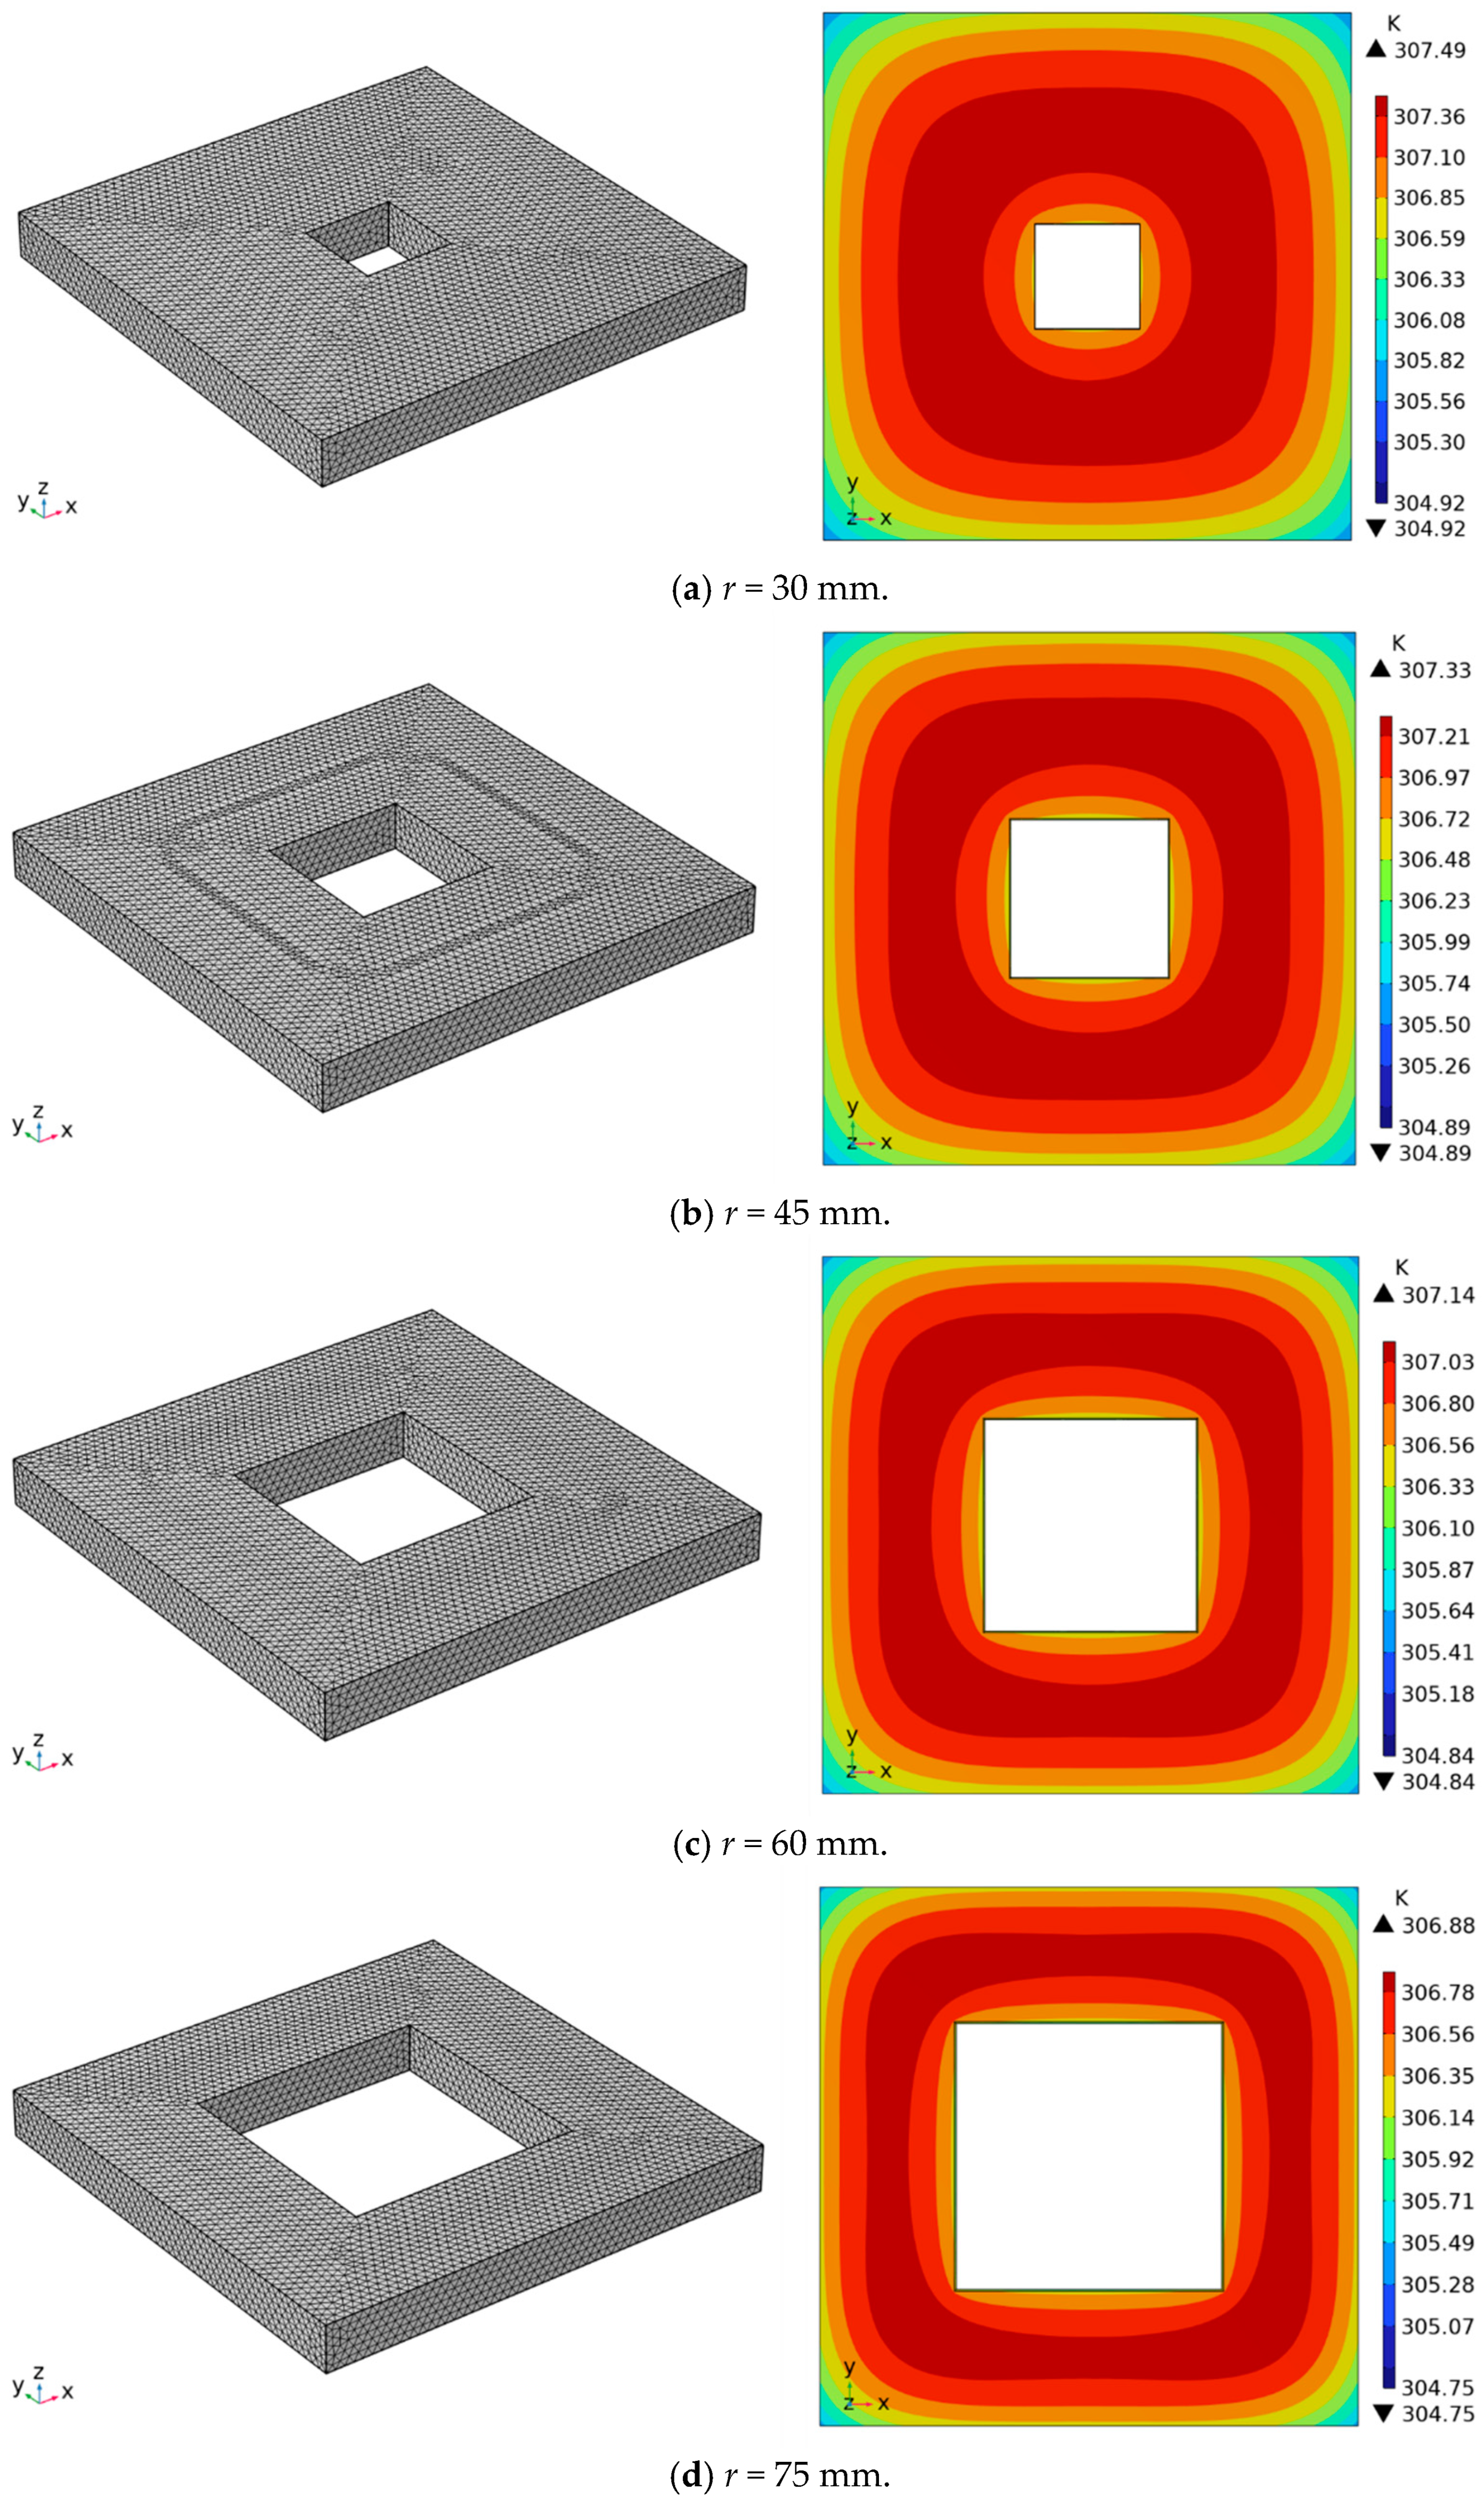
To study the influence of r, n was set to a constant value of 4. Taking the values of r as 30 mm, 45 mm, 60 mm, and 75 mm, we established four physical models, for which the size and heat transfer coefficients of the VIP are shown in Table 1. The accuracy of the simulation has high requirements, so the most refined grid division in the simulation software was used. The number of units divided by the four working conditions is shown in Table 5. The distribution of the grid after division is shown in Figure 13. The assumptions were the same as those described in Section 3.3.1. The physical models were simulated using the energy equation after they had been established. The finite volume method was employed to solve the steady-state heat transfer equation. The number of freedom degrees is shown in Table 5.
Four steady-state simulations were used to investigate the above four working conditions, and their isothermograms are shown in Figure 13. Cavity sizes vary, as do the influence of the thermal bridge effect. With the gradual increase in r, the isotherms at the sides of the cavity become lighter in color, which is due to the increasing thermal bridge effect of the cavity. The maximum and minimum hot surface temperatures become lower as r gradually increases. This is due to an increase in the thermal bridge effect, which reduces the insulation performance of the VIP. Figure 12b represents the variations in the maximum and minimum temperatures of the hot surface. The variations in Te,max and Te,min illustrate that the influence of the thermal bridge effect increases with an increase in r. The simulation results verify the conclusion drawn from the numerical calculations in Section 2.1.4, namely, that the increase in the tangent circle radius of the cavity will make the thermal bridge effect of the VIP increase.

3.4. Limitations of the Study

There are two aspects of our study that warrant caution when interpreting the results. Firstly, due to the limitations of the experimental conditions, two parameters in the mathematical model were derived from the literature. In Table 1 and Equation (20), the thickness and thermal conductivity of the barrier film are cited from Reference [24]. We must acknowledge that using experimentally measured parameters would make the study more reliable. Nevertheless, we verified these two parameters with the manufacturer of the barrier film, which significantly reduced potential biases.
Secondly, while the experiments used an almost constant temperature as the boundary condition, the simulations employed a convective boundary condition. This choice was made to provide a more general representation of various actual conditions. Such a simplification is typical in studies to make the problem tractable and to facilitate analysis. Due to equipment limitations, the thermostatic boundary condition used in the experiments was a reasonable approximation. We have analyzed the potential impact of this discrepancy on the results and found that the overall trends and conclusions remain consistent, despite the differences in boundary conditions.

4. Conclusions

Compared with traditional thermal insulation materials, using VIPs as an enclosure can effectively increase thermal resistance and improve the efficiency of energy utilization. However, in engineering applications, the occurrence of the thermal bridge effect is inevitable. The objective of this paper is to provide a theoretical basis for the selection of the shapes and sizes of cavities in VIPs in engineering applications to minimize the impact of thermal bridges. The effective heat transfer coefficient of a VIP with a cavity is used as the evaluation criterion, and the following conclusions are drawn based on numerical calculations, simulations, and experiments:
  • The thermal bridge effect when the tangent circle radius r is different or when the number of sides n of the cavity is different was investigated through experiments and numerical calculations. The results show that the influence of n and r on the thermal bridge effect could be verified by experiments and numerical calculations.
  • When other boundary conditions are the same, n has a noticeable influence on the thermal bridge effect. When n is 3, the effective heat transfer coefficient is the highest. It was experimentally verified that the effective heat transfer coefficient at n = 3 was 1.9% larger than that at n = 8. The thermal bridge effect decreases with increasing n, and the insulation performance of VIP increases with increasing n. Therefore, in engineering applications, to improve the efficiency of energy utilization, a VIP with more sides to the cavity should be used, and the number of sides should be at least 8 or more.
  • When other boundary conditions are the same, r has a noticeable influence on the thermal bridge effect. r is positively correlated with the thermal bridge effect of the VIP. It was experimentally verified that the effective heat transfer coefficient at r = 30 mm was 11.4% smaller than that at r = 75 mm. With an increase in r, the thermal bridge effect of the VIP gradually increases, and the insulation performance of the VIP decreases. Therefore, in engineering applications, the tangent circle radius of the cavity should be as small as possible.
  • Through simulation, the thermal bridge effect was investigated when n was different. It was found that the greater the number of sides of the cavity, the higher the maximum and minimum temperatures of the hot surface, and the better the insulation performance of the VIP. The thermal bridge effect at different r values was also investigated. It was found that the larger the r value, the lower the maximum and minimum temperatures of the hot surface, and the poorer the insulation performance of the VIP. To ensure the better insulation performance of the VIP, a cavity should be selected with more sides and a smaller radius of the tangent circle, which is consistent with conclusions 2 and conclusion 3.
In practical applications, the occurrence of the thermal bridge effect is unavoidable. We will continue to investigate VIPs made of different materials and VIPs with different structures in the future. In addition, it will be necessary to assess the insulation performance of VIPs in actual applications.

Author Contributions

Writing—original draft preparation, C.H.; writing—review and editing, A.K.; visualization, C.Y.; supervision, Y.Z.; project administration, Z.C.; funding acquisition, L.Y. All authors have read and agreed to the published version of the manuscript.

Funding

This research was funded by the National Natural Sciences Foundation of China (grant numbers: U2167214 and 52471380).

Data Availability Statement

The datasets supporting the conclusions of this article are included within the article and the sequencing data correspond with the Figures. After the paper is published, the corresponding author will provide informed consent as reasonably requested by the academic community.

Conflicts of Interest

The authors declare that they have no known competing financial interests or personal relationships that could have appeared to influence the work reported in this paper.

Abbreviations

The following abbreviations are used in this manuscript.
GPHMGuarded hot plate method
TIPTraditional insulation panel
VIPVacuum insulation panel

References

  1. Tahir, F.; Al-Ghamdi, S.G. Climatic change impacts on the energy requirements for the built environment sector. Energy Rep. 2023, 9, 670–676. [Google Scholar] [CrossRef]
  2. Pei, Y.; Shen, Z.; Zhou, J.; Yang, B. Experimental and theoretical thermal performance analysis of additively manufactured polymer vacuum insulation panels. Appl. Therm. Eng. 2024, 256, 123957. [Google Scholar] [CrossRef]
  3. Kaushik, D.; Singh, H.; Tassou, S.A. Vacuum insulation panels for high-temperature applications—Design principles, challenges and pathways. Therm. Sci. Eng. Prog. 2024, 48, 102415. [Google Scholar] [CrossRef]
  4. Li, X. Farmland rental market participation and residential energy consumption: Evidence from rural areas in China. Energy 2023, 268, 126672. [Google Scholar] [CrossRef]
  5. Pascual, A.M.; Romero, M.L.; Serra, E.; Guerrero, J.C.; Perez, R. Sustainable insulation panel for buildings made of rice husks and posidonia. Constr. Build. Mater. 2024, 445, 137983. [Google Scholar] [CrossRef]
  6. Božiček, D.; Peterková, J.; Zach, J.; Košir, M. Vacuum insulation panels: An overview of research literature with an emphasis on environmental and economic studies for building applications. Renew. Sustain. Energy Rev. 2024, 189, 113849. [Google Scholar] [CrossRef]
  7. Wang, J.; Ma, X.; Sun, Y.; Xie, J. Thermal performance and sustainability assessment of refrigerated container with vacuum insulation panel envelope layer at different design forms. Therm. Sci. Eng. Prog. 2023, 42, 101928. [Google Scholar] [CrossRef]
  8. Katsura, T.; Nagano, K. Double envelope vacuum insulation panel to contribute to the long-term thermal insulation performance. Vacuum 2024, 229, 113599. [Google Scholar] [CrossRef]
  9. Baetens, R.; Jelle, B.P.; Thue, J.V.; Tenpierik, M.J.; Grynning, S.; Uvsløkk, S.; Gustavsen, A. Vacuum insulation panels for building applications: A review and beyond. Energy Build. 2010, 42, 147–172. [Google Scholar] [CrossRef]
  10. Yuk, H.; Choi, J.Y.; Kim, Y.U.; Chang, S.J.; Kim, S. Historic building energy conservation with wooden attic using vacuum insulation panel retrofit technology. Build. Environ. 2023, 230, 110004. [Google Scholar] [CrossRef]
  11. Katsura, T.; Miyata, T.; Memon, S.; Radwan, A.; Nagano, K. Experimental analysis of vacuum pressure and gas flow rate in structured-core transparent vacuum insulation panels. Energy Rep. 2023, 9, 1071–1078. [Google Scholar] [CrossRef]
  12. Kalnæs, S.E.; Jelle, B.P. Vacuum insulation panel products: A state-of-the-art review and future research pathways. Appl. Energy 2014, 116, 355–375. [Google Scholar] [CrossRef]
  13. Alam, M.; Singh, H.; Limbachiya, M.C. Vacuum Insulation Panels (VIPs) for building construction industry—A review of the contemporary developments and future directions. Appl. Energy 2011, 88, 3592–3602. [Google Scholar] [CrossRef]
  14. Sun, Q.; Xu, J.; Lu, C.; Zhu, S.; Lin, G.; Fan, M.; Li, J.; Chen, K. Green and sustainable kapok fibre as novel core materials for vacuum insulations panels. Appl. Energy 2023, 347, 121394. [Google Scholar] [CrossRef]
  15. Gonçalves, M.; Simões, N.; Serra, C.; Flores-Colen, I.; Rottenbacher, K.; Almeida, F.A. Study of the edge thermal bridging effect in vacuum insulation panels: Steady and unsteady-state approaches using numerical and experimental methods. Energy Build. 2022, 258, 111821. [Google Scholar] [CrossRef]
  16. Sprengard, C.; Holm, A.H. Numerical examination of thermal bridging effects at the edges of vacuum-insulation-panels (VIP) in various constructions. Energy Build. 2014, 85, 638–643. [Google Scholar] [CrossRef]
  17. Mao, S.; Kan, A.; Wang, N. Numerical analysis and experimental investigation on thermal bridge effect of vacuum insulation panel. Appl. Therm. Eng. 2020, 169, 114980. [Google Scholar] [CrossRef]
  18. Lorenzati, A.; Fantucci, S.; Capozzoli, A.; Perino, M. Experimental and numerical investigation of thermal bridging effects of jointed Vacuum Insulation Panels. Energy Build. 2016, 111, 164–175. [Google Scholar] [CrossRef]
  19. Lakatos, Á.; Kovács, Z. Comparison of thermal insulation performance of vacuum insulation panels with EPS protection layers measured with different methods. Energy Build. 2021, 236, 110771. [Google Scholar] [CrossRef]
  20. Liang, W.; Di, X.; Zheng, S.; Wu, L.; Zhang, J. A study on thermal bridge effect of vacuum insulation panels (VIPs). J. Build. Eng. 2023, 71, 106492. [Google Scholar] [CrossRef]
  21. Tenpierik, M.; Cauberg, H. Analytical Models for Calculating Thermal Bridge Effects Caused by Thin High Barrier Envelopes around Vacuum Insulation Panels. J. Build. Phys. 2007, 30, 185–215. [Google Scholar] [CrossRef]
  22. Test Method for Steady-State Thermal Transmission Properties by Means of the Thin-Heater Apparatus. ASTM International: West Conshohocken, PA, USA, 2006. [CrossRef]
  23. BS EN ISO 10077; Thermal Performance Of Windows, Doors And Shutters—Calculation Of Thermal Transmittance—Part 2: Numerical Method For Frames. BSI: London, UK, 2003. [CrossRef]
  24. GB/T 39704-2020; Determination of Effective Thermal Conductivity for Vacuum Insulation Panels (VIP). National Standards of the People’s Republic of China: Beijing, China, 2020. (In Chinese)
  25. Yang, I.; Kim, D. Uncertainty of thermal conductivity measurement at high temperatures using guarded hot plate apparatus. Int. J. Heat Mass Transf. 2022, 198, 123434. [Google Scholar] [CrossRef]
  26. Yan, X.; Kan, A.; Chen, Z.; Hei, Y.; Chen, H.; Wu, W. A promising approach of caved vacuum insulation panel and investigation on its thermal bridge effect. Int. Commun. Heat Mass Transf. 2023, 148, 107086. [Google Scholar] [CrossRef]
  27. Planes, E.; Marouani, S.; Flandin, L. Optimizing the heat sealing parameters of multilayers polymeric films. J. Mater. Sci. 2011, 46, 5948–5958. [Google Scholar] [CrossRef]
  28. Yeo, I.; Jung, H.; Song, T.-H. Gas permeation characteristics through heat-sealed flanges of vacuum insulation panels. Vacuum 2014, 104, 70–76. [Google Scholar] [CrossRef]
  29. Li, C.-D.; Duan, Z.-C.; Chen, Q.; Chen, Z.-F.; Boafo, F.E.; Wu, W.-P.; Zhou, J.-M. The effect of drying condition of glassfibre core material on the thermal conductivity of vacuum insulation panel. Mater. Des. 2013, 50, 1030–1037. [Google Scholar] [CrossRef]
  30. Lorenzati, A.; Fantucci, S.; Capozzoli, A.; Perino, M. VIPs Thermal Conductivity Measurement: Test Methods, Limits and Uncertainty. Energy Procedia 2015, 78, 418–423. [Google Scholar] [CrossRef]
  31. Kim, J.H.; Simon, T.W.; Viskanta, R. Journal of Heat Transfer Policy on Reporting Uncertainties in Experimental Measurements and Results. J. Heat Transf. 1993, 115, 5–6. [Google Scholar] [CrossRef]
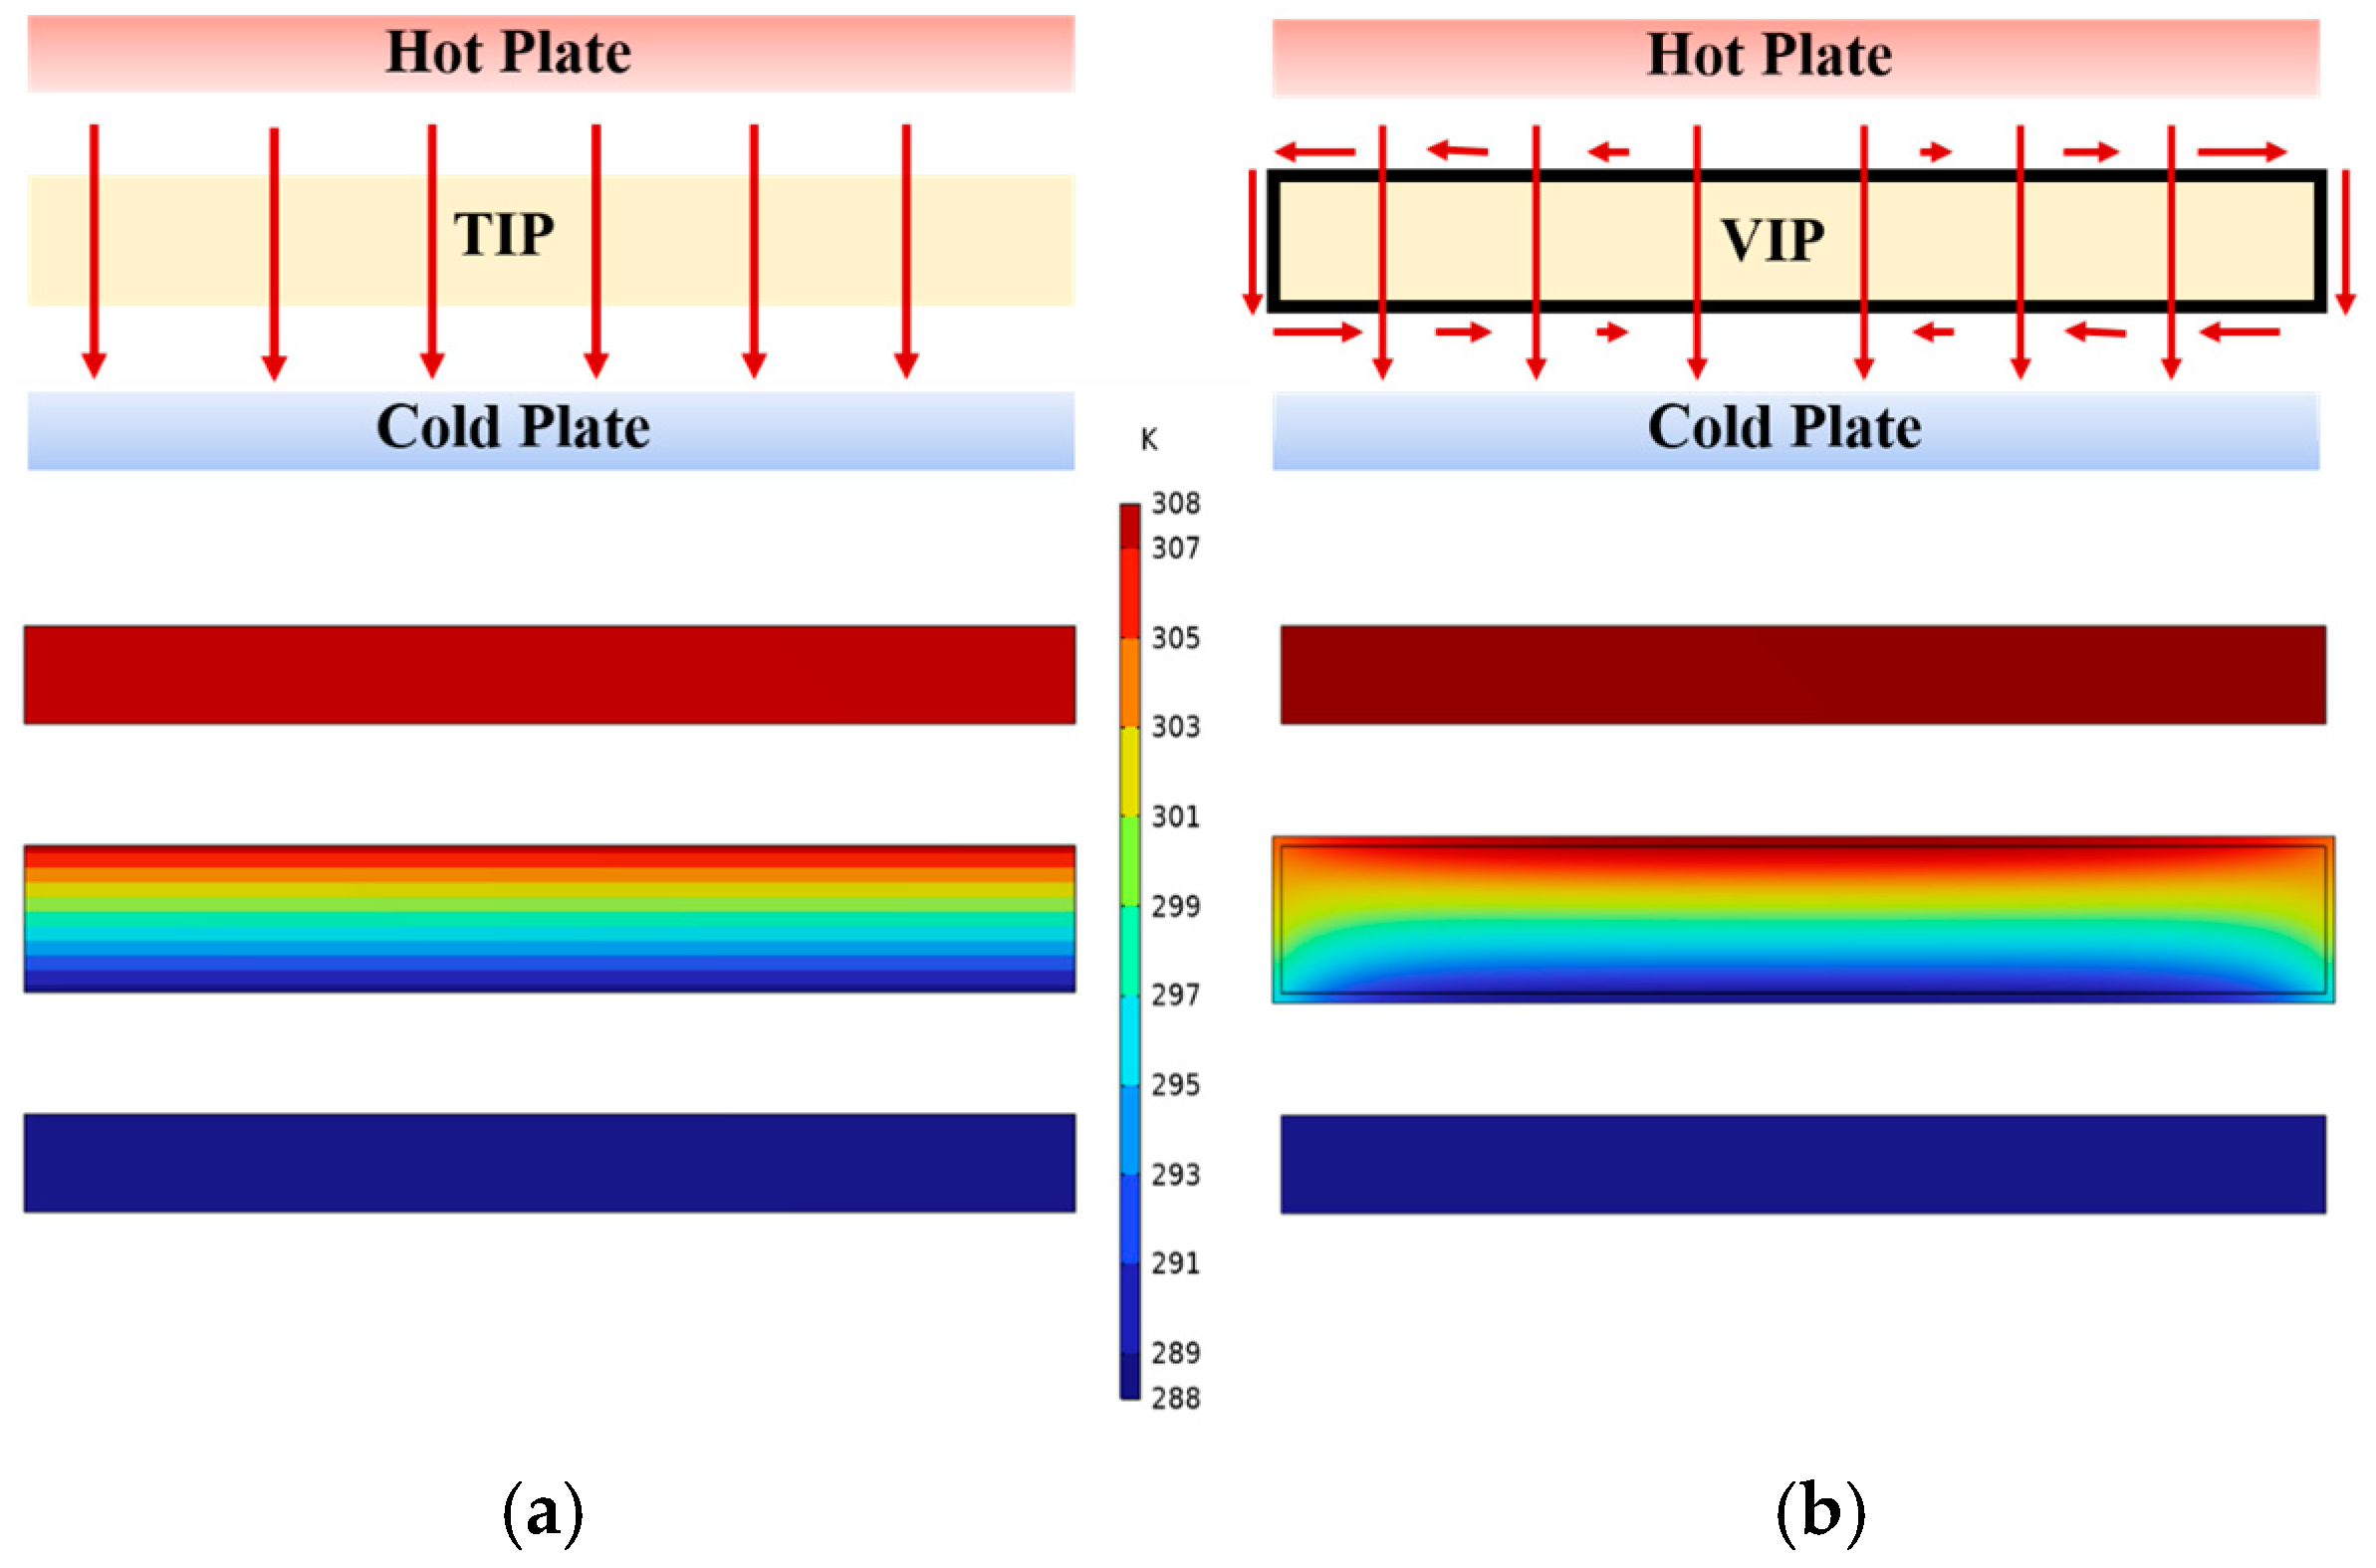
Figure 1. Heat transfer, shown in cross-section: (a) TIP; (b) VIP.
Energies 18 00467 g001
Figure 2. Schematic calculation of the cavity structure.
Energies 18 00467 g002
Figure 3. Model of a VIP with a cavity.
Energies 18 00467 g003
Figure 4. Influence of the number of cavity sides on the thermal bridge effect.
Energies 18 00467 g004
Figure 5. Influence of the tangent circle radius of the cavity on the thermal bridge effect.
Energies 18 00467 g005
Figure 6. Experimental apparatus: (a) guarded hot plate apparatus; (b) vacuum-packing machine; (c) heat-sealing device.
Energies 18 00467 g006
Figure 7. Schematic diagram of the guarded hot plate apparatus.
Energies 18 00467 g007
Figure 8. A specimen from group I.
Energies 18 00467 g008
Figure 9. Experimental and calculated values of the effective heat transfer coefficient; r = 30 mm.
Energies 18 00467 g009
Figure 10. Experimental and calculated values of the effective heat transfer coefficient; n = 4.
Energies 18 00467 g010
Figure 12. The maximum and minimum temperatures of the hot surface: (a) r = 30 mm; (b) n = 4.
Energies 18 00467 g012
Figure 13. The grid models and the isothermograms of the hot surface of the VIP, where n = 4: (a) r = 30 mm; (b) r = 45 mm; (c) r = 60 mm; (d) r = 75 mm.
Energies 18 00467 g013
Table 1. Boundary conditions of a VIP with a cavity.
ParameterTypeUnitValueResource
TiTemperature of the
cold plate
K288[22]
TeTemperature of the
Hot plate
K308[22]
hiHeat transfer coefficient of cold surfaceW/(m2·K)25[23]
heHeat transfer coefficient of hot surfaceW/(m2·K)7.8[23]
lpLength of the VIPm0.3Experimental measurement
wpWidth of the VIPm0.3Experimental measurement
δpThickness of the VIPm0.03Experimental measurement
λpHeat transfer conductivity of the barrier filmW/(m·K)0.39[24]
δbThickness of the
barrier film
m8.5 × 10−5[24]
UcopHeat transfer coefficient of the center area of the VIPW/(m2·K)0.002Experimental
measurement
Table 2. Parameters of the specimens.
Experimental GroupIIIIIIIVVVIVIIVIIIIX
n345678444
r (mm)303030303030456075
Table 3. Measurement uncertainties.
ComponentsTypeError
ThermocoupleDS18B20±0.18–±0.27 K
Thickness sensorSL-2000±1.2%
Measure powerShunt resistor1.00–1.47%
Vernier caliperMNT-150±0.02 mm
Table 5. Parameter of the grid, where n = 4.
Size of the Cavityr = 30 mmr = 45 mmr = 60 mmr = 75 mm
Number of domain units195,579184,912171,280151,987
Number of surface units14,21614,19613,58012,744
Number of edge units520560600640
Number of
freedom degrees
for the solution
275,123260,884242,138215,331
Number of internal freedom degrees included29,48029,52028,36826,776
Disclaimer/Publisher’s Note: The statements, opinions and data contained in all publications are solely those of the individual author(s) and contributor(s) and not of MDPI and/or the editor(s). MDPI and/or the editor(s) disclaim responsibility for any injury to people or property resulting from any ideas, methods, instructions or products referred to in the content.