Article

Assessing the Impact of Organic Loading Rate on Hydrogen Consumption Rates during In Situ Biomethanation

by
Ali Dabestani-Rahmatabad
,
Gabriel Capson-Tojo
,
Eric Trably
,
Jean-Philippe Delgenès
and
Renaud Escudié
*
Institut National de Recherche pour l’Agriculture, l’Alimentation et l’Environnement (INRAE), University of Montpellier, LBE, 102 Avenue des Etangs, 11100 Narbonne, France
*
Author to whom correspondence should be addressed.
Energies 2024, 17(11), 2490; https://doi.org/10.3390/en17112490
Submission received: 3 May 2024 / Revised: 17 May 2024 / Accepted: 20 May 2024 / Published: 22 May 2024
(This article belongs to the Collection Current State and New Trends in Green Hydrogen Energy)

Abstract

:
Biogas upgrading via biomethanation has been extensively studied recently, but the influence of organic loading rate on process performance remains to be fully understood. This is particularly significant because both organic loading rate and hydrogen injection can lead to volatile fatty acid accumulation during anaerobic digestion. This study investigated the impact of a wide range of organic loading rates (from 1.25 to 3.25 g VS/L/d) on hydrogen consumption rates, organic acid accumulation, and microbial communities during in situ biomethanation. It also provided kinetics data and metabolite production data for different control reactors, including anaerobic digestion, ex situ biomethanation, and endogenous control reactors. Hydrogen was injected into parallel batch reactors using digestate from a semi-continuous lab-scale reactor subjected to increasing organic loading rates (1.25–3.25 g VS/L/d) as an inoculum. The inoculum was well adapted to each tested organic loading rate. The batch experiments were replicated following a 12 h hydrogen starvation period to assess the stability of hydrogen consumption rates. High organic loading rate values resulted in increased hydrogen consumption rates, peaking at 68 mg COD/L/h at an organic loading rate of 3.25 g VS/L/d (maximum value tested), with no significant organic acid accumulation despite the high hydrogen partial pressures. The hydrogen consumption rates were maintained after the starvation period. Furthermore, the addition of an organic substrate did not impact the hydrogen consumption rate (i.e., the in situ and ex situ rates were similar). A higher organic loading rate resulted in higher relative abundances of hydrogenotrophic methanogens (i.e., Methanospirillum sp.). This study highlights that increasing the organic loading rate can accelerate the rate of hydrogen consumption during in situ biomethanation, consequently reducing both capital and operational costs.

1. Introduction

The use of traditional energy sources is causing apprehension because of a global increase in demand, along with issues of scarcity and harmful environmental effects [1]. As a result, numerous nations have established domestic goals for renewable energy, with the intention of lessening reliance on fossil fuels and nuclear power. In August 2015, France enacted the Energy Transition Law, aiming to achieve a 50% reduction in nuclear power electricity generation by 2025. Additionally, by 2030, the targets include a 40% decrease in greenhouse gas emissions, a 30% reduction in fossil fuel consumption, and a minimum 32% increase in renewable energy utilization. The plan also calls for renewable energy to contribute 40% of electricity production, 38% of final heat consumption, 15% of final fuel consumption, and 10% of gas consumption [2]. In addition, solid waste management is recognized as a significant environmental challenge in contemporary society [3].
Anaerobic digestion (AD) is a well-established, technically effective, economically feasible, and, consequently, extensively employed approach for handling solid waste [4]. AD represents a biological process for the valorization of solid wastes, wherein microorganisms effectively decompose organic matter, transforming it into biogas [5]. Biogas primarily consists of methane (CH4) and carbon dioxide (CO2), with typical ratios of 50–70% CH4 and 30–50% CO2 [6,7]. Before being introduced into natural gas grids, biogas must be converted into biomethane, with methane content of at least 95% [8].
Biomethanation, a form of biological biogas upgrading, stands out as a promising technology offering an alternative to the physical or chemical removal of CO2. This is attributed to its advantages of low investment and operational costs, high efficiency, and moderate operating conditions [9]. This bioprocess involves the transformation of CO2 into CH4 mainly through hydrogenotrophic methanogenesis (Reaction (1)), driven by methanogens utilizing H2 as an electron source [10].
CO2 + 4H2 → CH4 + 2H2O (ΔG0 = −130.75 kJ/mol)
Previous studies have demonstrated that the use of H2-assisted techniques for biogas upgrading offers significant adaptability within systems, whether they utilize in situ (H2 directly injected into the digesters) or ex situ (H2 reacting with biogas in a separate reactor) setups. Compared to ex situ systems, in situ biomethanation offers greater economic appeal due to its capacity to combine biogas production and upgrading within a single reactor, reducing capital costs. The digester is therefore fed organic waste and H2 simultaneously [11]. A schematic representation of in situ and ex situ biomethanation is depicted in Figure 1.
Despite the increasing number of studies dealing with in situ biomethanation, there are still gaps in the literature on the influence of crucial operational parameters, such as organic loading rate (OLR), on process performance and operation. OLR is a crucial parameter influencing the efficiency and stability of the AD process, and it corresponds to the amount of organic matter that is introduced into the digester per unit volume over a time period. It is a critical parameter used to characterize and control the feeding rate of organic substrates into the AD system. On the one hand, higher OLRs may result in adapted microbial communities, which, in turn, might lead to faster hydrogen consumption rates [11]. On the other hand, increasing the OLR may result in process failure or instability due to the accumulation of volatile fatty acids (VFAs), caused by the overload imposed by H2 on methanogenesis, which can be a limiting step, especially at high OLRs [13]. This effect might be exacerbated by high H2 partial pressures, which make VFA consumption reactions thermodynamically unfeasible [14].
Most research on H2-assisted biogas upgrading has been carried out in reactors processing solid waste, focusing on a restricted range of OLRs. Few studies have examined the impact of high OLRs on biomethanation performance. Agneessens et al. (2018) found an increased hydrogen consumption rate as the OLR escalated from 0.5 to 1.5 and from 1.5 to 2 g VS/L/d during in situ biomethanation (VS being volatile solids), treating sludge as a substrate in a continuous stirred-tank reactor (CSTR) [15]. Xu et al. (2020) also reported faster hydrogen consumption as the OLR increased from 1 to 5 g COD/L/d when treating synthetic wastewater as a substrate in an up-flow anaerobic sludge bed reactor (UASB) during in situ biomethanation [11] (COD being chemical oxygen demand). Furthermore, Okoro-Shekwaga et al. (2021) observed a hydrogen consumption rate of 0.49 mg COD/L/h when treating Food Waste (FW) in batch reactors during in situ biomethanation [16]. On the contrary, Poggio et al. (2023) found that lowering the OLR from 2 to 1 g VS/L/d resulted in higher biomethanation performance in terms of hydrogen consumption rate when treating FW and sewage sludge as substrates in CSTRs [17]. This lack of agreement calls for further research.
The AD of FW is already challenged by the high concentrations of intermediate metabolites (i.e., organic acids and H2) that can be found in the reactors, which can result in reactor instability and acidification [18,19,20]. Indeed, in situ biomethanation has faced criticism in the literature due to the accumulation of VFAs resulting from H2 injection [21]. Hence, it is crucially important to study the impact of OLR on the in situ biomethanation of highly biodegradable substrates such as FW. Agnessens et al. (2018) observed a rising trend in acetate concentration with increasing OLR during the in situ biomethanation of sludge. The maximum acetate concentration reached 1.5 mM at an OLR of 2.0 g VS/L/d [15]. Despite a higher OLR of 3 g VS/L/d, Xu et al. (2020) found lower acetate concentrations compared with Agneessens et al. (2018) [11].
The aim of this study is to enhance our understanding of biomethanation processes and their responses to changing OLRs. The OLR is a crucial parameter in anaerobic digestion processes, as it determines the flow of organic matter to be degraded and ultimately converted into biogas. In order to understand and optimize in situ biomethanation, the influence of this operational parameter on performance needs to be elucidated. In this study, a wide range of OLRs ranging from 1.25 to 3.25 g VS/L/d was investigated. One of the main novelties is the use of an inoculum adapted to the organic load, achieved through the implementation of a reactor dedicated to inoculum production. Biomethanation performance was monitored based on kinetic data (i.e., hydrogen consumption rates) and metabolite production, and the use of multiple types of control reactors, including ex situ, AD, and endogenous reactors, allowed for a comprehensive examination of biomethanation processes under different operational conditions. Furthermore, the response to starvation conditions of microbial communities adapted to different OLRs was assessed.

2. Materials and Methods

2.1. Inoculum and Substrate

The inoculum used in this study was obtained from an industrial AD plant treating FW in Clermont-Ferrand, France. Its initial characteristics were as follows: total solids (TS) of 1.2%, VS content of 1.0%, and a pH of 8.21. The substrate preparation followed the composition guidelines provided in Capson-Tojo et al. (2017b) [22], but was diluted with water at a 1:3 volumetric ratio (water to substrate) in order to reach TS and VS concentrations of 1.7% and 1.6%, respectively. The hydrogen used as a substrate for biomethanation was pure (99.999% H2; Linde, St. Priest, France).

2.2. Reactor Operation

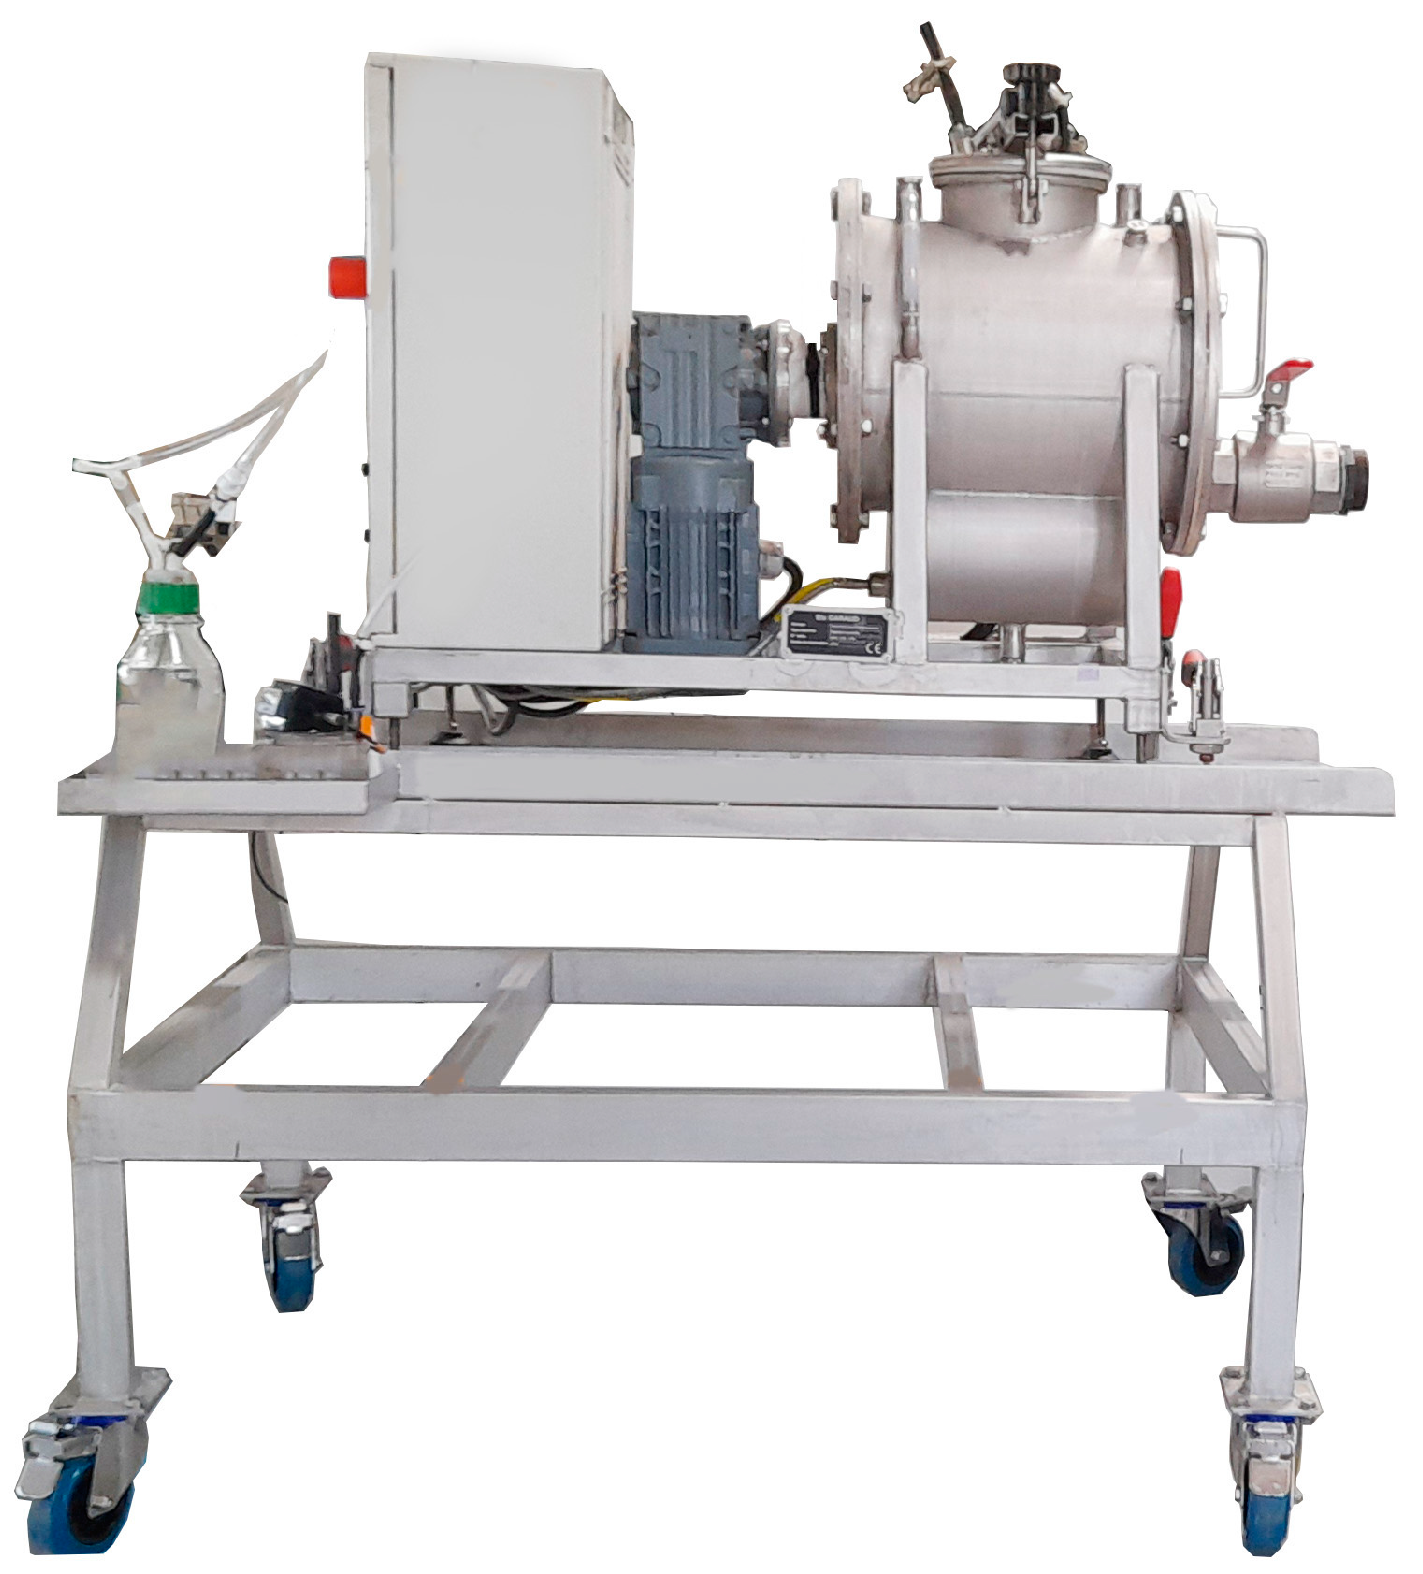
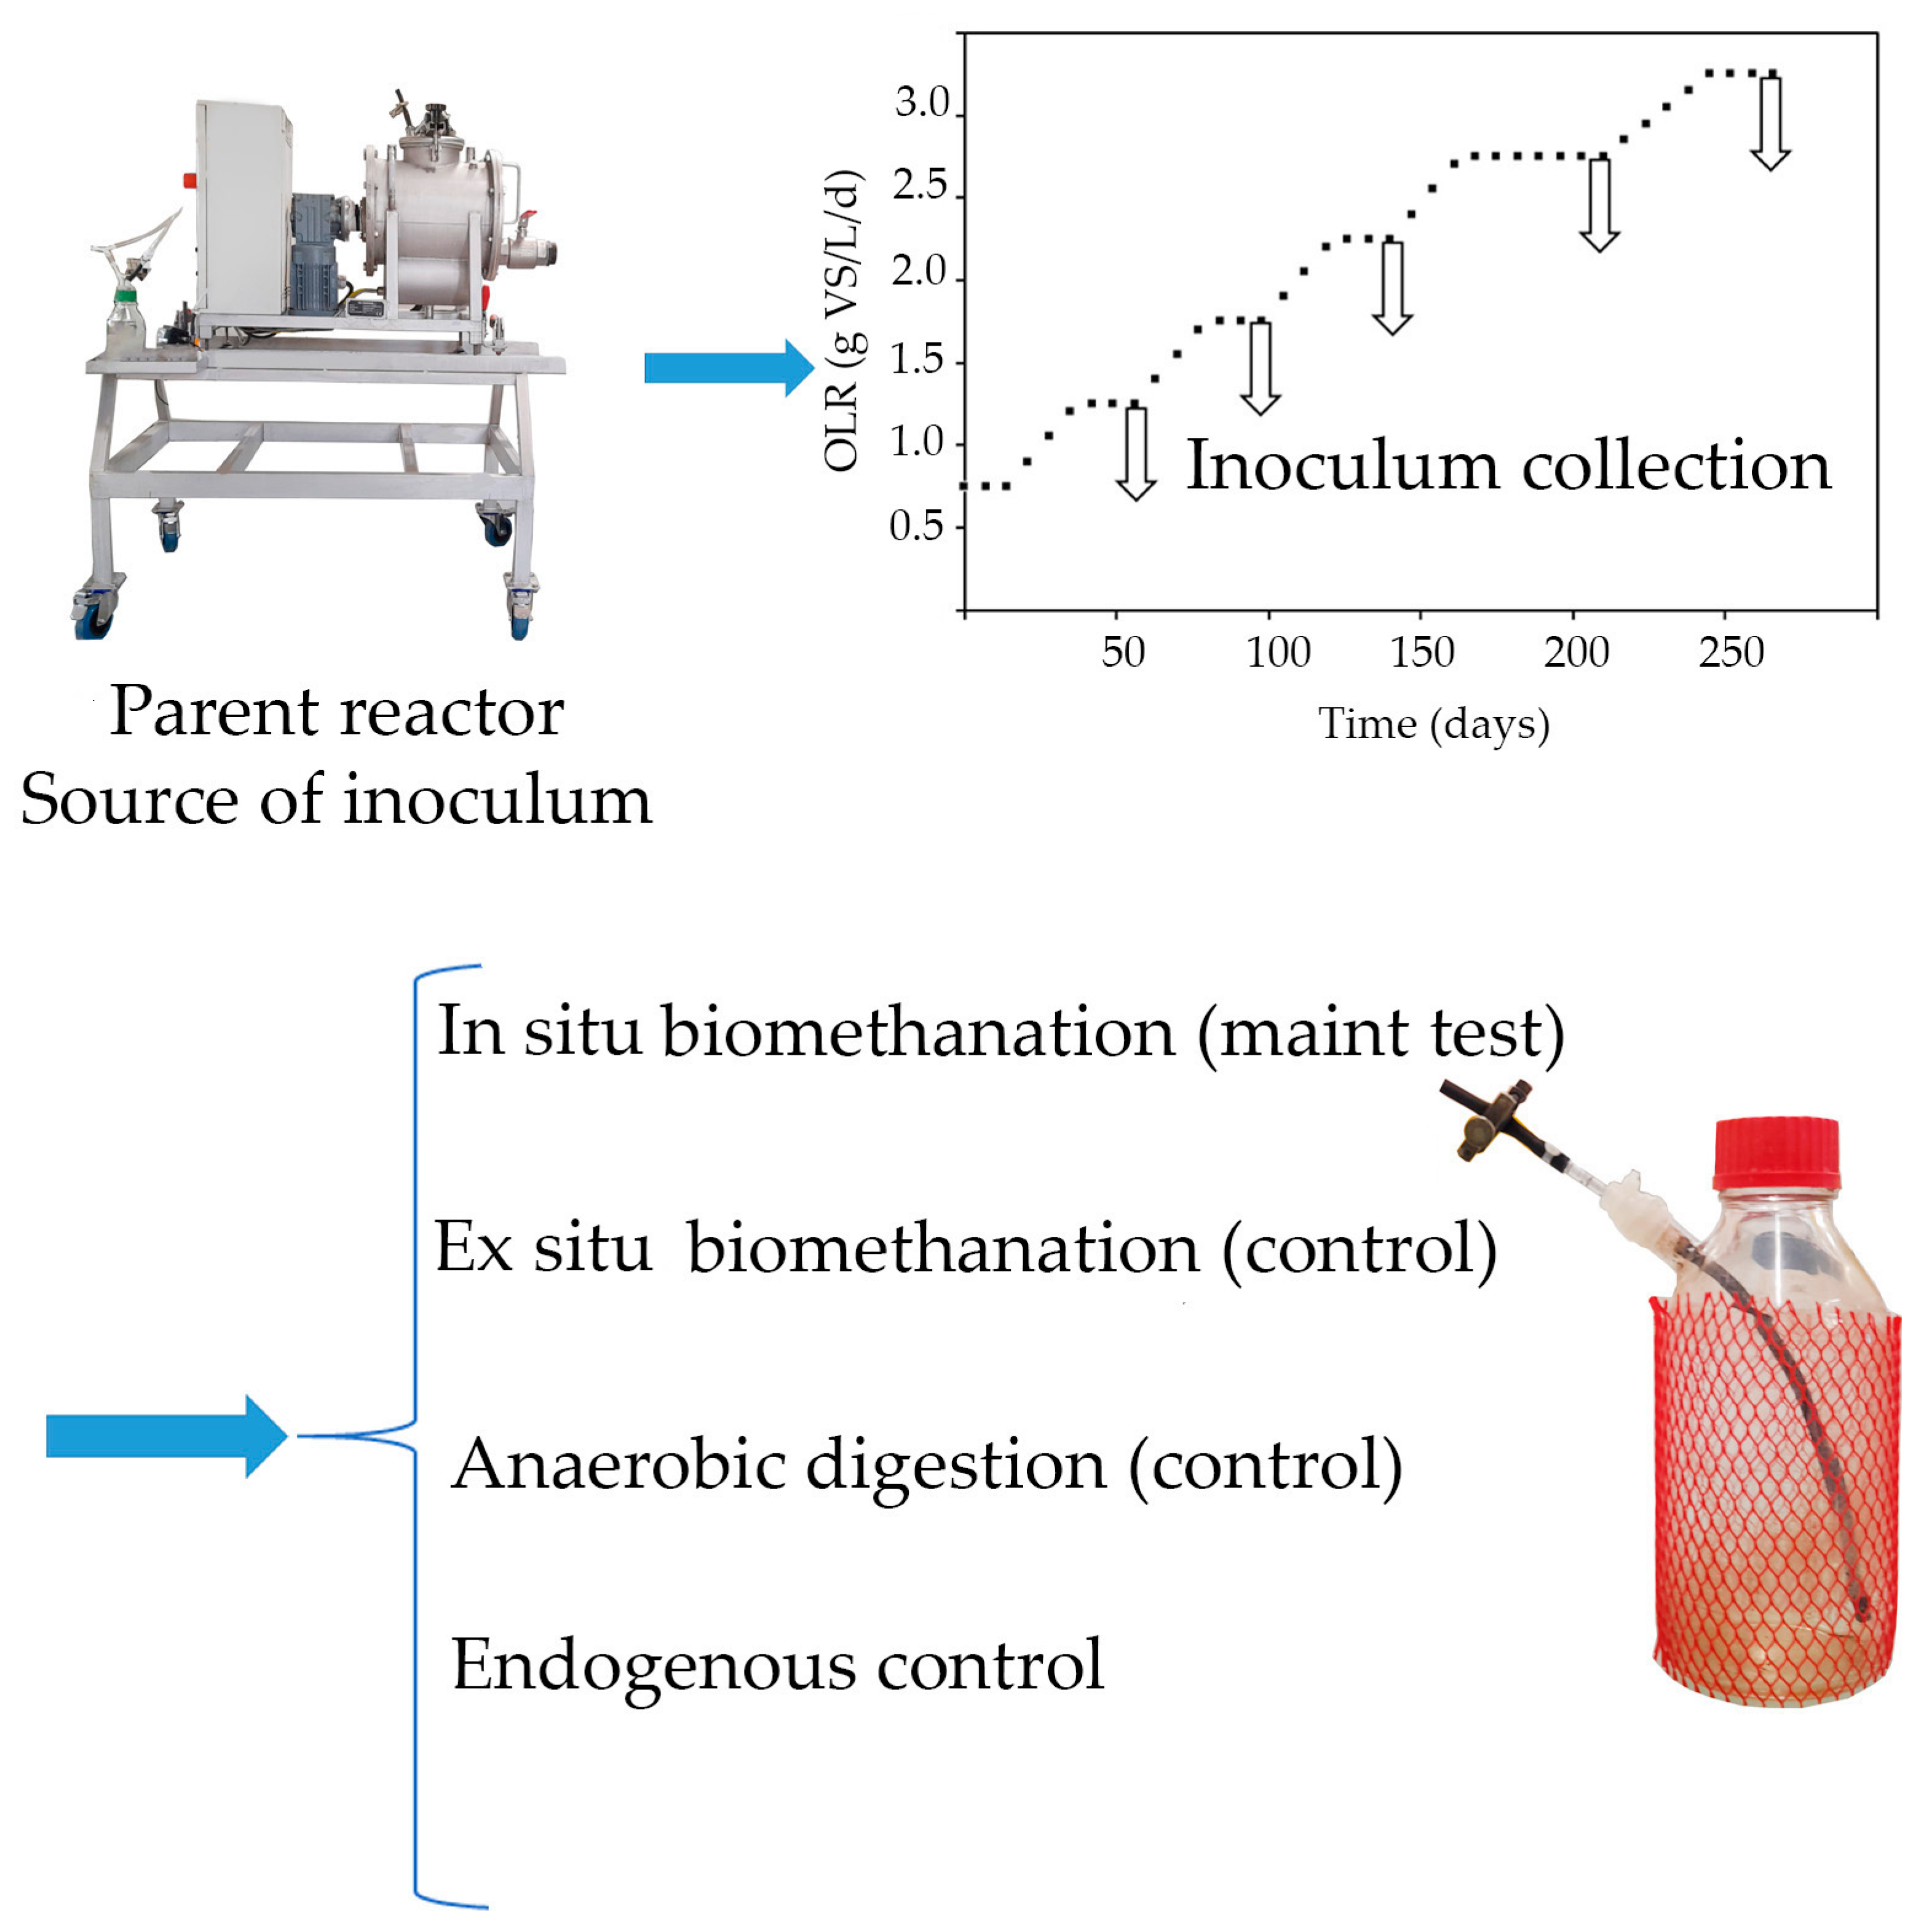
2.2.1. Semi-Continuous AD Reactor (“Parent” Reactor) for Inoculum Generation

A 15 L CSTR with a working volume of 10 L was employed as the source of inoculum for the biomethanation experiments. The reactor was constructed using stainless steel cylindrical vessels that incorporated internal stirring blades for mixing (Figure 2) [20]. The reactor was operated in mesophilic conditions (37 ± 1 °C). Reactor agitation was maintained at 45 rpm, and the HRT was set to 3 weeks. Feeding was performed manually once per day and five times a week. A daily addition of 2.5 mL of a trace element solution was carried out, according to Capson-Tojo et al. (2017a) [20], to prevent any deficiency of these compounds during the digestion of FW and avoid the potential accumulation of VFAs.
The reactor was fed based on the strategy outlined in Figure 3. During a startup phase of 7 weeks, the reactor was fed at an OLR of 0.75, increased up to 1.25 g VS/L/d. This was maintained until a consistent methane yield was achieved, without VFA accumulation and with stable biogas composition. After the start-up, the OLR was sequentially increased to 1.75, 2.25, 2.75, and 3.25 g VS/L/d. Each OLR increase was performed over a time span of three weeks, increasing one third of the load every week by increasing the substrate concentration (i.e., diluting less the FW), thus allowing us to keep the HRT constant. This “parent” reactor was operated for at least one HRT at each tested OLR, to reach a steady state. Stable operation was confirmed by consistent weekly methane yields, biogas compositions, ammonium and VFA concentrations, and pH values. The biogas flow rate and composition were measured daily, and the concentrations of VFAs and ammonium were monitored twice and once a week, respectively. Inoculum collection for biomethanation in Schott-flask reactors was conducted after feeding at each OLR for at least one HRT. A summary of the operating conditions is provided in Table 1.

2.2.2. Batch Biomethanation Reactors

After a stabilized period in the parent AD reactor at a given OLR, the digestate was collected and biomethanation batch tests (in Schott-flasks) were started using the digestate as an inoculum. At each OLR, four batch conditions were tested in triplicate: in situ biomethanation, ex situ biomethanation, AD, and endogenous control. This allowed us to investigate the impact of the OLR on each process. In situ biomethanation reactors were fed with FW at an OLR corresponding to the one to be tested, and pure hydrogen was added until the pressure in the headspace reached 1.2 bar. The AD reactors were fed only with FW at the corresponding OLR. Ex situ biomethanation reactors were fed with H2:CO2 (4:1 v:v) until the headspace pressure reached 1.25 bar to maintain the same hydrogen partial pressure as in the in situ biomethanation reactors. These pressures were primarily selected for security reasons. The endogenous control reactors received no substrate. The ex situ biomethanation and the AD reactors allowed us to investigate methane production in the absence of the organic substrate and hydrogen, respectively. The in situ biomethanation tests served to study the impact of OLR on hydrogen consumption kinetics and metabolite production during biomethanation (main objective here).
Each reactor had a total volume of 1 L and a working volume of 220–224 mL, comprising 200 mL of inoculum, 20 mL of phosphate buffer (pH 7.5, 0.5 M), and an organic and/or gaseous substrate (2.25–4.06 mL of FW). After inoculation and FW addition (if needed), all reactors were purged with N2 to achieve anaerobic conditions. Before injecting hydrogen into the in situ and ex situ biomethanation reactors, liquid samples were collected from the reactors to measure the concentrations of VFAs, and for 16S rRNA gene qPCR. The microbial community analysis was conducted on a single replicate of in situ biomethanation reactors, whereas the concentrations of VFAs were measured in triplicate for all reactors. After hydrogen injection into the in situ and ex situ biomethanation reactors, all reactors were placed in a mesophilic room (37 °C) for one hour for temperature and pressure equilibration. Gas samples were then collected from the reactor headspace and analyzed accordingly. Subsequently, reactors were placed on a shaking table, and gas composition was analyzed every hour during the first day to measure the rate of hydrogen consumption and the produced methane. After 4–5 h, liquid samples were collected again for VFA concentration measurement. The reactors underwent 12 h of hydrogen starvation until the next day, followed by a second substrate injection pulse in all reactors, and gas composition and VFA concentration were measured as described before. This second hydrogen injection after 12 h allowed us to assess the impact of hydrogen starvation on biomethanation performance. A schematic representation of the design of the experiment is depicted in Figure 3.

2.3. Analytical Methods

Gas composition and headspace pressure were measured four times daily (every 1 h). The pressure within the bottles was tracked with a manual pressure sensor LEO2 (Keller, Switzerland). Gas composition analysis, including H2, CO2, O2, N2, and CH4, was conducted using a GC Perkin Clarus 580 (Waltham, MA, USA) coupled to a thermal conductivity detector. The system was equipped with two columns: an RtUBond (30 m × 0.32 mm × 10 μm) and an RtMolsieve (30 m × 0.32 mm × 30 μm), both using Ar (flow rate at 31.8 mL/min) as the carrier gas at 350 kPa.
Liquid samples underwent centrifugation at 13,500 rpm for 15 min, and the resulting supernatant was filtered through at 0.45 μm. The filtered supernatant was then utilized for measuring VFA concentrations, determined using Gas Chromatography coupled to a Flame Ionization Detector (GC-FID). A Perkin Elmer Clarus 580 GC was equipped with an Alltech-FFAP EC™1000 column connected to an FID operating at 280 °C. N2 served as the carrier gas with a flow rate of 6 mL/min. Data were automatically recorded in a designated internal database. The pH was measured using a FiveGo F2 pH meter (Mettler Toledo, Greifensee, Switzerland). Standard methods were employed to determine concentrations of TS and VS [23]. Concentrations of dissolved N-NH4+ were assessed by filtering the samples through a filter with a 0.22 μm pore size and employing a Gallery Plus sequential analyzer (Thermo Fisher, Courtaboeuf Cedex, France). The BMP test of the FW used as a substrate was performed according to Motte et al. (2014) [24]. All experiments and related analyses were performed using the Bio2E platform [25].

2.4. Microbial Community Analysis

Two milliliters of liquid sample were collected from the semi-continuous reactor at the end of each HRT (the moment when the inoculum for each batch test was collected). Subsequently, the sample was centrifuged at 13,500 rpm for 15 min. The resulting retentate underwent 16S rRNA gene sequencing and qPCR.
The sample pellet obtained after centrifugation was used for microbiological analysis. DNA extraction was performed by means of the FastDNA SPIN kit for soil following the manufacturer’s instructions (MP Biomedicals, LCC, Santa Anta, CA, USA). The DNA amount and purity in the extracts was confirmed by spectrophotometry (Infinite NanoQuant M200, Tecan, Untersbergstraße 1a, 5082 Grödig, Austria). The extracted DNA was then stored at −20 °C.
DNA extraction was carried out using the FastDNA™ SPIN kit for soil following the manufacturer’s instructions (MP Biomedicals, LCC, CA, USA). Microorganism identification was conducted via amplification of the V3–V4 region of the 16S rRNA gene, following established methods [26]. The following primers to amplify the V4–V5 region of the 16S rRNA gene were designed, specifically targeting Archaea: 5′-CAGCMGCCGCGGKAA-3′ (F504–F519 Eurogentec, Rue Bois Saint-Jean 5, Rue du Bois Saint-Jean 14, 4102, Belgium) and 5′-CCCGCCWATTCCTTTAAGT-3′ (R910–R928 Eurogentec, Rue Bois Saint-Jean 5, Rue du Bois Saint-Jean 14, 4102, Belgium). The primer sets for Illumina Miseq sequencing were pre-equipped with adapters and barcodes. The PCR mix consisted of iProof™ High-Fidelity DNA Polymerase (Bio-Rad laboratories, Inc. 1000 Alfred Nobel Dr, Hercules, CA 94547, USA) (0.02 u/μL) along with its enzyme buffer, forward and reverse primers (0.5 mM each), dNTP (0.2 mM), sample DNA (0.04 to 0.2 ng/μL), and water, resulting in a final volume of 60 μL. The PCR amplification program comprised 30 cycles, including denaturation (98 °C, 1 min), annealing (maintained at 59 °C, 1 min), and elongation (72 °C, 1 min). Following the 30 cycles, a final extension step was conducted for 10 min at 72 °C. PCR reactions were performed using a Mastercycler® thermal cycler (Eppendorf, Hamburg, Germany). Illumina Miseq sequencing was performed using the GenoToul platform in Toulouse, France (https://www.genotoul.fr access 09/2023). Read cleaning, assembly, and quality checking were executed using Mothur version 1.48.0. Alignment and taxonomic classification was performed using SILVA release 132 [27]. Sequences were grouped into operational taxonomic units (OTUs) with 97% similarity. Sequences were submitted to the BioProject database (https://www.ncbi.nlm.nih.gov/bioproject/1054353 created 12/2023) with the ID number PRJNA1054353.
qPCR was utilized to estimate the concentrations of 16S rRNA genes, as a proxy for the concentrations of microorganisms. The qPCR assays were conducted using a BioRad CFX96 Real-Time Systems C1000 Touch Thermal Cycler (Bio-Rad Laboratories, 1000 Alfred Nobel Dr, Hercules, CA 94547, USA). For total bacteria and total archaea qPCR analysis, primers 330F (ACGGTCCAGACTCCTACGGG) and 500R (TTACCGCGGCTGCTGGCAC), and primers 787F and 1059R and probe 915F (FAM-AGGAA TTGGC GGGGG AGCAC-Tamra) were used, respectively [28]. For the bacteria qPCR mix composed of 330F primer (200 nM), 500R primer (200 nM), and SsoAdvanced™ Universal SYBR Green Supermix (Bio-rad Laboratories, 1000 Alfred Nobel Dr, Hercules, CA 94547, USA), 2 μL of DNA and water were used until the volume reached 12.5 μL. qPCR was performed using the following cycle: 40 cycles of dissociation (95 °C, 10 s) and elongation steps (61 °C, 20 s). The following solution was used for the archaea qPCR reactions: SsoAdvanced™ Universal Probes Supermix (Bio-Rad Laboratories, USA), 787F primer and 1059R primer (200 nM), TaqMan probe (50 nM), and 5 μL of DNA and water with final volume of 25 μL. The qPCR cycle consisted of 40 cycles of denaturation (95 °C, 15 s) and elongation (60 °C, 1 min). qPCR results are available in Supplementary Materials.

2.5. Calculations

The overall H2 consumption rates were calculated from the total number of moles of H2 (estimated using the ideal gas law), expressed as COD. These data were used to perform a linear regression of the consumed CODH2 vs. time, which provided the overall hydrogen consumption rates (mg COD/L/h) during the measured period. The quantity of methane produced was calculated by applying the ideal gas law, and presented as COD. VFA concentrations were transformed into their respective COD equivalents (with COD equivalents of acetic acid of 1.07 g COD/g acid, propionic acid of 1.51 g COD/g acid, butyric and iso-butyric acid of 1.82 g COD/g acid, and valeric acid of 2.04 g COD/g), and the outcomes were employed to perform COD mass balances [29].
The diversity indexes were calculated using the easy16S platform on the INRAE website (https://shiny.migale.inrae.fr/app/easy16S accessed 09/2023). Shannon, Ace, and InvSimpson indexes were used to evaluate the diversity and richness of the samples.

2.6. Statistical Analysis

To compare hydrogen consumption rates between different OLRs, in situ and ex situ biomethanation, and different H2 injections, single-factor ANOVA and Tukey–Kramer tests were performed using Microsoft Excel 2016. The significance level was defined at 95% (α = 0.05).

3. Results and Discussion

To evaluate the influence of OLR on biomethanation performance, it is crucial to use an inoculum adapted to the tested OLRs. To achieve this, a semi-continuous AD reactor, referred to as “parent” AD reactor, was operated with progressively increasing OLRs ranging from 1.25 to 3.25 g VS/L/d while maintaining at a constant hydraulic retention time (HRT) of 3 weeks. Following stabilization periods of one HRT at each OLR, an adapted inoculum was collected for subsequent biomethanation experiments conducted in batch reactors. Prior to these experiments, the OLR was increased over 4 weeks to the desired value. Subsequently, the OLR was maintained for one HRT before another round of inoculum sampling. These experiments aimed to assess the impact of OLR on H2 consumption rates, methane production rates, VFA accumulation, and microbial community structures.

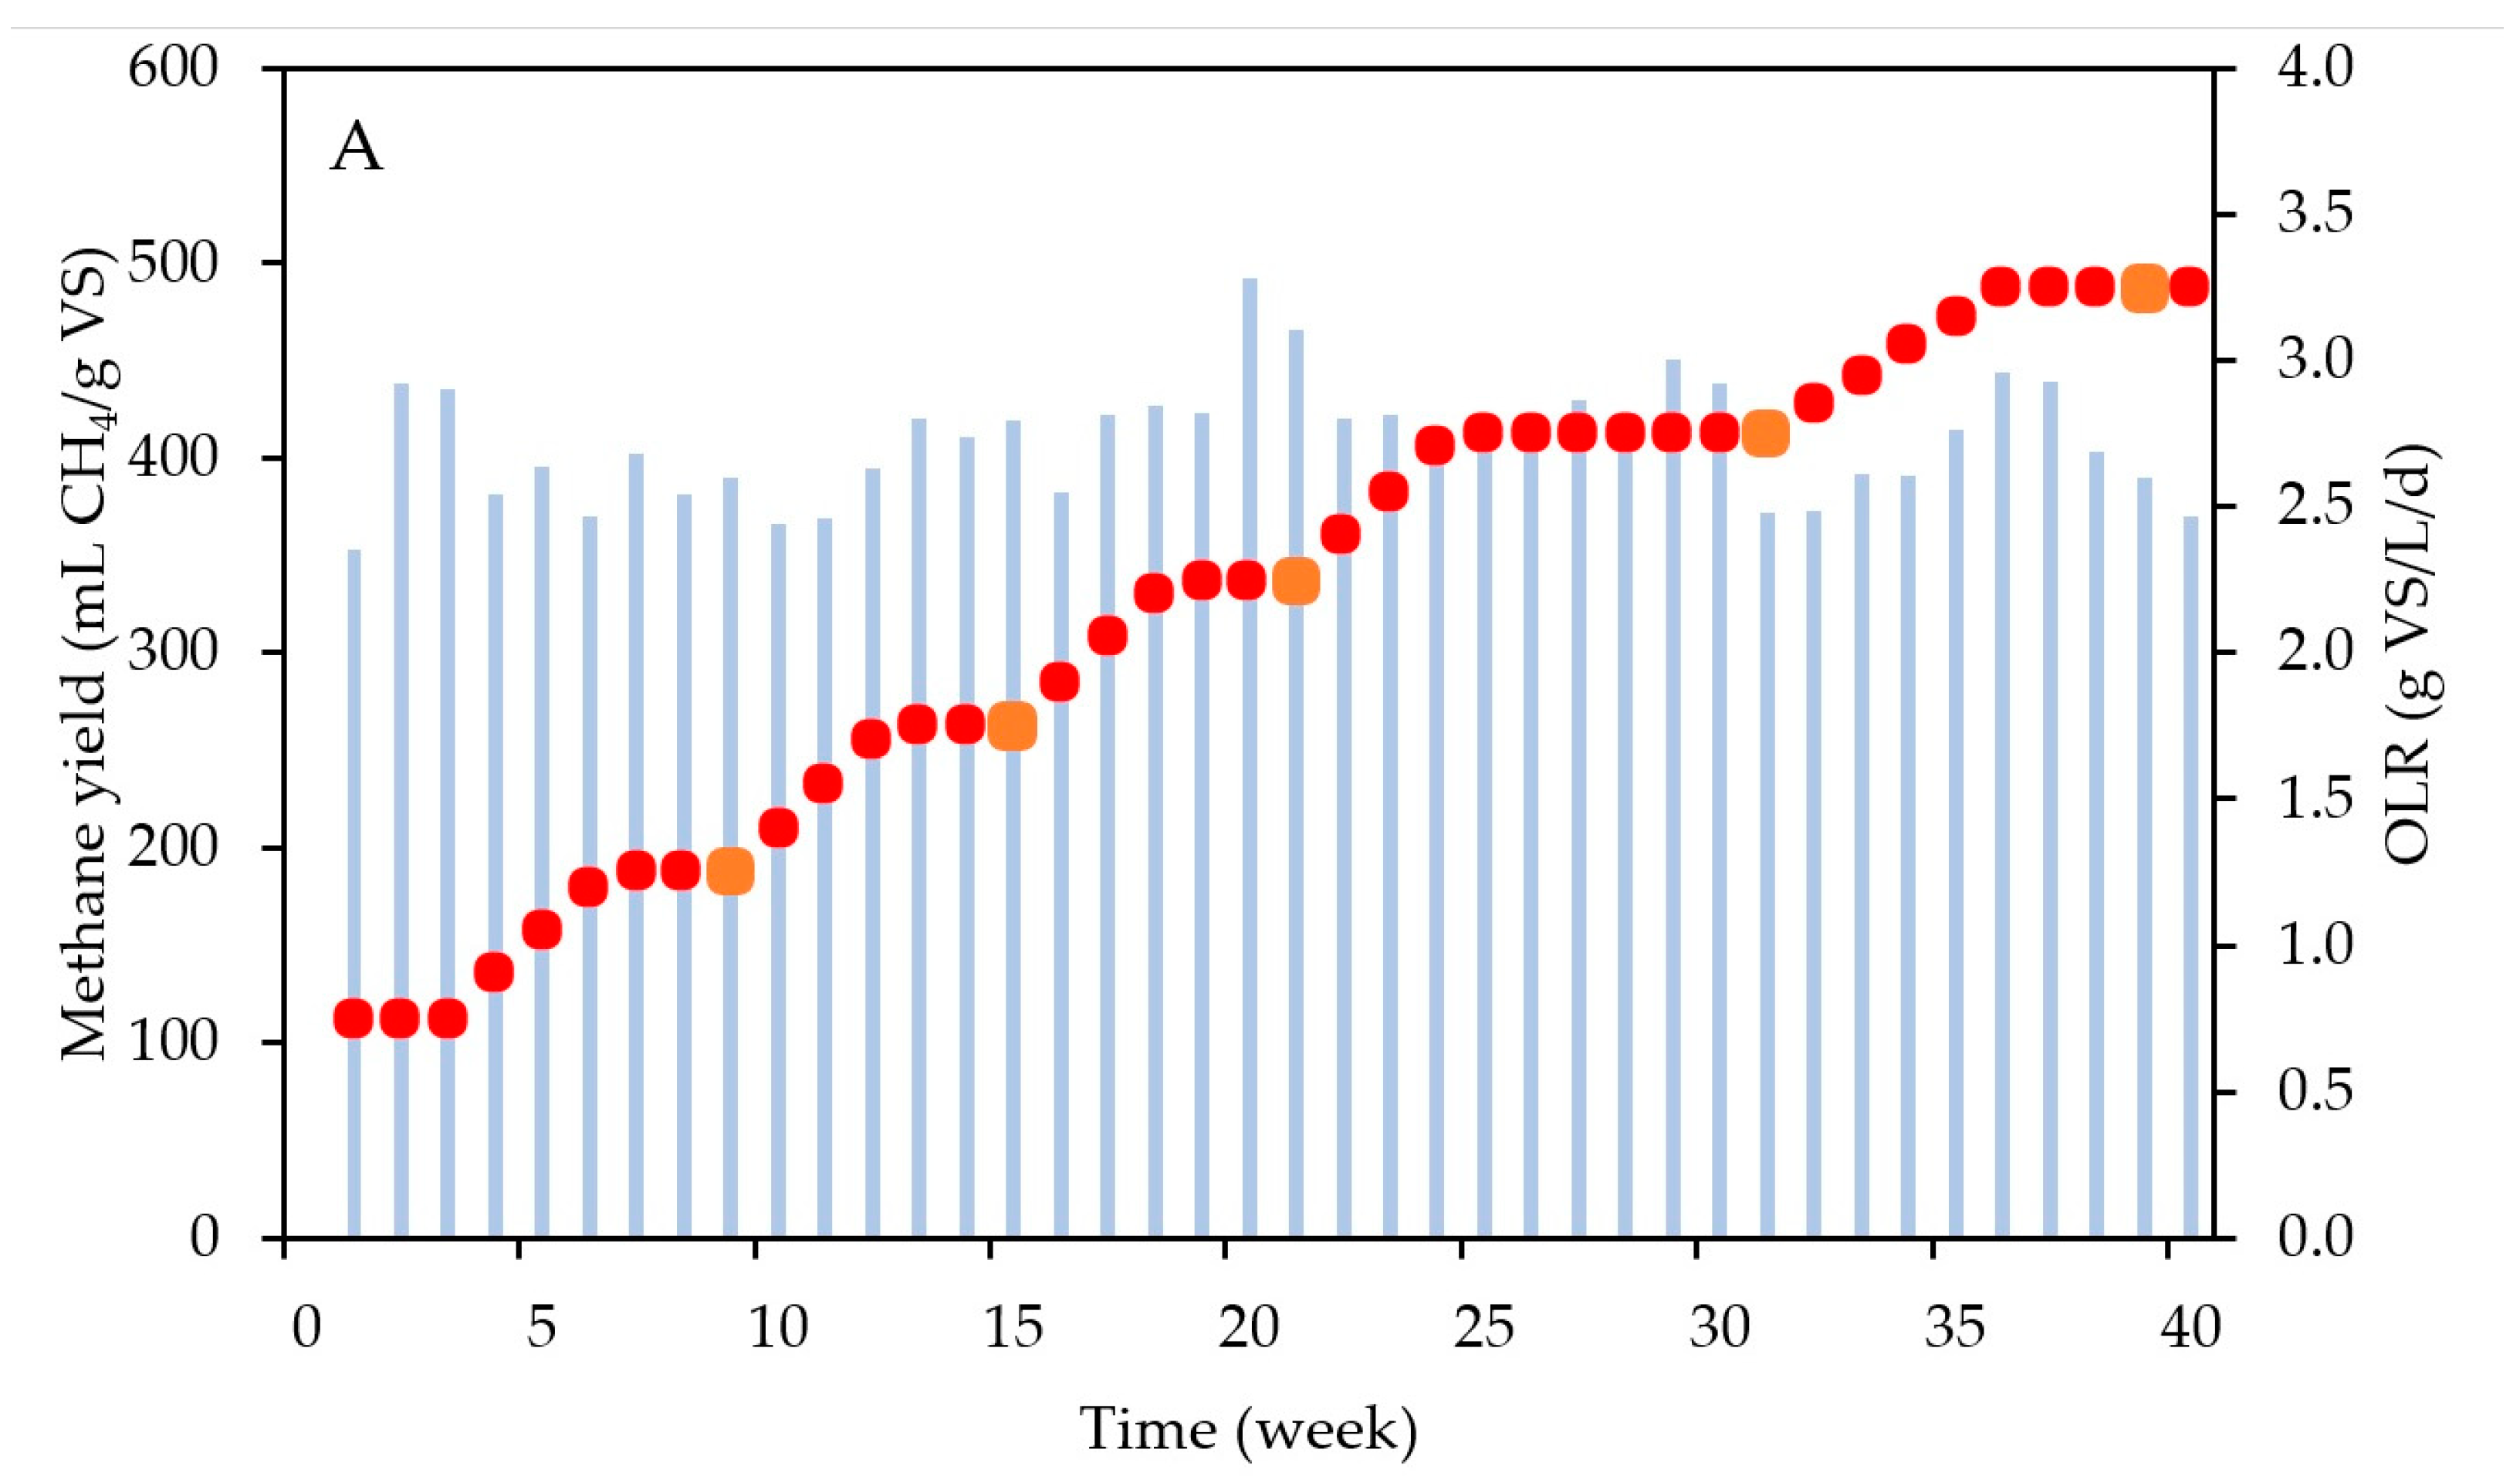
3.1. Performance of the Semi-Continuous “Parent” AD Reactor

Figure 4 shows the increasing OLR pattern applied in the AD reactor, as well as the resulting methane yields (weekly averages) and the VS concentrations in the “parent” reactor. The methane yield remained stable during the entire operational period, with an average value of 408 ± 30 mL CH4/g VS. This yield closely aligns with the biochemical methane potential (BMP) of the substrate, which was 404 mL ± 22 mL CH4/g VS, confirming that no residual degradable substrate remained in the digestate. Additionally, this yield is in agreement with the common range of values reported in the literature for FW AD, which ranges from 210 to 648 mL CH4/g VS [22]. Throughout the experiment, the pH consistently remained stable at 7.00 ± 0.13, falling within the optimal range for AD [30]. The ammonium concentration was maintained at 532 ± 97 mg N-NH4+/L after day 52, which marked the end of the startup phase, far from inhibitory values [31]. The VFA concentrations were kept at extremely low values (average of 0.09 ± 0.13 g COD/L) throughout the experiment. The high standard deviation in the VFA levels is a consequence of slightly higher levels of VFAs during the startup phase (first 7 weeks), reaching values up to 0.42 g COD/L. After stabilization, no significant VFA accumulation was observed (concentrations below 0.02 g COD/L after week 7). The biogas composition was also stable, at 61 ± 4% of CH4 and 39 ± 4% CO2, aligning with the observed range in the literature for the AD of FW [32]. These consistent results suggest that the reactor achieved good stability without encountering inhibition, regardless of the applied OLR. The stable operation of the reactor confirms that the microbial community was adapted to the substrate and the OLR, suggesting the effectiveness of the inoculum utilized for biomethanation. Additionally, the sustained operation of the reactor may be attributed to the addition of trace elements into the parent reactor. These trace elements act as cofactors in enzymatic reactions, facilitating the degradation of substrates and VFAs throughout the AD process [33]. Furthermore, the feeding strategy may have also contributed to maintaining the stability of the AD reactor during the OLR increase. As illustrated in Figure 4A, the OLR in the parent reactor gradually increased by 0.15 g VS/L/d each week. This gradual change avoids shocking the microbial community with a sudden increase in the OLR, enabling the surplus of organic matter supplied to be tuned to the degradation capacity of microorganisms, particularly methanogenic archaea. This finding aligns with results obtained by other researchers [34,35]. Another contributing factor could be related to the proper mixing and adequate retention time (21 days) for food waste AD. These two parameters have also been demonstrated to play crucial roles in ensuring the stable operation of AD reactors [36,37]. Furthermore, the stability of the reactor can be attributed to a balanced substrate composition, encompassing a diverse array of organic materials rich in carbon and nitrogen. This balanced blend ensures consistent microbial activity and enhances the efficiency of biogas production throughout the digestion process [38].
Figure 4B shows a consistent upward trend in the VS concentrations with increasing OLRs. With a constant HRT in the present experiments, the increase in OLR leads to higher substrate VS concentrations entering the digester. As the methane yields were constant, it can be hypothesized that the substrate was equally converted into biomass at any OLR value, implying that higher VS concentrations represent an increase in active biomass concentrations [39]. Given that FW is a highly biodegradable substrate (VS/TS of 94.2%, with TS being total solids), the increase of non-biodegradable organic matter was negligible. To validate this hypothesis, quantitative polymerase chain reaction (qPCR) was performed. However, the differences in biomass concentrations (log-based) at increasing OLRs were too small to allow us to observe significant differences (Figure S1).

3.2. Impact of the OLR on Biomethanation Performance

To investigate the influence of OLR on biomethanation performance, triplicate batch reactors were employed, utilizing the digestates recovered from “the parent” AD semi-continuous reactor as inocula (depicted by orange squares in Figure 4A). The primary working reactors, designated as in situ biomethanation reactors, received both FW and hydrogen as substrates. Additionally, three control reactors were employed: an AD test to evaluate the impact of the addition solely FW on metabolite production, an ex situ biomethanation test to assess the influence of FW’s absence on the hydrogen consumption rate and metabolite production, and an endogenous control reactor devoid of both FW and hydrogen. This allowed us to separately evaluate the impact of each substrate on the performance metrics.

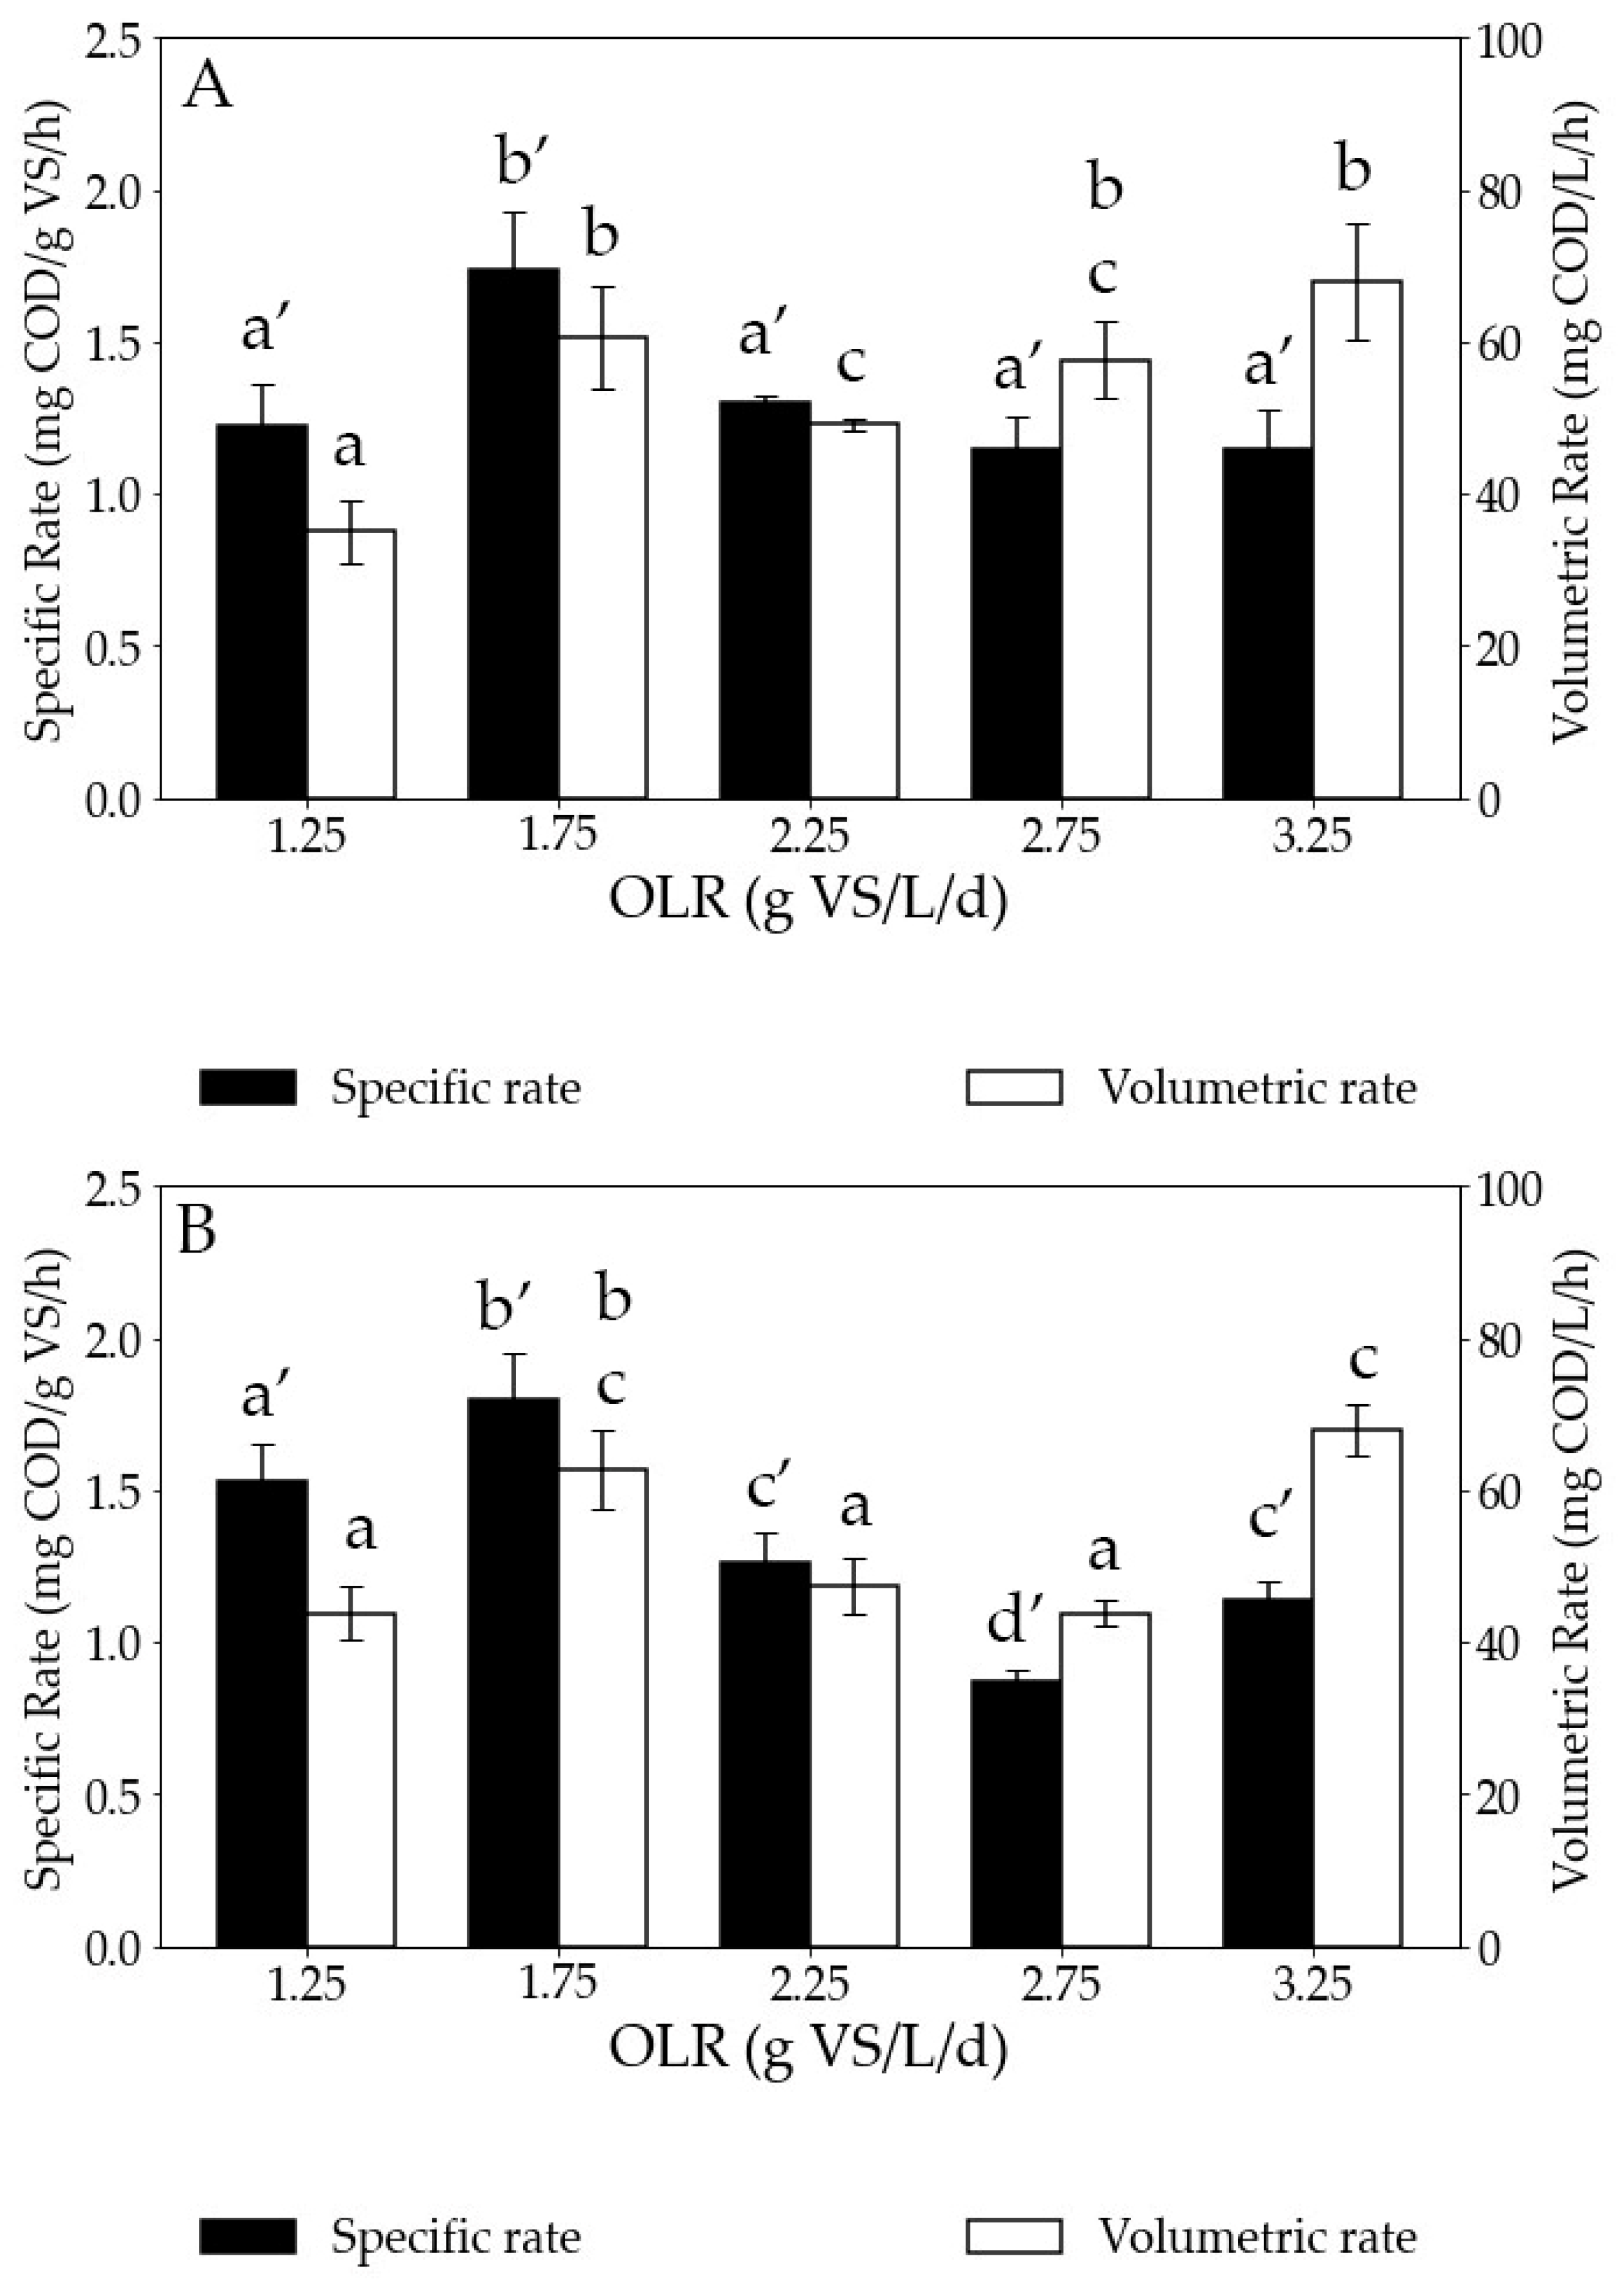
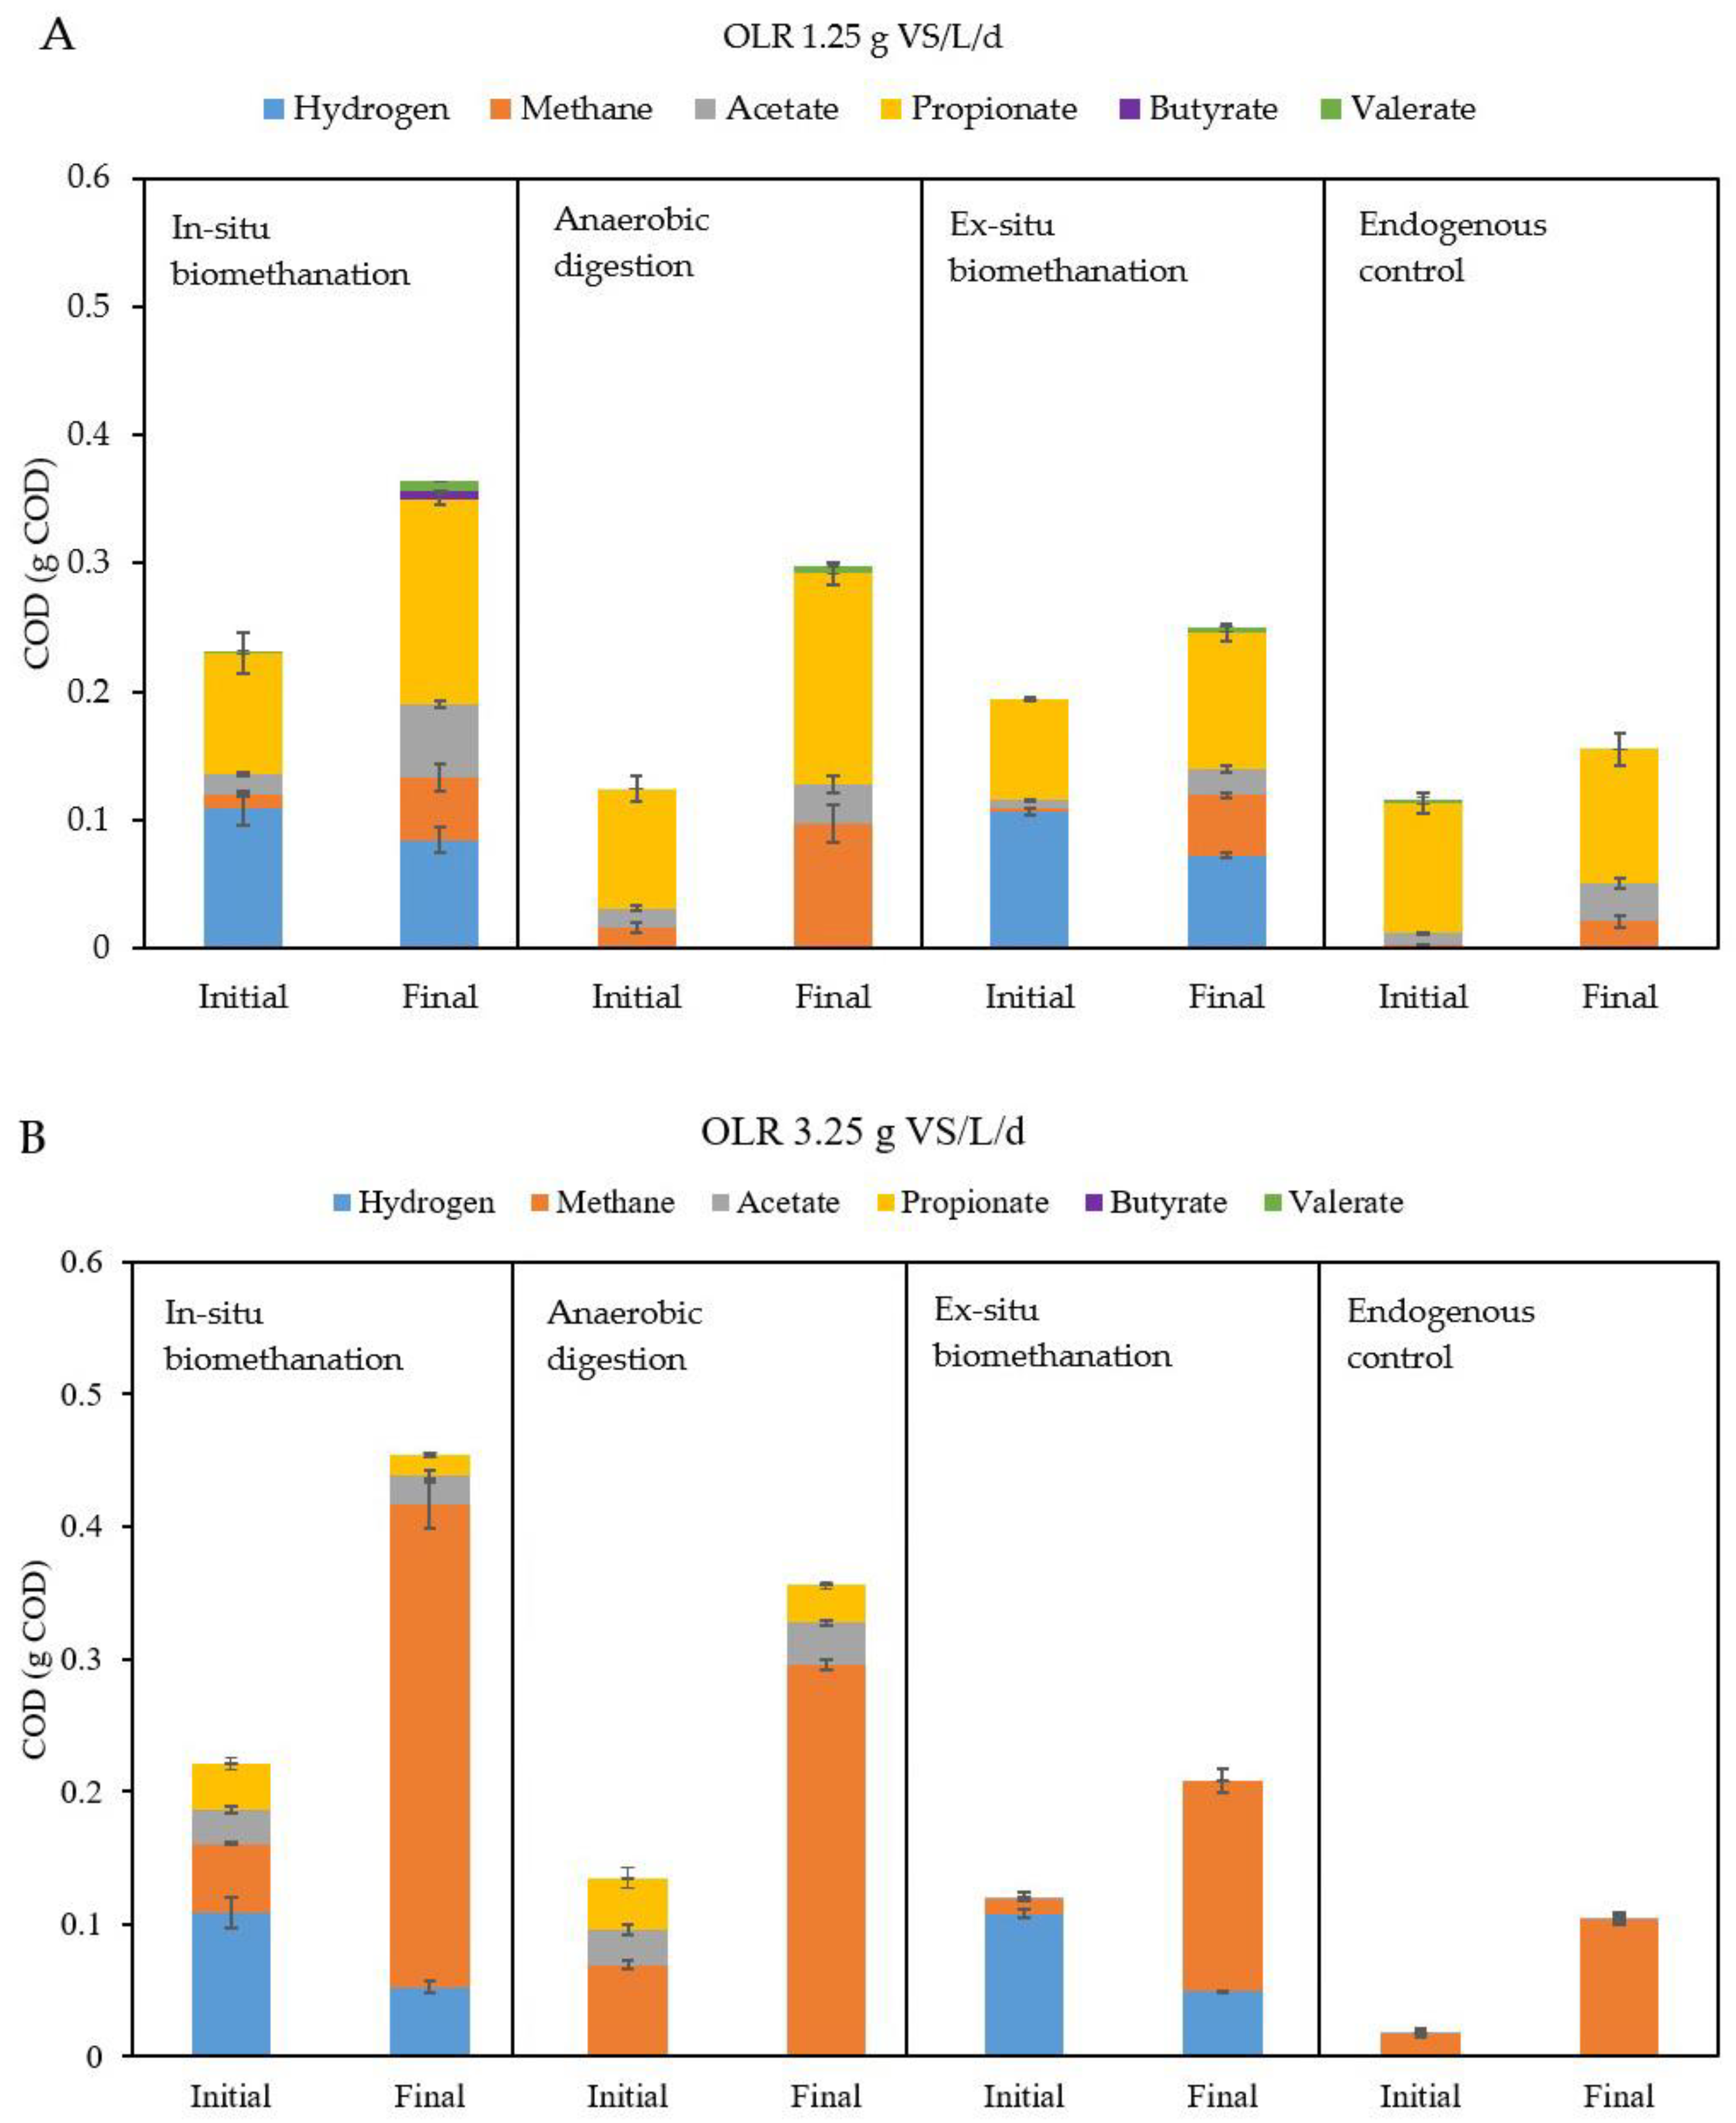
3.2.1. Impact of the OLR on the Hydrogen Consumption Rate

Starting with the in situ biomethanation tests, the volumetric hydrogen consumption rate showed an upward trend with increasing OLR, with values increasing from 35 ± 4.05 to 60 ± 6.61 mg COD/L/h as the OLR rose from 1.25 to 1.75 g VS/L/d (Figure 5). Subsequently, it experienced a slight decrease to 49 ± 0.9 mg COD/L/h as the OLR further increased from 1.75 to 2.25 g VS/L/d. However, subsequent to attaining an OLR of 2.25 g VS/L/d, the hydrogen consumption rate displayed a steady rise, reaching its peak at 68 ± 7.69 mg COD/L/h when the OLR reached 3.25 g VS/L/d. In agreement with the increasing volumetric rates and the increasing VS concentrations (Figure 4B) at higher OLRs, the specific hydrogen consumption rates remained similar for all OLRs except for the test at 1.75 g VS/L/d. The reasons for this improvement in kinetics at this particular OLR are unknown. As mentioned earlier, the VS amount represents the biomass concentration in the AD reactor. Therefore, the similar specific hydrogen consumption rate suggests that the faster volumetric hydrogen consumption at higher OLRs is a consequence of a higher concentration of microorganisms. This also indicates that hydrogen consumption was predominantly driven by biological processes rather than physical phenomena such as gas–liquid mass transfer rates, confirming that the observed rates are linked to biological kinetics.
At higher OLRs, the influx of organic substrate into the reactor fosters an environment for rapid microbial growth and metabolic activity. The surplus availability of organic carbon facilitates more extensive fermentation process, leading to a heightened hydrogen production rate as an intermediate product [40]. This can further lead to increased dominance of hydrogenotrophic methanogens in the reactor. In fact, methanogenic archaea possess diverse metabolic pathways for methane production, including hydrogenotrophic, acetoclastic, and methylotrophic methanogenesis [41]. At higher OLRs, hydrogenotrophic methanogenesis becomes increasingly favored due to the higher availability of hydrogen [42]. Consequently, methanogens actively consume hydrogen to produce methane, further augmenting the hydrogen consumption rate.
Comparing our results with the rates from the literature, Xu et al. (2020) observed similar hydrogen consumption kinetics in a UASB reactor treating synthetic wastewater, with the values of hydrogen consumption rates in the same range as those in our study (33 to 100 mg COD/L/h) for the same range of OLR (1 to 3 g VS/L/d) [11]. They also observed hydrogen consumption rates increasing with the OLR, which was attributed to the stable operation of the AD reactor, indicating no inhibition caused by VFA accumulation. Jensen et al. (2018) reported a hydrogen consumption rate ranging from 18 to 67 mg COD/L/h, corresponding to hydrogen injection rates varying between 20 and 40 m3/h [43]. The peak hydrogen consumption rate reached 153 mg COD/L/h when the hydrogen injection rate was 65 m3/h. Although their study utilized manure as a substrate and operated at a higher OLR (4.51–5.81 g VS/L/d), their hydrogen consumption rate values align with ours. This suggests that the hydrogen consumption rate can be enhanced not only at higher OLRs, but also with an increased hydrogen injection rate (provided that substrate availability is limiting). Also, Okoro-Shekwaga et al. (2021) observed a hydrogen consumption rate of 0.49 mg COD/L/h when treating FW in batch reactors. The low hydrogen consumption rate observed in their study may be related to a limited gas–liquid mass transfer rate [16]. This further supports the notion that our rates are governed by biological mechanisms rather than purely physical ones. In essence, if the rates were primarily physical, we would expect lower values, such as those observed in the aforementioned study. However, when kinetics is driven by biological processes, the rates can be much higher. Furthermore, Kim et al. (2021) noted reduced methane production rates with increasing OLR during the in situ biomethanation of FW in a CSTR. However, the elevated OLR in their study did not result from adding more organic substrate, but mainly came from higher H2 injection rates and partial pressures (the operating pressure reached 5–7 bars), which increased the risk of reactor acidification and decreased the methane production rates [44]. In our study, the increase in OLR was due to increased organic substrate concentration. Put together with our results, this suggests that there is an optimal H2 partial pressure (and thus, soluble concentration) to be found, low enough to avoid VFA accumulation but high enough to favor the growth of hydrogenotrophs and enhance methane production. More research should be conducted to estimate these values.
Concerning the ex situ biomethanation tests, this control test was performed to assess the kinetics of microbial structure in converting only H2. The upward trend of the volumetric hydrogen consumption with increasing OLR is less significant than for in situ, but the lowest value (43.8 mg COD/L/h) was still obtained at 1.25 g VS/L/d and the highest (67.9 mg COD/L/h) at 3.25 g VS/L/d. This difficulty in observing an increasing trend is a consequence of the obtained specific rates. As shown in Figure 5B, the specific hydrogen consumption rates varied between tests considerably. The reason for this is unknown.
When comparing the results of in situ and ex situ biomethanation, there is no notable difference in terms of volumetric hydrogen consumption rate at each OLR. The ex situ biomethanation reactors served as control reactors for the in situ biomethanation to examine whether the addition of the organic substrate influenced the hydrogen consumption rates. Since the hydrogen consumption rates were similar in both the in situ and ex situ conditions, it can be inferred that the addition of the organic substrate did not impact the hydrogen consumption rates. This similar behavior is a consequence of using the same adapted inoculum for both tests. Previous studies have demonstrated that when the inoculum exhibits a similar structure and is subjected to comparable operational conditions, it can result in similar hydrogen consumption rates [45]. Importantly, in situ conditions did not result in a more unstable process than ex situ conditions, with very low VFA accumulation at any tested OLR. Thus, biomethanation can be conducted within the same AD reactor, performing in situ hydrogen consumption without compromising microbial activity [46]. This provides the advantage of performing both AD and biomethanation in the same reactor, resulting in considerable savings in capital expense (CAPEX).

3.2.2. Impact of OLR on Methane and VFA Production

To understand the obtained results and to elucidate the fate of the provided substrates, COD mass balances were performed for each condition tested. Figure 6 illustrates the results, showing hydrogen, methane, and VFA, in the initial and final states of in situ biomethanation, ex situ biomethanation, AD, and the endogenous tests. To show examples leading to different outcomes, the figures correspond to the results at OLRs of 1.25 and 3.25 g VS/L/d, which represent the lowest and the highest test values. The corresponding graphs for the other OLRs tested can be found in the Supplementary Materials.
When comparing the mass balances between OLRs of 1.25 and 3.25 g VS/L/d, it appears that the results were significantly different. At low OLR, there was very low accumulation of acetate and propionate, which was not observed at higher OLRs. This discrepancy is very likely due to adaptation of the microbial communities to the substrates used in the AD reactor. Thus, in contradiction to what has been observed in previous studies [15], inoculum adaptation in the present tests resulted in boosted performances at higher OLRs, even in in situ biomethanation tests. In the study of Agneessens et al. (2018), they noted an elevated accumulation of acetate as the OLR increased from 0.5 to 2 g VS/L/d. However, it is essential to acknowledge that the OLR range in their study differed from ours and, despite observing an increasing trend in acetate accumulation with rising OLR, the actual values for acetate accumulation remained quite low, within the range of 31 to 189 mg COD/L [15]. Furthermore, the observed upward trend in acetate accumulation in their study could potentially be attributed to the absence of trace elements [47].
Another plausible explanation for the absence of VFA during in situ biomethanation is the prevalence of hydrogenotrophic methanogens. Their abundance notably increased at higher OLRs, leading to the rapid consumption of hydrogen. This consumption rate surpassed the potential inhibition of VFA degradation, thus preventing VFA accumulation within the reactor. This hypothesis aligns with the work of Alam Khan et al. (2022), who observed that the enrichment of hydrogenotrophic methanogens led to heightened methane production without the occurrence of VFA accumulation, even under conditions of high H2 partial pressure [48].
The second notable difference is that at 3.25 g VS/L/d, there was a much higher amount of methane in the final state of the in situ biomethanation and AD tests, which is simply due to the higher amount of FW supplied. Importantly, for both in situ and ex situ biomethanation tests, the amounts of hydrogen consumed (and thus, the methane produced by direct hydrogenotrophic methanogenesis) were clearly higher at 3.25 than at 1.25 g VS/L/d. This is in line with the faster rates reported in the previous section. A crucial point to mention is that the accumulation of any VFA (particularly propionate or butyrate) was not worsened during the in situ tests compared to the AD reactors, even though high dissolved hydrogen levels can induce the inhibition of their degradation due to thermodynamic constrains [49]. This is explained by the rapid consumption of hydrogen by hydrogenotrophic archaea, leading to low hydrogen concentrations in the liquid despite the higher hydrogen partial pressures. This further suggests increased hydrogenotrophic activity at higher OLRs.
Another important observation is that while at 1.25 g VS/L/d, the in situ reactor produced less methane than the AD test, which seems counterintuitive considering the presence of extra substrates such as H2, this discrepancy was not observed at 3.25 g VS/L/d. Therefore, while at low OLRs, hydrogen addition might have resulted in a lower extent of substrate degradation [50], this phenomenon did not occur at higher loads, confirming that microbial adaptation to higher OLRs can mitigate the negative impacts which might be caused by biomethanation, at least within the tested OLR range.

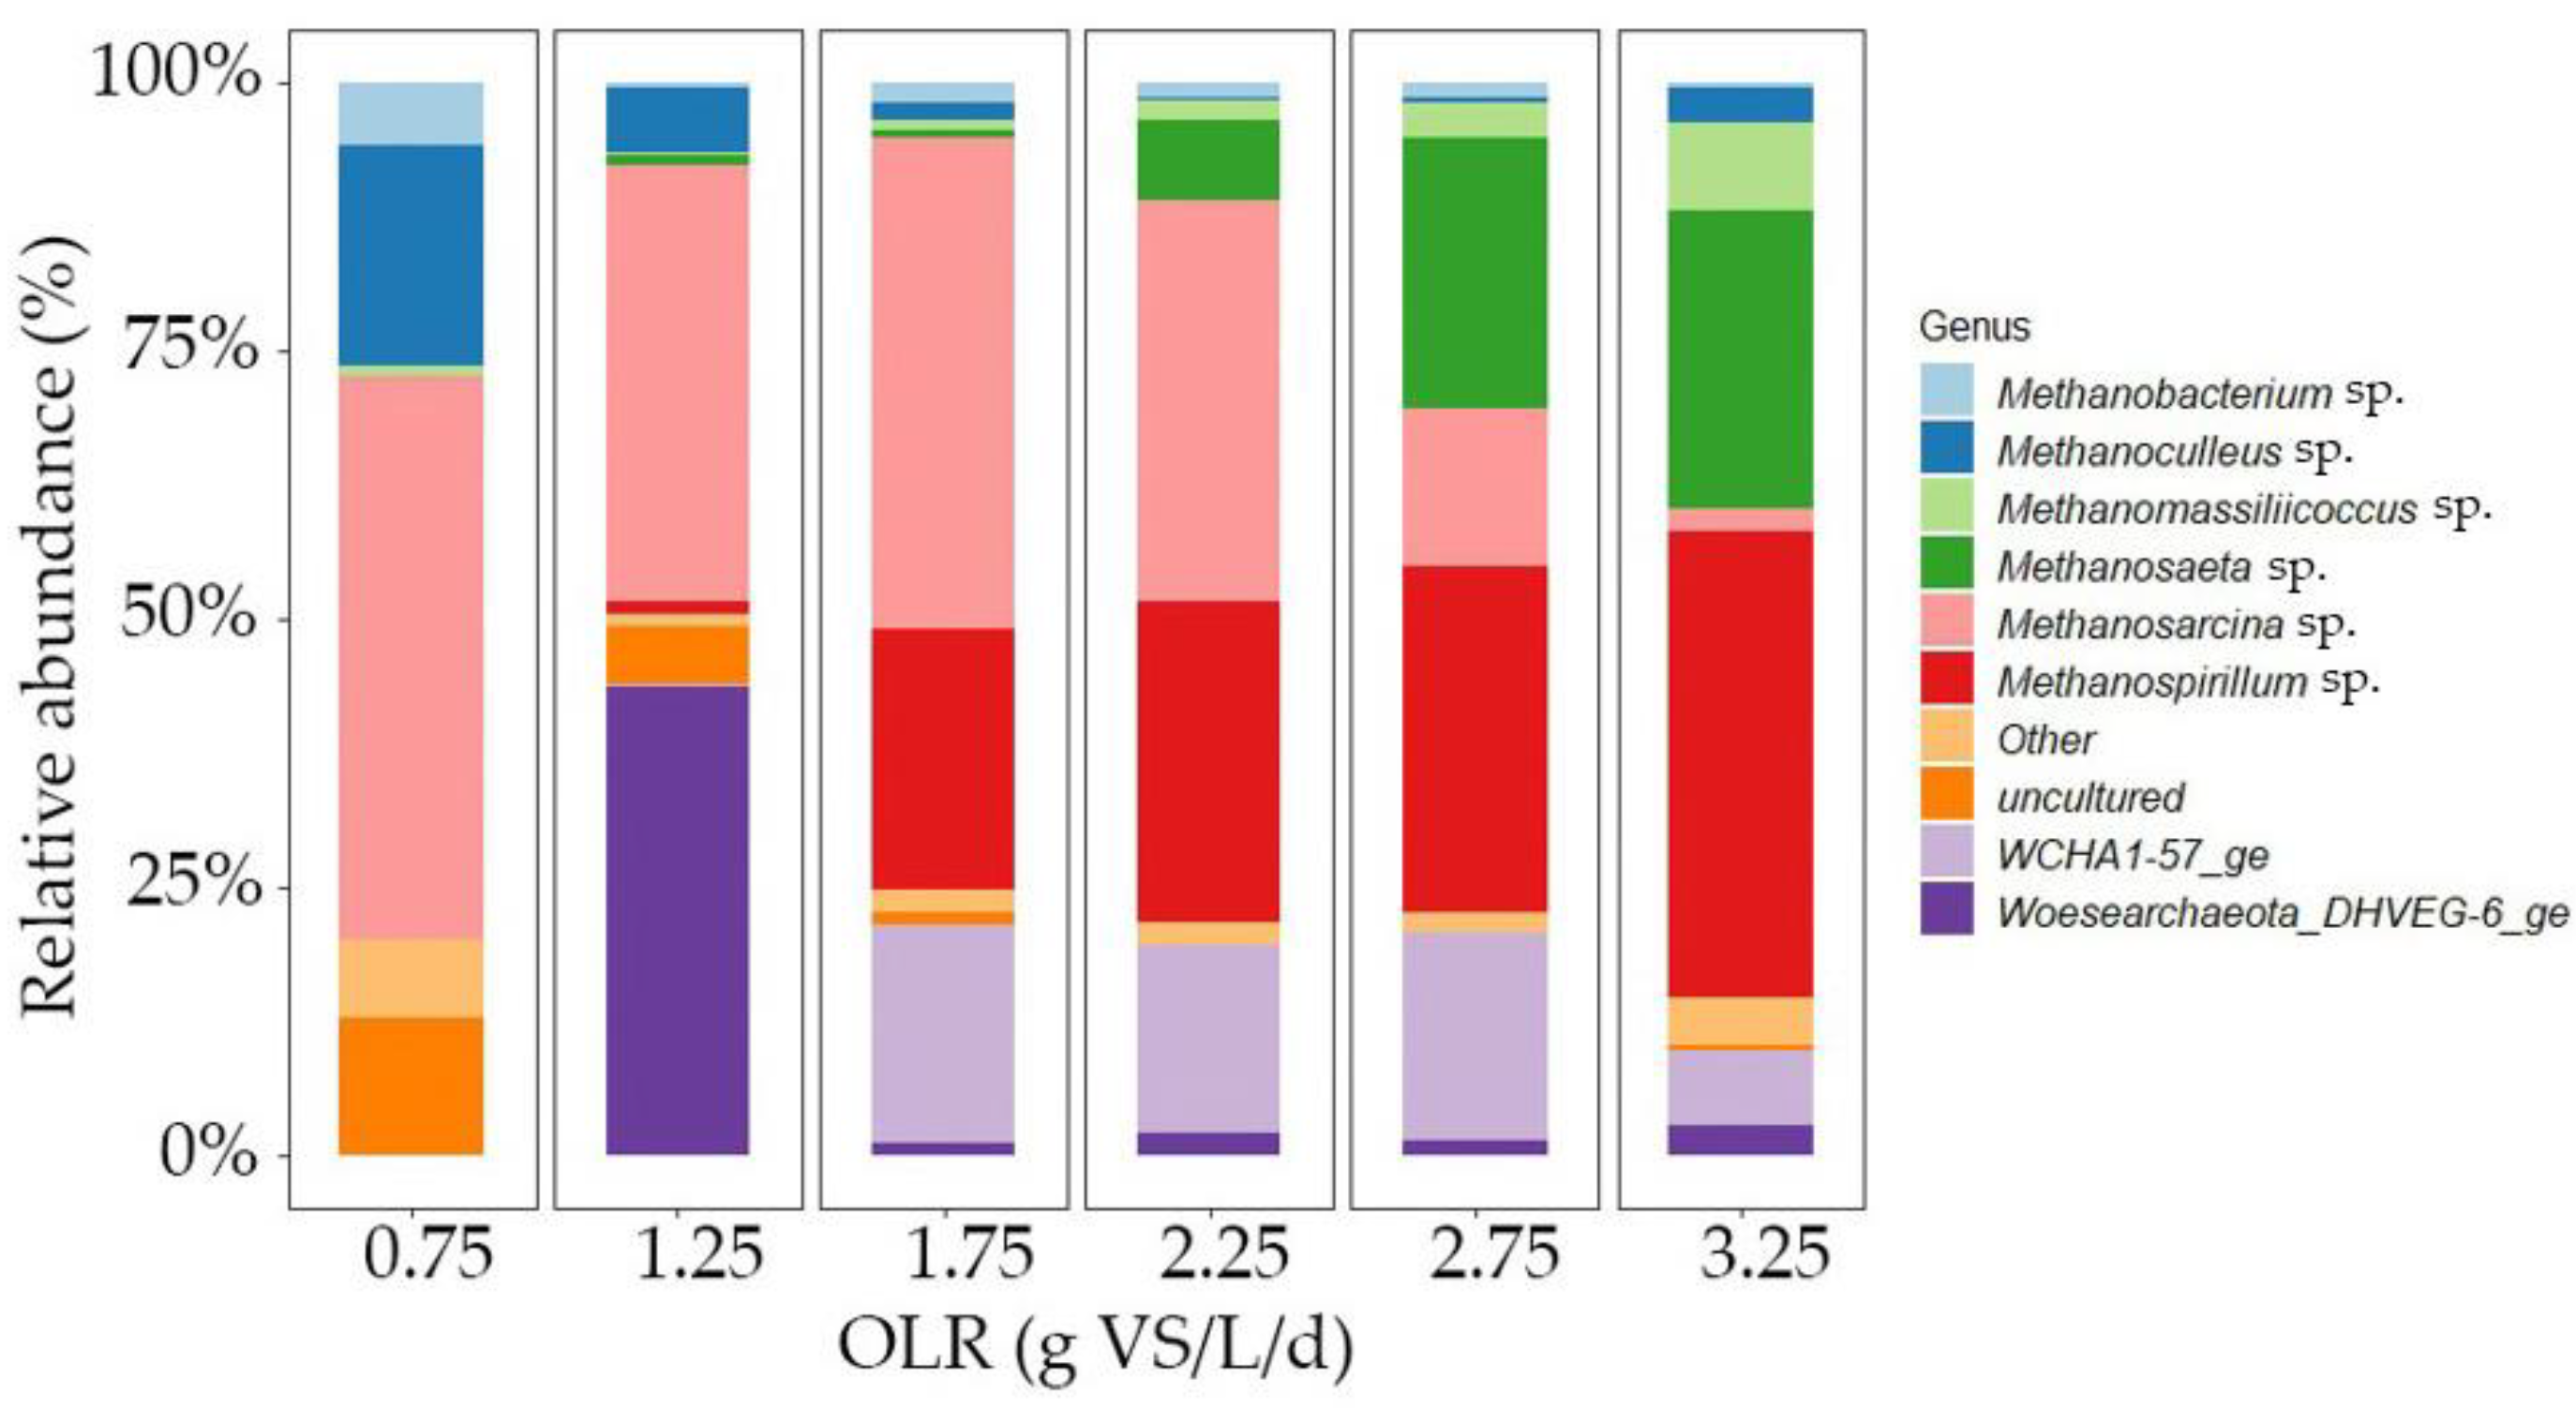
3.2.3. Microbial Community Analysis

To further understand the obtained results, the structure of the bacterial and archaeal communities in the inocula used for the batch tests was studied via 16S rRNA gene sequencing. The bacterial community remained stable throughout the experiment, and their results are detailed in Figure S3 of the Supplementary Materials. In our investigation, we observed a noticeable decrease in the abundance of Petrimonas with the progressive increase in OLR from 1.25 to 2.25 g VS/L/d. Moreover, upon surpassing an OLR threshold of 2.25 g VS/L/d, Petrimonas was absent from the samples. These results (Figure 7) confirm that higher OLRs resulted in an increase in the relative abundances of strict hydrogenotrophic methanogens (e.g., Methanospirillum sp. [51]). Thus, higher OLRs lead to enhanced hydrogen consumption rates due to both higher biomass concentrations and microbial adaptation, particularly towards hydrogenotrophic methanogenesis. This implies that the contribution to overall methane production from hydrogenotrophic methanogens increased with the OLR. Zhu et al. (2023) also observed a higher abundance of hydrogenotrophic methanogens at higher OLRs in the range of 50–90 g TS/L/d upon treating pig manure and corn stover in AD [52]. Zhang et al. (2023) observed an increased abundance of Methanoculleus sp., which are hydrogenotrophic methanogens, at high OLRs (5.8 g VS/L/d) when treating food waste and sewage sludge in a CSTR by increasing the OLR from 1.4 to 5.8 g VS/L/d [53]. Furthermore, Linyi et al. (2020) reported a higher abundance of Methanospirillum sp., a hydrogenotrophic methanogen, as the OLR increased from 1 to 6 g VS/L/d during the AD of FW in a 2 L CSTR [54].
Moreover, elevating the OLR led to a greater prevalence of Methanosaeta sp. while reducing the predominance of Methanosarcinai sp. This shift may be attributed to the acetate concentration, which remained below 100 mg/L in the parent AD reactor [55]. Based on these findings, it appears plausible that both acetoclastic methanogenesis and hydrogenotrophic methanogenesis pathways were occurring. However, conclusions regarding the presence or absence of the syntrophic acetate oxidation pathway could not be drawn. Among the methanogens, Methanospirillum sp. exhibited a notable increase in abundance, rising from negligible proportions at OLRs of 0.75 g VS/L/d and 1.25 g VS/L/d to 21% and 29% at OLRs of 1.75 g VS/L/d and 2.25 g VS/L/d, respectively. It became the most dominant methanogen, with 49% relative abundance, at an OLR of 3.25 g VS/L/d. This enrichment of Methanospirillum sp. underscores its significant role in biogas upgrading, aligning with findings from prior research [6]. There was also a sudden increase in the prevalence of Woesearchaeota_DHVEG-6_ge at an OLR of 1.25 g VS/L/d. However, the reason for this observation remains unknown.
The results of the richness and diversity indexes for archaeal communities are shown in Table 2. At increasing OLRs, the Ace index rose, indicating heightened richness in archaeal species. Additionally, the Shannon and InvSimpson indices also increased, confirming the higher diversity at increased OLRs. In essence, the archaeal community exhibited increased richness within specific communities, and the overall diversity expanded, with a higher number of genera observed at elevated OLRs. This resulted in improved performance of the reactors at higher loads.
In summary, a higher OLR results in a faster hydrogen consumption rate during the in situ biomethanation of food waste. The underlying mechanism for this effect is likely due to an increased abundance of hydrogenotrophic methanogens as the OLR increases in the parent reactor. This phenomenon leads to a more rapid hydrogen consumption rate. Additionally, the addition of trace elements may contribute to the stable operation of the parent reactor and the degradation of VFAs instead of their accumulation.

3.3. Impact of Short-Period Hydrogen Starvation on Biomethanation Performance

To assess the impact of a short-term hydrogen starvation period on biomethanation performance, a second injection of hydrogen was performed after 12 h of starvation. As shown in Table 3, the volumetric hydrogen consumption rates were statistically similar between the first and second hydrogen injections at OLRs of 1.25, 1.75, and 3.25 g VS/L/d for in situ biomethanation. However, at OLRs of 2.25 and 2.75 g VS/L/d, the rate was faster during the second substrate injection pulse. Thus, the hydrogen consumption rate during in situ tests was either equal or faster after 12 h of H2 starvation, suggesting consistent or improved kinetics of hydrogen consumption. Fermentative bacteria might have provided a limited but consistent supply of hydrogen and carbon dioxide originating from biomass digestion, which, although in low quantities, could have sustained the growth of hydrogenotrophic methanogens [56]. Nevertheless, this cannot explain why the second injection resulted in faster kinetics only in some OLRs.
pH cannot explain either of the observed differences, as it remained stable during the first and second hydrogen injections. An excessively high pH could restrict methanogenic activity, potentially resulting in process inhibition and reduced hydrogen consumption [57]. Additionally, during biomethanation, there is a risk of pH increase and potential process failure due to bicarbonate consumption [9]. pH ranges outside the range of 7.0–8.0 could inhibit methanogenic activity [58], leading to a reduction in the hydrogen consumption rate [59]. This was not observed in the present experiments, and the initial pH consistently remained at 7.16 ± 0.11 and 7.17 ± 0.18 during the first and second injections, respectively, for in situ biomethanation.
Indeed, the precise reason for the increased hydrogen consumption rate at OLR levels of 2.25 and 2.75 g VS/L/d remains uncertain. The results in the literature are inconsistent on this matter. While some authors have reported a faster hydrogen consumption rate after a starvation period [56], others have observed a reduction or a similarity in hydrogen consumption rates after a starvation period [60]. Further research is needed to better understand this phenomenon.
Comparing our results with the literature, Savvas et al. (2018) reported a swift recovery within 24 h for four ex situ biomethanation reactors (three operated at 37 °C and one at 55 °C) after a gas feeding interruption lasting 13 and 45 days [56]. In contrast, Logroño et al. (2021) observed a significant reduction in hydrogen consumption and methane production rates following a 7-day starvation period during ex situ biomethanation at a mesophilic temperature (37 °C) [60]. Conversely, Wahid et al. (2019) noted rapid restoration of methane production rates in in situ biomethanation reactors, but this recovery occurred only after three days without the addition of hydrogen [57]. Braga Nan et al. (2022) reported that a seven-day starvation period had no impact on methane productivity and yield under any tested conditions using glucose and acetate as organic substrates and H2:CO2 (4:1 molar ratio) as a gaseous substrate during in situ biomethanation (organic substrate and H2:CO2), ex situ biomethanation (only H2:CO2), and AD (only organic substrate). However, a four-week starvation period had adverse effects on all reactors in terms of metabolite production, substrate consumption, methane yield, and methane production rate [26].
These results showcase the robustness of the in situ biomethanation process developed. It seems that the activity of hydrogenotrophic methanogens remained unaffected even when hydrogen addition was halted for 12 h. Consequently, pulsed hydrogen addition is biologically viable without compromising the hydrogenotrophic activity of the microbial community in in situ biomethanation reactors. This might be an advantage of in situ vs. ex situ biomethanation, as the organic substrate degradation can provide, to some extent, the substrate required for maintaining the activity of hydrogenotrophic methanogens.

4. Conclusions and Perspectives

This study demonstrates that within the tested range, increasing the OLR from 1.25 to 3.25 g VS/L/d led to higher H2 consumption rates from 35 to 68 mg COD/L/h during the in situ biomethanation of FW. Importantly, higher loads did not result in VFA accumulation, which is a main issue that might arise during this process. Both in situ and ex situ biomethanation showed comparable kinetics, and a 12 h starvation period did not hinder the H2 consumption rates. The abundance of hydrogenotrophic methanogens increased from a negligible amount at an OLR of 0.75 g VS/L/d to 49% at an OLR of 3.25 g VS/L/d, which may account for the observed accelerated H2 consumption.
This study demonstrates that in situ biomethanation can be conducted at high OLRs without encountering VFA accumulation. However, further validation of these findings in (semi)continuous pilot-scale reactors is required. Additionally, beyond examining the OLR, investigating the biochemical composition of the treated substrate would be pertinent to fully understand the impact of organic matter input on biomethanation performance.
Regarding the practical application of this study, higher OLRs can be implemented to conduct in situ biomethanation without compromising the rate of hydrogen consumption. This enables the utilization of smaller reactor volumes for in situ biomethanation, thereby substantially reducing both capital and operational costs. Also, increasing the OLR did not lead to instability of the parent and batch reactors.

Supplementary Materials

The following supporting information can be downloaded at: https://www.mdpi.com/article/10.3390/en17112490/s1, Figure S1. qPCR results for bacteria and archaea across different OLRs. OTU stands for operational taxonomical unit and OLR for organic loading rate. Figure S2. Cumulative COD mass balances for the tests at (A) 1.75 g VS/L/d and (B) 2.25 g VS/L/d and (C) 2.75 g VS/L/d. Data for hydrogen, methane, and VFAs at the beginning (initial) and at the end (final) of the batch tests are provided. Results are shown for in situ biomethanation, AD, ex situ biomethanation, and endogenous tests. OLR stands for organic loading rate, COD for chemical oxygen demand, AD for anaerobic digestion, and VFA for volatile fatty acid. Figure S3. Relative abundance of bacterial species at genus level.

Author Contributions

Conceptualization, A.D.-R., G.C.-T., E.T., J.-P.D. and R.E.; methodology, A.D.-R., G.C.-T., E.T., J.-P.D. and R.E.; formal analysis, A.D.-R., G.C.-T. and R.E.; investigation, A.D.-R.; resources, E.T., J.-P.D. and R.E.; writing—original draft preparation, A.D.-R., G.C.-T. and R.E.; writing—review and editing, A.D.-R., G.C.-T., E.T., J.-P.D. and R.E.; visualization, A.D.-R., G.C.-T. and R.E.; supervision, G.C.-T., E.T., J.-P.D. and R.E.; project administration, J.-P.D. and R.E.; funding acquisition, J.-P.D. and R.E. All authors have read and agreed to the published version of the manuscript.

Funding

This research was funded by the Agence National de la Recherche (ANR, France), grant number ANR-20-CE05-0031-04.

Data Availability Statement

The data presented in this study are available in the Supplementary Materials and can be downloaded at https://susy.mdpi.com/user/manuscripts/displayFile/5647e07739e237456a84f3f679ead35e/supplementary (accessed on 19 May 2024).

Acknowledgments

The authors want to acknowledge Gaëlle Santa-Catalina for her support in carrying out the analyses of the microbial communities. Ali Dabestani-Rahmatabad is thankful to Philippe Sousbie and Clemence Pages for their assistance.

Conflicts of Interest

The authors declare no conflicts of interest. The funders had no role in the design of the study; in the collection, analyses, or interpretation of the data; in the writing of the manuscript; or in the decision to publish the results.

References

  1. Kacprzak, A.; Włodarczyk, R. Utilization of Organic Waste in a Direct Carbon Fuel Cell for Sustainable Electricity Generation. Energies 2023, 16, 7359. [Google Scholar] [CrossRef]
  2. Naji, A.; Rechdaoui, S.G.; Jabagi, E.; Lacroix, C.; Azimi, S.; Rocher, V. Pilot-Scale Anaerobic Co-Digestion of Wastewater Sludge with Lignocellulosic Waste: A Study of Performance and Limits. Energies 2023, 16, 6595. [Google Scholar] [CrossRef]
  3. Tsigkou, K.; Sventzouri, E.; Zafiri, C.; Kornaros, M. Digestate Recirculation Rate Optimization for the Enhancement of Hydrogen Production: The Case of Disposable Nappies and Fruit/Vegetable Waste Valorization in a Mesophilic Two-Stage Anaerobic Digestion System. Renew. Energy 2023, 215, 119010. [Google Scholar] [CrossRef]
  4. Dębowski, M.; Zieliński, M.; Kazimierowicz, J.; Nowicka, A.; Dudek, M. Optimisation of Biogas Production in the Co-Digestion of Pre-Hydrodynamically Cavitated Aerobic Granular Sludge with Waste Fats. Energies 2024, 17, 922. [Google Scholar] [CrossRef]
  5. Boukouvalas, C.; Kekes, T.; Oikonomopoulou, V.; Krokida, M. Life Cycle Assessment of Energy Production from Solid Waste Valorization and Wastewater Purification: A Case Study of Meat Processing Industry. Energies 2024, 17, 487. [Google Scholar] [CrossRef]
  6. Sun, Z.-F.; Zhao, L.; Wu, J.-T.; Wang, Z.-H.; Wu, K.-K.; Chen, C.; Xing, D.-F.; Liu, D.-M.; Yang, S.-S.; Wang, A.; et al. Exogenous Hydrogen Supply Improves in-Situ Biogas Upgrading of Sewage Sludge: Performance and Mechanisms. Chem. Eng. J. 2023, 477, 147307. [Google Scholar] [CrossRef]
  7. Zhao, J.; Li, Y.; Dong, R. Recent Progress towards In-Situ Biogas Upgrading Technologies. Sci. Total Environ. 2021, 800, 149667. [Google Scholar] [CrossRef]
  8. Khan, M.U.; Lee, J.T.E.; Bashir, M.A.; Dissanayake, P.D.; Ok, Y.S.; Tong, Y.W.; Shariati, M.A.; Wu, S.; Ahring, B.K. Current Status of Biogas Upgrading for Direct Biomethane Use: A Review. Renew. Sustain. Energy Rev. 2021, 149, 111343. [Google Scholar] [CrossRef]
  9. Derakhshesh, S.; Abdollahzadeh Sharghi, E.; Bonakdarpour, B.; Khoshnevisan, B. Integrating Electrocoagulation Process with Up-Flow Anaerobic Sludge Blanket for in-Situ Biomethanation and Performance Improvement. Bioresour. Technol. 2022, 360, 127536. [Google Scholar] [CrossRef]
  10. Luo, G.; Angelidaki, I. Integrated Biogas Upgrading and Hydrogen Utilization in an Anaerobic Reactor Containing Enriched Hydrogenotrophic Methanogenic Culture. Biotechnol. Bioeng. 2012, 109, 2729–2736. [Google Scholar] [CrossRef]
  11. Xu, H.; Wang, K.; Zhang, X.; Gong, H.; Xia, Y.; Holmes, D.E. Application of In-Situ H2-Assisted Biogas Upgrading in High-Rate Anaerobic Wastewater Treatment. Bioresour. Technol. 2020, 299, 122598. [Google Scholar] [CrossRef]
  12. Bellini, R.; Bassani, I.; Vizzarro, A.; Azim, A.A.; Vasile, N.S.; Pirri, C.F.; Verga, F.; Menin, B. Biological Aspects, Advancements and Techno-Economical Evaluation of Biological Methanation for the Recycling and Valorization of CO2. Energies 2022, 15, 4064. [Google Scholar] [CrossRef]
  13. D’ Silva, T.C.; Isha, A.; Chandra, R.; Vijay, V.K.; Subbarao, P.M.V.; Kumar, R.; Chaudhary, V.P.; Singh, H.; Khan, A.A.; Tyagi, V.K.; et al. Enhancing Methane Production in Anaerobic Digestion through Hydrogen Assisted Pathways – A State-of-the-Art Review. Renew. Sustain. Energy Rev. 2021, 151, 111536. [Google Scholar] [CrossRef]
  14. Jiang, H.; Wu, F.; Wang, Y.; Feng, L.; Zhou, H.; Li, Y. Characteristics of In-Situ Hydrogen Biomethanation at Mesophilic and Thermophilic Temperatures. Bioresour. Technol. 2021, 337, 125455. [Google Scholar] [CrossRef]
  15. Agneessens, L.M.; Ottosen, L.D.M.; Andersen, M.; Berg Olesen, C.; Feilberg, A.; Kofoed, M.V.W. Parameters Affecting Acetate Concentrations during In-Situ Biological Hydrogen Methanation. Bioresour. Technol. 2018, 258, 33–40. [Google Scholar] [CrossRef] [PubMed]
  16. Okoro-Shekwaga, C.K.; Ross, A.; Camargo-Valero, M.A. Enhancing Bioenergy Production from Food Waste by in Situ Biomethanation: Effect of the Hydrogen Injection Point. Food Energy Secur. 2021, 10, e288. [Google Scholar] [CrossRef]
  17. Poggio, D.; Sastraatmaja, A.; Walker, M.; Michailos, S.; Nimmo, W.; Pourkashanian, M. Experimental Evaluation of Continuous In-Situ Biomethanation of CO2 in Anaerobic Digesters Fed on Sewage Sludge and Food Waste and the Influence of Hydrogen Gas–Liquid Mass Transfer. Processes 2023, 11, 604. [Google Scholar] [CrossRef]
  18. Kong, X.; Wei, Y.; Xu, S.; Liu, J.; Li, H.; Liu, Y.; Yu, S. Inhibiting Excessive Acidification Using Zero-Valent Iron in Anaerobic Digestion of Food Waste at High Organic Load Rates. Bioresour. Technol. 2016, 211, 65–71. [Google Scholar] [CrossRef] [PubMed]
  19. Wang, C.; Nakakoji, S.; Ng, T.C.A.; Zhu, P.; Tsukada, R.; Tatara, M.; Ng, H.Y. Acclimatizing Waste Activated Sludge in a Thermophilic Anaerobic Fixed-Bed Biofilm Reactor to Maximize Biogas Production for Food Waste Treatment at High Organic Loading Rates. Water Res. 2023, 242, 120299. [Google Scholar] [CrossRef]
  20. Capson-Tojo, G.; Ruiz, D.; Rouez, M.; Crest, M.; Steyer, J.-P.; Bernet, N.; Delgenès, J.-P.; Escudié, R. Accumulation of Propionic Acid during Consecutive Batch Anaerobic Digestion of Commercial Food Waste. Bioresour. Technol. 2017, 245, 724–733. [Google Scholar] [CrossRef]
  21. Vechi, N.T.; Agneessens, L.M.; Feilberg, A.; Ottosen, L.D.M.; Kofoed, M.V.W. In Situ Biomethanation: Inoculum Origin Influences Acetate Consumption Rate during Hydrogen Addition. Bioresour. Technol. Rep. 2021, 14, 100656. [Google Scholar] [CrossRef]
  22. Capson-Tojo, G.; Trably, E.; Rouez, M.; Crest, M.; Steyer, J.-P.; Delgenès, J.-P.; Escudié, R. Dry Anaerobic Digestion of Food Waste and Cardboard at Different Substrate Loads, Solid Contents and Co-Digestion Proportions. Bioresour. Technol. 2017, 233, 166–175. [Google Scholar] [CrossRef] [PubMed]
  23. Eaton, A.D.; Franson, M.A.H.; Clesceri, L.S.; Rice, E.W.; Greenberg, A.E. Standard Methods for the Examination of Water & Wastewater; American Public Health Association: Washington, DC, USA, 2005; p. 1.v. [Google Scholar]
  24. Motte, J.-C.; Escudié, R.; Beaufils, N.; Steyer, J.-P.; Bernet, N.; Delgenès, J.-P.; Dumas, C. Morphological Structures of Wheat Straw Strongly Impacts Its Anaerobic Digestion. Ind. Crops Prod. 2014, 52, 695–701. [Google Scholar] [CrossRef]
  25. Bio2E, INRAE, 2018. Plateforme Biotechnologie et Bioraffinerie Environnementales. [CrossRef]
  26. Braga Nan, L.; Trably, E.; Santa-Catalina, G.; Bernet, N.; Delgenes, J.-P.; Escudie, R. Microbial Community Redundance in Biomethanation Systems Lead to Faster Recovery of Methane Production Rates after Starvation. Sci. Total Environ. 2022, 804, 150073. [Google Scholar] [CrossRef] [PubMed]
  27. Venkiteshwaran, K.; Milferstedt, K.; Hamelin, J.; Zitomer, D.H. Anaerobic Digester Bioaugmentation Influences Quasi Steady State Performance and Microbial Community. Water Res. 2016, 104, 128–136. [Google Scholar] [CrossRef] [PubMed]
  28. Braga Nan, L.; Trably, E.; Santa-Catalina, G.; Bernet, N.; Delgenès, J.-P.; Escudié, R. Biomethanation Processes: New Insights on the Effect of a High H2 Partial Pressure on Microbial Communities. Biotechnol. Biofuels 2020, 13, 141. [Google Scholar] [CrossRef] [PubMed]
  29. Zhang, L.; Yang, J.; Wu, B.; Liu, J.; Xu, X.; Wu, W.; Zhuang, J.; Li, H.; Huang, T. Enhanced VFAs Production from Microalgal Hydrolytic Acidification with Ultrasonic-Alkali Pretreatment. Algal Res. 2023, 71, 103056. [Google Scholar] [CrossRef]
  30. Wu, L.-J.; Li, X.-X.; Ye, F.; Yang, F.; Lyu, Y.-K. Determination of Operational Parameters for the First Stage of Continuous Temperature-Phased Anaerobic Digestion of Oily Food Waste: Influent Concentration, Hydraulic Retention Time, pH Control and Temperature. J. Clean. Prod. 2024, 434, 139960. [Google Scholar] [CrossRef]
  31. Zheng, H.; Li, D.; Stanislaus, M.S.; Zhang, N.; Zhu, Q.; Hu, X.; Yang, Y. Development of a Bio-Zeolite Fixed-Bed Bioreactor for Mitigating Ammonia Inhibition of Anaerobic Digestion with Extremely High Ammonium Concentration Livestock Waste. Chem. Eng. J. 2015, 280, 106–114. [Google Scholar] [CrossRef]
  32. Marín, D.; Méndez, L.; Suero, I.; Díaz, I.; Blanco, S.; Fdz-Polanco, M.; Muñoz, R. Anaerobic Digestion of Food Waste Coupled with Biogas Upgrading in an Outdoors Algal-Bacterial Photobioreactor at Pilot Scale. Fuel 2022, 324, 124554. [Google Scholar] [CrossRef]
  33. Choong, Y.Y.; Norli, I.; Abdullah, A.Z.; Yhaya, M.F. Impacts of Trace Element Supplementation on the Performance of Anaerobic Digestion Process: A Critical Review. Bioresour. Technol. 2016, 209, 369–379. [Google Scholar] [CrossRef] [PubMed]
  34. Wu, P.; Bai, T.; Yang, Y.; Li, K.; Tan, H.; Zhuang, S.; Song, F.; Lv, Z.; Wen, H.; Yu, H. Feeding Strategy Determine Flexible Biogas via Shaping Microbial Abundance and Interaction in Anaerobic Digestion. Biomass Bioenergy 2024, 180, 107030. [Google Scholar] [CrossRef]
  35. Yulisa, A.; Park, S.H.; Chairattanawat, C.; Hwang, S. Effect of Feeding Strategies on the Start-up of Anaerobic Digestion of Fish Waste. Energy 2023, 280, 128199. [Google Scholar] [CrossRef]
  36. Sasidhar, K.B.; Somasundaram, M.; Ekambaram, P.; Arumugam, S.K.; Nataraj, G.; Murugan, M.A. A Critical Review on the Effects of Pneumatic Mixing in Anaerobic Digestion Process. J. Clean. Prod. 2022, 378, 134513. [Google Scholar] [CrossRef]
  37. Yu, X.; Yan, L.; Wang, H.; Bi, S.; Zhang, F.; Huang, S.; Wang, Y.; Wang, Y. Anaerobic Co-Digestion of Cabbage Waste and Cattle Manure: Effect of Mixing Ratio and Hydraulic Retention Time. Renew. Energy 2024, 221, 119743. [Google Scholar] [CrossRef]
  38. Saravanakumar, A.; Sudha, M.R.; Chen, W.-H.; Pradeshwaran, V.; Ashokkumar, V.; Selvarajoo, A. Biomethane Production as a Green Energy Source from Anaerobic Digestion of Municipal Solid Waste: A State-of-the-Art Review. Biocatal. Agric. Biotechnol. 2023, 53, 102866. [Google Scholar] [CrossRef]
  39. Agyeman, F.O.; Tao, W. Anaerobic Co-Digestion of Food Waste and Dairy Manure: Effects of Food Waste Particle Size and Organic Loading Rate. J. Environ. Manag. 2014, 133, 268–274. [Google Scholar] [CrossRef]
  40. Paudel, S.; Kang, Y.; Yoo, Y.-S.; Seo, G.T. Effect of Volumetric Organic Loading Rate (OLR) on H2 and CH4 Production by Two-Stage Anaerobic Co-Digestion of Food Waste and Brown Water. Waste Manag. 2017, 61, 484–493. [Google Scholar] [CrossRef] [PubMed]
  41. Yellezuome, D.; Zhu, X.; Liu, X.; Liu, X.; Liu, R.; Wang, Z.; Li, Y.; Sun, C.; Hemida Abd-Alla, M.; Rasmey, A.-H.M. Integration of Two-Stage Anaerobic Digestion Process with in Situ Biogas Upgrading. Bioresour. Technol. 2023, 369, 128475. [Google Scholar] [CrossRef]
  42. Gao, M.; Guo, B.; Li, L.; Liu, Y. Role of Syntrophic Acetate Oxidation and Hydrogenotrophic Methanogenesis in Co-Digestion of Blackwater with Food Waste. J. Clean. Prod. 2021, 283, 125393. [Google Scholar] [CrossRef]
  43. Jensen, M.B.; Kofoed, M.V.W.; Fischer, K.; Voigt, N.V.; Agneessens, L.M.; Batstone, D.J.; Ottosen, L.D.M. Venturi-Type Injection System as a Potential H2 Mass Transfer Technology for Full-Scale in Situ Biomethanation. Appl. Energy 2018, 222, 840–846. [Google Scholar] [CrossRef]
  44. Kim, S.; Mostafa, A.; Im, S.; Lee, M.-K.; Kang, S.; Na, J.-G.; Kim, D.-H. Production of High-Calorific Biogas from Food Waste by Integrating Two Approaches: Autogenerative High-Pressure and Hydrogen Injection. Water Res. 2021, 194, 116920. [Google Scholar] [CrossRef] [PubMed]
  45. Figeac, N.; Trably, E.; Bernet, N.; Delgenès, J.-P.; Escudié, R. Temperature and Inoculum Origin Influence the Performance of Ex-Situ Biological Hydrogen Methanation. Molecules 2020, 25, 5665. [Google Scholar] [CrossRef] [PubMed]
  46. Rao, Y.; Chibwe, K.; Mantilla-Calderon, D.; Ling, F.; He, Z. Meta-Analysis of Biogas Upgrading to Renewable Natural Gas through Biological CO2 Conversion. J. Clean. Prod. 2023, 426, 139128. [Google Scholar] [CrossRef]
  47. Capson-Tojo, G.; Moscoviz, R.; Ruiz, D.; Santa-Catalina, G.; Trably, E.; Rouez, M.; Crest, M.; Steyer, J.-P.; Bernet, N.; Delgenès, J.-P.; et al. Addition of Granular Activated Carbon and Trace Elements to Favor Volatile Fatty Acid Consumption during Anaerobic Digestion of Food Waste. Bioresour. Technol. 2018, 260, 157–168. [Google Scholar] [CrossRef] [PubMed]
  48. Khan, A.; Akbar, S.; Okonkwo, V.; Smith, C.; Khan, S.; Ali Shah, A.; Adnan, F.; Zeeshan Ijaz, U.; Ahmed, S.; Badshah, M. Enrichment of the Hydrogenotrophic Methanogens for, in-Situ Biogas up-Gradation by Recirculation of Gases and Supply of Hydrogen in Methanogenic Reactor. Bioresour. Technol. 2022, 345, 126219. [Google Scholar] [CrossRef] [PubMed]
  49. Fukuzaki, S.; Nishio, N.; Shobayashi, M.; Nagai, S. Inhibition of the Fermentation of Propionate to Methane by Hydrogen, Acetate, and Propionate. Appl. Environ. Microbiol. 1990, 56, 719–723. [Google Scholar] [CrossRef]
  50. Cazier, E.A.; Trably, E.; Steyer, J.-P.; Escudie, R. Reversibility of Hydrolysis Inhibition at High Hydrogen Partial Pressure in Dry Anaerobic Digestion Processes Fed with Wheat Straw and Inoculated with Anaerobic Granular Sludge. Waste Manag. 2019, 85, 498–505. [Google Scholar] [CrossRef] [PubMed]
  51. Hu, Y.; Wang, X.; Zhang, S.; Liu, Z.; Hu, T.; Wang, X.; Peng, X.; Dai, H.; Wu, J.; Hu, F. Iron-Carbon Micro-Electrolysis Material Enhanced High-Solid Anaerobic Digestion: Performance and Microbial Mechanism. Biochem. Eng. J. 2024, 201, 109132. [Google Scholar] [CrossRef]
  52. Zhu, C.; Qu, R.; Li, X.; Zuo, X.; Yuan, H. Investigates of Substrate Mingling Ratio and Organic Loading Rate of KOH Pretreated Corn Stover and Pig Manure in Batch and Semi-Continuous System: Anaerobic Digestion Performance and Microbial Characteristics. Chin. J. Chem. Eng. 2023, 62, 114–123. [Google Scholar] [CrossRef]
  53. Zhang, X.; Jiao, P.; Zhang, M.; Wu, P.; Zhang, Y.; Wang, Y.; Xu, K.; Yu, J.; Ma, L. Impacts of Organic Loading Rate and Hydraulic Retention Time on Organics Degradation, Interspecies Interactions and Functional Traits in Thermophilic Anaerobic Co-Digestion of Food Waste and Sewage Sludge. Bioresour. Technol. 2023, 370, 128578. [Google Scholar] [CrossRef] [PubMed]
  54. Linyi, C.; Yujie, Q.; Buqing, C.; Chenglong, W.; Shaohong, Z.; Renglu, C.; Shaohua, Y.; Lan, Y.; Zhiju, L. Enhancing Degradation and Biogas Production during Anaerobic Digestion of Food Waste Using Alkali Pretreatment. Environ. Res. 2020, 188, 109743. [Google Scholar] [CrossRef] [PubMed]
  55. De Vrieze, J.; Hennebel, T.; Boon, N.; Verstraete, W. Methanosarcina: The Rediscovered Methanogen for Heavy Duty Biomethanation. Bioresour. Technol. 2012, 112, 1–9. [Google Scholar] [CrossRef] [PubMed]
  56. Savvas, S.; Donnelly, J.; Patterson, T.; Chong, Z.S.; Esteves, S.R. Methanogenic Capacity and Robustness of Hydrogenotrophic Cultures Based on Closed Nutrient Recycling via Microbial Catabolism: Impact of Temperature and Microbial Attachment. Bioresour. Technol. 2018, 257, 164–171. [Google Scholar] [CrossRef] [PubMed]
  57. Wahid, R.; Mulat, D.G.; Gaby, J.C.; Horn, S.J. Effects of H2:CO2 Ratio and H2 Supply Fluctuation on Methane Content and Microbial Community Composition during in-Situ Biological Biogas Upgrading. Biotechnol. Biofuels 2019, 12, 104. [Google Scholar] [CrossRef]
  58. Ashraf, M.T.; Sieborg, M.U.; Yde, L.; Rhee, C.; Shin, S.G.; Triolo, J.M. Biomethanation in a Thermophilic Biotrickling Filter—pH Control and Lessons from Long-Term Operation. Bioresour. Technol. Rep. 2020, 11, 100525. [Google Scholar] [CrossRef]
  59. Luo, G.; Johansson, S.; Boe, K.; Xie, L.; Zhou, Q.; Angelidaki, I. Simultaneous Hydrogen Utilization and in Situ Biogas Upgrading in an Anaerobic Reactor. Biotechnol. Bioeng. 2012, 109, 1088–1094. [Google Scholar] [CrossRef]
  60. Logroño, W.; Popp, D.; Nikolausz, M.; Kluge, P.; Harms, H.; Kleinsteuber, S. Microbial Communities in Flexible Biomethanation of Hydrogen Are Functionally Resilient Upon Starvation. Front. Microbiol. 2021, 12, 619632. [Google Scholar] [CrossRef]
Figure 1. Scheme derived from Bellini et al. (2022) [12] representing in situ (a) and ex situ (b) biomethanation.
Energies 17 02490 g001
Figure 2. Parent reactor used as source of inoculum.
Energies 17 02490 g002
Figure 3. Design of the experiment to study OLR impact on in situ biomethanation performance.
Energies 17 02490 g003
Figure 4. (A) The methane yield (blue bars) and OLR (red dots) and (B) VS concentrations in the semi-continuous AD reactor. The orange squares in A represent the moment when the digestate was collected to be used as an inoculum for the biomethanation batch tests. VS stands for volatile solids and OLR for organic loading rate.
Energies 17 02490 g004aEnergies 17 02490 g004b
Figure 5. Specific and volumetric hydrogen consumption rates for (A) in situ and (B) ex situ biomethanation tests at increasing OLRs. COD stands for chemical oxygen demand, VS for volatile solids, and OLR for organic loading rate. Bars sharing the same letter at the top are not statistically different in terms of hydrogen consumption rate.
Energies 17 02490 g005
Figure 6. Cumulative COD mass balances for the test at (A) 1.25 g VS/L/d and (B) 3.25 g VS/L/d. Data for hydrogen, methane, and VFAs at the beginning (initial) and at the end (final) of the batch tests are provided. Results are shown for in situ biomethanation, AD, ex situ biomethanation, and endogenous tests. OLR stands for organic loading rate, COD for chemical oxygen demand, AD for anaerobic digestion, and VFA for volatile fatty acid.
Energies 17 02490 g006
Figure 7. Relative abundance of archaea at genus level; higher OLR leads to a higher abundance of Methanospirillum, which is a hydrogenotrophic methanogen.
Energies 17 02490 g007
Table 1. Operating condition of the parent reactor at HRT = 21 days.
Substrate Concentration (g VS/L)OLR (g VS/L/d)
26.251.25
36.751.75
47.252.25
57.752.75
68.253.25
Table 2. Diversity and richness indexes at each OLR for archaea community.
OLRShannonACEInvSimpson
1.251.3231.712.76
1.751.5833.163.39
2.251.6635.073.90
2.751.7636.044.47
3.251.7037.013.63
Table 3. Volumetric hydrogen consumption rates for the 1st and the 2nd injections (pulses) at increasing OLRs. OLR stands for organic loading rate, VS for volatile solids, and COD for chemical oxygen demand.
OLR (g VS/L/d)rH2 (mg COD/L/h)
In-Situ 1st Pulse
rH2 (mg COD/L/h)
In-Situ 2nd Pulse
1.2535 ± 444 ± 11
1.7561 ± 757 ± 6
2.2549 ± 173 ± 5
2.7557 ± 585 ± 12
3.2568 ± 867 ± 7
Disclaimer/Publisher’s Note: The statements, opinions and data contained in all publications are solely those of the individual author(s) and contributor(s) and not of MDPI and/or the editor(s). MDPI and/or the editor(s) disclaim responsibility for any injury to people or property resulting from any ideas, methods, instructions or products referred to in the content.

