Abstract
Hydrogen energy is regarded as an ideal solution for addressing climate change issues and an indispensable part of future integrated energy systems. The most environmentally friendly hydrogen production method remains water electrolysis, where the electrolyzer constructs the physical interface between electrical energy and hydrogen energy. However, few articles have reviewed the electrolyzer from the perspective of power supply topology and control. This review is the first to discuss the positioning of the electrolyzer power supply in the future integrated energy system. The electrolyzer is reviewed from the perspective of the electrolysis method, the market, and the electrical interface modelling, reflecting the requirement of the electrolyzer for power supply. Various electrolyzer power supply topologies are studied and reviewed. Although the most widely used topology in the current hydrogen production industry is still single-stage AC/DC, the interleaved parallel LLC topology constructed by wideband gap power semiconductors and controlled by the zero-voltage switching algorithm has broad application prospects because of its advantages of high power density, high efficiency, fault tolerance, and low current ripple. Taking into account the development trend of the EL power supply, a hierarchical control framework is proposed as it can manage the operation performance of the power supply itself, the electrolyzer, the hydrogen energy domain, and the entire integrated energy system.
1. Introduction
The future energy system demands high stability, high efficiency, and carbon neutrality [1,2,3,4]. Hydrogen energy has gained widespread attention worldwide due to its rich sources, its ecological friendliness, its high calorific value, its diverse storage and transportation methods, and its diverse application scenarios. As a zero-carbon energy carrier, hydrogen energy plays an increasingly important role in addressing the problem of climate change [5]. According to the production methods, the hydrogen energy is classified mainly as grey hydrogen, blue hydrogen, and green hydrogen. The hydrogen energy produced through the conversion reaction of fossil fuels is called grey hydrogen due to the production of certain carbon emissions during the process; the hydrogen energy obtained by extracting carbon using technologies such as carbon capture and carbon sequestration (CCUS) based on grey hydrogen is called blue hydrogen; and hydrogen production through electrolysis of water using renewable energy sources such as photovoltaic and wind power is known as green hydrogen, which produces almost no greenhouse gas during the process [6]. Green hydrogen is the most ideal form for hydrogen energy use, but because of its high technical threshold and cost, further development is needed to achieve large-scale applications. Blue hydrogen, as a transitional technological means, can accelerate the development of a green hydrogen society. Due to its low production cost and mature technology, grey hydrogen is still the most common hydrogen production method at present [7].
For national or regional entities, the reduction in carbon emissions, the assurance of energy security, and the achievement of economic growth are the main driving forces for the development of hydrogen energy. Many countries have provided official policy support. For example, China positions hydrogen energy as an important component of the future national energy system and a crucial carrier for energy terminals to achieve a green and low carbon energy transformation [8]. The United States regards hydrogen energy as a strategic reserve technology and maintains competitiveness through continuous technological research and development and the creation of centralised fuel cell (FC) demonstration applications in California [9]. European countries view hydrogen energy as an important carrier for deep decarbonisation and the achievement of clean energy transformation. In addition, they are continually expanding the application of clean hydrogen energy in industries, construction, and other fields to accelerate the reduction in carbon emissions [10,11,12,13]. The main driving force for Japan’s development of hydrogen energy is to achieve a diversified energy supply and ensure energy security [14]. Based on energy security and low-carbon development, South Korea plans to make hydrogen energy the third largest industry with global strategic competitive advantages after displays and semiconductors and promote economic growth through the global output of FC technology [15]. Traditional energy-exporting countries such as Australia, Russia, and Saudi Arabia hope to achieve economic growth through hydrogen energy exports [16,17]. Table 1 summarises the policy documents of some countries for the development of hydrogen energy.

Table 1.
Policies on hydrogen energy.
The hydrogen energy industry chain covers multiple aspects of industry and civilization [18], as presented in Figure 1. Downstream of the industrial chain is the field of application, including hydrogen FC transportation, industry, energy storage, and building heating–power cogeneration. The middle layer includes hydrogen storage and transportation. Hydrogen can be stored as high-pressure gaseous, low-temperature liquid, organic liquid, and solid materials. Among them, gaseous hydrogen is currently the main storage method and can be transported using long tube trailers for short-distance and small-scale scenarios, and pipeline transportation, which has a large volume and low operation cost, but the construction investment is large.
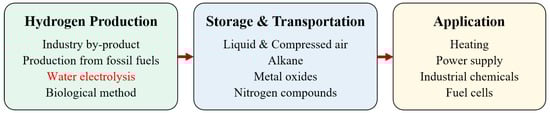
Figure 1.
Industrial chain of hydrogen energy.
The upstream chain of the hydrogen energy industry chain mainly includes fossil energy reforming, industrial by-product gas, water electrolysis (WE), and other technologies in the experimental stage. Among them, fossil energy reforming is currently the most popular method for hydrogen production, with the lowest cost but emitting a significant amount of carbon dioxide; hydrogen production from industrial by-product gas cannot be applied as a centralised source of hydrogen supply. The process of WE has no carbon emissions, currently accounting for a relatively low proportion, as the cost is higher than the other methods [18]. However, WE becomes increasingly attractive, as the process can effectively absorb fluctuating power electricity such as wind and photovoltaic power.
The electrolyzer (EL) is the key equipment and is the interface between electrical energy and hydrogen energy in the WE process. Most of the currently published reviews related to EL focus mainly on the principle of the electrolytic reaction and the effect of catalysts in the chemical domain, e.g., [19,20,21,22,23,24]. Few papers focus on the coupling of the electrical and chemical domains in the EL and analyse the power supply of the electrolytic cell from the perspective of power electronic topology and integrated energy system control. Some conventional DC/DC converter topologies are summarised in [25,26], yet not all of them are specially designed for the EL. Although the voltage step-down ratio and the output current ripple are compared with respect to the duty cycle, all converters are controlled by classical pulse width modulation (PWM). The comparison results in [25,26] are not applicable to other widely applied topologies, such as resonant converters, which are usually regulated by a soft-switching control algorithm. Furthermore, these reviews focus only on the control of the power supply itself, ignoring the influence of other components in the EL and the coordinated operation of the whole integrated energy system. The characteristics of other reviews on ELs are summarised in Table 2. The pros and cons of the review are highlighted with bullet point symbol and lozenge symbol, respectively.
Table 2.
Characteristics of other related reviews on ELs.
Compared to the reviews mentioned above, this article studies ELs from the perspective of power supply topologies and control. The requirements of EL for power supply systems are refined through a detailed investigation of polarisation and hydrogen production efficiency modelling. Various types of power supplies, including both conventional PWM-controlled types and novel soft-switching resonant types, are comprehensively reviewed in terms of topology, features, control types, etc. On the basis of the trend of development of the EL and its positioning in the future integrated energy system, the interleaved parallel topology and the hierarchical control framework are proposed to be the ideal choice for EL power supplies. The structure of this review is shown in Figure 2. After a brief introduction to the general background, related policies, and industrial chain of hydrogen energy, the four main WE methods and the status of the EL market are investigated in Section 2. The thermodynamics and electrochemical model, the empirical model and the hydrogen production efficiency model are reviewed, based on which the characteristics requirement of the EL power supply is derived in Section 3. Different types of power supply topologies that meet the requirements of the EL are categorised and analysed in Section 4. The control framework for the EL power supply as part of the future integrated energy system is introduced in Section 5. Finally, Section 6 provides a summary and prospects for future research on the power supply system.
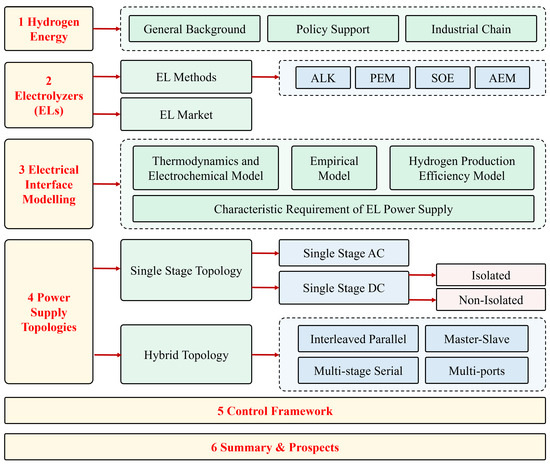
Figure 2.
Structure of this review.
2. Hydrogen Electrolyzer
2.1. Water Electrolysis Methods
Currently, there are four main WE methods, including alkaline (ALK) WE, proton exchange membrane (PEM) WE, solid oxide (SOE) WE, and anion exchange membrane (AEM) WE [19,20]. Among them, ALK WE was the first industrialised, with the most mature technology and industry chain. PEM WE technology has developed gradually in recent years, and its market share has been continuously increasing. Both the AEM WE and SOE WE technologies are still in the laboratory stage, and there is still a certain distance from commercialisation [27].
The principle of ALK WE is presented in Figure 3a. The two electrodes are separated by an airtight diaphragm. To maximise ion conductivity, both the electrode and diaphragm are immersed in a high-concentration ALK liquid electrolyte, with a solute typically KOH or NaOH, and a typical operating temperature range of 70 to 90 degrees Celsius. Water molecules undergo a reduction reaction at the cathode and decompose into hydroxide and hydrogen ions. Hydrogen ions combine with electrons to generate hydrogen gas, which is discharged from the cathode. Hydroxide ions pass through the diaphragm and undergo an oxidation reaction at the anode under the action of an electric field established by the EL power supply, generating oxygen and electrons. As a result of the high concentration of gas products released from the electrode, which can reduce the electrolysis efficiency, it is necessary to use a porous structure and maximise the contact area between the electrode plate and the liquid electrolyte when designing the electrode. During operation, the temperature gradient and precipitation of gases within the electrolyte will promote the flow of electrolytes and establish convective circulation. The movement of this electrolyte helps make the concentration of chemical substances in the electrode pores more uniform, further promotes the precipitation of gas products, and improves the heat transfer rate and the heat dissipation effect of the electrolysis unit. Details about the operating principle of ALK WE can be found in [22]. ALK WE technology is easy to deploy and apply quickly to solve the problem of renewable energy consumption in the near future [28].
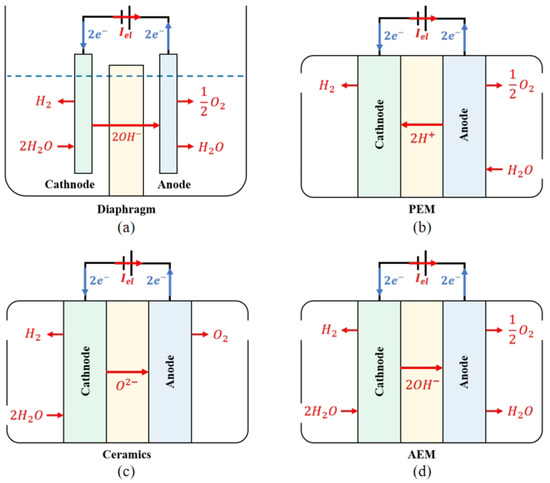
Figure 3.
Scheme of the operating principle of (a) ALK WE; (b) PEM WE; (c) SOE WE; (d) AEM WE.
In the PEM WE process, as presented in Figure 3b, the electrolyte is an airtight, thin PEM. Because of the functional groups of sulfonic acid, the PEM has a cross-linked structure and strong acid properties. These functional groups conduct proton conduction through ion-exchange mechanisms. The EL adopts a bipolar configuration, with a bipolar plate supporting the membrane electrode and the gas diffusion layer to converge the gas and conduct electrons. The membrane electrode component is composed of an electrode made of precious metals such as platinum or iridium and a PEM. During operation, water molecules undergo oxidation reactions at the anode to generate oxygen, electrons, and protons. Oxygen is precipitated at the anode, and electrons are transmitted to the cathode through an electrical circuit. Under the action of the electric field, protons circulate through the PEM to the cathode and react with electrons to synthesise hydrogen. PEM EL uses PEM as solid electrolytes instead of separators and liquid electrolytes in ALK EL and uses pure water as a raw material to avoid potential alkaline pollution and corrosion problems [29].
The operation principle of the SOE EL and the AEM EL are presented in Figure 3c and Figure 3d, respectively. The electrolysis reaction in the SOE EL is performed at a high temperature. In comparison to the electrolysis of water at low temperatures, SOE can theoretically provide a higher energy conversion efficiency. High-temperature water vapour reacts at the cathode of SOE EL, and water molecules obtain electrons to generate hydrogen and ionise oxygen ions. Oxygen ions are directed to the anode in an electrolyte composed of conductive ceramic materials and oxidised to form oxygen. In AEM EL, water molecules participate in the reducting reaction on the cathode side to obtain electrons and generate hydroxide ions and hydrogen. After reaching the anode through AEM, hydroxide ions participate in the oxidation reaction to lose electrons and generate water and oxygen. Similar to ALK, a certain amount of alkaline solution is needed to add to the AEM electrolyte to improve efficiency. Table 3 compares ALK, PEM, and SOE methods in terms of reaction equations, single device capacity, current density, power consumption efficiency, hydrogen purity, operation temperature, dynamic response speed, and development status. Since only a few companies are trying to commercialise AEM EL, relevant data are relatively scarce, so AEM is not involved in the discussion.
Table 3.
Comparison of alkaline (ALK), proton exchange membrane (PEM), and solid oxide (SOE) water electrolysis (WE) methods (data collects from [19,20,21,22,23,24,27,28,29,30,31,32]).
ALK ELs are suitable for large-scale hydrogen production thanks to its mature development status and large device capacity [30]. However, the diaphragm used in ALK EL is made of porous material, making the gas easy to penetrate and causing high electrical energy loss. Load changes can also cause an imbalance in the pressure of the electrode, increasing the risk of explosion as a result of excessive hydrogen permeation. ALK electrolytes will react with carbon dioxide in the air to form insoluble carbonates, hindering the convective transfer of products and reactants and affecting the electrolysis efficiency. The dynamic response of ALK ELs is usually in several minutes, making it difficult to cooperate with high-volatility renewable energy generation, such as wind or solar energy generation.
The PEM is thinner and has a stronger proton conductivity compared to that of the diaphragm used in the ALK EL. The internal structure of the PEM EL is more compact, which helps reduce the ohmic resistance. The hydrogen gas generated in PEM EL will not introduce alkali mist, which is beneficial for improving the quality of the hydrogen gas [31]. More importantly, the gas permeability of PEM is low, helping to prevent the cross-permeation of hydrogen and oxygen gases, ensuring the purity of the product and the safety of the operation of the equipment [32].
With the increase in temperature, the demand of electrolysis reaction for temperature increases, but the demand for electrical energy decreases. SOE can make full use of heat energy when operating at high temperature, thus reducing the consumption of electrical power. Therefore, the power consumption efficiency of the SOE EL is higher than that of ALK and PEM. However, the operating temperature of up to thousands of degrees Celsius also limits the development of the SOE hydrogen production scenario. In addition, the start–stop dynamic response time of SOE is very slow and is difficult to deploy in a system powered by renewable energy. At present, SOE EL products have not been commercialised.
In general, PEM EL is smaller, more compact and scalable than ALK EL, with higher current density, efficiency, hydrogen purity, faster response speed, and better compatibility with distributed energy generation such as wind and solar power [33]. Even though SOE EL performs better in current density and power efficiency in a laboratory experiment, these advantages have not been further verified by the industry, and it takes decades for commercialisation. PEM EL is a better choice for coordination with increasingly penetrating renewable energy. Currently, the disadvantage of PEM lies in its device cost, but it is expected to be further reduced with the development of FCs as PEM EL and PEM FC share most supply chains [21,34].
2.2. EL Market
The EL market today is dominated by ALK ELs and PEM ELs. Geographically, most EL manufacturers are located in western Europe, the United States, and China [35,36]. Table 4 summarises the annual EL production capacity of the main manufacturers and their market share for 2022 and 2023. The global production capacity of ELs in 2022 is 15.4 GW. In 2023, the production capacity is approximately doubled, reaching more than 31 GW.
Table 4.
Annual electrolyzer (EL) manufacturing capacity (data collects from [35,36,37]).
From the perspective of the EL type, the proportion of ALK EL in 2022 was 72.1%. Although its capacity increases by 80.2% in 2023, the proportion of ALK EL decreased to 64.3% due to the higher growth rate of the PEM EL capacity (158.1%). Due to the longer development history and more mature technology of ALK EL, there are more new manufacturers in 2022 than in 2023. Relatively speaking, the technical threshold of PEM EL is relatively high, and there are few new manufacturers, but many manufacturers that master PEM technology have greatly increased their production capacity owing to the advantages of research and development, such as Plug Power, ITM Power, Ohmium, Cummins, and Siemens Energy. The technical level of PEM EL is developing rapidly in response. The annual global manufacturing capactity of ELs is expected to increase to 242 GW by 2030, and PEM EL will account for the largest market share [35,36,37].
As presented in Figure 1, the EL is located in the upper part of the hydrogen energy industry chain, and its production capacity will be affected by the level of development in the middle and lower reaches of the industrial chain, especially the application of hydrogen energy. With the development of hydrogen energy in the automotive and chemical industries, the market demand for ELs will also continue to increase. At present, the cost of WE hydrogen production is higher than that of grey hydrogen production, and the development of ELs also depends on the strength of the policy support. The promotion of the carbon market and the further maturation of the new energy generation support facilities are conducive to the expansion of the market share of ELs. Under the guidance of zero-carbon policies, fossil energy is facing more stringent carbon emission restrictions, and EL benefits from its zero carbon emissions in the whole process, which will occupy a more important position in the global energy industry.
3. Electrical Interface Modelling of EL
3.1. Thermodynamics and Electrochemical Models
In the thermodynamic model of WE, the change in enthalpy , the change in entropy , and the change in Gibbs free energy of the water decomposition reaction are expressed as [38]
where T is the temperature.
Under standard conditions (25 degrees, 1 bar), the decomposition of water is a nonspontaneous reaction, which means that the change in Gibbs free energy is positive. The total energy required for water electrolysis is equal to the enthalpy change , which is related to the thermal equilibrium voltage :
where z is the number of electrons transferred in the reaction ( when producing 1 mole of hydrogen), and F is the Faraday constant (F = 96,485 C/mol). The thermal equilibrium voltage varies with temperature and pressure. Under standard conditions, = 1.482 V. Electrolytic reactions only occur when the voltage is higher than the thermal equilibrium voltage [39].
Electrochemical modelling is the core of EL modelling [23]. Various electrochemical models for ELs that consider different factors, such as temperature and pressure, are thus far proposed. Among these models, the polarisation curve (current-voltage curve) is an important indicator for measuring the characteristics of ELs. This article does not dive into the modelling process in depth but focusses on the electrical parameter related to the design of the EL power supply. In most electrochemical models, the electrolysis unit voltage is mainly composed of reversible voltage , activation overpotential , and ohmic overpotential [24]:
The input voltage of the EL port with n units connected in series is
The derivation of the reversible voltage and the activation overpotential in the ALK EL modelling is the same as in the PEM EL modelling. is the minimum unit voltage required to achieve electrolysis conditions of water [40], determined by
Under standard conditions, = = 1.229 V. The reversible voltage considering the influence of actual working temperature and pressure is given by the Nernst Equation [41]:
where R is the gas constant, represents the water activity, and and are the partial pressures of hydrogen and oxygen, respectively.
The energy loss during the transfer of charge from the reactor to the electrode is the activation energy, which can be reduced by using appropriate catalysts. The activation overpotential is caused by an electrochemical reaction and is related to the activation energy. increases logarithmically with current density and is strongly correlated with the electrocatalytic activity of the electrode material. In most cases, the activation overpotential of the anode is higher than that of the cathode. Assuming that the concentration of substances on the surface of the electrolyte and electrode is the same and that the charge transfer coefficients of the cathode and anode are equal, the activation overpotential can be approximately derived from the electrochemical reaction kinetics equation:
where represents the exchange current density of electrode k; is the charge transfer coefficient.
During the reaction process of ALK EL, electrons will first be transferred to the cathode through the electrode plate, and a reduction reaction will occur on the surface of the cathode. Then, the hydroxide ions generated pass through the electrolyte and are transferred from the membrane to the anode, thereby participating in the oxidation reaction. Therefore, the ohmic resistance in ALK ELs can be divided into anode resistance , cathode resistance , electrolyte resistance , diaphragm resistance , and bubble resistance based on the migration paths of electrons and ions [42,43]:
where
(1) The electrode resistance is usually calculated by the conductivity of the anode and cathode:
where the subscripts a and c represent the anode and cathode, respectively; and represent cross-sectional areas; and represent electrode thickness; and and represents the electrode conductivity.
(2) The electrolyte resistance is calculated as follows:
where and are the gaps between the electrode and the diaphragm, and reducing the electrode gap helps to reduce the electrolyte resistance. represents the conductivity of the electrolyte, which increases monotonically with increasing temperature, while there exists a maximum point as the molar concentration increases. This means that for each temperature, there is an optimal molar concentration that maximizes ion conductivity, and the optimal molar concentration value will gradually increase with increasing temperature.
(3) The resistance of the diaphragm is related to its own structural characteristics and electrolyte conductivity:
where is the thickness of the diaphragm, is the porosity of the diaphragm, represents the curvature of the diaphragm, and is the cross-sectional area of the diaphragm. The relationship between the porosity and curvature of porous membranes is shown in the following equation.
The diaphragm resistance can also be approximated as a function of its own thickness and conductivity.
and
where represents the conductivity of the diaphragm, and represents the humidity of the diaphragm, which describes the concentration of water in the membrane.
(4) The bubble resistance can be expressed as
where is the bubble coverage rate used to estimate the impact of bubbles on the electrode surface, which can be represented by the effective electrode surface area and the total electrode surface area S:
In different parts of the conductive circuit of the PEM EL, the PEM film has the smallest conductivity, so the ohmic overpotential can only consider the influence of the film resistance, as described by Equation (13). Some articles also consider the electrode impedance [20], and the equivalent resistance can be written as
3.2. Empirical Model
Empirical models can more intuitively describe the relationship between the voltage and current in the EL, helping in the design of efficient and high-quality power supply systems [44]. The empirical model of ALK EL widely used at a given temperature is [45,46]
where r is a parameter related to ohmic resistance, and s and t are the electrode overpotential coefficients. Considering the influence of temperature on the overpotential, the relationship between the electrolytic current and electrolytic unit voltage can be further refined. Based on the above equation, the corrected empirical model is
A systematic strategy for obtaining the optimal parameters in Equation (19) is developed in [47]. The parameters of the polarisation curve and their values are summarised in Table 5. Figure 4 presents the comparison of ALK cell voltage derived from the empirical model Equation (19) and experiment data from [47], verifying that the empirical modelling can basically fit the measured results.
Table 5.
Polarisation curve parameters of the empirical model.
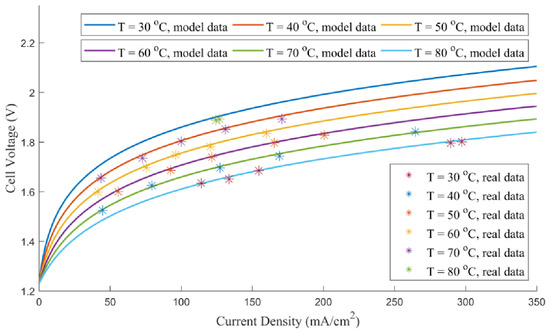
Figure 4.
Comparison of ALK cell voltage derived from empirical model and experiment; data taken from [47].
In addition, a first-order linear function is proposed as a a simple empirical model for PEM EL [48]:
where k and b represent the slope and the intercept, respectively.
Figure 5 presents the polarisation curve developed from the electrochemical model based on the results in [24,49]. Cell voltage is separated into several parts, including reversible potential and various overpotentials, as demonstrated by Equation (3). In comparison, the empirical model, Equation (20), is plotted with a red dashed line in the same figure. The parameters applied, k and b, are also summarised in Table 5. The empirical model fits the electrochemical model very well in high current density, though it is not very accurate when the current density is low.
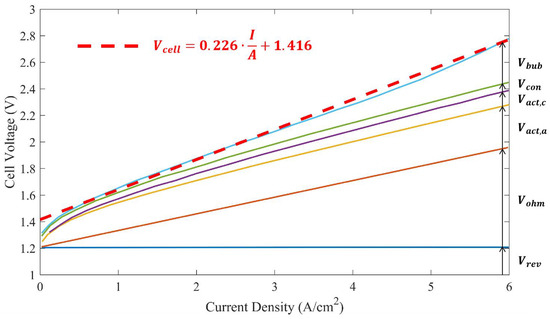
Figure 5.
Comparison of PEM cell voltage derived from thermodynamic model and empirical model; data taken from [24,49].
3.3. Hydrogen Production Efficiency Model
Most of the input current of the EL is consumed during the electrolysis reaction, whereas a small portion of the current is bypassed through the electrolyte pathway because of the conductivity of the electrolyte. These bypass currents are referred to as parasitic currents, which can reduce efficiency. The loss of efficiency caused by the parasitic current is usually represented by the Faraday efficiency (or current efficiency), which is defined as the ratio of actual hydrogen production to theoretical hydrogen production. The parasitic current is positively correlated with temperature but negatively correlated with current density, whereas the Faraday efficiency is the opposite. The empirical model of the Faraday efficiency is constructed by the electrode area A and empirical coefficients and [47].
The Faraday efficiency curve of an ALK EL developed by Equation (21) with parameters listed in Table 6 is presented in Figure 6. The Faraday efficiency increases to close to 98% with increasing current density. A high temperature results in a drop to some extent in the Faraday efficiency.
Table 6.
Efficiency curve parameters.
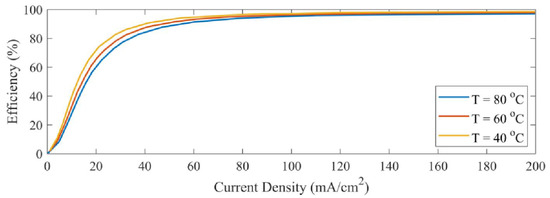
Figure 6.
Faraday efficiency curve of an ALK EL; data taken from [47].
According to Faraday’s law, the rate of hydrogen generation in an EL is directly proportional to the transfer rate of electrons on the electrode, which in turn is equivalent to the current provided by the power supply. Therefore, the total rate of hydrogen production in an EL composed of several serial connected cells can be expressed as
Some other indicators that can be used to evaluate the electrolysis efficiency of ALK EL are summarised in [23], including energy efficiency, voltage efficiency, and thermal efficiency. The overall efficiency trend of the PEM EL related to the current density and temperature is presented in [50]. Figure 7 compares the Faraday efficiency and the overall efficiency curves of a PEM EL based on the results in [24]. The overall efficiency gradually decreases with increasing current density if current density is higher than a certain optimal point.
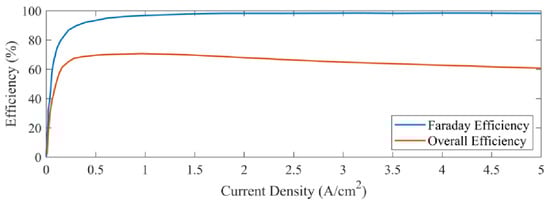
Figure 7.
Faraday efficiency and overall efficiency curves of a PEM EL [24].
Research on improving electrolysis efficiency includes the following aspects [50]:
- Improving operating conditions, including the application of forced electrolyte flow and increasing reaction temperature and pressure;
- Improve the structure of ELs, such as zero gap ELs, membrane free ELs, etc.;
- Optimise diaphragm materials;
- Improve catalyst effectiveness;
- Change the physical field of operation.
3.4. Characteristic Requirements of EL Power Supply
The design objective of the EL power supply is to maximise electrolysis efficiency, improve hydrogen production purity, and extend the lifetime while meeting the polarisation curve of the EL.
The input voltage of the EL is related to the current density and temperature. According to the polarisation curve model, as the current density increases, the voltage at the EL port increases. If the current density remains unchanged, the port voltage decreases as the temperature increases. During the hydrogen production process, the electrolysis current changes within a certain range, and the port voltage also changes accordingly. Therefore, the output voltage of the electrolysis cell power supply needs to be adjustable within a certain range.
At a certain temperature, there exists a maximum point for electrolysis efficiency with respect to the input current density, for example, the energy efficiency is highest at a current density of approximately 0.5 A/cm2 in a PEM EL. The hydrogen production rate is positively correlated with the current density. Therefore, it is necessary to adjust the input current according to the requirements of the system for electrolysis efficiency and hydrogen production rate [51].
The ripple of the electrolytic current can cause fluctuations in the production of hydrogen per unit of time, increasing the ohmic polarisation resistance of PEM ELs and affecting their lifetime. At the same time, components such as hydrogen and oxygen separators and compressors will frequently operate with fluctuations in gas production, resulting in poor system stability. To maximise the comprehensive performance of the EL, the electrolytic current ripple needs to be small enough.
In summary, the demand for power supply in electrolytic reactions is as follows: the output DC voltage is controllable within a certain low voltage range; the output current density is large enough and adjustable; and the output current ripple is small enough. In addition, the EL power supply should also meet the requirements of general industrial power supply: low cost, high efficiency, and high reliability.
4. Topologies of the EL Power Supply
Based on the performance requirements summarised above, many investigations have been conducted on the topology and control methods of the EL power supply. In the early days, the power supply system was mostly relying on the power grid. With the development of distributed energy resources, such as photovoltaic and wind power generation, many research projects have focused on the coupling of WE hydrogen production and the distributed energy system.
4.1. Single-Stage AC Source-Based Topologies
In a single-stage AC source-based topology, AC power is converted to DC power by rectification. The early ALK EL was developed primarily from industrial chlor-alkali ELs, and the power supply topology also inherited the high-current power supply topology of industrial electrolysis [52]. Due to the high current capacity that thyristors (SCRs) can withstand, rectifier circuits composed of thyristors are often used in power supply scenarios with thousands of amperes. A typical six-pulse thyristor rectifier is presented in Figure 8. By controlling the trigger angle of the six thyristors, a certain range of adjustable DC voltage can be obtained on the output side. Ref. [53] provides a detailed introduction to the modelling and operation principles of this topology. The six-pulse thyristor rectifier has low device losses. But its harmonics are too high and the current ripple is large, which affects the electrolysis efficiency and the lifetime of the EL [54]. Furthermore, the six-pulse thyristor rectifier generates significant reactive power, which also reduces the power quality of the AC power grid [55].
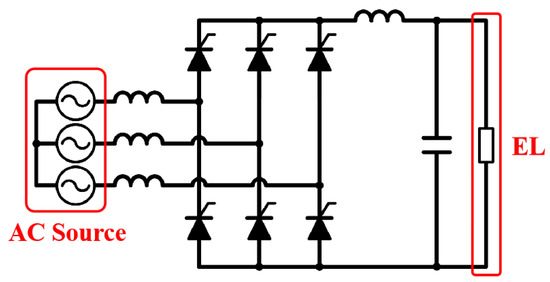
Figure 8.
The six pulse thyristor rectifier investigated in [53].
Two six-pulse rectifiers are commonly used in industry to form a 12-pulse thyristor rectifier, as presented in Figure 9. Co-ordinate control of the conduction angle is required to improve the power factor and reduce harmonics [56]. Many products further increase the number of connected 6-pulse rectifiers to form 18- or 24-pulse rectifiers, to achieve a higher power factor and current quality. However, the reactive power is caused by the changing conduction angle, and it is impossible to eliminate the reactive power from the perspective of control. In actual thyristor rectifier systems, it is generally necessary to design additional reactive power compensation devices on the grid side [57].
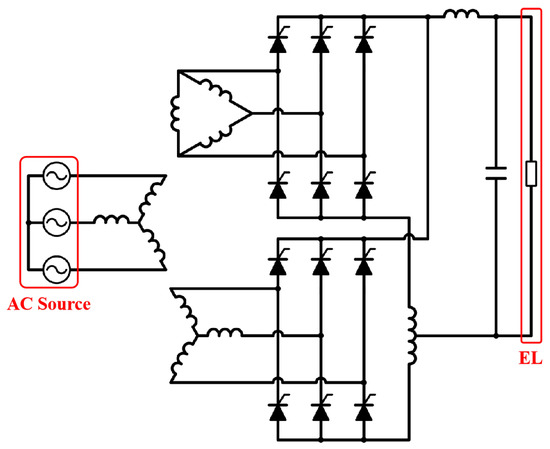
Figure 9.
The twelve-pulse thyristor rectifier investigated in [58].
The development of fully controlled power electronic semiconductors, such as Insulated Gate Bipolar Transistors (IGBTs) and Metal Oxide Semiconductor Field Effect Transistors (MOSFETs), has led to more applications of PWM converters in high-power scenarios. The EL can be powered by a current source PWM rectifier, as presented in Figure 10. IGBTs or MOSFETs are usually connected in series with diodes to block the bidirectional voltage [59]. By adopting the corresponding control strategies, the unit power factor and the grid side current can be sinusoidal, so the harmonics fed into the grid can be reduced [60]. In addition, current-source PWM rectifiers are able to regulate a wide range of DC voltage with direct current control and fast dynamic response. A detailed overview of the mathematical modelling and control strategies of current-source PWM rectifiers is provided in [61].
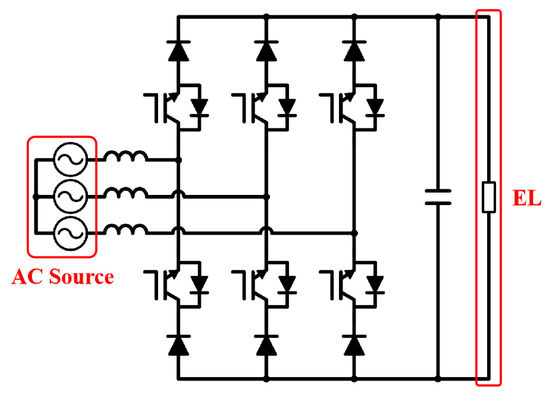
Figure 10.
The three-phase current source PWM rectifier investigated in [59].
Reference [62] compares the effects of 6-pulse thyristor rectifiers, 12-pulse thyristor rectifiers, and current source PWM rectifiers on the energy consumption of the megawatt level ALK EL based on an ideal DC source. The results show that at an operation point of 200 V 5000 A, the current source PWM rectifier has a 14% lower energy loss than the 6-pulse thyristor rectifier and a 9.2% higher energy loss in the EL than the 12-pulse thyristor rectifier. The impact of different AC power supply topologies on the Faraday efficiency and the impact of harmonics on the lifetime of ELs still need further exploration.
4.2. Single-Stage DC Source-Based Topology
When a DC coupling system, such as a photovoltaic or battery energy storage system, supplies power to an EL, a DC/DC converter is required to convert the DC bus voltage into a stable low voltage. DC/DC converters for ELs are mainly buck type and can be divided into two categories: non-isolated topology and isolated topology.
4.2.1. Non-Isolated DC/DC
The classic buck converter, as shown in Figure 11, is the most widely used non-isolated buck DC/DC topology due to its advantages, including few switching devices, low cost, and simple control. The output voltage is regulated by controlling the duty cycle of the power semiconductor. Increasing the switching frequency or increasing the output inductance can reduce the ripple of the output current. In [63], an experimental and simulation model was constructed using photovoltaic panels to supply power to PEM ELs through a buck converter, and the modelling process was detailed for each part of the system. However, the step-down ratio of the buck converter is limited. When generating a low output voltage, the duty cycle becomes very small, and the inductor current operates in the intermittent mode. Measures to reduce the current ripple will inevitably increase switch losses and the volume of inductance. These shortcomings limit the development of classic buck converters as the EL power supply.
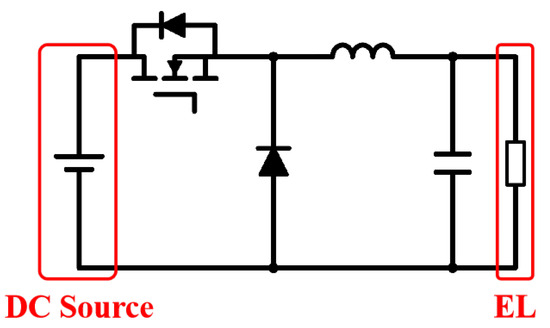
Figure 11.
The classic buck converter investigated in [63].
To improve the voltage ratio and achieve a wider voltage regulation range than the classic buck converter, a power supply based on the quadratic buck converter is designed in [64], as shown in Figure 12. The corresponding sliding-mode feedback control methods are also proposed to respond quickly to changes in the hydrogen production rate. Under the same parameters, the current ripple of the quadratic buck converter is smaller than that of the classical buck converter, but the voltage stress of the semiconductor is higher. To improve the performance of quadratic buck converters, three improved quadratic buck topologies based on circuit synthesis are proposed in [65]. If the semiconductor encounters an open circuit fault, the topology can be reconfigured as a semi-quadratic buck-boost converter, improving the stability of the EL power supply system.
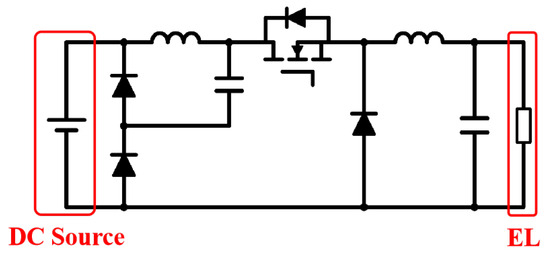
Figure 12.
The quadratic buck converter investigated in [64].
In [66], a synchronous buck converter is applied to convert the 12 V voltage output of the photovoltaic panel to a 2 V, 25 A DC output. The topology is presented in Figure 13. Compared to the classic buck converter, the synchronous buck converter applies another MOSFET to replace the diode. Power efficiency is effectively improved because the conducting resistance of the MOSFET is much lower than that of the diode. The study [66] derived a universal transfer function for the non-linear load of the EL and analysed the stability of the system under different operating conditions. However, synchronous buck converters cannot significantly improve the voltage drop ratio compared to classical buck converters.
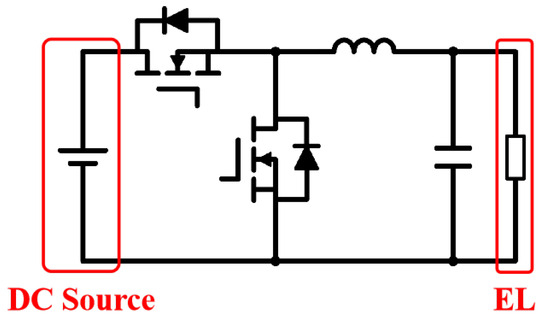
Figure 13.
The synchronous buck converter investigated in [66].
Compared to the two-level buck converter, the voltage stress of the power switches in the three-level buck converter shown in Figure 14 is only half of the input voltage. Under the same switching frequency and converter parameters, the current ripple can be halved, and the capacitance and inductance in the output filtering circuit can be reduced. In [67], the author analysed the operation principle and the parameter design process of a three-level buck converter in detail and developed a 200 V, 7200 A DC power supply for the EL. The experimental results show that this topology can meet the requirements for low-voltage and high-current outputs and reduce the ripple of the output current within 4%. However, the number of switching devices used in a three-level buck topology is twice that of classical buck converters, making the system relatively complex and the controller design more difficult.
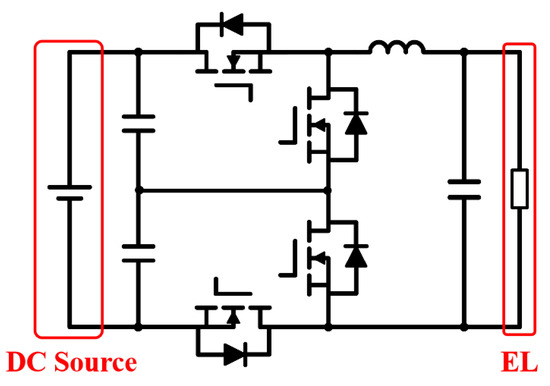
Figure 14.
The three-level buck converter investigated in [67].
In addition to the commonly used buck converters mentioned above, ref. [25] also summarises non-isolated DC/DC topologies including the double-quadratic buck converter [68], the tapped-inductor buck converter [69], the tapped-inductor buck converter with a lossless clamp [70], the buck converter with switched inductor cell [71], and the switch capacitor/switch inductor buck converter [72]. Although these topologies have made some performance improvements compared to classical buck converters, their structures are more complex, and their application scope is relatively limited.
4.2.2. Isolated DC/DC
The isolated DC/DC converters not only achieve electrical insulation between the power supply side and the EL side but also widen the voltage regulation range by implementing appropriate transformer ratios.
In [73], a 5 kW EL power supply is proposed based on a push–pull isolation DC/DC converter powered by a photovoltaic panel, as shown in Figure 15. The primary side of the push–pull topology is constructed with only two low-side switches. Therefore, the driving circuit is easy to design. There is no need for bulky and expensive input equalising capacitors. Within the power range of 5 kW, air-cooled heat dissipation can be applied, and a simple PWM control scheme can be used for control. The system has strong stability and a fast dynamic response. The main limitations of applying push–pull isolated DC/DC to an EL power supply include hard switching leading to low efficiency, high voltage stress of the primary side power switches, and complex centre-tap transformer design. Ref. [73] provides a detailed introduction to the component parameter design process such as power filters and transformers for ELs. The efficiency of the final prototype is greater than 90%.
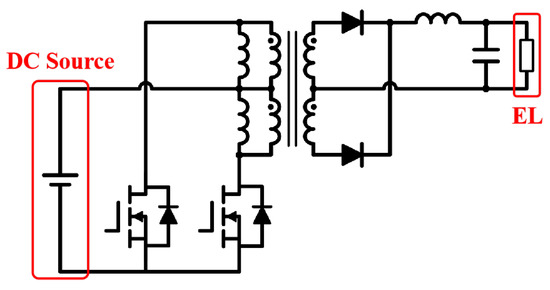
Figure 15.
The push–pull isolated DC/DC investigated in [73].
In high-power EL systems, a more widely used topology is full-bridge and half-bridge isolated DC/DC. Ref. [74] proposed a phase-shift full-bridge (PSFB) zero-voltage switching converter based on PWM control, as shown in Figure 16. In the literature, a distributed generation and energy storage system simulation model is built, which verifies the characteristics of stable output voltage and high topology efficiency. Zero-voltage switching (ZVS) is realised by using the phase shift and the resonance of the transformer leakage inductance and the output capacitance of the power semiconductors. The secondary side of the transformer is connected to the current doubler rectifier circuit to reduce the current stress of the diodes and improve efficiency. Ref. [75] studied a similar topology, as presented in Figure 17. The feasibility of PSFB in supplying power to PEM ELs in a DC-coupled system is verified through simulation.
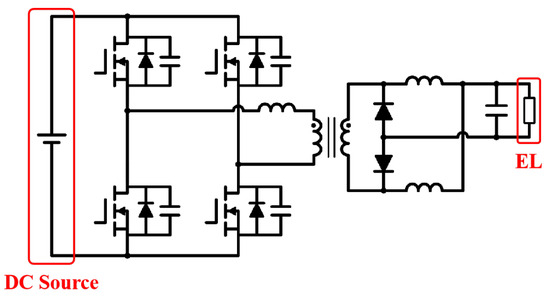
Figure 16.
The phase-shift full-bridge (PSFB) DC/DC investigated in [74].
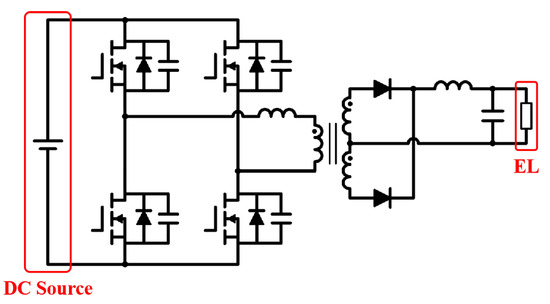
Figure 17.
The PSFB investigated in [75].
A commercially available 6kW ALK EL is applied in [76] to compare the performance of three typical high-frequency soft switching isolated DC/DC topologies through experimental results, including (1) the constant-frequency LCL series resonant converter (SRC) with capacitive output filtering as shown in Figure 18; (2) the fixed-frequency LCL SRC with inductive output filtering as shown in Figure 19; and (3) the phase-shifted PWM full-bridge DC/DC converter as shown in Figure 20. The secondary side of the transformer adopts a diode H-bridge rectification structure. Ref. [76] compares theoretical predictions with the results of the SPICE simulation using the same parameters of the system, and the results show that none of the topologies can maintain ZVS at the maximum input voltage. At the minimum input voltage, only topology (1) maintains ZVS throughout the load variation range. Furthermore, to obtain a high power density and a smaller ripple of the output current, ref. [77] extended the above-mentioned topology (3) to a three-phase configuration. However, the new topology uses more power semiconductors, more complex drivers, auxiliary soft switch components, and more complex control methods; yet the range of soft-switching has not been extended.
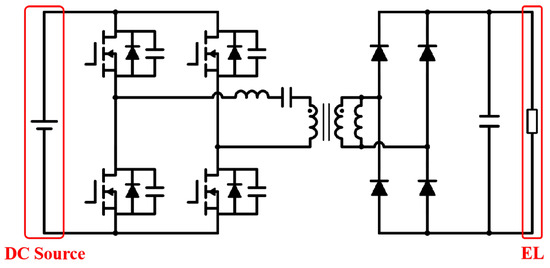
Figure 18.
The constant frequency LCL series resonant converter investigated in [76].
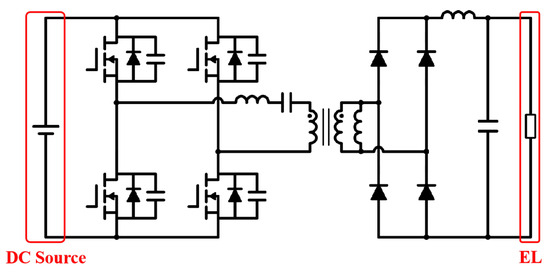
Figure 19.
The fixed-frequency LCL SRC with inductive output filtering investigated in [76].
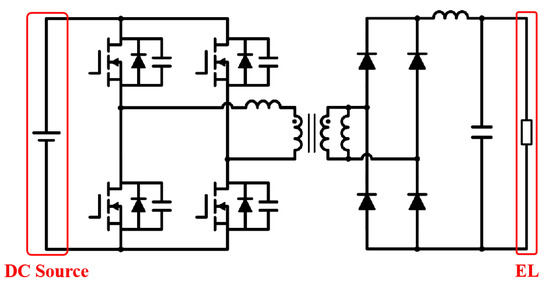
Figure 20.
The phase-shifted PWM full-bridge DC/DC investigated in [76].
Isolated DC/DC based on a half bridge is another potential candidate for the EL power supply, but it also requires complex driving circuits and voltage sharing input capacitors [78]. As presented in Figure 21, the primary side of the transformer is a half-bridge circuit, passed through a high-frequency step-down transformer, and the secondary side is a full-bridge synchronous rectification circuit with reverse blocking switch. Ref. [78] also introduces improved active rectification control algorithms that can reduce circulating power and switching losses, and improve efficiency performance over a wide range of input voltage and load changes. The steady-state operation principle and mathematical analysis provided in the literature can serve as a reference for device selection and parameter design in practical applications.
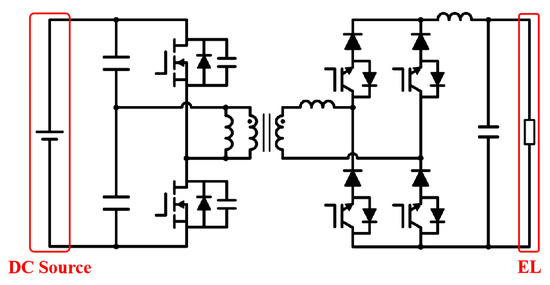
Figure 21.
The isolated half-bridge and full-bridge topology proposed in [78].
4.3. Hybrid Topology
4.3.1. Interleaved Parallel Connection
The power supply system should have sufficient fault tolerance capability to ensure stable and reliable operation of the EL. The interleaved parallel configuration provides redundancy in the power circuit, while also increasing the system current capacity and reducing the current ripple.
The classic interleaved buck converter (CIBC) [79] consists of the classic buck converter, as shown in Figure 22. The literature [80] designs a three-channel CIBC with 120 degree interleaved control signals to power the PEM EL and also proposes a corresponding PWM sliding mode controller to deal with the unstable supply voltage, even if the pressure of the cathode plate changes constantly. Many articles have proposed new topologies with additional active or passive components to improve CIBC performance, including improved step-down conversion ratio IBC [81], improved duty cycle extended IBC [82], winding-coupled IBC [83], zero current transition IBC [84], winding cross-coupled inductors with passive clamp IBC [85], and soft-switching active clamp converter IBC [86]. However, these derivative topologies are more complex and difficult to control. No papers or reports have been found yet on the application of these topologies in EL power supplies. The principles of various derivative topologies are summarised in [26,87]. The detailed introduction of these derivative topologies is not provided in this article due to space limitations; readers can refer to the corresponding literature.
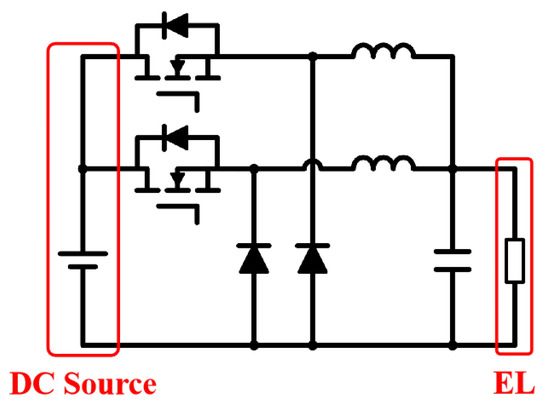
Figure 22.
The classic interleaved buck converter (CIBC) investigated in [79].
The stacked interleaved buck converter (SIBC) shown in Figure 23 has a high step-down ratio and low output current ripple and can be used for direct coupling between renewable energy generation units and ELs [88,89,90]. In [88], the SIBC is theoretically analysed, a controller based on feed-forward and feedback is designed, and the stability of the control system is discussed. In [89], the output DC bus voltage of the wind turbine system is converted by the SIBC to power a PEM EL. The operating state of the SIBC is determined by the output power of the wind turbine system. The system exhibits advantages such as a low output ripple and fast dynamic response. In [90], a dual closed-loop PI controller is proposed to control the terminal current and voltage of the PEM EL. Taking into account the dynamic characteristics of the EL, the controller tracks the output reference voltage and adjusts its output current to deliver the desired power. The state space and the transfer function of the SIBC are also analysed in [90].
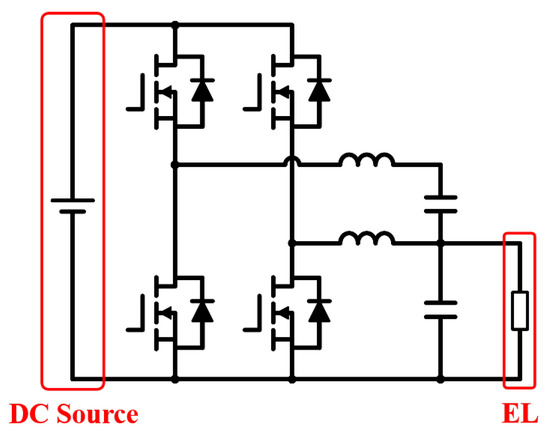
Figure 23.
The stacked interleaved buck converter (SIBC) investigated in [88,89,90].
The three-level interleaved buck converter (TLIBC) has attracted much attention due to its low voltage stress on power switches, low switching loss, and soft switching capability [91,92,93]. The topology is shown in Figure 24. Refs. [91,92] developed an improved sliding mode control algorithm for TLIBC, which reduces the ripple of the output current under fault conditions by approximately 10% by improving the phase angle between the switching signals, thus extending the lifetime of the PEM EL to a certain extent. Ref. [93] conducted in-depth research on the energy efficiency, hydrogen flow rate, and energy consumption ratio of the PEM EL system powered by TLIBC, and proposed a PI-based controller to accurately and rapidly track the reference voltage.
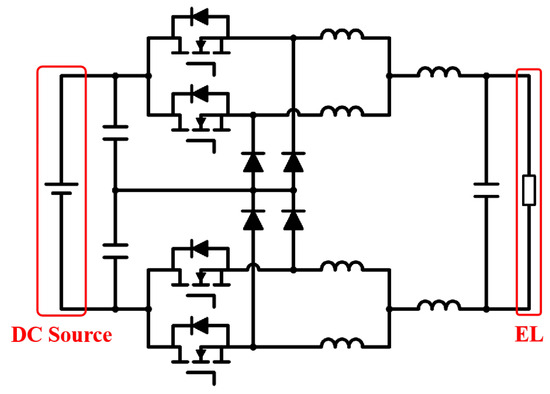
Figure 24.
The three-level interleaved buck converter (TLIBC) investigated in [91,92,93].
Research on isolated DC/DC interleaved parallel topology has also made some progress. In [50], a Y-type three-phase interleaved parallel LLC topology is proposed and improved for the EL power supply. Each phase contains two high-frequency transformers with the primary side connected in series and the secondary side connected in parallel to increase the output current level and reduce the current stress of the power switches, as shown in Figure 25. This structure can meet the needs for distributed energy WE hydrogen production. The experimental results verify the advantages of this topology, such as three-phase automatic current sharing, high current output, low current ripple, wide range output, high voltage conversion ratio, and electrical isolation.
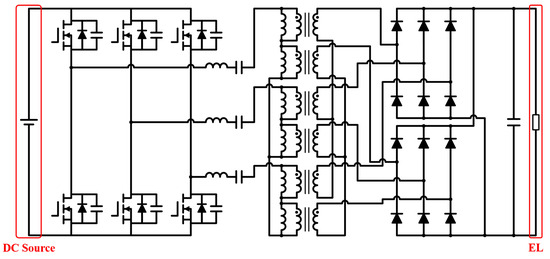
Figure 25.
The Y-type three-phase interleaved parallel LLC converter proposed in [50].
In [94], an input-serial–output-parallel (ISOP) DC/DC converter is proposed, using two LCLCL resonant converters as basic modules, as shown in Figure 26. This paper introduces the principle and characteristics of the converter and also analyses the impact of the inconsistent resonance parameters between the two modules on the imbalance of the electrolysis voltage. On this basis, the corresponding dual closed-loop decoupling control method is proposed, and the effectiveness of the topology is verified through simulation.
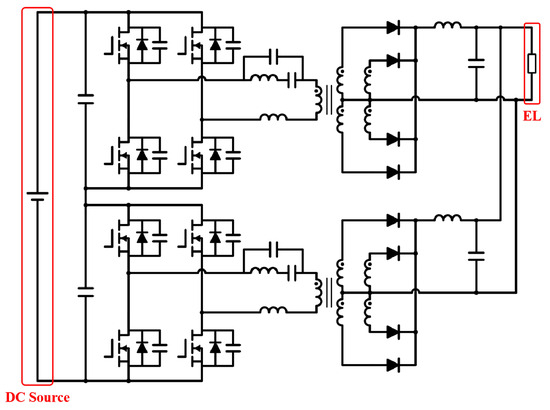
Figure 26.
The serial-input–parallel-output (ISOP) DC/DC converter based on interleaved LCLCL resonant converter proposed in [94].
4.3.2. Multi-Stage Serial Connection
Many papers have also conducted research on the multi-stage serial topology, in which most of the front stage topologies use diode rectifier circuits. In the topology investigated in [95], the front stage diode rectifier circuit converts the AC power of the wind power system to DC power and the rear-end parallel classic buck converter to power ten independent ELs. The structure of the system is shown in Figure 27. The collaborative control strategy proposed in [95] can smooth the fluctuations in wind power and decouple the power supply of each EL, which helps to dynamically switch the operation of the EL, thus improving its lifetime and efficiency. In [96], a neural network-based open circuit fault diagnosis and state monitoring method is proposed for a PEM EL power supply system constructed by a diode rectifier and a serial connected CIBC to improve reliability. In [97], a topology with a 12-pulse diode rectifier circuit and a CIBC is designed, with a peak power of 400 kW. In [98,99,100,101], stability, basic control, ripple compensation, and other aspects of the power supply topology with a diode rectifier circuit and a serial connected PSFB are also analysed.
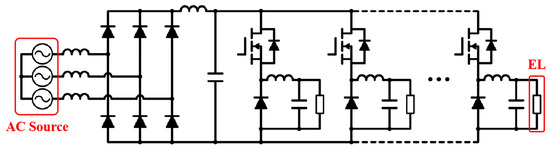
Figure 27.
The multi-stage serial topology constructed by a diode rectifier and buck converters proposed in [95].
In [102], the front stage of the multi-stage topology uses a three-phase PWM rectifier, which has very low current and voltage distortion on the AC side compared to diode rectifier circuits and also has power factor adjustment capability, which has advantages in grid-connected scenarios. The rear stage uses an CIBC with average current-mode control. Ref. [103] connects a Vienna rectifier and a synchronous buck converter in series, as shown in Figure 28. The Vienna rectifier can ensure power quality without requiring large grid-connected filtering devices, and the reduction in the number of active switches also ensures lower losses. Ref. [103] analyses in detail the operating principles and control methods of the Vienna rectifier and synchronous buck converter and proposes two working modes of hydrogen production priority and power demand satisfaction priority to adapt to the requirements of intermittent distributed generation and demand side management.
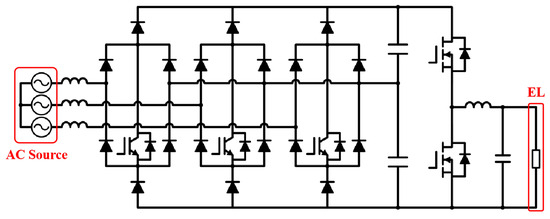
Figure 28.
The multi-stage serial topology constructed by a Vienna rectifier and a synchronous buck converter proposed in [103].
4.3.3. Other Hybrid Topologies
To achieve high power density, low cost, and high efficiency in WE hydrogen production, a master-slave parallel hybrid rectifier was proposed in [104], consisting of a thyristor rectifier circuit as the main power circuit, and a PWM rectifier and a PSFB connected in series as the auxiliary power circuit, in parallel with the main power circuit. The topology is shown in Figure 29. The thyristor main circuit is responsible for long-term/high-power/large-energy-scale frequency support and large-current conduction. The auxiliary circuit is used to achieve frequency responses in transient/low-power/small-energy ranges, such as transient inertial support, smoothing frequency change rate, and gaining time for the thyristor action of the main circuit. The PWM rectifier is used to compensate for the grid current harmonics of the thyristor rectifier circuit on the AC side and maintain the DC bus voltage of the auxiliary power circuit, while the PSFB is responsible for suppressing the output DC current ripple. The setup of the secondary diode of the PSFB transformer avoids the problem of the circulating current on the DC side, and the structure of the two-stage auxiliary circuit also ensures power decoupling between the AC and DC sides of the entire system. To effectively control the response characteristics of the EL load, a coordinated control method was proposed for different converters in the master-slave parallel hybrid topology in [105], and the effectiveness of the topology and coordinated control method was verified through experiments.
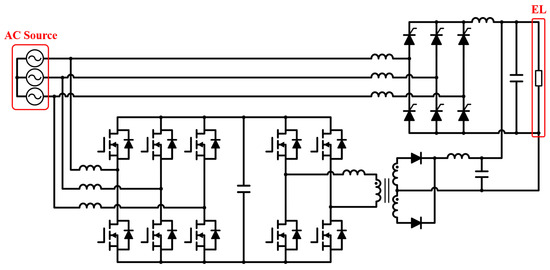
Figure 29.
The master-slave parallel hybrid rectifier proposed in [104].
The novel energy-storage system composed of EL and FC has become a hot topic in recent years. The multi-port topology can meet the requirements of integrated power conversion, efficient thermal management, compact packaging, and centralised control, which can improve the system efficiency and flexibility of hydrogen as an energy carrier used in distributed energy systems. Ref. [106] introduces a multi-port hydrogen converter, as shown in Figure 30. The three ports are magnetically coupled through a multi-winding transformer. In EL mode, the entire topology is equivalent to a buck converter, ensuring a stable supply voltage of the EL. In the FC mode, the topology is equivalent to a boost converter, with the load powered by the FC port. Compared with a system consisting of an independent EL converter and an FC converter, the multi-port topology reduces the number of energy conversion stages, thus reducing the number of power devices and costs and simplifying the control algorithm. Based on this topology, ref. [107] replaces the primary side of the transformer with a three-level clamped neutral point converter, as shown in Figure 31, to achieve higher voltage ratios and facilitate the coupling of hydrogen energy storage systems with high-voltage DC buses.
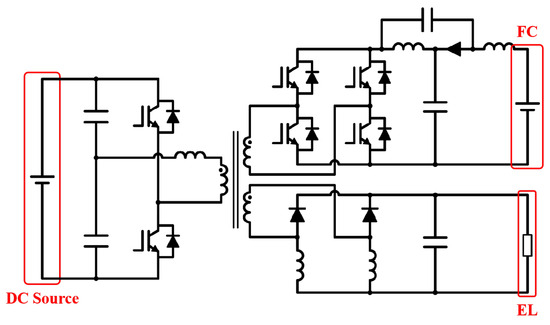
Figure 30.
The three-port topology proposed in [106].
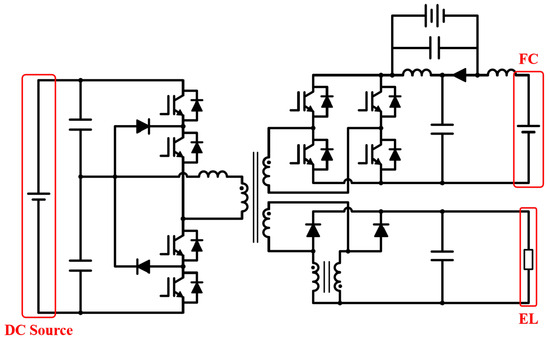
Figure 31.
The three-port topology proposed in [107].
4.4. Comparison and Analysis
A high-performance EL requires a power supply with high power density, small current ripple, high efficiency, and high reliability, as discussed in Section 3.4. However, data related to these criteria provided by most of the literature are not sufficient. With many different types of power supply investigated, it is difficult to find a unified standard to evaluate performance. Table 7 summarises and compares the aforementioned topologies in terms of power sources, development status, adaptive EL type, topology classification, power rating, efficiencies, semiconductor quantities, and control types. The data of rated power and efficiency are based on the results of the corresponding references listed in the first column of Table 7. The EL industry is currently dominated by large-scale equipment with a capacity of up to several megawatts, which is mainly powered by topologies based on single-stage AC sources. After decades of development and efficiency optimisation, it is reasonable that they have the highest efficiency of up to 98% compared to other EL power supply topologies that are still in the prototype or concept stage.
Table 7.
Comparison of power supply topologies for electrolyzer (EL). ALK represents alkaline, PEM represents proton exchange membrane, SCR represents thyristor, IGBT represents insulated gate bipolar transistor, MOSFET represents metal oxide semiconductor field effect transistor, PWM represents pulse width modulation, ZVS represents zero voltage switching.
Most articles explore only the feasibility of topology for EL power supply, and there is no further analysis or optimisation with respect to power density, current rating, current ripple, efficiency, or reliability. Figure 32 shows the comparison of peak efficiency of the prototypes for EL [63,66,73,76], the simulation model for EL [75], and the same topology used in other applications, for example, switching power supply for mobile phones and battery energy storage converters [108,109,110,111,112,113,114]. Despite their low efficiency in the prototype, these topologies show high application prospects in EL power supply systems due to their potential efficiency improvement capability. For some topologies listed in Table 7, upgrading the conventional PWM-based control strategy with a zero-voltage-switching (ZVS) control strategy could significantly increase efficiency. For example, the efficiency of the LLC-based EL prototype introduced in [76] is only 90.87%, while the efficiency of the same topology applied in electric vehicles is 98.5% [113]. In addition, the classic buck converter, synchronous buck converter, push–pull DC/DC, DAB, and Vienna rectifier all see a noticeable improvement in efficiency if the proper configuration and control strategy are applied [108,109,110,111,112]. Figure 33 further demonstrates the trend in efficiency of these power supplies versus output power. The efficiency of the classic buck converter increases monotonically with increasing load, and the efficiency is highest at full load. The peak efficiency points of other topologies are approximately in the range of 50% to 70% of the rated power. Recalling the trend of EL efficiency versus current density presented in Figure 7, FB-LLC could be the best choice among these candidates, since it performs the highest efficiency throughout the load range especially at the 100% power rating.
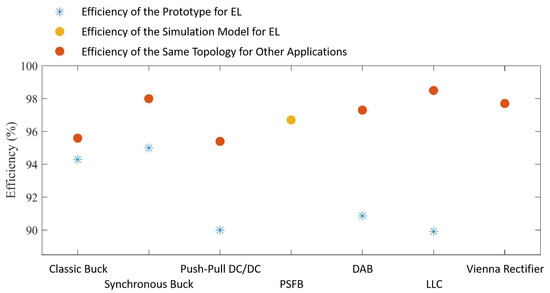
Figure 32.
Power supply peak efficiency comparison of the prototypes for EL [63,66,73,76], the simulation model for EL [75], and the same topology used in other applications [108,109,110,111,112,113,114].
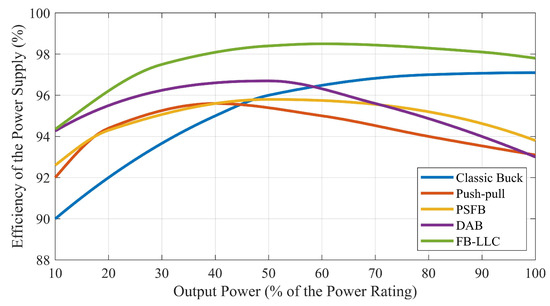
Figure 33.
Power supply efficiencies versus output power [108,110,111,112,113].
According to the literature summarised in this paper, the interleaved parallel connection of single-stage topology has many advantages:
- On the premise that the circuit parameters are close to the limit, the output current density is generally extended by paralleling devices or circuits [115,116].
- Designing redundant parallel branches is a commonly used method to improve the fault tolerance and converter reliability [117].
- The efficiency of parallel topologies is close to that of its single-stage counter part, while the efficiency of serial topologies is the product of each stage’s efficiency [118].
- The ripples of the output current can be reduced by increasing the inductance and capacitance of the filter, increasing the switching frequency, and applying an interleaved parallel configuration [119,120,121]. However, increasing inductance and capacitance will inevitably increase the size of these magnetic components, and consequently, the power density drops. Additionally, increasing the switching frequency brings great challenges to the thermal design and suppression of switching loss in semiconductors. The interleaved parallel configuration becomes the most suitable solution for reducing current ripples.
Wide-band-gap power semiconductors, represented by gallium nitride (GaN) and silicon carbide (SiC) MOSFETs, have been attracting increasing attention because of their promising performance in low on-state resistance, high breakdown voltage, fast switching speed, and high power efficiencies compared to those of silicon-based semiconductors. The interleaved parallel LLC topology constructed by wideband gap power semiconductors and controlled by the ZVS algorithm will effectively improve the performance of the power supply for EL as it provides high power density, high efficiency, high current rating, good fault tolerance, and low current ripple.
5. Control Framework of the EL Power Supply in Future Integrated Energy Systems
As illustrated in Figure 34a, the power supply system is part of the EL, while the EL is also part of the hydrogen energy domain that builds the future integrated energy system, where hydrogen and electrical energy are transformed into each other through the EL and FC [104,105]. In the foreseeable future, the development trend for hydrogen production will follow the path of development of electrical power generation, as shown in Figure 34b. The uneven distribution of renewable energy has led to the current dominance of centralised hydrogen production stations and ELs with large capacity up to hundreds of megawatts. Long-distance transportation pipelines play an important role in connecting the hydrogen supply side and the demand side. However, the high investment costs required for these infrastructures also limit the development of the entire hydrogen energy industry. Similarly, the technical iteration path in the field of power generation provides inspiration for the development of hydrogen production. Cooperation between large-scale power generation and HVDC transmission has alleviated the problem of regional imbalance of power resources to some extent, but further improvement in the utilisation efficiency of distributed power generation depends more on the development of microgrid and smart grid technology. With the maturity of hydrogen storage technology and the expansion of hydrogen utilisation scenarios, the on-site development and consumption of hydrogen energy will become more important. Ultimately, the construction of a future integrated energy system coupled with hydrogen, electricity, heat, and gas is a powerful means for the efficient use of renewable energy.
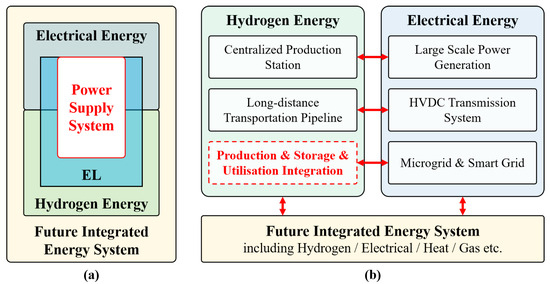
Figure 34.
(a) The positioning of the EL power supply in the future integrated energy system; (b) similarity and connection between hydrogen energy and electrical energy.
Based on the positioning of the power supply system shown in Figure 34a, in the future integrated energy system, the control of the EL power supply should take into account four layers of operating performance, namely the power supply itself, the EL, the hydrogen energy domain, and the entire system. Most of the literature summarised in Table 7 concentrates solely on the power supply itself and uses an equivalent simplified model to simulate the electrical characteristics of the EL. However, an EL is a complicated system composed of a power supply, an electrode plate, a catalyzer, hydrogen and oxygen filtration devices, hydrogen storage devices, etc. Taking the PEM EL as an example, its device cost is approximately three times the power cost, as listed in Table 3. Control of the power supply should not only improve the comprehensive hydrogen production efficiency but also avoid sudden changes in the hydrogen production rate and avoid frequent start and stop of other devices, such as gas separators, to improve the overall lifetime of the EL and reduce the operating cost. From the point of view of the hydrogen energy domain, the power supply needs to adjust its output according to the state of hydrogen storage and consumption (such as the pressure of the hydrogen storage tank, the prediction curve of hydrogen consumption, etc.) to regulate the hydrogen production rate. From the perspective of the whole integrated energy system, the control of the EL power supply needs to be coordinated with the operation of other energy carriers.
The expected control framework of the EL power supply in future integrated energy systems involves multiple controlled objects and multi-objective optimisation. A hierarchical framework [122,123] is adopted to regulate such a complex system and assign control tasks to distributed controllers. The specific implementation of the hierarchical control framework is inspired by the PV-Battery converter control structure shown in Figure 35a. The maximum power point tracking algorithm is implemented at the first level to calculate the current reference for the PI feedback controller at the second level. The PI controller generates a duty cycle signal and feeds it into a PWM modulator [124] at the third level to generate the final control signals of the power semiconductors. The power electronics converter can interact with other components in the system, thanks to the hierarchical control framework. Figure 35b presents the hierarchical control framework suitable for the EL power supply. The main functions of the entire control system include the collection of information, the prediction of the energy flow, intelligent scheduling, real-time monitoring of the status of each component of the EL, the fault response mechanism, and the power control algorithm. The first layer is seen as the system-level controller in charge of the energy management, multi-objective optimisation, and fault response of the entire integrated energy system. At the converter-level controller where most of the power supply control algorithm is implemented [125,126], the tracking of the specific control objectives of the power supply (constant current output, constant voltage output, etc.) is carried out. Intermediate variables such as the modulation index are fed into the third layer, the power electronics device level controller, to obtain the gate signals of the power semiconductors. The modulation methods involved in this layer includes PWM, phase-shift control (PSC) [127], variable frequency control [128], etc. System-level strategies can refer to the literature in the field of coordinated control; converter-level strategies can refer to the literature in the field of power converter control, as presented in most of the reference literature introduced in Section 4; and device-level strategies can refer to the literature related to low-level modulation methods.
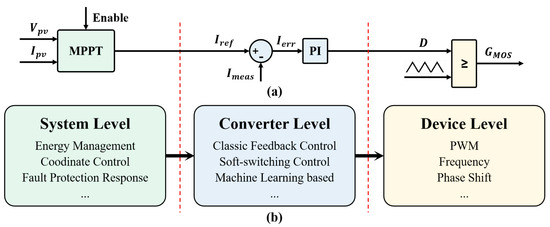
Figure 35.
(a) The control structure of a PV-battery converter; (b) the hierarchical control framework of the EL power supply.
6. Conclusions
This article reviews the development progress of hydrogen energy and hydrogen production ELs and summarises the power supply topologies based on the electrical interface modelling of the EL. The requirements for the EL power supply include high voltage stepdown ratio, high current density, small current ripple, low cost, high efficiency, and high reliability. EL power supply topologies are divided into single-stage AC source, single-stage DC source, and hybrid topology, and their performance is compared and analysed. The results show that the interleaved parallel LLC topology constructed by wideband-gap-power semiconductors and controlled by the ZVS algorithm is an ideal candidate for an EL power supply because of its good performance. This review is the first to consider the positioning of the EL power supply and the development trend of the EL in the future integrated energy system. A hierarchical control framework constructed by the system-level controller, the converter-level controller, and the device-level controller is recommended, as it is able to manage the operation performance of the power supply itself, the EL, the hydrogen energy domain, and the entire system at the same time.
With the increasing stability and safety of hydrogen storage and utilisation, hydrogen production can gradually expand from industrial to civilian scenarios. We predict that the development of hydrogen energy will follow the footprint of the development of the electrical system; apart from being implemented in centralised stations, hydrogen energy will also be produced distributively in commercial premises or even households. EL will no longer be an independent hydrogen production device but will be a principal component of a future integrated energy system. The further development of the EL is influenced by multiple aspects. First, the technological improvement of the EL itself plays an important role. In addition, the expansion of the hydrogen application scenarios will also promote investments in research and development on the EL. It should be noted that the current comprehensive cost of hydrogen production from WE is still much higher than that of traditional methods such as hydrogen production from fossil energy, so the sustainable development of EL is also inseparable from continuous policy support.
The power supply system of the EL in the future integrated energy system needs to consider the performance of the power supply (topology, power semiconductors, single device efficiency), the performance of the EL (lifetime expansion, coupling efficiency, fault response), the performance of the hydrogen domain (cooperation of hydrogen production, storage, and utilisation), and the performance of the integration of multiple energy carriers. So far, the authors have not found a mature solution in the literature, and many problems remain to be solved. Future research topics on the power supply of EL include the use of wideband-gap semiconductors, the improvement of power supply topologies, the specific implementation of the proposed hierarchical control framework in a demonstration project, and the integration and coordinate control of multiple energy carriers.
Author Contributions
Conceptualization, J.L. and H.M.; methodology, J.L. and G.Q.; investigation, J.L.; resources, Z.G.; writing—original draft preparation, J.L.; writing—review and editing, J.L., H.M., and G.Q.; visualization, P.X. and C.H.; supervision, J.L.; project administration, H.M. and G.Q.; funding acquisition, J.L. All authors have read and agreed to the published version of the manuscript.
Funding
This research received no external funding.
Data Availability Statement
Not applicable.
Acknowledgments
The authors would like to acknowledge the academic support provided by Bilu Liu.
Conflicts of Interest
J.L., H.M. and G.Q. has been involved as a consultant and expert witness in Shenzhen Poweroak Newener Co., Ltd. Z.G. and C.H. are affiliated with Shenzhen Poweroak Newener Co., Ltd. The remaining authors declare that the research was conducted in the absence of any commercial or financial relationships that could be construed as a potential conflict of interest.
Abbreviations
The following abbreviations are used in this manuscript:
| CCUS | carbon capture and carbon sequestration |
| FC | fuel cell |
| WE | water electrolysis |
| EL | electrolyzer |
| ALK | alkaline |
| PEM | proton exchange membrane |
| AEM | anion exchange membrane |
| SOE | solid oxide electrolyzer |
| IGBT | insulated gate bipolar transistor |
| MOSFET | metal oxide semiconductor field effect transistor |
| SiC | silicon carbide |
| GaN | gallium nitride |
| PSFB | phase-shift full-bridge |
| IBC | interleaved buck converter |
| CIBC | classic interleaved buck converter |
| SIBC | stacked interleaved buck converter |
| TLIBC | three level interleaved buck converter |
| ISOP | input-serial–output-parallel |
| PWM | pulse width modulation |
| ZVS | zero-voltage switching |
| MPPT | maximum power point tracking |
References
- Hua, H.; Shi, J.; Chen, X.; Qin, Y.; Wang, B.; Yu, K.; Naidoo, P. Carbon Emission Flow Based Energy Routing Strategy in Energy Internet. IEEE Trans. Ind. Inform. 2023, 1–12. [Google Scholar] [CrossRef]
- Liang, H.; Hua, H.; Qin, Y.; Ye, M.; Zhang, S.; Cao, J. Stochastic Optimal Energy Storage Management for Energy Routers Via Compressive Sensing. IEEE Trans. Ind. Inform. 2022, 18, 2192–2202. [Google Scholar] [CrossRef]
- Hua, H.; Qin, Z.; Dong, N.; Qin, Y.; Ye, M.; Wang, Z.; Chen, X.; Cao, J. Data-Driven Dynamical Control for Bottom-up Energy Internet System. IEEE Trans. Sustain. Energy 2022, 13, 315–327. [Google Scholar] [CrossRef]
- Hao, C.; Qin, Y.; Hua, H. Energy “Routers”, “Computers” and “Protocols”; Springer: Cham, Switzerland, 2020. [Google Scholar] [CrossRef]
- Pan, G.; Gu, Z.; Luo, E.; Gu, W. Analysis and Prospect of Electrolytic Hydrogen Technology Under Background of New Power Systems. Autom. Electr. Power Syst. 2023, 47, 1–13. [Google Scholar] [CrossRef]
- Xu, S. Current Development and Prospect of Hydrogen Energy Technology in China. J. Beijing Inst. Technol. (Soc. Sci. Ed.) 2021, 23, 1–12. [Google Scholar] [CrossRef]
- Yu, H.; Shao, Z.; Hou, M.; Yi, B.; Duan, F.; Yang, Y. Hydrogen Production by Water Electrolysis: Progress and Suggestions. Chin. J. Eng. Sci. 2021, 23, 146–152. [Google Scholar] [CrossRef]
- Medium and Long-Term Plan for the Development of Hydrogen Energy Industry (2021–2035). Available online: http://zfxxgk.nea.gov.cn/2022-03/23/c_1310525630.htm (accessed on 9 October 2023).
- The U.S. National Clean Hydrogen Strategy and Roadmap. Available online: https://www.hydrogen.energy.gov/library/roadmaps-vision/clean-hydrogen-strategy-roadmap (accessed on 9 October 2023).
- Strategic Research and Innovation Agenda 2021–2027. Available online: https://www.clean-hydrogen.europa.eu/about-us/key-documents/strategic-research-and-innovation-agenda (accessed on 9 October 2023).
- UK Hydrogen Strategy. Available online: https://www.gov.uk/government/publications/uk-hydrogen-strategy (accessed on 9 October 2023).
- The National Hydrogen Strategy. Available online: https://www.bmbf.de/files/bmwi-Nationale (accessed on 9 October 2023).
- National Strategy for Carbon-Free Hydrogen Energy Development. Available online: https://www.economie.gouv.fr/plan-de-relance/mesures/strategie-nationale-developpement-hydrogene-decarbone (accessed on 9 October 2023).
- The 6th Strategic Energy Plan. Available online: https://www.enecho.meti.go.jp/en/category/others/basic_plan/ (accessed on 9 October 2023).
- Clean Hydrogen Ecosystem Construction Plan. Available online: https://doc.msit.go.kr/SynapDocViewServer (accessed on 9 October 2023).
- Action Plan for the Development of Hydrogen Energy in the Russian Federation by 2024. Available online: http://government.ru/docs/40703/ (accessed on 9 October 2023).
- National Hydrogen Roadmap. Available online: https://www.csiro.au/en/news/All/News/2018/August/Roadmap-finds-Hydrogen-Industry-set-for-scale-up (accessed on 9 October 2023).
- Zhang, Z.; Zhao, Y.; Cai, N. Technological development status and prospect of hydrogen energy industry in China. Nat. Gas Ind. 2022, 42, 156–165. [Google Scholar] [CrossRef]
- David, M.; Ocampo-Martínez, C.; Sánchez-Peña, R. Advances in alkaline water electrolyzers: A review. J. Energy Storag. 2019, 23, 392–403. [Google Scholar] [CrossRef]
- Carmo, M.; Fritz, D.L.; Mergel, J.; Stolten, D. A comprehensive review on PEM water electrolysis. Int. J. Hydrogen Energy 2013, 38, 4901–4934. [Google Scholar] [CrossRef]
- Shiva Kumar, S.; Himabindu, V. Hydrogen production by PEM water electrolysis—A review. Mater. Sci. Energy Technol. 2019, 2, 442–454. [Google Scholar] [CrossRef]
- Ursua, A.; Gandia, L.M.; Sanchis, P. Hydrogen Production From Water Electrolysis: Current Status and Future Trends. Proc. IEEE 2012, 100, 410–426. [Google Scholar] [CrossRef]
- Hu, S.; Guo, B.; Ding, S.; Yang, F.; Dang, J.; Liu, B.; Gu, J.; Ma, J.; Ouyang, M. A comprehensive review of alkaline water electrolysis mathematical modeling. Appl. Energy 2022, 327, 120099. [Google Scholar] [CrossRef]
- Majumdar, A.; Haas, M.; Elliot, I.; Nazari, S. Control and control-oriented modeling of PEM water electrolyzers: A review. Int. J. Hydrogen Energy 2023, 48, 30621–30641. [Google Scholar] [CrossRef]
- Guilbert, D.; Collura, s.; Scipioni, A. DC/DC converter topologies for electrolyzers: State-of-the-art and remaining key issues. Int. J. Hydrogen Energy 2017, 42. [Google Scholar] [CrossRef]
- Guo, X.; Wei, Y.; Wan, Y.; Zhou, Y.; Kong, L.; Zhang, Z.; Lu, Z.; Hua, C.; Malinowski, M. Review on Power Electronic Converters for Producing Hydrogen from Renewable Energy Sources. Autom. Electr. Power Syst. 2021, 45, 185–199. [Google Scholar] [CrossRef]
- Li, D.; Park, E.; Zhu, W.; Shi, Q.; Zhou, Y.; Tian, H.; Lin, Y.; Serov, A.; Zulevi, B.; Baca, E.; et al. Highly quaternized polystyrene ionomers for high performance anion exchange membrane water electrolysers. Nat. Energy 2020, 5, 1–8. [Google Scholar] [CrossRef]
- Vasudevan, S. Electrolysis—Inevitable energy transformer in a world of sustainable energy. In Proceedings of the 2013 International Conference on Energy Efficient Technologies for Sustainability, Nagercoil, India, 10–12 April 2013; pp. 306–311. [Google Scholar] [CrossRef]
- Guilbert, D.; Vitale, G. Variable Parameters Model of a PEM Electrolyzer Based Model Reference Adaptive System Approach. In Proceedings of the 2020 IEEE International Conference on Environment and Electrical Engineering and 2020 IEEE Industrial and Commercial Power Systems Europe (EEEIC/ICPS Europe), Madrid, Spain, 9–12 June 2020; pp. 1–6. [Google Scholar] [CrossRef]
- Terlouw, T.; Bauer, C.; Mckenna, R.; Mazzotti, M. Large-scale hydrogen production via water electrolysis: A techno-economic and environmental assessment. Energy Environ. Sci. 2022. [Google Scholar] [CrossRef]
- Falcão, D.; Pinto, A. A review on PEM electrolyzer modelling: Guidelines for beginners. J. Clean. Prod. 2020, 261, 121184. [Google Scholar] [CrossRef]
- Song, X.; Liang, D.; Song, J.; Xu, G.; Deng, Z.; Niu, M. Problems and Technology Development Trends of Hydrogen Production from Renewable Energy Power Electrolysis—A Review. In Proceedings of the 2021 IEEE 5th Conference on Energy Internet and Energy System Integration (EI2), Taiyuan, China, 22–24 October 2021; pp. 3879–3882. [Google Scholar] [CrossRef]
- Zhang, K.; Liang, X.; Wang, L.; Sun, K.; Wang, Y.; Xie, Z.; Wu, Q.; Bai, X.; Hamdy, M.; Chen, H.; et al. Status and perspectives of key materials for PEM electrolyzer. Nano Res. Energy 2022, 1, 9120032. [Google Scholar] [CrossRef]
- Pirom, W.; Srisiriwat, A. Experimental Study of Hybrid Photovoltaic-PEM Electrolyzer-PEM Fuel Cell System. In Proceedings of the 2022 International Electrical Engineering Congress (iEECON), Khon Kaen, Thailand, 9–11 March 2022; pp. 1–4. [Google Scholar] [CrossRef]
- Ni, M.; Leung, M.K.; Leung, D.Y. Technological development of hydrogen production by solid oxide electrolyzer cell (SOEC). Int. J. Hydrogen Energy 2008, 33, 2337–2354. [Google Scholar] [CrossRef]
- Wappler, M.; Unguder, D.; Lu, X.; Ohlmeyer, H.; Teschke, H.; Lueke, W. Building the green hydrogen market—Current state and outlook on green hydrogen demand and electrolyzer manufacturing. Int. J. Hydrogen Energy 2022, 47, 33551–33570. [Google Scholar] [CrossRef]
- A Breakneck Growth Pivot Nears for Green Hydrogen. Available online: https://about.bnef.com/blog/a-breakneck-growth-pivot-nears-for-green-hydrogen/ (accessed on 9 October 2023).
- Varela, C.; Mostafa, M.; Zondervan, E. Modeling alkaline water electrolysis for power-to-x applications: A scheduling approach. Int. J. Hydrogen Energy 2021, 46, 9303–9313. [Google Scholar] [CrossRef]
- Iribarren, A.; Elizondo, D.; Barrios, E.L.; Ibaiondo, H.; Sanchez-Ruiz, A.; Arza, J.; Sanchis, P.; Ursúa, A. Dynamic Modeling of a Pressurized Alkaline Water Electrolyzer: A Multiphysics Approach. IEEE Trans. Ind. Appl. 2023, 59, 3741–3753. [Google Scholar] [CrossRef]
- Rahim, A.H.A.; Tijani, A.S.; Shukri, F.H.; Hanapi, S.; Sainan, K.I. Mathematical modelling and simulation analysis of PEM electrolyzer system for hydrogen production. In Proceedings of the 3rd IET International Conference on Clean Energy and Technology (CEAT) 2014, Kuching, Malaysia, 24–26 November 2014; pp. 1–7. [Google Scholar] [CrossRef]
- Abomazid, A.M.; El-Taweel, N.A.; Hany E. Z., F. Electrochemical Optimization Model for Parameters Identification of PEM Electrolyzer. In Proceedings of the 2020 IEEE Electric Power and Energy Conference (EPEC), Edmonton, AB, Canada, 9–10 November 2020; pp. 1–5. [Google Scholar] [CrossRef]
- Omez, A.; Ramírez, V.; Guilbert, D. Investigation of PEM electrolyzer modeling: Electrical domain, efficiency, and specific energy consumption ScienceDirect. Int. J. Hydrogen Energy 2020, 45, 14625–14639. [Google Scholar] [CrossRef]
- Rizwan, M.; Alstad, V.; Jäschke, J. Design considerations for industrial water electrolyzer plants. Int. J. Hydrogen Energy 2021, 46, 37120–37136. [Google Scholar] [CrossRef]
- Guilbert, D.; Zasadzinski, M.; Rafaralahy, H.; Boutat-Baddas, L. Modeling of the dynamic behavior of a PEM electrolyzer. In Proceedings of the 2022 10th International Conference on Systems and Control (ICSC), Marseille, France, 23–25 November 2022; pp. 78–84. [Google Scholar] [CrossRef]
- Sakas, G.; Ibáñez-Rioja, A.; Ruuskanen, V.; Kosonen, A.; Ahola, J.; Bergmann, O. Dynamic energy and mass balance model for an industrial alkaline water electrolyzer plant process. Int. J. Hydrogen Energy 2022, 47, 4328–4345. [Google Scholar] [CrossRef]
- Ren, Z.; Wang, J.; Yu, Z.; Zhang, C.; Gao, S.; Wang, P. Experimental studies and modeling of a 250-kW alkaline water electrolyzer for hydrogen production. J. Power Source 2022, 544, 231886. [Google Scholar] [CrossRef]
- Ulleberg, Ø. Modeling of advanced alkaline electrolyzers: A system simulation approach. Int. J. Hydrogen Energy 2003, 28, 21–33. [Google Scholar] [CrossRef]
- Atlam, O.; Kolhe, M. Equivalent electrical model for a proton exchange membrane (PEM) electrolyser. Energy Convers. Manag. 2011, 52, 2952–2957. [Google Scholar] [CrossRef]
- Ojong, E.T.; Kwan, J.T.H.; Nouri-Khorasani, A.; Bonakdarpour, A.; Wilkinson, D.P.; Smolinka, T. Development of an experimentally validated semi-empirical fully-coupled performance model of a PEM electrolysis cell with a 3-D structured porous transport layer. Int. J. Hydrogen Energy 2017, 42, 25831–25847. [Google Scholar] [CrossRef]
- Zhou, J.; Meng, X.; Chen, Y.; Zhang, G. Research on DC Power Supply for Hydrogen Production from Electrolytic ater Based on New Energy Generation. Acta Energiae Solaris Sin. 2022, 43, 389–397. (In Chinese) [Google Scholar] [CrossRef]
- Guilbert, D.; Vitale, G. Dynamic Emulation of a PEM Electrolyzer by Time Constant Based Exponential Model. Energies 2019, 12, 750. [Google Scholar] [CrossRef]
- Keddar, M.; Da Conceicao, M.; Doumbia, M.L.; Zhang, Z. Electrolyzer Degradation influence on power electronics performance for 6-pulse thyristor rectifier in a large-scale water electrolyzer. In Proceedings of the 2022 13th International Renewable Energy Congress (IREC), Hammamet, Tunisia, 13–15 December 2022; pp. 1–5. [Google Scholar] [CrossRef]
- Iribarren, A.; Barrios, E.L.; Ibaiondo, H.; Sanchez-Ruiz, A.; Arza, J.; Sanchis, P.; Ursúa, A. Modelling and Operation of 6-Pulse Thyristor Rectifiers for supplying High Power Electrolyzers. In Proceedings of the 2022 IEEE 23rd Workshop on Control and Modeling for Power Electronics (COMPEL), Tel Aviv, Israel, 20–23 June 2022; pp. 1–8. [Google Scholar] [CrossRef]
- Keddar, M.; Zhang, Z.; Periasamy, C.; Doumbia, M.L. Comparative analysis of thyristor-based and transistor-based rectifiers for PEM water electrolysis. In Proceedings of the 2021 12th International Renewable Energy Congress (IREC), Hammamet, Tunisia, 26–28 October 2021; pp. 1–5. [Google Scholar] [CrossRef]
- Ruuskanen, V.; Koponen, J.; Kosonen, A.; Niemelä, M.; Ahola, J.; Hämäläinen, A. Power quality and reactive power of water electrolyzers supplied with thyristor converters. J. Power Source 2020, 459, 228075. [Google Scholar] [CrossRef]
- Rautela, P.; Kulkarni, R.D.; Deep Srivastava, G. Design Consideration of High Power High Current Twelve Pulse Thyristor Controlled Rectifiers. In Proceedings of the 2018 2nd International Conference on Power, Energy and Environment: Towards Smart Technology (ICEPE), Shillong, India, 1–2 June 2018; pp. 1–6. [Google Scholar] [CrossRef]
- Solanki, J.; Fröhleke, N.; Böcker, J. Implementation of Hybrid Filter for 12-Pulse Thyristor Rectifier Supplying High-Current Variable-Voltage DC Load. IEEE Trans. Ind. Electron. 2015, 62, 4691–4701. [Google Scholar] [CrossRef]
- Rodriguez, J.; Pontt, J.; Silva, C.; Wiechmann, E.; Hammond, P.; Santucci, F.; Alvarez, R.; Musalem, R.; Kouro, S.; Lezana, P. Large current rectifiers: State of the art and future trends. IEEE Trans. Ind. Electron. 2005, 52, 738–746. [Google Scholar] [CrossRef]
- Li, Y.; Lou, Z.; Zhang, Z. Novel control scheme for 3-phase PWM current-source converters under unbalanced source voltage conditions. J. Zhejiang Univ.-Sci. A Appl. Phys. Eng. 2006, 7, 263–268. [Google Scholar] [CrossRef]
- Solanki, J.; Fröhleke, N.; Böcker, J.; Averberg, A.; Wallmeier, P. High-current variable-voltage rectifiers: State of the art topologies. IET Power Electron. 2015, 8, 1068–1080. [Google Scholar] [CrossRef]
- Guo, Q.; Liu, H.; Peng, D.; Liu, Q.; Zhang, Y. A multi-loop control strategy and parameter design for current-source PWM rectifiers. Zhongguo Dianji Gongcheng Xuebao/Proc. Chin. Soc. Electr. Eng. 2015, 35, 1193–1202. [Google Scholar] [CrossRef]
- Koponen, J.; Ruuskanen, V.; Kosonen, A.; Niemelä, M.; Ahola, J. Effect of Converter Topology on the Specific Energy Consumption of Alkaline Water Electrolyzers. IEEE Trans. Power Electron. 2019, 34, 6171–6182. [Google Scholar] [CrossRef]
- Albarghot, M.; Rolland, L. MATLAB/Simulink modelling and experimental results of a PEM electrolyzer powered by a solar panel. In Proceedings of the 2016 IEEE Electrical Power and Energy Conference (EPEC), Ottawa, ON, Canada, 12–14 October 2016; pp. 1–6. [Google Scholar] [CrossRef]
- Guilbert, D.; Yodwong, B.; Kaewmanee, W.; Phattanasak, M.; Hinaje, M. Hydrogen Flow Rate Control of a Proton Exchange Membrane Electrolyzer. In Proceedings of the 2019 Research, Invention, and Innovation Congress (RI2C), Bangkok, Thailand, 11–13 December 2019; pp. 1–6. [Google Scholar] [CrossRef]
- Gorji, S.A. Reconfigurable Quadratic Converters for Electrolyzers Utilized in DC Microgrids. IEEE Access 2022, 10, 109677–109687. [Google Scholar] [CrossRef]
- Şahin, M.; Okumuş, H.; Aydemir, M. Implementation of an electrolysis system with DC/DC synchronous buck converter. Int. J. Hydrogen Energy 2014, 39, 6802–6812. [Google Scholar] [CrossRef]
- Fan, L.; Luo, S.; Lai, Y.; Liu, H. Development of three level DC power supply for hydrogen production from electrolytic water. Power Electron. Technol. 2023, 57, 31–34. [Google Scholar]
- de Sá, F.L.; Eiterer, C.V.B.; Ruiz-Caballero, D.; Mussa, S.A. Double Quadratic Buck Converter. In Proceedings of the 2013 Brazilian Power Electronics Conference, Gramado, Brazil, 27–31 October 2013; pp. 36–43. [Google Scholar] [CrossRef]
- Birca-Galateanu, S. Triple step-down DC-DC converters. In Proceedings of the PESC Record, 27th Annual IEEE Power Electronics Specialists Conference, Baveno, Italy, 23–27 June 1996; Volume 1, pp. 408–413. [Google Scholar] [CrossRef]
- Kondrath, N.; Kazimierczuk, M. Analysis and design of common-diode tapped-inductor PWM buck converter in CCM. In Proceedings of the Electrical Manufacturing Technical Conference 2009: Electrical Manufacturing and Coil Winding Expo, Nashville, TE, USA, 29 September–1 October 2009. [Google Scholar]
- Yao, K.; Ye, M.; Xu, M.; Lee, F. Tapped-inductor buck converter for high-step-down DC-DC conversion. IEEE Trans. Power Electron. 2005, 20, 775–780. [Google Scholar] [CrossRef]
- Xiong, S.; Wong, S.C.; Tan, S.C.; Tse, C.K. A Family of Exponential Step-Down Switched-Capacitor Converters and Their Applications in Two-Stage Converters. IEEE Trans. Power Electron. 2014, 29, 1870–1880. [Google Scholar] [CrossRef]
- Garrigós, A.; Blanes, J.; Carrasco, J.; Lizán, J.; Beneito, R.; Molina, J. 5kW DC/DC converter for hydrogen generation from photovoltaic sources. Int. J. Hydrogen Energy 2010, 35, 6123–6130. [Google Scholar] [CrossRef]
- Cavallaro, C.; Chimento, F.; Musumeci, S.; Sapuppo, C.; Santonocito, C. Electrolyser in H2 Self-Producing Systems Connected to DC Link with Dedicated Phase Shift Converter. In Proceedings of the 2007 International Conference on Clean Electrical Power, Capri, Italy, 21–23 May 2007; pp. 632–638. [Google Scholar] [CrossRef]
- Diabate, M.; Vriend, T.; Krishnamoorthy, H.S.; Shi, J. Hydrogen and Battery–Based Energy Storage System (ESS) for Future DC Microgrids. In Proceedings of the 2022 IEEE International Conference on Power Electronics, Drives and Energy Systems (PEDES), Jaipur, India, 14–17 December 2022; pp. 1–6. [Google Scholar] [CrossRef]
- Gautam, D.S.; Bhat, A.K.S. A Comparison of Soft-Switched DC-to-DC Converters for Electrolyzer Application. IEEE Trans. Power Electron. 2013, 28, 54–63. [Google Scholar] [CrossRef]
- Vinnikov, D.; Hoimoja, H.; Andrijanovits, A.; Roasto, I.; Lehtla, T.; Klytta, M. An improved interface converter for a medium-power wind-hydrogen system. In Proceedings of the 2009 International Conference on Clean Electrical Power, Capri, Italy, 9–11 June 2009; pp. 426–432. [Google Scholar] [CrossRef]
- Blinov, A.; Andrijanovits, A. New DC/DC Converter for Electrolyser Interfacing with Stand-Alone Renewable Energy System. Electr. Control. Commun. Eng. 2012, 1, 24–29. [Google Scholar] [CrossRef]
- Agbossou, K.; Doumbia, M.; Anouar, A. Optimal hydrogen production in a stand-alone renewable energy system. In Proceedings of the Fourtieth IAS Annual Meeting, Conference Record of the 2005 Industry Applications Conference, Hong Kong, China, 2–6 October 2005; Volume 4, pp. 2932–2936. [Google Scholar] [CrossRef]
- Koundi, M.; El Fadil, H. Mathematical modeling of PEM electrolyzer and design of a voltage controller by the SMPWM approach. In Proceedings of the 2019 International Conference on Power Generation Systems and Renewable Energy Technologies (PGSRET), Istanbul, Turkey, 26–27 August 2019; pp. 1–6. [Google Scholar] [CrossRef]
- Lee, I.O.; Cho, S.Y.; Moon, G.W. Interleaved buck converter having low switching losses and improved step-down conversion ratio. In Proceedings of the 8th International Conference on Power Electronics—ECCE Asia, Jeju, Republis of Korea, 30 May–3 June 2011; pp. 2136–2143. [Google Scholar] [CrossRef]
- Pan, C.T.; Chuang, C.F.; Chu, C.C. A Novel Transformerless Interleaved High Step-Down Conversion Ratio DC–DC Converter with Low Switch Voltage Stress. IEEE Trans. Ind. Electron. 2014, 61, 5290–5299. [Google Scholar] [CrossRef]
- Yao, K.; Qiu, Y.; Xu, M.; Lee, F. A novel winding-coupled buck converter for high-frequency, high-step-down DC-DC conversion. IEEE Trans. Power Electron. 2005, 20, 1017–1024. [Google Scholar] [CrossRef]
- Ilic, M.; Maksimovic, D. Interleaved zero current transition buck converter. In Proceedings of the Twentieth Annual IEEE Applied Power Electronics Conference and Exposition, 2005, APEC 2005, Austin, TX, USA, 6–10 March; 2005; Volume 2, pp. 1265–1271. [Google Scholar] [CrossRef]
- Li, W.; He, X. A Family of Interleaved DC–DC Converters DeducedFrom a Basic Cell with Winding-Cross-CoupledInductors (WCCIs) for High Step-Upor Step-Down Conversions. IEEE Trans. Power Electron. 2008, 23, 1791–1801. [Google Scholar] [CrossRef]
- Tsai, C.T.; Shen, C.L. Interleaved soft-switching coupled-buck converter with active-clamp circuits. In Proceedings of the 2009 International Conference on Power Electronics and Drive Systems (PEDS), Taipei, Taiwan, 2–5 November 2009; pp. 1113–1118. [Google Scholar] [CrossRef]
- Guida, V.; Guilbert, D.; Douine, B. Candidate Interleaved DC-DC Buck Converters for Electrolyzers: State-of-the-Art and Perspectives. In Proceedings of the 2018 IEEE International Conference on Environment and Electrical Engineering and 2018 IEEE Industrial and Commercial Power Systems Europe (EEEIC/ICPS Europe), Palermo, Italy, 12–15 June 2018; pp. 1–6. [Google Scholar] [CrossRef]
- Guilbert, D.; Sorbera, D.; Vitale, G. A stacked interleaved DC-DC buck converter for proton exchange membrane electrolyzer applications: Design and experimental validation. Int. J. Hydrogen Energy 2020, 45, 64–79. [Google Scholar] [CrossRef]
- Guilbert, D.; Vitale, G. Optimal Hydrogen Production from Direct Coupled Variable Speed Wind Generator with a Stacked Interleaved Buck converter. In Proceedings of the 2019 IEEE International Conference on Environment and Electrical Engineering and 2019 IEEE Industrial and Commercial Power Systems Europe (EEEIC/ICPS Europe), Genova, Italy, 11–14 June 2019; pp. 1–6. [Google Scholar] [CrossRef]
- Makineni, R.R.; Sutanto, D.; Muttaqi, K.M.; Islam, M.R.; Agalgaonkar, A.P. Dual Loop Cascade Control of a Stacked Interleaved Buck Converter for Electrolyzer Application. In Proceedings of the 2022 IEEE IAS Global Conference on Emerging Technologies (GlobConET), Arad, Romania, 20–22 May 2022; pp. 1029–1035. [Google Scholar] [CrossRef]
- Yodwong, B.; Sikkabut, S.; Guilbert, D.; Kaewmanee, W.; Phattanasak, M.; Hinaje, M.; Vitale, G. Reliable Control Strategy and Power Switch Failure Analysis of a Three-level Interleaved Buck Converter for Electrolyzer Applications. In Proceedings of the 2022 25th International Conference on Electrical Machines and Systems (ICEMS), Chiang Mai, Thailand, 29 November–2 December 2022; pp. 1–6. [Google Scholar] [CrossRef]
- Yodwong, B.; Guilbert, D.; Kaewmanee, W.; Phattanasak, M.; Hinaje, M.; Vitale, G. Modified Sliding Mode-Based Control of a Three-Level Interleaved DC-DC Buck Converter for Proton Exchange Membrane Water Electrolysis. In Proceedings of the 2021 Research, Invention, and Innovation Congress: Innovation Electricals and Electronics (RI2C), Bangkok, Thailand, 1–3 September 2021; pp. 221–226. [Google Scholar] [CrossRef]
- Yodwong, B.; Guilbert, D.; Kaewmanee, W.; Phattanasak, M. Energy Efficiency Based Control Strategy of a Three-Level Interleaved DC-DC Buck Converter Supplying a Proton Exchange Membrane Electrolyzer. Electronics 2019, 8, 933. [Google Scholar] [CrossRef]
- Zhang, C.; Wang, J.; Pan, Y.; Diao, Y.; Li, D. A DC/DC Converter for Electrolytic Hydrogen Production Based on DC Microgrid. In Proceedings of the 2022 IEEE International Power Electronics and Application Conference and Exposition (PEAC), Guangzhou, China, 4–7 November 2022; pp. 1348–1353. [Google Scholar] [CrossRef]
- Muyeen, S.; Takahashi, R.; Tamura, J. Electrolyzer switching strategy for hydrogen generation from variable speed wind generator. Electr. Power Syst. Res. 2011, 81, 1171–1179. [Google Scholar] [CrossRef]
- Kumar, R.; Kumar, S.; Cirrincione, G.; Cirrincione, M.; Guilbert, D.; Ram, K.; Mohammadi, A. Power Switch Open-Circuit Fault-Diagnosis Based on a Shallow Long-Short Term Memory Neural Network: Investigation of an Interleaved Buck Converter for Electrolyzer applications. In Proceedings of the 2021 IEEE Energy Conversion Congress and Exposition (ECCE), Vancouver, BC, Canada, 10–14 October 2021; pp. 483–488. [Google Scholar] [CrossRef]
- Zhang, H.; Lu, Y.; Zhang, J.; Benigni, A. Real-Time Simulation of an Electrolyzer with a Diode Rectifier and a Three-Phase Interleaved Buck Converter. In Proceedings of the 2022 IEEE 13th International Symposium on Power Electronics for Distributed Generation Systems (PEDG), Kiel, Germany, 26–29 June 2022; pp. 1–6. [Google Scholar] [CrossRef]
- Török, L.; Mathe, L. Stability analysis of a three-phase grid-connected DC power supply with small DC-link capacitor and voltage feed-forward compensation. In Proceedings of the 2017 IEEE 26th International Symposium on Industrial Electronics (ISIE), Edinburgh, UK, 19–21 June 2017; pp. 867–872. [Google Scholar] [CrossRef]
- Török, L.; Mathe, L.; Munk-Nielsen, S. Voltage ripple compensation for grid connected electrolyser power supply using small DC link capacitor. In Proceedings of the 2014 International Conference on Optimization of Electrical and Electronic Equipment (OPTIM), Bran, Romania, 22–24 May 2014; pp. 607–611. [Google Scholar] [CrossRef]
- Török, L.; Mathe, L.; Nielsen, C.K.; Munk-Nielsen, S. Modeling and Control of Three-Phase Grid-Connected Power Supply with a Small DC-Link Capacitor for Electrolyzers. IEEE Trans. Ind. Appl. 2017, 53, 4634–4643. [Google Scholar] [CrossRef]
- Török, L.; Nielsen, C.K.; Munk-Nielsen, S.; Rømer, C.; Flindt, P. High efficiency electrolyser power supply for household hydrogen production and storage systems. In Proceedings of the 2015 17th European Conference on Power Electronics and Applications (EPE’15 ECCE-Europe), Geneva, Switzerland, 8–10 September 2015; pp. 1–9. [Google Scholar] [CrossRef]
- Ayivor, P.K. Feasibility of Demand Side Response from Electrolyzers to Support Power System Stability; Delft University of Technology: Delft, The Netherlands, 2018. [Google Scholar]
- Monroy-Morales, J.L.; Hernández-Ángeles, M.; Campos-Gaona, D.; Peña-Alzola, R.; Ordonez, M.; Mérida, W. Modeling and control design of a Vienna rectifier based electrolyzer. In Proceedings of the 2016 IEEE 7th International Symposium on Power Electronics for Distributed Generation Systems (PEDG), Vancouver, BC, Canada, 27–30 June 2016; pp. 1–8. [Google Scholar] [CrossRef]
- Meng, X.; Chen, M.; He, M.; Wang, X.; Liu, J. A Novel High Power Hybrid Rectifier with Low Cost and High Grid Current Quality for Improved Efficiency of Electrolytic Hydrogen Production. IEEE Trans. Power Electron. 2022, 37, 3763–3768. [Google Scholar] [CrossRef]
- Meng, X.; Jiang, L.; He, M.; Wang, X.; Liu, J. A Novel Multi-Scale Frequency Regulation Method of Hybrid Rectifier and Its Specific Application in Electrolytic Hydrogen Production. IEEE Trans. Power Electron. 2023, 38, 123–129. [Google Scholar] [CrossRef]
- Vinnikov, D.; Andrijanovitš, A.; Roasto, I.; Jalakas, T. Experimental study of new integrated DC/DC converter for hydrogen-based energy storage. In Proceedings of the 2011 10th International Conference on Environment and Electrical Engineering, Rome, Italy, 8–11 May 2011; pp. 1–4. [Google Scholar] [CrossRef]
- Andrijanovitš, A.; Blinov, A.; Husev, O.; Vinnikov, D. Multiport converter with integrated energy storage for hydrogen buffer interfacing with renewable energy systems. In Proceedings of the 2012 IEEE International Conference on Industrial Technology, Athens, Greece, 19–21 March 2012; pp. 230–235. [Google Scholar] [CrossRef]
- Kaufmann, M.; Lueders, M.; Kaya, C.; Wicht, B. 18.2 A Monolithic E-Mode GaN 15W 400V Offline Self-Supplied Hysteretic Buck Converter with 95.6% Efficiency. In Proceedings of the 2020 IEEE International Solid-State Circuits Conference—(ISSCC), San Francisco, CA, USA, 16–20 February 2020; pp. 288–290. [Google Scholar] [CrossRef]
- Zhang, J.; Lai, J.S.; Kim, R.Y.; Yu, W. High-Power Density Design of a Soft-Switching High-Power Bidirectional dc–dc Converter. IEEE Trans. Power Electron. 2007, 22, 1145–1153. [Google Scholar] [CrossRef]
- Tarzamni, H.; Babaei, E.; Esmaeelnia, F.P.; Dehghanian, P.; Tohidi, S.; Sharifian, M.B.B. Analysis and Reliability Evaluation of a High Step-Up Soft Switching Push–Pull DC–DC Converter. IEEE Trans. Reliab. 2020, 69, 1376–1386. [Google Scholar] [CrossRef]
- Zhao, L.; Li, H.; Wu, X.; Zhang, J. An Improved Phase-Shifted Full-Bridge Converter with Wide-Range ZVS and Reduced Filter Requirement. IEEE Trans. Ind. Electron. 2018, 65, 2167–2176. [Google Scholar] [CrossRef]
- Qin, Z.; Shen, Y.; Loh, P.C.; Wang, H.; Blaabjerg, F. A Dual Active Bridge Converter with an Extended High-Efficiency Range by DC Blocking Capacitor Voltage Control. IEEE Trans. Power Electron. 2018, 33, 5949–5966. [Google Scholar] [CrossRef]
- Ta, L.A.D.; Dao, N.D.; Lee, D.C. High-Efficiency Hybrid LLC Resonant Converter for On-Board Chargers of Plug-In Electric Vehicles. IEEE Trans. Power Electron. 2020, 35, 8324–8334. [Google Scholar] [CrossRef]
- Lee, J.S.; Lee, K.B. Performance Analysis of Carrier-Based Discontinuous PWM Method for Vienna Rectifiers with Neutral-Point Voltage Balance. IEEE Trans. Power Electron. 2016, 31, 4075–4084. [Google Scholar] [CrossRef]
- Xue, Y.; Lu, J.; Wang, Z.; Tolbert, L.M.; Blalock, B.J.; Wang, F. Active current balancing for parallel-connected silicon carbide MOSFETs. In Proceedings of the 2013 IEEE Energy Conversion Congress and Exposition, Denver, CO, USA, 15–19 September 2013; pp. 1563–1569. [Google Scholar] [CrossRef]
- Hao, C.; Judge, P.; Finney, S.; Merlin, M. Enabling the use of lower current-rated SiC MOSFET devices in large-current power converters by paralleling multiple H-bridges in the sub-modules. In Proceedings of the 19th International Conference on AC and DC Power Transmission (ACDC 2023), Glasgow, UK, 1–3 March 2023; Volume 2023, pp. 142–147. [Google Scholar] [CrossRef]
- Wang, B.; Wang, X.; Bie, Z.; Judge, P.D.; Wang, X.; Green, T.C. Reliability model of MMC considering periodic preventive maintenance. IEEE Trans. Power Deliv. 2016, 32, 1535–1544. [Google Scholar] [CrossRef]
- Fang, J.; Blaabjerg, F.; Liu, S.; Goetz, S.M. A Review of Multilevel Converters with Parallel Connectivity. IEEE Trans. Power Electron. 2021, 36, 12468–12489. [Google Scholar] [CrossRef]
- Liu, G.; Wang, B.; Liu, F.; Wang, X.; Guan, Y.; Wang, W.; Wang, Y.; Xu, D. An Improved Zero-Voltage and Zero-Current- Switching Phase-Shift Full-Bridge PWM Converter with Low Output Current Ripple. IEEE Trans. Power Electron. 2023, 38, 3419–3432. [Google Scholar] [CrossRef]
- Bagawade, S.; Pahlevani, M.; Jain, P. Novel Soft-Switched Three-Phase Inverter with Output Current Ripple Cancellation. IEEE Trans. Power Electron. 2023, 38, 1232–1248. [Google Scholar] [CrossRef]
- Joshi, K.; Yang, Z.; Fu, C.; Mandal, D.; Waterfall, G.; Bakkaloglu, B. A Mixed-Signal Adaptive Ripple Canceler for Switching Regulators Providing 18 dB–24 dB of Ripple Rejection up to 1 MHz. IEEE Trans. Power Electron. 2020, 35, 10249–10259. [Google Scholar] [CrossRef]
- Hao, C.; Cao, J.; Xia, P.; Finney, S.J.; Merlin, M.M.C. Meet the Micro-MMC. IEEE Power Electron. Mag. 2023, 10, 47–52. [Google Scholar] [CrossRef]
- Heath, T.; Barnes, M.; Judge, P.D.; Chaffey, G.; Clemow, P.; Green, T.C.; Green, P.R.; Wylie, J.; Konstantinou, G.; Ceballos, S.; et al. Cascaded- and Modular-Multilevel Converter Laboratory Test System Options: A Review. IEEE Access 2021, 9, 44718–44737. [Google Scholar] [CrossRef]
- Islam, M.T.; Ayon, S.I. Performance Analysis of Three-Phase Inverter for Minimizing Total Harmonic Distortion Using Space Vector Pulse Width Modulation Technique. In Proceedings of the 2020 23rd International Conference on Computer and Information Technology (ICCIT), Dhaka, Bangladesh, 19–21 December 2020; pp. 1–4. [Google Scholar] [CrossRef]
- Hao, C.; Merlin, M. Automatic Derivation of State-Space Model from Linear Electrical Circuits with Dependent Variables using Modified Nodal Analysis. In Proceedings of the 2020 IEEE 21st Workshop on Control and Modeling for Power Electronics (COMPEL), Aalborg, Denmark, 9–12 November 2020; pp. 1–6. [Google Scholar] [CrossRef]
- Li, N.; Macavilca, M.B.; Wu, C.; Finney, S.; Judge, P.D. Converter Topology for Megawatt Scale Applications with Reduced Filtering Requirements, Formed of IGBT Bridge Operating in the 1000 Hz Region with Parallel Part-Rated High-Frequency SiC MOSFET Bridge. IEEE Trans. Power Electron. 2024, 39, 799–813. [Google Scholar] [CrossRef]
- Shan, Y.; Pei, X.; Sun, T.; Zhou, P.; Zhang, M.; Zhou, L. Space Spread-Spectrum-Based PSC-PWM for MMC to Reduce Conducted CM EMI. In Proceedings of the 2021 IEEE 12th Energy Conversion Congress and Exposition—Asia (ECCE-Asia), Singapore, 24–27 May 2021; pp. 1916–1921. [Google Scholar] [CrossRef]
- Huang, Q.; Yu, R.; Ma, Q.; Huang, A.Q. Predictive ZVS Control with Improved ZVS Time Margin and Limited Variable Frequency Range for a 99% Efficient, 130-W/in3 MHz GaN Totem-Pole PFC Rectifier. IEEE Trans. Power Electron. 2019, 34, 7079–7091. [Google Scholar] [CrossRef]
Disclaimer/Publisher’s Note: The statements, opinions and data contained in all publications are solely those of the individual author(s) and contributor(s) and not of MDPI and/or the editor(s). MDPI and/or the editor(s) disclaim responsibility for any injury to people or property resulting from any ideas, methods, instructions or products referred to in the content. |
© 2024 by the authors. Licensee MDPI, Basel, Switzerland. This article is an open access article distributed under the terms and conditions of the Creative Commons Attribution (CC BY) license (https://creativecommons.org/licenses/by/4.0/).