Article

Technoeconomic Analysis of Torrefaction and Steam Explosion Pretreatment Prior to Pelletization of Selected Biomass

1
Department of Chemical and Biological Engineering, University of Saskatchewan, 57 Campus Drive, Saskatoon, SK S7N 5A9, Canada
2
Agriculture and Agri-Food Canada, Saskatoon Research Centre, 107 Science Place, Saskatoon, SK S7N 0X2, Canada
3
Department of Mechanical Engineering, University of Saskatchewan, 57 Campus Drive, Saskatoon, SK S7N 5A9, Canada
*
Authors to whom correspondence should be addressed.
Energies 2024, 17(1), 133; https://doi.org/10.3390/en17010133
Submission received: 9 November 2023 / Revised: 22 December 2023 / Accepted: 23 December 2023 / Published: 26 December 2023
(This article belongs to the Special Issue New Trends in Biofuels and Bioenergy for Sustainable Development II)

Abstract

:
Lignocellulosic biomass has demonstrated great potential as feedstock for pellet production, notwithstanding the fact that the industrial production of pellets is faced with some economic challenges. This study presents a technoeconomic analysis of six scenarios to develop a process model for pellet production from sawdust and oat straw that employs torrefaction and steam explosion pretreatment prior to pelletization. SuperPro Designer was used to carry out this evaluation. The pellet plants were designed to have a capacity of 9.09 t/h of sawdust and oat straw each. The pellet yield ranged from 59 kt to 72 kt/year. The scenarios analyzed included variations of steam explosion and torrefaction. In some scenarios, materials were lost in the form of liquid and gas due to the pretreatment process. The breakdown of equipment purchase cost showed that the torrefaction reactor is the most expensive unit with approximately 51% of the purchase cost. Facility-dependent and feedstock costs were the major significant contributors to the pellet production cost. The minimum selling prices of the pellets obtained from Scenarios 1–6 were $113.4/t, $118.7/t, $283.4/t, $298.7/t, $200.5/t, and $208.4/t, respectively. The profitability of pellet production as determined by the net present value (NPV), internal rate of return (IRR), and payback period was found to be sensitive to variations in feedstock cost.

1. Introduction

In recent decades, the agriculture and forestry industries have encountered many changes because of globalization, financial crises, the high cost of energy, and climate change. Canada, Finland, United States, Sweden, Norway, and some countries in South America have huge, forested areas that can be harvested and used for industrial purposes [1,2].
Co-firing coal with biomass has been shown to be a promising, less expensive, and low greenhouse gas (GHG) emission alternative for electricity production [3]. A great number of power generation plants have been established in the United Kingdom and Europe with co-firing options ranging from 10 to 100%, mainly because of the strict regulations to minimize GHG emissions [4]. Wood pellets are used as the solid biofuel in power plants in the U.K. and Europe. The use of biomass for power generation in the United States is low (approximately 2%); nevertheless, this is expected to increase with the establishment of environmental regulations, coal-compatible biofuel sources, availability, the low cost of biomass, and, lastly, reduced transportation costs [5].
The United States had an annual wood pellet production of approximately 6.6 million tonnes in 2020 [6], making it the world’s largest producer of wood pellets utilized for heat and power generation. Canada had an estimated wood pellet production of 3.5 million tonnes in 2021 with domestic use estimated at 0.5 million tonnes [7]. However, there are setbacks in the utilization of wood pellets domestically for power generation due to the higher heating value and dimensional stability of coal versus those of wood pellets. Pretreatments with torrefaction prior to pelletization have been broadly investigated to improve the thermal and physiochemical properties of lignocellulosic biomass as a suitable substitute to coal [8,9,10,11,12]. Torrefaction is a thermal treatment process of feedstock, which involves the roasting of the feedstock in an inert surrounding at temperatures ranging between 200 and 300 °C. Torrefaction is sometimes referred to as mild pyrolysis because the operating temperature is less than that of the pyrolysis process. This pretreatment method reduces the amount of moisture in the biomass sample, which makes the biomass hydrophobic and enhances the calorific value, thereby improving the volumetric energy density of the biomass. The torrefaction process produces both solid char (torrefied material) and torgas. The torgas comprises condensable and non-condensable gases. Condensable gas is a torrefaction liquid (TL), which is rich in ketones, organic acids, furfural, water, and traces of other components. These TL components can be transformed into economically feasible products [13]. Since the bulk density of torrefied material is reduced because of mass loss and the voids formed during torrefaction, pelletization increases the total energy density of the final products. There are a lot of challenges that have limited the development of biomass-based facilities. The characteristics of the biomass from different sources vary significantly, and this is obviously one of the main factors limiting their commercialization in a biomass-based facility. Traditionally, biomass has high moisture content and low energy density, calorific value, and yield. These factors increase the transportation cost of biomass, which also increases biomass conversion costs [14]. Pretreatment and pelletization of biomass could reduce the overall cost of biomass conversion.
Steam explosion is a physical and chemical process, otherwise known as a physiochemical pretreatment method, that involves the breakdown of lignocellulosic biomass with two procedures: First is the utilization of high-pressure heat (3.4 MPa at 180 °C), which leads to the formation of organic acid, and second are shearing forces, which prompt moisture expansion and explosive decompression. These processes alter the biomass components via hydrolysis of the hemicellulosic components (leading to the release of mono- and oligosaccharides), modify the chemical structure of lignin, and enhance the crystallinity index of cellulose. These transformations allow the lignocellulosic biomass structures to unleash and improve the fermentable carbohydrate yield of the next enzymatic hydrolysis steps [15,16,17].
Biomass production cost, feedstock transportation cost, and densification cost contribute significantly to the high economic component of downstream production. Therefore, the cost implications of biomass production, transportation, and pretreatment are limitations to the commercialization of pellet production [18,19].
Biomass pelletization can be defined as a compression or compaction process to eliminate inter- or intraparticle empty spaces. It also reduces the moisture content of biomass during compression. The aim of biomass pelletization is to increase the mass per unit volume of the biomass. Pelletization is a vital approach for the biomass market since it can improve the convenience and accessibility of biomass because of the uniform shape and size [20,21]. Pelletization also facilitates logistics by improving its storage and handling characteristics and reducing transportation cost [22].
Previous research has analyzed the economics of biomass-based energy from the outlook of generic models [18,23,24]. The cost of sawdust pellet production has been studied by Mani et al. [25] who reported that pellets can be produced from sawdust at US$51/t based on a 45 kt plant capacity. Similarly, Shahrukh et al. [18] performed a technoeconomic assessment of pellets produced from the steam pretreatment of three biomass feedstocks (energy crops, forest residue, and agricultural residue). They reported that the cost of production varied from US$95 to $105/t for regular pellets and US$146 to $156/t for steam-pretreated pellets at a capacity of 190 kt and 250 kt, respectively. Pirraglia et al. [26] carried out a technoeconomic analysis of an industrial scale 100 kt/year wood biomass torrefaction system in the United States, reporting a production cost of US$199/t and concluding that a high capital cost represented the most sensitive factor affecting the net present value (NPV), followed by biomass cost. The torrefaction liquid (TL), which consists of mainly water and other minor components, was assumed to sell at US$0.25/L [27].
However, there has not been much research to evaluate the production costs of torrefaction and steam explosion pretreated pellets and how they compare with the production costs of regular pellets (untreated). There is a need to evaluate the economic feasibility of both forms of pretreated biomass-based pellets. There is a need to link research and development (R&D), engineering, and business. By connecting process parameters to economic metrics, it serves as a useful method to screen potential research priorities, and it can help to better understand businesses and the factors that affect the profitability of their technology-development projects.
Therefore, the overall objective of this study is to conduct a comparative technoeconomic assessment of an integrated steam explosion, torrefaction, and pelletization process from two feedstocks, sawdust and oat straw, relative to the cost of regular pellet production. This can establish cost bottlenecks at the earliest phase of the project and present the mass and energy data required to conduct life-cycle environmental assessments.

2. Materials and Methods

2.1. Process Design and Parameters

Technoeconomic analysis for sawdust- and oat straw-based pellet production was carried out using SuperPro Designer software v.10 (Intelligen Inc., Scotch Plains, NJ, USA). A plant capacity of 9.09 dry t/h of sawdust and oat straw was selected for the design, equivalent to 72 kt/year, assuming 7920 h of annual operating time for both scenarios. The plant size of 72 kt/year was selected based on available sawdust in the NorSask Forest Products, Meadow Lake [28] and available oat straw in Meadow Lake, Saskatchewan, Canada with a latitude of 54°7′27.00″ N (52.755529) and longitude of 108°26′9.00″ W (−107.316492). The unit operations in this study are grouped into three process sections: feedstock preprocessing, steam explosion/torrefaction pretreatment, and pelletization. The assumptions, data, and process conditions used in the process design of this study were obtained from the experimental results reported from our previous research [29,30,31,32] and Superpro built-in data (Table 1).

2.2. Process Description

2.2.1. Feedstock Processing and Plant Location

Sawdust and oat straw were the two feedstocks used in this study. The first step in analyzing the economic cost of producing pellets from oat straw is the determination of feedstock cost. In establishing the cost of non-woody biomass, the following were considered: the cost of production (establishment and harvest) and storage, drying, and transportation costs.
The Biomass Inventory Mapping and Analysis Tool (BIMAT) developed by Agriculture and Agri-Food Canada (AAFC) [33] was used to identify high oat producing regions in Meadow Lake, Saskatchewan, Canada. Biomass availability was recorded on a 50% farmer participation basis; the tillage type and competitive usage of straw for livestock and soil conservation were considered. The available oat straw within 50 km of the plant is approximately 89,409 tonnes per year. This study assumed that trucks were the main mode of transportation for the conveying of oat straw from the farm to the densification plant within the region. There are no available short line railroads near the farms that would be contracted to supply straw, which is the case in most of the Canadian Prairie. Therefore, trucks offer the requisite responsiveness and flexibility to transport the product as the market demands [22]. For baled feedstock, conveying is through a segmented truck or flatbed trailer hinged to an agricultural tractor. Chipped material is moved by either a high-sided trailer attached to an agricultural tractor or segmented truck and step-frame trailer. An agricultural tractor combination is the preferred means of transportation where the travel distances are short (less than 50 km).
Equation (1) defines the average transportation distance (L, km) as a function of feedstock collection radius (r, km) of a circular area that consists of farms supplying oat straw to the pelletization plant whose central point is in the circular area:
L = 2 3   r
The estimated area (A), according to BIMAT, is assumed to have an area as shown in Equation (2):
A = π r 2
Using Equation (1), the average transportation distance (L) is determined as a function of plant capacity using Equation (3):
L = 2 3 A π  
Feedstock transportation cost (Ct) is calculated as described by Stephen [34] and Sokhansanj and Fenton [35] as indicated in Equation (4):
C t = C f + C v L
where Cf is the fixed cost of transportation, which includes loading and unloading, and is $3.40/t for a bale [36] and $3.84/t for pellets [35]; and Cv represents the variable cost of transporting feedstock ($/t km).
Bioenergy plants are usually sited in regions where there is abundant feedstock to reduce the cost of transportation and facilitate feedstock supply logistics. Given Saskatchewan’s abundance of oat straw feedstock, it was assumed that, without accounting for the tortuosity factor, the transportation calculation is acceptable for theoretical analysis [22]. In this study, the biorefinery was strategically situated in the environs of the NorSask Forest Products mill in Meadow Lake, Saskatchewan to allow for proximity and regular feedstock availability.
The price of sawdust feedstock was obtained from a study by Antonio et al. [37]. It was assumed that the dry oat straw bale was supplied to the bioenergy plant at a cost estimated using BIMAT [33]. The samples were stored indoors under room conditions until ready to use. According to Samson et al. [38], the indoor storage of samples results in a 2% loss in sample dry matter. Oat straw samples were conveyed (belt conveyors) to the hammermill of screen size 3.2 mm for further size reduction. The oat straw particle size (3.2 mm) option chosen in this study has been reported to favor optimum pretreatment performance [29]. The sawdust samples did not require particle size reduction; instead, they were conveyed directly to the pretreatment chamber. The properties of the feedstocks used in this study are presented in Table S1 in the Supplementary Material.

2.2.2. Pretreatment Process

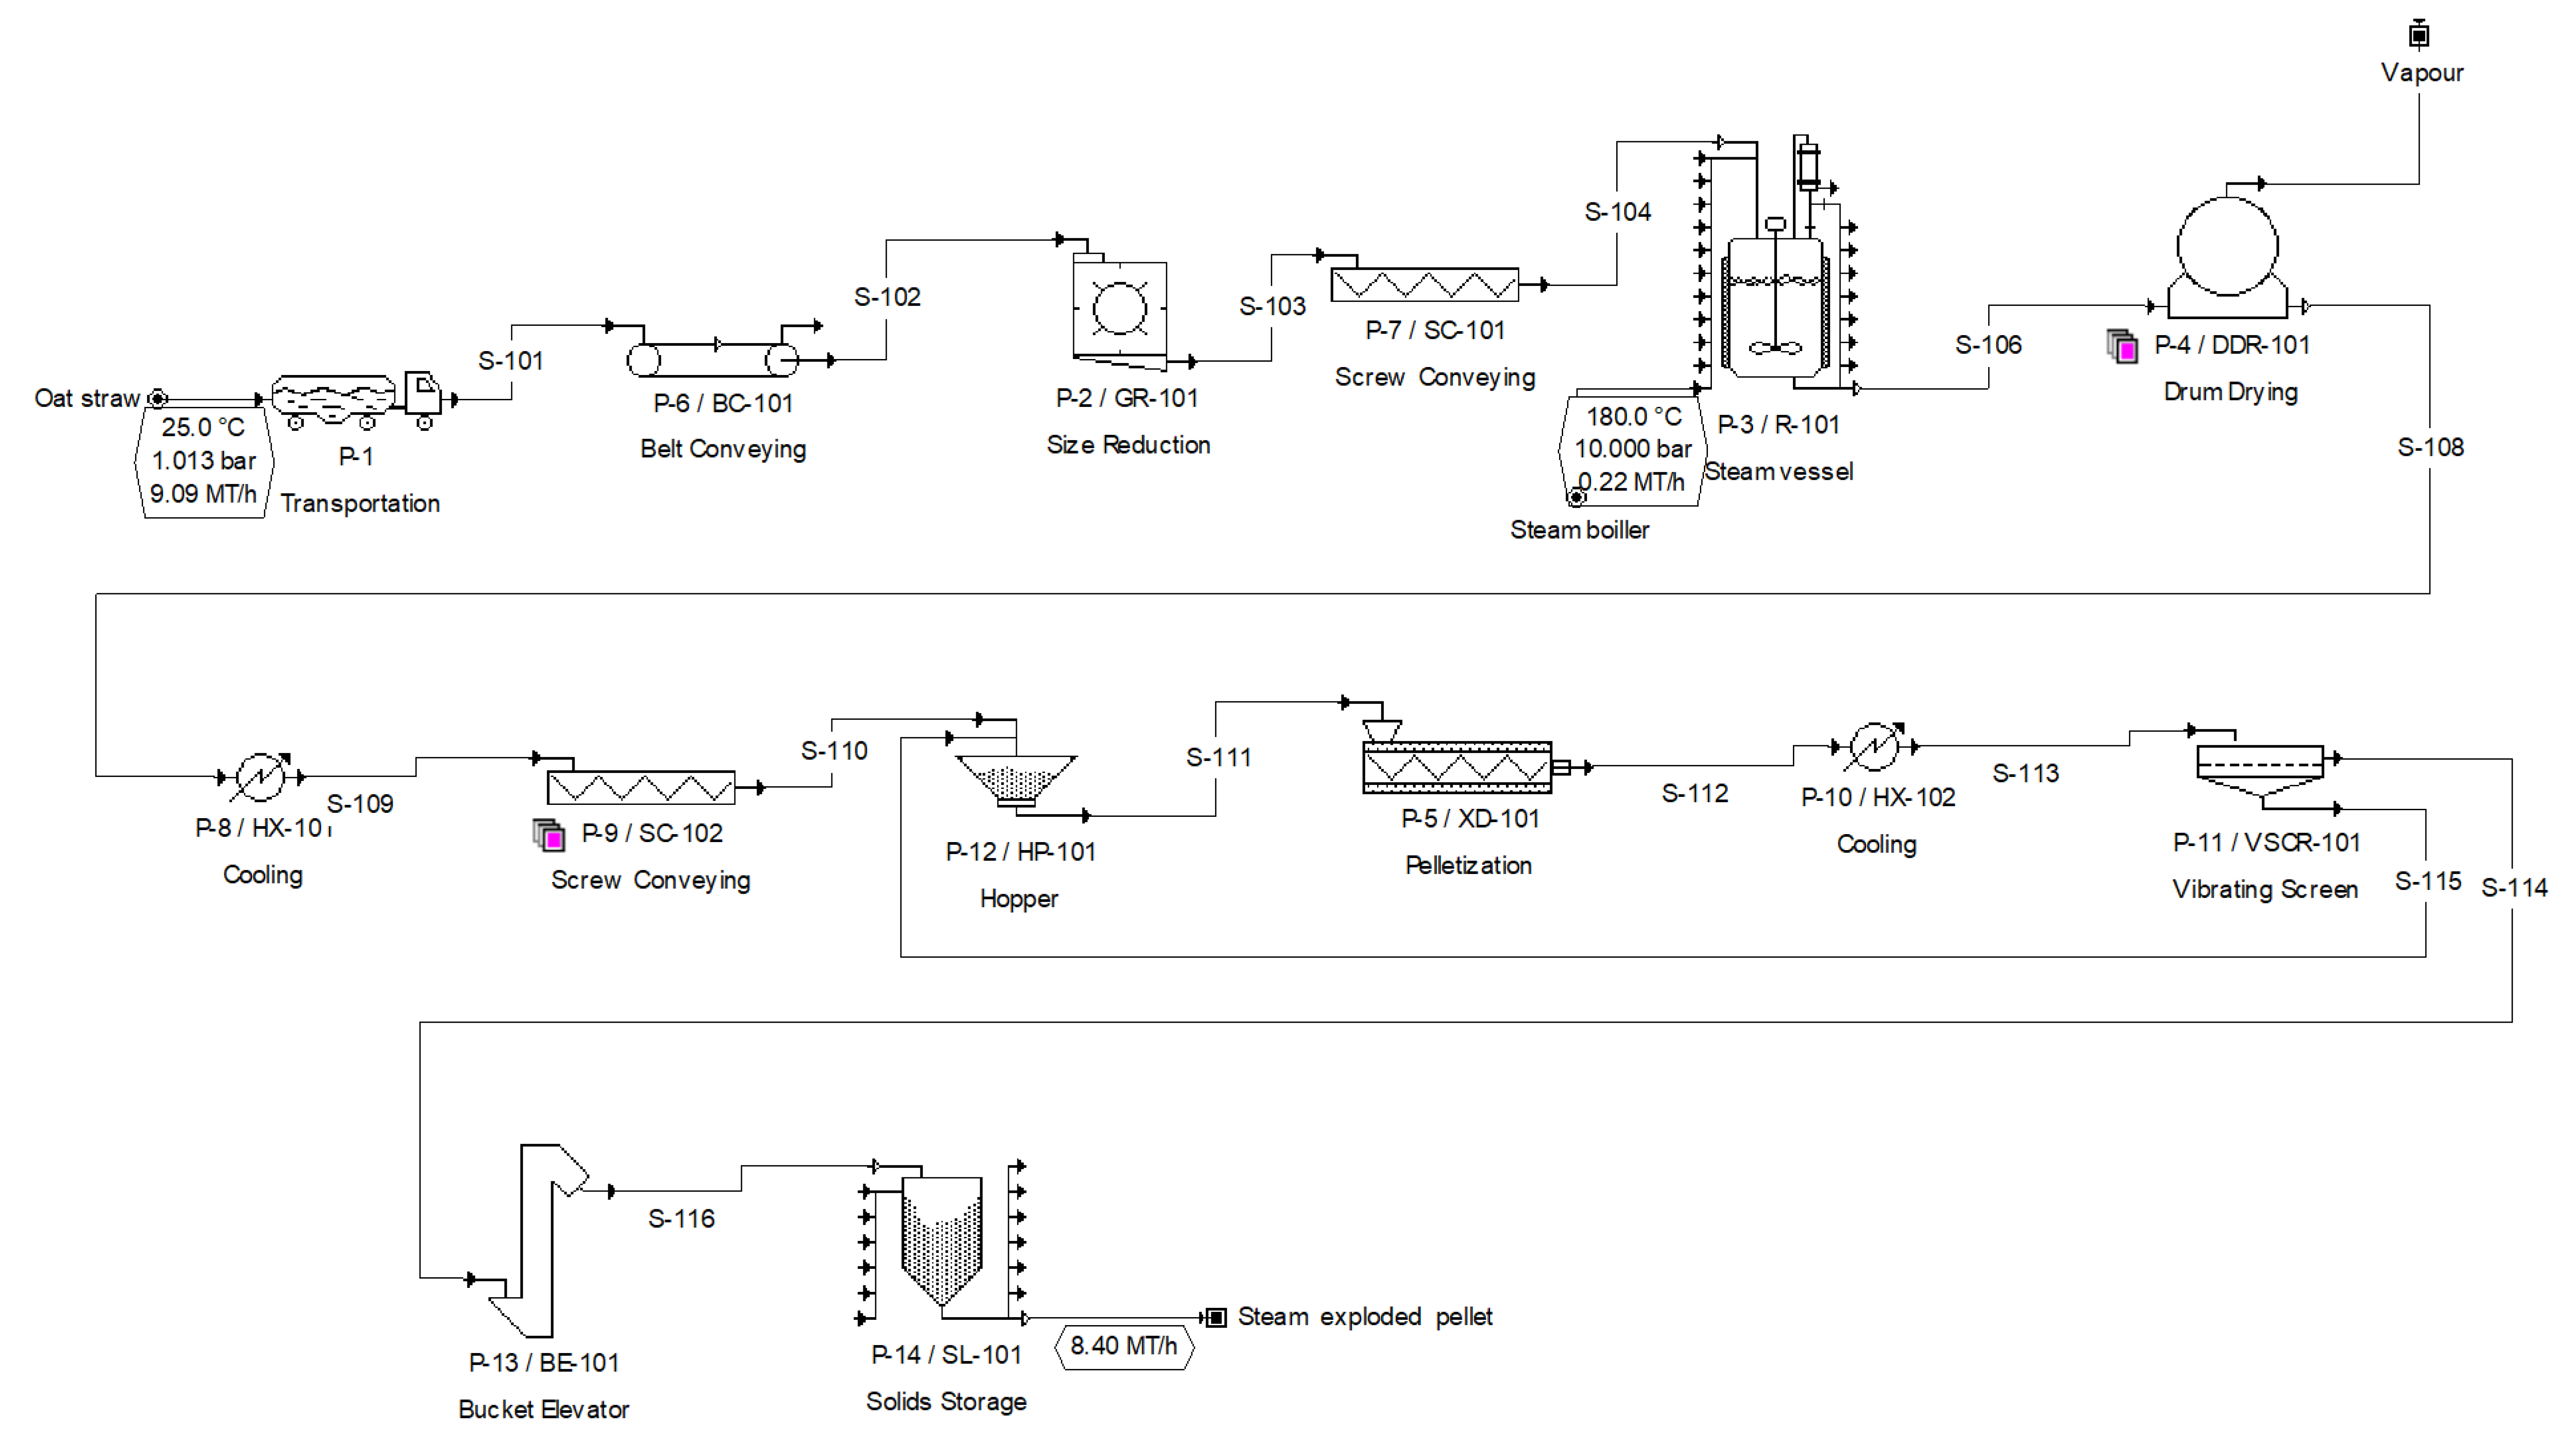
Figure 1 and Figure 2 show the torrefaction and steam explosion pretreatment process. The steam explosion pretreatment process adopted in this study was similarly carried out by Onyenwoke et al. [29]. This process consisted of a steam boiler, reactor, and a discharge at the bottom of the vessel. A steam treatment of samples submitted at 180 °C for 9 min was considered for this analysis due to a lower energy consumption. Screw conveyors were used to introduce the feedstocks into the vessel (10.00 bar pressure). The steam was produced by the high-pressure boiler, and when the required reaction temperature was attained, the ball valve was opened manually to allow the saturated steam to enter the reactor chamber (vessel) to treat the sample for a specified period of time. The steam-exploded sample was conveyed to the dryer with a belt conveyor.
The torrefaction pretreatment process adopted in this study was similarly carried out by Onyenwoke et al. [31]. This process consisted of a microwave, reactor, and condenser system. The preferred thermal conditions for this study were 250 °C and a retention time of 9 min based on the optimum condition studied [31]. A water-cooled condenser system was designed to trap the torrefaction gases that exited the microwave reactor. The condensable gas was split into a storage tank and a pelletization section to be used as a binder. The torrefied sample was discharged through a water-cooled screw [39], which enabled the torrefied samples to cool below 100 °C to prevent auto-ignition [40].

2.2.3. Pelletization Process

A pelletizer was used to simulate this process. The die temperature was set at 95 ± 2 °C. A screw conveyor was used to introduce the dried steam-treated sample into the extruder; then, the pellets were ejected and cooled. During the pelletization of the torrefied samples, the torrefaction liquid was introduced as a binder. The torrefied samples and the torrefaction liquid were thoroughly mixed in a hopper (P-12/HP-101) prior to their introduction into the extruder. A bucket elevator was used to convey the formed pellets to the storage tank, while the pellet crumbles were reintroduced to the pelletizer to make better pellets. During pelletization, the energy consumed was assumed to be 85.7 kWh t −1 as described by Yun et al. [41]. Prior to the storage of the pellets formed, the pellets were allowed to pass via a counterflow cooler to reduce the temperature and avoid ignition during storage [42].

2.2.4. Scenario

There are six scenarios established in this study as potential bioenergy enterprises: (1) wood pellet production from raw sawdust in a pellet plant, (2) straw pellet production from raw oat straw in a pellet plant, (3) integrated torrefied treated sawdust pelletization plant utilizing the torrefaction liquid (TL) as a pellet binder, (4) integrated torrefied treated oat straw pelletization plant utilizing the torrefaction liquid (TL) as a pellet binder, (5) integrated steam explosion-treated sawdust pellet plant, and (6) integrated steam explosion-treated oat straw pellet plant. The pellet plant was intentionally sited in close proximity to feedstock sources. The Biomass Inventory Mapping and Analysis Tool (BIMAT) developed by AAFC [33] was used to identify high oat straw-producing areas around the proposed pellet biorefinery. Scenarios 1 and 2 produce regular wood pellets and agricultural residue pellets, respectively. Figures S1 and S2 depict the process of pelleting raw sawdust and oat straw, respectively. Figure 1 shows the pellet production process for scenario 3. Figure S3 depicts the pellet production process for scenario 4. Nitrogen gas was supplied to the reactor to purge the system and provide an inert environment suitable for the torrefaction process. A heating rate of 50 °C min−1 was assumed in this case to maximize solid yield [43]. Figure S4 and Figure 2 depict the production process of steam-exploded sawdust and oat straw pellets, respectively. The generated steam was injected into the reactor to submerge the feedstock. The feedstock was allowed to remain inside the reactor for a period of 9 min as the conditions increased to 1000 kPa and 180 °C. The steam-exploded sawdust was conveyed to a rotary drum dryer to remove the excess moisture available in the feedstock. During the drying process, there was an escape of some volatile compounds. Shahrukh et al. [44] reported that the drying process utilizes a huge amount of energy during the steam pretreatment process, which considerably increases the energy demand. These scenarios were evaluated based on feedstock, procedures, operations, and their mechanisms, followed by a cost analysis.

2.3. Cost Analysis

The purpose of modeling and simulation of the process was to determine the cost of pellet production and to ascertain the basic economic requirement for prospective research and development. The cost presented in this study was based on 2023 US dollars; Table S2 summarizes the cost assumptions and the economic evaluation parameters used in this study. The plant capital investment and operating cost were calculated based on data from other researchers on similar technoeconomic studies [30,45,46,47,48,49,50] and the built-in cost models in SuperPro designer. The equipment purchase cost (PC) was evaluated on the established equipment sizes acquired from the process model after the materials and energy balance evaluation. The total equipment purchase cost is the summation of listed and unlisted equipment. The summation of direct fixed capital (DFC), start-up and validation costs, and working capital is the total capital investment (TCI). The calculation of the various components of the DFC is shown in Table 2.
Startup cost and validation cost are 15% of the DFC [51], while working capital was calculated to be 5% of the DFC [51]. The annual plant operating costs used in this study comprise raw material, facility-dependent, labor-dependent, laboratory, and utility. Facility-dependent costs included maintenance (5% DFC), depreciation cost, and miscellaneous cost.
Capital cost and equipment cost for the pellet production capacity were estimated to scale up based on the relationship between capital cost and pellet plant size as represented in Equation (5):
C n e = C e x ( Q n e Q e x ) 0.6
where 𝐶𝑛𝑒 denotes the estimated capital cost; 𝐶𝑒𝑥 denotes the empirical capital cost of a baseline pellet plant with size 𝑄𝑒𝑥; and 𝑄𝑛𝑒 is the pellet plant size. The exponent 0.60 is selected as the scaling factor to depict the economic and financial effects of increasing or reducing the pellet plant size [22].

2.4. Profitability Analysis and Minimum Selling Price of Pellet

A profitability analysis was carried out to determine the economic viability of the proposed process. A sensitivity analysis provides information on how the alternate form of the economic and process assumed variables influence the economic performance and the sensitive components of the design. The sensitivity analysis of a variable could steer prospective research and development efforts that, in turn, enhance the capacity of the different biorefinery scenarios [52]. The minimal selling price (MSP) of the pellet was estimated using a discounted cash flow analysis (DCFA). This study assumed that the plant operates uninterrupted for 24 h a day and 330 days in a year, amounting to 7920 h per year. The MSP was evaluated using a 10% discount rate, where the net present value (NPV) is equal to zero (selling price at which NPV = 0). Javier and Ortiz [53] described the profitability index analysis in detail.
The profitability of the pellet biorefinery plant was estimated using the net present value (NPV), which ascertains the enterprise or projects that will yield the greatest return in each period. The NPV was evaluated based on Equation (6):
N P V = I 0 + j = 1 T Ø j   ( 1 + R ) j
where I 0 represents the initial investment in the pellet plant; Ø j   denotes annual cash flow; R denotes the discount rate; and j = 1, 2, … T is the year with N terminal time.

3. Results and Discussion

3.1. Capital Cost

Tables S3–S5 outline the purchase cost of the major equipment used for each scenario. In Scenarios 1 and 2 (regular pellet process), equipment costs were the most economical when compared to those in Scenarios 3, 4, 5, and 6, which were the pretreatment process. The pelletizer was the most expensive equipment in Scenarios 1 and 2 (US$212,000), while the bucket elevator (US$20,000) was the least expensive. The purchase cost of the major equipment used for Scenario 1 was approximately US$1.27 M, while approximately US$1.32 M was used to purchase the equipment in Scenario 2. Similarly, Alizadeh et al. [30] estimated the total equipment cost for producing 72 kt/yr of wood pellets at US$1.7 M based on 2020 US dollars, while Wolbers et al. [54] estimate for producing 87 kt/yr of wood pellets per year was US$1.5 M based on 2016 US dollars.
Table S4 summarizes the cost of purchasing equipment for producing torrefied pellets (sawdust and oat straw). Scenario 3 (torrefied sawdust pellets) and Scenario 4 (torrefied oat straw pellets) were almost in the same range (US$7.33 M and US$7.86 M, respectively) for production capacities of 9.09 t/h of pellets. Similarly, Valdez [45] reported an estimate of US$6.53 M based on 2023 US dollars for the production capacity of 4.5 t/h of torrefied pellets. In another study, Mobini Dehkordi [55] estimated that US$26.08 M based on 2023 US dollars was used to purchase equipment to produce 137 kt/yr of torrefied wood pellets. The breakdown of the equipment purchase cost shows that the torrefaction reactor is the most expensive unit with approximately 51% of the purchase cost, while the least expensive unit is the conveyor. Sarker et al. [51] reported that the torrefaction reactor was the most expensive unit, accounting for 32% of the purchase cost of the equipment. In a similar manner, Manouchehrinejad et al. [19] reported that the cost share for the torrefaction reactor was approximately 34% of the total capital investment (TCI) for the torrefaction-before-pelleting (TOP) process, while Koppejan et al. [10] reported that a torrefaction reactor accounts for 45% of the TCI for the TOP process. The difference in the cost of the torrefaction reactor may be due to its capacity.
The cost of purchasing equipment for producing steam-exploded pellets (sawdust and oat straw) is shown in Table S5. Scenario 5 (steam-exploded sawdust pellets) and Scenario 6 (steam-exploded oat straw pellets) were almost in the same range (US$2.13 M and US$2.68 M, respectively) for pellet production capacities of 9.09 t/h. According to Alizadeh et al. [30], the cost of purchasing equipment for producing steam-exploded pellets and electricity was estimated at US$3.3 M based on 2020 US dollars ($3.92 M based on 2023 US dollars) with production capacities of 53 kt/yr steam-exploded pellets. In a similar manner, Wolbers et al. [54] reported that the total equipment cost for producing 84 kt/yr steam-exploded pellets was estimated at approximately US$2.3 M based on 2016 US dollars (US$2.94 M based on the 2023 rate).
The total capital investment (TCI) for the six scenarios is presented in Table 3. The TCI for producing regular pellets was approximately US$9.9 M (Scenarios 1 and 2). Alizadeh et al. [30] reported a TCI of US$10.5 M based on 2020 US dollars for producing wood pellets from untreated sawdust; with the cumulative rate of inflation at 18.6%, this value stands at $12.46 M in 2023. Similarly, for a capacity of 80 kt/yr of wood pellets, Peng [56] recorded a TCI of $9.1 M on 2012 US dollars (equivalent to $12.17 M in 2023). Scenarios 3 and 4 have TCIs of approximately US$54.5 M and US$60.3 M, respectively. The high TCI recorded in Scenarios 3 and 4 was because of the purchase cost of the torrefaction equipment. Peng [56] recorded a TCI of US$32.16 M on 2012 US dollars ($43.10 M in 2023) for torrefied wood pellet production. The TCIs for Scenarios 5 and 6 were US$15.9 M and US$19.9 M, respectively. Similarly, Alizadeh et al. [30] reported a TCI of US$24.68 M on 2023 US dollars for a plant including combined heat and power (CHP), and steam-exploded wood pellets was estimated.

3.2. Operating Cost

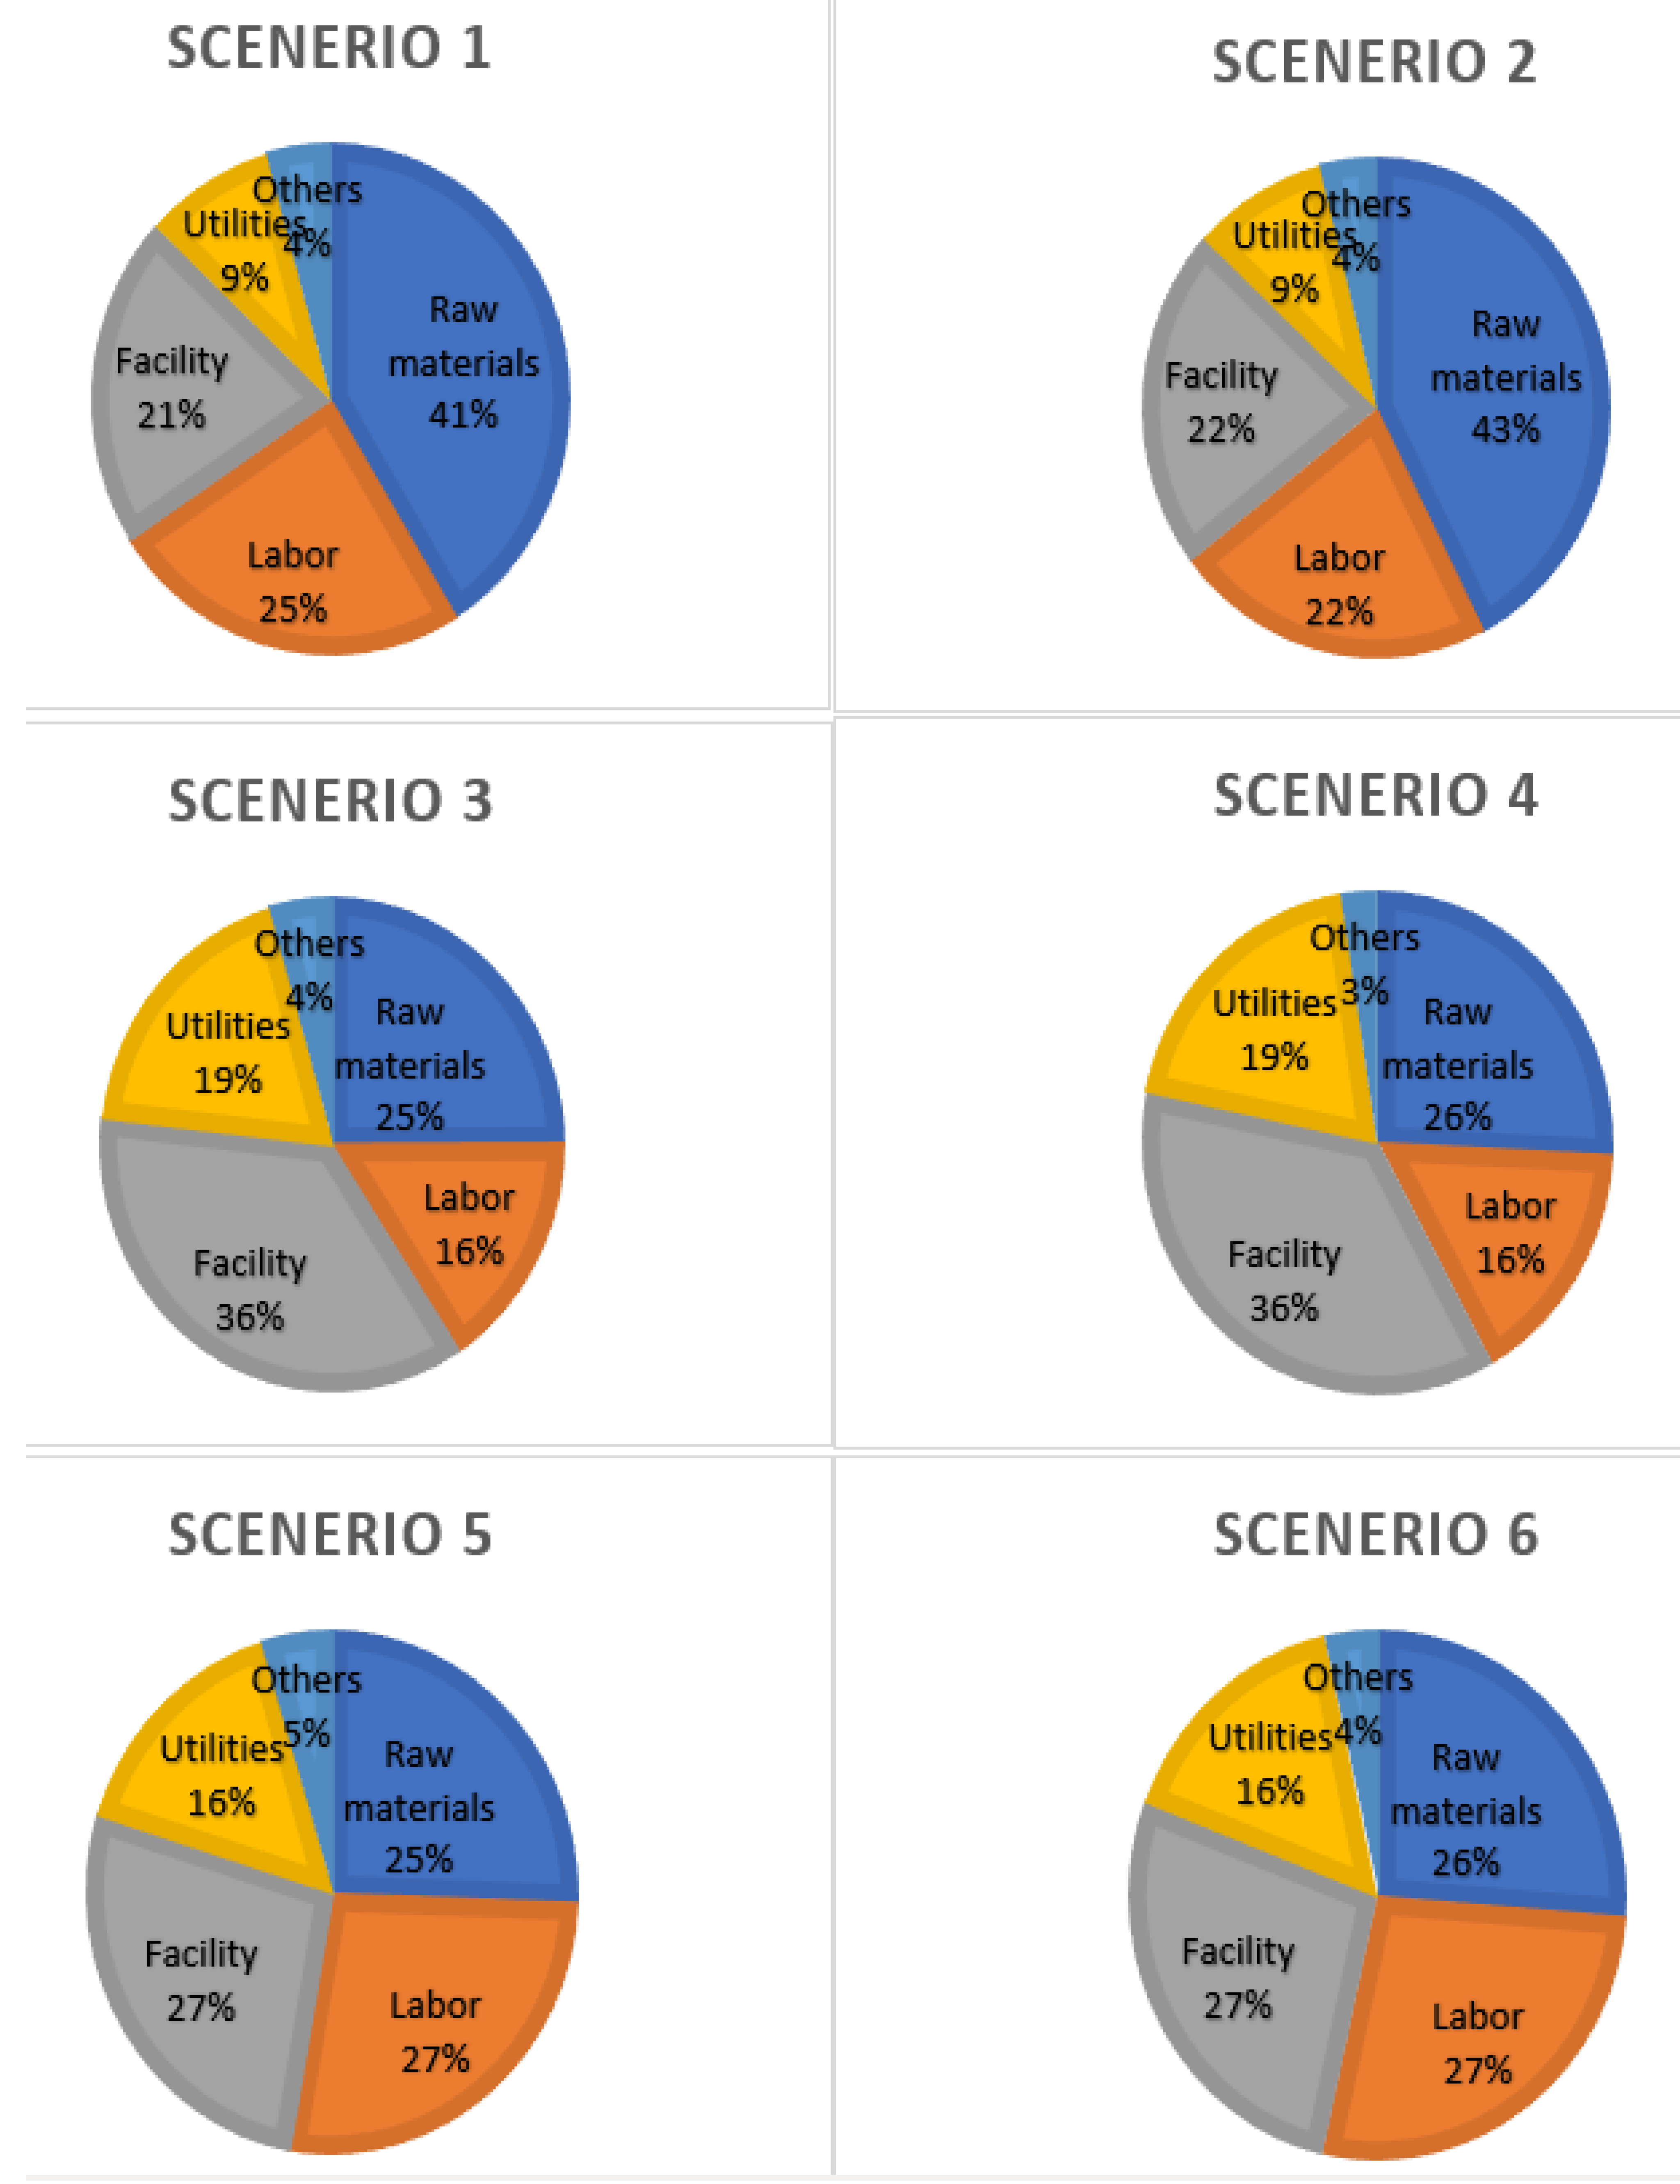
The annual operating cost (AOC) includes utilities; the costs associated with purchasing raw materials, chemicals, waste treatment, and disposal; and facility-dependent, labor-dependent, and laboratory costs. The feedstock cost and the facility-dependent, labor-dependent, and labor costs were the most influential parameters in all six scenarios. Figure 3 depicts the annual plant operating costs for each scenario. The main contributors to the operational expenditures (OPEX) in all scenarios were the cost of raw materials and facility-dependent cost, which ranged from 25 to 43% and 21 to 36%, respectively. The cost of labor (16–27%) was the third major contributor to the OPEX, while the utility cost ranged from 9 to 19% of the OPEX. According to Sarker et al. [51], the raw material cost contributed approximately 19–48% to the overall OPEX cost for both scenarios studied. Pirraglia et al. [57] studied the technoeconomic analysis of wood pellet production for U.S. manufacturers and reported that the cost of feedstock, labor, and utilities shared 27%, 24%, and 17%, respectively, of the OPEX. Alizadeh et al. [30] reported that the facility-dependent cost accounts for 56–61% of the OPEX and 24% as utility cost. An economic analysis of pellet production from untreated and torrefied oat hull was carried out by Valdez [45] in which facility-dependent costs ranged from 28 to 35%, labor cost was 18%, and utility cost shared 20%. Similarly, Sarker et al. [51] and Alizadeh et al. [30] reported the cost of labor as approximately 20% and 29%, respectively. The difference in the AOC of the compared studies could be attributed to the choice of feedstock and size of the plant.
Manouchehrinejad et al. [19] conducted technoeconomic analysis of integrated torrefaction and pelletization systems to produce torrefied wood pellets, where the feedstock cost and labor cost were reported to be the most influential parameters in all three scenarios studied. Also, Fadhilah et al. [49] concluded that the feedstock cost and labor cost were the most expensive sections, which accounted for approximately 27 and 43% of the unit production cost, respectively. Most of the production costs were from facility-dependent, raw material, and utility costs [49].

3.3. Profitability Evaluation

Pellets are the main product in this study. Scenarios 3 and 4 produced torrefaction liquid (TL), which was considered as a credit to the process. From a technoeconomic point of view, torrefaction byproducts, especially torrefaction liquids, have a higher profit potential because they contain formic acid, acetic acid, methanol, and furfural, which can be used for the production of green chemicals [51]. Torrefied liquid can also be used to produce “liquid smoke”. The economic value of liquid smoke is in terms of its potential uses: natural food ingredient, preservation, flavoring, coloring of treated food, and nonfood uses (e.g., biofertilizer, biopesticide, growth-stimulant, other bioactive compounds) [45,51].
The minimum selling price (MSP) of regular, torrefied, and steam-exploded pellets from sawdust and oat straw was calculated for a plant capacity of 9.09 dry t/h of feedstock processing at a 10% discount rate. The MSPs of regular pellets from sawdust and oat straw were $113.4/t and $118.7/t, respectively. The MSPs of torrefied pellets from sawdust and oat straw were $283.4/t and $298.7/t, respectively, while the MSPs of steam-exploded pellets from sawdust and oat straw were $200.5/t and $208.4/t, respectively. These indicate that the project becomes profitable when the pellets’ selling price (PSP) is higher than the break-even point. Manouchehrinejad et al. [19] reported that $207/t was the MSP of torrefied wood pellets of a 100 kt/yr plant capacity. Similarly, Agar [8] calculated the MSP of torrefied wood pellets to be $211/t. Sarkar et al. [51] reported the MSP of pellets with additives and without additives to be $103.4/t and $105.1/t, respectively. Shahrukh et al. [18] determined the MSP of steam-pretreated forest residue, wheat straw, and switchgrass, and reported $148.50/t, $152.63/t, and $156.61/t, respectively. The difference in the MSP could be because of the cost of production for the various studies.
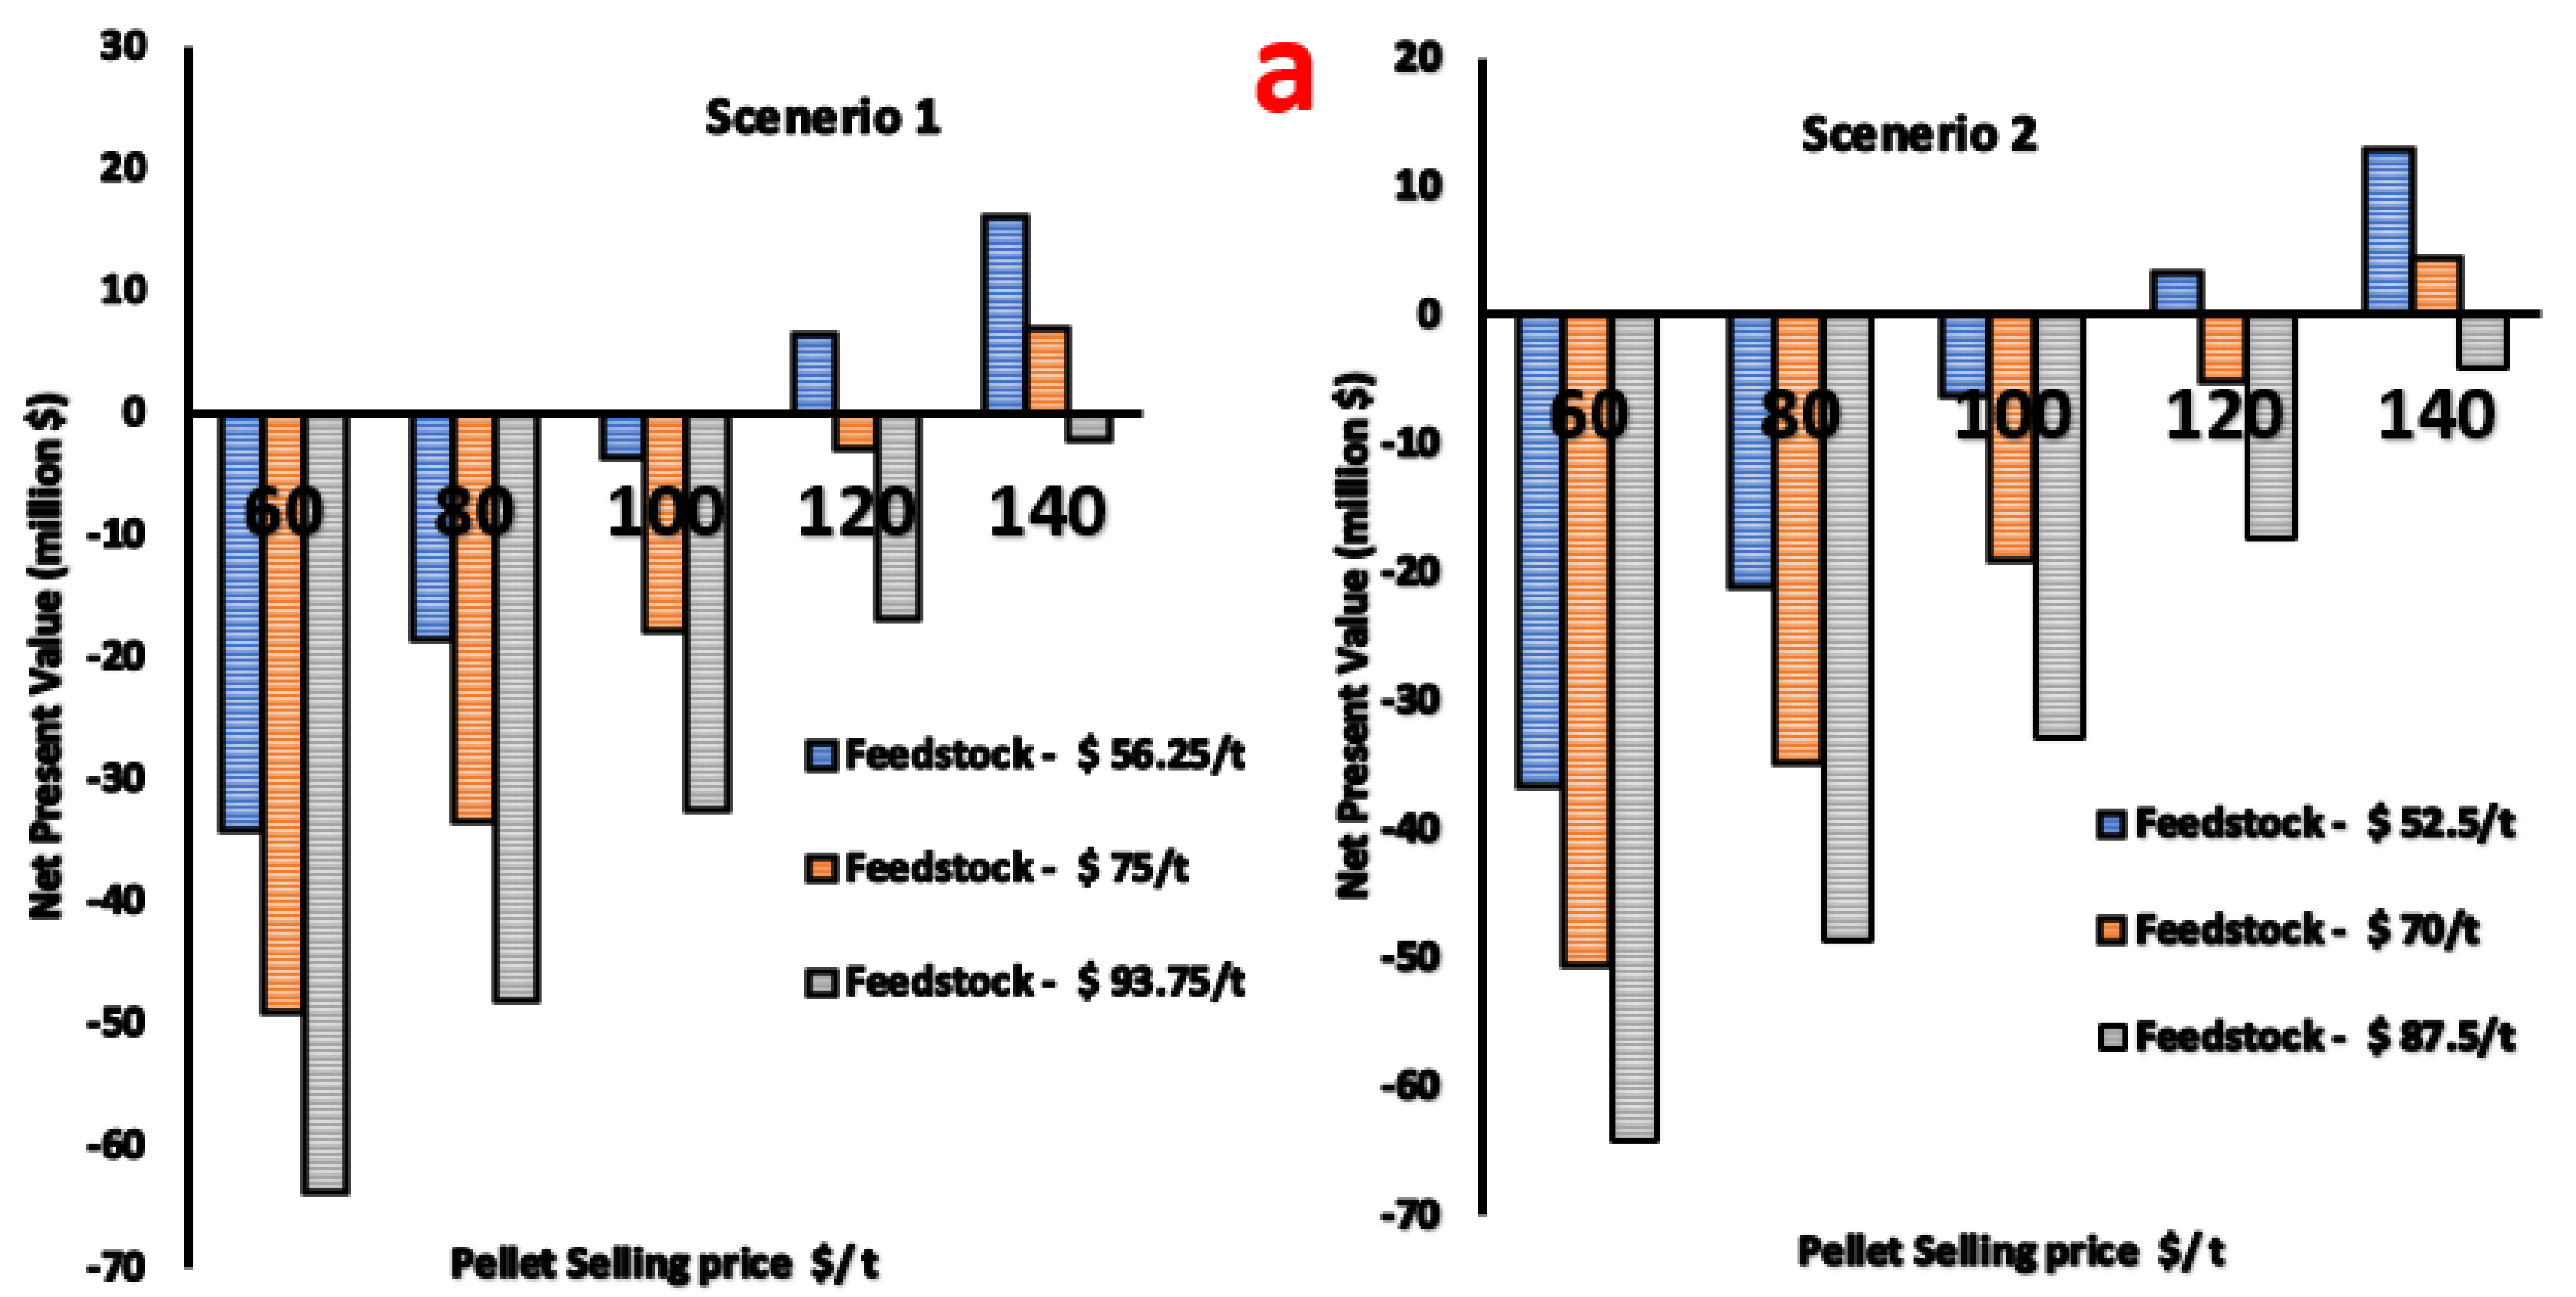
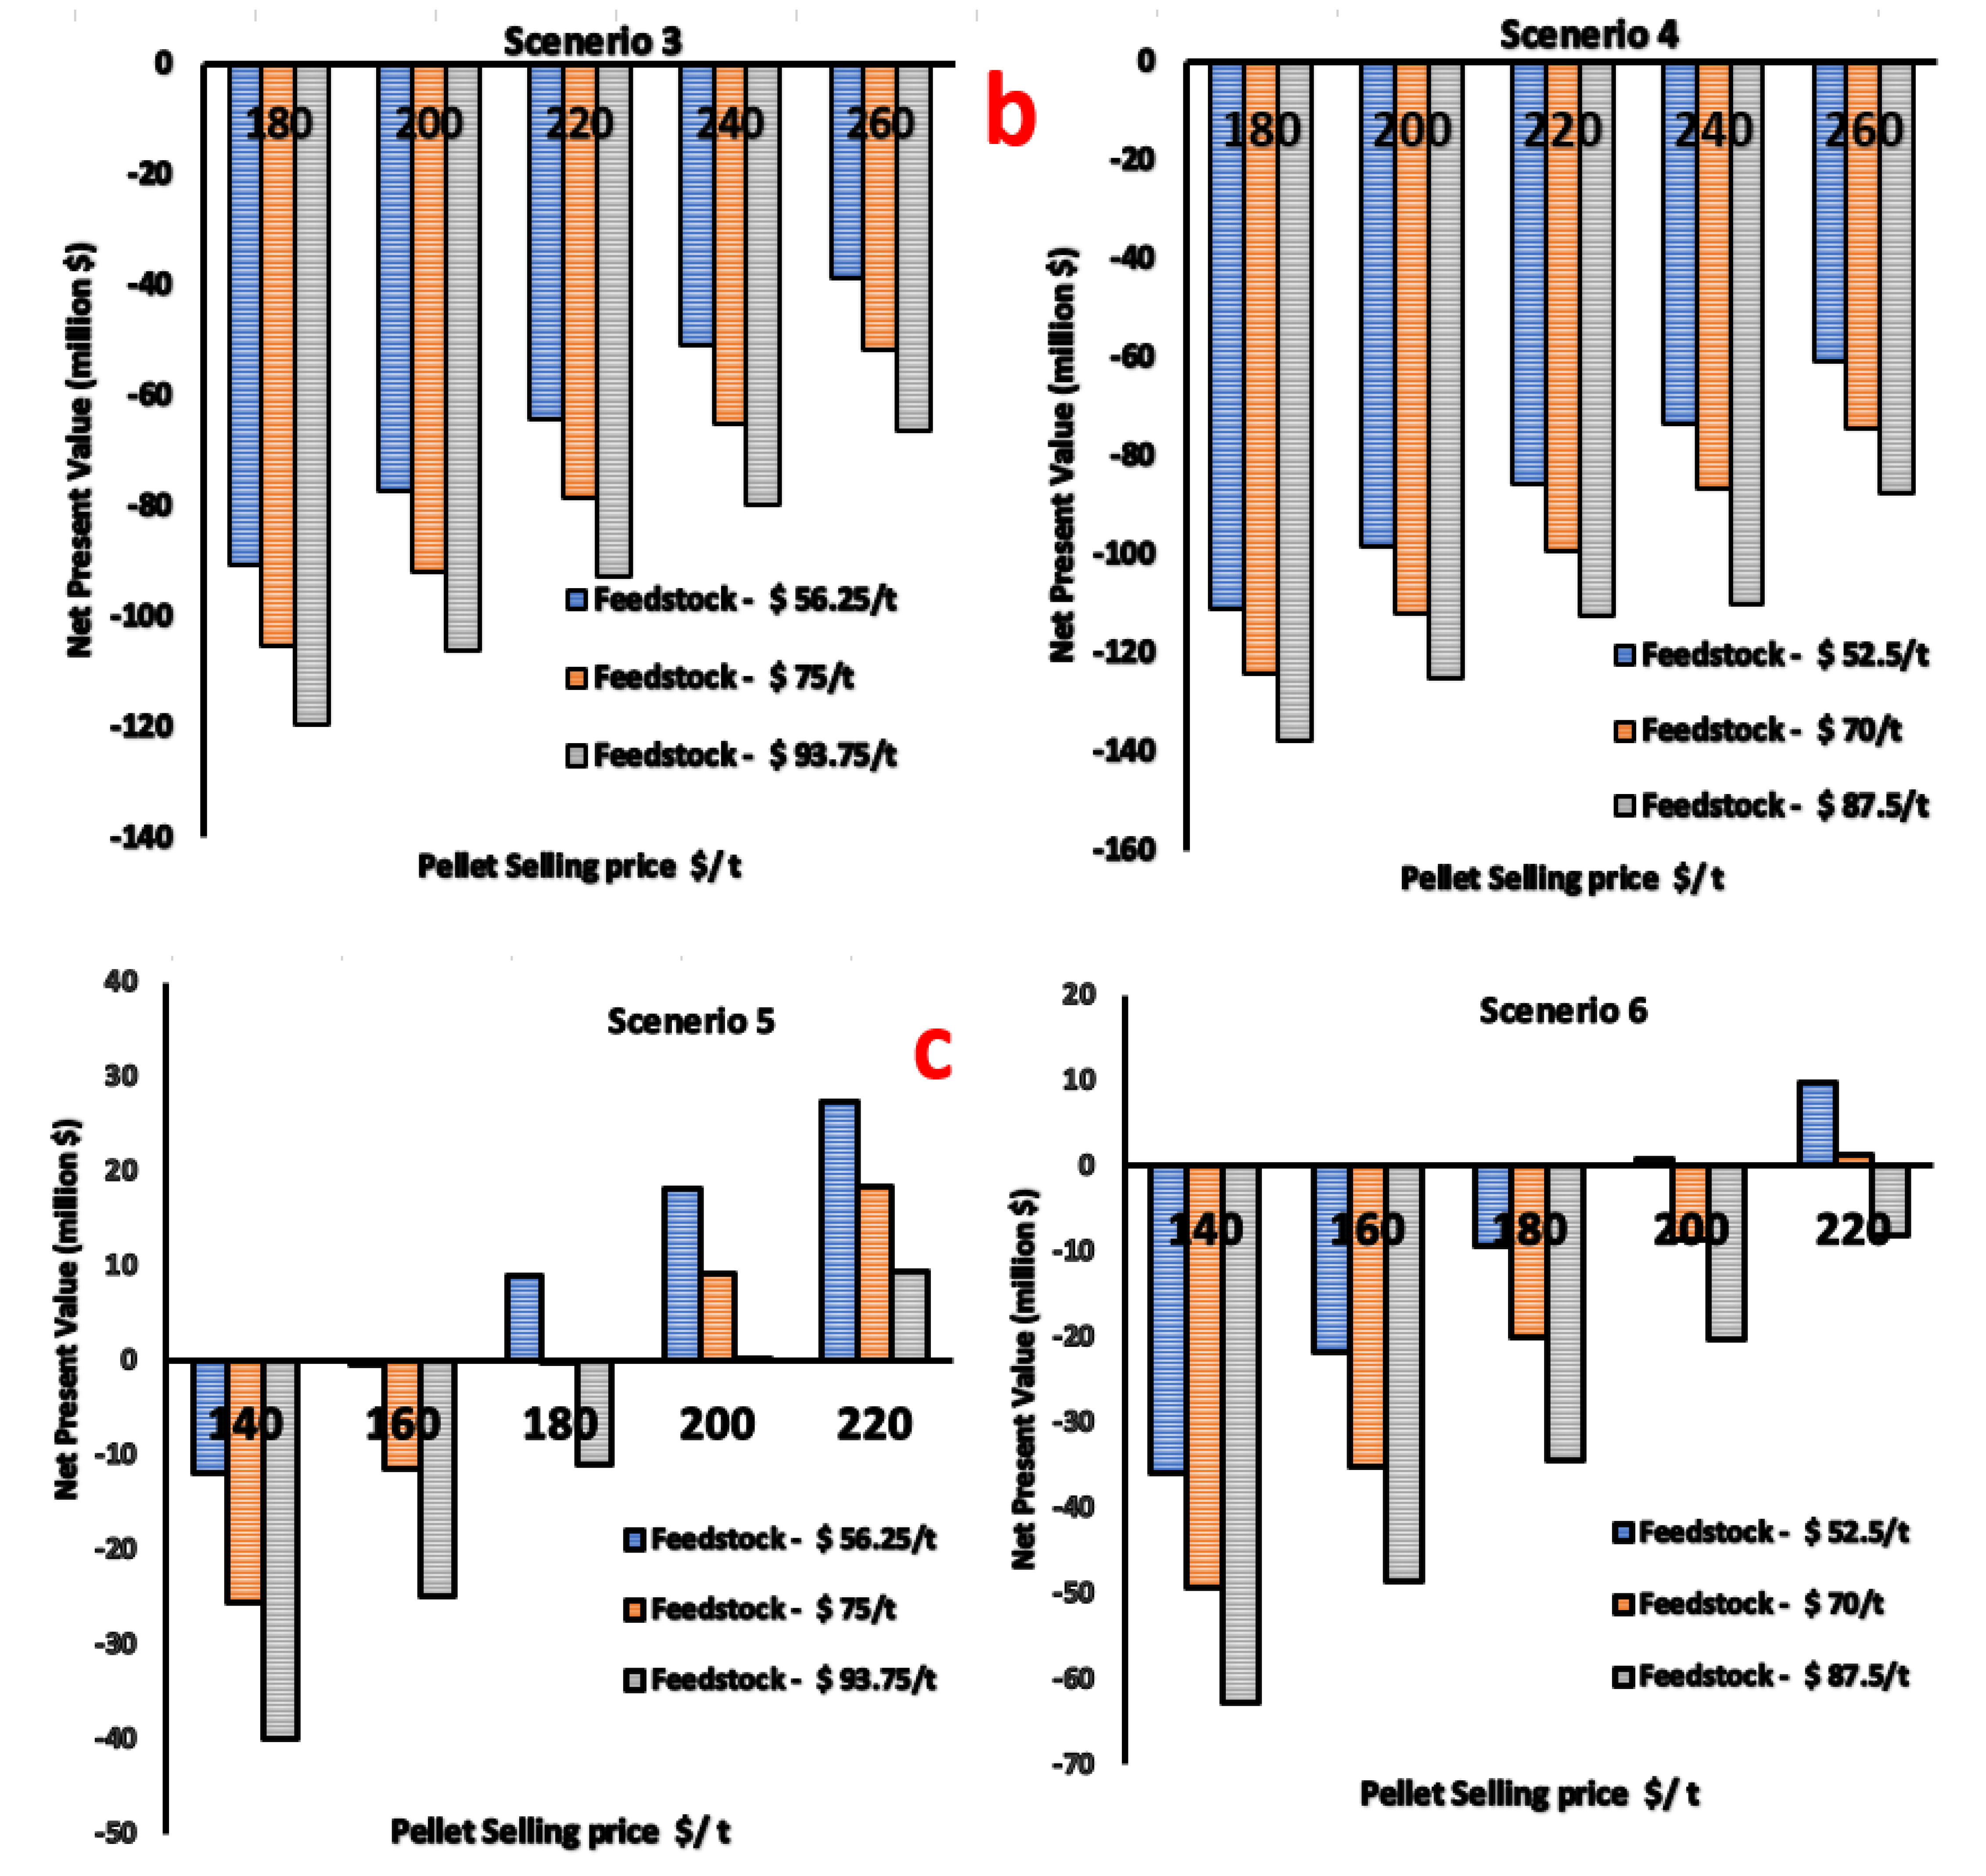
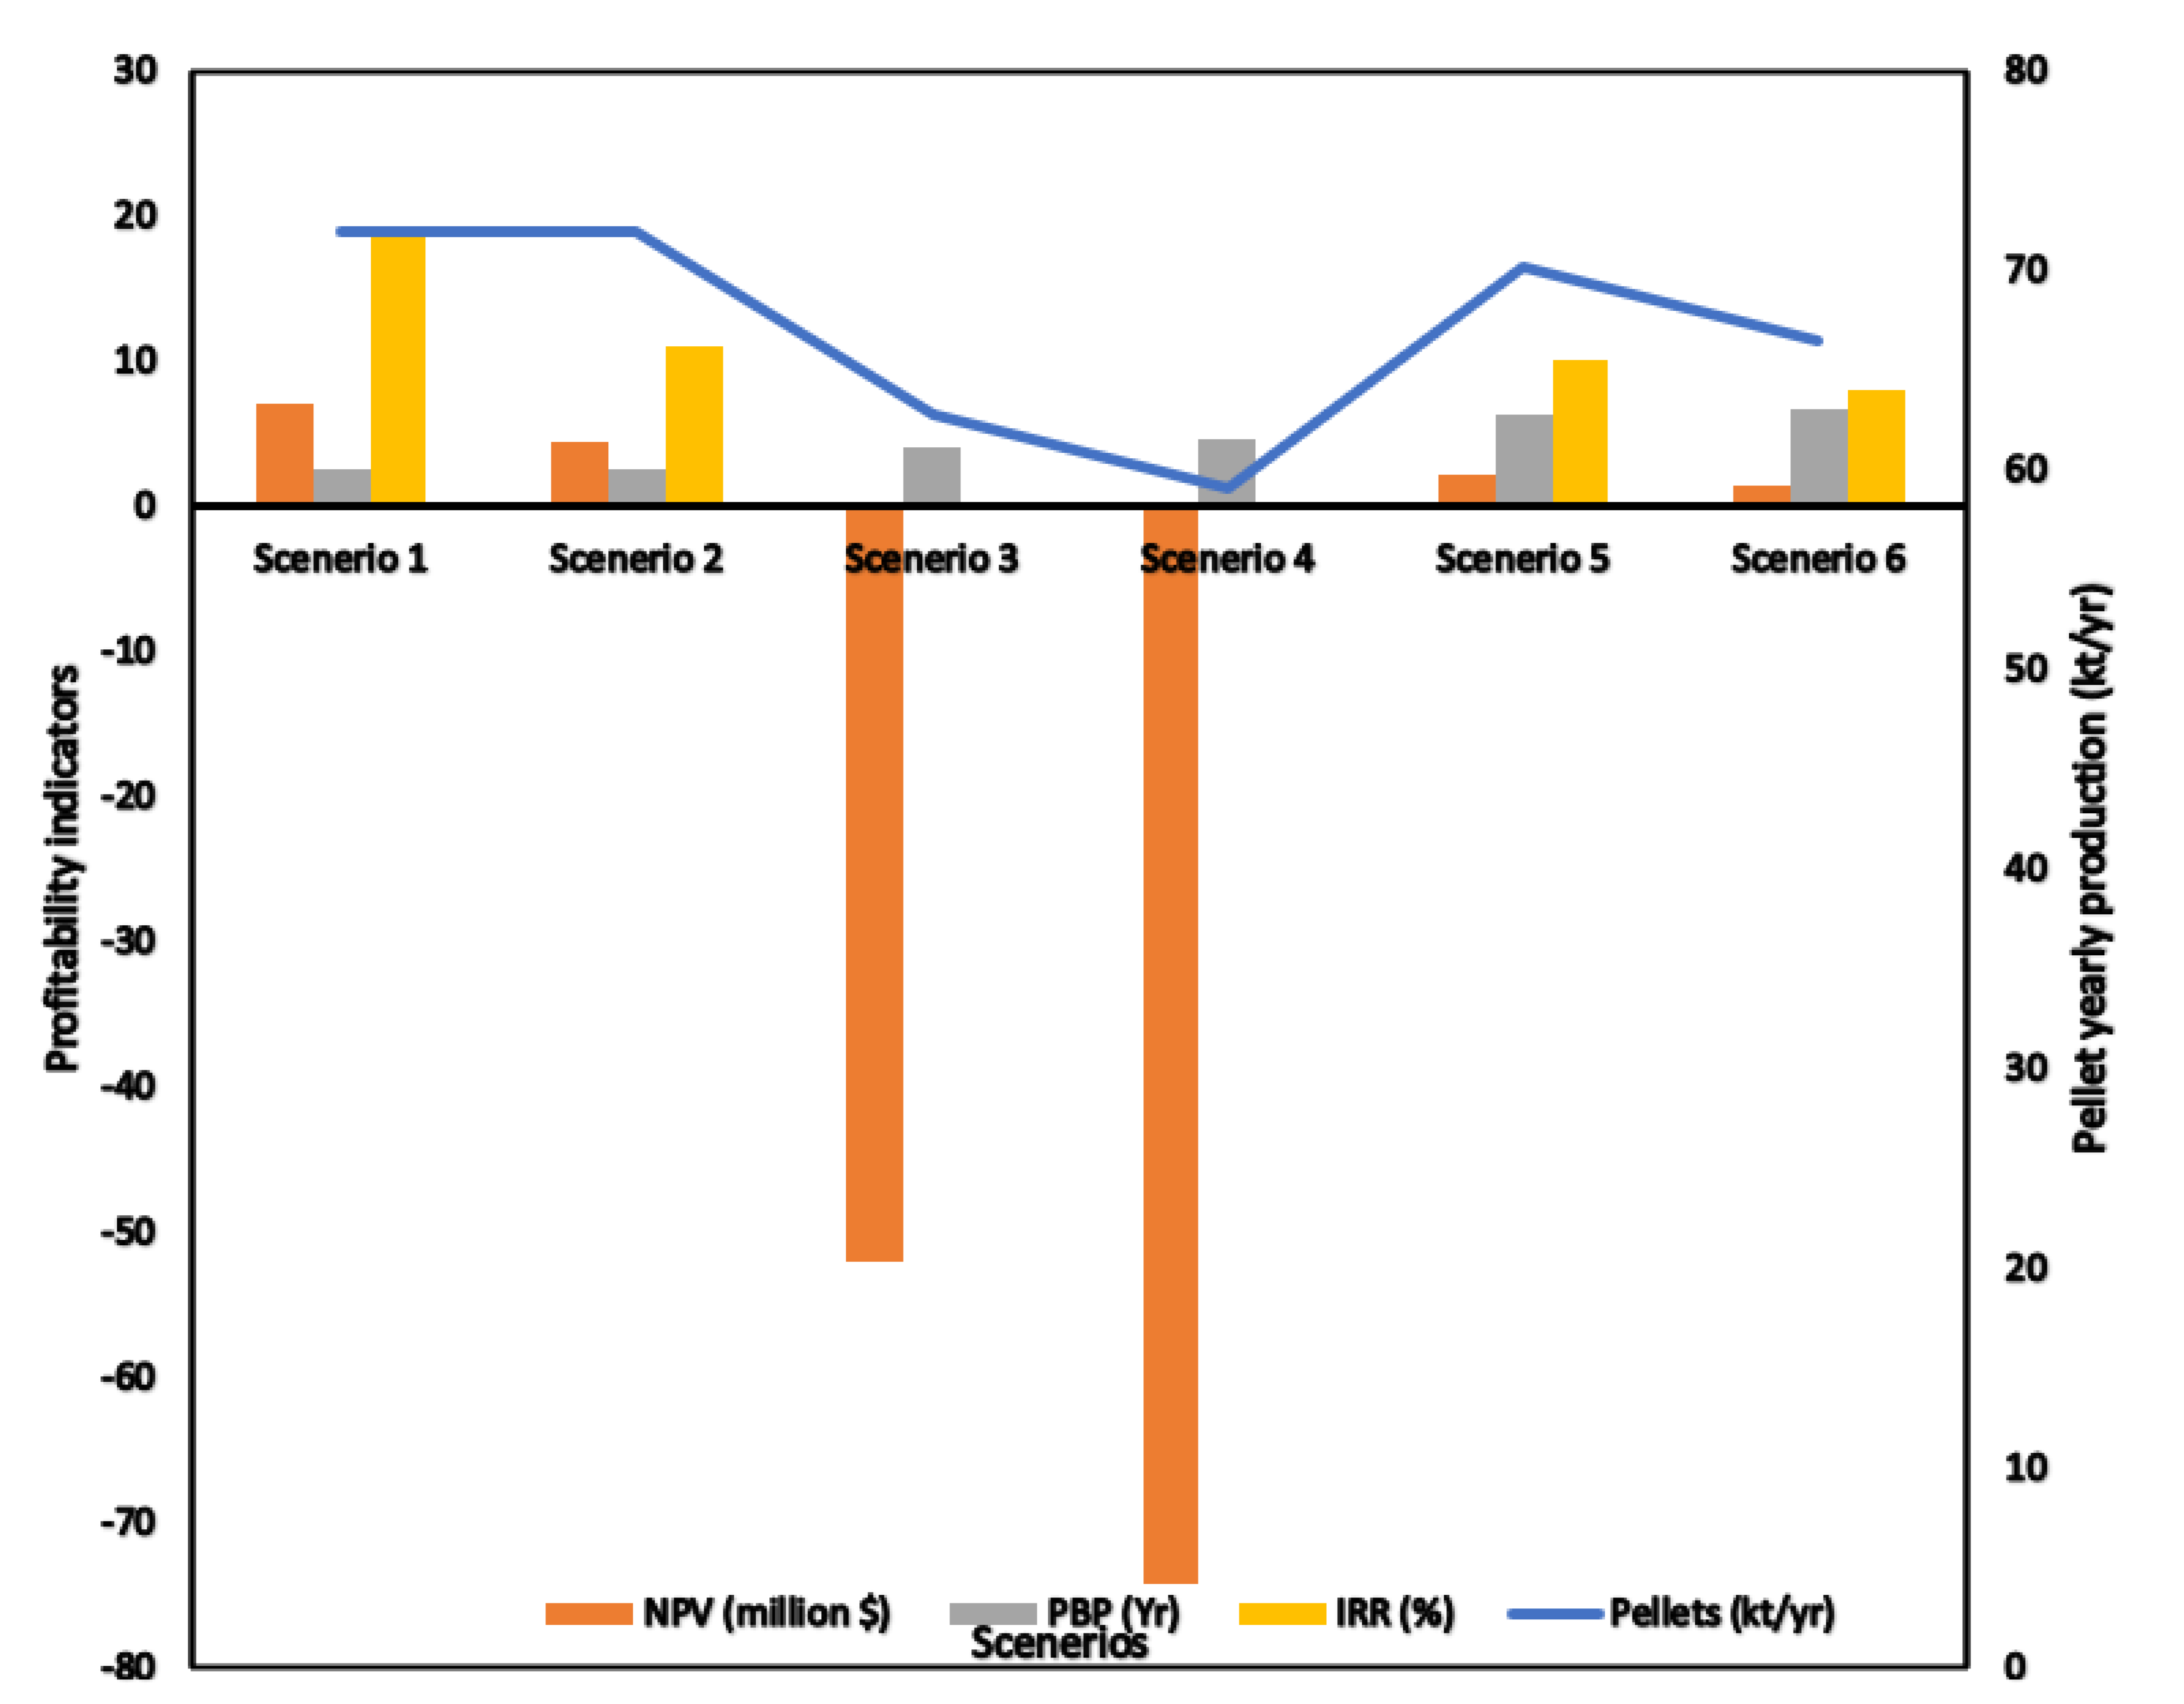
The effect of feedstock cost on NPV at different pellet selling prices is shown in Figure 4. The feedstock price is important, and it is attributed to pellet production cost. The assumptions regarding pellet price were made based on literature surveys. Mupondwa et al. [22] reported an approximate price of $120/t for wheat straw pellets, which were used for heat applications. Similarly, Pirragila et al. [26] reported the price of torrefied wood pellets as US$260/t for 100 kt/h of plant capacity. In the same manner, Sarker et al. [51] considered $170/t for torrefied canola residue pellets, while Shahrukh et al. [18] conducted a technoeconomic assessment of pellets produced from steam-pretreated biomass feedstock and reported a price range of steam-exploded pellets and regular pellets from approximately US$140/t to $160/t and US$80/t to $95/t, respectively. A feedstock cost of US$70/t and US$75/t were considered for oat straw and sawdust, respectively, in the baseline model, which resulted in a negative NPV at the regular pellet selling price (PSP), which is below $140/t (Figure 4a), and the pretreated pellet selling price is below US$200/t (Figure 4b,c). A positive NPV was obtained at a PSP of US$140/t for untreated pellets, while steam-exploded pellets sold for above $200/t, which resulted in a positive NPV. Figure 4b showed that, if the PSP of torrefied pellets was US$260/t, the NPV remained negative. The sensitivity of NPV to the feedstock cost was performed by varying the cost of sawdust and oat straw by 25% (above and below the baseline price). Figure 4a shows that, if the PSP was below US$120/t, the reduction in the feedstock cost by 25% did not result in profitability of pellet production. However, when the PSP was increased to US$120/t and further to $140/t and the feedstock cost was maintained at 25% less than the baseline price (US$75 and $70 for sawdust and oat straw, respectively), these led to an approximately 60% increase in NPV, which was approximately 2.3 times the NPV of the baseline model. Similarly, Figure 4c shows that, at a PSP below US$180/t for steam-exploded pellets, reducing the feedstock cost by 25% did not improve the economics of pellet production. However, increasing the PSP to US$200/t and further to $220/t and maintaining the feedstock cost at 25% (US$56.25 and $52.50) less than the baseline price (US$75 and $70 for sawdust and oat straw, respectively) resulted in a 14% increase in NPV, which was approximately 1.2 times the NPV of the baseline model. Generally, increasing the feedstock cost by 25% (US$93.75 and $87.50) more than the baseline price (US$75 and $70 for sawdust and oat straw, respectively) did not result in the profitability of pellet production. Although Scenario 5 showed a positive NPV when the PSP was increased to US$220/t, it was 50% less than the NPV of the baseline model. Figure 4b depicts the NPV at a 7% discount rate for torrefaction-pretreated pellets at various PSP and feedstock prices. The negative NPV was found in both scenarios when the PSP was increased from US$180/t to $260/t. Similarly, Valdez [45] reported that the inclusion of the torrefaction equipment to the direct fixed capital cost made the project unprofitable. Figure 5 depicts the profitability analysis and the maximum pellet capacity of this study. The PSPs of US$140/t, $240/t, and $260/t were considered for regular pellets, steam-pretreated pellets, and torrefied pellets, respectively. Scenarios 1 and 2 have 72 kt/year of regular pellets produced, which is equivalent to the initial feedstock (no loss). Scenarios 3–6 (steam explosion and torrefaction) resulted in the loss of some materials in the form of non-condensable gas due to the pretreatment process.
By analyzing the NPV, internal rate of return (IRR), and payback period (PBP), the profitability of fuel pellet production from various conditions was determined. Cash flow is generated as soon as the construction is concluded and the project begins. These funds make it possible that, eventually, the cash flow becomes positive. The PBP is the period required to recuperate the original investment. The IRR is a metric that is used to evaluate the return of an investment. Any business must have a PBP that is less than the period of the project for it to be economically feasible. Considering the baseline models, this study found that the PBP was lower for undiscounted and discounted cases for most of the scenarios when compared side-by-side with the entire life of the project. It can be highlighted that some of the proposed projects (Scenarios 1, 2, 5, and 6) were economically profitable for the production of fuel pellets. However, Scenarios 3 and 4 were not economically profitable to produce fuel pellets. The PBP only measures the duration to recover the initial investment and does not ensure the project’s feasibility beyond that point. Therefore, additional profitability indicators, such as NPV and IRR, were considered to complement the PBP. The estimated IRR values were 19%, 11%, 10%, and 8% for Scenarios 1, 2, 5, and 6, respectively. Since the same calculation applies to the various scenarios, it is evident that all mentioned scenarios were profitable. The PBPs for Scenarios 1 and 2 were the lowest (2.48 yr and 2.59 yr, respectively), followed by Scenarios 3 and 4 (4.07 yr and 4.64 yr, respectively) and, finally, Scenarios 5 and 6 (6.27 yr and 6.78 yr, respectively). Although Scenarios 3 and 4 had a higher investment but lower PBP than Scenarios 5 and 6, this may be because of the co-products from Scenarios 3 and 4 that generated more revenue. Similarly, Alizadeh et al. [30] recorded PBPs of 2.49 yr, 6.35 yr, and 3.38 yr for untreated wood pellets, steam-exploded pellets, and torrefied pellets, respectively. In the same way, Sarker et al. [51] studied the technoeconomic analysis of torrefied fuel pellet production from agricultural residue via the integrated torrefaction and pelletization process, reporting an estimated IRR value of 25% and 22% at a 10% discounted rate for both scenarios.

4. Conclusions

A technoeconomic analysis to produce regular and pretreated pellets via an integrated steam explosion, torrefaction, and pelletization system was conducted. Four scenarios of treated pellets were estimated and compared with two conventional pellet processes. For the base scenario, the model indicated a plant size of 72 kt/year for both regular pellet scenarios and approximately 59 kt–67 kt and 67 kt–70 kt for torrefied and steam-pretreated pellets, respectively. From the profitability analysis, facility-dependent and feedstock costs were the major significant contributors to the pellet production cost. The minimum selling price of the pellets for the six scenarios were evaluated using a 10% discount rate, where the net present value (NPV) is equal to zero. The profitability of the pellet production, as determined by the NPV, internal rate of return (IRR), and payback period, was found to be sensitive to the variations in the feedstock cost. The baseline model discussed in this study does not represent an existing pellet plant. Nevertheless, this analysis is poised to establish a benchmark for industry stakeholders intending to implement the new technology in the pelletization of oat straw and sawdust in Saskatchewan.

Supplementary Materials

The following supporting information can be downloaded at: https://www.mdpi.com/article/10.3390/en17010133/s1, Table S1: Properties of the feedstocks; Table S2: Cost assumptions and economic evaluation parameters; Table S3: Major equipment costs (2023 prices in US$) for Scenarios 1 and 2; Table S4: Major equipment costs (2023 prices in US$) for Scenarios 3 and 4; Table S5: Major equipment costs (2023 prices in US$) for Scenarios 5 and 6; Figure S1: The process of pelleting raw sawdust (Scenario 1); Figure S2: The process of pelleting raw oat straw (Scenario 2); Figure S3: Integrated torrefied treated oat straw pelletization plant utilizing torrefaction liquid (TL) as binder (Scenario 4); Figure S4: Integrated steam-exploded treated sawdust pellet plant (Scenario 5).

Author Contributions

Conceptualization, C.O., L.G.T., T.D. and E.M.; methodology, C.O., L.G.T. and E.M.; software, C.O. and O.O.O.; validation, L.G.T., T.D. and E.M.; formal analysis, C.O.; investigation, C.O.; resources, L.G.T., T.D., E.M., D.C., X.L. and O.O.O.; data curation, C.O.; writing—original draft preparation, C.O.; writing—review and editing C.O., L.G.T., T.D., E.M., D.C., X.L. and O.O.O.; visualization, C.O.; supervision, L.G.T. and T.D.; project administration, L.G.T., T.D., E.M. and D.C.; funding acquisition, L.G.T., T.D., E.M. and D.C. All authors have read and agreed to the published version of the manuscript.

Funding

This research was funded by the Biofuel Network (BFN) (ASC-16) and Natural Sciences and Engineering Research Council of Canada (NSERC) (RGPIN-2017-05287). We also acknowledge the funding support provided by the University of Saskatchewan through the CGPS Dean’s Scholarship.

Data Availability Statement

The data presented in this study are available on request from the corresponding author. The data are not publicly available due to privacy.

Acknowledgments

The authors are grateful to John Smillie and Scott Bishoff of the Canadian Feed Research Centre (CFRC), University of Saskatchewan, who are acknowledged for their technical support of this experiment.

Conflicts of Interest

The authors declare no conflict of interest.

References

  1. Clauser, N.M.; Area, M.C.; Felissia, F.E.; Vallejos, M.E. Techno-economic assessment of carboxylic acids, furfural, and pellet production in a pine sawdust biorefinery. Biofuels Bioprod. Biorefin. 2018, 12, 997–1012. [Google Scholar] [CrossRef]
  2. Lamberg, J.; Ojala, J.; Peltoniemi, M.; Särkkä, T. The Evolution of Global Paper Industry 1800–2050, 1st ed.; Springer: Dordrecht, The Netherlands, 2012. [Google Scholar]
  3. Sami, M.; Annamalai, K.; Wooldridge, M. Co-firing of coal and biomass fuel blends. Prog. Energy Combust. Sci. 2001, 27, 171–214. [Google Scholar] [CrossRef]
  4. Roni, M.S.; Chowdhury, S.; Mamun, S.; Marufuzzaman, M.; Lein, W.; Johnson, S. Biomass co-firing technology with policies, challenges, and opportunities: A global review. Renew. Sustain. Energy Rev. 2017, 78, 1089–1101. [Google Scholar] [CrossRef]
  5. Goerndt, M.E.; Aguilar, F.X.; Skog, K. Drivers of biomass co-firing in U.S. coalfired power plants. Biomass Bioenergy 2013, 58, 158–167. [Google Scholar] [CrossRef]
  6. EIA. Monthly Densified Biomass Fuel Report form EIA-63C; U.S. Department of Energy, U.S. Energy Information Administration: Washington, DC, USA, 2021. Available online: https://www.eia.gov/biofuels/biomass/?year=2020&month&equals (accessed on 25 October 2023).
  7. USDA, United States Department of Agriculture, Foreign Agricultural Service. Voluntary Report on Canada Wood Pellet Annual. Available online: https://apps.fas.usda.gov/newgainapi/api/Report/DownloadReportByFileName?fileName=Canada%20Wood%20Pellet%20Annual_Ottawa_Canada_CA2023-0002.pdf (accessed on 25 October 2023).
  8. Agar, D.A. A comparative economic analysis of torrefied pellet production based on state of the art pellets. Biomass Bioenergy 2017, 97, 155–161. [Google Scholar] [CrossRef]
  9. Nanou, P.; Carbo, M.C.; Kiel, J.H.A. Detailed mapping of the mass and energy balance of a continuous biomass torrefaction plant. Biomass Bioenergy 2016, 89, 67–77. [Google Scholar] [CrossRef]
  10. Koppejan, J.; Sokhansanj, S.; Melin, S.; Madrali, S. Status Overview of Torrefaction Technologies (IEA Bioenergy Task 32); IEA Bioenergy: Paris, France, 2012. [Google Scholar]
  11. Chen, W.H.; Peng, J.; Bi, X.T. A state of the art review of biomass torrefaction, densification, and applications. Renew. Sustain. Energy Rev. 2015, 44, 847–866. [Google Scholar] [CrossRef]
  12. Cao, L.; Yuan, X.; Li, H.; Li, C.; Xiao, Z.Z.; Jiang, L.; Huang, B.; Xiao, Z.Z.; Chen, H.; Wang, X.; et al. Complementary effects of torrefaction and co-pelletization: Energy consumption and characteristics of pellets. Bioresour. Technol. 2015, 185, 254–262. [Google Scholar] [CrossRef]
  13. Phanphanich, M.; Mani, S. Impact of torrefaction on the grindability and fuel characteristics of forest biomass. Bioresour. Technol. 2011, 102, 1246–1253. [Google Scholar] [CrossRef]
  14. Kumar, A.; Cameron, J.B.; Flynn, P.C. Biomass power cost and optimum plant size in western Canada. Biomass Bioenergy 2003, 24, 445–464. [Google Scholar] [CrossRef]
  15. Lam, P.S. Steam Explosion of Biomass to Produce Durable Wood Pellets. Unpublished Ph.D. Thesis, Department of Chemical and Biological Engineering, University of British Columbia, Vancouver, BC, Canada, 2011. [Google Scholar]
  16. Tooyserkani, Z. Hydrothermal Pre-Treatment of Softwood Biomass and Bark for Pelletization. Ph.D. Thesis, Department of Chemical and Biological Engineering, University of British Columbia, Vancouver, BC, Canada, 2013. [Google Scholar]
  17. Pastre, O. Analysis of the Technical Obstacles Related to the Production and Utilization of Fuel Pellets Made from Agricultural Residues; Report Prepared by EUBIA for the ALTENER Project Pellets for Europe, Report No. ALTENER 2002-012-137-160; EUBIA: Brussels, Belgium, 2002; p. 57. [Google Scholar]
  18. Shahrukh, H.; Olajire Oyedun, A.; Kumar, A.; Ghiasi, B.; Kumar, L.; Sokhansanj, S. Technoeconomic assessment of pellets produced from steam pretreated biomass feedstock. Biomass Bioenergy 2016, 87, 131–143. [Google Scholar] [CrossRef]
  19. Manouchehrinejad, M.; Bilek, E.M.T.; Mani, S. Technoeconomic analysis of integrated torrefaction and pelletization systems to produce torrefied wood pellets. Renew. Energy 2021, 178, 483–493. [Google Scholar] [CrossRef]
  20. Gebreegziabher, T.; Oyedun, A.O.; Hui, C.W. Optimum biomass drying for combustion—A modeling approach. Energy 2013, 53, 67–73. [Google Scholar] [CrossRef]
  21. Luk, H.T.; Lam, T.Y.G.; Oyedun, A.O.; Gebreegziabher, T.; Hui, C.W. Drying of biomass for power generation: A case study on power generation from empty fruit bunch. Energy 2013, 63, 205–215. [Google Scholar] [CrossRef]
  22. Mupondwa, E.; Li, X.; Tabil, L.; Phani, A.; Sokhansanj, S.; Stumborg, M.; Gruber, M.; Laberge, S. Technoeconomic analysis of wheat straw densification in the Canadian Prairie Province of Manitoba. Bioresour. Technol. 2012, 110, 355–363. [Google Scholar] [CrossRef] [PubMed]
  23. Dassanayake, G.D.M.; Kumar, A. Technoeconomic assessment of triticale straw for power generation. Appl. Energy 2012, 98, 236–245. [Google Scholar] [CrossRef]
  24. Kumar, A.; Flynn, P.; Sokhansanj, S. Biopower generation from mountain pine infested wood in Canada: An economical opportunity for greenhouse gas mitigation. Renew. Energy 2008, 33, 1354–1363. [Google Scholar] [CrossRef]
  25. Mani, S.; Sokhansanj, S.; Bi, X.; Turhollow, A. Economics of producing fuel pellets from biomass. Appl. Eng. Agric. 2006, 22, 421–426. [Google Scholar] [CrossRef]
  26. Pirraglia, A.; Gonzalez, R.; Saloni, D.; Denig, J. Technical and economic assessment for the production of torrefied lignocellulosic biomass pellets in the US, Energy Convers. Manag. 2013, 66, 153–164. [Google Scholar] [CrossRef]
  27. Badger, P.; Badger, S.; Puettmann, M.; Steele, P.; Cooper, J. Technoeconomic analysis: Preliminary assessment of pyrolysis oil production costs and material energy balance associated with a transportable fast pyrolysis system. Bioresources 2011, 6, 34–47. [Google Scholar] [CrossRef]
  28. Government of Saskatchewan. Wood Biomass in Saskatchewan. 2021. Available online: https://pubsaskdev.blob.core.windows.net/pubsaskprod/121001/SK%252BWood%252BBiomass%252BOverview%252BNov%252B2021-FINAL.pdf (accessed on 19 April 2023).
  29. Onyenwoke, C.; Tabil, L.G.; Dumonceaux, T.; Cree, D.; Mupondwa, E.; Adapa, P.K.; Karunakaran, C. Investigation of steam explosion pretreatment of sawdust and oat straw to improve their quality as biofuel pelets. Energies 2022, 15, 7168. [Google Scholar] [CrossRef]
  30. Alizadeh, P.; Tabil, L.G.; Mupondwa, E.; Li, X.; Cree, D. Technoeconomic feasibility of bioenergy production from wood sawdust. Energies 2023, 16, 1914. [Google Scholar] [CrossRef]
  31. Onyenwoke, C.; Tabil, L.G.; Mupondwa, E.; Cree, D.; Adapa, P. Effect of torrefaction on the physiochemical properties of white spruce sawdust for biofuel production. Fuels 2023, 4, 111–131. [Google Scholar] [CrossRef]
  32. Onyenwoke, C.; Tabil, L.G.; Dumonceaux, T.; Mupondwa, E.; Cree, D. Combined effects of torrefaction and binders on the quality of pellets produced from oat straw. BioEnergy Res. 2023. [Google Scholar] [CrossRef]
  33. BIMAT. Biomass Inventory Mapping and Analysis Tool (BIMAT) by Agriculture and Agri Food Canada. 2010. Available online: http://www4.agr.gc.ca/AAFC%20AAC/displayafficher.do?id=1226509218872&lang=eng (accessed on 12 May 2023).
  34. Stephen, J.D. Biorefinery Feedstock Availability and Price Variability: Case Study of the Peace River Region, Alberta. Ph.D. Thesis, Chemical and Biological Engineering, University of British Columbia, Vancouver, BC, Canada, 2008. [Google Scholar]
  35. Sokhansanj, S.; Fenton, J. Cost Benefit of Biomass Supply and Pre-Processing. A BIOCAP Research Integration Program Synthesis Paper. 2006. Available online: http://www.biocap.ca/rif/Sokhansanj_S.pdf (accessed on 15 April 2022).
  36. Composites Innovation Centre. Straw Procurement Business Case; Final Report; Submitted to Manitoba BioProducts Working Group; Prairie Practitioners Group Ltd.: Mason St. Springfield, IL, USA, 2008. [Google Scholar]
  37. Antonio, J.E.; Roldán-San, E.; Martín-Hernández, R.; Briones, R.; Martín, M. Process design and scale-up study for the production of polyol-based biopolymers from sawdust. Sustain. Prod. Consum. 2021, 27, 462–470. [Google Scholar] [CrossRef]
  38. Samson, R.; Delaquis, E.; Deen, B.; Debruyn, J.; Eggimann, U. Switchgrass Agronomy. Ontario Biomass Producers Co-Operative Inc. Report, 2016. Available online: https://www.agrireseau.net/documents/93992/switchgrass-agronomy (accessed on 19 July 2022).
  39. Teal, W.B.; Gobel, R.J.; Johnson, A. Biomass Torrefaction System and Method. 2012. Available online: https://patents.google.com/patent/US8246788B2/en (accessed on 19 April 2023).
  40. Evangelista, B.; Arlabosse, P.; Govin, A.; Salvador, S.; Bonnefoy, O.; Dirion, J.L. Reactor scale study of self-heating and self-ignition of torrefied wood in contact with oxygen. Fuel 2018, 214, 590–596. [Google Scholar] [CrossRef]
  41. Yun, H.; Clift, R.; Bi, X. Process simulation, technoeconomic evaluation, and market analysis of supply chains for torrefied wood pellets from British Columbia: Impacts of plant configuration and distance to market. Renew. Sustain. Energy Rev. 2020, 127, 109745. [Google Scholar] [CrossRef]
  42. Manouchehrinejad, M.; Mani, S. Process simulation of an integrated biomass torrefaction and pelletization (iBTP) plant to produce solid biofuels. Energy Convers. Manag. X 2019, 1, 100008. [Google Scholar] [CrossRef]
  43. Bergman, P. Combined Torrefaction and Pelletisation; Technical ECN-C--05-073. The TOP Process; Energy Research Centre of the Netherlands (ECN): Petten, The Netherlands, 2005.
  44. Shahrukh, H.; Oyedun, A.O.; Kumar, A.; Ghiasi, B.; Kumar, L.; Sokhansanj, S. Net energy ratio for the production of steam pretreated biomass-based pellets. Biomass Bioenergy 2015, 80, 286–297. [Google Scholar] [CrossRef]
  45. Valdez, E. Microwave Torrefaction and Densification of Oat Hulls for Heat and Power Production. Master’s Thesis, Department of Chemical and Biological Engineering, University of Saskatchewan, Saskatoon, SK, Canada, 2020. Available online: https://harvest.usask.ca/server/api/core/bitstreams/3729a5fc-e5d5-4de0-9431-16c7ff1dfa25/content (accessed on 19 April 2023).
  46. Mupondwa, E.; Li, X.; Tabil, L.; Sokhansanj, S.; Adapa, P. Status of Canada’s lignocellulosic ethanol: Part I: Pretreatment technologies. Renew. Sustain. Energy Rev. 2017, 72, 178–190. [Google Scholar] [CrossRef]
  47. Vlysidis, A.; Binns, M.; Webb, C.; Theodoropoulos, C. A Techno-Economic Analysis of Biodiesel Biorefineries: Assessment of Integrated Designs for the Co-production of Fuels and Chemicals. Energy 2011, 36, 4671–4683. [Google Scholar] [CrossRef]
  48. Junsittiwate, R.; Srinophakun, T.R.; Sukpancharoen, S. Techno-economic, environmental, and heat integration of palm empty fruit bunch upgrading for power generation. Energy Sustain. Dev. 2022, 66, 140–150. [Google Scholar] [CrossRef]
  49. Fadhilah, N.A.; Islam, M.N.; Rosli, R. Techno-economic analysis of sawdust and rice husk co-pyrolysis for bio-oil production. Bioresour. Technol. Rep. 2023, 21, 101233. [Google Scholar] [CrossRef]
  50. Patel, H.; Maiti, P.; Maiti, S. Techno-economic assessment of bio-refinery model based on co-pyrolysis of cotton boll crop-residue and plastic waste. Biofuels Bioprod. Biorefin. 2022, 16, 155–171. [Google Scholar] [CrossRef]
  51. Sarker, T.R.; German, C.S.; Borugadda, V.B.; Meda, V.; Dalai, A.K. Techno-economic analysis of torrefied fuel pellet production from agricultural residue via integrated torrefaction and pelletization process. Heliyon 2023, 9, e16359. [Google Scholar] [CrossRef] [PubMed]
  52. Hasanly, A.; Khajeh Talkhoncheh, M.; Karimi Alavijeh, M. Technoeconomic assessment of bioethanol production from wheat straw: A case study of Iran. Clean Technol. Environ. Policy 2018, 20, 357–377. [Google Scholar] [CrossRef]
  53. Javier, F.; Ortiz, G. Techno-economic assessment of supercritical processes for biofuel production. J. Supercrit. Fluids 2020, 160, 104788. [Google Scholar] [CrossRef]
  54. Wolbers, P.; Cremers, M.; Robinson, T.; Madrali, S.; Tourigny, G. Biomass Pre-Treatment for Bioenergy–Case Study 4: The Steam Explosion Process Technology; IEA Bioenergy: Paris, France, 2018. [Google Scholar]
  55. Mobini Dehkordi, M.M. On the Design and Analysis of Forest Biomass to Biofuel and Bioenergy Supply Chains. Ph.D. Thesis, Department of Chemical Engineering, University of British Columbia, Vancouver, BC, Canada, 2015. [Google Scholar]
  56. Peng, J. A Study of Softwood Torrefaction and Densification: For the Production of High-Quality Wood Pellets. Ph.D. Thesis, The University of British Columbia, Vancouver, BC, Canada, 2012. [Google Scholar]
  57. Pirraglia, A.; Gonzalez, R.; Saloni, D. Technoeconomical analysis of wood pellets production for U.S. manufacturers. BioResources 2010, 5, 2374–2390. [Google Scholar] [CrossRef]
Figure 1. Integrated torrefied treated sawdust pelletization plant utilizing torrefaction liquid (TL) as a binder (Scenario 3).
Energies 17 00133 g001
Figure 2. Integrated steam-exploded treated oat straw pellet plant (Scenario 6).
Energies 17 00133 g002
Figure 3. Annual plant operating costs for each (1–6) scenario.
Energies 17 00133 g003
Figure 4. Net present value (NPV) at 7% discount rate for pellets at various pellet selling prices and feedstock prices; (a) NPV for regular pellets; (b) NPV for torrefied pellets; (c) NPV for steam-exploded pellets.
Energies 17 00133 g004aEnergies 17 00133 g004b
Figure 5. Profitability analysis and the maximum pellet capacity.
Energies 17 00133 g005
Table 1. Process conditions and data used in process baseline modeling.
Unit OperationParameterValueSource
Steam explosionTemperature (°C)
Residence time (min)
180
9
[29,30]
TorrefactionTemperature (°C)
Residence time (min)
250
9
[31]
[31]
Binder Torrefaction liquid (%)25[32]
PelletizationDie temperature (°C)
Pressure rate (mm/min)
Sample moisture content (%)
95
50
10
[29,31]
Table 2. Summary of assumed direct fixed capital cost.
Cost CategoryEstimation Assumption
Purchase price of all equipment (PC)Plant equipment cost + unlisted equipment
Installation (I)0.50 × PC
Piping (II)0.35 × PC
Instrumentation cost (III)0.40 × PC
Building and services (IV)0.45 × PC
Electrical facilities (V)0.10 × PC
Insulation (VI)0.03 × PC
Yard improvements (VII)0.15 × PC
Auxiliary facilities (VIII)0.40 × PC
Total plant direct cost (TPDC)PC + I + II + III + IV + V + VI + VII + VIII
Engineering (IX)0.25 × TPDC
Construction (X)0.35 × TPDC
Total plant indirect cost (TPIC)IX + X
Contractor’s fee (XI)0.05 × (TPDC + TPIC)
Contingency and research and development (XII)0.10 × (TPDC + TPIC)
Direct fixed capital cost (DFC)TPDC + TPIC + XI + XII
Working capital (WC)0.05 × DFC
Start-up cost (SC)0.15 × DFC
Total capital investment (TCI)DFC + WC + SC
Table 3. Total capital investment (TCI) for six scenarios.
Cost CategoryScenario 1Scenario 2Scenario 3Scenario 4Scenario 5Scenario 6
Purchase price of all equipment (PC)1,273,0001,323,0007,335,0007,859,0002,125,0002,675,000
Installation (I)636,000662,0003,553,0003,930,0001,063,0001,338,000
Piping (II)445,000463,0002,567,0002,751,000744,000936,000
Instrumentation cost (III)509,000529,0002,934,0003,144,000850,0001,070,000
Building and services (IV)573,000595,0003,301,0003,537,000956,0001,204,000
Electrical facilities (V)127,000132,000733,000786,000213,000268,000
Insulation (VI)38,00040,000220,000236,00064,00080,000
Yard improvements (VII)191,000198,0001,100,0001,179,000319,000401,000
Auxiliary facilities (VIII)509,000529,0002,934,0003,144,000850,0001,070,000
Total plant direct cost (TPDC) PC + I + II + III + IV + V + VI + VII + VIII4,301,0004,471,00024,677,00026,566,0007,183,0009,042,000
Engineering (IX)1,075,0001,118,0006,169,0007,859,0001,796,0002,260,000
Construction (X)1,505,0001,565,0008,637,0009,298,0002,514,0003,165,000
Total plant indirect cost (TPIC) IX + X2,581,0002,683,00014,806,00017,157,0004,310,0005,425,000
Total plant cost (TPC = TPDC + TPIC)6,882,0007,154,00039,483,00043,723,00011,492,00014,466,000
Contractor’s fee (XI)344,000358,0001,974,0002,186,000575,000723,000
Contingency and research and development (XII)688,000715,0003,948,0004,372,0001,149,0001,447,000
Direct fixed capital cost (DFC) = TPDC + TPIC + XI + XII7,914,0008,227,00045,405,00050,281,00013,216,00016,636,000
Working capital (WC)396,000411,0002,270,0002,514,000661,000832,000
Start-up cost (SC)1,187,0001,234,0006,811,0007,542,0001,982,0002,495,000
Total capital investment (TCI) = DFC + WC + SC9,497,0009,922,00054,486,00060,337,00015,859,00019,963,000
Scenario 1: wood pellet production from raw sawdust in a pellet plant; Scenario 2: straw pellet production from raw oat straw in a pellet plant; Scenario 3: integrated torrefied treated sawdust pelletization plant utilizing the torrefaction liquid (TL) as a pellet binder; Scenario 4: integrated torrefied treated oat straw pelletization plant utilizing the torrefaction liquid (TL) as a pellet binder; Scenario 5: integrated steam-treated sawdust pellet plant; and Scenario 6: integrated steam-treated oat straw pellet plant.
Disclaimer/Publisher’s Note: The statements, opinions and data contained in all publications are solely those of the individual author(s) and contributor(s) and not of MDPI and/or the editor(s). MDPI and/or the editor(s) disclaim responsibility for any injury to people or property resulting from any ideas, methods, instructions or products referred to in the content.