1. Introduction
The underground coal gasification (UCG) process consists of the reaction of underground coal with gasifying agents such as oxygen, air, and/or steam, which, at high temperatures, results in a gas containing mainly hydrogen, carbon monoxide, carbon dioxide, and methane. In addition, this gas also contains smaller amounts of ethane, hydrogen sulfide, water, and tar [
1,
2]. If the gasification is carried out using air or oxygen-enriched air, then the gas also contains nitrogen. This resulting gas is transported by a pipeline to the surface, where, after cleaning, it can be used for energy generation or as a raw material in the chemical industry. Although the UCG process is rather well documented in the literature [
3,
4,
5], there is little information about the tar produced by this technology. This is because the main goal of this process is to obtain a gas with the highest possible calorific value, and tar is a byproduct [
6]. The most important parameter that affects the course of tar production is the gasification temperature [
7]. When the temperature is increased to 350 °C, volatile substances, such as steam and adsorbed gases, are released from the gasified coal seam as a result of evaporation (not thermal decomposition). The temperature range of 350–750 °C is the main area of decomposition for the coal components, in which the largest amount of tar is emitted, with the most intensive production of the tar occurring at temperatures of approximately 600 °C [
8]. At temperatures above 1000 °C, tar is no longer emitted, but due to secondary processes occurring in the previously released tar (cracking and aromatization), its composition changes. As the UCG process progresses, an increasing amount of the coal is gasified, and depending on the scale of the test, some amounts of tar are almost always present in the process gas [
9].
In the UCG process, the participation of water is necessary. At high temperatures in the reactor, the water is transformed into steam, which reacts with the coal and produces water gas (CO + H
2). These reactions can be described by the equations:
In the case of excess steam, a second process takes place in parallel:
The reaction described by Equation (1), which produces both carbon monoxide and hydrogen, is one of the most important reactions within coal gasification. It is endothermic and reversible. It requires heat energy, and is favoured by high temperature and rather low pressure, with the temperature not having as great an influence as the pressure. Above 800 °C, the equilibrium gas concentrations (steam, carbon monoxide, and hydrogen) do not change significantly [
10,
11]. The optimum parameters for this reaction are a temperature of 700–900 °C and a pressure of 3–4 MPa [
12]. Reaction (2), called a shift conversion or a water–gas shift reaction, is a reversible, moderately exothermic reaction, a result of which is that the amount of hydrogen that is produced in the gases increases compared to that of the carbon monoxide [
10,
13]. The direction of reaction (2) strongly depends on the conditions in the reactor. If the temperature is too high, the reverse reaction occurs, and the amount of carbon monoxide increases at the expense of hydrogen. Since there is no volume change in this reaction, the pressure has no effect on the hydrogen yield. The typical parameters of this reaction are a temperature of 200–500 °C and a pressure of 0.3–4 MPa [
13].
The water that takes part in the gasification process can influence the composition and quantity of the tar obtained. In one study [
14], it was found that the presence of water vapour increases the rate of the decomposition of the heavier components of the tar (cracking), resulting in an increase in the yield and a decrease in the molecular weight. Further studies of this effect [
15] have shown that, as a result of reaction (1), the original macromolecular structure of the coal surface is disrupted, thus opening the pores of the coal [
16], through which the tar components escape as a result of increased permeability. As a result of this reaction, the yield of the tar increases [
17]. The hydrogen that is produced can build into the separated tar substances (reforming) and inhibit the repolymerisation reaction of the molecules. As a result of these reactions, the amount of separated tar with a lighter character increases. On the other hand, when too much water participates in the UCG process, the average pyrolysis temperature decreases, and the aforementioned effect is weakened [
18,
19].
An example of a pyrolysis reaction can be the thermal decomposition of toluene. It is a radical process that can be described by the following reactions (3) and (4):
As a result of this reaction, at a high temperature of approximately 1000 °C and in the presence of hydrogen, toluene decomposes to benzene and methane [
20]. If another alkylbenzene, such as ethylbenzene, is thermally decomposed, ethane can be formed instead of methane. Ethane can also be formed by the termination of two methyl radicals that collide with each other. This is described by reaction (5):
Under the conditions in the reactor during gasification, the source of the hydrogen radicals can be hydrogen or steam. According to other studies [
21], at the high temperatures that prevail in the reactor (800–1000 °C), in the presence of steam, the reforming of tar to carbon monoxide and hydrogen can also occur. This is represented by Equation (6):
As a result of this reaction, the amount of the tar that is formed decreases, and the concentration of the carbon monoxide and hydrogen in the process gas increases. This reaction is favoured [
22] by the presence of a catalyst (Al, Ni). Another factor determining the yield and composition of the tar is its residence time in the reactor. A shorter residence time favours fewer partial cracking events over time, and consequently, the overall tar yield is increased. With longer residence times, the opposite can be expected. For example, more than 80% of the tar can decompose within seconds in the pyrolysis process at 1000 °C [
23]. This tendency is also visible in the data on surface syngas and related tar yields [
24].
Numerical simulation, in addition to the experiments, can also be effectively applied to the study of tar formation and conversion in UCG. In work [
25], the UCG process was simulated on the basis of the American Hanna I and Centralia PSC tests [
26,
27]. The model results for the tar show that the trends of the changes in its performance are at an acceptable level in relation to the values from the reference field tests. The authors of the paper admit, however, that, due to the simplified assumptions of the model, the tar yield was significantly overstated in relation to the actual values. Accurate results were obtained in the improved model [
28]. The quantitative effect of the tar yield varied from a few percent to more than 50% compared to the specified actual cases. More information on these models can be found in the dissertation [
29].
The tar contained in the process gas stream (vapours and/or aerosol) is condensed as a result of lowering the temperature of the gas during transport through the outlet pipeline to the surface. Its heavier components condense in the higher temperature zone, while its lighter components condense in places closer to the surface, where the temperature is lower. This phenomenon negatively affects the course of the gas transport to the surface, because the condensing tar reduces the cross-section of the pipeline transporting the process gas [
30,
31,
32,
33,
34,
35,
36]. In extreme cases, a clogged pipeline may occur. The described phenomena can be partially prevented by the appropriate temperature control of the gasification process. If the outlet gas temperature is high, the tar will condense to a lesser extent in the underground part, but more intensively on the surface. This will result in higher tar yields, and will necessitate the expansion and further utilisation of tar–gas separation equipment. It should be noted that, if the gas cleaning system is not equipped with an efficient recovery system, contained in the tar’s light aromatic hydrocarbons (BTEX), even at room temperature, may not condense due to their high volatility and will remain in the process gas. For example, during in situ tests [
37,
38] in tar that condensed on the surface at the temperature of 20–40 °C, no presence of the BTEX compounds was found, while the measurement of their direct presence in the process gas showed their high content [
9]. More detailed analyzes have shown that even volatile tar components can remain in areas closer to the reactor (hot zones) by dissolving into previously condensed heavier tar components [
30]. The amount of tar produced in the process depends on the conditions of the process and can be different in each experiment. In Poland, during two UCG tests at the “Barbara” mine and a third at the “Wieczorek” mine, the tar yields were 0.23%, 0.06%, and 0.91% of the mass of the gasified raw coal, respectively [
38,
39]. However, most data on the yields of the tar obtained from large-scale in situ gasifications come from Russian and US tests. Thus, based on a series of tests at the Podzemgaz South Abinsk Station [
40], the tar yield was approximately 0.15–0.20% of the mass of gasified coal. Comparing these data with the 2–5% tar yield that is obtained in a typical coal coking process, Pavlovich and Strakhov [
40] found that the tar yield from the UCG process is 13–25 times lower. The data from the American UCG tests [
41,
42,
43] showed that the yield of the tar was slightly higher than those of the Russian tests. In these tests, the yield of the tar (referred to as oil condensates) from the raw coal was approximately 1–3% of the weight of the gasified coal (e.g., 1.6% of the weight of the carbon for Rocky Mountain 1; 1.9% of the weight of the carbon for Hanna IV; and 1.9% of the weight of the carbon in Hanna II Phase III). Based on these data, Camp and White [
41] concluded that, compared with the tar yields of a typical coal coking process, a significant part (approximately 80%) of the tar products that were produced by the underground coal gasification process underwent secondary reactions or condensation and remained underground. It should be noted that these conclusions resulted from measuring the amount of the tar obtained after the process gas had passed from the underground reactor to the surface, and assuming that the total (lossless) amount of the tar obtained from the UCG process was similar to the tar yield of a typical coal coking process. This assumption should be tested experimentally, because the UCG process differs from coal coking in many of its process parameters. One of the most important differences is that, to obtain a sufficiently high temperature inside the reactor, part of the coal is burned, and with it, a certain amount of the produced tar. This is confirmed by the literature data on earlier UCG tests, which show that only 75% of the coal is converted to gas and 25% is converted to ash, water, and tar [
44]. Therefore, the amount and properties of the tar obtained from the UCG process will differ from those of the coal coking process. Detailed data on the quantity and composition of the tar obtained from the UCG process could be obtained from the measurements of the tar samples taken directly from the reactor outlet, however, there are not many such works in the available literature. This is because of technical and safety reasons. Such measurements in real conditions are rather impossible; however, in ex situ conditions, measurement is more realistic.
In three such studies, carried out on small coal blocks [
45,
46,
47], changes in the composition of the tar collected directly from the interior and outlet of the reactor were investigated during an ex situ coal gasification. On the basis of the work [
45], it was found, among others, that in comparison to the tar from the reaction zone, the tar from the reactor outlet, due to cracking and condensation, contained a smaller amount of heavier substances. The results of the tar tests in study [
46] showed that when the coal was gasified with oxygen, the amount of the tar obtained at the reactor outlet was greater than that in the case of using air, and that an increase in the oxygen flow rate caused an increase in the amount of the obtained tar.
In another paper [
47], tar samples were taken from three places: two from the inside of the reactor and the third from the outlet. The analysis of the composition of the tars concerned only a few selected components that were present in the highest concentrations. It was found that the most abundant component of all the tars was the compound C
15H
13N and its isomers. Compared with the tar taken from the upper part of the reactor, the tar taken from the lower part was characterized by a lower content of PAHs and a lower boiling point. The authors of the work stated that this was due to the decomposition of the heavy tar components, as a result of the temperature increase in the reaction zone.
However, in the mentioned three papers [
45,
46,
47] no tar yield calculations were performed. The presented literature review shows that there are very few detailed data on the amount and composition of the tar taken directly from the reactor outlet during the UCG process. Furthermore, the simulations of the tar yield and composition, due to the high degrees of complexity and unpredictability of the phenomena occurring during the UCG process, are not accurate enough. Therefore, an innovative approach to achieving the research goal in this area was to determine the efficiency of the individual tar components (single and in groups) and the average residence time of the tar vapours in the reactor, on the basis of the measurements made directly from the reactor outlet. In addition, the effect of the gasification time on the tar composition was analysed, the H/C ratio in the tar was determined, and the average molecular weight of the tar was calculated.
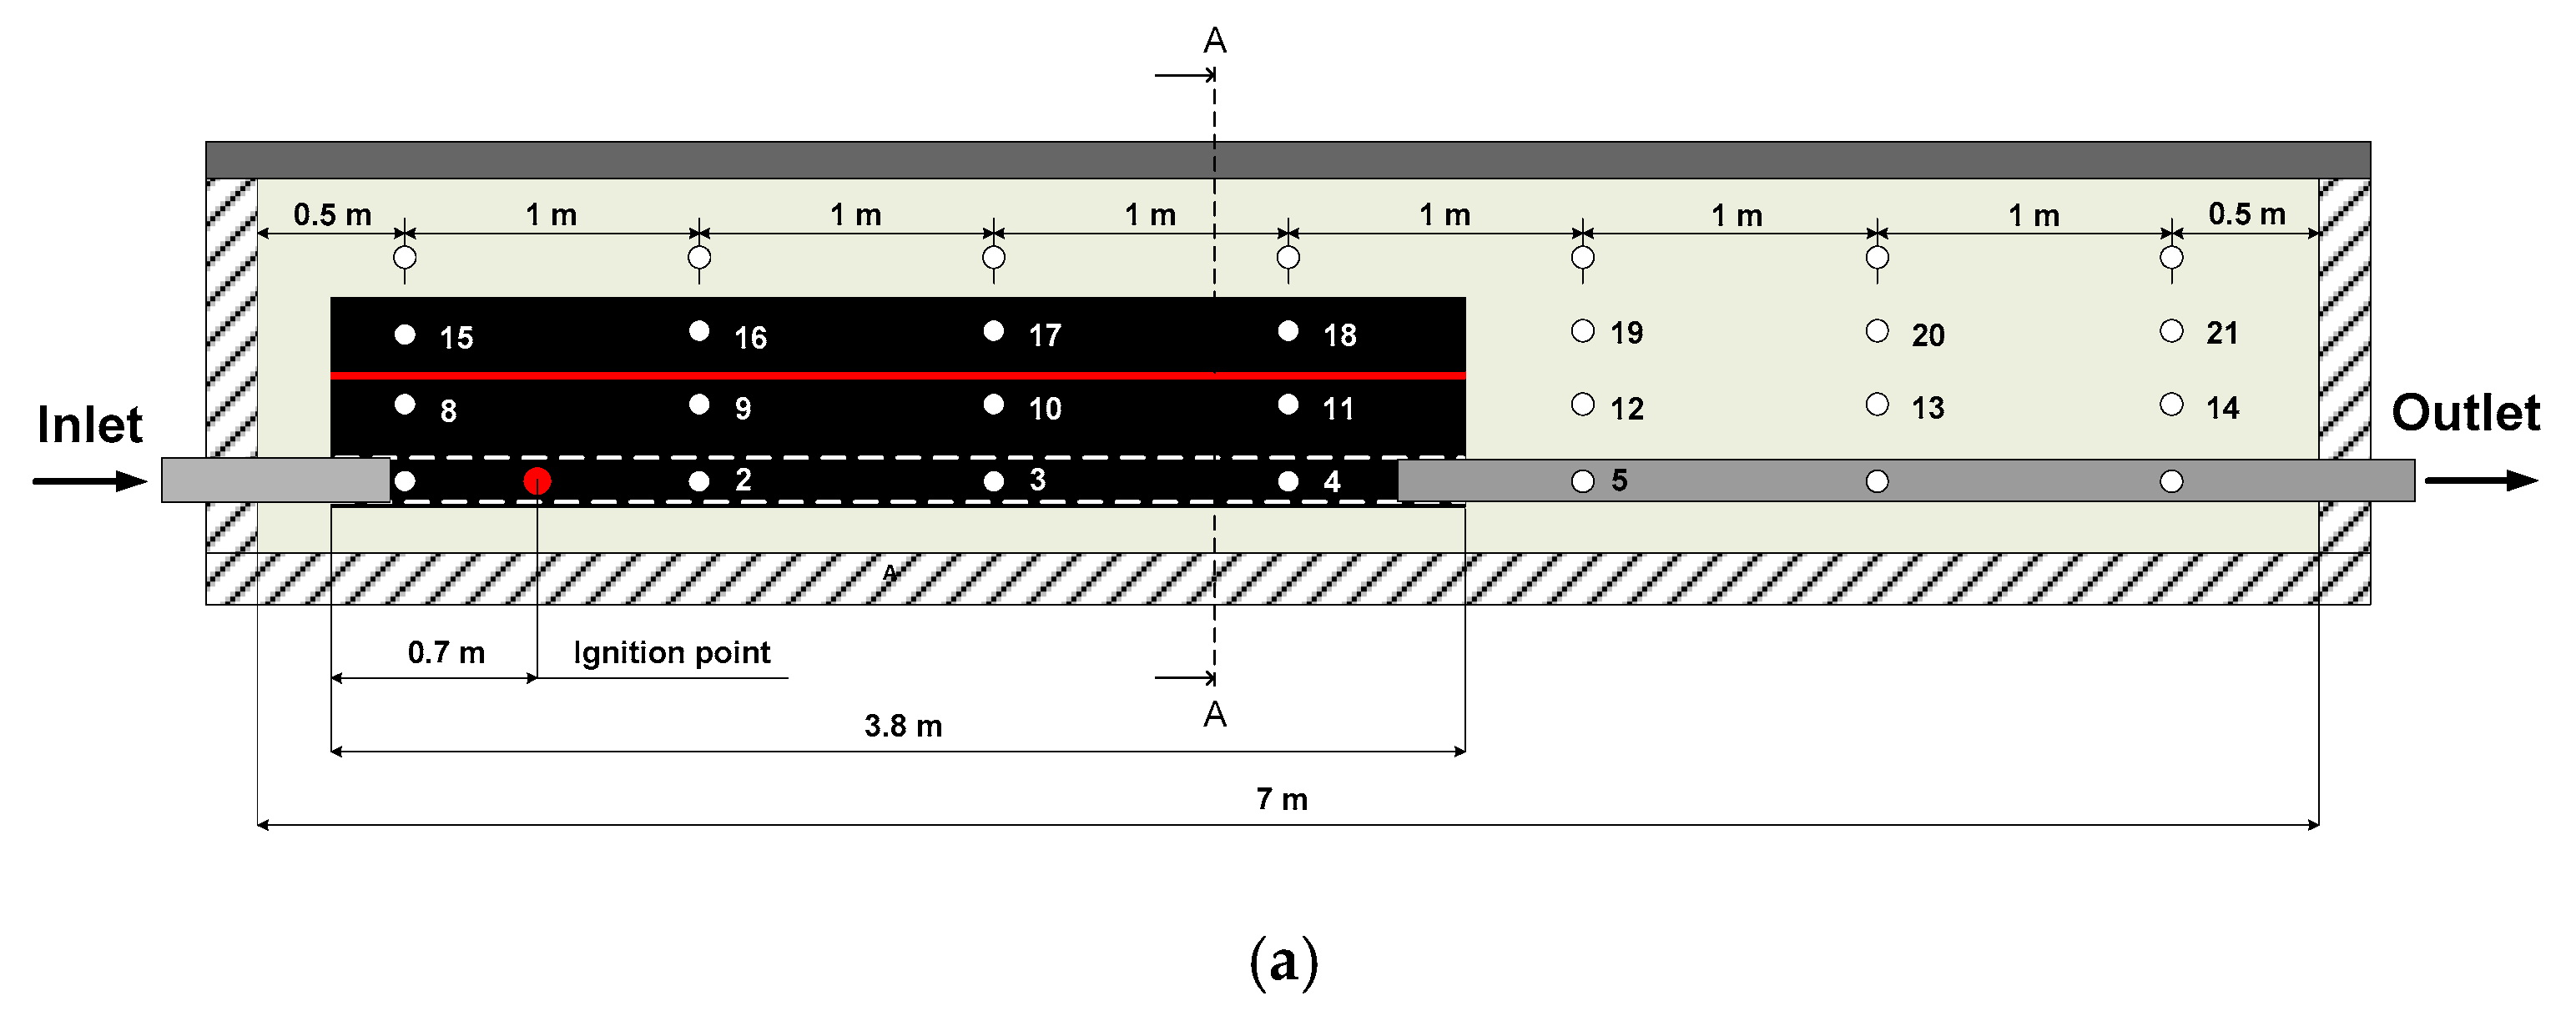
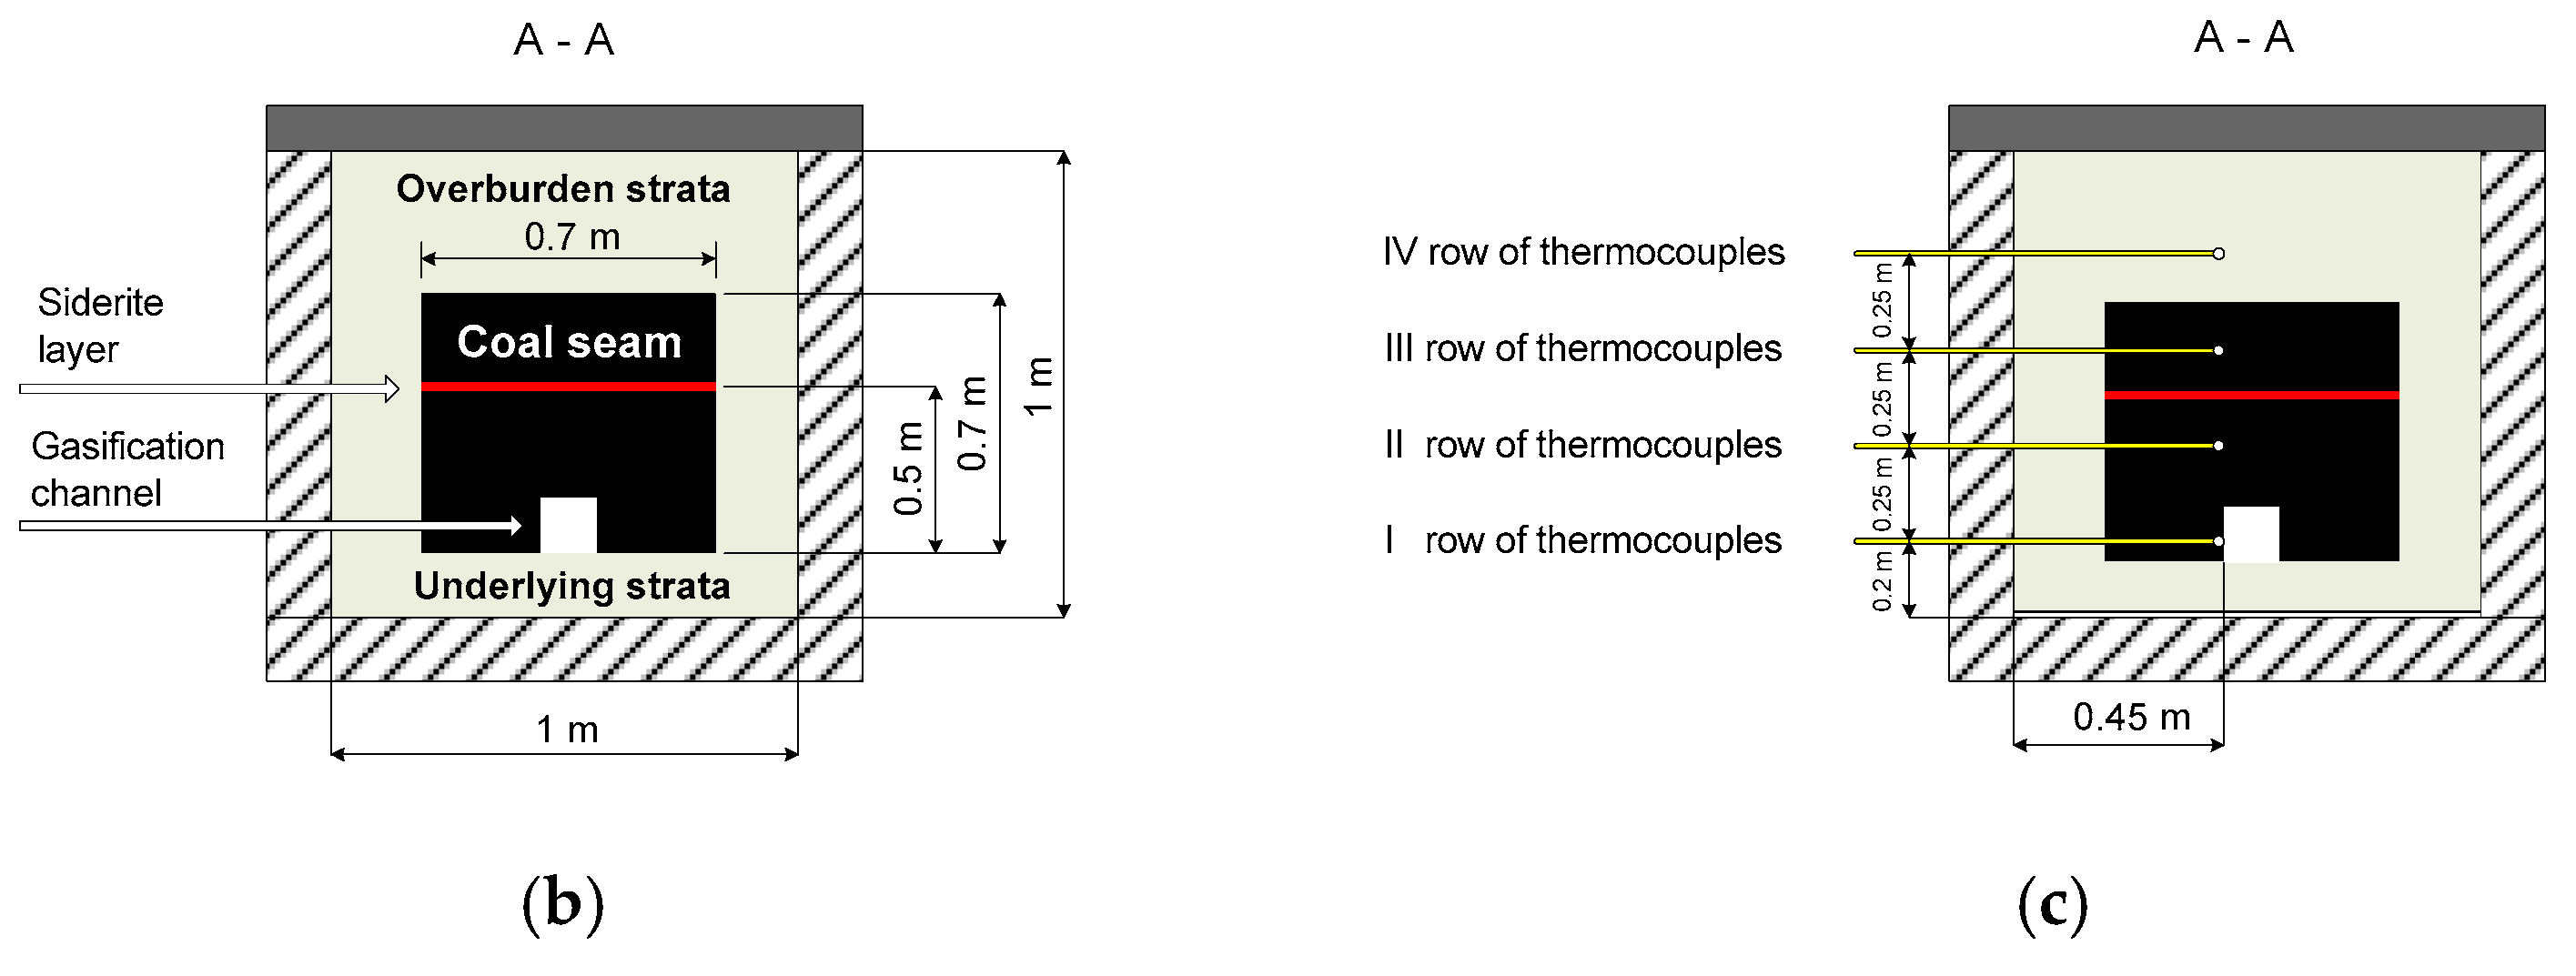
To perform such measurements, a previously conducted ex situ experiment [
48] used the oxygen gasification of a large block of hard coal. The experiment investigated, among other things, the effect of siderite addition on the UCG process, and an attempt was made to determine the temperature distribution in the reactor. During the same experiment, the tar was sampled directly from the reactor outlet and analysed qualitatively and quantitatively. The results contributed to an understanding of the quantity and composition of the tar obtained in the real UCG process, which can help in designing plants to carry out this process on a large scale.
3. Results
3.1. Results of the Analysis of Coal, Siderite, and Moisture Content in Sand
The analysis of the coal and sand was carried out in the certified laboratory at Silesian Technical University, according to Polish standards. The obtained results of the technical and elemental analysis of the coal are shown in
Table 3.
The analysed bituminous coal was characterised by a low moisture content (as received) of 4.7%, a relatively high ash content of 16.30%, and a volatile matter content of 30.10%. Its calorific value was 22.719 MJ/kg. The moisture content in the sand, determined in accordance with the PN-G-04511:1980 standard, was 11.0%. The high humidity of the sand was as a result of storing it in an open space, which exposed it to the effects of weather conditions, including rain. The analysis of the siderite was carried out at the Silesian Interdisciplinary Education and Research Centre in Chorzów. Its elemental composition was determined by X-ray fluorescence (XRF) from a ZSX Primus II Rigaku spectrometer, and the results were recalculated into oxides. Its CO2 content was determined by the volumetric method in a Scheibler-Dietrich apparatus. The data that were obtained show that iron oxide is the dominant component, at 41.08% FeO. The content of the other minerals was lower, at 10.72% silicon dioxide, 5.03% aluminium trioxide, 3.33% magnesium oxide, and 2.37% calcium oxide, with a measurement accuracy of up to 1 wt.%. The CO2 content ranged from 33.1 to 35.7% by weight, with an average of 34.6%.
3.2. Temperature Distribution
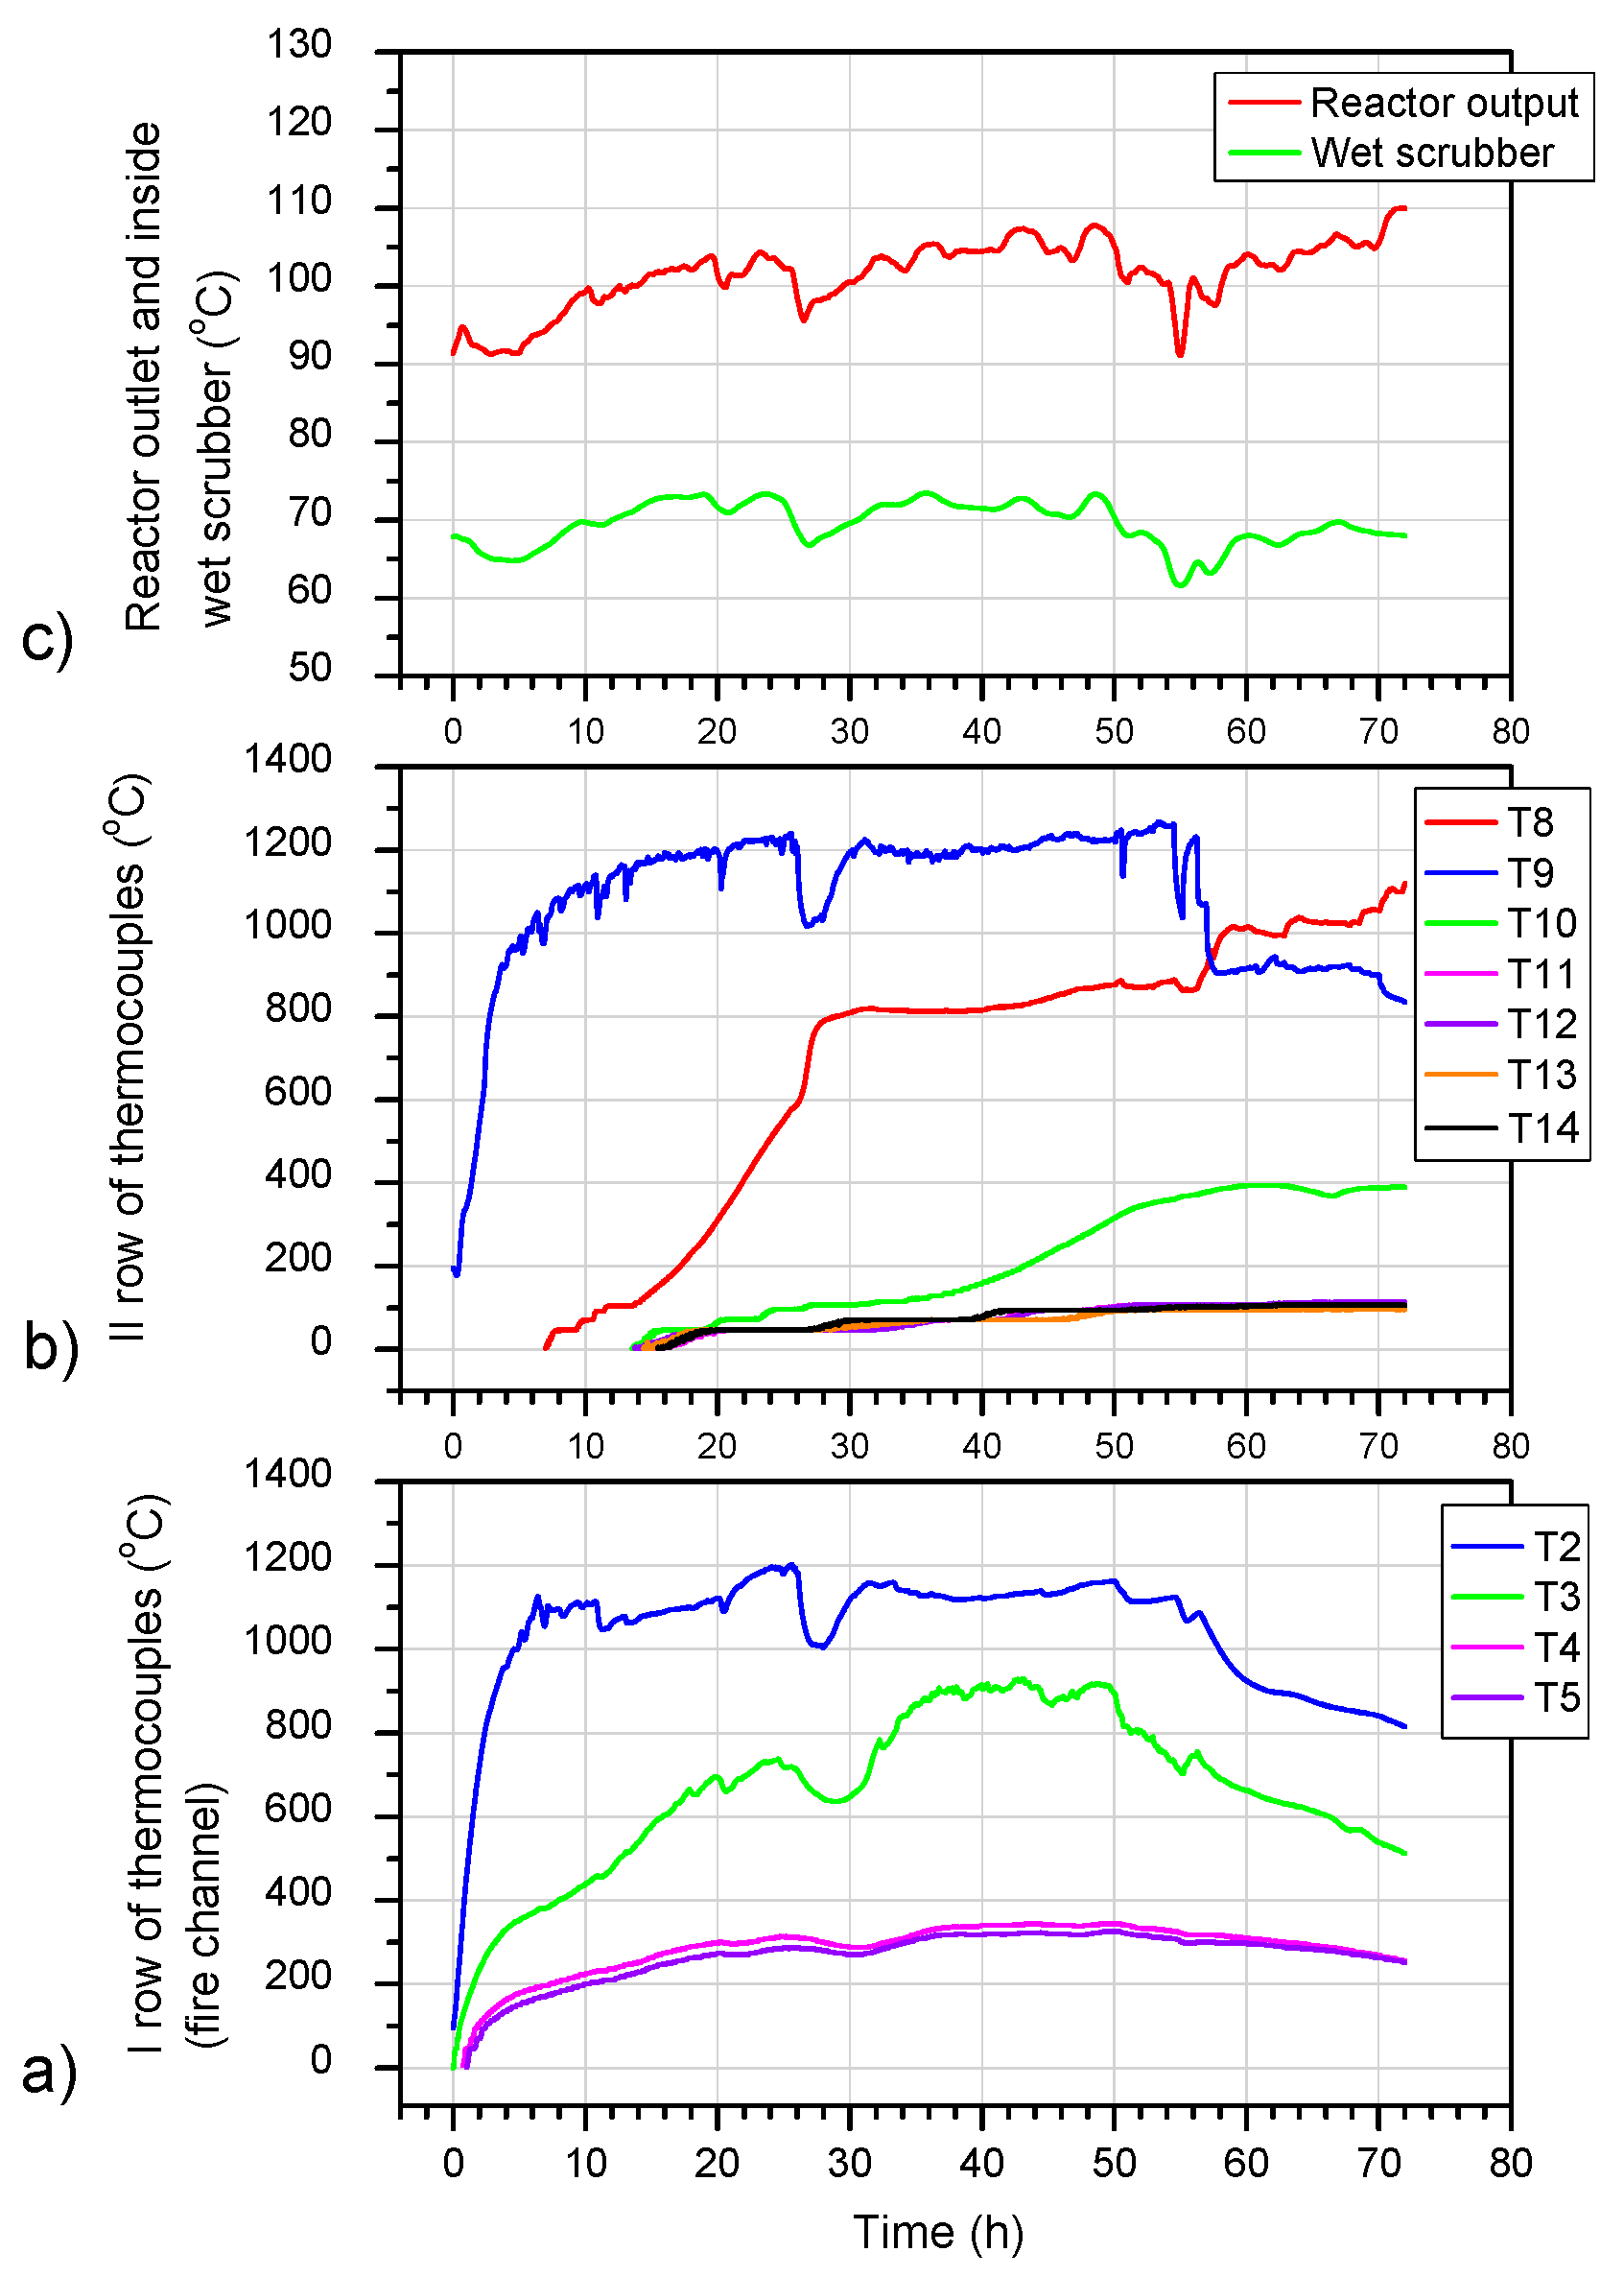
The temperatures in row I of the thermocouples (fire channel) and row II of the thermocouples, as well as the temperatures at the reactor outlet and inside the wet scrubber, are shown in
Figure 4a–c.
Figure 4a shows that the highest temperatures in the fire channel, approximately 1200 °C, were indicated by the T2 thermocouple, which was located approximately 1 m from the beginning of the coal seam. The lowest temperatures of 350 °C were recorded by the furthest thermocouple T4. Thermocouple T5, which was placed outside of the block of coal, showed maximum temperatures that did not exceed 330 °C. The temperatures in the second row of the thermocouples were similar to those in the first row.
Figure 4a shows that the temperatures in the fire channel decreased with increasing distance from the place of ignition. In row II, there was a similar relationship, with the exception of the T9 thermocouple, which indicated higher values than thermocouple T8, because thermocouple T9 was located directly above the ignition point of the coal seam. All the thermocouples recorded temperature fluctuations that occurred at similar time intervals. The most characteristic interval was between 24 and 32 h.
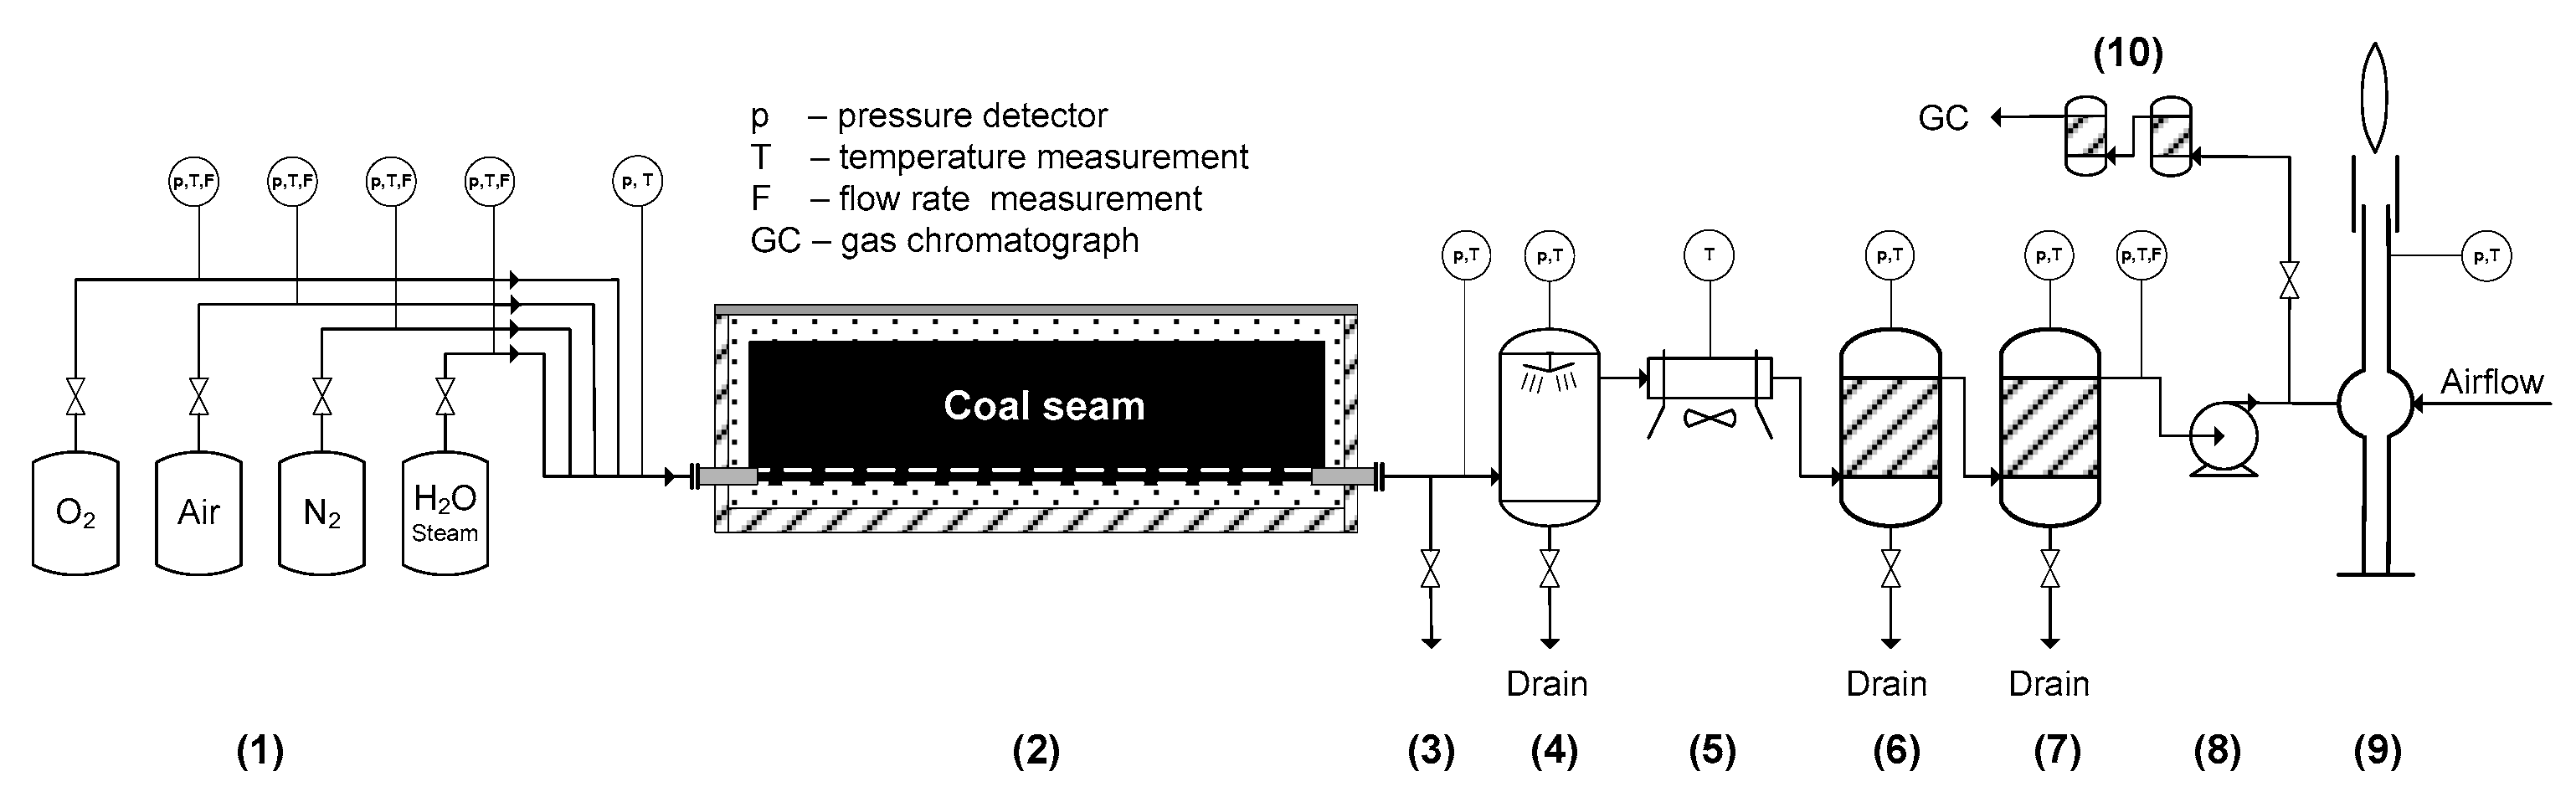
The temperature measurement point of the process gas at the reactor outlet was located close to the tar-sampling connection (
Figure 1). Thus, the process gas temperature in this place, shown in
Figure 4c, is the temperature at which the tar was sampled.
The temperatures of the process gas at the inlet to the scrubber were not high, ranging from 90–110 °C. At the outlet, the temperatures were approximately 30 °C lower (
Figure 4c). Under these conditions (low temperature, atmospheric pressure, and no catalyst), the components of the process gas no longer reacted with each other or with the water vapour. The lowest temperature at which the components of the process gas could react with each other was approximately 180 °C, and refers to the process of producing water gas from water vapour and carbon monoxide (see Equation (2)). Therefore, without much error, it can be assumed that the composition of the process gas at the outlet of the installation was the same as at the tar sampling site.
The component of the BTEX group with the lowest boiling point was benzene at 80.1 °C. The other compounds of this group, namely toluene, ethylbenzene, and xylenes, had boiling temperatures of 110.6 °C, 136 °C, and 139 °C, respectively. These temperatures were very close to the temperatures that occurred at the outlet of the reactor and the tar sampling point, so it can be expected that BTEX compounds, which are the lightest components of tar, should be present in the tested samples.
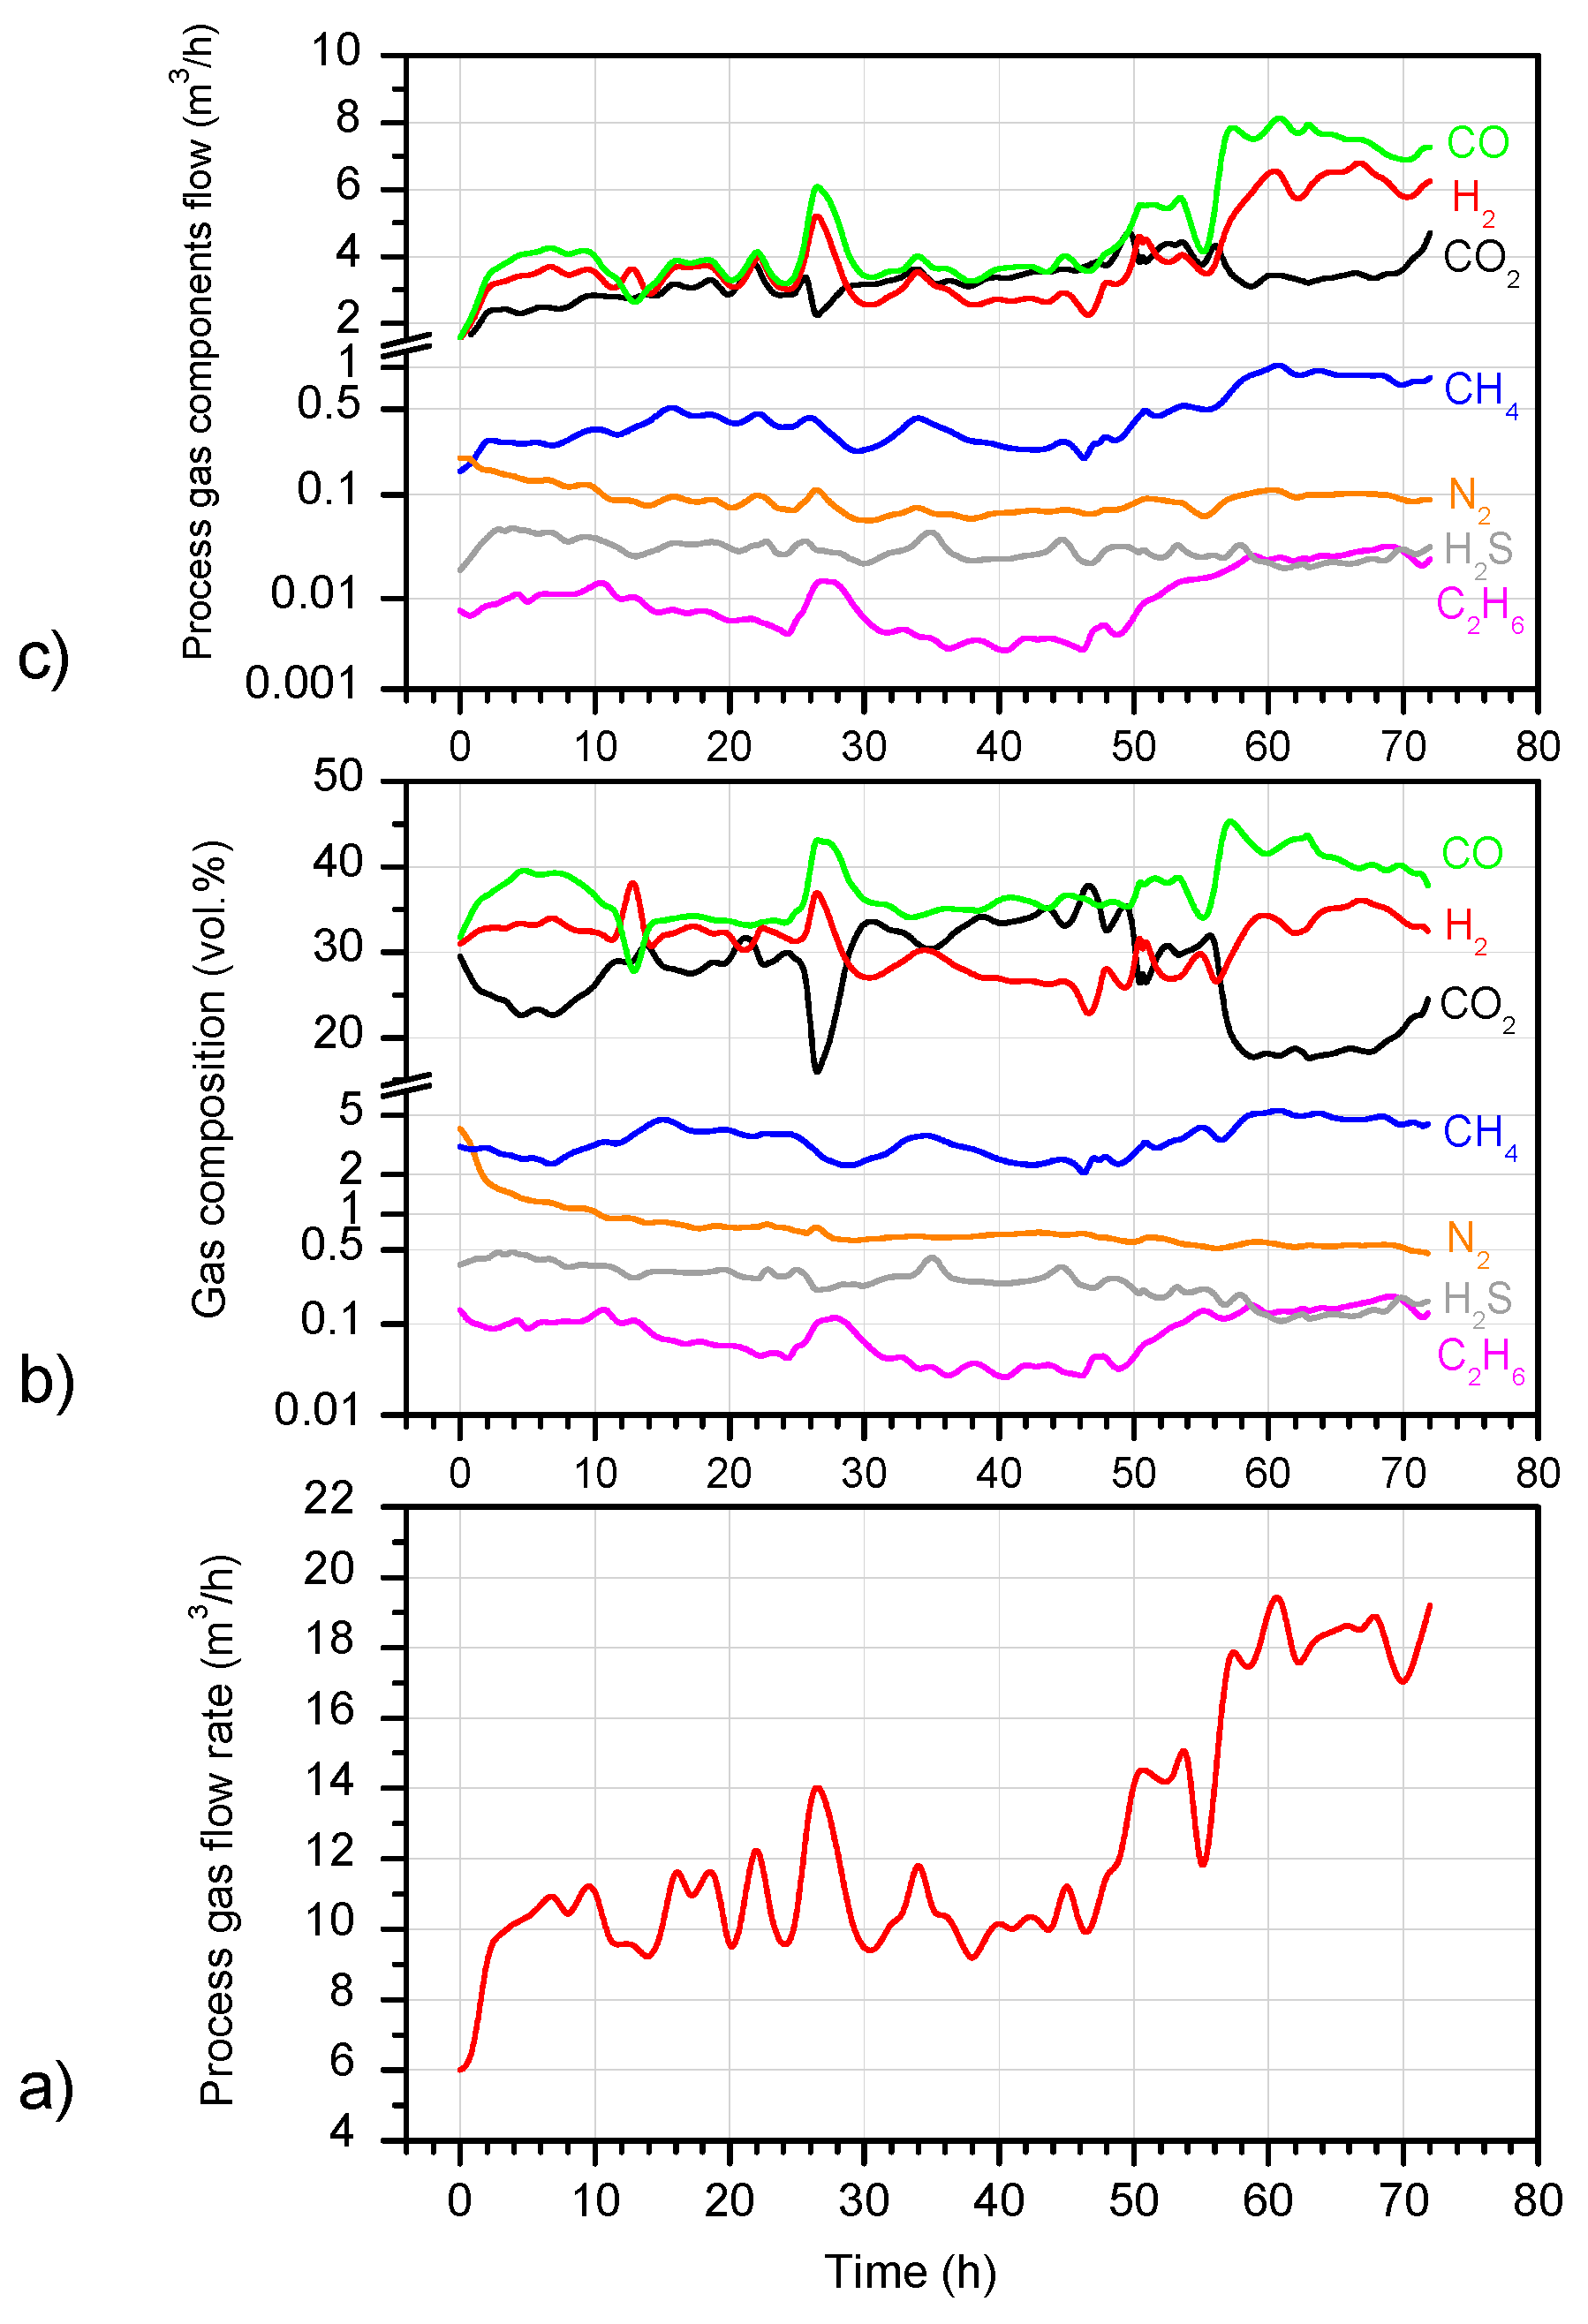
3.3. Process Gas Flow, Composition and Mass Flow of Its Components
Figure 5a shows the process gas flow rate, and
Figure 5b,c show the composition and the mass flow of the individual gas components. The data obtained in
Figure 5a show that, from the beginning of the process until approximately 46 h, the flow of the gas received was relatively stable and was in the range of 10–14 m
3/h. After 46 h of the process, the amount of gas produced began to increase, reaching a value of approximately 18 m
3/h. The total amount of the gas produced was 896.94 m
3, with an average flow of 12.46 m
3/h.
The data presented in
Figure 5b show that the composition of the produced gas was quite stable throughout the gasification process. Between 25 and 28 h into the process, and after approximately 46 h of the process, a significant decrease in the carbon dioxide content was observed, along with a simultaneous increase in the hydrogen, carbon monoxide, and ethane contents. After approximately 46 h of gasification, the methane content started to gradually increase, and after 60 h, it stabilised at the level of approximately 5%. The methane concentration during the whole process was in the range of 2–5.6%, while the ethane and hydrogen sulfide contents were practically below 0.5% and 0.2%, respectively. Throughout the whole experiment, high concentrations of hydrogen (23–38%) and carbon monoxide (27–46%) were observed.
Figure 5c shows that the flow of the hydrogen and carbon monoxide increased twice: it doubled between 25–28 h, as well as from 46 h to the end of the gasification process. In the case of the ethane, its flow rate doubled for the time period of 25–28 h, and from 46 h, the flow even tripled. In the second half of the gasification process, a clear increase in the methane flow was observed. From approximately 46 h to the end of the gasification, the flow of the methane increased to triple its value, and this occurred in the same period of time as the increased flow of the hydrogen and carbon monoxide. Based on the data on the balance of the coal contained in the coal seam before gasification and in the obtained gases, it was possible to calculate the amount of gasified coal. These calculations showed that 532.80 kg of coal was gasified, which constituted 23.17% of the total amount of the raw coal placed in the reactor.
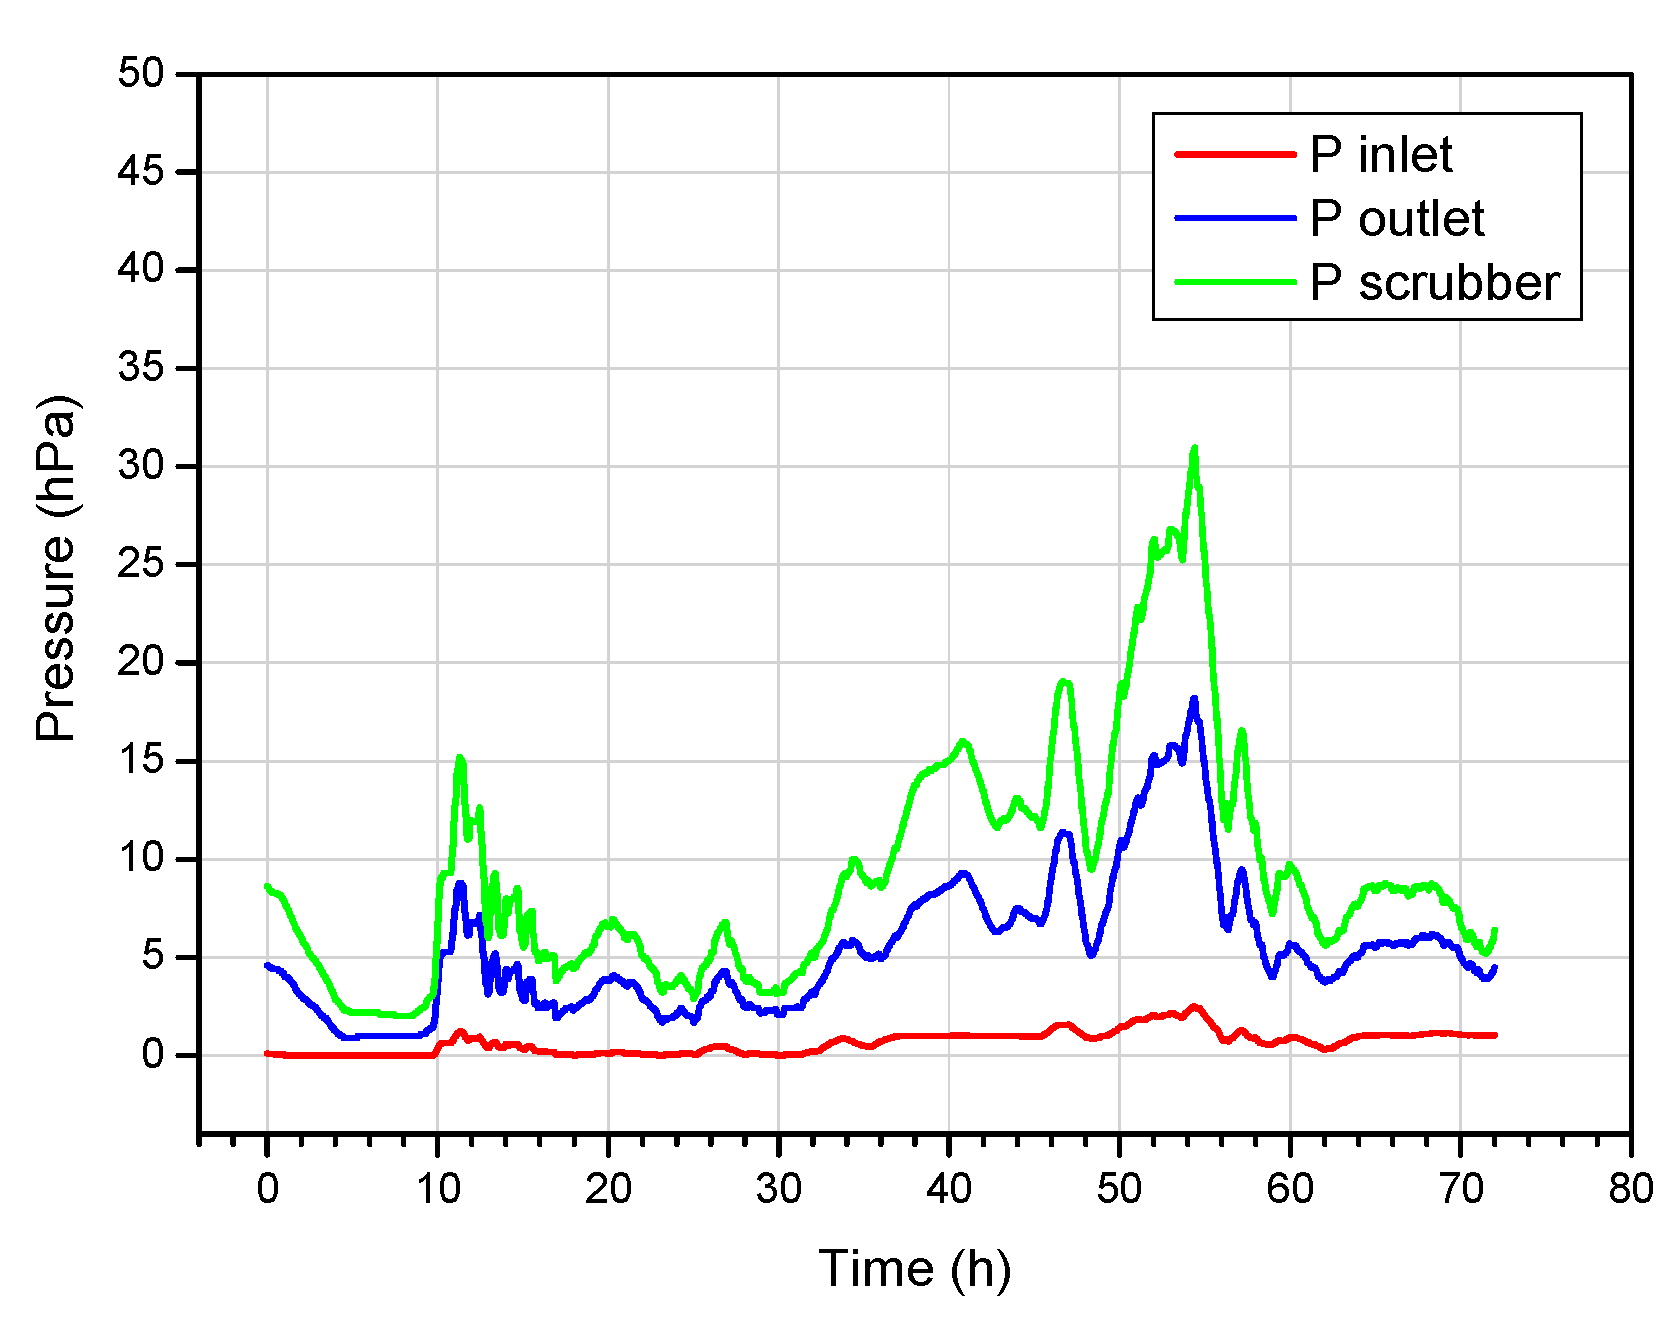
3.4. Pressure Profiles
The course of the pressure changes during the gasification is shown in
Figure 6. The presented data show that, in relation to the atmospheric pressure, the gasification process was carried out at a slight overpressure between 0–17 hPa. As there was no negative pressure in the reactor during the coal gasification, the process gas and tar emission were not forced by the suction fan. From the pressure graph (
Figure 6), it can be seen that the scrubber had a higher pressure than the reactor outlet; it is also seen that the pressure changes in the scrubber were proportional to the pressure changes at the reactor outlet. The higher pressure in the scrubber was caused by the increase in the amount of water vapour, which was formed as a result of the evaporation of the water that was injected into the scrubber.
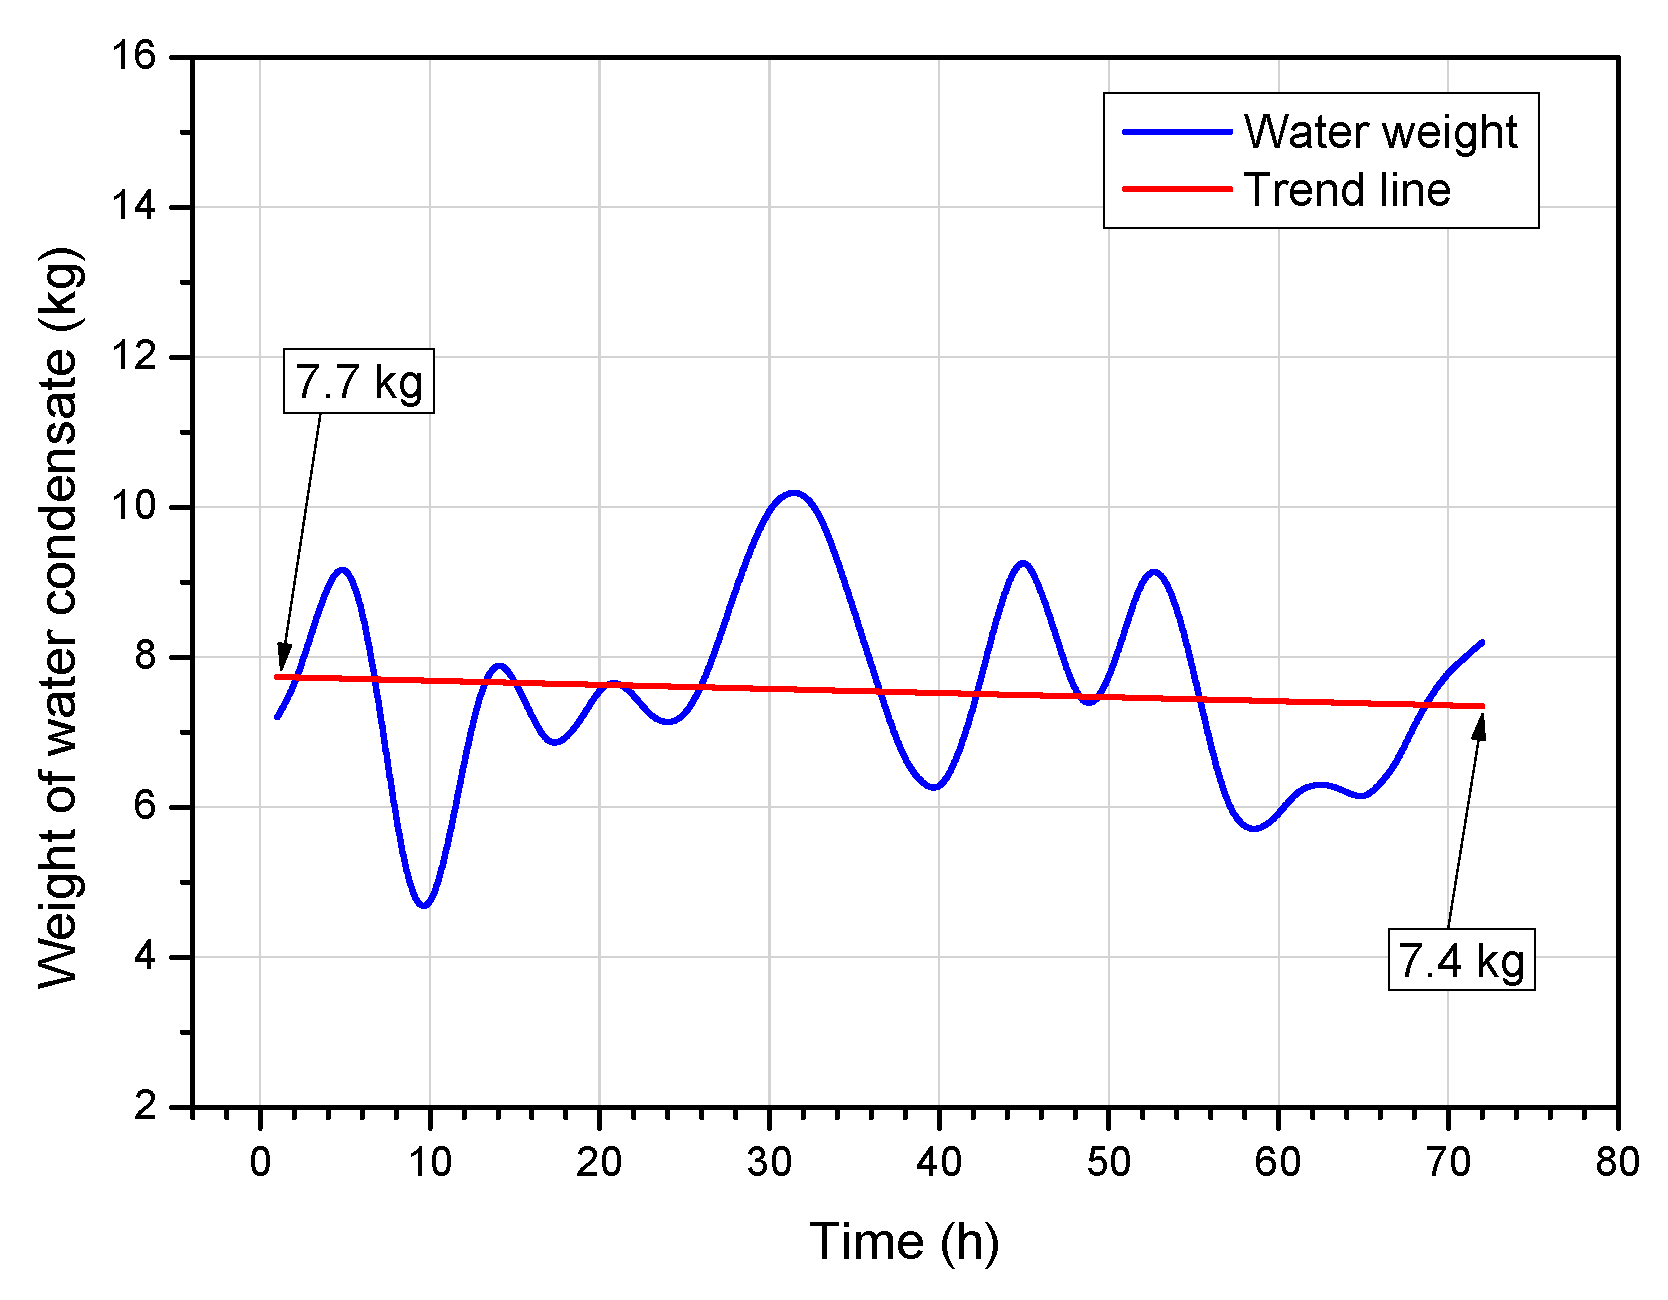
3.5. The Obtained Amount of Postprocessing Water
The total amount of the water taken from the scrubber was 1529 kg. The real amount of the water obtained from the coal gasification was lower, because the water that was added to the wet scrubber to cool the process gas must be subtracted from this amount. The amount of water that was added was 1008 kg, so the postprocess water yield was 521 kg. The gasified block of coal contained only 108.1 kg of water, so the separated water must have originated mainly from the evaporation of the moisture contained in the wet sand, and only some of it would have come from the water contained in the coal. The dependence of the amount of the obtained post-process water (after subtracting the water that was added to the scrubber) on the gasification time is shown in
Figure 7.
The lowest and highest amounts of the water produced, amounting to 4.7 kg and 10.2 kg, were recorded at 10 and 31 h of the process, respectively. The trend line for the changes in the amount of obtained water, shown in
Figure 7, has a downwards trend, which indicates that, as the gasification progressed, the amount of water that was released decreased.
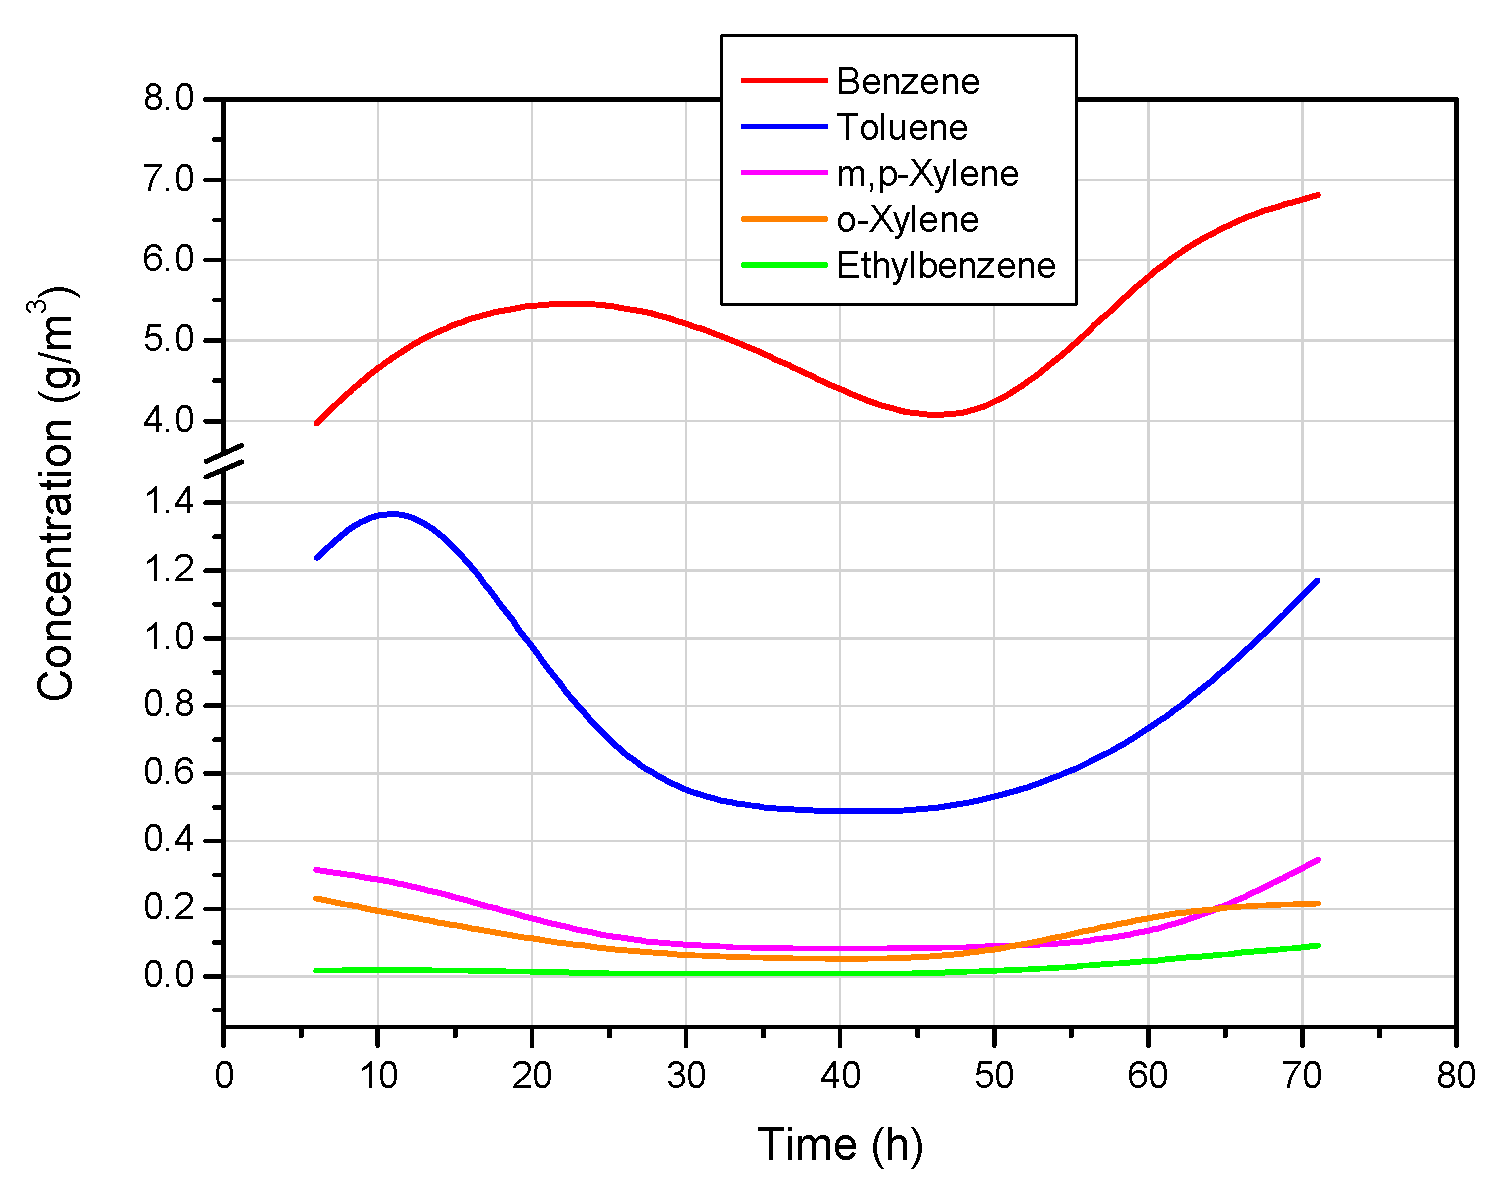
3.6. Concentration and Mass Flow of BTEX, PAHs and Phenols in Tar
The concentrations of the individual tar components are shown in
Figure 8,
Figure 9 and
Figure 10, while the total list of the analysed compounds and their average concentrations are shown in
Table 4.
Figure 8 shows that the concentration of benzene was the highest among all the hydrocarbons of the BTEX group, amounting to an average of 5051.2 mg/m
3. The next most concentrated compound was toluene, with an average concentration of 708.6 mg/m
3. The average concentrations of the other BTEX components (m,p-xylene, o-xylene, and ethylbenzene) were significantly lower, and amounted to 148.7, 103.1, and 23.3 mg/m
3, respectively.
Figure 9a,b show the concentrations of the PAH compounds at high and low concentrations. The highest concentration of this group of compounds was characterised by naphthalene, acenaphtylene, and phenanthrene. Their average concentrations in the process gas were 522.9, 110.7, and 91.6 mg/m
3, respectively.
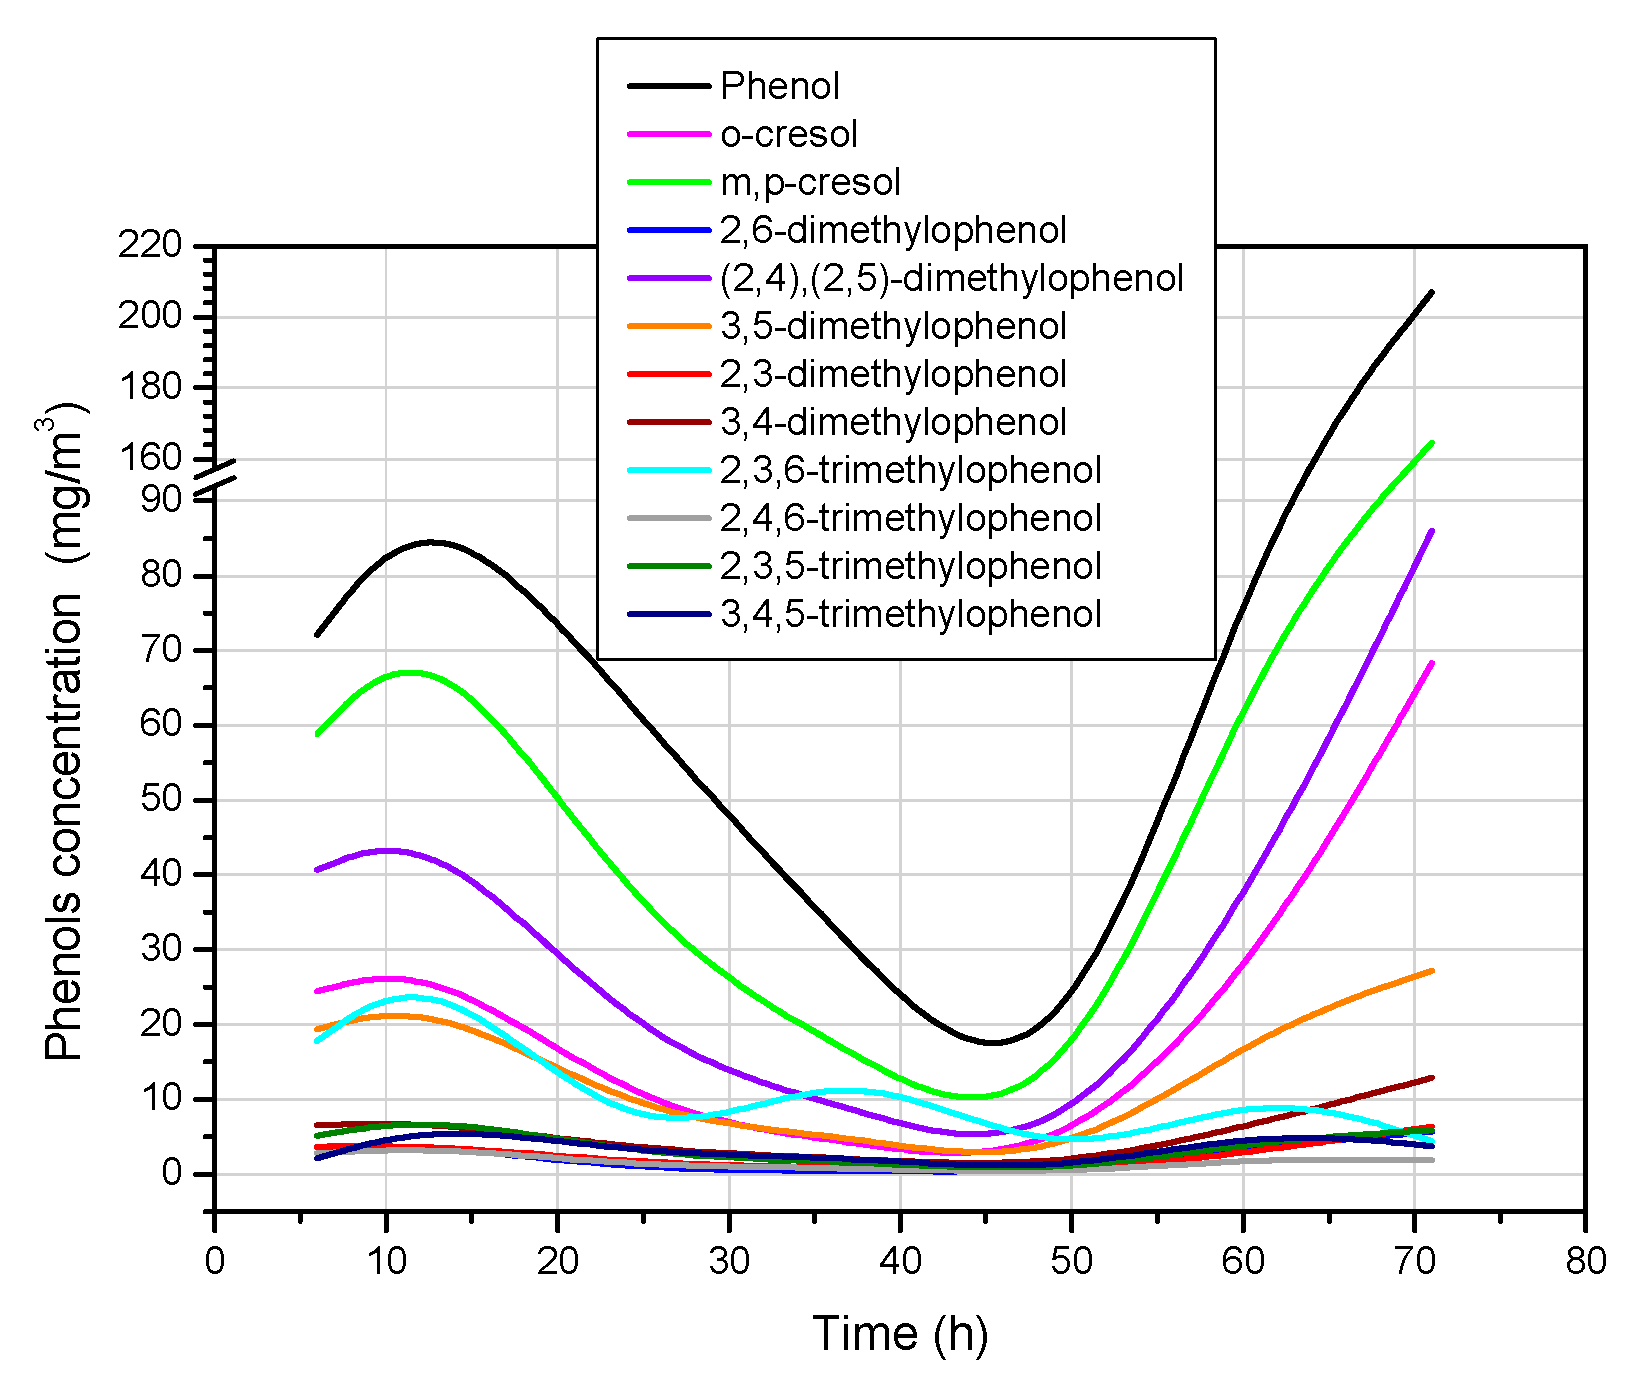
Phenols, whose concentrations are shown in
Figure 10, are the third group of the compounds that were tested. In this group of compounds, the highest average concentration was characterised by phenol (69.1 mg/m
3), followed in decreasing order by m,p-cresol (48.2 mg/m
3) and (2,4),(2,5)-dimethylphenol (26.9 mg/m
3). The concentrations of the remaining compounds in this group were significantly lower (
Table 4).
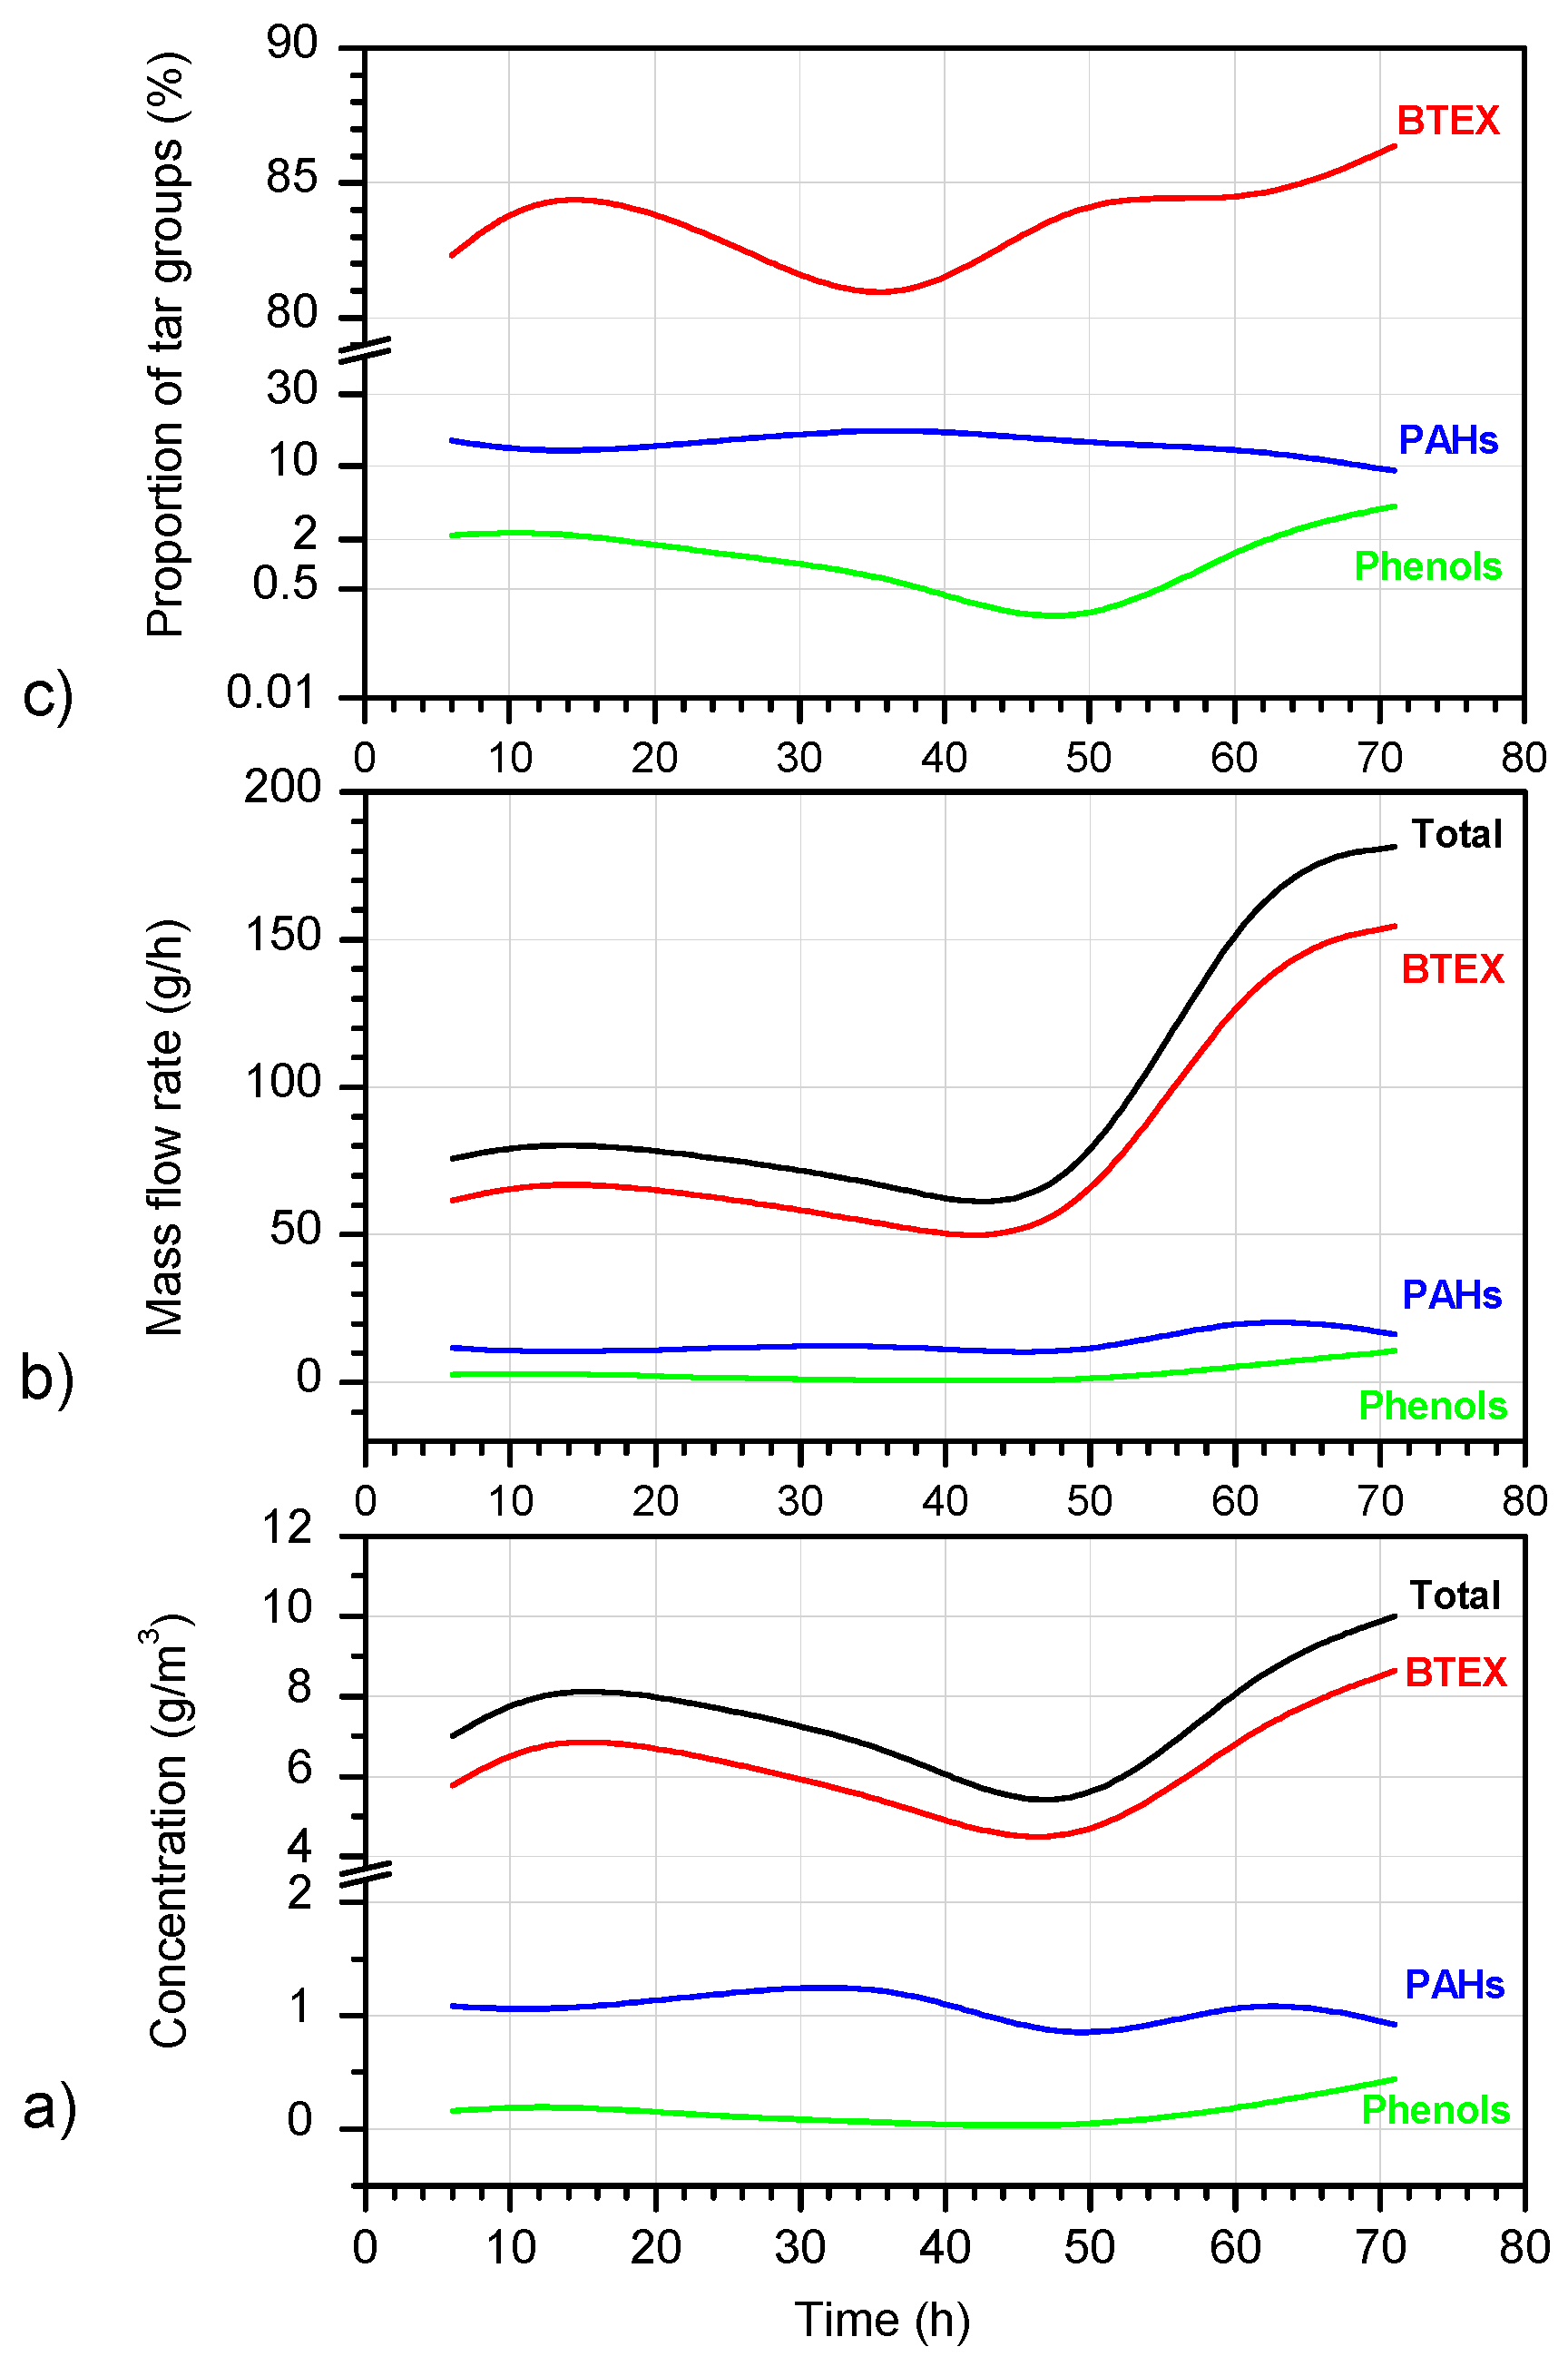
3.7. Concentrations, Mass Flows and Proportion of the Sum of BTEX, PAH and Phenol Compounds
Based on the results that were obtained, the concentrations of the individual compounds in the groups were summed and presented as total concentrations of the BTEX, PAHs, and phenols. The mass flow of these groups in the process gas and their mutual proportions were also calculated. The results that were obtained are presented in
Figure 11a–c.
3.7.1. Concentration of Tar Groups
Figure 11a shows that, after the ignition of the coal seam, the BTEX concentrations started to increase from a value of approximately 5.7 g/m
3, and then started to decrease to a minimum value of 3.7 g/m
3 at the 46th hour of the process. After that, the BTEX concentrations increased again to a final value of 8.60 g/m
3. The second group of the compounds, in terms of mass, are the PAHs. At the beginning of the experiment, the PAH concentrations decreased slightly, then started to increase until hour 30, and then decreased again until hour 46. Thereafter, their concentrations increased again, and after hour 60, they decreased again until the end of the gasification process. At the start of the gasification, the PAH concentration was 1.08 g/m
3, and at the end, the concentration was 0.93 g/m
3 (average 1.07 g/m
3). Phenols were the group of compounds whose obtained amount was the lowest. At the beginning of the process, the concentration of the phenols was 0.15 g/m
3, and after a temporary increase, it dropped to 0.033 g/m
3. Thereafter, a steady increase in the concentration was recorded up to a maximum value of 0.45 g/m
3 at the end of the gasification test. The average concentration of the phenols in the process gas was 0.20 g/m
3.
3.7.2. Mass Flows and Proportion of Tar Groups
From the graphs of the mass flows of the BTEX, PAHs, and phenols, as shown in
Figure 11b, it can be seen that, up to approximately 46 h of the process, the curves are similar in shape to the curves that show the changes of their respective concentrations in the process gas (
Figure 11a). After 46 h of the process, a large increase in the mass flow rates of all the tested tar groups was observed. With regard to the changes in the proportions of the discussed groups of compounds,
Figure 11c shows that, after the ignition of the coal seam, the percentage of the BTEX compounds, which were the dominant group in the tar up to the 15th hour of the process, increased from 82% to 84%, and then started to decrease to a minimum value of 81% at the 46th hour of the process. Starting at 46 h, the proportion of the BTEX in the tar was observed to increase to a final value of 86%. As shown in
Figure 11c, the proportions of the PAH and phenol compounds were significantly lower than the proportion of the BTEX compounds. The proportion of the PAH compounds up to the 15th hour of gasification, initially amounting to 16%, dropped to 13%. By the 46th hour, there was an increase to approximately 17%, followed by a decrease to 9% at the end of the experiment. In approximately the first 46 h, the proportion of the phenols decreased in the range of 2–0.1%, and then constantly increased to the final value of 4%.
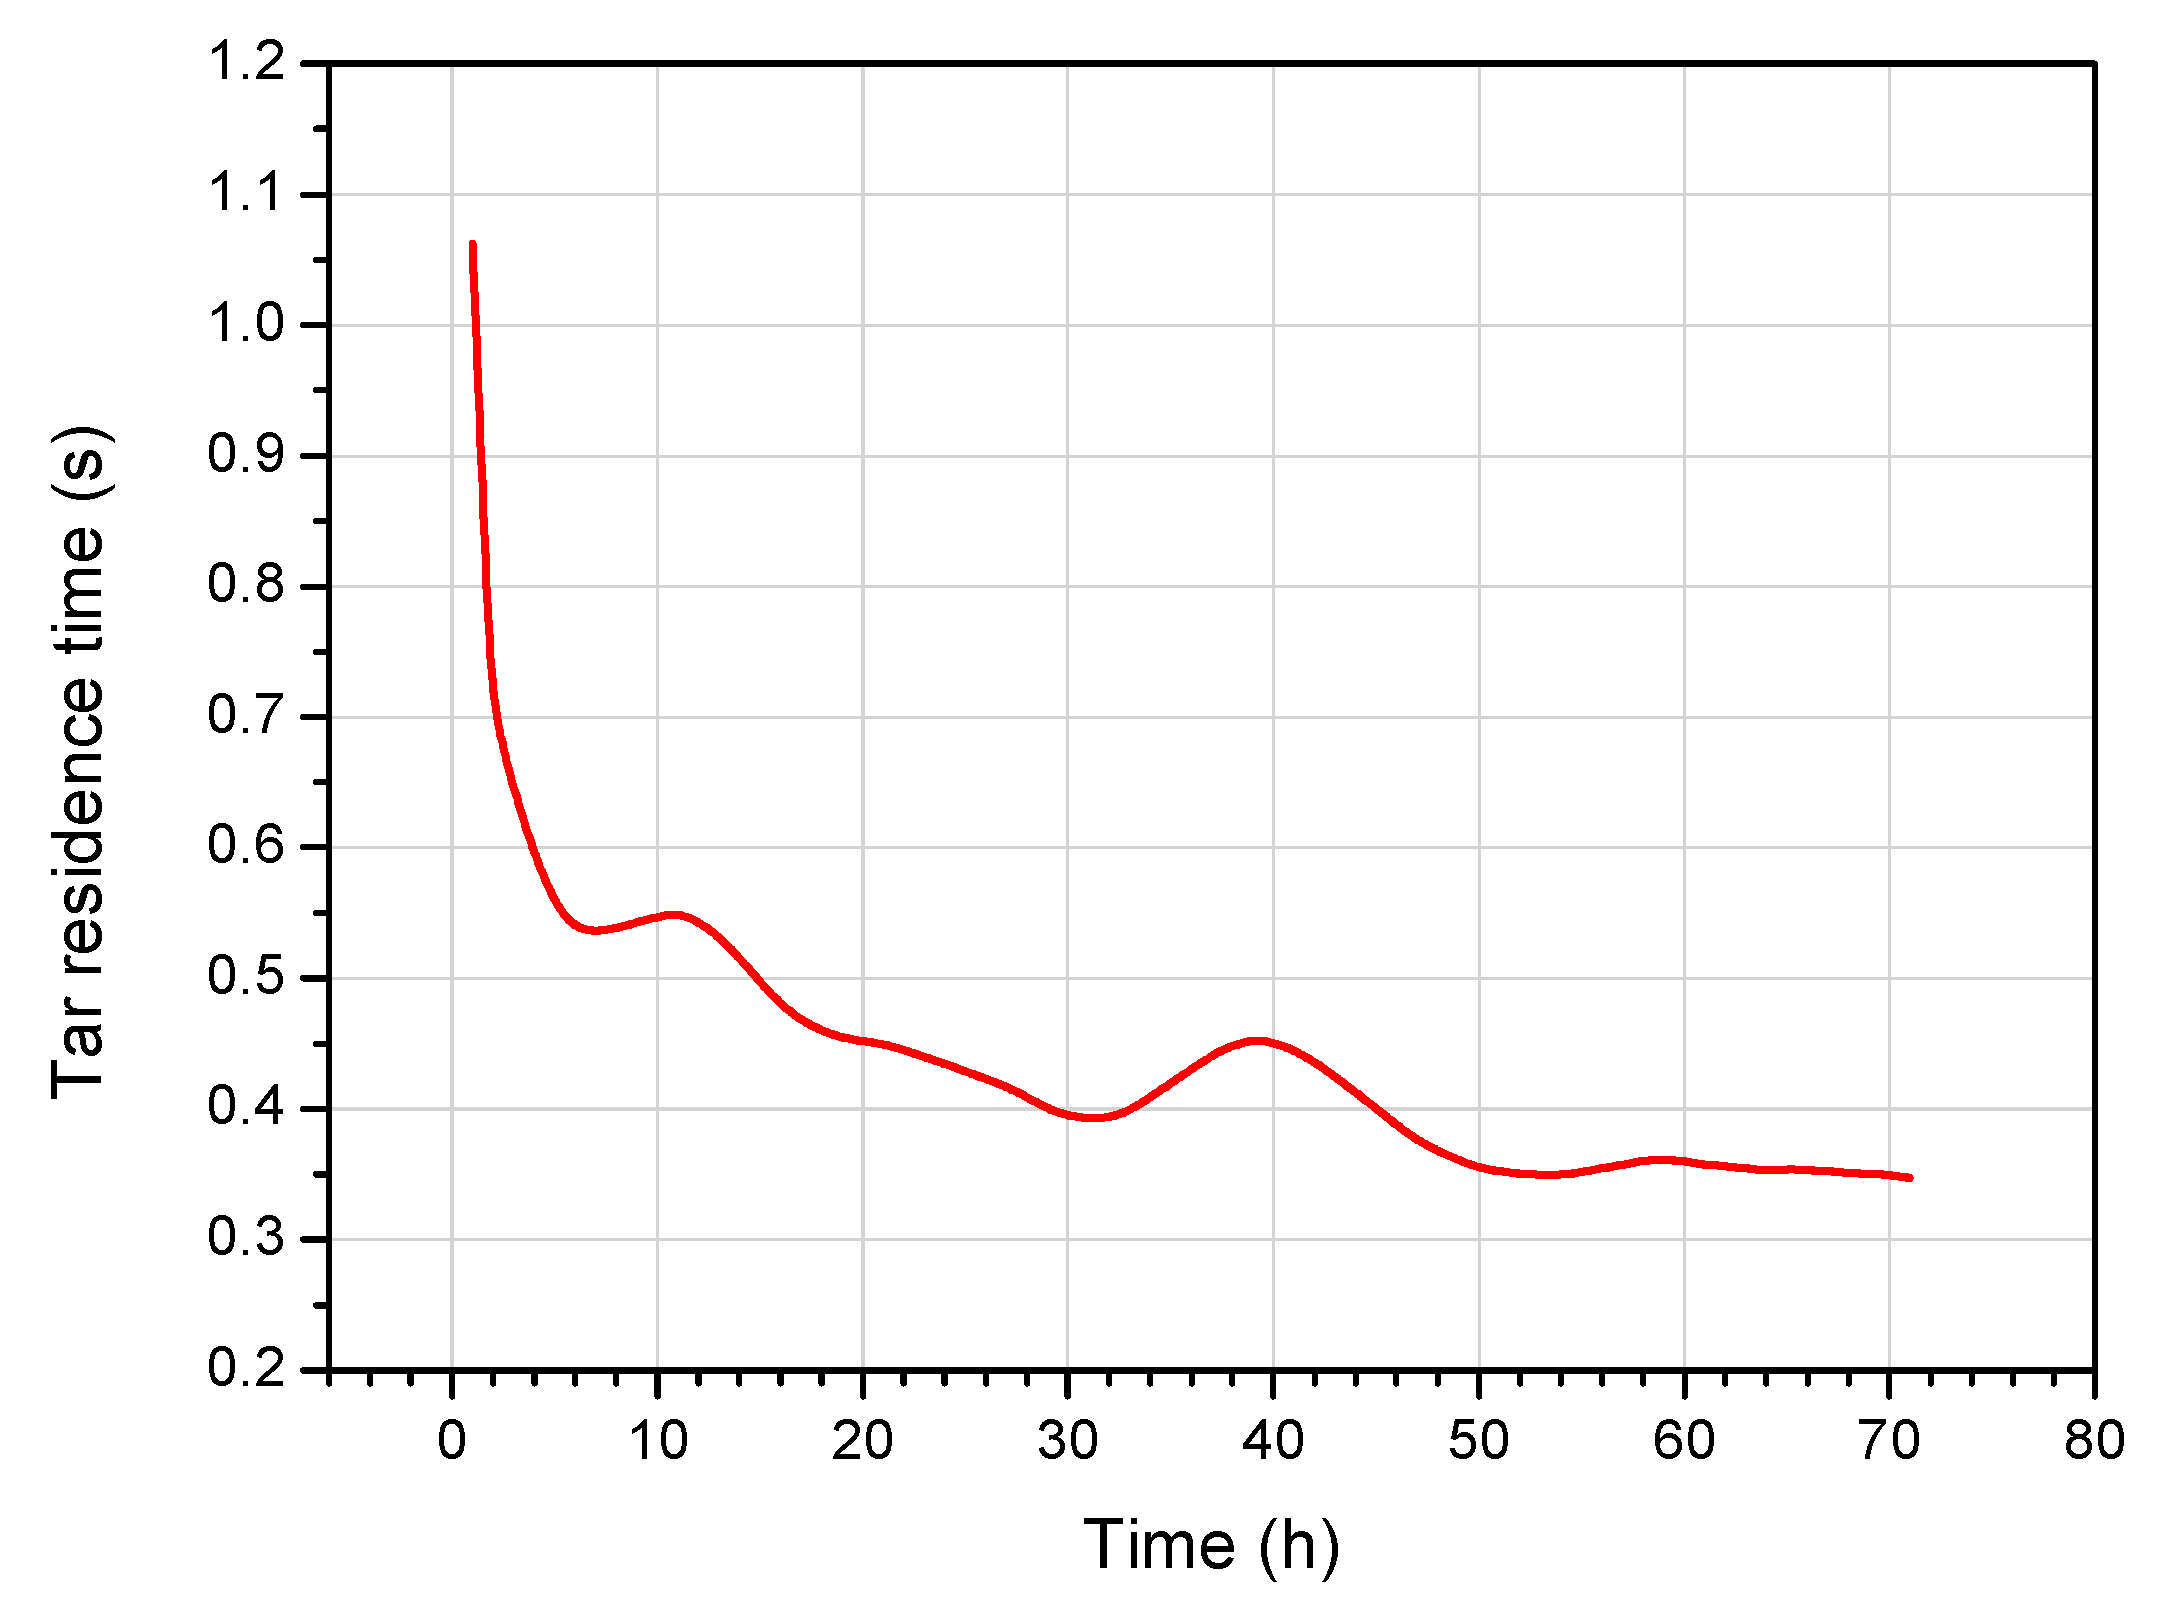
3.8. Residence Time of the Tar in the Reactor
The residence time of the tar vapours in the reactor can be calculated based on the temperatures in the reactor, the geometry of the reactor, and the amount of gases and water released in the process. The volumes of the tar vapours were neglected in the calculations, because they constituted 0.05–0.15% of the combined volumes of the produced gases and water vapour. The results of the calculations are presented in
Figure 12.
Figure 12 shows that, at the beginning of the experiment, the residence time of the tar in the reactor was approximately 1 s, and at the end, it was 0.35 s. This means that there was a threefold decrease as the reaction progressed. The visible local increases in the residence time at approximately 10 h and 40 h of the process are due to the lower amount of water released at these times (
Figure 7).
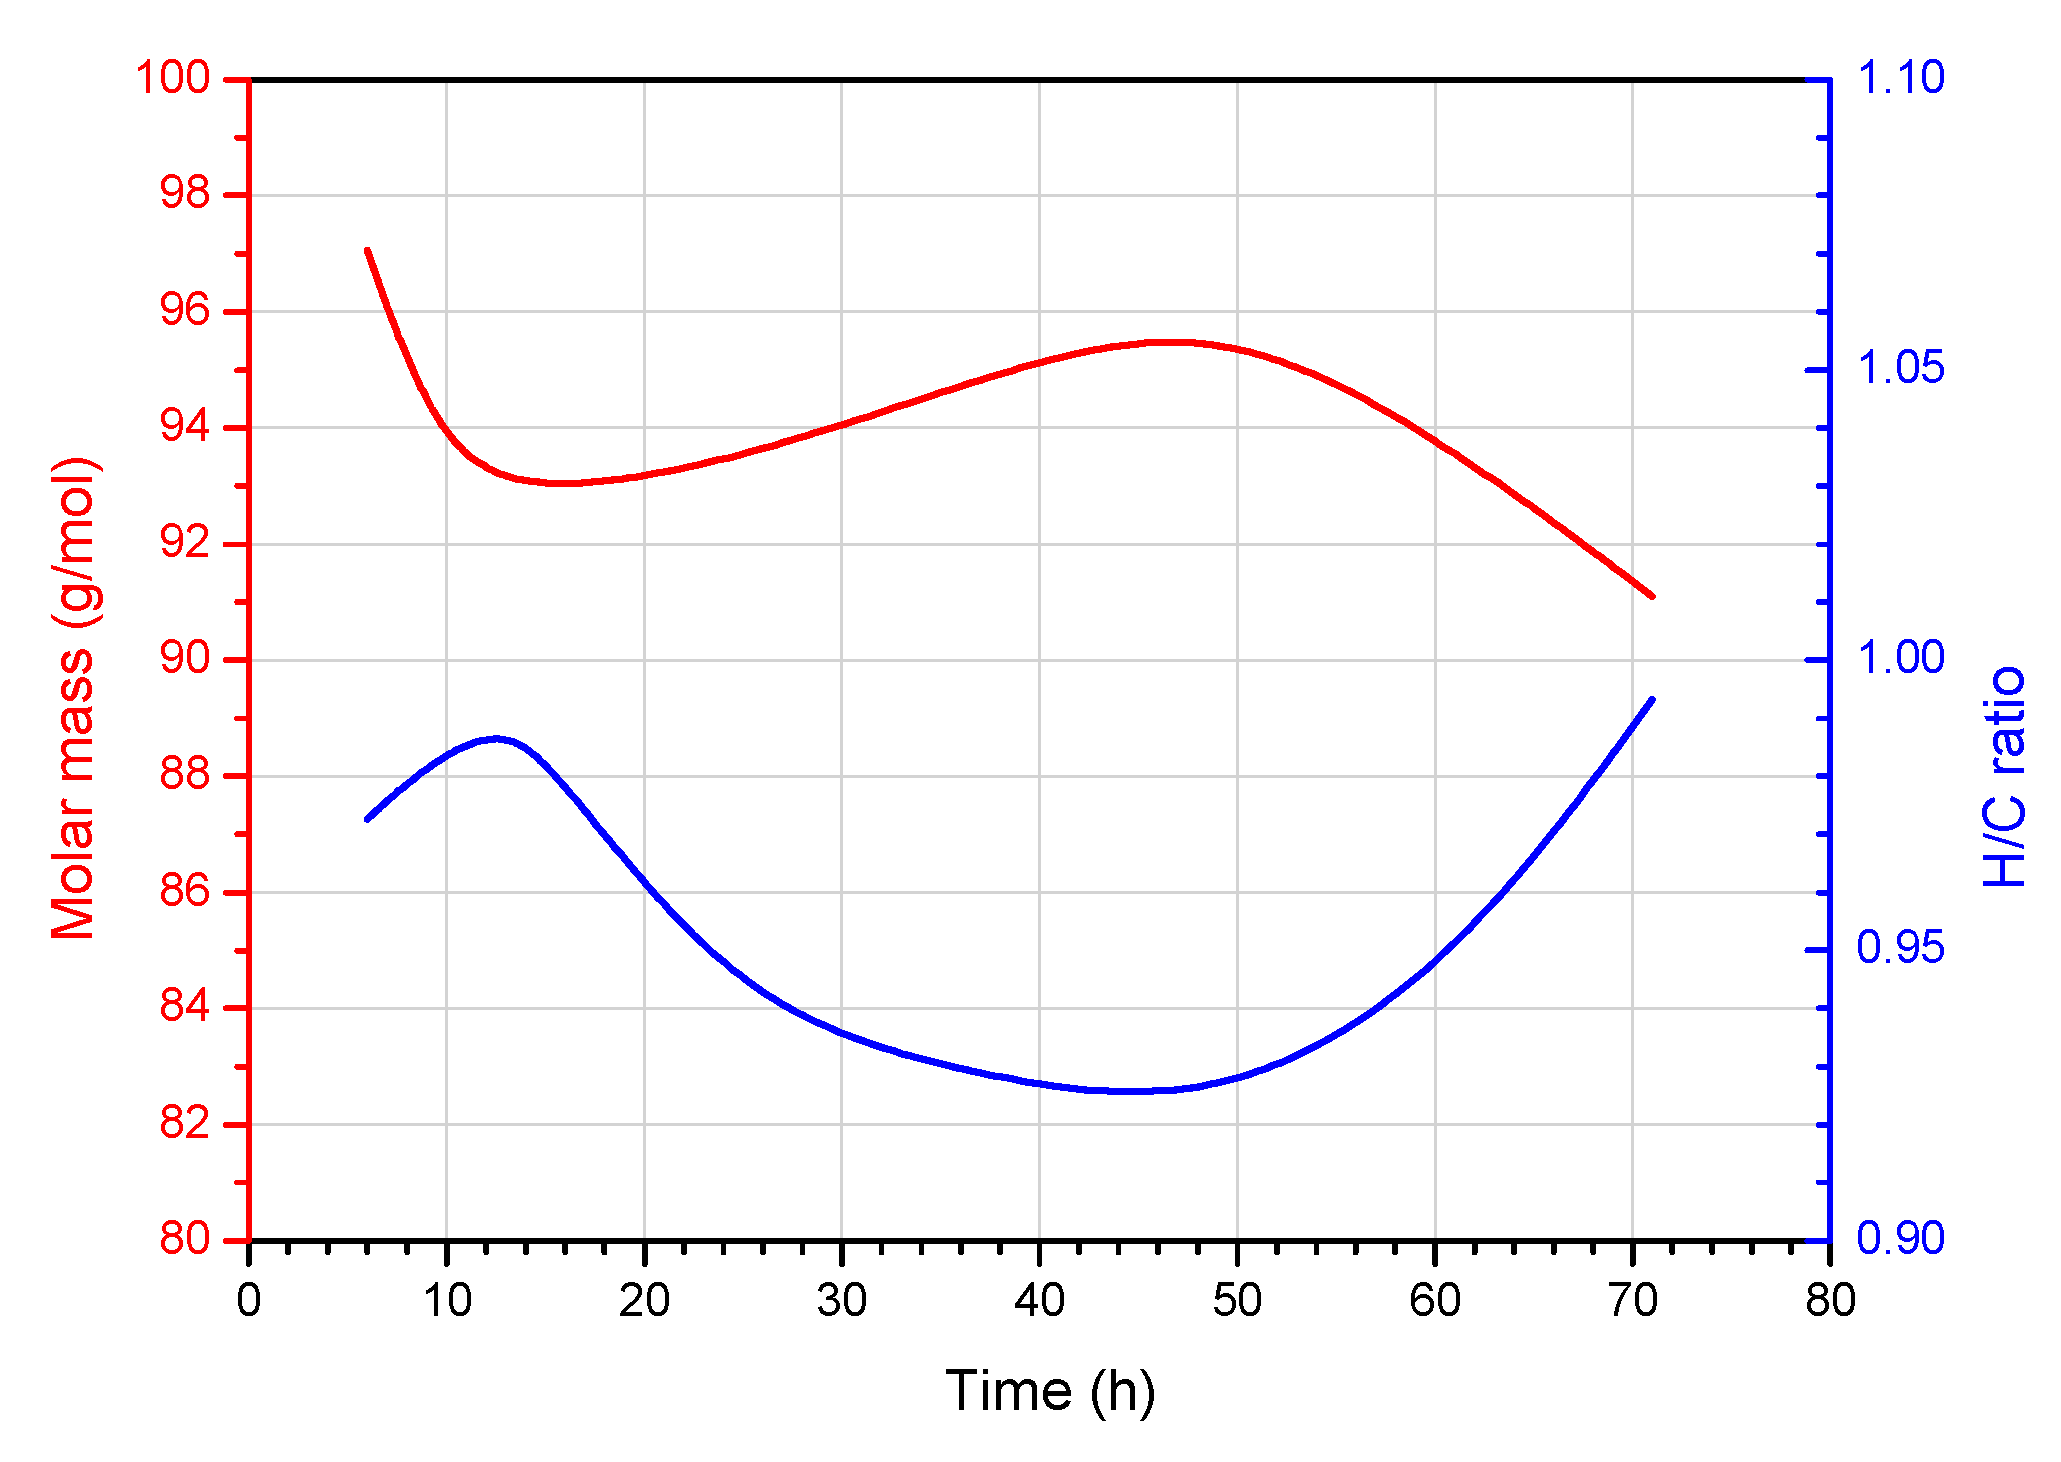
3.9. Molar Masses and H/C Ratio in Tar
Based on the data on the yields of the analysed components of the tar and their molecular weights, graphs of their changes in molar mass and H/C ratio during the gasification process were prepared. The results of the calculations are presented in
Figure 13.
Figure 13 shows that the changes in molar mass and H/C ratio were inversely proportional to each other. An increase in the molecular weight of the tar corresponded to a decrease in the H/C ratio, and vice versa. This validates the analysis and calculations, because the lighter the tar was, the higher the H/C ratio.
Figure 13 shows that, at the beginning of the process until approximately 15 h, the molar mass of the tar decreased from a value of approximately 97 g/mol to 93 g/mol. At the same time, the H/C ratio increased from 0.97 to 0.99. Then, by the 46th hour, the molar mass began to increase, and the H/C ratio began to decrease. At the 46th hour of the process, the molar mass was 95.5 g/mol and the H/C ratio was 0.93. From this point in time until the end of the experiment, the molar mass began to decrease to a value of 91.1 g/mol, and the H/C ratio steadily increased to a final value of 0.99.
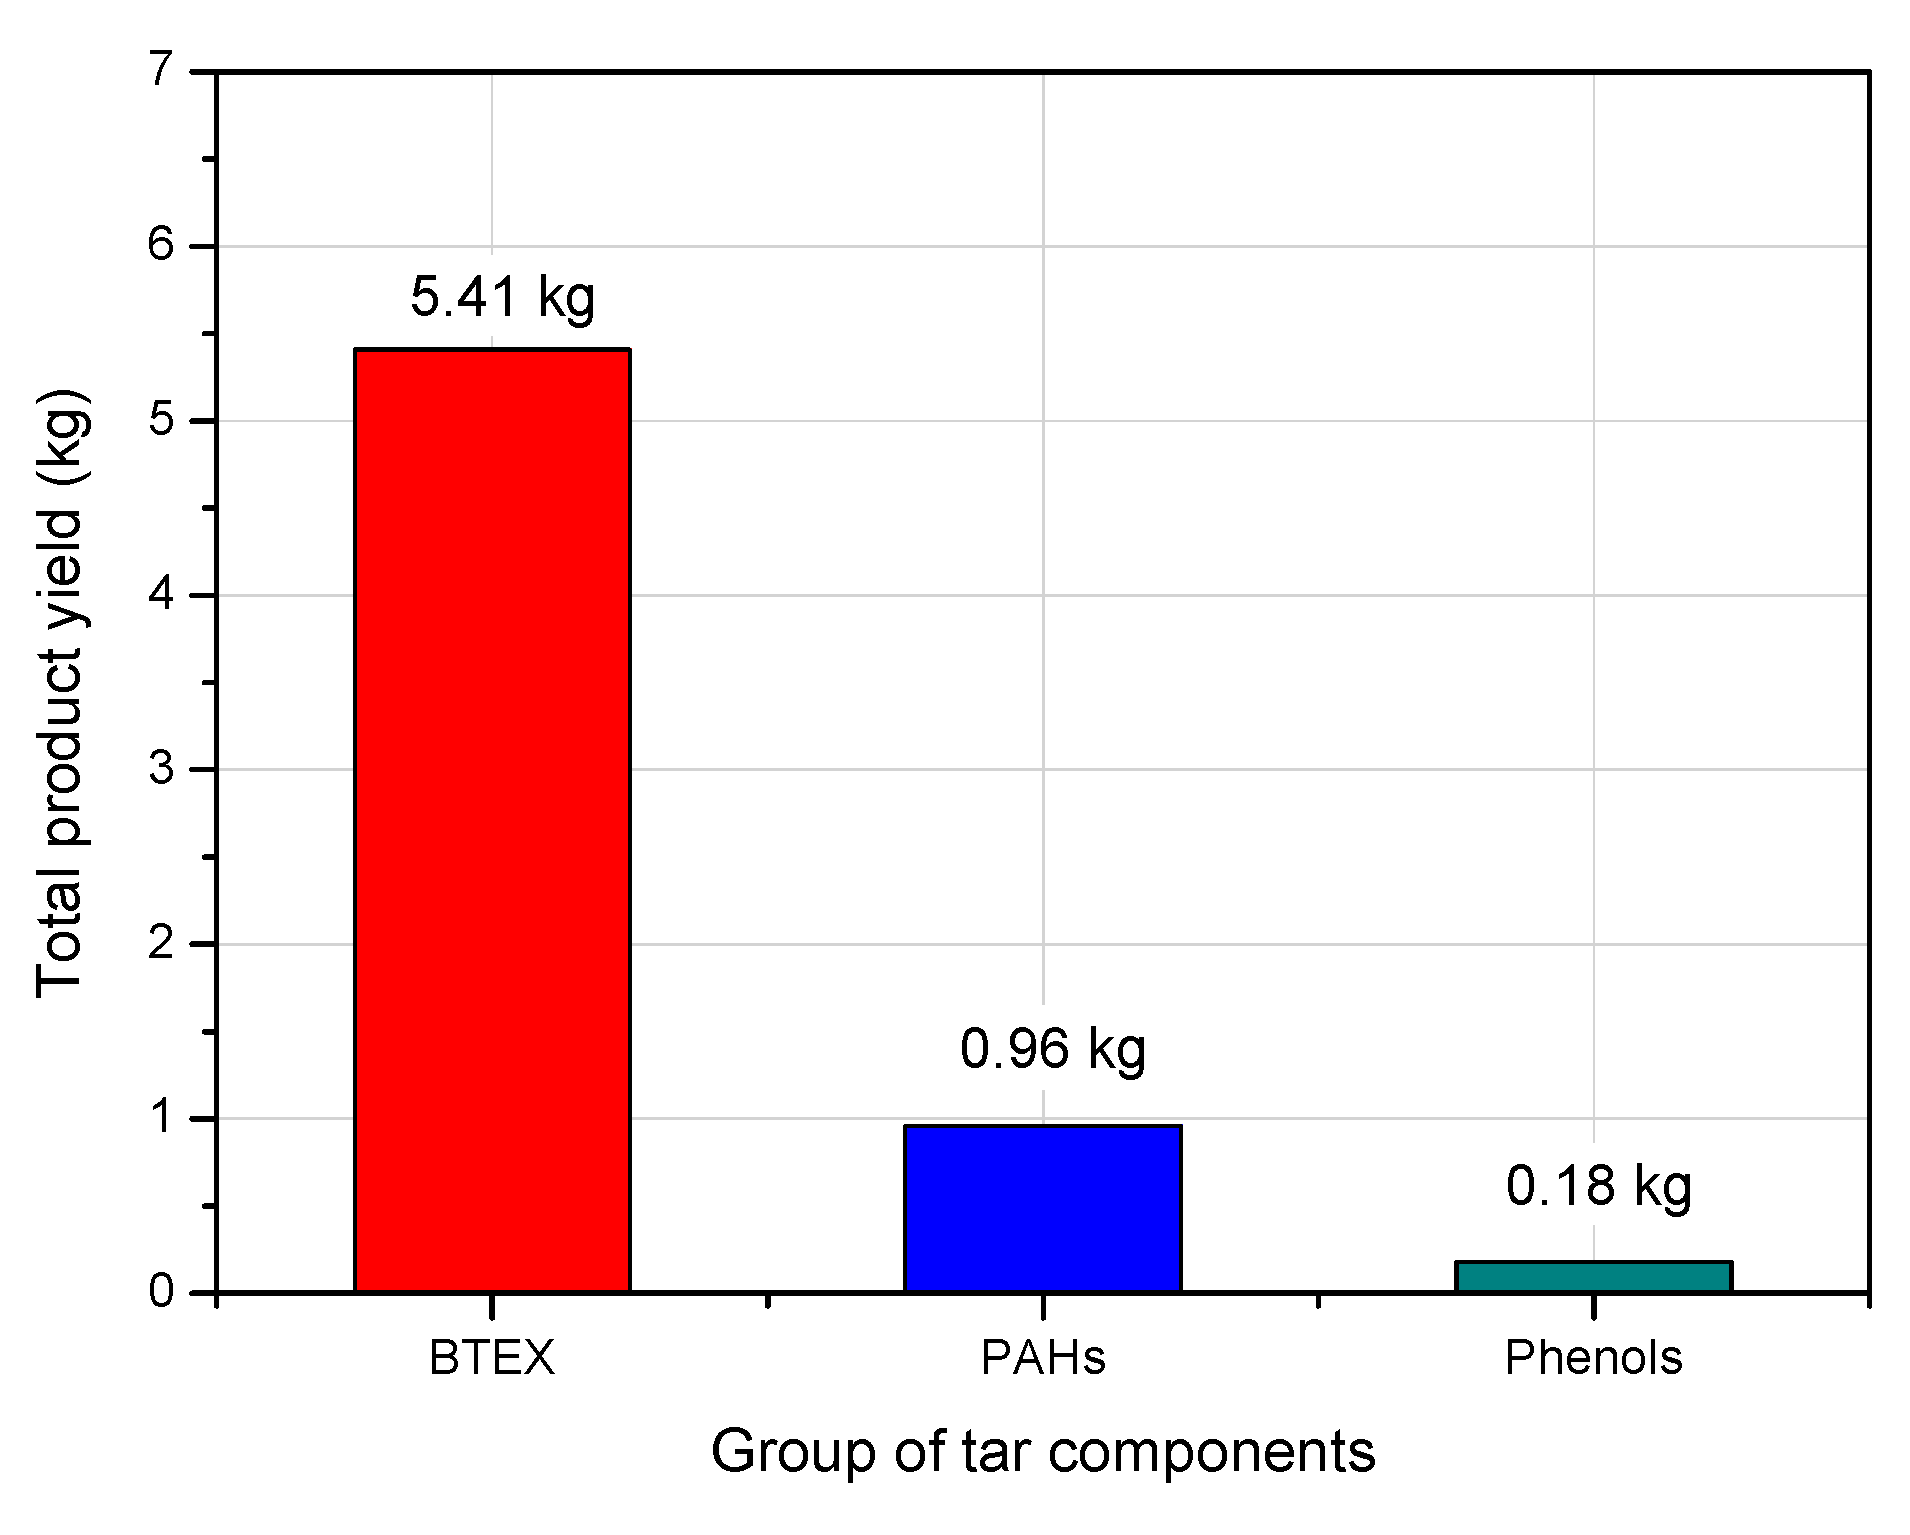
3.10. Total Production of BTEX, PAHs and Phenols
The total production of the particular compounds in the tar was calculated based on the data for the amount of gas that was produced and the data for the concentrations of those compounds. The results are presented in
Figure 14.
The calculations show that, during the coal gasification test, the amounts of the BTEX, PAHs, and phenols that were produced were 5.41 kg, 0.96 kg, and 0.18 kg, respectively. Their average concentrations were 82.6%, 14.7%, and 2.7%, respectively. The total mass of these compounds was 6.55 kg. An inspection of the internal sections of the process gas pipeline following the process did not reveal any tar deposits on the walls, which indicates that practically all of the tar produced during the gasification was transported outside the reactor in the gas stream. An estimation of the efficiency of the tar production from the gasified coal was made, taking into account the total amount of the gasified coal, which was 532.8 kg. The tar yield was 12.3 kg per ton of coal, which accounted for 1.23% of the total mass of the gasified coal. This is not the summary amount of the tar produced, because only a part of the compounds present in the tar was determined, so the total yield should be higher.
3.11. Measurement Errors
During each experiment, measurement errors are made, the magnitude of which depends on the accuracy of the analytical methods that are used, the accuracy of the measuring apparatus, the methodology that is used to conduct the experiment, and the sampling used for the analysis. It is assumed that the possible inaccuracies of the results presented in this work result from the imprecise determination of hydrocarbon concentrations in tar samples taken into sorption tubes. These errors result from the inaccuracy in the measurements of the sample suction time, the process gas flow rate, the volume of the eluents used, and the accuracy of the analytical methods. The total assay error can be estimated to be up to ±20% of the measured value, depending on the measured concentration level. The estimation of the amount of tar that was obtained is also flawed, because it was based on the analysis of 33 specific compounds (from the BTEX, phenol, and PAH groups), while the actual number of the chemical compounds that have been identified in tar is much higher, and amounts to several thousand. The content of many of these compounds in tar does not even exceed 1%. The estimation of this error was carried out using a semiquantitative method by analysing the spectra of the samples obtained during the chromatographic analysis that was performed in scanning mode. For this purpose, the ratio (in percentage) was calculated from the area of the peaks corresponding to the analysed compounds, divided by the sum of the areas of all the peaks obtained in the spectrum. Due to their very large number, those with a percentage share of less than 0.1% were omitted. The error that was calculated on this basis was approximately (minus) 30% of the total tar mass. In connection with the error in the tar composition measurements, the errors in the molecular weight of the tar and the H/C ratio are also estimated to not exceed 30%. The maximum measurement errors concerning the other measured physicochemical quantities are not as significant as those in the case of tar. For example, the measurement error for the process gas flow rate was approximately ±0.01 dm3, the temperature error was ±1 °C, and the gas concentration error was ±0.02 vol. %.
4. Discussion of the Results Obtained
The presented data show that, during the gasification test, tar products were constantly present in the process gases. This is because, during the process, the gasification zone was expanding, which meant that subsequent amounts of coal were gasified, producing new amounts of tar. Taking into account that tar formation stops when the temperature exceeds approximately 1000 °C, the tar was formed in areas where the temperature was lower than that. The gasification time interval was very important, starting from approximately hour 46 of the process, until the end of the process. During this time, the process gas stream started to increase, and at the same time, the concentrations of the hydrogen, methane, ethane, and carbon monoxide also started to increase. At the same time, in the process gas, the concentration of the sum of the compounds from the BTEX group almost doubled, and the flux of those compounds tripled. Similar changes were recorded in the proportions of the individual compounds. There was an increase in the proportions of the BTEX compounds and phenol compounds, and a decrease in the proportion of the PAH compounds. The data show that the changes in the process gas and the tested tar were influenced by the water that was contained in the wet sand that surrounded the gasified coal seam. After the ignition of the coal, the temperature rapidly increased around the location of the igniting charge. The tar started to rise from the coal, and the water started to evaporate from the sand upon which the block of coal had been placed. The water vapour gradually reacted with the coal, and, as a result, high concentrations of hydrogen and carbon monoxide were observed in the resulting gases. From the moment of ignition until approximately the 15th hour of the process, the amount of light BTEX fractions increased in the emitted tar. Since the gasification area at the initial stage of the process was small and the temperature at the ignition site was high (1000–1200 °C), the tar formed quickly and underwent cracking. These tar cracking processes were favoured by the long residence time of the tar in the reactor during this period of time. As a result of the cracking, the molecular weight of the tar decreased, and the H/C ratio increased. After 15 h of the process, as the gasification progressed, the gasification zone continued to expand, and the amount of released water stabilised. Between 15 and 46 h of the process, the amount of tar that was produced decreased, as much of it was released earlier. At this time, the heavier components of the tar were released from the coal, which changed their composition due to the intensification of the secondary processes taking place under the influence of the rapidly rising temperature. In the produced tar, the concentrations of the BTEX and phenol compounds decreased, while the concentration of the PAH compounds increased, and then decreased again between 15–34 h. As a result, the molecular weight of the tar increased, and the H/C ratio was lowered. From the 46th hour to the end of the gasification process, a significant increase in the amount of process gas produced was observed. This was most likely the result of the gasification zone moving closer to the wet sand. Due to the high temperature, a large amount of water vapour began to escape from the sand and reacted with the incandescent coal. As a result, large amounts of hydrogen and carbon monoxide were produced.
Simultaneously, the reaction of steam with the coal-exposed “fresh” portions of the coal allowed for additional large amounts of tar to start escaping. The explanation for the large increase in the BTEX yields following the 46th hour of the process is more complex, because, according to theory, there could have been two reaction mechanisms that complemented each other. According to the first mechanism, at higher temperatures, the presence of steam increases the rate of the decomposition of the heavier components of the tar (cracking), resulting in an increase in its yield and a decrease in its molecular weight. According to the second mechanism, at lower temperatures, the hydrogen that is generated can reform into the separated tar components and inhibit the repolymerisation reaction of their molecules. As a result of both reactions, the amount of lighter separated tar increases. It seems that, under the conditions prevailing in the reactor (a high temperature at the beginning and a lower temperature at the end, and the presence of hydrogen and steam), apart from cracking, some reforming processes (isomerisation, cyclization, and aromatisation) could have taken place. As a result, the amount of the BTEX group hydrocarbons that formed was high. From the temperature data presented, the temperature in the reactor could have been in the range of 600–1200 °C. This suggests that the high-temperature mechanism, i.e., the cracking of the heavier components of the tar in the presence of hydrogen, is responsible for the high amount of the tar released from 46 h until the end of the process.
The amount of postprocess water that was obtained from this process was 521 kg. The conversion of this quantity of liquid water into steam requires supplying approximately 1265 MJ of thermal energy, which is equivalent to the combustion of approximately 56 kg of gasified coal. The consumption of this amount of energy must have lowered the temperature in the reactor, as shown in the temperature diagrams. The curves of the temperature changes that are presented in
Figure 4a,b show that, from a certain point, the rate of the temperature increase in the gasified bed decreased, or even stopped, which confirms the influence of water evaporation on the change in the process temperatures.
The yield of the tar that was obtained, in terms of the amount of the gasified coal, was approximately 1.23% of the mass of the raw coal that was gasified. Taking into account a 30% error in underestimating the amount of tar that was obtained, it was calculated that the yield of the tar in this process was approximately 1.8% of the mass of the gasified coal. When comparing the tar yield from the UCG process with the tar yield from a classic coal coking process, it should be taken into account that the coke oven tar yield is approximately 3.5–5% of the weight of the coked coal. This is the efficiency without light fractions (mainly BTEX compounds), as these fractions are separated from the coke oven gas as crude benzole. The yield of the crude benzol is typically 1.1% of the weight of the coked coal. Together with the crude benzole, the yield of the coke oven tar is 4.6–6.1%. This means that the tar yield from the UCG process was approximately 2.5–3.3 (3x on average) times lower than that of the coke oven tar. The tar from the UCG process contained 82.6% of BTEX compounds, 14.7% of PAH compounds, and 2.7% of phenol compounds. The yield of the benzene is very high, amounting to 0.95 kg/ton of the gasified coal, which is comparable to the yield of the benzene produced in the coal coking process, amounting to approximately 1 kg/ton. The high average content of the benzene in the tested tar (77.1%) indicates that it was formed as a result of thermal cracking. Starting from the 46th hour of the process, an increase in the amount of ethane produced is also visible. As ethane is released during the cracking of the tar, the increase in ethane during these time intervals indicates the occurrence of cracking processes in the tar produced.
Figure 5b shows that, at approximately the 25th hour of the process, there was also a temporary increase in the concentration of the ethane, carbon monoxide, and hydrogen. This was probably due to a momentary release of water vapour, which caused exactly the same phenomena in the process gas and the tar, and occurred from hour 46 onwards. The cracking and reforming of the tar also produces methane and hydrogen. These compounds increase the concentrations of the flammable components of the process gas, but in the UCG process, their main source is the reaction of steam with the coal.
In discussing the results obtained, it should also be taken into account that the iron contained in siderite may have had a catalytic effect in the Bouduard reaction. This could be possible if this iron was dispersed in the gasified coal. In this experiment, the siderite was arranged in a thick, solid layer, so the catalytic action, if it did occur, was only to a small extent and had no effect on the obtained results.
The results of the ex situ coal gasification presented in the article show that, during this process, tar was released with different intensities, and its efficiency and composition depended on the gasification parameters. Under in situ conditions, tar will also be released, because the process of its formation results from the chemistry of phenomena occurring during coal pyrolysis.
A review of the literature shows that the presence of tar in the process gas causes numerous problems related to its condensation in the pipelines that transport the produced gas to the surface. Knowledge of the yield and composition of the produced tar, determined on the basis of measurements that were made directly from the reactor outlet, is very important, because such data can minimize the adverse effects associated with the presence of tar in the process gas to an acceptable minimum. The ex situ coal gasification studies presented in the article were aimed at identifying this problem to a significant extent.


