Article

Characterizing Complex Deformation, Damage, and Fracture in Heterogeneous Shale Using 3D-DIC

1
Petroleum Engineering, School of Engineering, Texas A&M International University, Laredo, TX 78041, USA
2
Systems Engineering, School of Engineering, Texas A&M International University, Laredo, TX 78041, USA
*
Author to whom correspondence should be addressed.
Energies 2023, 16(6), 2776; https://doi.org/10.3390/en16062776
Submission received: 13 January 2023 / Revised: 12 March 2023 / Accepted: 14 March 2023 / Published: 16 March 2023
(This article belongs to the Special Issue Advances in Hydraulic Fracturing and Reservoir Characterization)

Abstract

:
Safe drilling and effective fracturing are constant challenges for shale formations. One of the most important influencing factors is the accurate characterization of the deformation and damage caused by inherent lamination and natural fractures. Furthermore, shale formations exhibit fine-scale heterogeneity, which conventional laboratory methods (linear variable differential transformer (LVDT), strain gauges, etc.) cannot distinguish. To overcome these constraints, this research aims to investigate the damage and deformation characteristics of shale samples using three-dimensional digital image correlation (3D-DIC). Under uniaxial and diametrical compression, samples of Wolfcamp, Mancos, and Eagle Ford shale with distinct lamination and natural fractures are evaluated. The 3D-DIC system is utilized for image processing, visualization, and analysis of the shale damage process under varying loads. DIC made quantitative full-field strain maps with load (tension, compression, and shear), showing all the damage process steps and strain localization zones (SLZs). DIC maps are used to quantify damage variables in order to investigate sample damage. Damage variables are used to categorize the damage evolution process of shale specimens into four stages: initial damage, linear elastic, elastic–plastic, and plastic damage. Characterizing shale damage evolution with a strain localization line is more effective because there is more damage there than in the whole sample. Damage variables based on major strain and its standard deviation from the DIC strain map for all tested shale samples follow a similar trend, though diametrical compression variables are greater than uniaxial compression. In both uniaxial and diametrical compression, the Wolfcamp shale was reported to have the highest damage variable, which was measured at 0.37, while the Eagle Ford shale was reported to have the lowest damage variable. This image-based technique is more effective not only for understanding the laminated and naturally fractured rocks but also for predicting the hydraulic fractures that will occur during the stimulation process.

1. Introduction

Safe drilling and efficient fracturing are ongoing challenges in unlocking the potential of shale reservoirs. The accurate assessment of a shale reservoir’s geomechanical characteristics is critical to the success of a fracture operation [1]. To fully understand fracture behaviors and hydraulic fracture treatment design in shale, it is critical to explore the parameters that influence geomechanical behavior as a result of its deformation features. As a result, a quantitative estimate of shale mechanical characteristics significantly impacts hydraulic fracturing planning and operation [2].
In rock mass engineering, rock failure owing to compressive and focused loading is a common occurrence. Before the failure, rock accumulates damage, fracture initiation, propagation, interaction, and failure. It is critical to analyze the deformation and failure events of rock under varied loading scenarios to have a better understanding of the mechanisms underlying rock failure. When stress-induced damage accumulates over time, rock material deteriorates [3].
There is a complex sequence of events that leads to rock failure, including the accumulation of damage, onset of fracture, propagation of internal and exterior damage, interaction, and finally rock failure [4]. Strain mapping of complex or heterogeneous geo-materials, however, presents challenges when conducted with conventional laboratory strain tracing techniques (strain gauges, extensometer, or LVDT). Therefore, precise strain monitoring, which participates in forecasting material properties, is crucial to advancing the study of material behavior. In addition to the intrinsic anisotropy and heterogeneity of any specific shale formation, the presence of natural fractures and other geological discontinuities adds levels of complication to any attempt to statistically measure fracture behaviors [5].
Digital image correlation (DIC) is a strong optical approach for assessing a specimen’s deformation and full-field strain map [6]. It is important to remember that this is just one approach. DIC can circumvent the limitations of conventional strain measurement techniques since it maps the full-field strain during loading [7,8,9,10].
DIC is a useful experimental technique for monitoring rock deformation and failure in response to varying loads because of its ability to provide direct information on displacement and strain fields across a wide range of conditions and its many other desirable features (such as its full-field, real-time, online, non-contact, flexible nature, etc.). Using DIC, the failure process of quasi-brittle material was seen in a three-point bend test; the evolution of damage fields was defined by strain fields. The standard deviation of the DIC strain field has been identified by Ma et al. as the damage variable, and a damage curve of rock has been provided throughout the entire loading process [11]. It was also determined, using the DIC deformation field, how fractures occur from oblique cracks in soft rock subjected to uniaxial plane strain compression. In addition, uses of DIC to identify and describe cracking have been documented during the past year.
X-ray computed tomography (CT) and scanning electron microscopy (SEM) are frequently employed to determine rock cracks’ mesoscopic and microscopic damage features and propagation processes [12,13]. To establish the damage variable, the CT number was proposed as a method based on the CT principle [14]. Using the SEM, the volumetric porosity and accumulated plastic strain are used to determine the damage variable [15]. This is done so that the damage process can be studied.
To investigate the microscopic and mesoscopic details of rock degradation and deformation, researchers employed CT, AE (acoustic emission), and SEM [16,17,18]. While more expensive alternatives such as CT, SEM, and AE may provide certain advantages, DIC provides the same advantages at a reduced cost, including but not limited to larger sample sizes, higher precision, broader fields of view, etc. The rock-mechanics sector has made considerable use of DIC because it is a superior nondestructive testing technique [19,20]. In the realm of rock mechanics, DIC has been widely implemented as a superior nondestructive testing method [21].
Although DIC techniques have been utilized to characterize the fracture growth and failure pattern of carbonate and sandstone, and the failure mechanisms of Mancos shale under indentation [22,23,24], insufficient work has been done to explain the stages of rock damage using deformation evolution deploying DIC under uniaxial and diametrical compressions. The degradation of a rock sample can be studied by looking at how its shape changes over time when it is under stress [25].
The rupture of shale is directly tied to the accelerated evolution of strain, yet the relationship between damage evolution and strain localization remains unexplained [26,27,28]. To define the damage progression and localization from strain fields under varied loading conditions, we are inspired to explore and experimentally investigate the rock deformation and damage process in shales.
This study presents the results of uniaxial and diametrical compression tests performed on shale to examine the development of damage and fracture. Laminate and naturally fractured samples of Wolfcamp, Mancos, and Eagle Ford shales are studied. Using the 3D-DIC technique, deformation data is continually collected throughout the loading process. The damage factor connected with the deviation of the strain is calculated, and the localization factor is presented to characterize the damage evolution of rock by considering the variability of the deformation field and the spatial distribution of the damage.

2. Materials and Methods

2.1. D-DIC Principle

DIC is a powerful nondestructive technique for assessing the deformation field in a variety of materials. This technique allows for accurate 2D and 3D displacement quantification based on the grey level difference between two digital photographs of the specimen surface in two different states, and it also paves the way for additional research on fracture analysis of the anisotropic material tracking the deformation measurement. Displacement fields can be calculated using the DIC method, which involves comparing a set of digital speckle images captured under different loads. The correlation coefficient is computed using the following formula [29,30]:
C X = i = 1 m j = 1 m f x i , y j f · g x i * , y j * g i = 1 m j = 1 m f x i , y j f 2 · i = 1 m j = 1 m g x i * , y j * g 2 X = u , v , u x , u y , v x , v y
x * = x + u + u x x + u y y y * = y + v + v x x + v y y
where X contains six deformation parameters, f (x, y) is the average grey value of the reference picture, g (x*, y*) is the average grey value of the target image, and f and g are the average grey values of image f (x, y) and image g (x*, y*), respectively. The displacement fields can be found by finding the largest value of image correlation. With numerical approaches, the strain can also be calculated by the displacement smoothing difference.

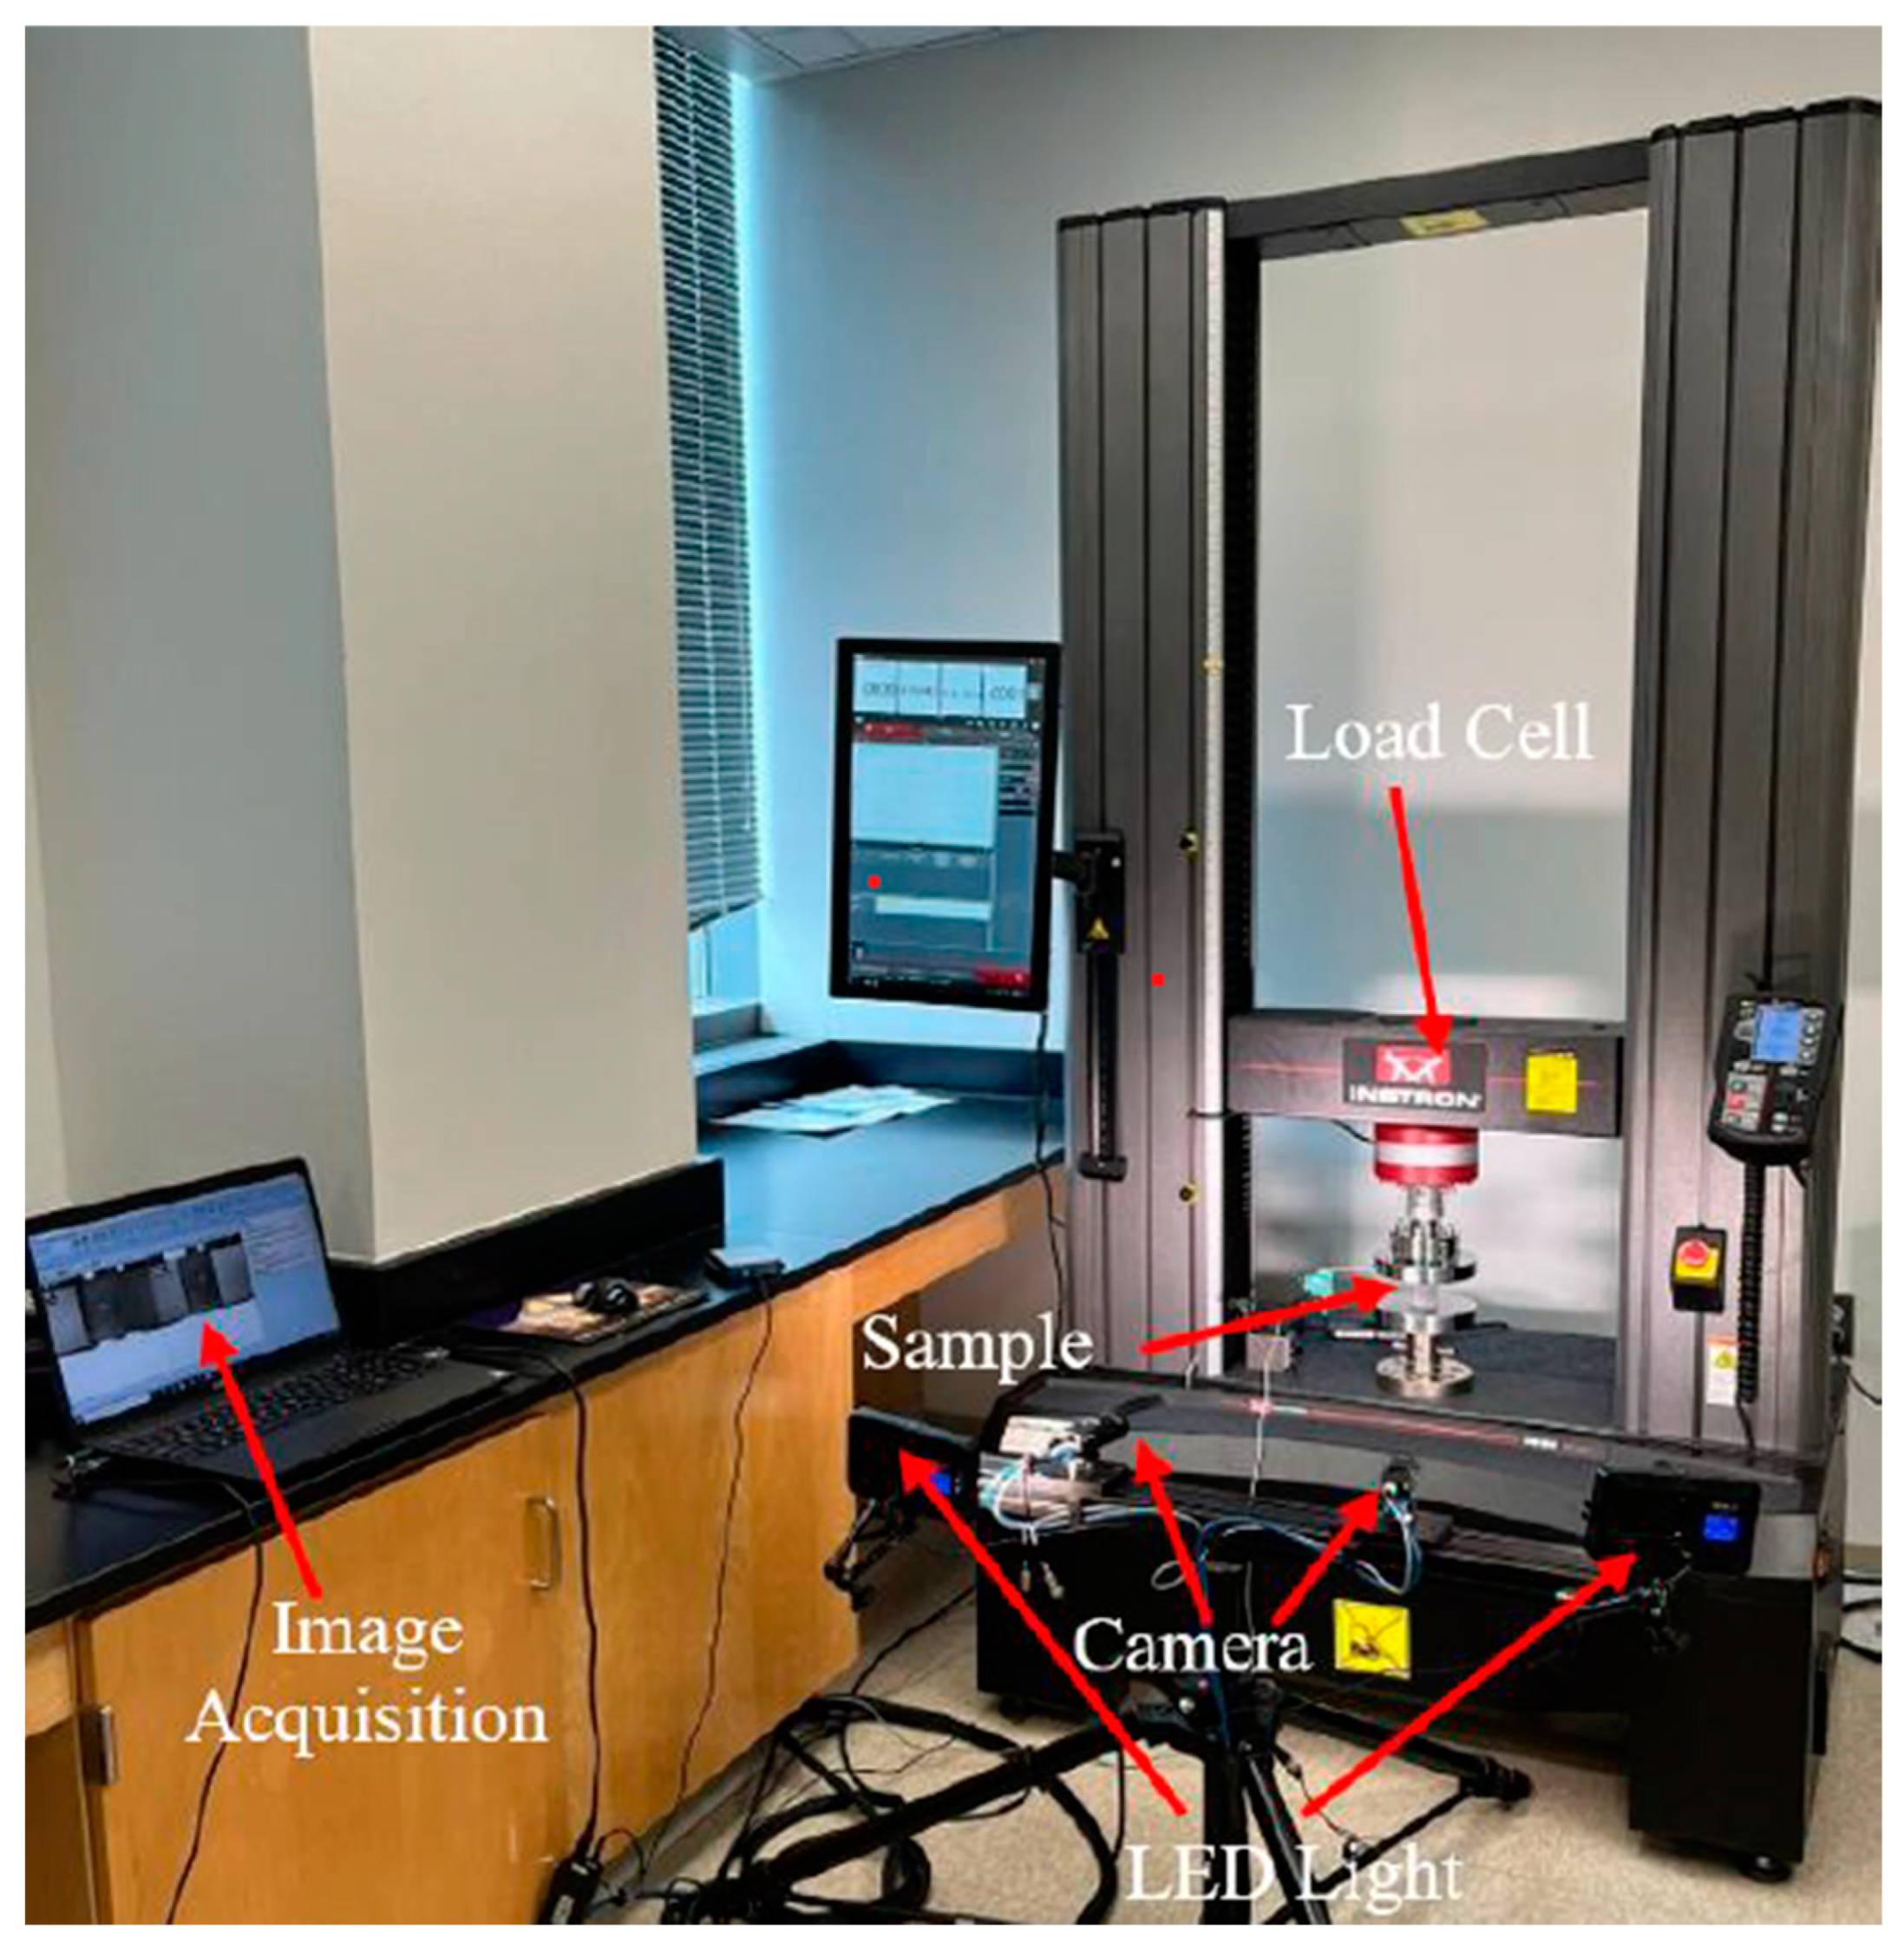
2.2. D-DIC Setup and Image Acquisition Method

The 3D-DIC image acquisition system includes the Trilion 3D-DIC acquisition system (2022 version, Trilion Quality Systems, King of Prussia, PA, USA) two CMOS industrial cameras (Trilion Quality Systems, King of Prussia, PA, USA), two blue-light sources with adjustable brightness, and a computer with data acquisition. Initially, the reference photos used for calibration were captured at a no-load condition. In order to maintain a consistent displacement rate throughout the test, the cameras were calibrated and then set to take photos every second. DIC collects 2 frames per second (FPS) during the diametrical and uniaxial compression of rock samples.
The Instron load frame was illuminated by two blue LED lights placed in front of it. To ensure the DIC camera could properly identify the specimen’s speckled pattern, the lights were maintained at the same level as the sample. According to ASTM D 3967 [31], the failure time of the specimen is within the acceptable range of 1–10 min. In the data processing stage, the subset and spacing used 19 pixels and 16 pixels, respectively. The actual length of each pixel is calculated to be 0.5 mm/pixel in the experiment. In our experiment, we obtained a displacement accuracy of 0.3 μm. To capture the images, two 3-MP monochrome digital cameras (FLIR) were employed to capture images, and ARAMIS commercial DIC software (GOM 3D 2022 version, Trilion Quality Systems, King of Prussia, PA, USA) was used to process and analyze the deformation of images.

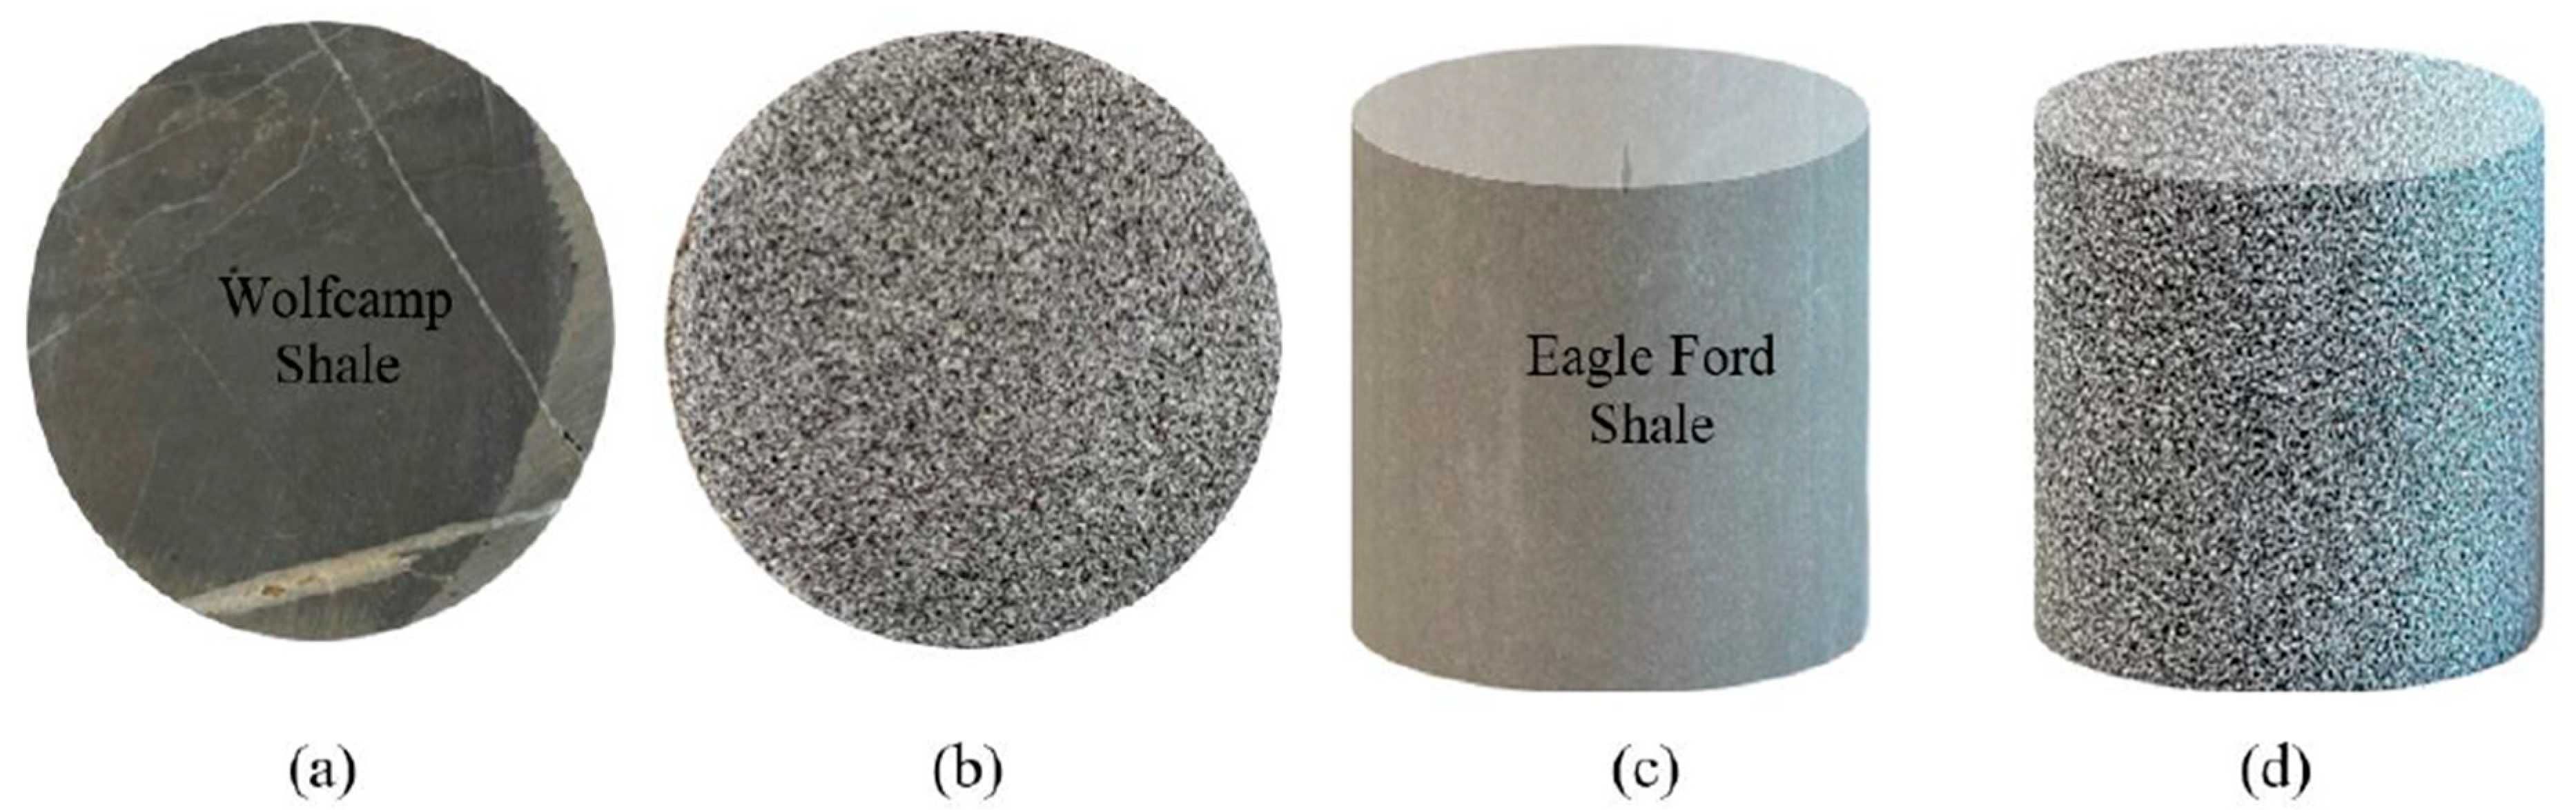
2.3. Sample Preparation

In this study, three types of shale samples were studied: Eagle Ford, Wolfcamp, and Mancos. Both uniaxial and Brazilian testing was conducted to evaluate the deformation and damage behavior of the rocks. The core specimens were prepared and tested employing ASTM D3967-08 for Brazilian Disc testing (BDT) and ASTM D 2938-95 for uniaxial compression testing (UCS) [31,32].
The specimen dimensions and properties are given the Table 1. All specimens were kept in a drying oven at 30 °C for 24 h before testing. A flat black-on-white dot pattern was created on the samples spraying on the front face (toward the camera face) for quality image processing (Figure 1).

2.4. Test Procedure

The uniaxial and diametrical compression test was performed by a precision Instron 100 kN electro-mechanical load frame. An ARAMIS 3D DIC system was employed for image capturing and processing. Before DIC can be used, a region of interest (ROI) must be chosen in the reference image. This ROI is then broken up into evenly spaced virtual grids. It is necessary to calculate displacements at each node of the virtual grids in order to obtain the full-field deformation. The tracking or matching procedure is obtained by exploring the extremity of a predefined correlation criterion. After the position of the target subset with the highest degree of similarity has been identified in the distorted picture, the displacement components of the centers of the reference and target subsets can be computed.
Samples were tested in a way similar to the testing conditions described by Nath et al. [7] for rock samples. To understand the DIC principles in detail, interested readers can go into the literature [33,34]. The Instron load frame was operated in displacement control mode with a displacement rate of 0.05 mm/min and an acquisition rate of 2 FPS. The image has a spatial resolution of 2448 × 2048 pixels, and the average length–pixel ratio of the imaging system is around 3.45 m/pixel. The detailed testing procedure is captured in Figure 2.

3. Results

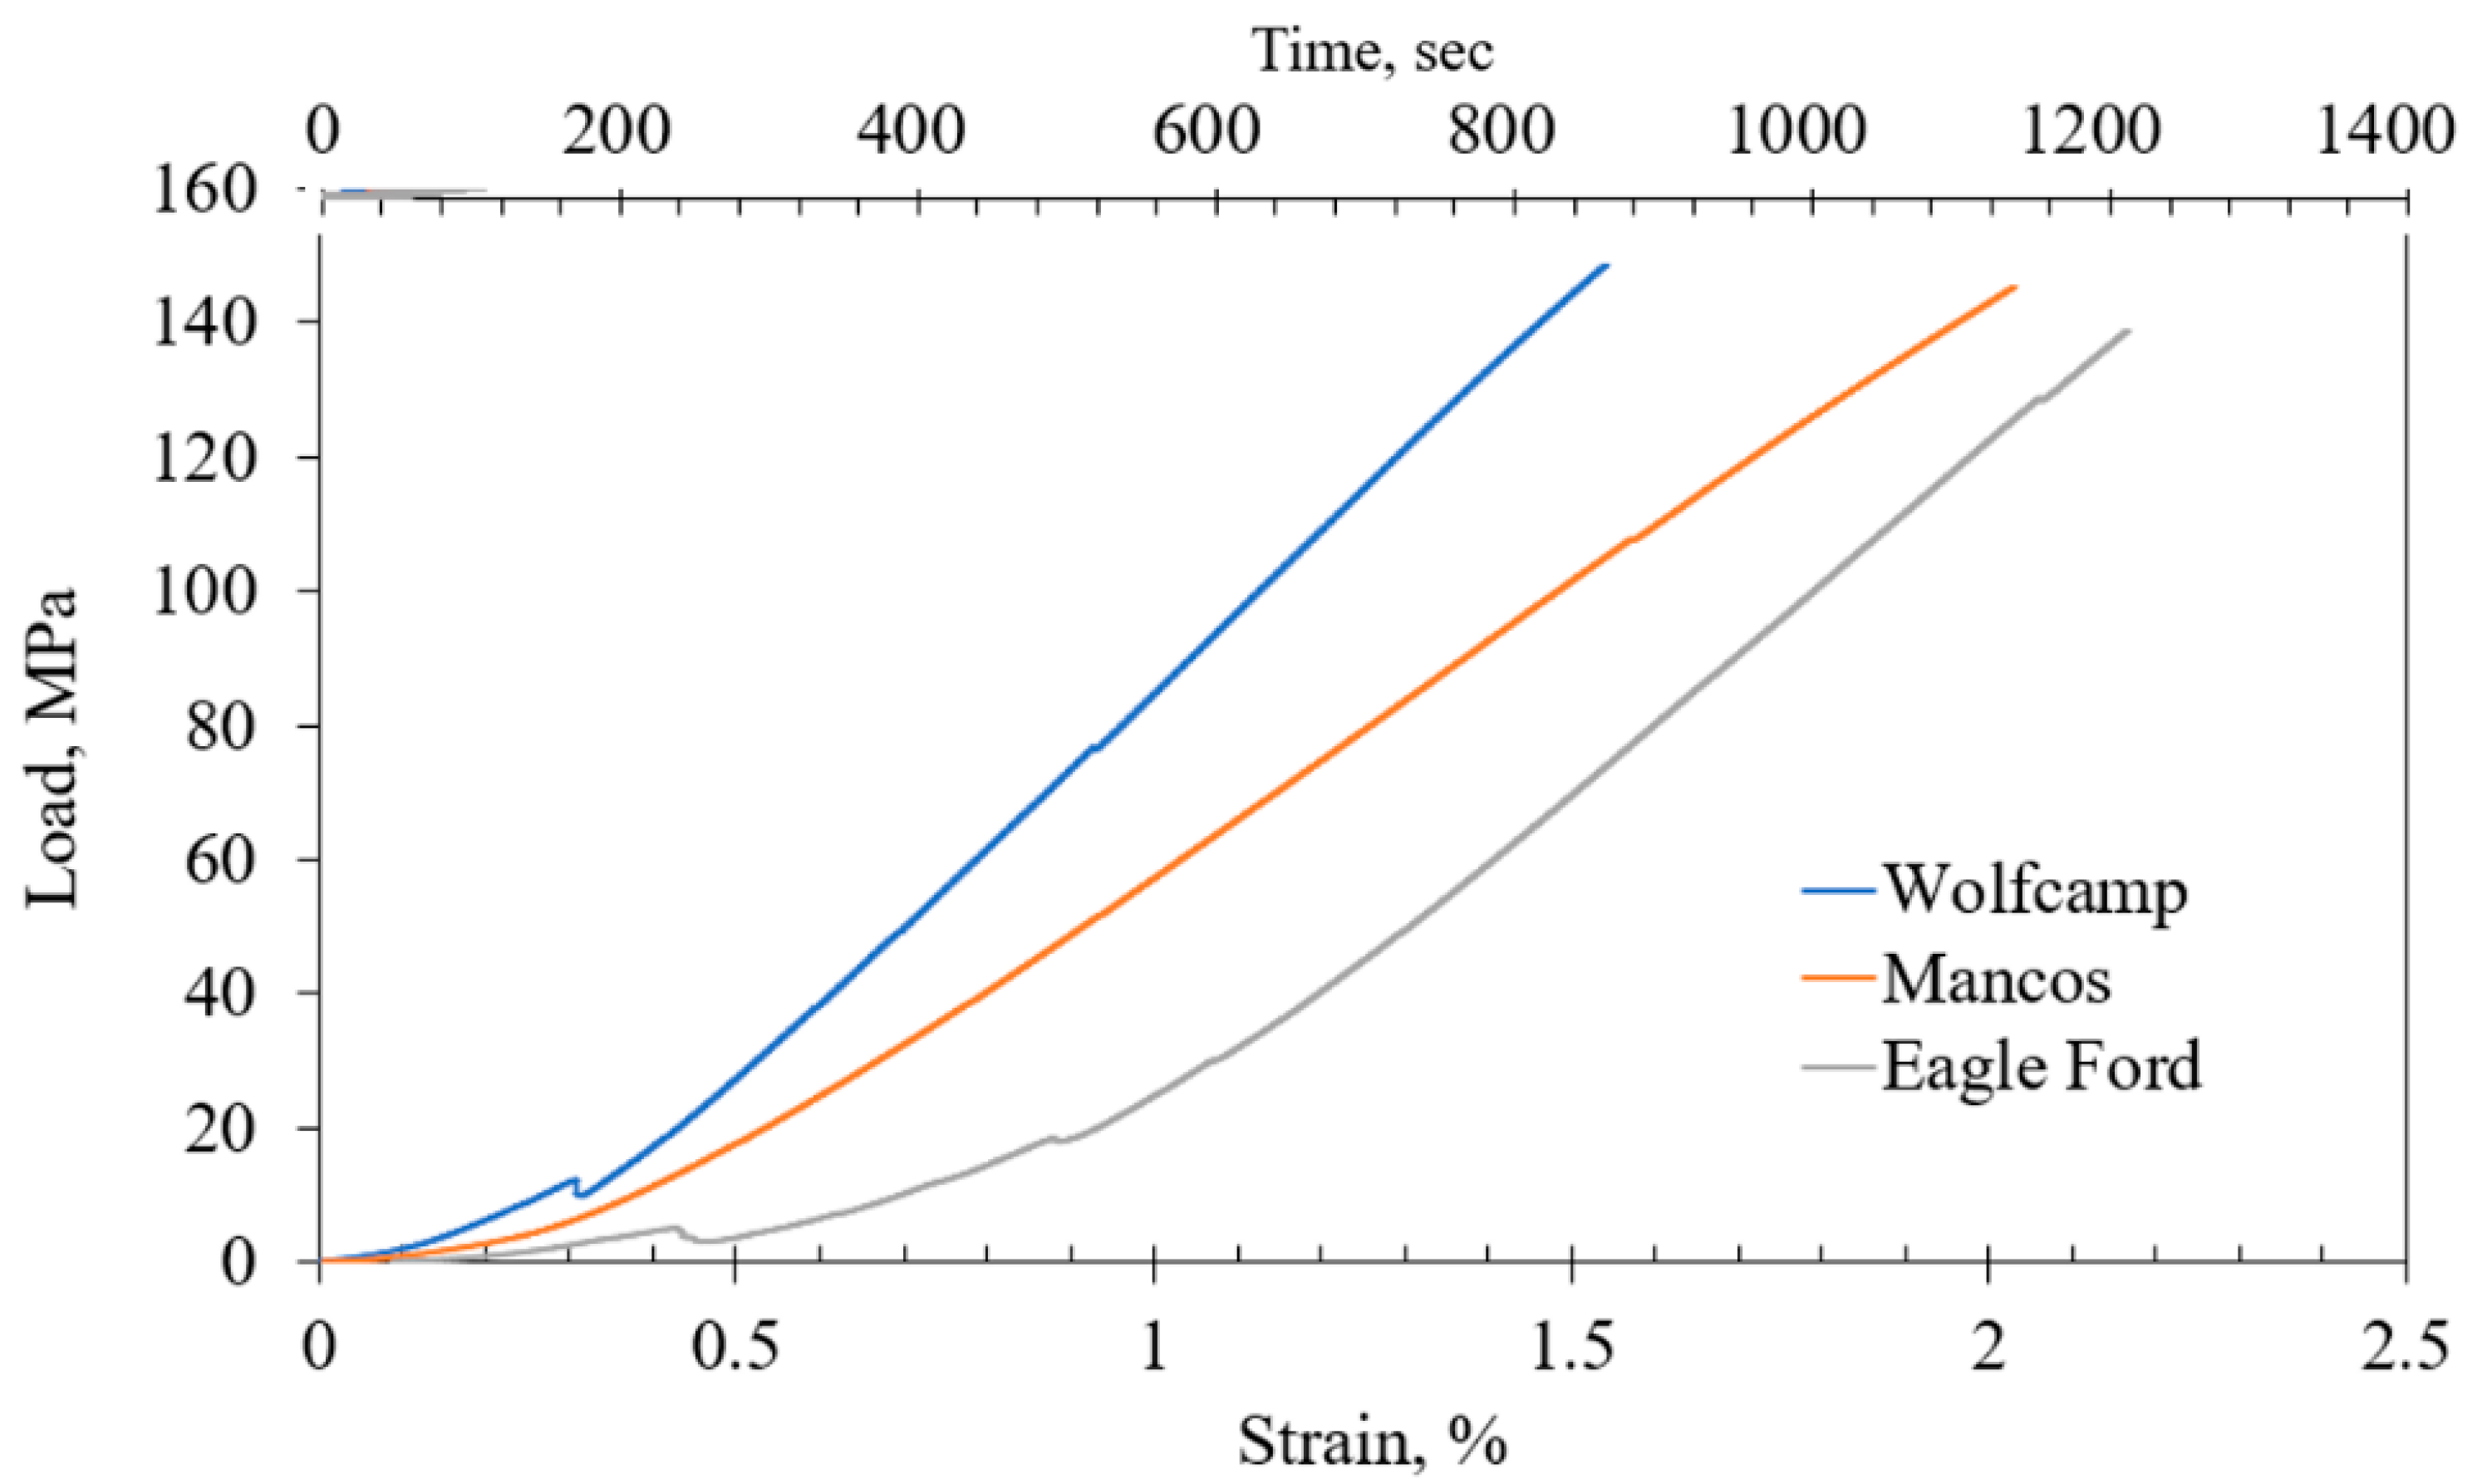
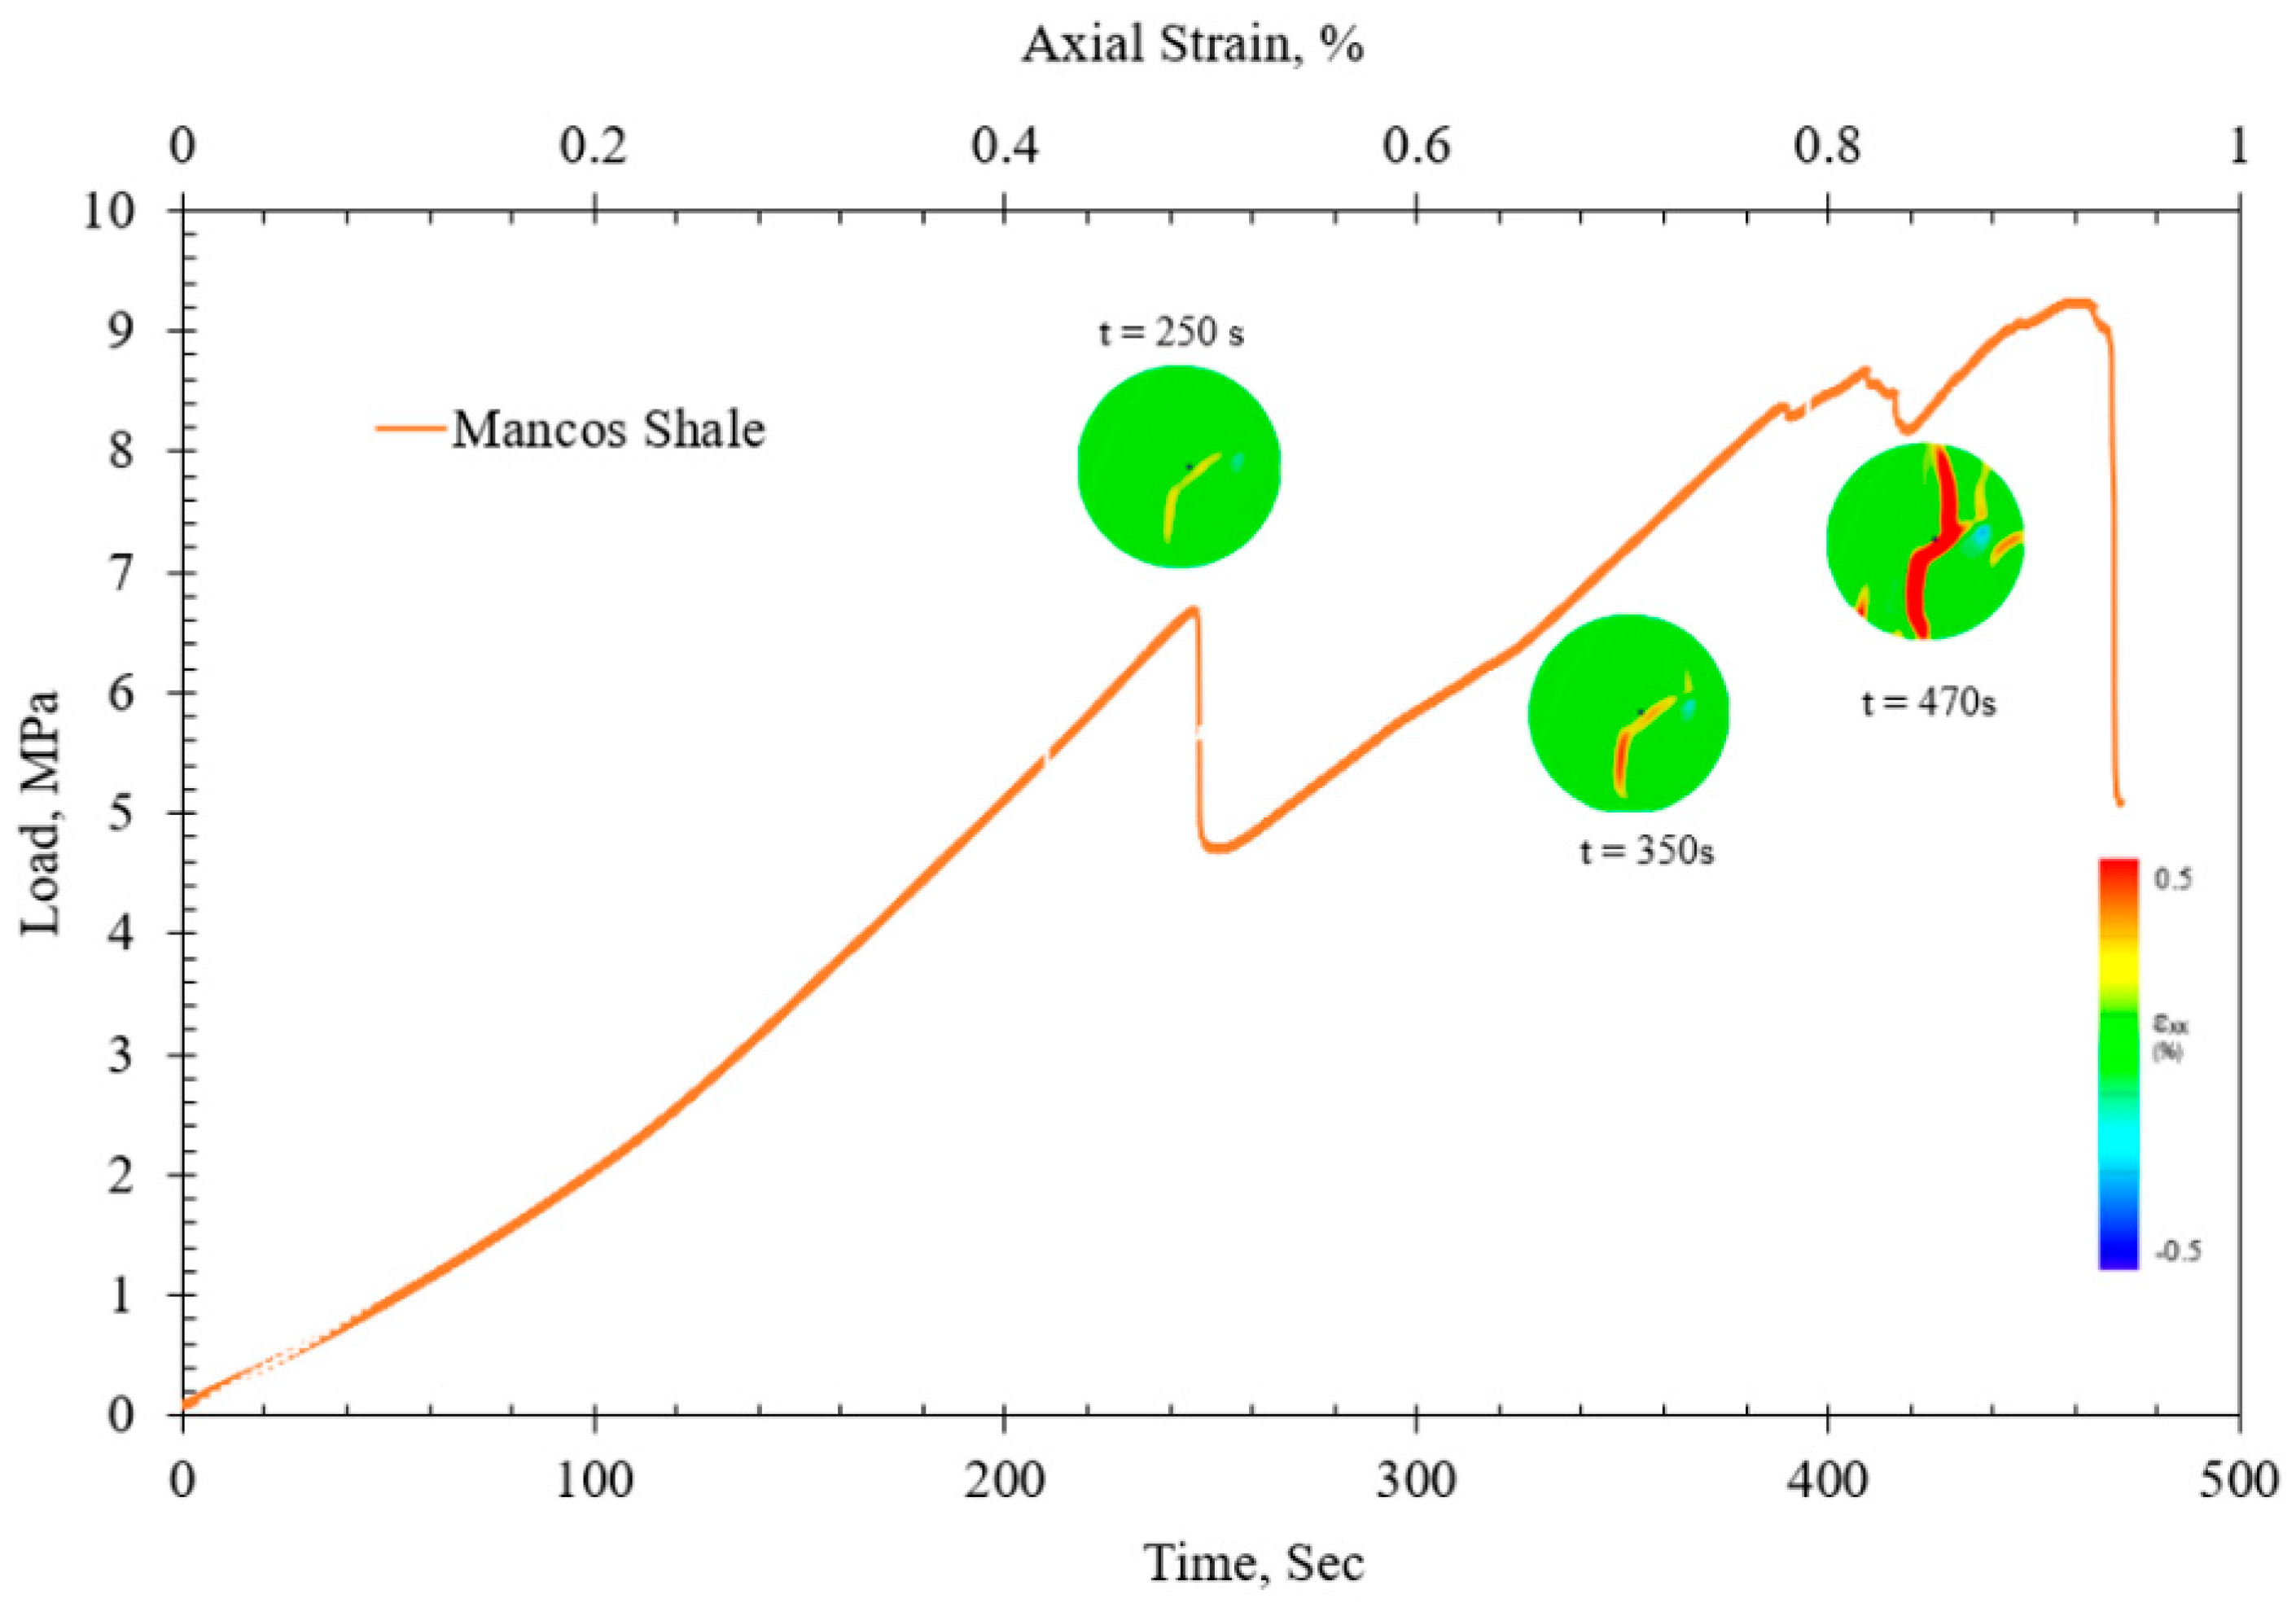
3.1. Load–Strain Relationship of the Tested Rock Samples

To analyze the evolution of deformation and damage characteristics in the tested shale specimens, a typical load–strain relationship is constructed using the data obtained from the Instron load frame based on both uniaxial and diametrical conditions. The load–strain curves for Eagle Ford, Wolfcamp, and Mancos shale specimens for UCS and BDT are shown in Figure 3 and Figure 4 respectively. Figure 3 shows that with equal load, the Eagle Ford shale specimen deforms more compared to the Wolfcamp and Mancos shale; this is likely due to the ductile nature of the shale.
The Instron load frame applied for this study has 100 kN capacity; that is why the UCS test was conducted with that closer capacity and the complete fracture did not occur for all samples when the test stopped. Within that limit, the curve shows several small peaks for the Wolfcamp and Mancos shale specimens; this is an indication of internal damage to the sample which is not visible in the final fracture while loading.
A similar observation was reported for the indirect tensile testing of the three different shale samples during diametrical compression. Figure 4 exhibits the load–strain nature of the shale specimens during diametrical compression (Brazilian testing). The curve shows that fracture and failure happened in the Eagle Ford shale with pure tension, compared to the other two samples.
The internal damages due to loading and subsequent deformation over time can be best illustrated by the DIC strain map. Figure 5 shows the DIC visualization on the sample face while the compressive load is applied. The strain map in the load–strain diagram shows the evolution and deformation and damage in the sample in different distinct time steps.
The Wolfcamp and Mancos shale samples exhibit several small peaks before the final fracture. As an example, Figure 6 shows what happened to the Mancos shale sample during diametrical compression. Strain accumulation and evolution in different time steps clearly show the nature of the failure on the shale sample.
Figure 7 and Figure 8 show the stages involved in deformation and damage evolution during uniaxial and diametrical compression, respectively, where distinguishable changes occurred during loading. Based on the DIC map visualization, the whole damage process of the shale sample can be split into four distinct stages: the initial stage, the linear elastic region, the mixed elastic–plastic region, and the plastic stage where unstable fracture growth happened.
In the initial stage, the damage internally starts to progress but is not visible. The second phase involves a linear elastic region, where the slope of the load–strain curve steadily increases and internal damage continues to progress. After that, cracks start and appear and finally the sample is effectively damaged with the load increase tending toward an unstable fracture.

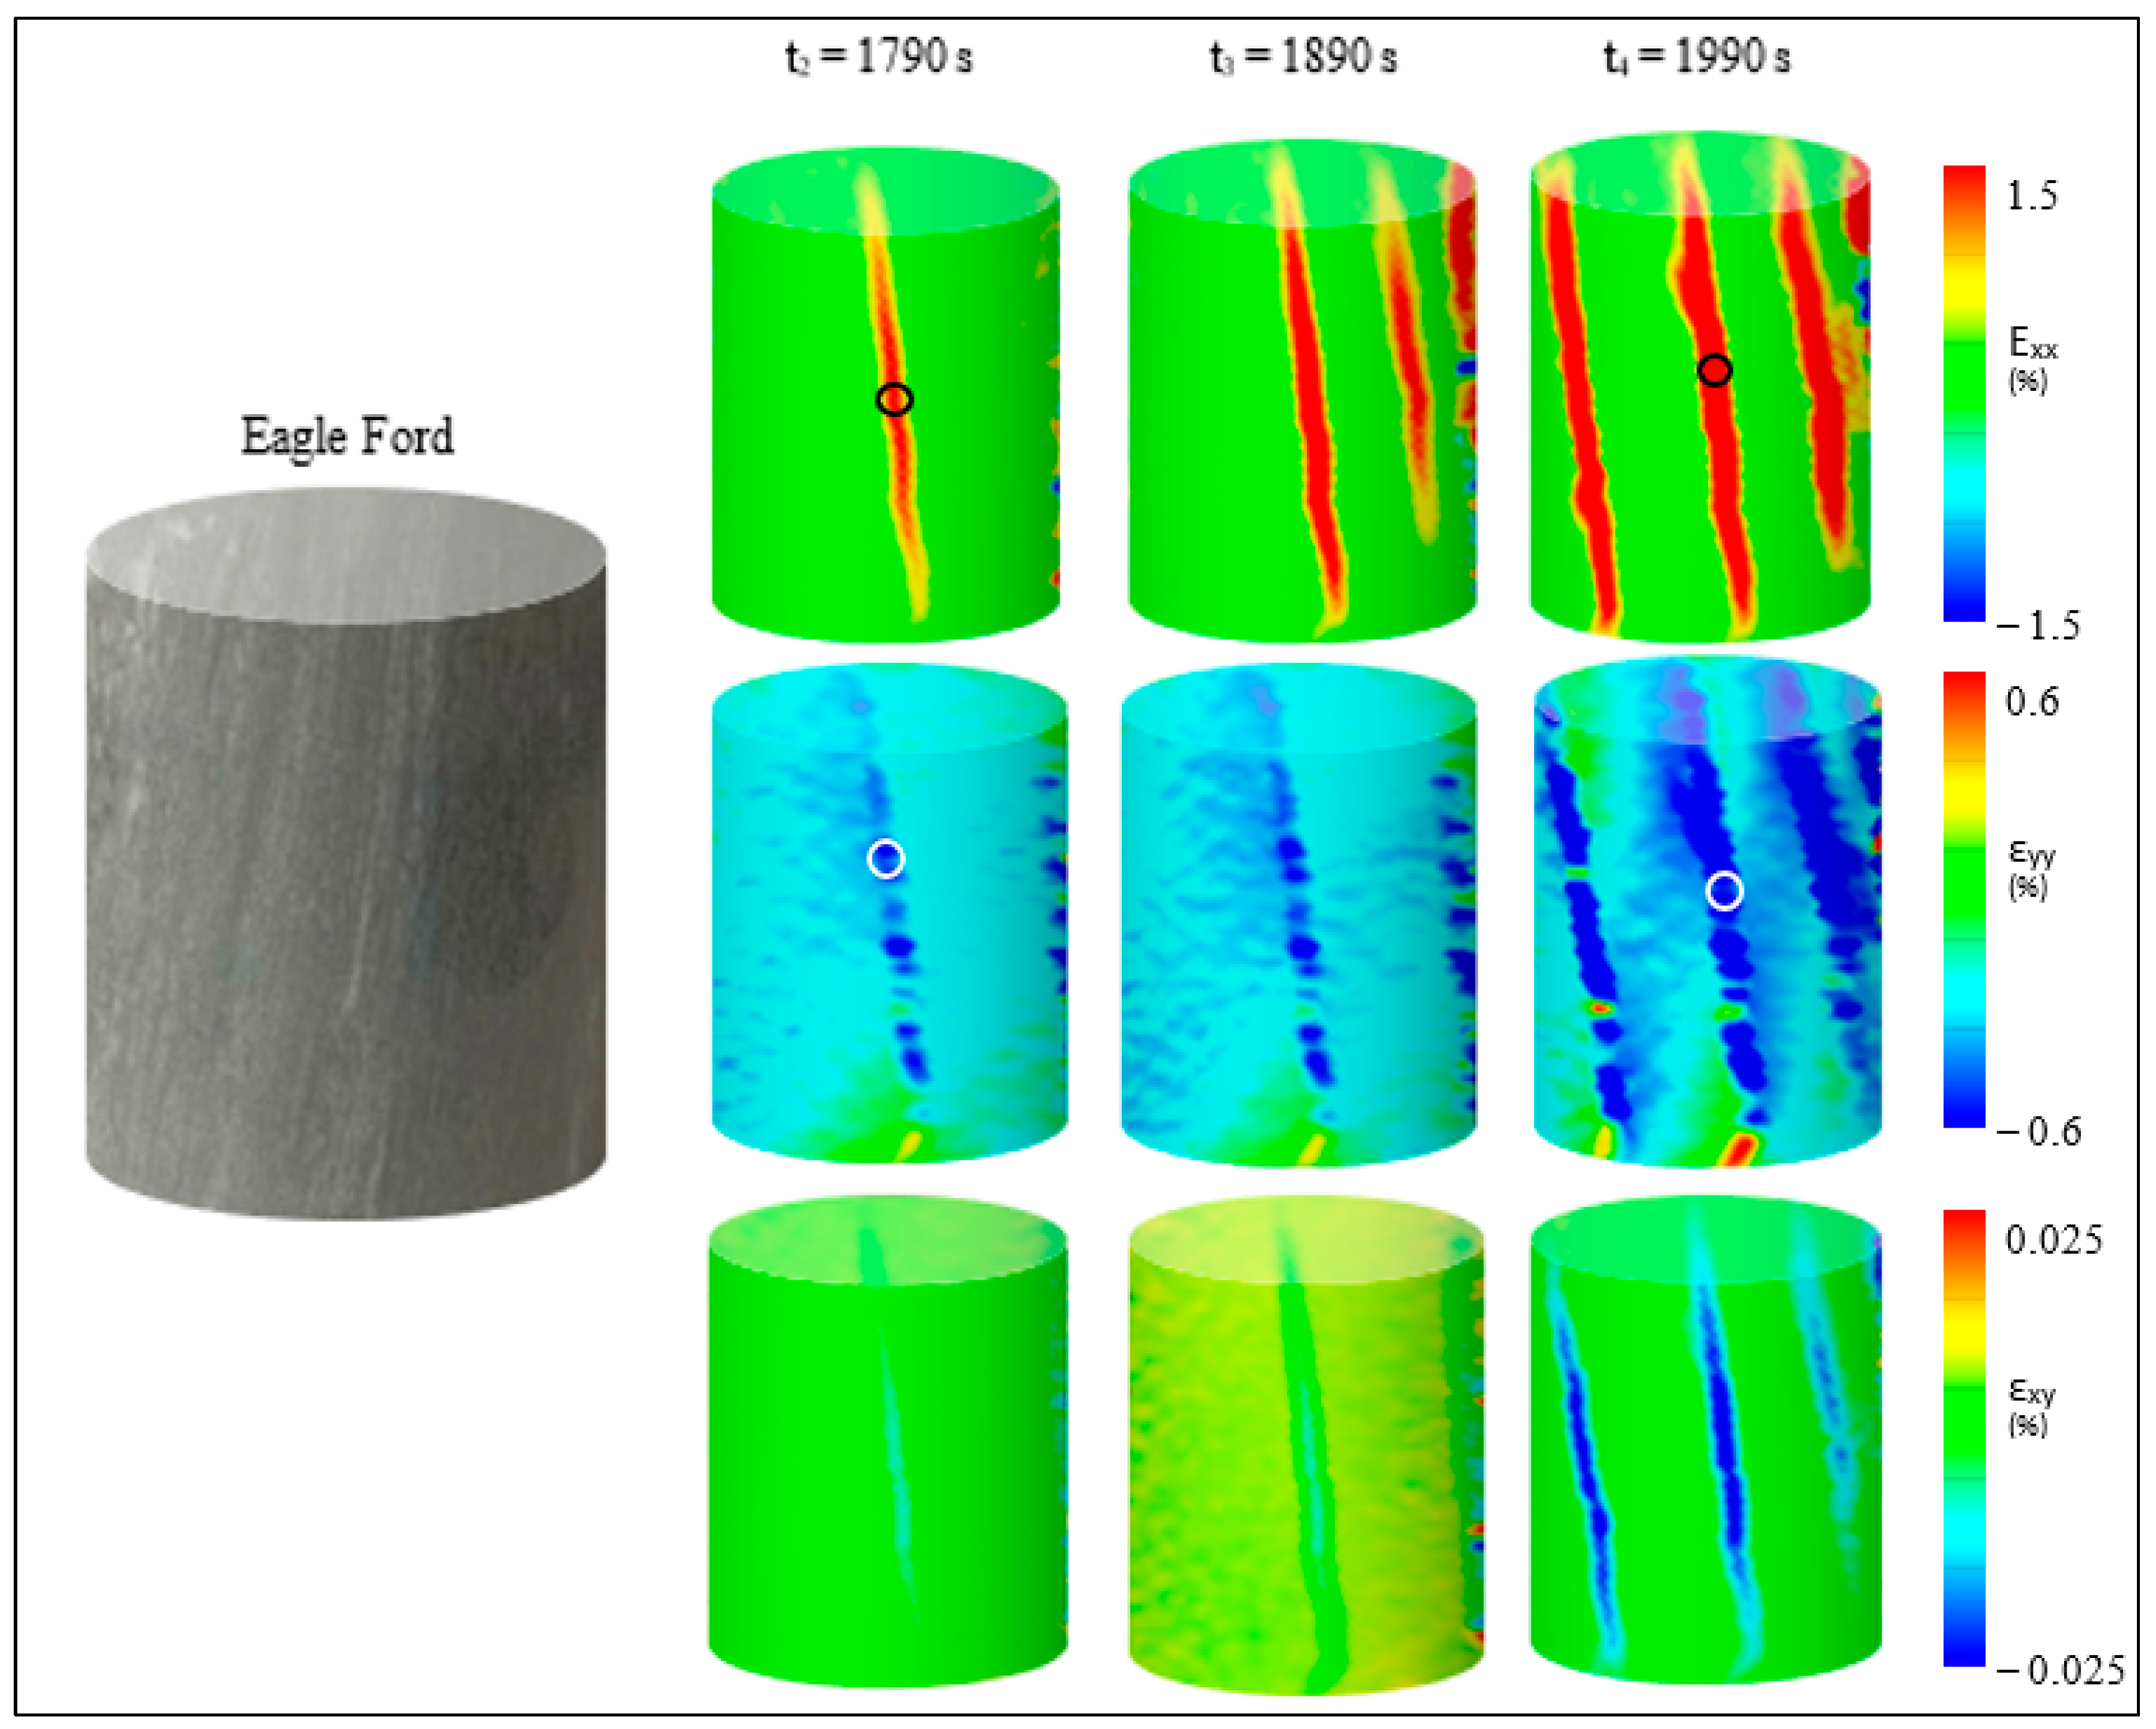
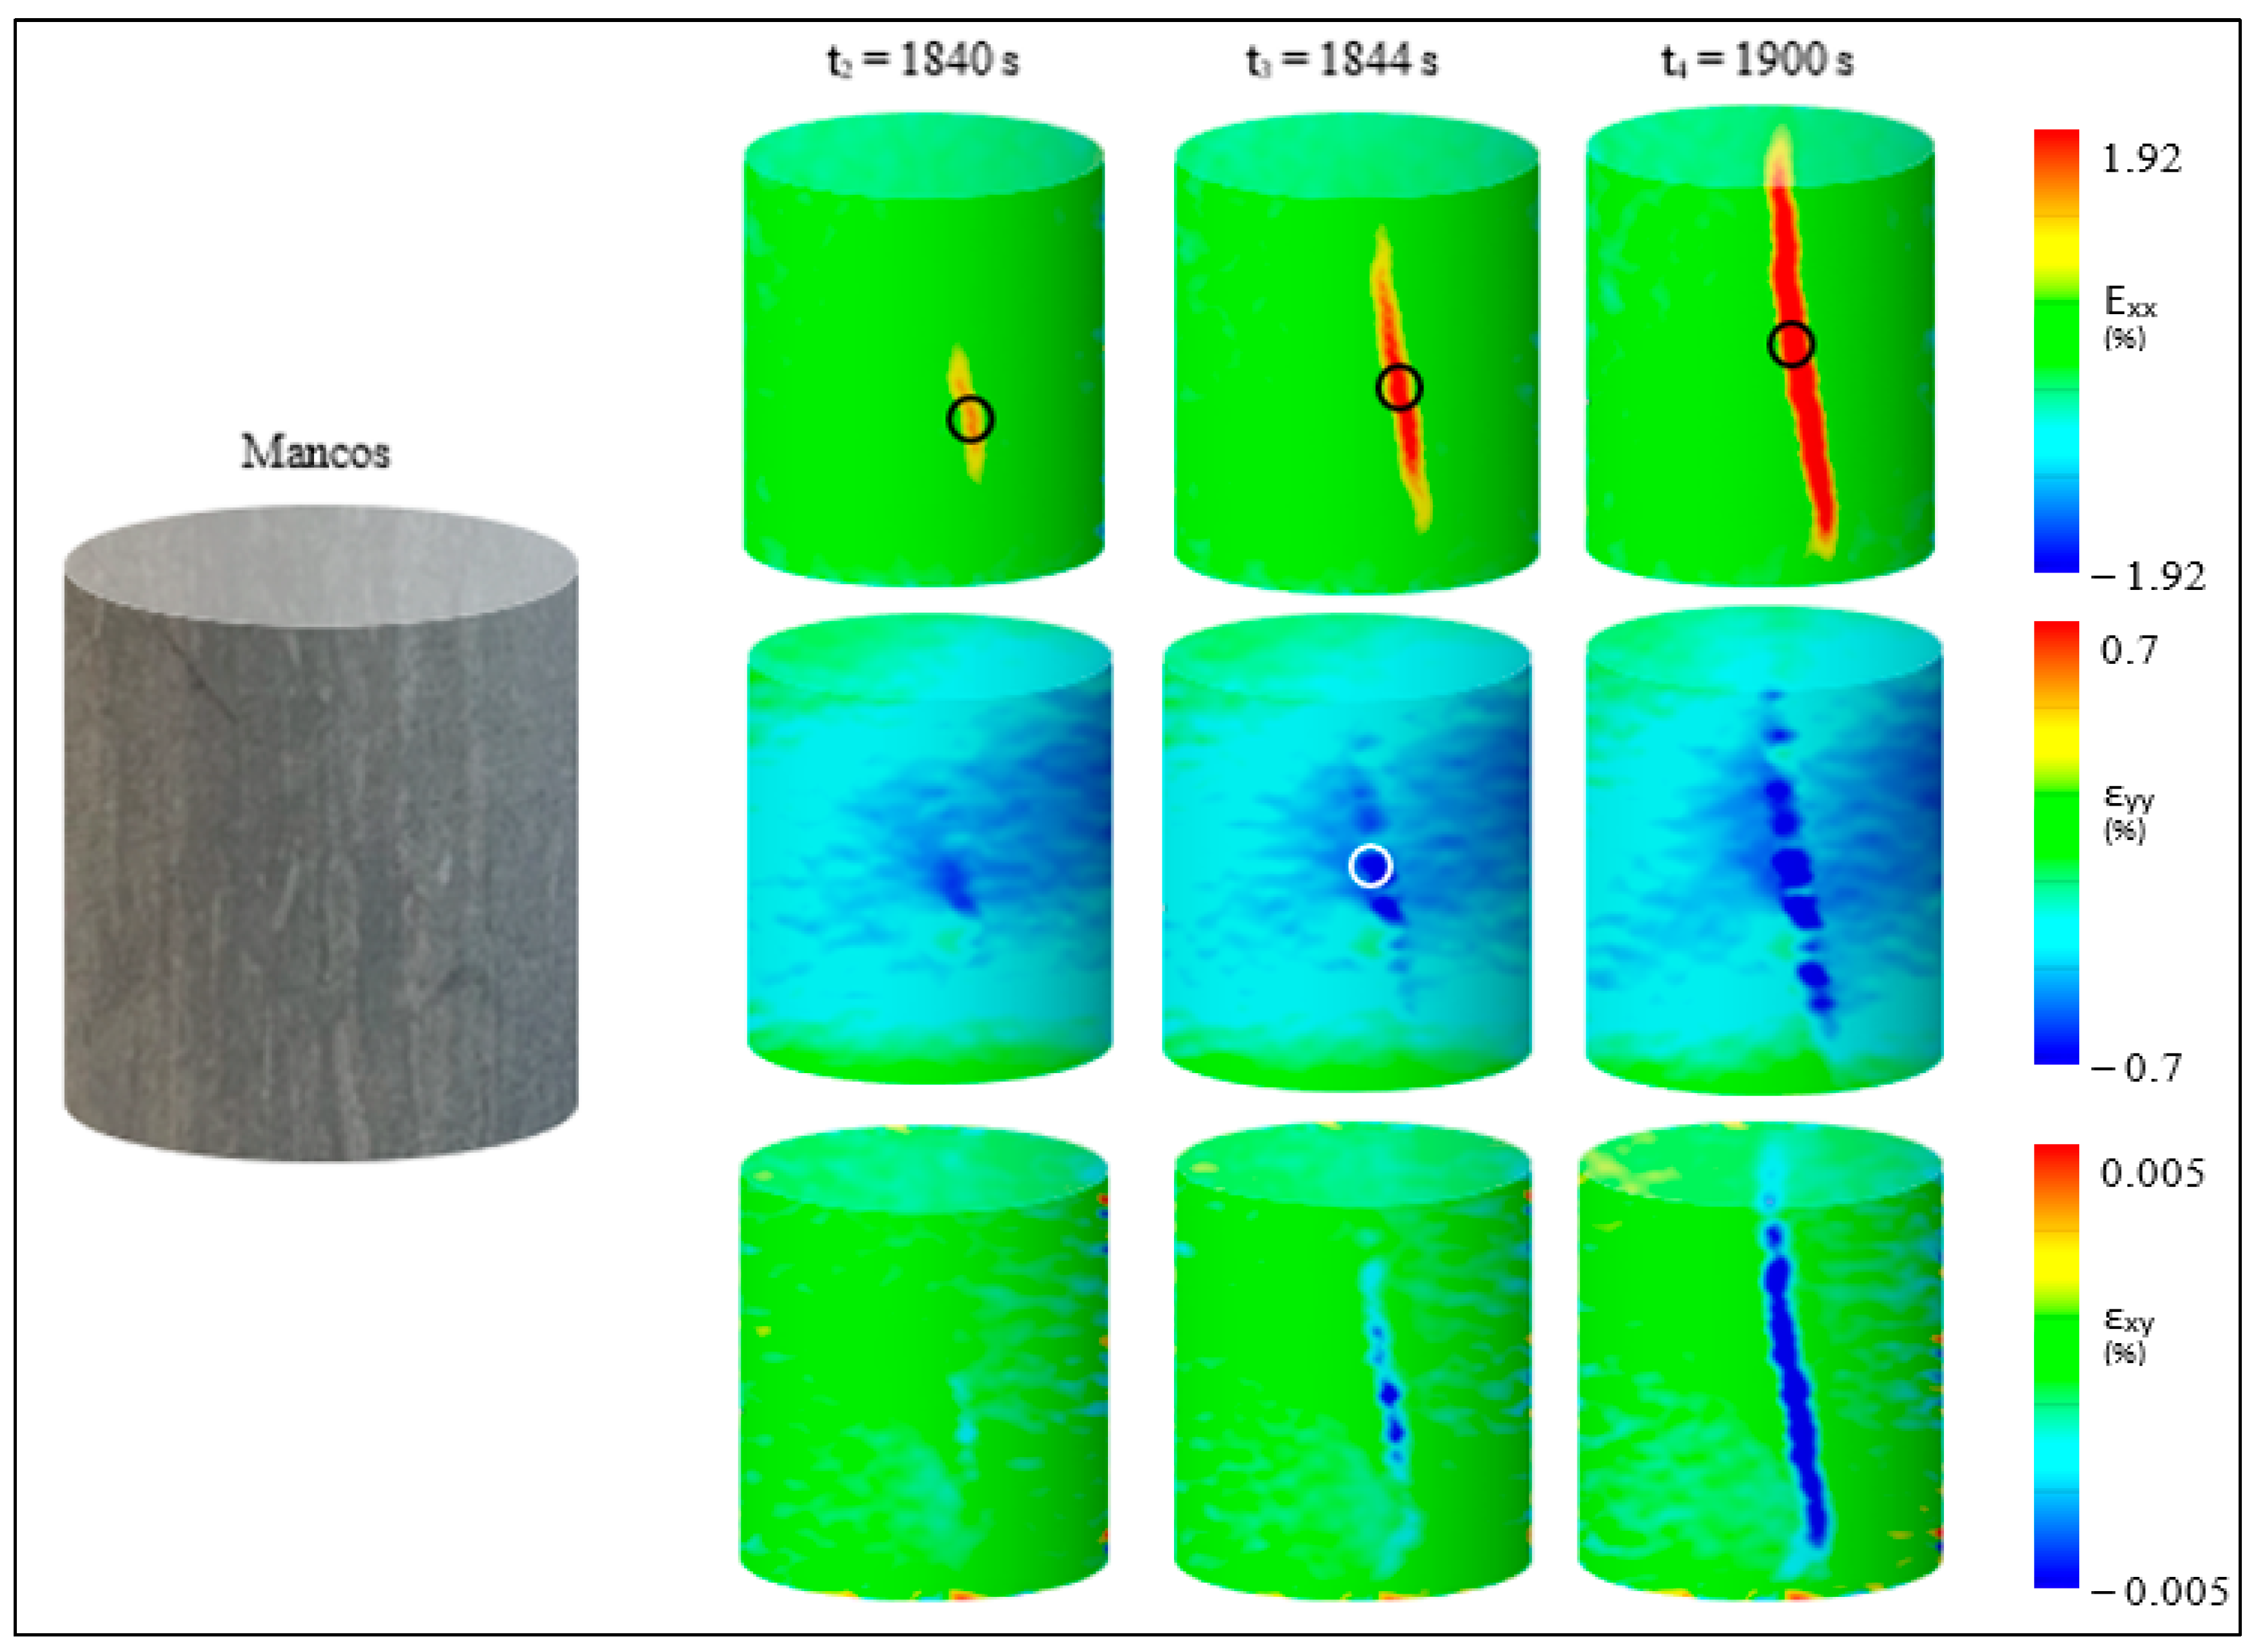
3.2. Deformation Evolution of the Shale Specimens during Uniaxial Compression

To illustrate the damage features during uniaxial compression, a deformation evolution map is created using 3D-DIC. Figure 9, Figure 10 and Figure 11 demonstrate the deformation evolution for Wolfcamp, Eagle Ford, and Mancos shale, respectively. The deformation and strain maps include the horizontal strain (εxx), vertical strain (εyy), and shear strain (εxy) for both uniaxial and diametrical compression. The non-uniform and distinct changes during horizontal, vertical, and shear strain maps are shown using a black circle, white circle, and white rectangle, respectively.
Analyses of these three different strain evolution maps in different time steps (t2, t3, and t4) can show the damage and failure nature in compression, tension, or shear. Finally, fracture initiation and propagation were observed until the failure of the samples. Figure 9 shows that the tension–compression mixed mode is dominant for damage that happened in the Wolfcamp shale.
Figure 9 shows the results of a UCS test conducted on a sample of Wolfcamp shale, which reveals the presence of a distinct calcite vein. Damage can be tracked in the load–strain diagram at various stages as it develops in both the horizontal and vertical axes.
Initial strain development takes place on the existing vertical lamination in the sample, where the calcite vein is located. Because the greatest horizontal strain (εxx) occurs in the lamination’s center (black circle), cracks propagate down the vein of calcite. Vertical strain (εyy) is concentrated at the bottom of the sample through the calcite vein (white circle) and shear (εxy) strain (white rectangle) in the bottom loading end as a result of compressive load accumulation at the lamination. It was observed that the sample developed cracks in response to an increase in the load that was being applied to it. After the experiment, the crack matched the visible fracture’s path.
Figure 10 shows the evolution of the strain field and crack growth on the Eagle Ford shale sample during UCS testing. Initial cracking in the sample occurred midway between the horizontal and vertical axes (black and white circles, respectively), and the fracture progressed upwards as a result of strain accumulation. Increased strain causes not only vertical strain damage, but also strain and fractures in the sample. The lamination that is already present in the sample is reflected in the strain accumulation that can be seen in the vertical direction. Additionally, the strain field that was observed in Figure 10 demonstrates that tension is more prominent than compression in Eagle Ford shale.
Figure 11 demonstrates the evolution of deformation and damage in Mancos shale in a similar fashion. The sample’s damage evolution shows strain accumulation along the vertical axis, which begins in the sample’s center (black and white circles). Then, as the load was increased, the fracture propagated outward along the centerline, indicating strain accumulation at the sample’s center. Mancos shale’s strain map differs from that of Eagle Ford shale in that the parallel propagation along the vertical axis is absent from the former. Furthermore, as seen in Figure 11, tension is more prominent than compression throughout the observed strain field.
When comparing Figure 10 and Figure 11, we can see that tension plays a much larger role in the damage observed in the Mancos and Eagle Ford shale formations than shear did. Damage occurred at points where tension-induced strain accumulation was greatest, as illustrated by strain maps with discrete different time steps (t2 to t4). Eagle Ford shale displays cracks that extend from the sample’s edge.
Both the load–strain curve and DIC strain (εxx, εyy, and εxy) map provided fracture behaviors until sample fracture. All of the above observations suggest that DIC is an effective tool for analyzing fracture initiation, development, and propagation.

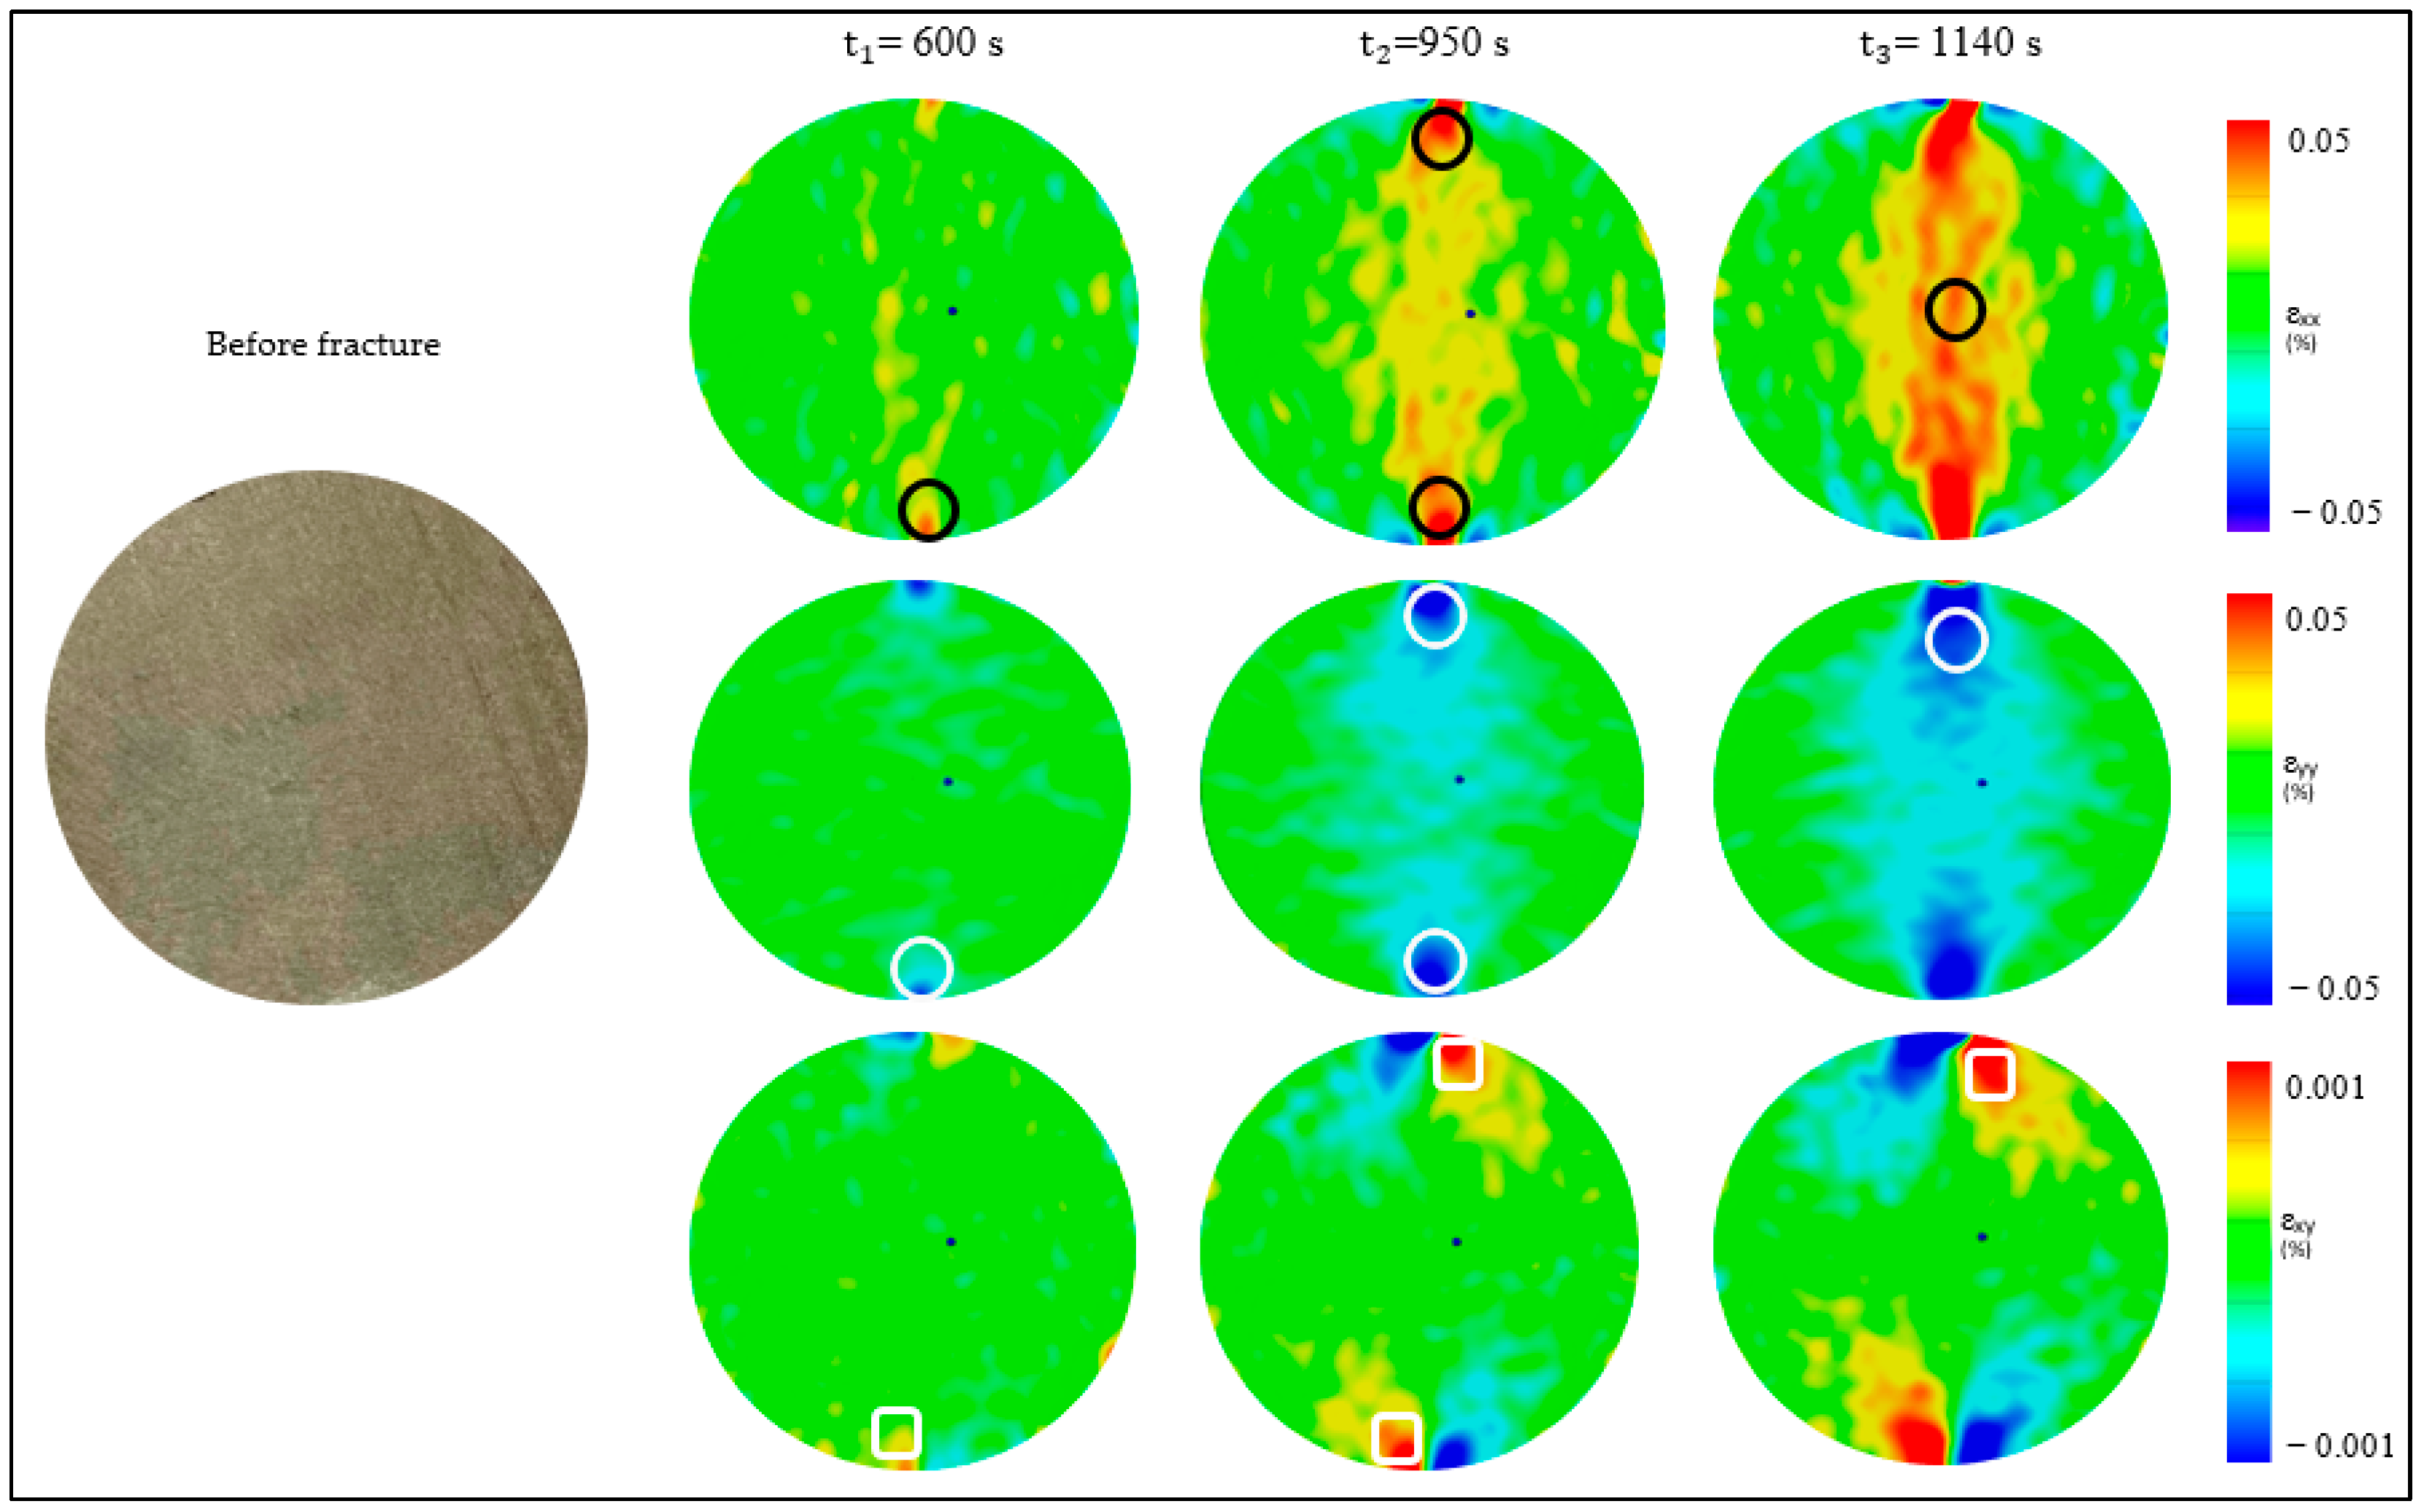
3.3. Deformation Evolution of the Shale Specimens during Diametrical Compression

A deformation development map is generated by 3D-DIC to show damage characteristics under diametrical compression. Wolfcamp shale, as seen in Figure 12, accumulated strain along the centerline as the load increased radially, but it cracked at both ends as the load was raised (black and white circles). With increasing apparent strain, the fracture shifted outward from the geometric center of the specimen (the white rectangle) until finally breaking. All three strain maps (εxx, εyy, and εxy) reveal that tension is the dominant failure mode for Wolfcamp shale, even though the failure mode is mixed.
Figure 12 shows the DIC strain development maps that conclude that the maximal strain accumulation in the Mancos shale was the consequence of both tension and compression, leading to a deviated and convoluted fracture from the center and a mixed-mode failure of the sample.
Figure 13 and Figure 14 illustrate the diametrical compression that occurred inside the Mancos and Eagle Ford shale samples, respectively. The lamination is the weakest part of the structure, therefore any strain that builds up through it will eventually cause the structure to fracture. When conducting diametrical testing, an isotropic and homogeneous rock should most likely exhibit central failure due to pure indirect tension. However, this does not appear to be the case in the observed strain maps. The non-uniform appearance of the displacement contours shown in Figure 12, Figure 13 and Figure 14 may be caused by the heterogeneity of the shale samples.
As the diametrical load increased in Eagle Ford shale, it reached the area of the lamination or weakest zone (black circle) with the greatest horizontal strain (εxx). The accumulation of compressive load caused the vertical strain (εyy) to be localized at both ends of the sample (white circle), and the shear strain (εxy) to be concentrated in the bottom loading end (white rectangle). Figure 14 depicts the pure tensile failure of the Eagle Ford shale when subjected to diametrical compression. A central failure pattern is seen in the sample face because of the strain accumulation.

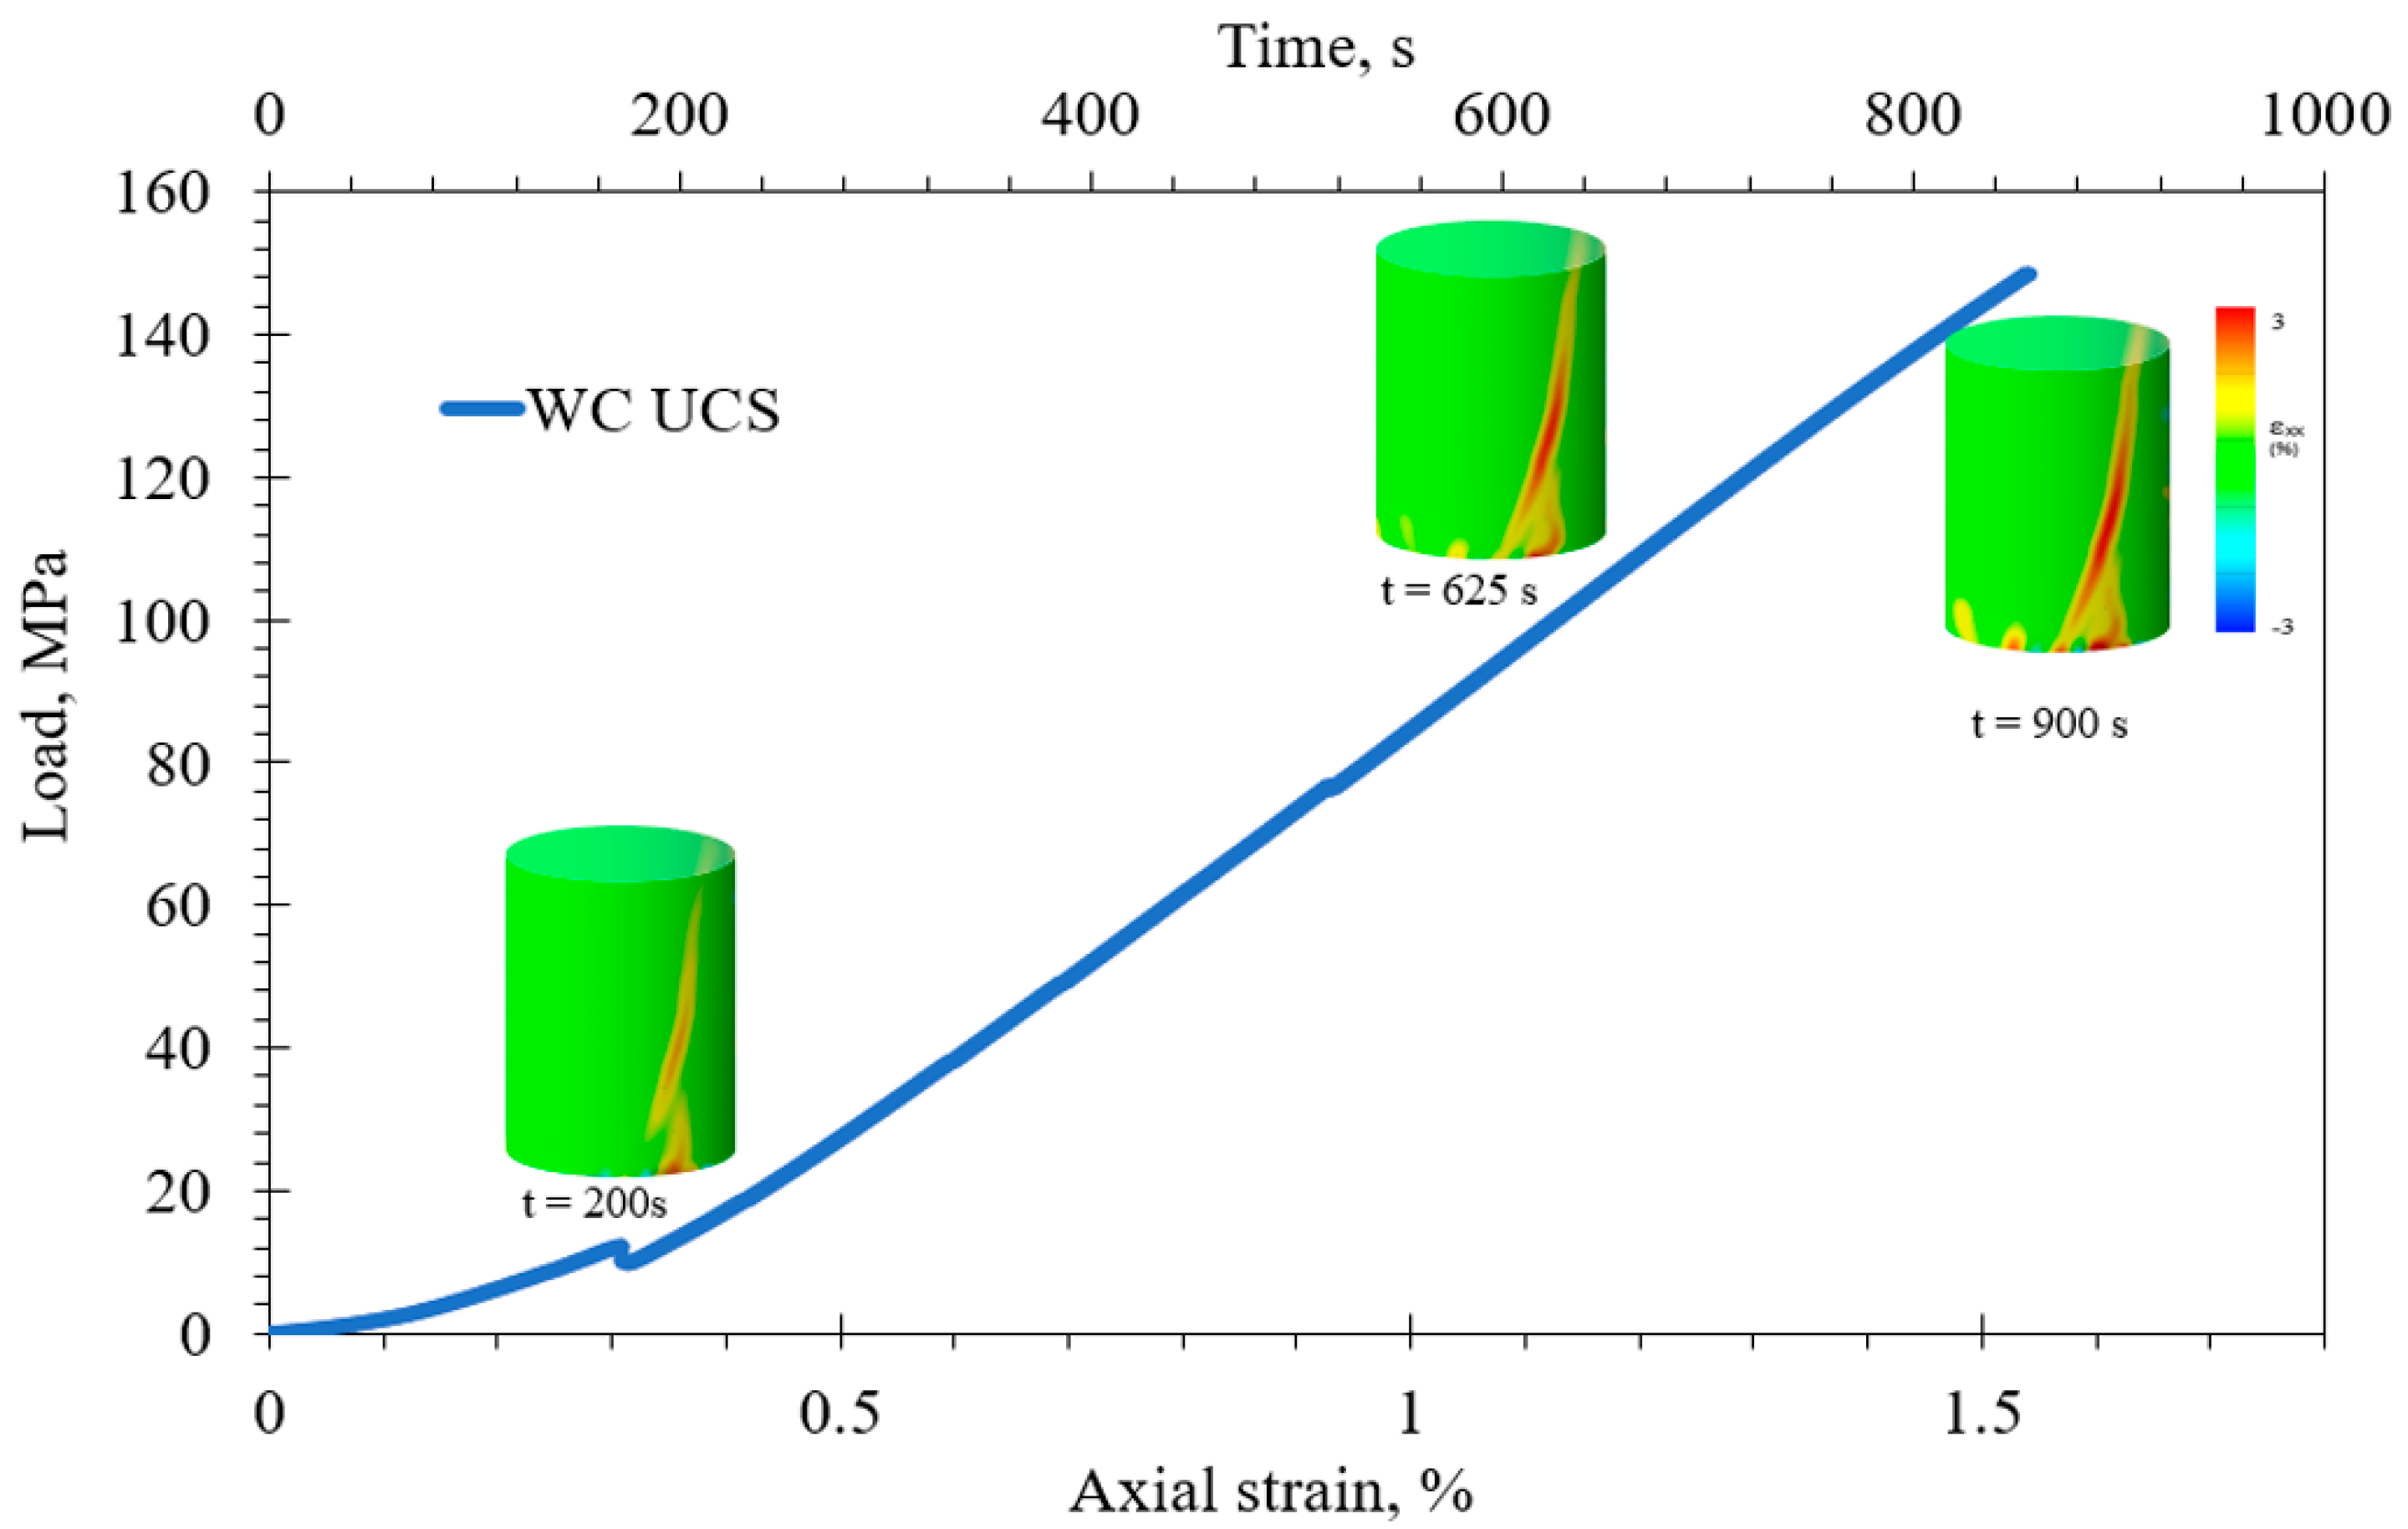
3.4. Analysis of Damage Evolution in Shale Samples Using a 3D-DIC Strain Map

Rock mechanics utilizes the damage mechanism of any substance to determine the damage variable. This is an illustration of the fact that the load-bearing area of the materials decreases when they are loaded. When the damaged section is fractured or develops a defect, the standard deviation of the primary strain can be used to determine the severity of the damage. The DIC map does a fantastic job of tracing the development of substantial strain up until the sample’s collapse. Therefore, by analyzing the damage evolution process of the shale samples, strain data generated from DIC with the standard deviation of the main strain value may effectively represent the damage development of the specimen. Figure 15 shows a sample DIC strain map with a measuring line and different points A-D located along the maximum strain accumulation path, from which a formula for calculating the damage variable can be derived [25]:
D = S S m a x
where S is the standard deviation of the major strain and Smax is the maximum strain when the damaged area reaches damage. These data can be obtained from the DIC strain map as shown in Figure 15. The damage variable of the sample under uniaxial and diametrical compression is obtained as shown in Table 2 and Table 3.
The damage variable is also illustrated in Figure 16. The damage process of the shale samples can be split into four distinct damage phases: initial closure stage, linear stage, elastic–plastic damage stage, and plastic damage stage, corresponding to the load–strain curves. At point A, initial damage reaches the closure stage where micropores in the sample are progressively compacted. Point B is the determinative and key point, from where internal to external changes occur during damage evolution; after this point, the sample damage reaches the visible scale. It is evident from Figure 16 that the damage variables obtained for all shale samples mostly follow a similar trend, though variables obtained during BDT are relatively greater than in UCS testing. A similar damage variable trend was observed in a UCS analysis on laboratory-made rock-like samples conducted by Chai et al. [25].

4. Discussion

A better understanding of damage evolution and the fracture process is crucial for hydraulic fracturing, drilling, and completion activities of any hydrocarbon reservoirs. This work was conducted in laboratory conditions, which cannot mimic true subsurface conditions. Damage and deformation progression can be obtained quantitatively compared to other measurements with the help of DIC, which is a very efficient tool.
Using the DIC method with full-field strain measurement, we studied how the presence of spontaneous cracks affected deformation behavior in both uniaxial and diametrical compression testing conditions. The DIC findings provide insight on the limitations of traditional approaches to determining deformation behavior. The behavior of induced fractures depends on natural fractures. The difficulty of fracturing in heterogeneous media is shown using the DIC technique on a variety of shale samples. The role of natural fractures in fracture initiation and propagation is governed by their direction, location, bonding strength, and in situ forces. The DIC map for BDT shows that cracks do not always originate from the center of the sample, as one might expect from a perfectly homogeneous material. While the Eagle Ford shale exhibits pure central failure due to stress, the Mancos and Wolfcamp shale samples contain a calcite vein, unique lamination, and spontaneous fracture that cause deviated fracture from the center. Similar observations were obtained in the Mancos shale in prior investigations [11,23].
By studying the damage evolution process based on DIC-obtained strain data, the damage variable defined with the standard deviation of primary strain may effectively characterize the damage process of the specimen. As a specimen deforms from linear to nonlinear elasticity, the damage progression pivots from internal to external. The specimen’s damage spreads from the inside to the outside.
Sample preparation is essential for successful DIC picture acquisition, and this includes things such as polishing the specimen’s surface, making an acceptable spackle pattern, and calibrating the camera. Obtaining reliable information from the DIC requires due diligence. Future studies are advised to ensure that precise speckled paint patterns are used so that clearer, more consistent video of fracture progression over time may be obtained, since the DIC findings are entirely reliant on picture quality.

5. Conclusions

DIC is a powerful method for examining sample strain. This work uses a 3D-DIC method to quantify the damage and deformation of Wolfcamp, Mancos, and Eagle Ford shale. This approach can analyze rock damage mechanisms where traditional measurement instruments are limited. This study concludes:
  • The load–strain relationship with the DIC map revealed damage and deformation evolution, and the entire process can be broken into four sections where various changes happened in the sample: initial closure damage, elastic region, elastic–plastic transition, and unstable plastic region.
  • In Brazilian testing, Eagle Ford shale fails centrally owing to stress, while Mancos and Wolfcamp fail in mixed mode. Uniaxial compression showed a similar pattern.
  • Shale damage evolution can be effectively characterized with strain localization lines because the damage is more concentrated along these lines than in the rest of the sample as a whole.
  • Damage variables based on the main strain and its standard deviation from the DIC strain map for all investigated shale samples follow a similar evolution trend; however, BDT variables are bigger than UCS.
  • With both uniaxial and diametrical compression, the Wolfcamp shale had the highest damage variable at 0.37 compared to Eagle Ford and Mancos shale.

Author Contributions

Conceptualization, F.N.; methodology, F.N., G.A. and E.A.; validation, F.N.; formal analysis, F.N., G.A. and E.A.; software, F.N., G.A. and E.A.; investigation, F.N., G.A. and E.A.; resources, F.N.; data curation, G.A. and E.A.; writing—original draft preparation, F.N.; writing—review and editing F.N.; supervision, F.N.; project administration, F.N.; funding acquisition, F.N. All authors have read and agreed to the published version of the manuscript.

Funding

This research received no external funding.

Institutional Review Board Statement

Not applicable.

Informed Consent Statement

Not applicable.

Data Availability Statement

The data presented in this study are available on request from the corresponding author.

Acknowledgments

The authors thank Texas A&M International University for supporting the necessary equipment for this work with a start-up research fund and accelerating undergraduate research through a university research grant (URG).

Conflicts of Interest

The authors declare no conflict of interest.

References

  1. Nath, F.; Asish, S.M.; Ganta, D.; Debi, H.R.; Aguirre, G.; Aguirre, E. Artificial Intelligence Model in Predicting Geomechanical Properties for Shale Formation: A Field Case in Permian Basin. Energies 2022, 15, 8752. [Google Scholar] [CrossRef]
  2. Wang, Z.L.; Shi, H.; Wang, J.G. Mechanical behavior and damage constitutive model of granite under coupling of temperature and dynamic loading. Rock Mech. Rock Eng. 2018, 51, 3045–3059. [Google Scholar] [CrossRef]
  3. Jaeger, J.C.; Cook, N.G.W.; Zimmerman, R.W. Fundamentals of Rock Mechanics, 4th ed.; Wiley-Blackwell: Oxford, UK, 2009. [Google Scholar]
  4. Amitrano, D. Rupture by damage accumulation in rocks. Int. J. Fract. 2006, 139, 369–380. [Google Scholar] [CrossRef] [Green Version]
  5. Nath, F.; Mokhtari, M. Optical visualization of strain development and fracture propagation in laminated rocks. J. Pet. Sci. Eng. 2018, 167, 354–365. [Google Scholar] [CrossRef]
  6. Pan, B.; Asundi, A.; Xie, H.; Gao, J. Digital image correlation using iterative least squares and pointwise least squares for displacement field and strain field measurements. Opt. Lasers Eng. 2009, 47, 865–874. [Google Scholar] [CrossRef]
  7. Nath, F.; Salvati, P.E.; Mokhtari, M.; Seibi, A.; Hayatdavoudi, A. Laboratory Investigation of Dynamic Strain Development in Sandstone and Carbonate Rocks under Diametrical Compression Using Digital-Image Correlation. SPE J. 2019, 24, 254–273. [Google Scholar] [CrossRef]
  8. Baqersad, J.; Poozesh, P.; Niezrecki, C.; Avitabile, P. Photogrammetry and optical methods in structural dynamics—A review. Mech. Syst. Signal Process. 2017, 86, 17–34. [Google Scholar] [CrossRef]
  9. Chu, T.; Ranson, W.; Sutton, M. Applications of digital-image-correlation techniques to experimental mechanics. Exp. Mech. 1985, 25, 232–244. [Google Scholar] [CrossRef]
  10. Sutton, M.A.; Orteu, J.J.; Schreier, H.W. Image Correlation for Shape, Motion, and Deformation Measurements; Springer: Berlin/Heidelberg, Germany, 2009. [Google Scholar]
  11. Ma, T.; Peng, N.; Zhu, Z.; Zhang, Q.; Yang, C.; Zhao, J. Brazilian Tensile Strength of Anisotropic Rocks: Review and New Insights. Energies 2018, 11, 304. [Google Scholar] [CrossRef] [Green Version]
  12. Luo, Y.; Xie, H.P.; Ren, L.; Zhang, R.; Li, C.S.; Gao, C. Linear Elastic Fracture Mechanics Characterization of an Anisotropic Shale. Sci. Rep. 2018, 8, 8505. [Google Scholar] [CrossRef] [Green Version]
  13. Wu, X.Y.; Baud, P.; Wong, T.-F. Micromechanics of compressive failure and spatial evolution of anisotropic damage in Darley Dale sandstone. Int. J. Rock Mech. Min. Sci. 2000, 37, 143–160. [Google Scholar] [CrossRef]
  14. Yang, G.S.; Xie, D.Y.; Zhang, C.Q. The quantitative analysis of distribution regulation of CT values of rock damage. Chin. J. Rock Mech. Eng. 1998, 17, 279–285. [Google Scholar]
  15. Ni, X.H.; Zhu, Z.D.; Zhao, J.; Li, D.W.; Feng, X.T. Meso-damage mechanical digitalization test of the complete process of rock failure. Rock Soil Mech. 2009, 30, 3283–3290. [Google Scholar]
  16. Cui, Z.; Han, W. In Situ Scanning electron microscope (SEM) observations of damage and crack growth of shale. Microsc. Microanal. 2018, 24, 107–115. [Google Scholar] [CrossRef]
  17. Gupta, N.; Mishra, B. Experimental Investigation of the Influence of Bedding Planes and Differential Stress on Microcrack Propagation in Shale Using X-Ray CT Scan. Geotech. Geol. Eng. 2020, 39, 213–236. [Google Scholar] [CrossRef]
  18. Wang, Y.; Hou, Z.Q.; Hu, Y.Z. In situ X-ray micro-CT for investigation of damage evolution in black shale under uniaxial compression. Environ. Earth Sci. 2018, 77, 717. [Google Scholar] [CrossRef]
  19. Mokhtari, M.; Nath, F.; Jiang, S. Full-field strain measurement on rocks with horizontal natural fractures. In Proceedings of the Unconventional Resources Technology Conference, Houston, TX, USA, 23–25 July 2018. [Google Scholar] [CrossRef]
  20. Mokhtari, M.; Hayatdavoudi, A.; Nizamutdinov, R.; Rizvi, H.; Nath, F. Characterization of Complex Propagation in Naturally Fractured Formations Using Digital Image Correlation Technique. In Proceedings of the SPE Hydraulic Fracturing Technology Conference and Exhibition, The Woodlands, TX, USA, 24–26 January 2017. [Google Scholar] [CrossRef]
  21. Rue, P. DIC: A Revolution in Experimental Mechanics. Exp. Mech. Exp. Tech. 2015, 39, 1–2. [Google Scholar] [CrossRef]
  22. Nath, F.; Salvati, P.E.; Mokhtari, M.; Seibi, A.; Hayatdavoudi, A. Observation of Fracture Growth in Laminated Sandstone and Carbonate Rock Samples under Brazilian Testing Conditions Using Digital Image Correlation Technique. In Proceedings of the SPE Eastern Regional Meeting, Lexington, KY, USA, 4–6 October 2017. [Google Scholar] [CrossRef]
  23. Na, S.; Sun, W.; Ingraham, M.D.; Yoon, H. Effects of Spatial Heterogeneity and Material Anisotropy on the Fracture Pattern and Macroscopic Effective Toughness of Mancos Shale in Brazilian Tests. J. Geophys. Res. Solid Earth 2017, 122, 6202–6230. [Google Scholar] [CrossRef] [Green Version]
  24. Zhang, H.; Huang, G.; Song, H.; Kang, Y. Experimental Investigation of Deformation and Failure Mechanisms in Rock Under Indentation by Digital Image Correlation. Eng. Fract. Mech. 2012, 96, 667–675. [Google Scholar] [CrossRef]
  25. Chai, J.; Liu, Y.; Yang, B.Y.; Zhang, D.; Du, W. Application of Digital Image Correlation Technique for the Damage Characteristic of Rock-like Specimens under Uniaxial Compression. Adv. Civ. Eng. 2020, 2020, 8857495. [Google Scholar] [CrossRef]
  26. Hao, S.W.; Wang, H.Y.; Xia, M.F.; Ke, F.J.; Bai, Y.L. Relationship between strain localization and catastrophic rupture. Theor. Appl. Fract. Mech. 2007, 48, 41–49. [Google Scholar] [CrossRef] [Green Version]
  27. Hao, S.-W.; Xia, M.-F.; Ke, F.-J.; Bai, Y.L. Evolution of Localized Damage Zone in Heterogeneous Media. Int. J. Damage Mech. 2010, 19, 787–804. [Google Scholar] [CrossRef]
  28. Nath, F.; Aguirre, E.; Aguirre, G.; Perez, J.; Netro, C.; Borjas, F.; Limon, V. Quantitative Characterization of Deformation and Damage in Shale Under Compression Utilizing Digital Image Correlation. In Proceedings of the Unconventional Resources Technology Conference, Houston, TX, USA, 20–22 June 2022. [Google Scholar]
  29. Xie, W.; Zhang, X.; Liu, Q.; Tang, S.; Li, W. Experimental investigation of rock strength using indentation test and point load test. Int. J. Rock Mech. Min. Sci. 2021, 139, 104647. [Google Scholar] [CrossRef]
  30. Bruck, H.; McNeill, S.; Sutton, M.; Peters, W. Digital image correlation using Newton–Raphson method of partial differential correlations. Exp. Mech. 1989, 29, 261–267. [Google Scholar] [CrossRef]
  31. ASTM D3967-08; Standard Test Method for Splitting Tensile Strength of Intact Rock Core Specimens. ASTM: West Conshohocken, PA, USA, 2008. [CrossRef]
  32. ASTM D2938-95; Standard Test Method for Unconfined Compressive Strength of Intact Rock Core Specimens. ASTM: West Conshohocken, PA, USA, 2008. [CrossRef]
  33. Reu, P. Introduction to digital image correlation: Best practices and applications. Exp Tech. 2012, 36, 3–4. [Google Scholar] [CrossRef]
  34. Stirling, R.A.; Simpson, D.J.; Davie, C.T. The Application of Digital Image Correlation to Brazilian Testing of Sandstone. Int. J. Rock Mech. Min. 2013, 60, 1–11. [Google Scholar] [CrossRef] [Green Version]
Figure 1. Creating speckled pattern: (a) Brazilian Disc before speckle, (b) Brazilian Disc after speckle, (c) UCS test sample before speckle, and (d) UCS test sample after speckle.
Energies 16 02776 g001
Figure 2. Experimental setup with 3D-DIC system.
Energies 16 02776 g002
Figure 3. The load–strain curve for rock samples in uniaxial compression.
Energies 16 02776 g003
Figure 4. The load–strain curve for the rock samples in diametrical compression.
Energies 16 02776 g004
Figure 5. Load–strain relationship for Wolfcamp shale with DIC visualizations during UCS.
Energies 16 02776 g005
Figure 6. Load–strain relationship for Mancos Shale sample with DIC visualizations during BDT.
Energies 16 02776 g006
Figure 7. Stages in damage evolution during UCS.
Energies 16 02776 g007
Figure 8. Stages in damage evolution during BDT.
Energies 16 02776 g008
Figure 9. Strain (εxx, εyy, and εxy) and damage evolution on Wolfcamp shale in uniaxial testing.
Energies 16 02776 g009
Figure 10. Strain (εxx, εyy, and εxy) and damage evolution on Eagle Ford shale in uniaxial testing.
Energies 16 02776 g010
Figure 11. Strain (εxx, εyy, and εxy) and damage evolution on Mancos shale in uniaxial testing.
Energies 16 02776 g011
Figure 12. Strain (εxx, εyy, and εxy) and damage evolution on Wolfcamp shale in Brazilian testing.
Energies 16 02776 g012
Figure 13. Strain (εxx, εyy, and εxy) and damage evolution on Mancos Shale in Brazilian testing.
Energies 16 02776 g013
Figure 14. Strain (εxx, εyy, and εxy) and damage evolution on Eagle Ford shale in Brazilian testing.
Energies 16 02776 g014
Figure 15. Damage variable analysis for: (a) Mancos shale during BDT, and (b) Eagle Ford shale during UCS.
Energies 16 02776 g015
Figure 16. Damage evolution across the line in Figure 15.
Energies 16 02776 g016
Table 1. Descriptions of tested samples.
SNShaleTestSample Initial FeaturesDiameter,
in
Length,
in
L/DWeight,
gm
Density, gm/cm3
1Eagle FordUCSDistinct lamination1.9812.0221.021263.7582.582
2WolfcampUCSSealed natural fractures with
calcite vein
2.0012.0431.021277.2352.633
3MancosUCS Calcite-filled distinct lamination1.9952.0191.021260.7612.521
4Eagle FordBDTDistinct lamination1.9811.0200.515133.1542.584
5WolfcampBDTInclined sealed and partially open calcite-filled natural fracture2.0041.0200.509139.8932.655
6MancosBDTCalcite-filled distinct lamination1.9981.0050.503131.1292.541
Table 2. Damage variable of samples under diametrical compression.
Mancos ShaleEagle Ford ShaleWolfcamp Shale
Damage
Variable
Strain,
%
Damage
Variable
Strain,
%
Damage
Variable
Strain,
%
Line Points
0.1500.0070.040.0590.1420.006A
0.2020.2010.090.0850.2190.011B
0.2060.2260.100.120.260.017C
0.2540.2550.210.1650.3570.114D
Table 3. Damage variable of samples under uniaxial compression.
Mancos ShaleEagle Ford ShaleWolfcamp Shale
Damage
Variable
Strain,
%
Damage
Variable
Strain,
%
Damage
Variable
Strain,
%
Line Points
0.1630.020.0850.170.1170.1A
0.1540.030.1240.140.1850.2B
0.1880.040.1520.170.2640.3C
0.2230.060.2660.20.370.4D
Disclaimer/Publisher’s Note: The statements, opinions and data contained in all publications are solely those of the individual author(s) and contributor(s) and not of MDPI and/or the editor(s). MDPI and/or the editor(s) disclaim responsibility for any injury to people or property resulting from any ideas, methods, instructions or products referred to in the content.

