1. Introduction
Today, numerous studies about the effects of IEQ’s performance in the internal environment have been developed.
In fact, over the years, various systems have been developed for the evaluation of the internal comfort of buildings with particular regard to schools and recreational environments.
In [
1], the aim is to provide an overview of the IEQ parameters often measured in schools, their measurement methods, and the main conclusions of these measurements. Most of the studies considered in this review measured the parameters of temperature, humidity,
and volatile organic compounds (VOCs) in schools. Other parameters considered include the concentration of suspended particulates, the air speed, the presence of mold, and the quality of lighting and acoustic comfort.
In [
2], the aim is to identify the key factors influencing the quality of the indoor environment and to develop a sustainability assessment system to improve the performance of residential buildings. The assessment model has been developed based on a review of the existing literature regarding factors that influence the quality of the indoor environment and based on the authors’ practical experiences. The model was then validated through interviews with residents of sample houses in the Biobio region (Cile).
Another study utilized a set of innovative techniques, such as virtual reality (VR) and augmented reality (AR), to visualize the occupants’ comfort in real-time.
In [
3], a new approach to integrating occupant feedback and the probabilistic occupant comfort model into BIM was proposed. It also featured innovative techniques to facilitate BIM as a more effective platform for visualization to guide decision-makers in addressing building operational problems focused on occupant comfort.
The theme of acoustic comfort (ambient noise, sound insulation, reverberation time, speech intelligibility) in primary and secondary school classrooms, as well as in university classrooms, has been the focus of several studies all around the world [
4].
High noise levels in classrooms can have a negative impact on students’ learning and well-being. Studies have shown that high noise levels can cause students to tire early, negatively affect cognitive abilities such as attention, memory, and reading, and make it more difficult to understand the lesson content [
5].
Prolonged exposure to high noise levels can also cause stress and anxiety and lead to negative health effects such as hearing loss, cardiovascular disease, and sleep disturbances. Children are more sensitive to noise than adults and can be negatively affected by high noise levels at lower levels than adults [
6].
Adequate acoustic comfort is particularly important in schools, as poor acoustic conditions can negatively impact the learning and well-being of students and teachers.
The DM 11/01/2017 [
7] establishes specific criteria for assessing the indoor acoustic quality of public buildings, including reference values for sound pressure level, reverberation time, and background-noise level.
The values specified in the DM 11/01/2017 [
7] are based on international standards, which provide guidelines for measuring and assessing the acoustic environment in buildings. The goal of these regulations is to ensure that public buildings provide a comfortable and safe environment for those who use them by controlling noise pollution. These laws are established to keep people safe and healthy and to guarantee good learning and working conditions.
The reference values specified in the DM 11/01/2017 [
7] are evaluated in compliance with the national standards UNI 11532-1 [
8] and UNI 11532-2 [
9]. These two standards provide guidelines for the assessment of indoor acoustic quality in terms of the sound pressure level, reverberation time, and background-noise level.
UNI 11532-1 [
8] specifies methods for measuring and assessing the acoustic environment in buildings, while UNI 11532-2 [
9] sets out the reference values and acceptance criteria for various acoustic parameters, such as sound pressure level, reverberation time, and background-noise level.
The standard UNI EN ISO 9921 [
10] specifies the requirements for the performance of speech communication and recommends the level of speech communication quality required for conveying comprehensive messages in several case studies.
In [
11], it is highlighted that the acoustic conditions of a learning environment, such as the level of background noise and the amount of reverberation, can have a significant impact on a child’s ability to attend to and remember information during primary school. This is because the perception of speech sounds is still developing in young children, and background noise and reverberation can make it more difficult for them to distinguish and understand speech. This can negatively impact their comprehension and retention of the material being taught in the classroom.
Several studies [
12,
13,
14] have shown that children perform better in classrooms with better acoustic conditions, improved speech intelligibility, and reduced background noise.
In [
15], many measurements of the intelligibility of speech were made to calculate the disturbance produced by different amounts of vocal force. The results of this case study show less than a 5% deterioration in intelligibility over the range, from a moderately low voice to a very loud voice (from 55 to 78 dB in a free field at one m from the lips).
Other studies [
16,
17,
18,
19,
20] have shown that speech intelligibility is influenced by the reverberation time (RT) and signal-to-noise ratios (SNR).
In [
21], speech intelligibility tests were carried out in 12 university classrooms in Korea; the test results indicate that young adult listeners at university have a mean score of 95% correct at a signal-to-noise ratio (SNR) value of +3 dBA, which is a considerably lower SNR value than for the younger students in elementary schools. As a result, the development of effective objective indicators of quality and/or intelligibility is of particular interest; the measured parameters include reverberation time, early decay times, energy ratios, and STI values. The STI is a physical metric related to the intelligibility of speech degraded by additive noise and reverberation [
22].
Scientists nowadays consider the STI to be the parameter that best reflects the intelligibility of speech (in a sound transmission system) [
23]. Consequently, the STI measure correlates well with subjective intelligibility scores for stimuli distorted by linear filtering, reverberation, and additive noise. The experiments in the literature evaluate the effectiveness of the prevision method in predicting speech intelligibility.
In [
24], the potential binaural effect of reducing reflection and reverberation was studied. These conditions create a reduction in intelligibility because echoes and strong discrete reflections, arriving late, lead directly to a wrong assessment when using the STI.
Similarly, in [
25], the STI approach was revisited, and a variation was proposed that processes the modulation envelope in short time segments, requiring only an assumption of quasi-stationarity (rather than the stationary assumption of STI) of the modulation signal.
Based on the tests in [
26], the corresponding relation between the STI and speech intelligibility in large spaces was modified, and a new rating threshold for the STI was also proposed.
In Makito et al. [
27], the aim is to evaluate the speech intelligibility of the different types of sound sources and the reverberation time in the classrooms and to compare the results. The study attempted to find ways to improve the design of public address systems for better speech intelligibility in the classrooms. It attempted also to identify best practices for the design of sound systems in classrooms evaluating the differences in the speech intelligibility scores between different types of sound sources.
The main objectives of this work are summarized as follows:
To study and compare the acoustical performance of several university classrooms based on different geometrical configurations;
To determine how well various prediction methods, such as computer simulations and mathematical models, can predict the speech intelligibility of a given space based on the measurement results;
To find correlation factors between prediction methods and measurement methods as high as possible, indicating that the prediction methods provide results that are highly correlated with actual speech intelligibility measurements.
This study used the existing calculation method of the speech transmission index (STI) via the indirect method described in IEC 60268-16 [
28] to model speech intelligibility in the classrooms and then compare the results of the model with actual measurement data to determine the correlation between the two.
Section 2 describes the methods used, including a brief description of the places and the acoustic parameters studied.
Section 3 presents a discussion of the results. Finally,
Section 4 provides the conclusions of the study.
2. Materials and Methods
This section introduces the descriptors that characterize the internal acoustic quality of school environments and the related standards and procedures. Then, it illustrates the characteristics of the evaluated classrooms and the measuring equipment. The method of calculating the voice transmission index is explained in detail.
2.1. Reference Value for RT, STI, and C50
Reverberation Time T20 and T30 are the values of the reverberation time estimated by the slope of the Schroeder backward-integrated decay, respectively, in the [dB] ranges: [−5, 163-25] for T20 and [−5, −35] for T30.
According to standard 11532-2 [
9], the optimal reverberation time,
, which corresponds to a conventional room occupation of 80%, with the exception of category A5 as per the categories shown in
Table 1, is determined according to the specific room activity as a function of the room volume, according to the formulas shown in
Table 2.
The categories of the environment, in relation to the destined use, are reported in
Table 1.
The reference values for the optimal reverberation times for A1–A4 categories are reported in
Table 2.
Reference values for ;
is the ratio, in dB, between the “useful energy” received in the first 50 ms of the impulse response to the energy received in subsequent instances. The term “energy” represents the square of the instantaneous values of the pressure impulse response.
is defined in the ISO 3382-1 [
29] through Equation (
1) as follows.
The descriptor can be used as an alternative to the STI for categories A1, A2, A3, and A4 for environments smaller than 250 .
For environments with V ≥ 250
, only the STI is applicable. The reference values for
are shown in
Table 3.
The values in each single measurement position are obtained as the arithmetic average of the measured values in the octave bands 500–1000–2000 Hz.
Reference values for STI; The STI aims to objectively quantify speech intelligibility at a specific location in one environment when speech is produced through a normalized signal at another specific location in the same environment.
Speech intelligibility is measured using a metric called the speech transmission index (STI), which ranges from 0 to 1 with higher values indicating better speech intelligibility. It is measured by comparing the speech signal with the background noise in a room.
STI values from above 0.6 to 0.7 are considered good and provide intelligible speech. It is worth noting that values above 0.5 are still considered acceptable but lower than optimal, and values under 0.5 are considered poor and problematic for effective communication.
Proper acoustical design of a classroom, utilizing sound-absorbing materials, and proper sound isolation techniques, can help improve speech intelligibility by reducing excessive noise levels and controlling reverberation.
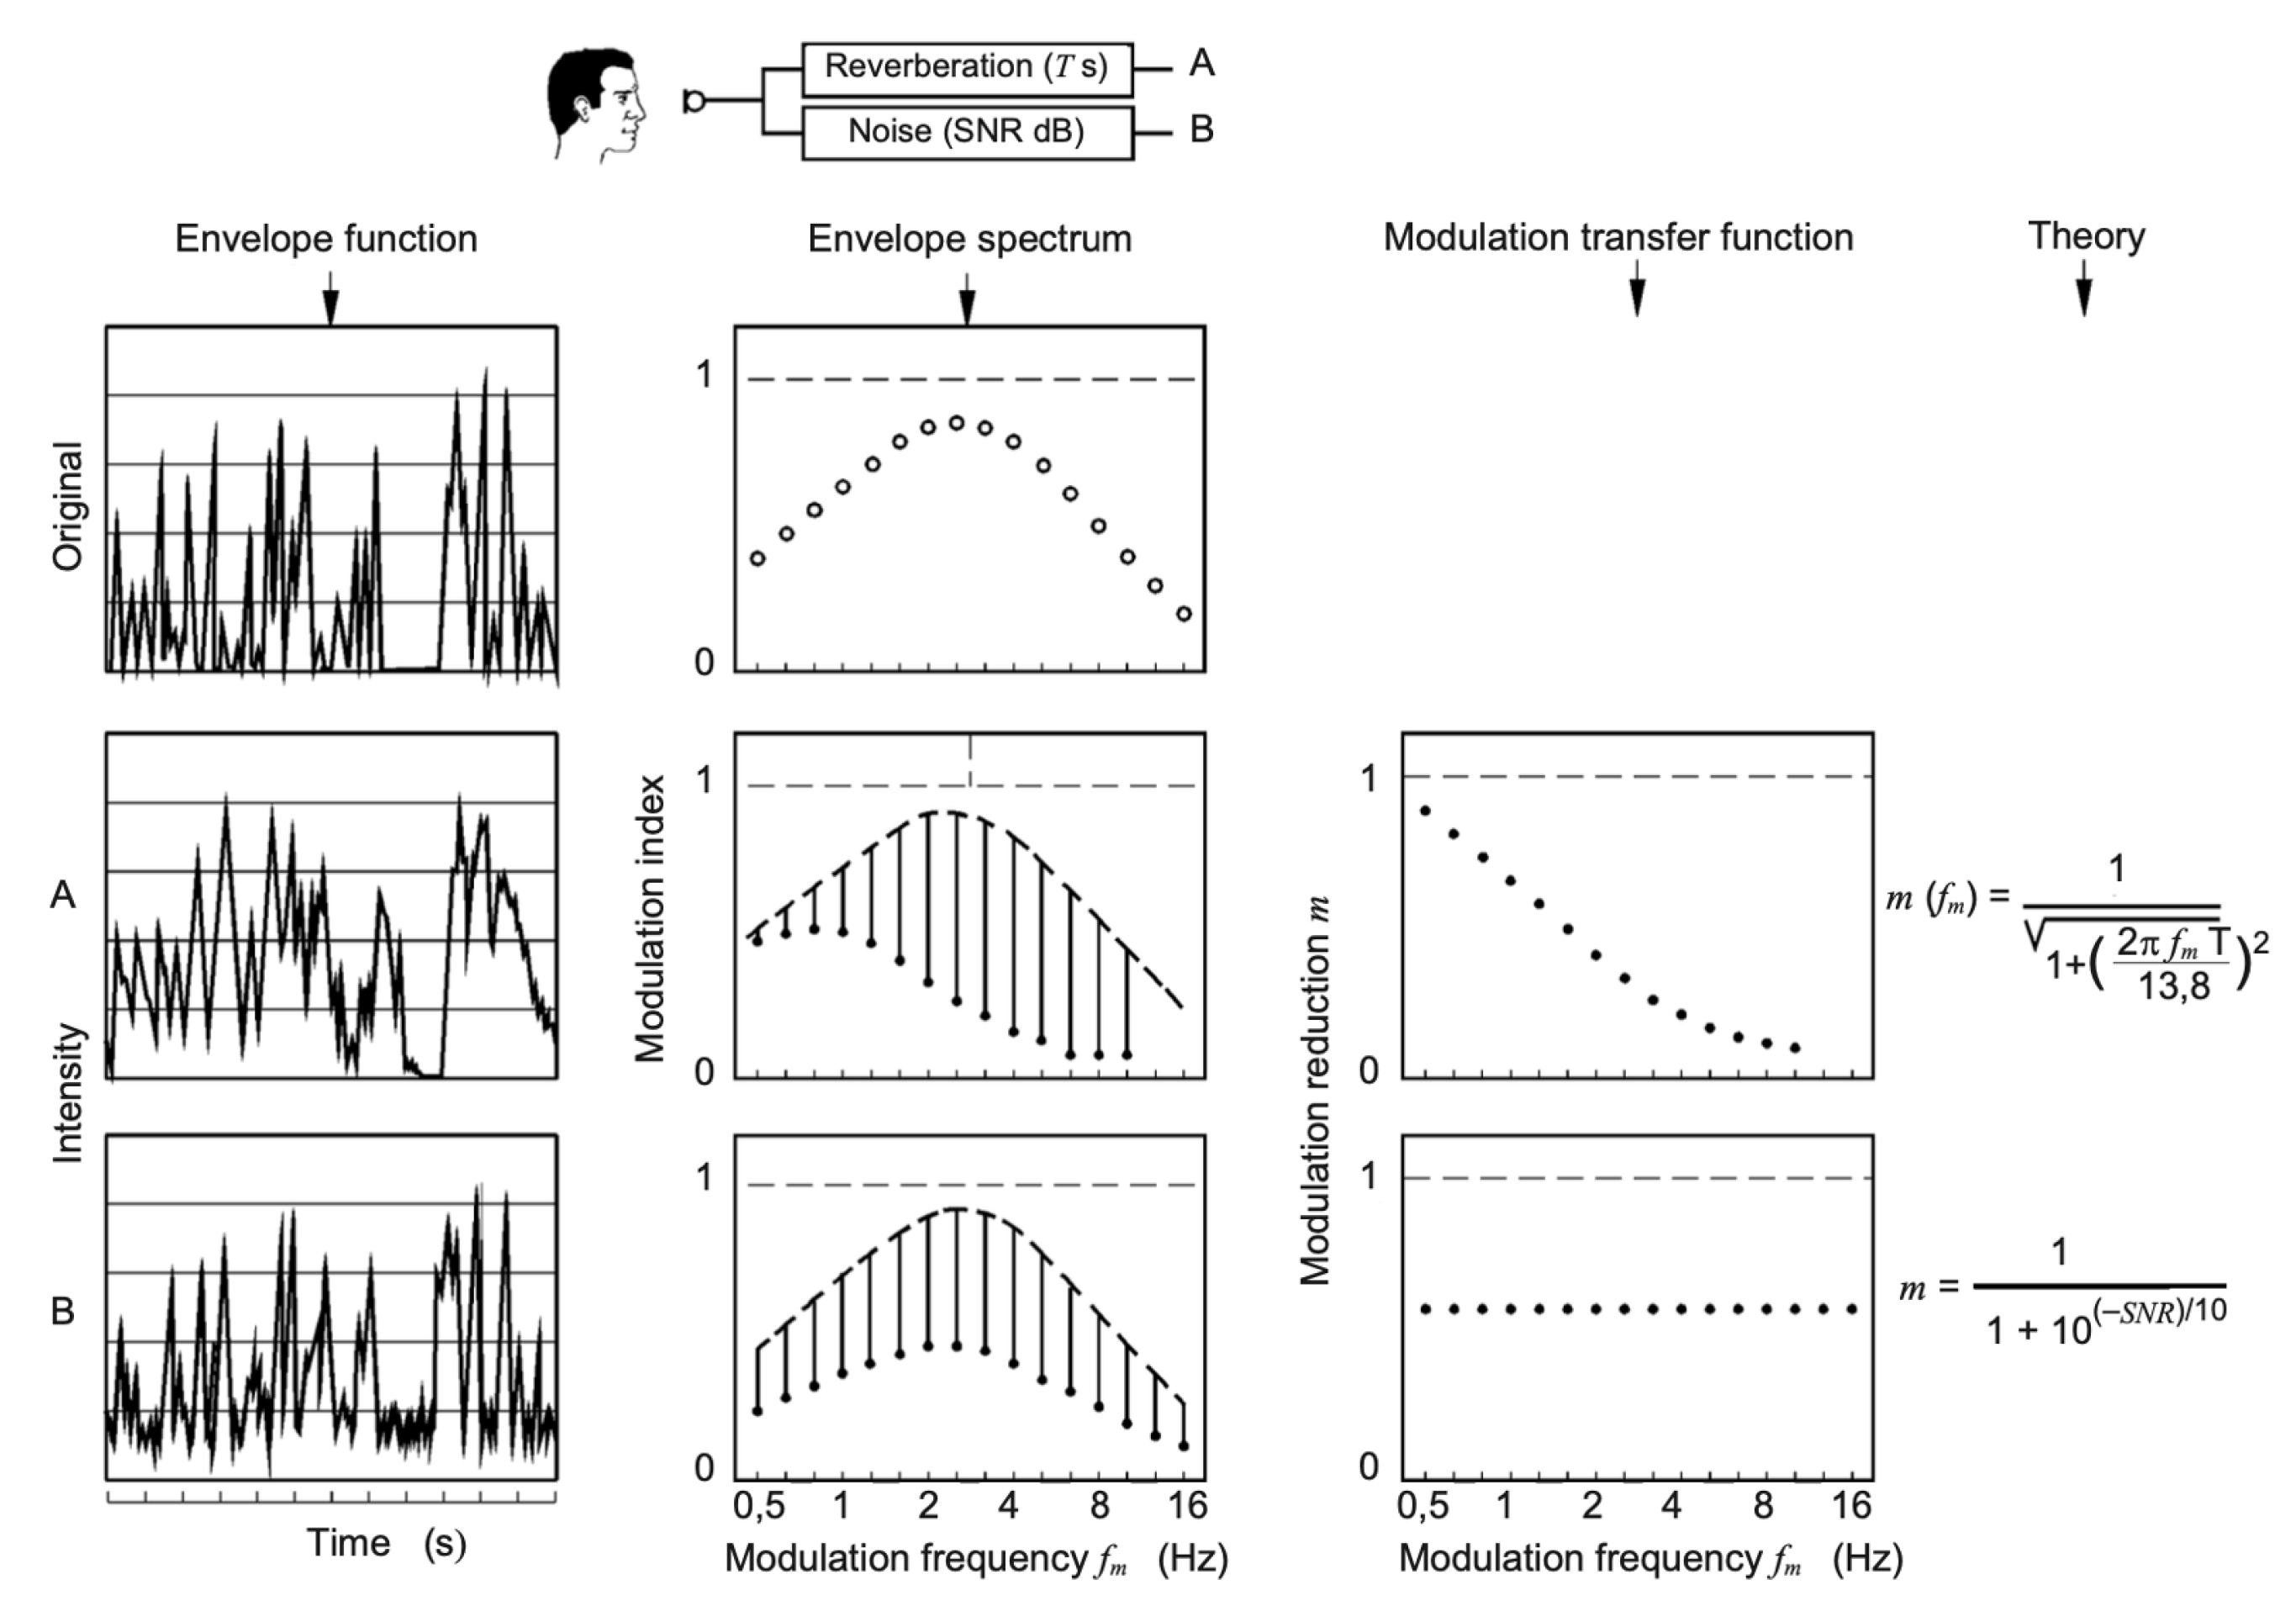
The speech transmission index (STI) is based on the measurement of the modulation transfer function (MTF).
The MTF is a measure of how well a system (such as a room or a communications system) transmits the modulations, or variations, of a signal. The modulation transfer function (MTF) is a measure of the reduction in the amplitude of a sinusoidal input signal as it passes through a system. The MTF is the ratio of the amplitude of the sinusoidal output signal to the amplitude of the input signal.
In the case of the STI, the MTF is used to measure the reduction in amplitude of a speech signal as it passes through a room and is represented by a ratio between the speech signal and the background noise. This ratio is then used to calculate the STI value which ranges from 0 to 1 with higher values indicating better speech intelligibility.
For each modulation frequency, the MTF is determined by the ratio between the modulation index of the signal at the listener, , and the modulation index of the test signal, . A family of MTF curves is determined, in which each curve is relative to each octave band of speech emission and is defined by the values that the modulation index reduction factor m assumes for each modulation frequency present in the envelope of a natural speech signal.
For the STI measurement, 7 octave bands, from 125 Hz to 8 kHz, and 14 modulation frequencies, between 0.63 Hz and 12.5 Hz at octave intervals of one-third, are considered. The 98 (7 × 14) m-values are finally summarized in a single index, the STI, varying between 0 and 1, which represents the effect of the transmission system on intelligibility. The STI quantifies the combined effect of background-noise interference and reverberation on speech intelligibility reduction, with or without sound amplification systems.
Figure 1 illustrates the MTF for the octave band centered on 250 Hz for two simple transmission systems: one with exponential reverberation (case A) only and the other with only interfering noise (case B).
The UNI EN ISO 9921 standard [
10] establishes a relationship between the STI value and their subjective assessment in terms of the intelligibility for a normally hearing user. The values are shown in
Table 4:
Another classification of speech intelligibility is provided by BS EN 60268–16 [
28]; the standard defines qualification intervals for the levels of the STI obtained, as shown in
Figure 2. The typical STI requirements for dedicated applications are also provided in
Figure 3.
There are two measurement methods for STI: the direct and indirect methods. The direct method uses modulated (speech-like) test signals to directly measure the modulation transfer function. Typically modified pink noise with modulation frequencies was used. In this case, the measurement signal is either applied as an electric input to the system or through a “human speaker” loudspeaker to a microphone. The indirect method uses impulse response and forward energy integration (Schroeder integral) to derive the modulation transfer function. The STI can be measured at the same time as other room acoustic parameters. This means that speech intelligibility will normally be measured using an omnidirectional speaker.
2.2. Room Descriptions and Measurements
The university building selected for the measurement campaign is located in a suburban area of Ancona. The acoustics of the building are affected by the surrounding environment.
In suburban areas, the level of background noise is generally lower than in urban areas, but it can still be significant, and sound reflections from nearby buildings and surfaces can impact the acoustics of the building.
In addition, the classrooms are located at the rear of the building in relation to the access road. The external SPL during the daytime period is between 45 and 55 dB (A).
The measurement campaign was carried out in different classrooms with and without the HVAC system to understand the acoustic performance of the building.
Table 5 summarizes the main characteristics of the lecture rooms: type of school (school number and grade), name of the room, year of construction, location characteristics, and main finishing materials.
The list of geometric dimensions of each classroom is provided in
Table 6.
Figure 4 shows some of the classrooms at the University of Ancona and the measurement positions, as required by UNI 11532-2 [
9].
The measurements in each classroom were completed for four measurement points, chosen in compliance with the UNI 11532 standard. Three positions were selected along the imaginary line traced on the longitudinal axis of the classroom between the sound source and the back of the classroom, and a position was selected as representative of the most unfavorable listening condition (due to background noise, distance from the speaker, etc.). The STI measurements were derived from the impulse response measures and background-noise measures with the indirect methodology proposed by BS EN 60268–16 [
28].
Table 7 shows the results of measurements for the RT
30 from 125 kHz to 8 KHz, the STI for each measurement point, and the STI mean value and intelligibility rating according to [
28].
2.3. STI Prediction Using Indirect Method
Prediction of the STI of a sound system may be based on the MTF matrix that is calculated from the predicted room acoustic and electro-acoustic parameters and from the measured or estimated background-noise levels for each octave band contributing to the STI version chosen. The STI measure uses artificial signals (e.g., sinewave-modulated signals) as probe signals to assess the reduction in the signal modulation in several frequency bands and for a range of modulation frequencies (0.6–12.5 Hz). As requested in the reference standard, the speech spectrum at 1 meter in front of the mouth of a male speaker with the ambient noise spectrum is reported in Table H.1 of UNI EN ISO 9921:2004.
Table 8 and
Table 9 were concatenated.
The STI was calculated based on the modulation transfer function (MTF), and the calculations used the method of Houtgast and Steeneken (1973) [
30].
In (UNI, 2020) for the calculation of the STI in classrooms without amplification systems and with volumes > 250 , an emission signal at 1m on the axis to the source equal to 70 dB is required.
Therefore, to calculate the predictive STI, the reference signal of the speech was increased by 10 dB.
The modulation transfer function of the transmission path may be quantified by comparing the ratio of the modulation depth at the output and input of the test signal, and it is written as Equation (
2):
where:
is the modulation transfer function of the transmission channel;
is the impulse response of the transmission channel;
SNR is the signal-to-noise ratio in dB.
Considering a diffuse reverberant field, the impulse response is written as Equation (
3):
where:
Q is the directivity factor for the sound source (talker);
r is the talker-to-listener distance;
T is the reverberation time of the room space.
The reverberation time was calculated with the method described in UNI EN 12354-6 [
31], starting from the acoustic absorption of the room.
3. Results
This section presents the experimental results. First, it presents the STI values of the classrooms described in
Section 2.2 according to the method described in
Section 2.3. The result of the correlation between the measured and predicted STI results is then shown.
3.1. Evaluation of Speech Intelligibility through the Predictive Method
The model is based on our experience with predictions for rooms, such as rooms in dwellings and offices, and common spaces in buildings, such as stairwells, corridors, and rooms containing machinery and technical equipment. It is not intended to be used for very large or irregularly-shaped spaces, such as concert halls, theaters, and factories.
The impulse response of the classroom was calculated in the four different positions of the room.
In
Figure 5, the graph of the simulated reverberation time vs. the measured reverberation time for each classroom for a conventional occupation of the environment equal to 80% is reported.
The calculation was made the same for all of the classes previously listed.
For categories A1–A4, if the measurement is performed in a furnished but unoccupied environment, the measured values must be corrected with Equation (
4) to compare them with the reference limits.
where:
is the optimal reverberation time for the room occupied at 80% in seconds;
is the optimal reverberation time when the room is not occupied (measurement result), in seconds;
V is the volume of the room in cubic meters;
is the equivalent additional surface area of the acoustic absorption of people in square meters.
A constant MTF over the modulation frequencies indicates that speech intelligibility is mainly determined by background noise. A continuously decreasing MTF indicates an important influence of the reverberation, and an MTF that decreases first and then increases again indicates the presence of an echo.
The STI index can finally be obtained by using the weighted average method for the modulation transmission index on the considered octave bands as follows in Equation (
5):
The STI weighting factors (
) and redundancy factors (
) for male and female speech are shown in
Table 10 as a function of the octave bands.
For example, the calculation of the AT1 classroom is given. The same procedure has been applied to all other classrooms under examination.
Figure 6 shows the result of the simulation of the modulation transfer function in the seven octave bands calculated for P1:
Table 11 shows the relationship between
,
, and MTI
to determine the STI for the AT1 classroom.
The same calculation was carried out for all of the positions, and the STI simulation results are shown in
Table 12.
From the comparison between the results of the STI obtained between the measured and simulated values (see
Table 13), it can be seen that the difference is very low.
This demonstrates that the predictive model turns out to be very effective at ensuring a good internal quality of the classrooms during the design phase.
3.2. Correlations between Measurments and Predictive Methods
Considering the results of the simulations and according to the background literature, a statistical analysis for the case study was carried out.
The purpose of the correlation study is to highlight an interdependent link between the statistical variables. The linear correlation is measured by Bravais–Pearson [
32], as seen in Equation (
6).
A linear regression model is the relation between a dependent, or response, variable
y and one or more independent, or predictor, variables
, …,
. A simple linear regression considers only one independent variable using the relation in Equation (
7):
where
is the y-intercept,
is the slope (or regression coefficient), and
is the error term. It begins with a set of n observed values of x and y given by Equation (
8):
Using the simple linear regression relation, these values form a system of linear equations. It is possible to represent these equations in matrix form as:
Then, the Equation (
7) can be expressed more concisely, as explained in Equation (
9):
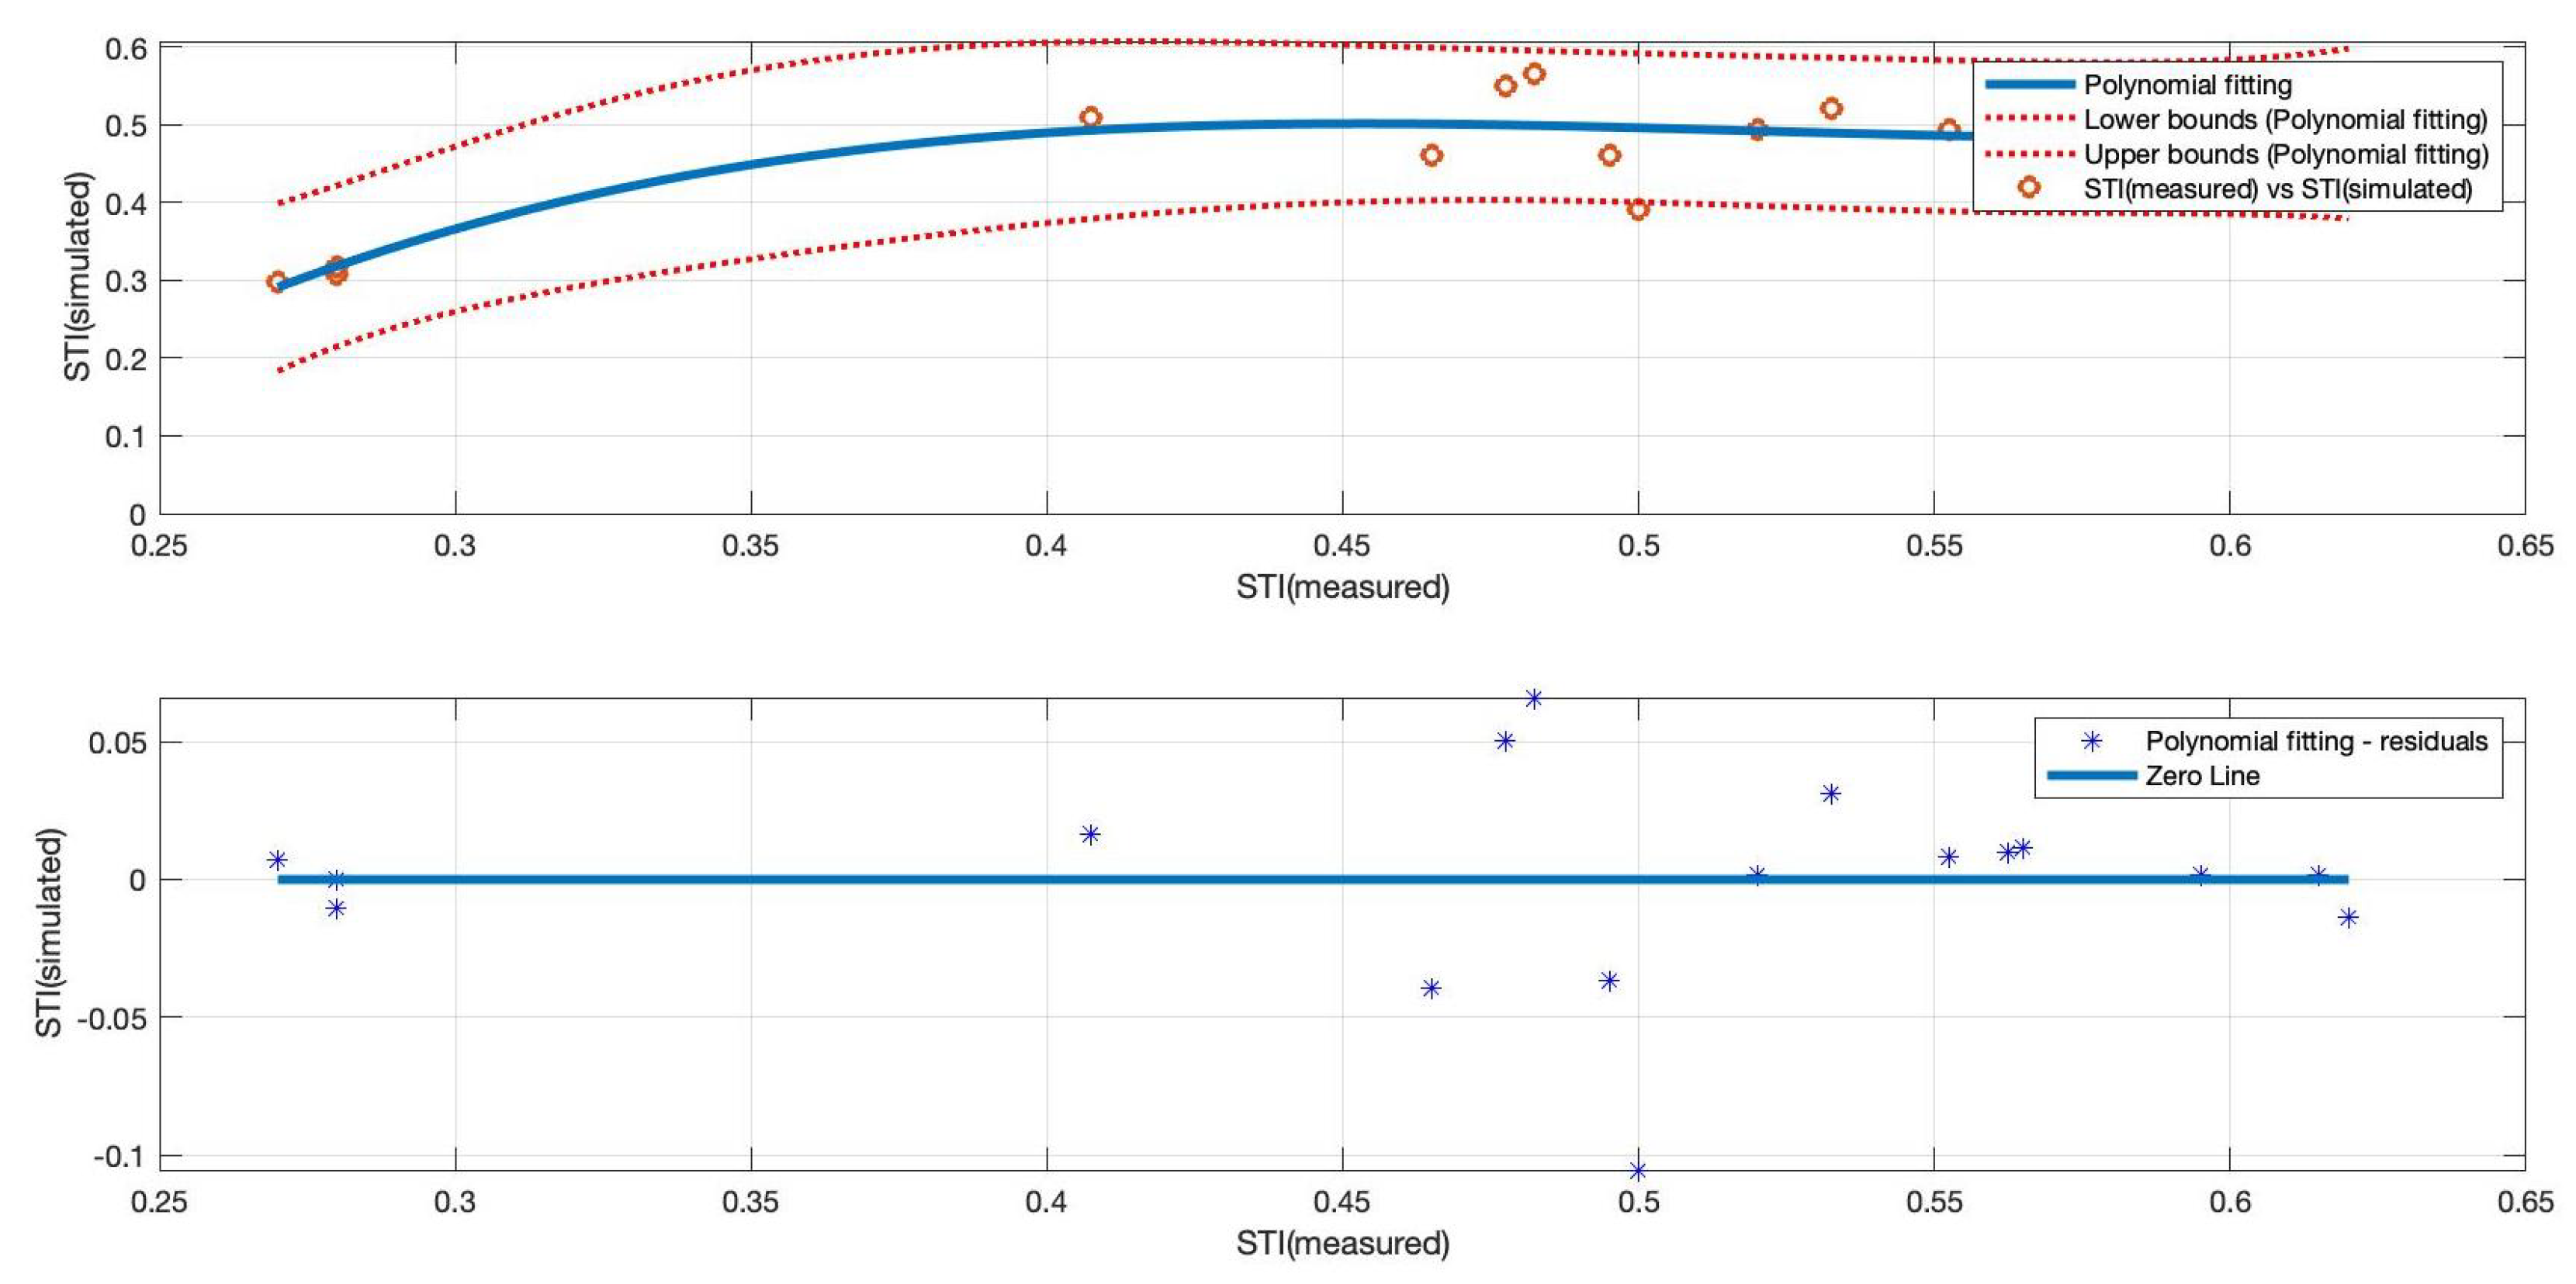
A polynomial regression analysis was used to identify the most appropriate correlation between the measurement and predictive method, as shown in
Figure 7.
The proposed correlation model between the measurements of the STI versus the simulations of the STI is based on a polynomial function, according to the following Equation (
10):
where
y is the response variable, and
a,
b,
c, and
d represent partial correlation coefficients (coefficients with a 95% confidence bound).
a = 16.53 (−13.76, 46.83);
b = −25.71 (−67.04, 15.62);
c = 13.11 (−4.937, 31.17);
d = −1.701 (−4.186, 0.7837).
This can be attributed to the particular geometry of those classrooms, which makes the acoustic quality more sensitive to reverberation conditions.
Moreover, the only classrooms that have an unacceptable “poor” intelligibility are the classrooms S1, S2, and S3, in which controlled mechanical ventilation systems have been installed.
VMC sources worsen the internal acoustic quality, especially in terms of speech intelligibility and ambient noise levels, with negative consequences for both the teacher and the student.
Overall, the predictive model proved to be an effective tool for improving the internal quality of classrooms during the design phase.
It can be applied to analyze the acoustic quality of classrooms in different conditions, with different geometries, orientations, and materials, and can be used to quickly and accurately assess the acoustic intelligibility of school classrooms.
4. Conclusions
This paper systematically provides the flow of the STI indirect test method specified in BS EN 60268-16 and introduces in detail the calculation formula involved in the indirect method, with reference to Schroeder’s frequency analysis and, therefore, to the limits of the validity of the sound equations of classical theory, which are associated with the simulation of the room. The aim is to find correlation factors between the prediction and measurement methods as high as possible, indicating that the prediction methods provide results that are highly correlated with actual speech intelligibility measurements.
The proposed approach utilizes first the measurements of the the acoustical performance and the speech intelligibility of several university classrooms based on different geometrical configurations according to national and international standards. Second, speech intelligibility was determinedby the prediction methods indicated in the ANNEX L of the BS EN 60268-16 standard. Then, the correlation between the prediction methods and the measurements in situ.
This study highlighted that the one of the major problems when developing this type of prediction is represented by the error generated by a low signal-to-noise ratio. Therefore, the choice of the speech spectrum, as well as the residual noise setting, represents an important choice in order for overestimation errors of the STI not to be incurred.
Although the standard is clear in recommending standard spectra, a possible solution could be to simulate the environment impulse response using a commercial room acoustic software and enter, during the input phase, an environmental noise that could be representative of the acoustic scene of the room.
However, measurement methods provide actual data on the acoustic characteristics of a room, which can be used to validate the predictions made by predictive methods.
Additionally, an HVAC system can have a significant effect on speech intelligibility in educational room, either positively, for example by providing improved ventilation, or negatively, for example, by introducing additional noise into the room, depending on the HVAC system’s design, installation, and maintenance.
The installation of acoustic panels and other sound absorbing materials can be recommended in order to improve the acoustic quality of the classrooms where VMC systems are installed.
The results show that the calculation tool has computational robustness that allows its use in preliminary evaluations of language intelligibility, design o fthe optimal type of school buildings, and sound amplification systems in classrooms that comply with Italian regulations.


