1. Introduction
The European Union’s (EU) increasing dependence on imports of energy resources and climate change have necessitated intervention in the energy market. The EU climate policy aims to reduce greenhouse gas emissions by 55% by 2030 and to achieve climate neutrality by 2050 [
1]. A vital tool for achieving the ambitious targets will be the development of renewable energy sources. Among these, offshore wind energy is becoming increasingly important [
2].
Poland’s energy mix is 60–70% based on coal. The share of renewable energy sources in the energy balance is only 15%. One way of achieving the EU’s climate targets is through the development of offshore wind energy. Despite favourable conditions, Poland is one of the few countries with access to the sea without offshore wind farms.
The potential of Polish offshore areas is estimated at 33 GW, which is approximately half of the current energy demand. Despite favourable conditions, Poland is the only EU country with access to the sea that does not have offshore wind farms. However, there are plans to launch the first farm in 2026 and to reach 6.3 GW of capacity by 2030 [
3].
In addition to climate considerations, the economic aspect of offshore wind development is becoming equally important. It creates jobs and generates added value in the supply chain, in the manufacture of components for the assembly of offshore wind farms, in maintenance and repair services and in the decommissioning phase. Knowledge of the economic determinants of offshore wind development is essential not only to justify capital-intensive investments but also to enhance the benefits of local supply chain development [
4].
The main objective of this article is to determine the economic importance of offshore wind energy in Poland. This article seeks to answer the following research questions:
what is the share of the coastal regions in the supply chain;
what is the global value, how many jobs are created and what added value is generated by the offshore wind energy sector at the level of the country and coastal provinces;
what differences exist between the Polish wind power industry and the location adopted for comparison;
what barriers limit the development of offshore wind energy in Poland.
The regional territorial scope includes two provinces within which the wind farms will be located, i.e., West Pomerania and Pomerania. In the literature, the share of the examined regions in the supply chain is determined either on the basis of the location of the offshore wind energy sector [
5,
6,
7] or in an arbitrary manner [
8]. In this article, the first method was chosen, i.e., the share of the coastal provinces in the supply chain was determined on the basis of the location, taking into account the predominant type of activity and revenue for the last financial year.
The input–output method was used to determine the economic effects of offshore wind farms. It allows for the distinction of direct, indirect and induced effects. These effects are discussed in terms of global and added value and employment.
The results of this study were compared with an offshore wind farm in Saint-Brieuc in the Brittany region of France, included in the article by Kahouli and Martin [
8]. The choice was dictated by the application of a similar methodology, i.e., input–output. In both cases, direct, indirect and induced effects were distinguished. Similarly, the territorial coverage of the study was regional and national. Although the study covers Poland’s 6.3 GW offshore wind sector, the data represent an offshore wind farm with an average capacity of 0.7 GW, compared to Saint-Brieuc’s 0.5 GW offshore wind farm. The comparative analysis identified differences in the network of economic ties created by the offshore wind sector.
The final stage of the research was to identify the main barriers limiting the development of offshore wind farms. Based on these, postulates to improve offshore wind energy activities were formulated.
The economic importance of offshore wind energy has been widely discussed in the literature [
5,
8,
9,
10,
11,
12,
13,
14]. However, most studies refer to its onshore counterpart [
15,
16,
17,
18,
19]. The dominant method for assessing the economic impacts of offshore wind farms has been the input–output method, with the CGE model, surveys and supply chain analysis used much less frequently. In the case of input–output and CGE methods, the analytical part was based on available models (REMI, JEDI) or on proprietary models. The most commonly used measure of the importance of offshore wind energy was employment, and less frequently, output, value added, wages and tax revenues. The above measures were examined in terms of direct, indirect and induced effects. However, the interrelationships between them were very rarely analysed [
5]. Almost all authors distinguished between the planning and construction phase (CAPEX) and the operation and decommissioning phase (OPEX). The studies covered both existing and planned wind farms. In the latter case, the authors often considered different offshore wind development scenarios, as it is difficult to precisely determine the involvement of actors in the local, regional or national supply chain.
The territorial scope of the study most often covered the region and the country, rather than local systems. This was due to the difficulty of adapting the national input–output table, on which the input–output model is based, to smaller reference areas. In contrast, Flegg’s location coefficients were the main method used to regionalise the national table. The research focused on offshore wind farms located in several countries, i.e., the US, Germany, the UK, Spain, France and Denmark. The studies were case studies but also included comparative analyses.
To date, there have been two studies showing the economic aspects of offshore wind energy development in Poland. However, the methodology [
4] and the results [
2] are not publicly available. In addition, some of the data on which the first study was based have become outdated and do not take into account the current conditions for the development of domestic offshore wind energy.
This article consists of five parts. The first part contains basic information about offshore wind energy in Poland, i.e., location, planned capacity and stage of development. The second part discusses the research methodology and the sources of information used. The following two parts present the results of the research and provide a comparative analysis. The last part discusses the main barriers limiting the development of offshore wind energy and formulates postulates to improve its operation.
2. Offshore Wind Energy in Europe and Poland
In July 2021, there were 120 offshore wind farms (OWFs) in Europe, located in 12 countries, with a total of 5566 turbines, of which 42% were in the UK (2355 turbines), 27% were in Germany (1501), 11% were in Denmark (631), 10% were in the Netherlands (568) and 7% were in Belgium (399). In 2021, 8 offshore wind farms (with grid-connected turbines, some under construction) will be installed in Europe. The most significant number of new installations—three new projects with a total capacity of 2317 MW: Moray East (950 MW), Trinton Knoll (875 MW) and Kincardine (48 MW)—will be built in the UK. A fourth project—the 462 MW Hornsea Two—will come on stream in 2022. In Denmark, the 605 MW Kriegers Flak project has been completed, and in the Netherlands, a commercial wind farm and a demonstration project totalling 10 MW have been installed in the Borssele area. A demonstration project with a new floating concept, the Tetra Spar Demo (Metcentre), with a total capacity of 4 MW, has also been installed in Norway. Offshore wind farms are mainly located in the North Sea (20,571 MW). Farms with a total capacity of 2924 MW are located in the Irish Sea and 2824 MW in the Baltic Sea [
20].
According to the report ‘Wind Energy in Europe. 2021 Statistics and the outlook for 2022–2026’, published by WindEurope, the intensive development of offshore wind energy (OWE) in the European Union has been interrupted by the pandemic. As in many other sectors of the economy, the main reason for the delays in bringing new wind farms into operation was the disruption of global supply chains. In 2021, the volume of new wind installations in Europe was 17.4 GW (11 GW in the EU-27), including 14 GW onshore and 3.4 GW offshore. Despite the increase compared to 2017 (17.1 GW), investment in this sector was well below the level needed for Europe to meet its 2030 energy and climate targets. Achieving the EU-27’s 40% renewable energy (RES) target by 2030 will require 32 GW of new wind capacity to be installed each year.
Table 1 presents information describing the total installed offshore wind capacity in the EU-27, Norway and the UK, including installations as of the end of 2021 together with information on new installations in 2021.
In 2021, offshore wind accounted for 19% of all new wind installations (onshore and offshore) in Europe. A total of 3.3 GW was connected to the grid in 2021, 2.1 GW more than in 2012. The EU-27 accounts for 55% of all offshore wind capacity in Europe. The United Kingdom had the most considerable amount of new offshore wind capacity installed in 2021 (997 MW). It is followed by Denmark (605 MW), the Netherlands (392 MW) and Norway (2 MW). The total capacity of offshore wind installations in Europe in 2021 was 28 MW, which is an increase of 23 GW compared to 2012.
The UK had the largest total installed offshore wind capacity in Europe at the end of 2021 (12,739 MW), followed by Germany (7713 MW), the Netherlands (2986 MW), Denmark (2308 MW) and Belgium (2261 MW).
At least 4.2 GW of offshore wind power is expected to be installed in Europe in the next few years, mainly from UK projects. Rystad Energy estimates an increase of 3.2 GW. Further investment will come from the German energy company RWE. It has a majority stake in the Triton Knoll investment in the UK. The RWE’s second project is the Kaskasi offshore wind farm with a target capacity of 342 MW, consisting of 38 turbines; this farm will be the first German offshore wind farm to be commissioned after 2020.
The company also plans to complete its first offshore project off the coast of France, with a capacity of 480 MW. Further investments are planned in the following countries:
In Norway, the 88 MW Hywind Tampen floating wind project will be the world’s largest wind farm, with turbines on floating platforms. The Norwegian company Equinor is responsible for the realisation of this investment;
In Italy, there are plans to commission its first offshore wind farm, Beleolico, in the port of Taranto, with a capacity of 30 MW;
In Spain, there are plans to launch demonstration projects based on the use of floating wind technology.
According to Rystad Energy, generation capacity is also forecast to grow in the coming years. It is estimated that generation capacity will reach 7.3 GW in 2023 and 8.6 GW in 2025, with investments mainly in the UK. Investments are also planned in France and the Netherlands [
20].
The potential of offshore wind energy in the Polish part of the Baltic Sea, in the so-called Polish maritime areas, is estimated at 33.0 GW. The current (summer 2023) total installed capacity of all energy sources is 58.1 GW, which means that the potential of offshore wind energy can meet a significant part of the national energy demand in the future [
3,
21].
The country’s two key energy policy documents, i.e., the “Act on the Promotion of Electricity Generation in Offshore Wind Farms” [
22] and the “Energy Policy of Poland until 2040” [
23], assume the generation of 5.9 GW by 2030 and 11.0 GW by 2040. At present (summer 2023), eleven location permits have been issued for offshore wind farms with a capacity of 8.9 GW, of which eight have received decisions from the President of the Energy Regulatory Office to grant the right to cover the negative balance for electricity generated in OWFs and injected into the grid, which, in fact, means guaranteed collection of the generated energy. The final condition for the construction of an offshore wind farm is to obtain a decision on ‘environmental conditions’. Thus far, only two projects have received this decision, and considering the time of construction, the first offshore wind farm should usually be commissioned in 2026 [
3].
Table 2 shows the characteristics of the energy projects that have received location permits [
24,
25,
26]. As already mentioned, eleven projects with a total capacity of 8.9 GW, belonging to six capital groups, have received a location permit. These are key players in the energy sector. Foreign capital includes entities with many years of experience in the construction and operation of offshore wind farms. Domestic entities are the majority shareholders, with 5.85 GW or nearly 66% of the projected capacity. However, only two projects of 1.0 GW/11% are owned exclusively by national entities. The shareholders of the remaining sites are either foreign entities or, most often, companies with mixed domestic and foreign capital. The preference for joint ventures is understandable, given the lack of experience in the construction and operation of Polish entities.
3. Materials and Methods
3.1. Materials
Various economic indicators are used in renewable energy research [
12]. By far, the most popular are measures of employment. Other measures such as gross output, value added, GDP, tax receipts, wage levels and corporate profits are also popular. This article assesses three indicators that characterise offshore wind energy: employment size, output and value added. As mentioned above, employment is the most frequently analysed indicator and the one that most captures the imagination of decisionmmakers. Employment is a particularly important factor in the Polish context due to the phasing out of coal-fired power plants and, in coastal regions, the decline of Baltic Sea fisheries. On the other hand, the total value of production consists of the costs of acquiring the raw materials used in the electricity production process and the newly created value, i.e., the value added. This includes wages, taxes and company profits. This is important information for workforce allocation, local/state budget planning and business involvement in offshore wind development. The selection of the above indicators was also driven by a comparative analysis of employment, global value and value added.
3.2. Methods
A review of the literature identified four main methods used in the economic assessment of the importance of renewable energy, including offshore wind [
8,
11,
12]. These are employment rates, supply chain analysis, input–output methods and CGE general equilibrium models. In addition to the main methods, researchers have also used others, such as macroeconomic (ME) models, econometric regressions and cost–benefit analysis. However, these have been much less popular.
Employment indicators measure average employment per unit of capacity. Supply chain analysis, on the other hand, provides a broader range of information, covering the main categories of financial flows. The methods discussed are used in a bottom-up approach to research, particularly in local studies. The collection of data from larger reference areas would be problematic due to the time and cost involved in the research. The sources of information in the above methods are surveys/interviews, analysis of documentation and financial statements. They relate to studies of the activities of the existing renewable energy sector and, to a lesser extent, planned investments (especially employment rates). They identify direct economic impacts, ignoring cross-sectoral linkages referred to as indirect impacts.
The input–output method and CGE general equilibrium models (the so-called top-down approach) refer to supralocal studies. In the case of the input–output model, this is the regional and national level. CGE models are also used at the supranational level. On the other hand, they are not suitable for local research due to the low precision of the results. These methods are generally based on publicly available statistical data. They are applicable to studies of the activities of both the existing and the emerging renewable energy sector, in particular the CGE models. They cover a wider range of impacts, i.e., they are not limited to direct effects, but also examine the cross-sectoral link (indirect effect) and the impact of household spending (induced effect). They allow the study of renewable energy on the basis of a wide range of indicators. However, CGE models are more complex, and their use sometimes requires a multidisciplinary research team. The input–output method, on the other hand, is less complex. Calculations can be based on existing models or carried out using an Excel spreadsheet.
In order to assess the economic importance of offshore wind energy in Poland, the input–output method was chosen as it best meets the criteria of this study. It is also the most popular among researchers. It is based on the national intersectoral flow chart adapted to the regional dimension. It allows a comprehensive assessment of the importance of the offshore wind sector (direct, indirect and induced effects), allows research using a wide range of indicators, does not require an extensive set of statistical data as it only analyses the demand side of the economy, allows the study of both existing and emerging offshore wind energy sectors and finally, the calculation does not require access to specialised statistical models.
The input–output method, often referred to as the Leontief Model [
19,
27,
28], was used to determine the economic importance of offshore wind farms. It is one of the most widely used methods, allowing a comprehensive assessment of the offshore wind energy sector. This method distinguishes between direct, indirect and induced effects. The first effect is related to the activity of entities directly involved in the development of offshore wind farms. The indirect effect includes entities that are a source of supply for the wind energy sector. The source of the last effect is the consumption expenditure of households directly and indirectly related to offshore wind farm activities. The induced effect is sometimes referred to in the literature as the income multiplier type 2 [
17,
29]. With this, a secondary increase in demand can be estimated as a result of an increase in income. The above effects are discussed, taking into account the volume of employment and value added.
In the CAPEX phase, the direct effect on global value is the amount spent on the construction of offshore wind farms, which is calculated as follows:
where:
—global output generated by entities directly involved in the construction of offshore wind farms;
Y—spending on offshore wind farm construction, otherwise known as the final demand vector.
We create a direct effect for value added and employment by including a diagonal matrix in the model. Its diagonal is the coefficient of the share of value added and employment in the global value, i.e., as shown as by the following:
where:
—added value generated by entities directly involved in the construction of offshore wind farms;
—employment in entities directly involved in the construction of offshore wind farms;
—diagonal matrix of value added coefficients;
—diagonal matrix of employment coefficients.
To determine the indirect effect, a formula called the inverse of the Leontief matrix is used, expressed by the following formula:
where:
—output of the sourcing sectors for those directly involved in the construction of offshore wind farms;
I—unit matrix;
= —technical coefficients of intermediate consumption, where —flow from the i-th to the j-th branch.
Formula (4) allows you to determine the total effect, i.e., the sum of the direct effect and the indirect effect. To extract the indirect effect, subtract the value of the direct effect from the Leontief inverse matrix, viz., as follows:
We carry out the same steps for the indirect effect for value added and employment; namely, we subtract the value of the direct effect for value added and employment from the Leontief inverse matrix for value added and employment, as follows :
where:
—added value generated by the sourcing entities for those directly involved in the construction of offshore wind farms;
—employment in sourcing entities for entities directly involved in the construction of offshore wind farms.
The induced effect is determined from the basic input–output model formula by adding a row and column to the matrix. The elements in the row represent net income (wages) per unit of output. The column elements, on the other hand, represent household consumer spending. The induced effect represents the difference between the sum of the direct, indirect and induced effects and the direct and indirect effects, as follows:
where:
As with the indirect effect, we determine the induced effect for value added and employment by considering the diagonal matrix in the Leontief inverse matrix:
where:
In the OPEX phase, the direct effect is the value of energy produced (in the case of global value and value added) and the number of jobs required to produce a unit of energy (in the case of employment). In contrast, the method of estimating indirect and induced effects is the same as in the CAPEX phase.
3.3. Regionalisation of the National Input–Output Table
The use of the Leontief model is based on data contained in input–output tables published in Poland at 5-year intervals (the latest available version presents data for 2015) [
30]. The GUS in Poland publishes input–output tables at the national level, which necessitates their adaptation to the regional dimension. Regionalisation allows us to determine the self-sufficiency of the reference area and is the most challenging task related to the use of the Leontief model. Prior to regionalisation, the input–output table was aggregated from 98 to 19 divisions corresponding to the PKD 2007 section [
31]. The availability of statistical data at the regional level dictated the procedure for narrowing the table. In addition, too much disaggregation affects the complexity of the model, making it difficult to interpret the results.
Regionalisation of the national table was carried out based on Flegg’s location coefficient, expressed by the following formula [
32,
33,
34]:
where:
—Flegg location factor;
TRE—employment in the region’s economy (in all sectors);
TNE—employment in the national economy (in all sectors);
=
where:
—regional employment in the vendor sector;
—national employment in the selling sector;
—regional employment in the buying sector;
—national employment in the buying sector;
δ—delta parameter, whose value is in the interval (0 < δ < 1).
Location coefficients are most commonly used in the regionalisation of a national table, and among them, Flegg’s coefficient has the highest accuracy in determining the self-sufficiency of regions. The value of the critical parameter δ in the formula was adopted based on Flegg and Tohmo’s research for Finnish regions [
35]. As a result, the regression function for determining the value of the δ parameter was estimated as follows:
Using value added as the ‘R’ parameter, the value of the δ parameter for the West Pomeranian Voivodeship was estimated to be 0.2475, and for the Pomeranian Voivodeship, 0.2846.
4. Sources of Information
The tables presented above are presented separately for the construction phase (referred to in the literature as the CAPEX phase) and the operation phase (referred to in the literature as the OPEX phase) of offshore wind farms. The duration of the phases was taken from “Optimisation of the national offshore wind energy supply chain development in Poland” (“Optimisation”) [
4]. The CAPEX phase under Polish conditions lasts ten years and consists of a 7-year design, research and permitting period and a 3-year construction period. The OPEX phase, on the other hand, lasts 28 years and consists of a 25-year operation period and a 3-year decommissioning period.
Information on the regions’ demand for offshore wind energy (the knowledge needed to determine the global value and OPEX value added) was obtained from the Bank of Local Data [
36] and the update of the Energy Policy of Poland until 2040 [
22], with the assumption that energy production will be 24.82 TWh [
37] with a value per TWh of EUR 70.89 million, which is the maximum price for energy generated from offshore wind farms [
38]. Additionally, data on the level of unemployment in the country and the studied provinces were obtained from the LDB [
36].
The most essential element necessary to determine the economic importance of offshore wind farms is the construction of the final demand vector. It represents the direct effect of offshore wind farms and is the starting point for estimating indirect and induced effects. In the case of the CAPEX phase, the construction of the final demand vector requires obtaining information on the amount of capital expenditure and then mapping the data to the sections of the PKD. For this purpose, the study “Optimisation” [
4] was used again. According to the study, by 2030, the installed capacity of offshore wind farms will be 6.3 GW, with construction costs estimated at EUR 22.04 billion (
Table 3), or approximately EUR 3.33 billion–3.56 billion per 1 GW of capacity. The above figures coincide with the estimates of the power companies themselves and are in line with or higher than the construction costs of existing wind farms [
39,
40,
41].
The most critical item of capital expenditure is the design and manufacture of the turbine and complementary components EUR 17.52 billion, or 79.52%. Much less capital expenditure will be allocated to the installation and commissioning and project preparation and management, EUR 3.48 billion, or 15.78%, and EUR 1.04 billion, or 4.70%, respectively.
The next step in the construction of the final demand vector requires the separation of the national and regional supply chain according to the PKD 2007 section. In the case of the national chain, the study “Optimisation” [
4] was used. However, in the case of the regional chain, the study “Future of offshore wind energy in Poland” (“Future”) [
42] was used. The study lists the actors in the offshore wind energy sector. They were grouped by location, taking into account the dominant type of activity and revenues for the last financial year. Additionally, the results were confirmed by experts from the Polish Wind Energy Association.
Table 4 shows the distribution of investment outlays according to PKD section and reference area.
The data in the table show that the vast majority of funds will go to foreign entities, i.e., more than 83%. For domestic entities, the most considerable portion of the offshore wind energy sector is located outside the coastal provinces (8.62%). On the other hand, among the regions surveyed, the Pomeranian Voivodeship dominates, with a share of 6.00%. The West Pomeranian province has the smallest share at 2.28%.
The data in
Table 5 were used to create a national vector of final demand (
Table 4). At the national level, the value of the CAPEX phase is EUR 3724 million. In the case of the Pomeranian and West Pomeranian Voivodeships, the corresponding values are EUR 502 million and EUR 1322 million, respectively. For the PKD 2007 section, the dominant economic sectors are C-production of components for wind farms, F-construction, i.e., installation of foundations, turbines, cables, H-land and maritime logistics, M-obtaining permits, financial and insurance activities, and N-public administration activities.
For the OPEX phase, the construction of the demand vector requires a different procedure. First, it is necessary to determine the expected value of energy generated, i.e., the global value, which is the direct effect of offshore wind farms. As already mentioned, offshore wind farms with a capacity of 6.3 GW are expected to generate energy equal to 24.82 TWh, which, at a price of EUR 70.89 million per 1 TWh, would generate an annual production value of EUR 1760 million, or EUR 43.989 billion over 25 years. In turn, the value added is assumed on the basis of the national input–output table to be 43.71% of the global value, which means that 56.29% will be spent on intermediate consumption, i.e., the purchase of goods and services used in the production process. It means that over the 25-year lifetime of offshore wind farms, maintenance expenditures will amount to approximately EUR 24.762 billion. Thus, the shares of the OPEX and CAPEX phases in capital expenditure and operating costs are 47.09% and 52.91%, respectively. The importance of the CAPEX phase is slightly higher than in previous foreign studies. For example, according to the US EIA [
38], the share of the CAPAX phase is 39.83%, and according to the BVD [
39], it is 45.46%. In contrast, it is on a comparable level with the domestic study of 53.82% [
4]. Differences from foreign studies may be due to declining construction costs of offshore wind farms, the cost of preparing seaports for installation and service functions, the distance of ports from wind farms or the exchange rate.
The next step in building the demand vector is to determine the structure of expenditures. For this purpose, the “Optimisation” study [
4] was used again, as shown in
Table 6.
Relating the data in
Table 5 to monetary values, a demand vector for the OPEX phase is created, which is necessary to estimate the indirect and induced effects, as shown in
Table 7.
5. Results
Table 8,
Table 9,
Table 10,
Table 11,
Table 12 and
Table 13 provide data on the economic impact of offshore wind farms nationally and regionally. At the national level, offshore wind farms in the CAPEX phase will generate EUR 2793 million in global value (
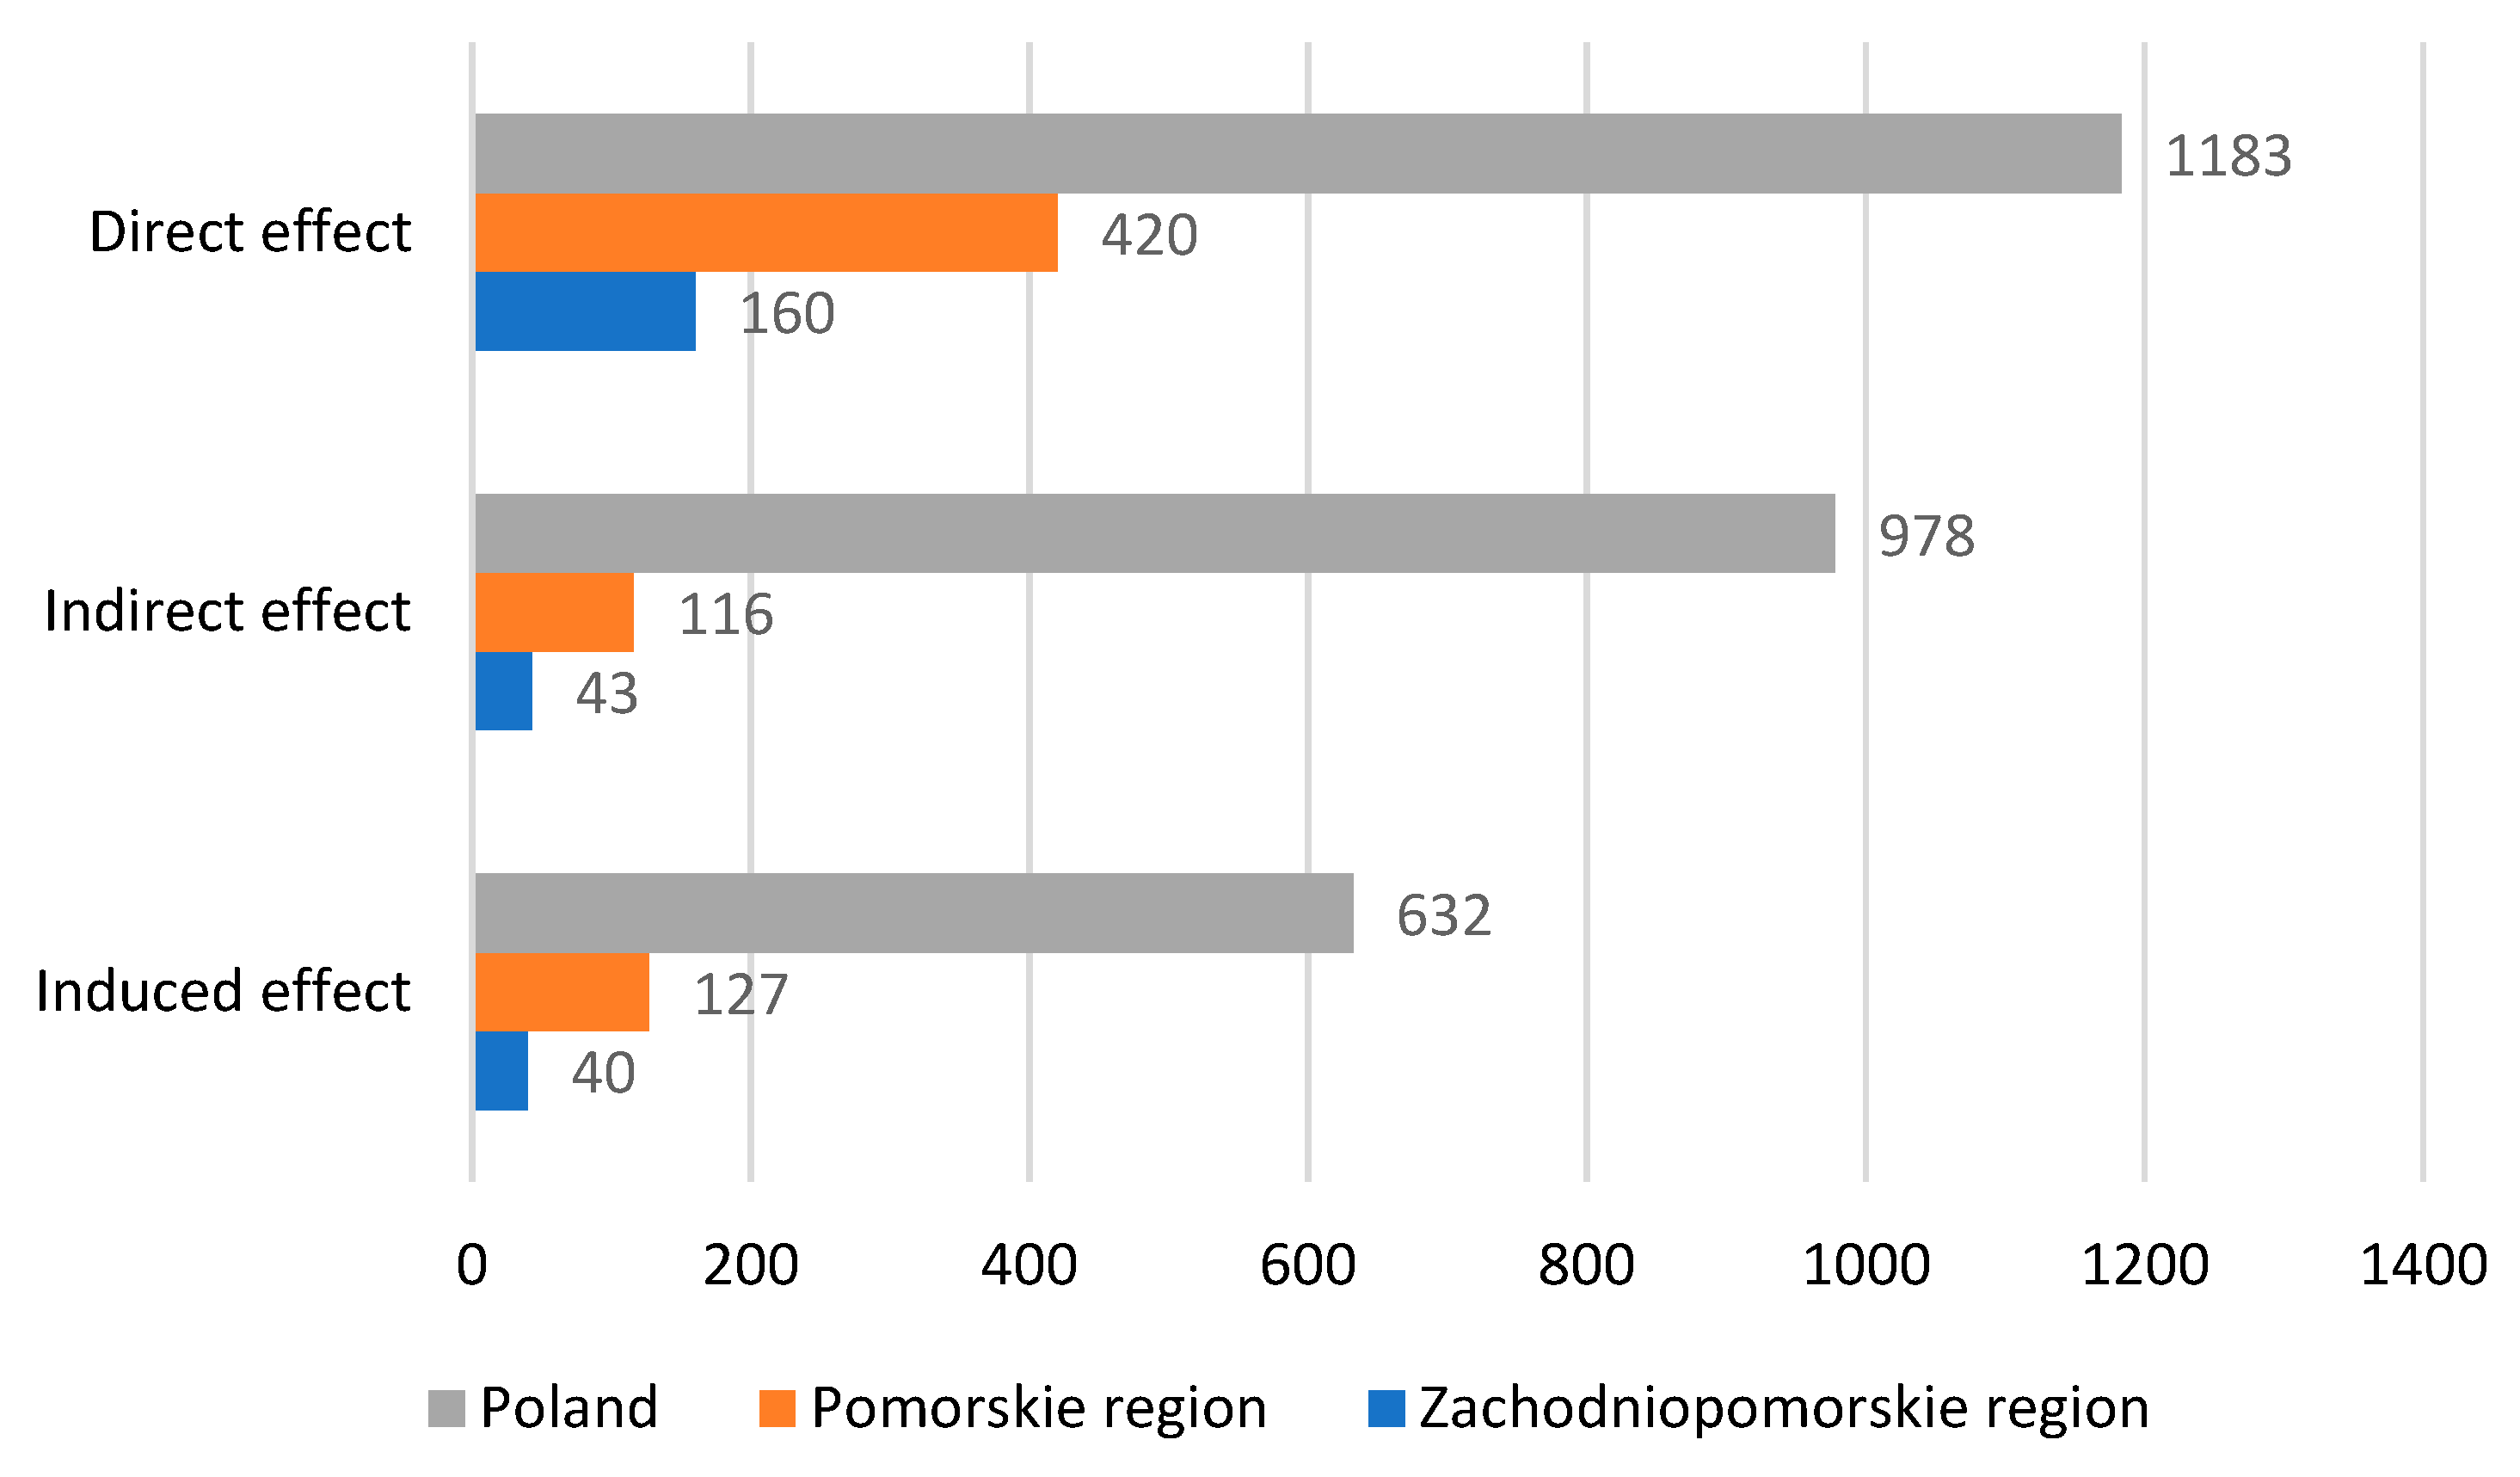
Table 8). On the other hand, at the regional level, EUR 243 million for the West Pomeranian Voivodeship and EUR 663 million for the Pomeranian Voivodeship will be generated. The varying magnitude of the global value is due to the share in the supply chain. At the country level, the direct effect dominates, followed by indirect (82.67% of the value of the direct effect) and induced (53.42% of the value of the direct effect) effects. At the regional level, the indirect and induced effects are relatively less significant (26.88% and 25.00% for the West Pomeranian Voivodeship and 27.62% and 30.24% for the Pomeranian Voivodeship, respectively), which is due to the lower self-sufficiency of coastal areas—the effect of regionalisation of the national input–output table. The MW ratio, the total value of economic effects to installed capacity, is highest at the national level and lower at the regional level due to participation in the supply chain.
In the OPEX phase, offshore wind farms will generate at the national level EUR 2106 million in global value, while at the regional level, EUR 223 million for the West Pomeranian Voivodeship and EUR 548 million for the Pomeranian Voivodeship (
Table 9). These volumes are slightly smaller than those in the CAPEX phase. The global value in the OPEX phase depends on energy demand (direct effect), participation in the supply chain and self-sufficiency of the reference area (indirect and induced effect). The factors mentioned above cause a much greater disparity between the economic effects of offshore wind farms and affect the MW ratio, which is slightly lower than in the CAPEX phase.
For employment, at the national level, the CAPEX phase will create an average of 26,323 jobs per year, and at the regional level, 1953 jobs will be created in the West Pomeranian Voivodeship and 5804 in the Pomeranian Voivodeship (
Table 10). The volume of employment depends primarily on the global value. However, indirect and induced effects are slightly more critical, both at the national and regional levels. It means that those directly involved in the activities of offshore wind farms are characterised by lower labour intensity of activities. The value of the MW indicator depends on participation in the supply chain.
The volume of employment in the OPEX phase is much smaller than that in the CAPEX phase, amounting to 4790 at the country level and 558 and 751 at the regional level, respectively (
Table 11).
The difference is not reflected in the global value in the OPEX phase. In addition, economic sectors in the OPEX phase are characterised by higher labour intensity. On the other hand, the main reason for lower employment is the way employment is calculated in sectors directly related to offshore wind farm activities, namely, on the basis of a factor of 0.4 jobs per MW of capacity. For this reason, indirect and induced effects dominate among the effects, and the MW ratio is much lower than in the CAPEX phase.
The average annual value added in the CAPEX phase at the national level is EUR 1221 million, while the regional value added is EUR 106 million for the West Pomeranian Voivodeship and EUR 290 million for the Pomeranian Voivodeship (
Table 12). The added value depends primarily on the global value and is approximately 43%. With this, the differences between the effects and the national and regional benchmarks are minor. Additionally, the MW indicator is proportional to the global value.
A similar situation as in the CAPEX phase takes place in the OPEX phase, i.e., the value added is strictly dependent on the global value and is approximately 43% (
Table 13). Hence, the MW ratio is also comparable to the CAPEX phase.
6. Discussion
Table 14,
Table 15,
Table 16,
Table 17,
Table 18 and
Table 19 summarise the effects of offshore wind farms at the level of countries (Poland and France) and regions (West Pomeranian and Pomeranian Voivodeships and Brittany region). In the case of the global value in the CAPEX phase, the value of the three considered economic effects is higher in Poland than in France (
Table 14), which is due to the installed capacity (6300 MW in Poland and 500 MW in France). However, on a per-MW basis, the value of the indicator is much higher in France (2.70) than in Poland (0.44), which is related to the share of players in national supply chains (16.90% in Poland and 100% in France). It shows that France has a much higher production potential than Poland. Among the effects, the most important in Poland is direct, followed by indirect (82.67% of the direct effect) and induced (53.42% of the direct effect). In France, on the other hand, the induced effect is dominant (104.73 of the direct effect), followed by the direct and indirect effects (85.81% of the direct effect). The much lower importance of the induced effect in Poland may indicate a lower level of remuneration. Indirect effects are at a similar level but slightly lower in Poland, which may reflect weaker ties to the domestic economy.
At the regional level, the value of the three effects is lower in the case of West Pomeranian Voivodeship and higher in the case of Pomeranian Voivodeship than in the Brittany region (
Table 14). The value of the MW indicator is much lower for Polish regions, which is related to the small share in the local supply chain (2.28% for West Pomeranian Province, 6.00% for Pomeranian Province, and as much as 60% for Brittany region). For the correlations between the effects, the slightly higher values of the indirect effect in the case of West Pomeranian Province (26.88%) and Pomeranian Province (30.24%) may indicate the greater self-sufficiency of Polish regions. On the other hand, the lower values for the induced effect have a lower level of remuneration.
For the OPEX phase, at the country level, the value of economic effects is much higher in Poland than in France, which is due to the larger installed capacity (
Table 15). On the other hand, the MW index is lower for Poland (0.33) than in France (0.47). This is due to the higher values of indirect (57.76%) and induced (49.14%) effects in France, which is, in turn, related to the share in the supply chain of 100%. In the case of Poland, the values of indirect and induced effects are much lower—10.28% and 9.38%, respectively. As already mentioned, the direct effect is the value of energy produced, which is used 100% domestically, while the share of actors in the supply chain is only 24.65%. Hence, such significant disparities in economic effects exist between countries. In addition, calculating the energy produced raises the value of the direct effect in Poland. This is due to the higher production of energy (3.94 TWh/1 GW versus 3.75 TWh/1 GW in France) and its higher price (70.89 million EUR/1 TWh versus France’s 66.50 million EUR/1 TWh).
At the regional level (
Table 15), the MW index is much lower for the West Pomeranian (0.04) and Pomeranian (0.09) Provinces than for the Brittany region (0.32). It results from the size of installed capacity and the regions’ energy demand, factors which affect the value of the direct effect. Energy production from the Saint-Brieuc wind farm will be used entirely in the Brittany region (hence the identical global value at the national and regional levels).
On the other hand, the West Pomeranian Province’s demand for offshore wind energy by 2030 will be approximately 2.59 TWh, and for the Pomeranian Province, approximately 7.00 TWh (our own calculations taking into account the increase in energy demand and changes in the energy balance of the West Pomeranian and Pomeranian Provinces). This is 10.44% and 28.20% of the estimated energy production from offshore wind farms, respectively. For Polish regions, indirect and induced effects are also less critical. This is dictated by the smaller share in the supply chain, which is 5.98% for West Pomeranian Voivodeship and 8.23% for Pomeranian Voivodeship.
With offshore wind farms in the CAPEX phase, more jobs will be created in Poland than in France, and this applies to all economic effects, as indicated by the size of the installed capacity and the labour intensity of the economy (
Table 16). The volume of employment per unit of global value, i.e., the index indicating the labour intensity of the economy, is higher in Poland (9.42) than in France (7.05). However, while in the case of the direct effect, the index is at a similar level, i.e., 7.96 in Poland and 7.20 in France, it is much higher in Poland in the case of the indirect and induced effects. It amounts to 11.16 and 9.48 compared to 7.20 and 6.93 in France. It can be seen from the above values that the indirect effect and induced effect are more important for the domestic labour market in Poland. The MW index is much higher in France (19.05) than in Poland (4.18) as a consequence of the share of actors in the supply chain (16.90% in Poland and 100% in France).
We can also see the higher labour intensity of the economy for Polish regions. The labour-intensity index for West Pomeranian Voivodeship is 8.04, Pomeranian Voivodeship is 8.75, and the Brittany region is 6.82 (
Table 16). For the effects, as at the level of countries, indirect and induced effects dominate in the Polish regions. The labour intensity index for the West Pomeranian region is 9.93 and 9.13, that for the Pomeranian region is 10.22 and 8.95, respectively, and that for the Brittany region is 6.76 and 6.64. The MW index is highest in the Brittany region due to its 60% share in the supply chain.
The volume of employment in the OPEX phase in sectors directly related to offshore wind farms reduces the assumed ratio of 0.4 jobs per MW of capacity (
Table 17). For example, for such an assumption, the employment in Poland will be 621 jobs, and in France, it will be 200. If one were to assume the size of employment on the basis of the input–output table, employment in Poland should be approximately 2370 jobs, and in France, approximately 820, which is about four times more. The adoption of the employment indicator results in the dominance of indirect and induced effects, which are 395% and 271% of the direct effect in Poland and 179% and 225% in France. The relatively greater importance of the indirect and induced effects in Poland is also due to the labour-intensive nature of the economic sectors associated with the activities of offshore wind farms. In the case of the indirect effect, there are 13.56 jobs per EUR 1 million of output, and in the case of the induced effect, there are 10.39, while in France, the corresponding values are 5.33 and 7.88. The MW indicator is much higher in France than in Poland, which, as has already been emphasised many times, is due to the participation of domestic players in the supply chain.
At the regional level, the size of employment also reduces the adopted employment rate (
Table 17). Direct employment in the Brittany region is 200 people—the same as at the national level—because all entities involved in offshore wind farms are located in the coastal region. In the case of Polish regions, the corresponding percentages of entities are only 5.98% and 8.23%, which reduces the importance of the direct effect. In the Polish regions, the greater importance of indirect and induced effects is related to the labour intensity of the economy. There are 12.79 and 9.12 jobs per unit of global value in West Pomeranian and Pomeranian Voivodeships, respectively, and 5.88 and 6.07 in the Brittany region. At the country level, the MW ratio is much higher for the Brittany region due to the larger share of entities in the regional supply chain.
Value added at the country level in the CAPEX phase is higher in Poland than in France as a consequence of the higher global value (
Table 18).
In general, the importance of value added in Poland is higher (43.83% of global value) than that in France (37.38% of global value). For individual effects, the importance of direct and induced effects is higher in Poland. They amounted to 43.70% and 43.83% of the global value, respectively, while in France, they were 40.65% and 27.72%. Of note is the particularly low significance of the induced effect in France, which contradicts the level of wages in the country. In contrast, the importance of the indirect effect is slightly higher in France (45.36%) than in Poland (43.66%). The MW ratio is many times higher in France as a consequence of its more significant participation in the supply chain.
At the regional level, the importance of the global value in the CAPEX phase is similar (
Table 18). In the case of the West Pomeranian region, it is 43.62%, the Pomeranian region is 43.74% and the Brittany region is 43.21%. However, in terms of individual effects, there are significant discrepancies in the case of the Brittany region. The direct effect is the least significant at 39.93%, followed by the indirect effect at 44.12% and the induced effect at 52.08%. It is not easy to interpret such varied results. In contrast, the MW rate is much higher in the Brittany region, which, as has been repeatedly pointed out, is due to its more significant participation in the supply chain.
Additionally, for the OPEX phase, value added is higher in Poland than in France due to the higher global value. In contrast, the importance of value added is higher for France (49.79%) than for Poland (43.73%) (
Table 19). This is partly due to the methodology for determining the added value for the direct effect. The Saint-Brieuc offshore wind farm’s added value was determined based on the sector’s past performance at 50% of the global value. In contrast, for Polish wind farms, the added value was assumed on the basis of the input–output table at 43.71% of the global value. Additionally, the added value for the induced effect is more significant for France (59.65% versus 43.65% for Poland), which the higher level of remuneration can explain. Only the added value for the indirect effect is more significant for offshore wind farms in Poland (43.65%) than for France (40.30%). The MW ratio is obviously higher for France due to its participation in the supply chain.
Similar correlations at the country level are found at the regional level (
Table 19 and
Figure 1). The importance of added value is greater in the Brittany region, with significant variations between the effects. Induced and direct effects dominate, and indirect effects are of lesser importance. In the case of the Polish regions, the values of the effects are at a fairly even level, and the added value has greater importance only in the case of the indirect effect. Additionally, the MW index is higher for the Brittany region.
7. The Future of Offshore Wind Energy in Poland
The offshore wind energy sector can provide a developmental impetus for the country, especially for coastal regions. Efforts should be made to get offshore wind farms up and running as soon as possible and to maximise the participation of domestic players in the supply chain. The current domestic potential of offshore wind energy is estimated at 20–25%, with the prospect of its growth predicted to be 45–50% in 2030, then 55–60% in 2040, and ultimately 60–65% in 2050, using the total capacity of Polish maritime areas. Will forecasts for offshore wind energy development come true? Experience to date may raise doubts. What are the reasons behind the delays in the development of offshore wind energy? Among the most important, we can include the lack of installation and service ports, administrative procedures and the limitations in the capacity of the transmission network in the northern part of the country [
3,
43].
To date, existing seaports in Poland have not been prepared for the installation and servicing of offshore wind farms, which risks investors choosing foreign ports, such as the ports of Rønne (in Denmark) and Sassnitz-Mukran (in Germany), and thus involving entities from neighbouring countries in the supply chain. It should be noted that while in the case of installation ports, the distance from offshore wind farms is not that important, in the case of servicing, location is a crucial factor affecting both the cost and efficiency of offshore wind farm operations. Despite the 20-year history of offshore wind development, it is only in 2021 that the locations of installation and servicing ports have been identified. These ports are Gdansk and Swinoujscie for installation ports and Ustka, Leba, Wladyslawowo, Kolobrzeg and Darlowo for service ports. Currently, the source of funding for port investments has become a problem. Funds for ports were guaranteed in the National Reconstruction Plan (NRP), the document that forms the basis for applying for funds from the European Instrument for Reconstruction and Increasing Resilience. By the summer of 2023, the funds had not been released, and all indications are that Poland will not receive them. However, alternative sources of port financing have not been identified, which, with the prospect of launching the first wind farms in 2026, raises the risk that investors will choose foreign ports.
The second reason for delays in the development of offshore wind power is administrative issues. In general, there was a dispersion of administrative procedures—the lack of the “one-stop shop” principle, as is the case in other European countries—frequent delays in issuing administrative decisions, an excessive number of needed permits and a lack of unambiguous criteria for evaluating submitted applications. A consequence of the above-described difficulties was the extension of the pre-investment period to seven years. Two critical documents for offshore wind energy, i.e., the Polish Energy Policy (PEP) 2040 and the “Law on Promoting Electricity Generation in Offshore Wind Farms” (Offshore Law), were not adopted until 2021. The former (enacted 7 to 10 years late) gave priority weight to offshore wind energy, which is part of the implementation of the European Green Deal, i.e., a strategy aimed at achieving climate neutrality for the EU by 2050. Unfortunately, the Act’s provisions were not accompanied by implementing legislation clarifying offshore wind energy development. In contrast, the Offshore Act made the administrative process less cumbersome but did not eliminate all barriers to offshore wind development. Nevertheless, it was a “milestone” step for the energy industry. The law includes a list of instruments to stimulate the development of the local supply chain, provides generators with opportunities to apply for the right to cover negative balances and adapts the auction system to the specifics of offshore wind energy.
The third problem considered to be limiting the development of offshore wind power is the capacity of the power grid. The national system operator has often issued adverse decisions to connect offshore wind energy extraction facilities to the transmission grid. The main reason was the limited absorption of energy by the power grid in the northern part of the country. Moreover, the national grid operator did not include offshore wind development in its investment plans due to the uncertainty associated with it, i.e., regarding the planned capacity, location and timing of offshore wind farms. Only the prioritisation of offshore wind energy development contained in strategic documents, i.e., the Offshore Law and PEP 2040, influenced the investment plans of the national grid operator. As a result, in 2019–2021, the national operator issued connection conditions for an additional eight projects with a total capacity of 6.8 GW.
Realising Poland’s offshore wind energy potential requires urgent systemic action. As already mentioned, the two most important key pieces of legislation have recognised offshore wind energy development as crucial to the country’s future energy balance but have not solved all of the industry’s problems. For infrastructure, Polish seaports have reserves of land for the construction of installation and service terminals. Their managers express their willingness to cooperate in the development of offshore wind energy. Even detailed port expansion plans have already been created, as is the case of the port of Ustka [
44,
45]. However, in the absence of NIP funds, alternative sources of financing for port investments should be identified. It is an even more urgent task, given the time-consuming nature of the investment process and the prospect of commissioning the first wind farms planned for 2026. In the case of issuing the necessary permits, administrative processes for applicants should be ceded on a one-stop-shop basis to a single organisational unit, such as the Ministry of Climate and Environment. This is especially important in the case of location decisions, cable laying permits or environmental decisions. The number of statutory administrative burdens for applicants needs to be reduced, such as the requirement to prepare a geological work project. The acceleration of the decision-making process should be seen in the timely issuance of administrative decisions and in the clarification of unambiguous criteria for evaluating applications submitted. With regard to the last problem, efforts should be made to expand the transmission grid so that it can accommodate energy from more offshore wind farms being commissioned in the future.
8. Conclusions
This article examines the economic aspects of offshore wind farm operations, including direct, indirect and induced effects. The above effects were discussed considering the global value, employment volume and added value.
Determining the share of actors in the supply chain at the level of the provinces surveyed was often of an estimative nature. This was due to the difficulty in identifying the potential of the offshore wind energy sector and the diversified activity profile of the companies themselves.
Regionalisation of the national input–output table was performed on the basis of the Flegg location factor, which, although the most accurate, may not be appropriate for Polish regions. This is especially the case when estimating the value of the delta parameter.
One location was chosen for the comparative analysis. One of the reasons for this choice was the use of a similar research methodology. Extending the research to a larger number of sites would certainly enrich the knowledge of the economic aspects of offshore wind farm activities.
At the national level, offshore wind farms in the CAPEX phase can generate EUR 2793 million in global value on average per year. Meanwhile, at the regional level, EUR 243 million for the West Pomeranian Voivodeship and EUR 663 million for the Pomeranian Voivodeship. In the OPEX phase, the corresponding values are slightly lower, amounting to EUR 2106 million at the national level and EUR 223 million and EUR 663 million at the regional level. The global value generated depends on the share of players in the supply chain, which in the CAPEX phase is 17.90% at the country level and 2.28% and 6.00% at the regional level. In the OPEX phase, the global value is 24.65%, 5.98% and 8.23%, respectively.
Offshore wind farms can create an average of 26,323 jobs at the country level in the CAPEX phase and 1953 and 5804 jobs at the regional level. The volume of employment in the OPEX phase is smaller and can be 4790 jobs at the country level and 558 and 751 jobs at the regional level. In the CAPEX phase, the volume of employment depends primarily on and is a multiple of the global value. In the OPEX phase, on the other hand, it also depends on an employment factor of 0.4 jobs per 1 MW.
The average annual value added in the CAPEX phase at the national level is EUR 1.221 million, while at the regional level, it is EUR 106 million and EUR 290 million. In the OPEX phase, the corresponding figures are EUR 920 million, EUR 97 million and EUR 239 million. The added value represents approximately 43% of the global value.
In the CAPEX phase, at the country level, the indirect and induced effects are of greater importance to the global value in the case of the Saint-Brieuc offshore wind farm, which may reflect stronger ties to the national economy and higher wage levels in France. In contrast, at the regional level, the importance of the indirect effect is higher, and the induced effect is lower in the Polish provinces. In the OPEX phase, the disparity between the effects at the country level is even more significant due to the share in the supply chain and the value of energy produced. The above factors reduce the importance of indirect and induced effects in Poland. We are dealing with a similar situation at the level of Polish regions.
The Polish offshore wind energy sector in the CAPEX phase at both the national and regional levels is characterised by a higher labour intensity of operations. This is especially true for indirect and induced effects. In the case of the direct effect, labour intensity is at a similar level. On the other hand, in the OPEX phase, the volume of employment decreases, as does the adopted employment coefficient. Based on the input–output table, the employment volume would be four times higher. As in the CAPEX phase, the indirect and induced effects dominate in the OPEX phase due to the higher labour intensity of the economy.
The importance of value added in the OPEX phase at the country level is higher in Poland than in France. In contrast, between regions, it is at a similar level. At the same time, the economic effects of the Saint-Brieuc offshore wind farm show greater disparity. In France, the direct and induced effects are less critical, and the indirect effect is slightly higher. In contrast to the country, in the Brittany region, the induced effect dominates. In the OPEX phase, the importance of added value is more remarkable for the Saint-Brieuc offshore wind farm, both at the national and regional levels, which may be due to the methodology adopted. In the case of France, its value was determined on the basis of the sector’s past performance at 50% of the global value. For Polish wind farms, on the other hand, the added value was assumed on the basis of the input–output table at 43.71% of the global value. At the same time, direct and induced effects are more important for French offshore wind farms. Poland’s offshore wind energy potential is estimated at 33 GW, with a domestic supply chain of 60–65%. To take advantage of the opportunity for offshore wind energy, the barriers that limit its development must be overcome. Urgent intervention is required to redevelop the country’s seaports so that they can serve as installation and maintenance facilities for offshore wind farms. Simplification of the administrative process and expansion of onshore energy infrastructure to receive the power generated by offshore wind farms is called for.
The development of offshore wind energy in Poland is significantly behind schedule. Ambitious plans to achieve planned capacity and local participation in the supply chain are at risk. This research has provided data on the size of employment and global and value added (including the size of tax revenues, wages and profits). These factors can influence the decisions of policy makers and renewable energy stakeholders to increase their efforts to develop offshore wind energy. In subsequent studies, it is also worth analysing the involvement of actors in the local supply chain. Research in this area may shed light on the reasons why actors are not sufficiently involved in the development of offshore wind energy. It should be considered that the development of offshore wind energy will contribute to the modernisation of small seaports, which will become service ports. It is important to consider how this will affect the local community. For some residents, the expansion and change in the activity profile of seaports may conflict with the development of the tourist functions of coastal towns.


