1. Introduction
The advancement of renewable energy technologies demonstrates a spectrum of specialization and diversification among nations striving for global carbon neutrality. The rise of anti-fossil fuel norms (AFFNs) is increasingly shaping national agendas, influencing international specialization, guiding policy initiatives, and fostering new climate governance in line with the Paris Agreement [
1,
2].
Simultaneously, coal energy usage must be subjected to deep analysis before it is cut off, and a precautionary approach based on national resources, land usage, and environmental policies must be considered [
3]. Another perspective on coal mining is given by Blondeel and Van de Graaf [
4], who consider that the argument of pollution is insufficient to convince prominent actors not to use coal for energy production, as the technologies for producing these types of energy are clean.
We evaluate the expansion of green knowledge in renewable energy across both related and unrelated fields from a long-term viewpoint. The patent generation within a specific technological realm, in this case, renewable energy, across nations (irrespective of their developmental stage) from 1995 to 2019 offers insights into innovation capacities. The predominant global approach towards renewable energy is diversification, shaped by energy demands and the nature of energy sources. Although policy frameworks like the Green Deal, carbon neutrality, the Paris Agreement, and Agenda 2030 [
5] emphasize and drive the importance of sustainability and the creation of green knowledge in renewable energy, there has been a continuous decline in these efforts since 2011. This highlights the sluggish growth of markets and the limited knowledge transfer from patent generation to tangible production, often attributed to the steep research costs. Studies in renewable energy remain predominantly centralized, and the diffusion and uptake of these technologies are limited and slow paced. Sung and Wen’s research [
6] on a 19-country sample concluded that public awareness, market magnitude, and governmental directives were pivotal in driving technology exports.
According to their government’s declaration, Iceland leads in renewable energy utilization, sourcing 85% of its total energy from renewables (65% geothermal and 20% hydro energy) [
7]. Many nations aspire to replicate Iceland’s approach but must account for natural resources and technological advancements. Benediktsson [
8] examined the Icelandic energy paradigm to explore energy transitions through the lens of varying perspectives. He posited that such changes are not solely reliant on natural resources but are intricately tied to historical, societal, and technological contexts. Drawing from the concept of ‘sociotechnical imaginaries’ presented by Jasanoff and Kim [
9] during their examination of nuclear energy in the USA and Korea, Benediktsson [
8] deduced that effective energy transition plans must integrate social, technological, and environmental aspects. Further, Jasanoff and Kim [
9] highlighted the emphasis on “national development” in backing nuclear energy, a sentiment echoed by Lee and Mogi [
10] in their scrutiny of energy technology and impending shifts towards renewables grounded in research and innovation. Such case analyses bolster our assertion that a geospatial evaluation of the patent landscape and renewable energy production can provide a roadmap for countries to transition to renewable energy, considering both natural and technological facets.
Studies on budding renewable energy sources [
11,
12] emphasize that while many are yet to achieve commercial viability, they arere rapidly expanding and face market entry challenges. To progressively supplant traditional energy forms, these sources require supportive measures. It is recognized that the high costs of novel technologies can impede their adoption. Policies, such as incentives, tax breaks, and grants, can facilitate the uptake of renewable energy technologies [
13]. The journey from conventional to innovative technologies involves initially innovating and patenting renewable energy technologies, followed by their commercialization and application. The onset of this transition is marked by technological innovation and development. Subsequently, depending on regional characteristics, this is achieved by means of knowledge dissemination through avenues like testing, market introduction, or collaborative ventures [
14].
Viewing innovation as the driving force of progress, this study seeks to delve into the patent market in the field of renewable energy production, to discern patterns of national specialization and their spatial distribution. Such insights will shed light on the potential pathways towards renewable energy, ensuring that countries harness their natural and technological advantages.
The unique approach of this research lies in its two-step examination of specialization patterns in the progression of renewable energy generation technologies (SPD-REGT) across countries. Firstly, it delves into the patent market by employing the Herfindahl–Hirschman Index to discern specialization or diversification trends. Secondly, it groups national, global, and EU patterns to emphasize policy and strategic planning variances. This is complemented by mapping these clusters to provide a geographical viewpoint of the renewable energy generation technology landscape.
2. Literature Review
2.1. Economic Growth and Renewable Energy
The increasing trend of socioeconomic growth and well-being is anchored in energy consumption, predominantly in the use of fossil fuels. Yet, these conventional fossil fuels have environmental consequences, driving global urgency towards adopting cleaner energy alternatives. Owusu and Asumadu-Sarkodie [
15] put forth a comprehensive renewable energy model. Their research emphasizes the benefits of renewable energy technologies and their associated challenges, advocating for international collaboration to facilitate this energy transition.
Economic progress is closely tied to energy consumption, especially to the shift towards green energy [
16,
17]. Over the past two decades, the price of renewable energy technologies relative to that of those based on fossil fuels has consistently declined [
18]. This reduction could be attributed to a surge in technical innovations (patents), enhanced knowledge transfer, or societal demand. Despite this, public enthusiasm for renewable energy technologies has remained subdued [
19], resulting in renewables making up just a quarter of total energy consumption. Promoting renewable energy through societal transformation [
20] can pave the way for broader acceptance and deployment of emerging technologies. In Greece, challenges like limited financial resources, insufficient grid capacity, regulatory constraints, and local resistance have been pinpointed as barriers [
21].
Cheng et al. [
22] analyzed BRICS nations and found that while foreign direct investment and renewable energy adoption lead to reduced CO
2 emissions, factors like GDP per capita, exports, domestic private sector credit, and environmental patents elevate emissions. A holistic view is essential for balanced economic growth and effective energy source integration.
2.2. Innovation and Renewable Energy
Countries renowned for their energy efficiency, like Scandinavian countries and Canada, showcase the best innovations. Green innovation encompasses advancements linked to eco-friendly products and processes that reduce fossil fuel consumption, facilitate pollution control, promote waste recycling, influence product design, and bolster environmental management [
23]. Harnessing satellite data and statistical figures, Bódis et al. [
24] projected the EU’s potential solar energy output, approximating it to be 24.4% of present consumption. This hints at a growing pivot towards green energy and the possibility of reduced household electricity costs. Ekins and Zenghelis [
25] contended that preemptively adopting clean technologies before ramping up energy consumption is far more cost-efficient than relying on non-renewable energy sources and grappling with the aftermath. They also stressed the significance of strategic resource management in influencing energy production, consumption, and innovation trends. Proposals for cost-effective investment models tailored to bolster renewable development across varied countries have been put forward [
26,
27].
Peszko et al. in a World Bank Group’s study [
28] emphasized that transitioning to a low-carbon economy and embracing new renewable energy sources are priorities for countries, irrespective of their level of development. This makes a compelling case for the adoption of green technologies and the encouragement of innovative solutions.
In their research, Haščič and Migotto [
29] examined three distinct metrics: the advancement of over 80 specific environmental technologies, international partnerships in technological development, and the proliferation of such technologies. These metrics provide frameworks to assess innovations’ efficacy and national policy approaches. The trajectory of these technologies has been scrutinized in the context of sustainable renewable energy development [
30].
2.3. Patent Market
Patents offer a comprehensive blend of qualitative details and quantitative metrics that showcase the evolution of technology. With the advent of online patent databases, accessing this wealth of information has become straightforward and instantaneous, serving as a valuable tool for researchers in academia and industry. Over time, numerous methods to gauge innovation using patent data have been put forth in scholarly works [
31,
32,
33].
Patent outputs reveal potential innovative specializations. While Germany’s patent activity in battery storage, hydrogen, and bioenergy is lower than countries like Japan, China, and the US, it is similar in batteries and hydrogen. Bioenergy, however, presents different outcomes based on country comparisons and patent counts [
34]. A more comprehensive context is recommended to gauge technology trends, as not all patents lead to actual production or commercialization.
National models already exist that aim for a 100% reliance on renewable energy [
35]. Introducing a new patent to the market can alter these models, enhancing cost-effectiveness.
Using patent data has merits, including its accessibility, quantitative nature, result-oriented perspective, and value in environmental and energy assessments [
36]. However, it is worth noting since not all innovations are patented, and not every patent reveals details about its significance or impact.
Emerging renewable energy technologies often hinge on resources like wind, solar, marine, and thermal energy, in addition to innovations in storage and transportation [
17]. Deploying these renewable energy technologies is seen as a remedy, and if not viewed holistically, it might risk the system’s sustainability [
12,
37]. The essence of energy management in microgrids underscores the necessity for a comprehensive approach encompassing production, storage, distribution, and usage [
37,
38,
39].
To enhance the applicability of patent statistics, Haščič, Silva, and Johnstone [
40] employed indicators grounded in a series of patents. They also delved into the unique aspects of patent databases, suggesting strategies to counteract potential biases in cross-country evaluations.
2.4. Diversification or Specialization
Noailly and Smeets [
41] analyzed many fossil fuel and renewable energy companies. Their findings point out that the innovation disparity arises from niche renewable energy firms entering the market and mixed companies bolstering the fossil fuel industry and its technologies. Their conclusion emphasized the importance of public policies targeting small, specialized renewable energy businesses to foster innovation and expedite long-term transformation.
The study of De Rosa et al. [
42] investigates Europe’s energy supply diversification over the past decade, focusing on the EU’s import dependence, market concentration, and renewable energy deployment. Using indicators, we assessed fuel mix diversity, market stability, geopolitical risks, renewable energy proportions, and more at individual and aggregated European scales. Results indicate consistent fuel mix diversity and modest market concentration. Furthermore, there’s a rising trend in renewable electricity production, influenced by the EU’s decarbonization efforts, though variations exist among member states.
To promote energy diversification, Dyatlov et al. [
43] explore avenues and potential for leveraging alternative energy sources and enhancing their development. Statistical data reveal that despite adopting alternative fuels like hydrogen, biofuel, solar, wind, and tidal energy, there has not been a substantial reduction in the demand for traditional energy sources such as oil and gas [
43].
Energy diversification, crucial for security and sustainability, remains under-researched. Using the Energy Mix Concentration Index (a refined Herfindahl–Hirschman Index), Akrofi [
44] studied energy patterns in Africa’s top economies from 2000 to 2017. Findings revealed slow energy diversification and a trend leaning towards multi-fuel use. The energy type influenced diversification; a weak correlation existed between GDP growth and diversification. Policy makers are urged to invest in renewables and diversify their sources for sustainable energy transitions.
2.5. Country Pattern and Spatial Distribution
The significance of geographical factors in renewable energy innovation has been underscored [
45], with local and global knowledge playing pivotal roles in the innovation journey. International knowledge spillover enables low- and medium-income nations to tap into these markets. Noailly and Shestalova [
46] examined the diffusion trends of renewable energy technologies across 18 European nations, noting that wind technology tends to increase more within a country’s region. In contrast, storage and solar technologies have broader impacts.
Using patent records from 63 nations spanning 1971–2012, Perruchas et al. [
47] conducted a time and location-based study on innovations in green technology and identified critical factors. Their findings suggest that a country’s engagement in green technology advancement is more linked to their pre-existing expertise. The country’s developmental stage is secondary to the progress in their green technology or the extent of climate change threats they face.
Shifting to renewable energy sources reshapes the global perspective of relations and dependencies and economic, behavioral, social, and geopolitical perspectives [
48]. In the long run, technological innovations and patents for renewable energy production, storage, distribution, and consumption have become the most valuable assets [
48], and they have determined new country patterns and global rights.
There are concerns about the patterns and clusters for renewable energy and the variability of sources in terms of technical approach [
49,
50,
51]. These concerns confirm the idea of consistent changes in energy technology development. As such, this is driving the perspective of potential patterns at the country level in terms of their shift from fossil fuel energy to renewable energy sources and the path of carbon neutrality.
Our literature review shows that renewable energy is examined from multiple angles, including production, commercialization, patent creation, shifts in the energy mix, and markets for both fossil and renewable fuels. However, there seems to be a gap concerning studies on the country profile for SPD-REGT. To address this, we carried out a study spanning 134 countries to pinpoint the specialization profile and establish clusters on both global and European scales.
This study seeks to answer the research question: What are the distinct patterns of specialization in developing renewable energy generation technologies among different countries and their spatial distribution?
This study’s hypotheses are as follows:
Hypothesis 1 (H1). Countries have developed different patterns of green innovation for renewable energy to achieve carbon neutrality.
Hypothesis 2 (H2). Clusters of country profiles exist.
Hypothesis 3 (H3). Countries with the same or similar profiles are grouped geographically.
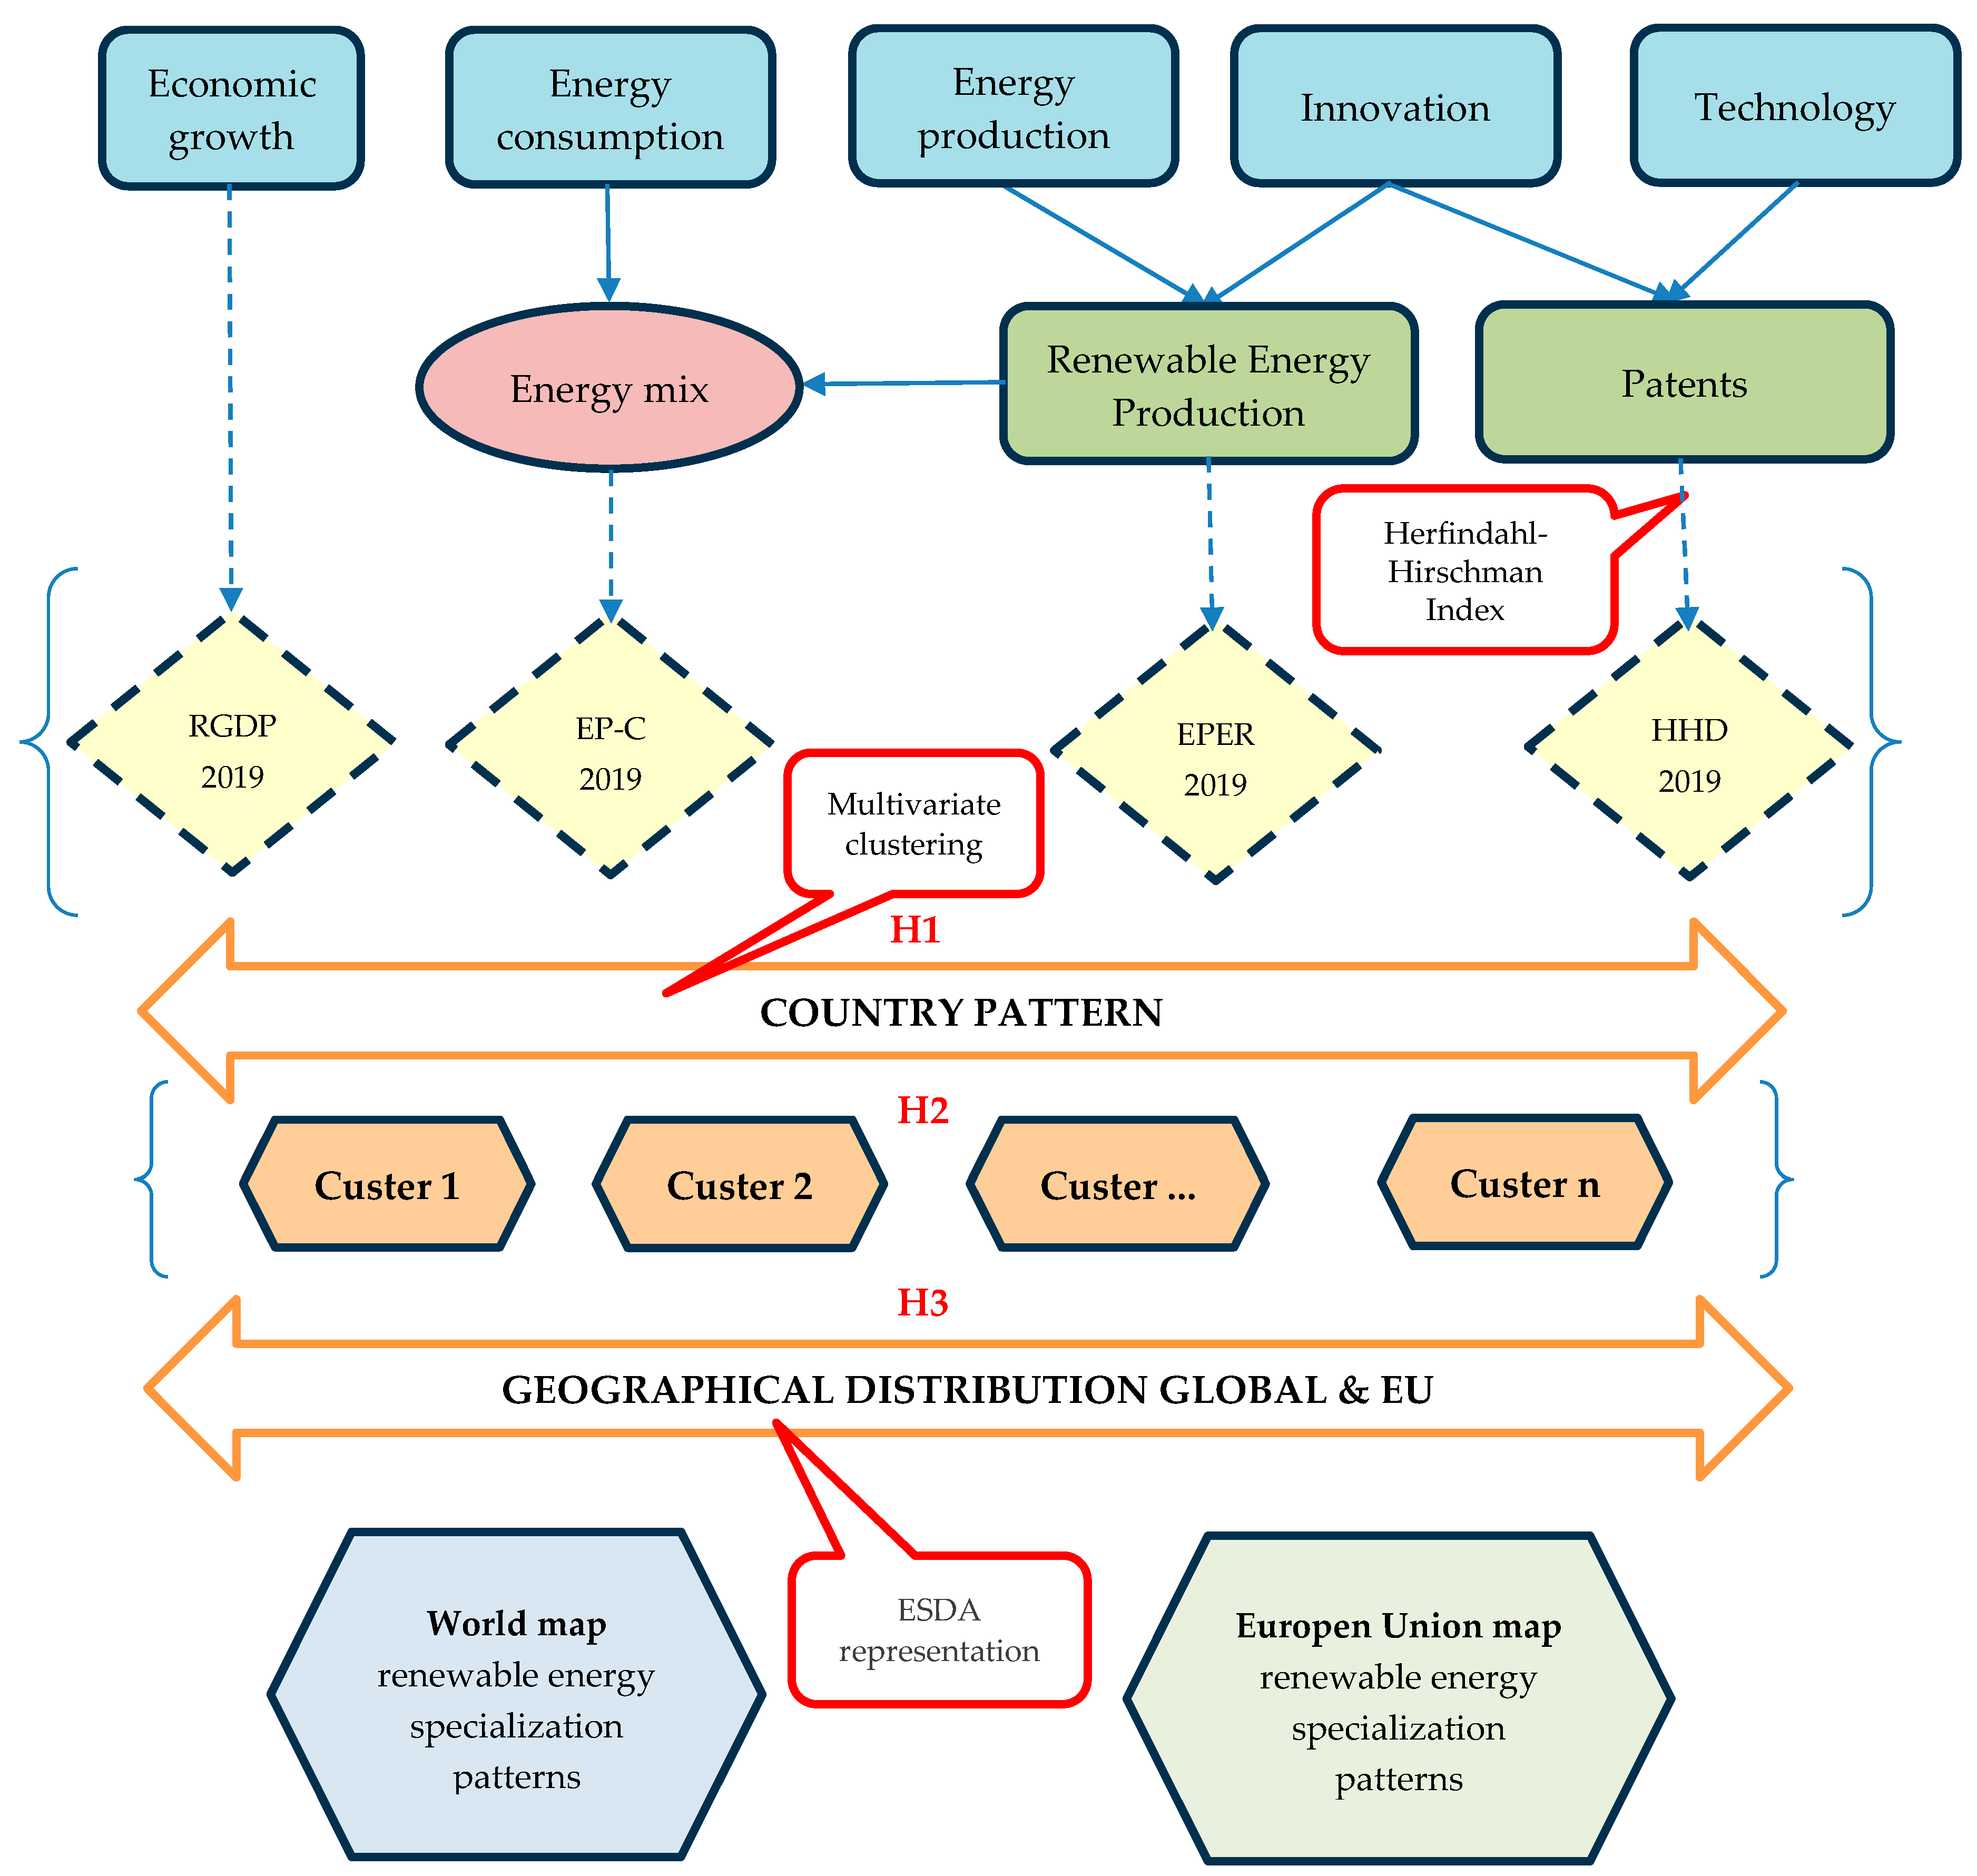
The theoretical and methodological framework of this study is presented in
Figure 1.
3. Materials and Methods
We hypothesized that all countries aim to achieve carbon neutrality by developing green innovations that rely on renewable energy production and consumption. Regarding renewable energy in 2019, we used the following four variables for the green innovation model:
- (a)
Green knowledge creation through patents for a renewable energy diversification model using Herfindahl–Hirschman Index (HHI) for renewable energy generation and Herfindahl–Hirschman Diversification (HHD) related to diversification;
- (b)
Green energy production as a share of total energy production;
- (c)
Consumption pattern of energy through variable energy efficiency utilization;
- (d)
The socioeconomic level of development is expressed through real GDP/capita.
3.1. Data
3.1.1. Level of Technology Development for Renewable Energy Generation
Innovation in environment-related technologies is estimated by considering the following variables: the number of patents and the respective countries’ fractional value. (Source OECD. Stat, Dataset: Technology development, family size, and more significant (all inventions)
https://stats.oecd.org/Index.aspx?DataSetCode=PAT_DEV# (accessed on 2 September 2022) [
52]).
The technology domains considered were as follows: climate change mitigation; climate change mitigation technologies related to energy generation, transmission, or distribution; renewable energy generation; wind energy; solar thermal energy; solar photovoltaic (PV) energy; solar thermal–PV hybrids; geothermal energy; marine energy, e.g., using wave energy or salinity gradient; and hydro energy. The time series considered was 1995–2019 for spatial coverage of 212 countries.
3.1.2. Renewable Energy Generation Technology Systems’ Characteristics
The period considered was 2019, and the spatial coverage was for 134 countries (with the data available).
The variables used for this study were as follows:
- (a)
EP_C2019 Energy productivity—Gross Domestic Product per unit of Total Primary Energy Supply (GDP per unit of TPES) (USD, 2015). Energy productivity is determined by measuring the GDP per TPES unit (USD/toe). This metric not only indicates efforts to enhance energy efficiency and diminish carbon and other atmospheric emissions but also captures influences from structural and climatic elements alongside energy intensity. Source: OECD Stat, Dataset: Green Growth Indicators,
https://stats.oecd.org/# (accessed on 2 September 2022).
- (b)
EPER2019 Renewable Energy productivity—Renewable electricity as a share of total electricity generation (%). Source: OECD Stat, Dataset: Green Growth Indicators,
https://stats.oecd.org/# (accessed on 2 September 2022).
- (c)
HHD2019—Patents market—HHD index related to diversification for renewable energy generation, calculated by the authors.
- (d)
RGDP2019—Economic Growth—Real GDP per capita (USD, 2015). Source: OECD Stat, Dataset: Green Growth Indicators,
https://stats.oecd.org/# (accessed on 2 September 2022).
3.2. Methodologies
3.2.1. Calculation of HHD-Related to Diversification for Renewable Energy Generation Using the Herfindahl–Hirschman Index
The Herfindahl–Hirschman Index (HDI) is an absolute measure of market concentration. It is mainly used to determine market competitiveness. As a simple index calculated based on the market share, it does not consider complexity and side effects but instead provides a realistic view. Specialization rates were calculated using Equations (1) and (2), in which the patents market was considered:
where
P is the total number of patents at the national level;
Pi is the patents number for country
i;
Pij is the total number of patents in industry
j for country
i;
Pj is the national employment or gross added value in industry
j, country
i, of n country number considered, or of the j industry of m number of sectors/industries; and
is the share of sector
j in the total value of country
i.
When a region or country
i specializes in a single sector or industry, the Herfindahl–Hirschman Diversification (HHD) index grows with the growing specialization genre up to the maximal limit of 1. The weak point of the HHD index is the inferior limit: the lowest level of concentration is 1/n, and this is reached when all regions have equal shares in sector
j, which is because the lowest specialization is given by 1/m when all sectors have the same share in the region
i [
53].
Another limitation of the HHD index is the bias of large regions and their influence on concentration and specialization. These regions hold larger shares and polarize the results, thus disadvantaging the smaller regions. Additionally, the fineness of the classification influences the outcome [
53]. Moreover, it is also used to determine market competitiveness as it better describes the diversification being sensitive to the geographic agglomeration. It was successfully used by Akrofi [
44] to determine the energy diversification for African countries.
We used the following notations:
- (a)
The Total Herfindahl–Hirschman Diversification Index (HHDTY) was calculated with Equation (3):
- (b)
The Herfindahl–Hirschman Diversification Index Related to Renewable energy generation (HHDRYi) was calculated using Equation (4):
- (c)
The Herfindahl–Hirschman Diversification Index Non-Related to Renewable energy generation (HHDNRYi) was calculated using Equation (5):
According to NIBUSINESS INFO.CO.UK [
54], more types of business diversification should be considered.
Horizontal diversification involves the development of new complementary products for core businesses. They address existing customers and require new technologies and marketing skills.
Concentric diversification requires adding new products based on the range and synergy between existing products and new customers.
Conglomerate diversification involves the addition of new products to existing businesses. It is characterized by high risk due to new market entry and a completely different target segment of customers.
Vertical diversification occurs when the development is performed downstream or upstream of the existing production–sell chain business. From our perspective, diversification in the energy sector is analyzed as total, related, and unrelated to renewable energy generation technologies.
3.2.2. Mapping Clusters by Renewable Energy Generation Technology Development—Specialization Patterns across Countries
We determined the specialization clusters for renewable energy generation technologies using multivariate clustering (a spatial statistics tool from ArcGIS Pro).
- (a)
The multivariate clustering tool ESRI ArcGIS Pro [
55] was used as a machine learning method to determine the natural clusters without prerequisite characteristics. This tool uses the K means algorithm and types of NP-hard values, which can maximize the similarities within the group and differences between groups.
- (b)
This model allowed us to determine the spatial patterns and better understand when and where renewable technology is developed and where the link in the renewable energy chain is specialized.
- (c)
It provides valuable input for any decision maker in business and those in public administration to design future development and market strategies or public policies.
- (d)
The algorithm used to calculate the number of clusters with the multivariate clustering tool was clustering effectiveness. This algorithm measures the clusters using the Calinski–Harabasz pseudo-F-statistic, the ratio between-cluster variance to within-cluster variance (Equation (6)). In other words, the percentage reflects the within- and between-group differences.
SST reflects the between-cluster differences:
SSE reflects the within-cluster similarities:
where
n is the number of features,
the number of features in cluster
i,
is the number of classes (clusters), and
is number of variables used to cluster the features.
represents the value of the
kth variable of the
jth feature in the
ith cluster,
the mean value of the
kth variable, and
the mean value of the
kth variable in cluster
i.
As a type of greedy algorithm, the K means algorithm always converges to a local minimum but does not always find the global (most optimal) minimum. The K means algorithm first identifies the seeds used to grow each cluster. The first seed was randomly selected and served as the base for the next source. Therefore, the number of seeds is equal to the number of clusters. The reallocation of each feature drives the mechanism to the cluster closer to stabilization (a maximum of 100 iterations).
We ran the multivariate clustering tool twice with the following outputs:
- (a)
A global map for the 134 countries.
- (b)
A detailed European Map for 33 countries.
4. Results
4.1. The Level of Development for Renewable Technologies
4.1.1. The Level of development for Renewable Technologies Is Understood by Looking at the Generation Source at the Global Level
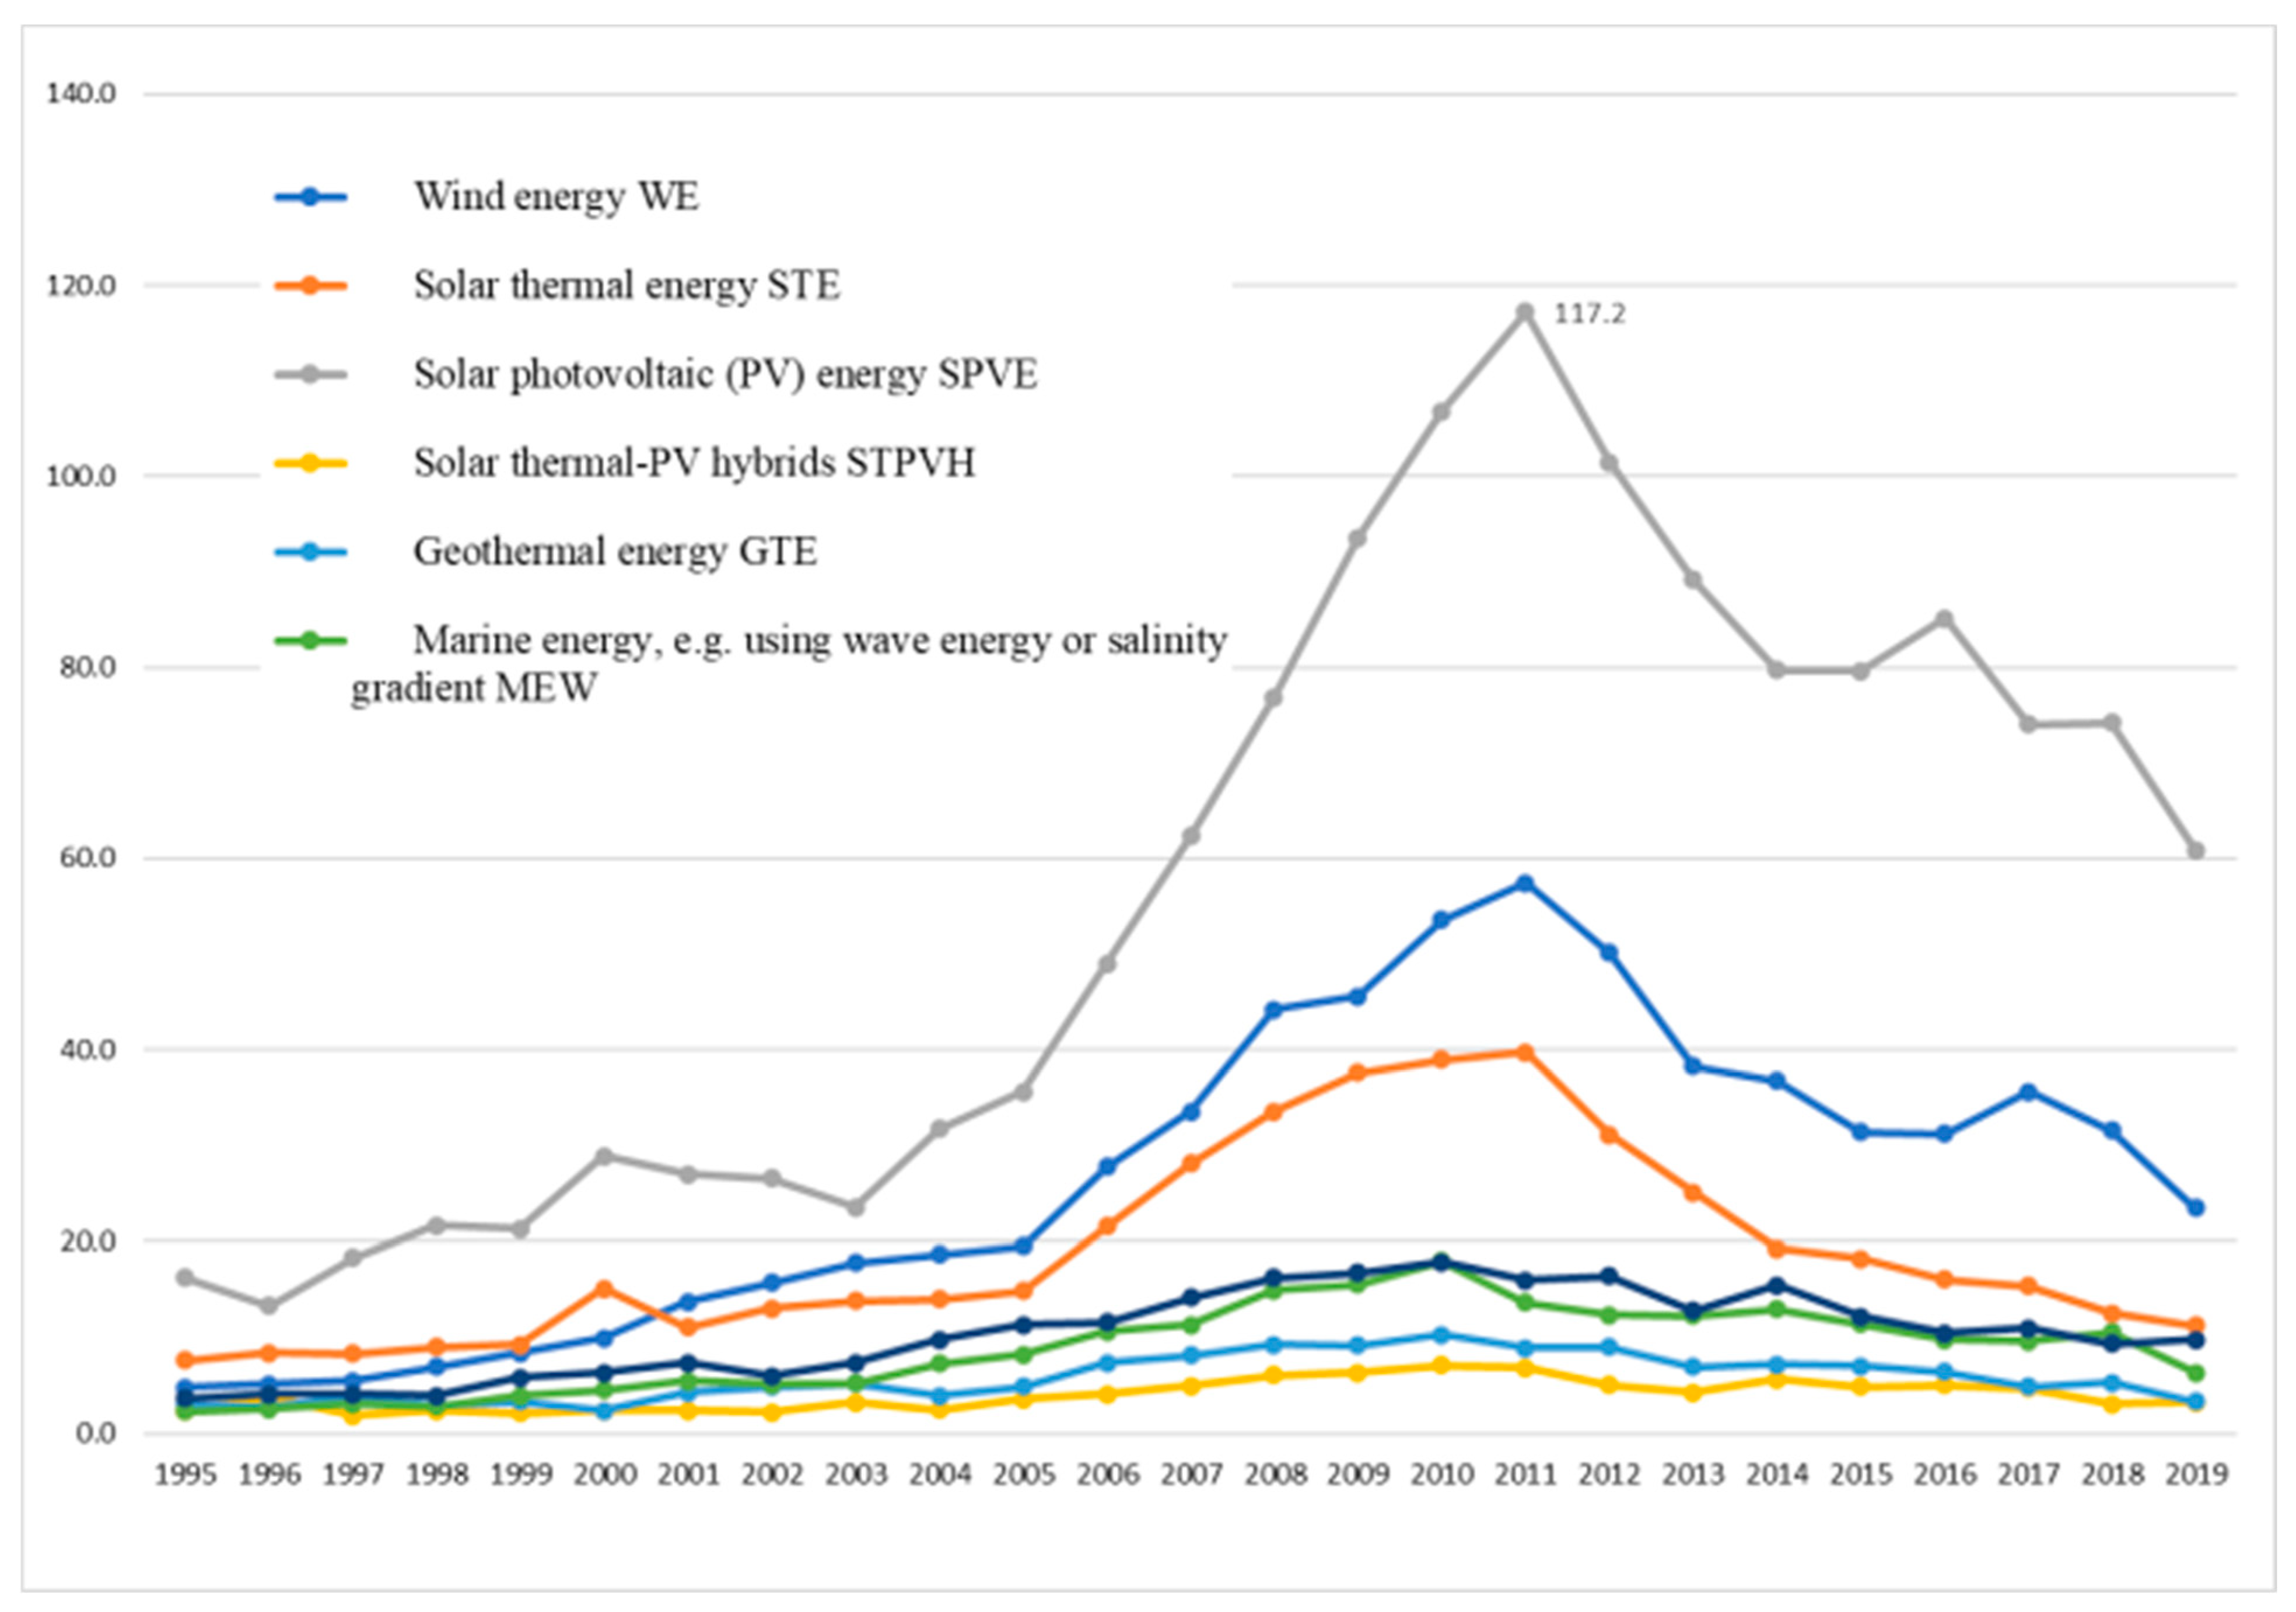
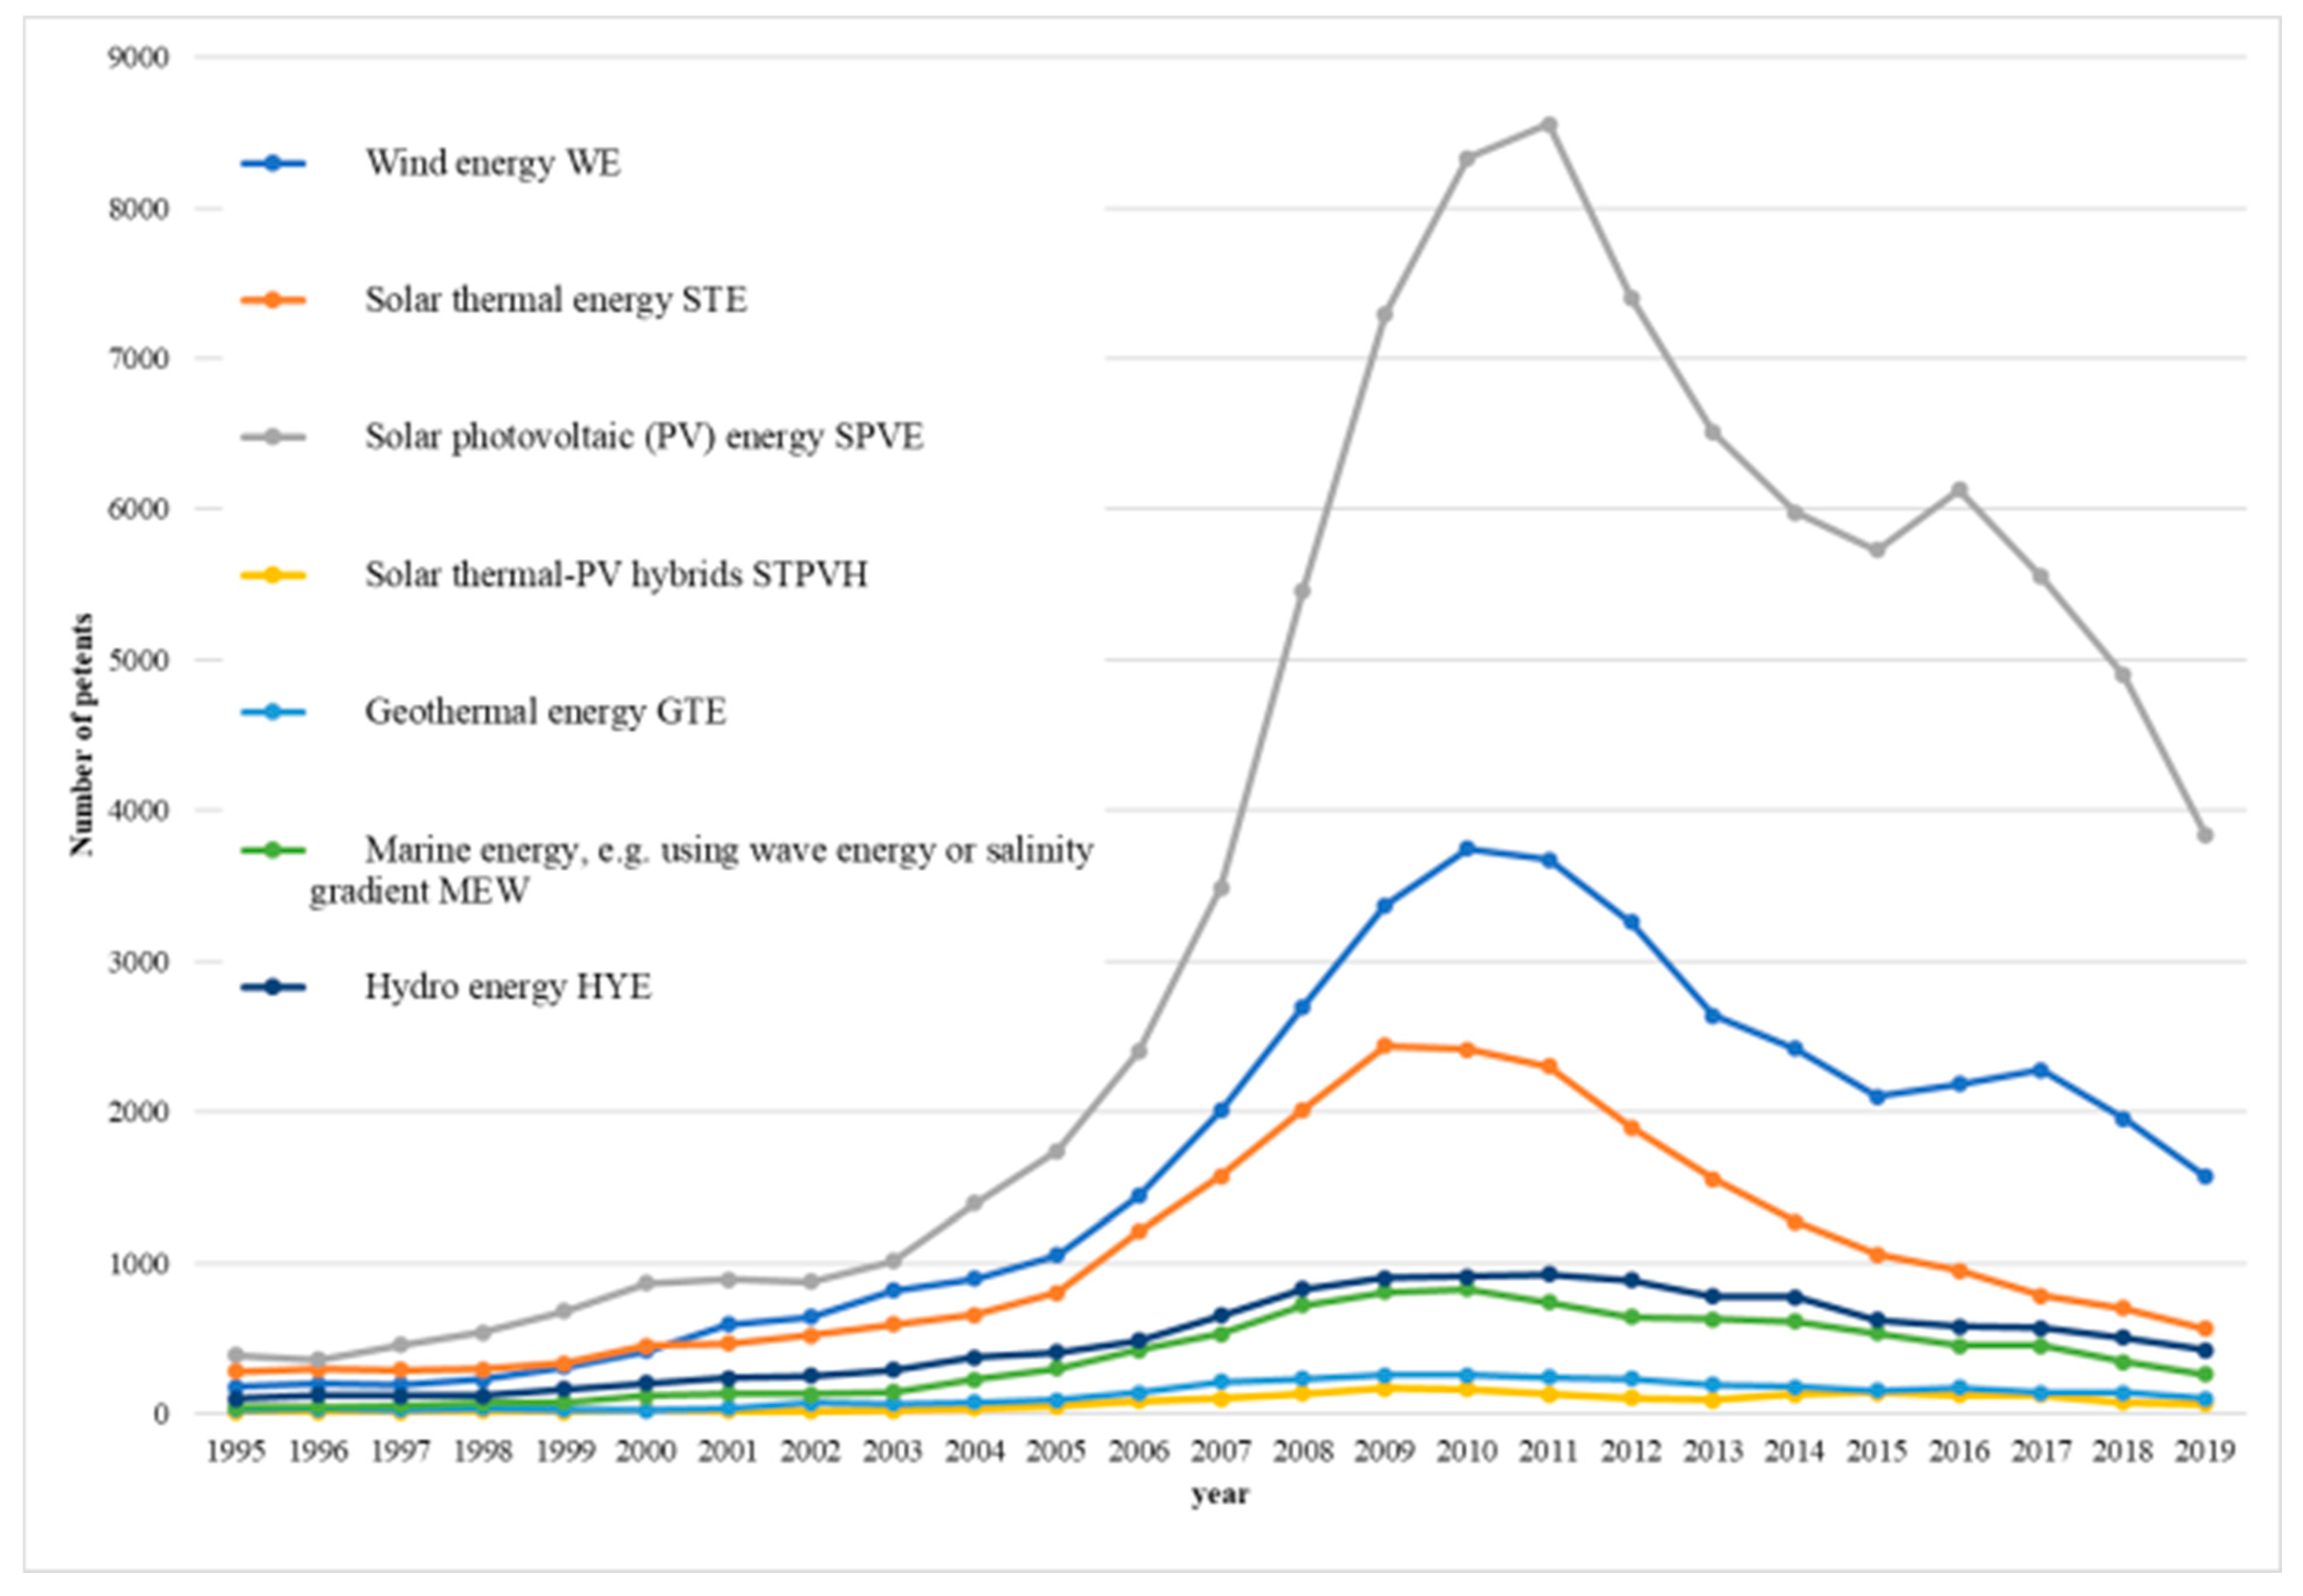
First, we evaluated the portfolio of patents for renewable energy generation technologies from 1995 to 2019 (
Figure 2).
The number of patterns for all types of renewable energy-generating technologies (hydro, marine, solar, and wind) stuck together until 2003 when a significant increase in the patterns for solar PV, wind, and solar thermal was recorded for the next eight years (2011). From 2011 to 2019, the pattern number decreased to 2003 for solar thermal power and approximately half the peak value for solar PV and wind.
A presumptive reason for this could be the shift of focus from innovation to the implementation/knowledge transfer practice of new technologies, which is most likely reflected in fund allocation.
4.1.2. The Protection Propensity of Renewable Energy Generation Technology Domains at the Global Level
Protection propensity is the share of patents in the total global patents by technology domain, of which we appreciate that this share better reflects specialization and trends (
Figure 3).
We calculated and represented the number of patents with country fractional values. The shapes and trends were the same, and they also showed that solar PV is the most attractive area, as 60% of the patterns were held by it.
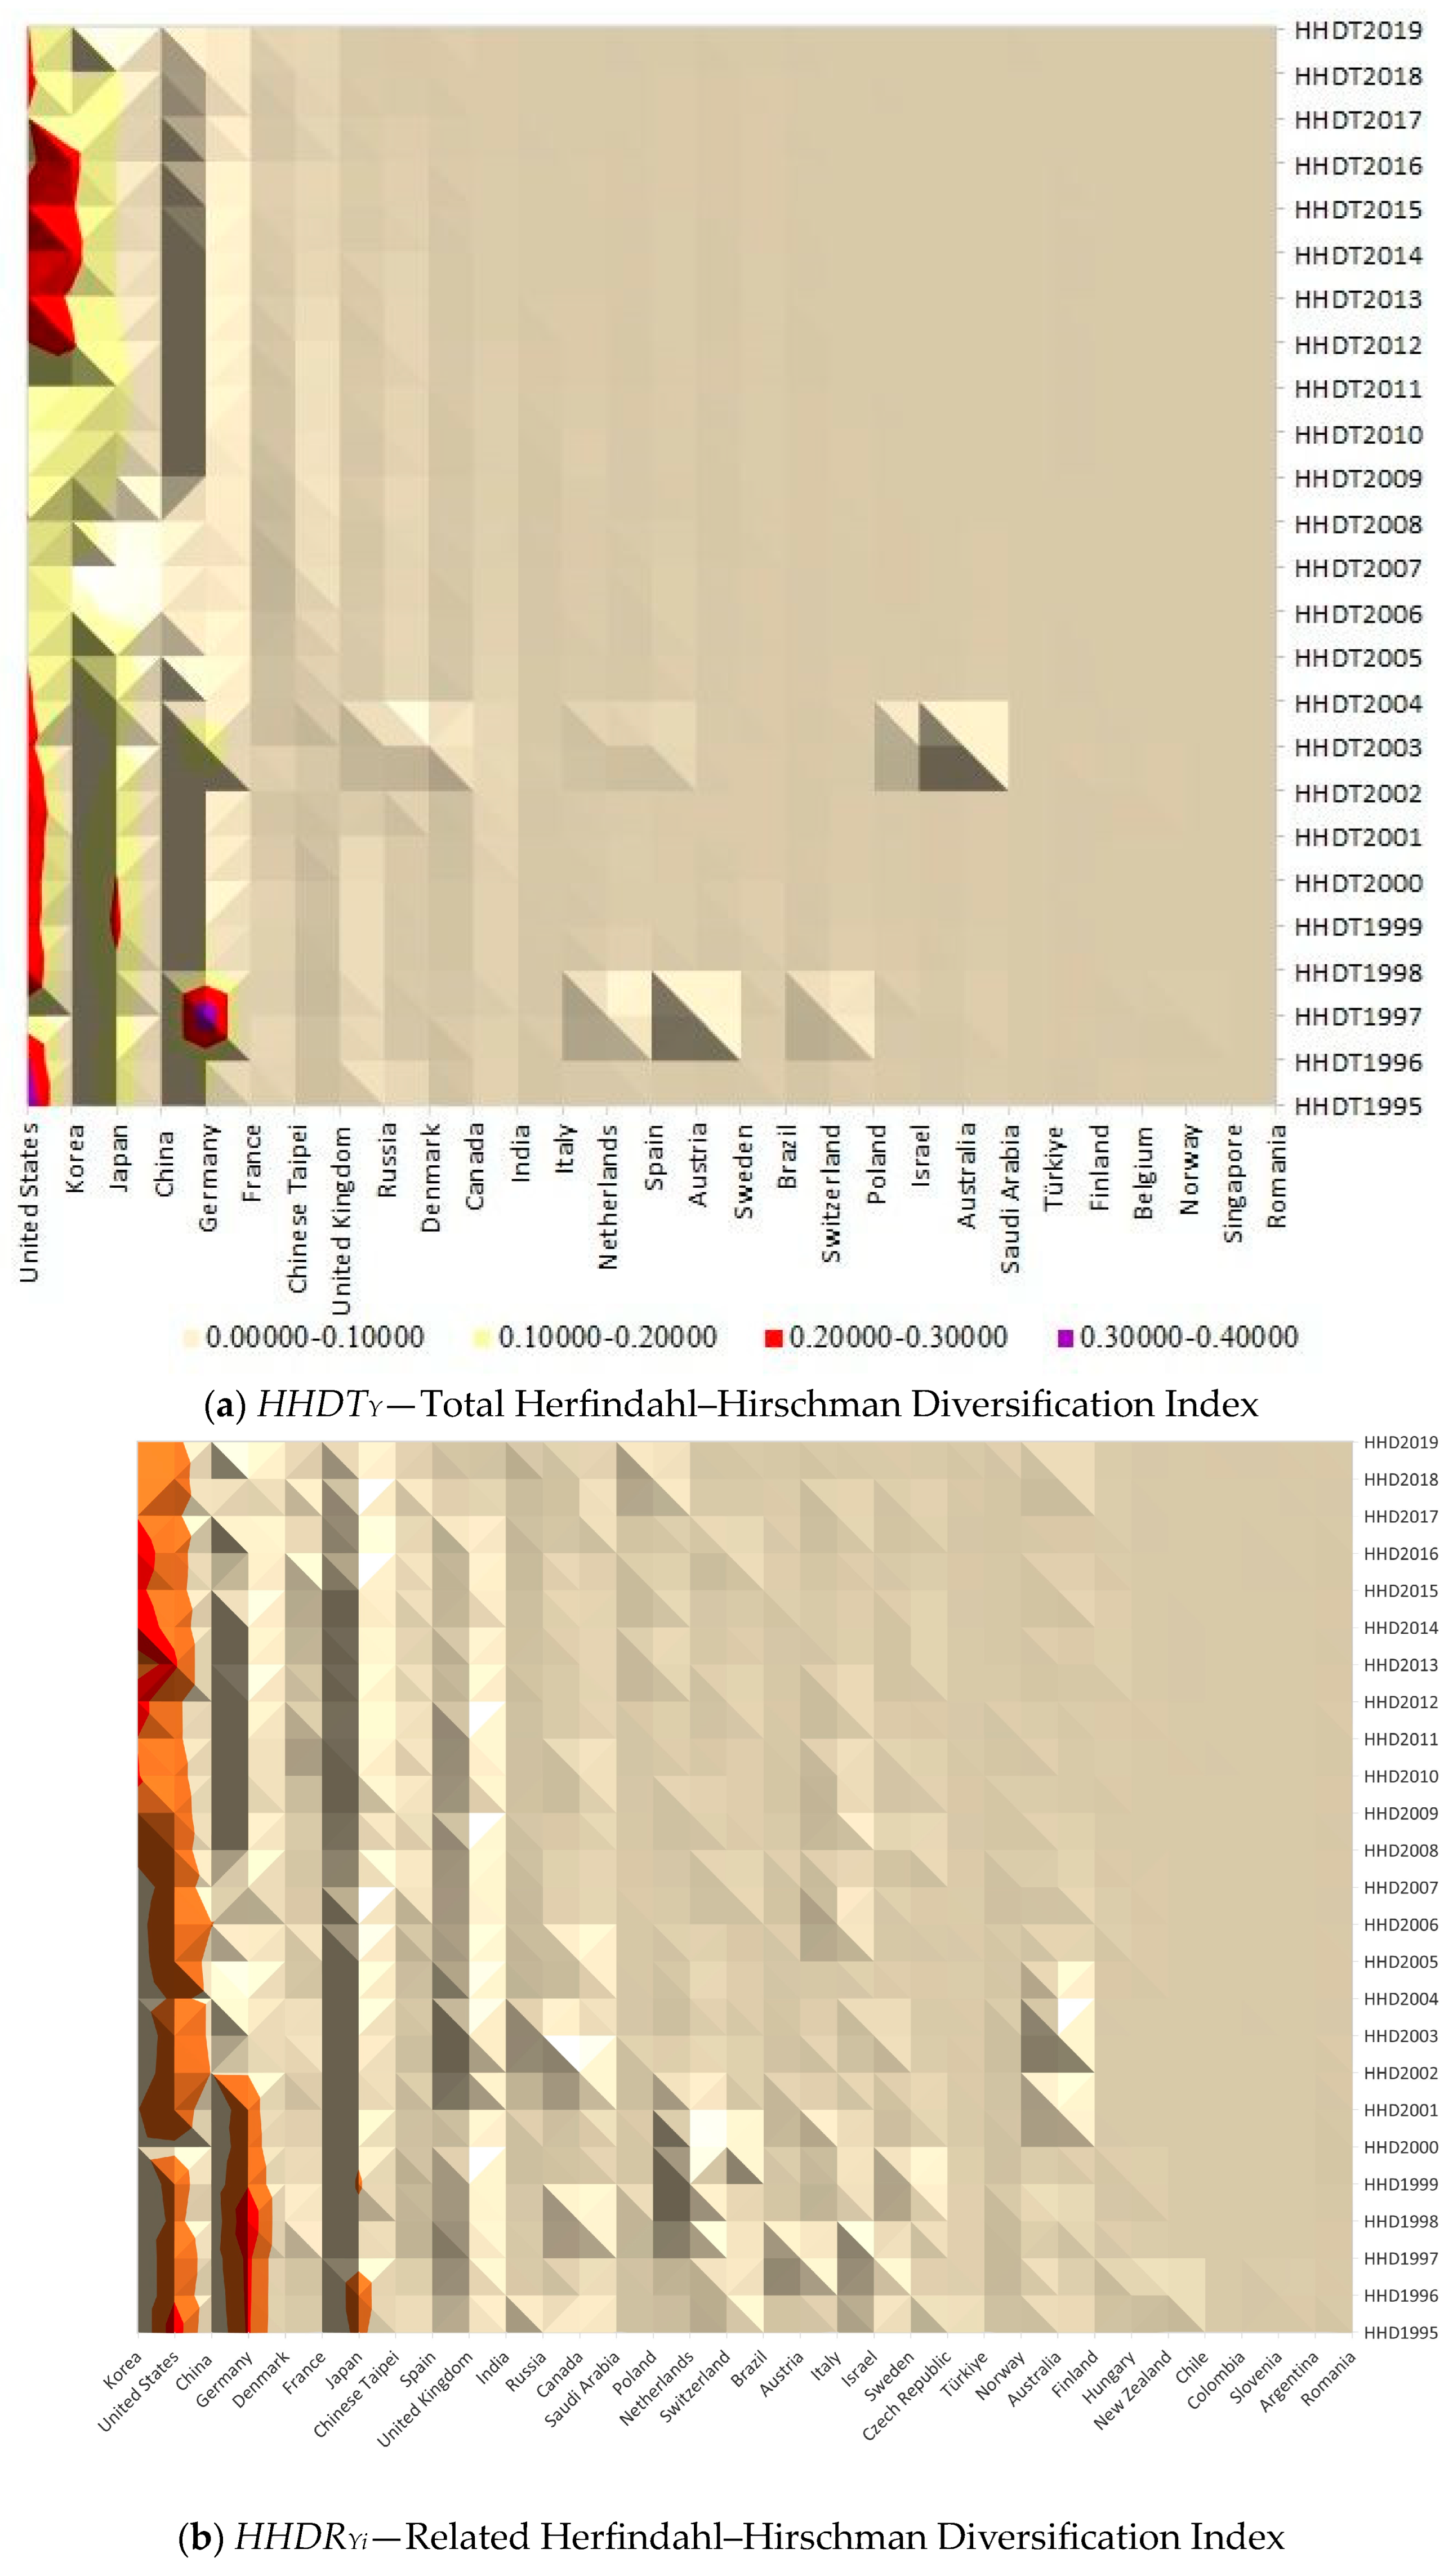
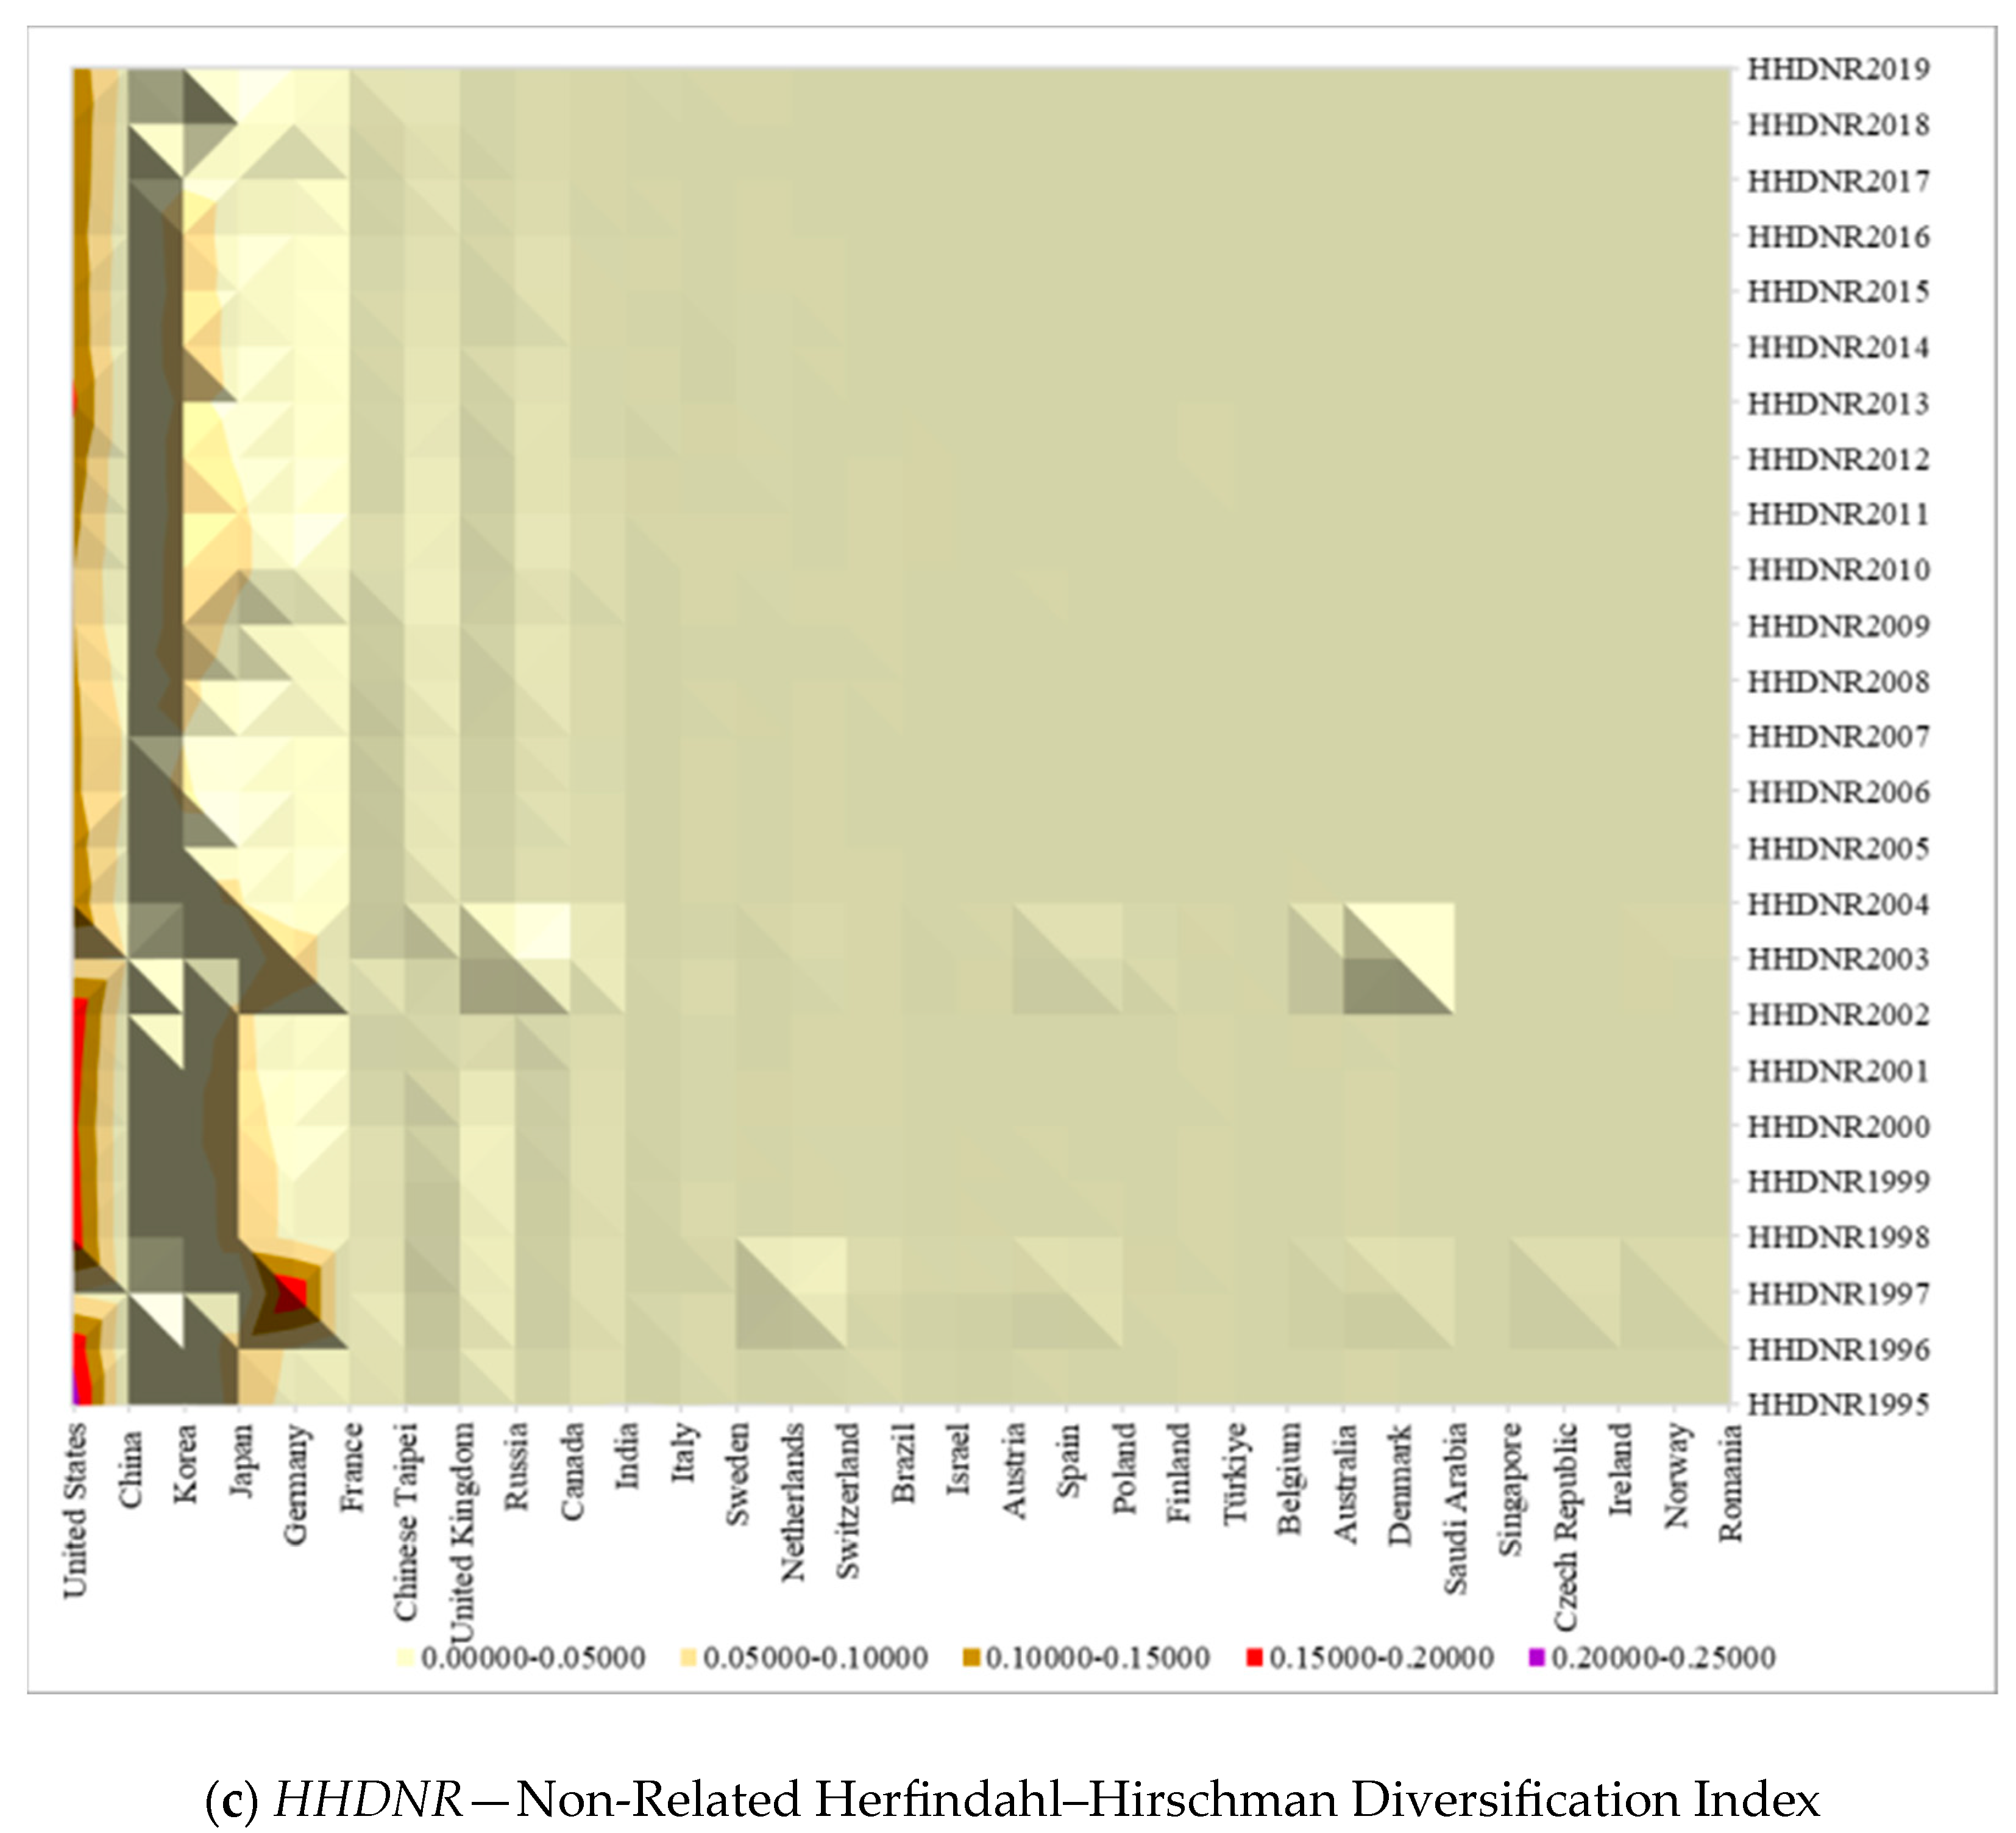
4.1.3. The Global Leaders in Renewable Patents Ranked by the Diversification Index in the Total, Related, and Unrelated Patents during 1995–2019
A second preliminary aspect analyzed by the present research is the country-based situation regarding patterns for renewable energy-generating technologies. In
Figure 4a–c, we present a selection of the global leaders in renewable patents, ranked by the diversification index, for total, related, and non-related patents during 1995–2019.
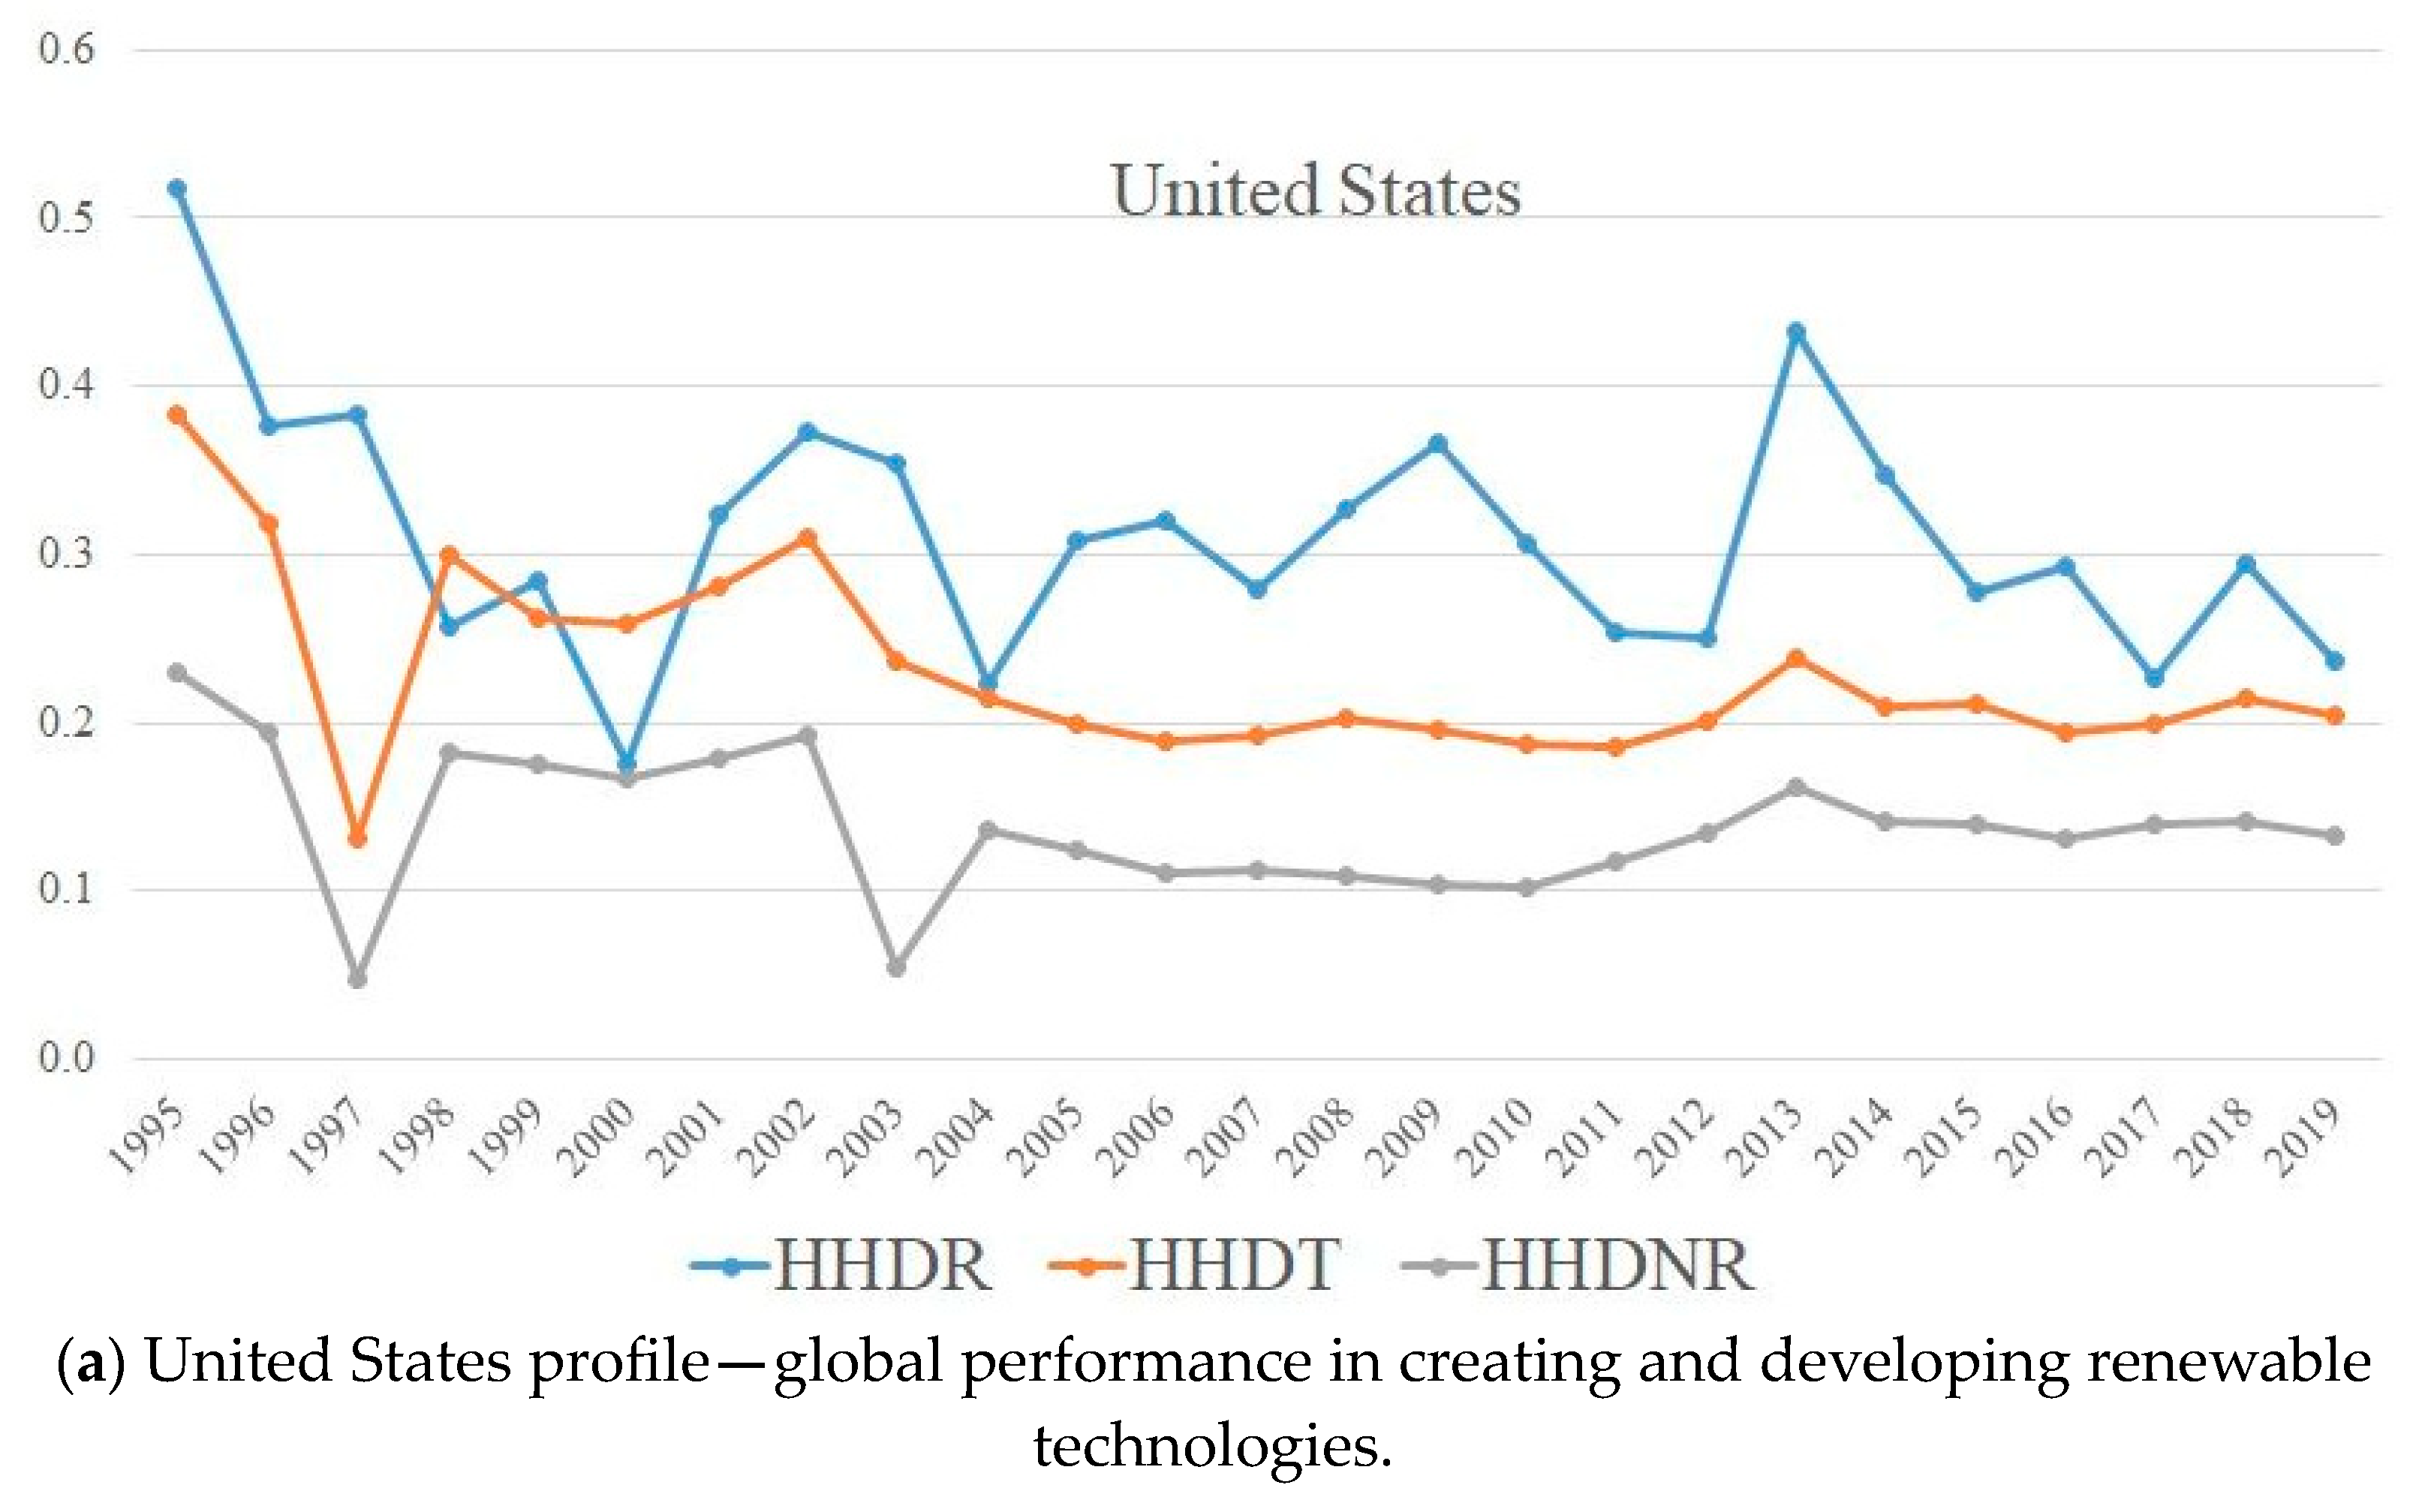
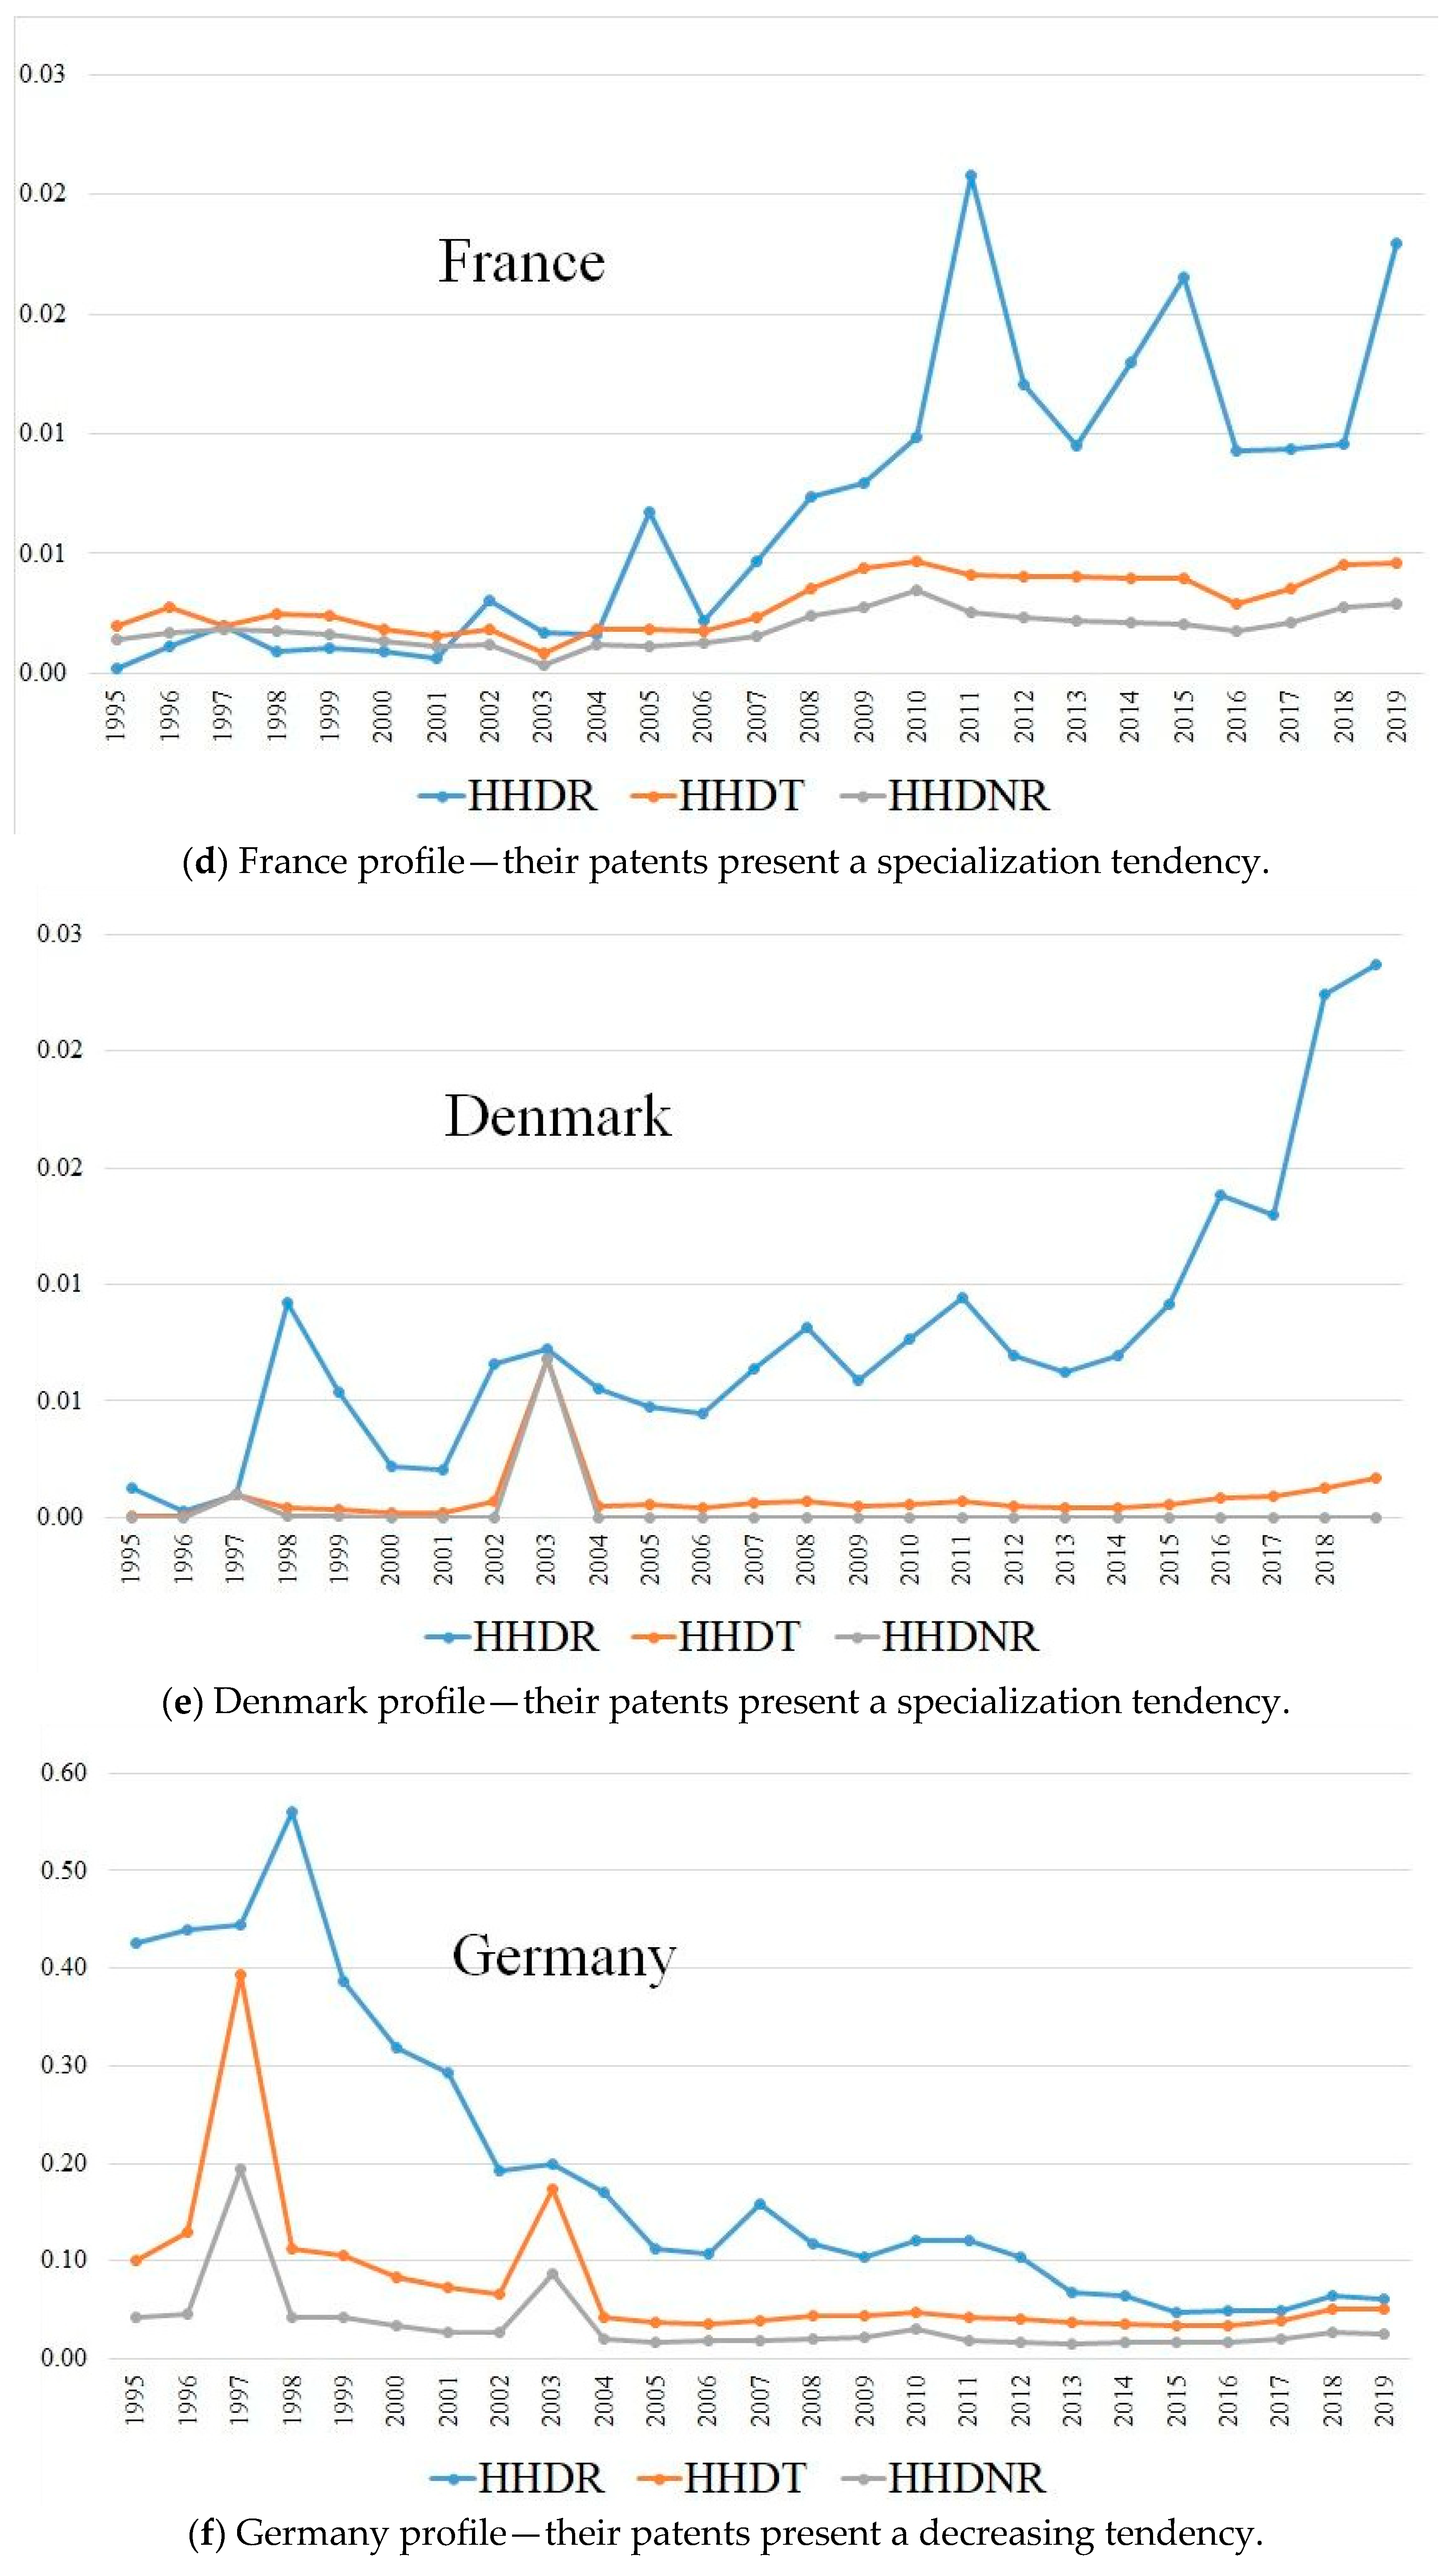
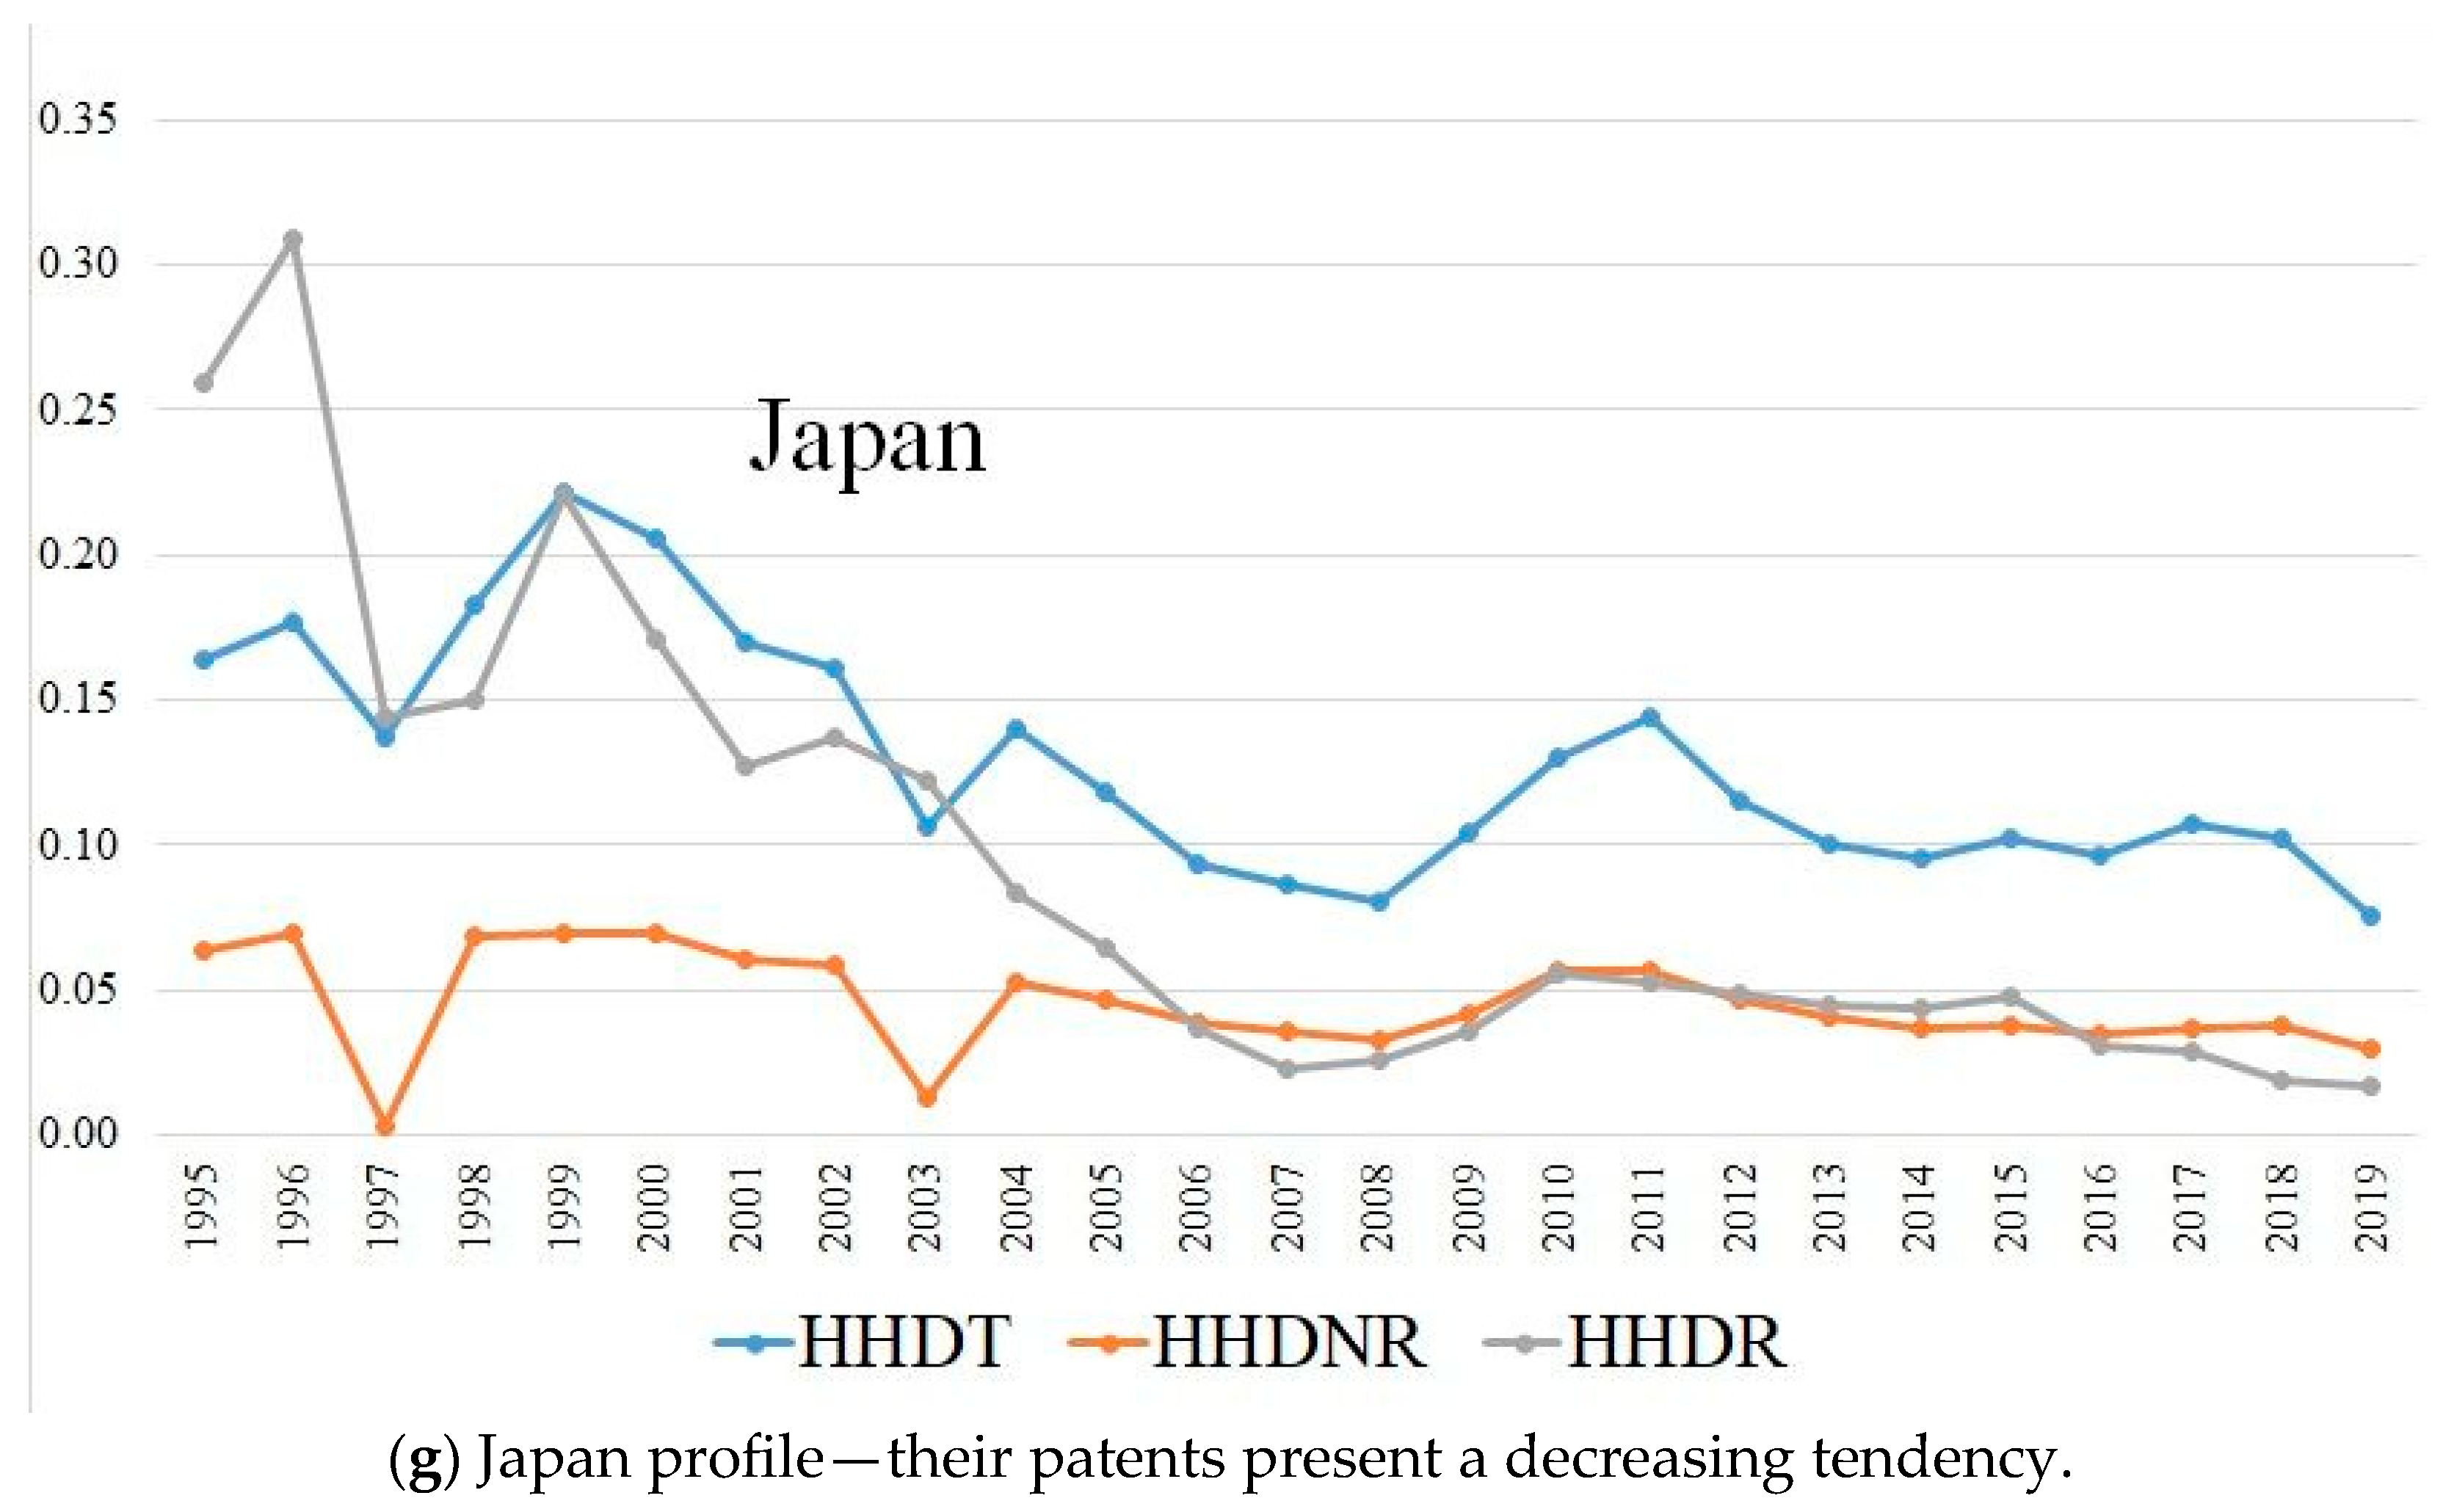
We selected seven country profiles, the top six in the world, and Denmark as the representatives of specialization types (
Figure 5a–g).
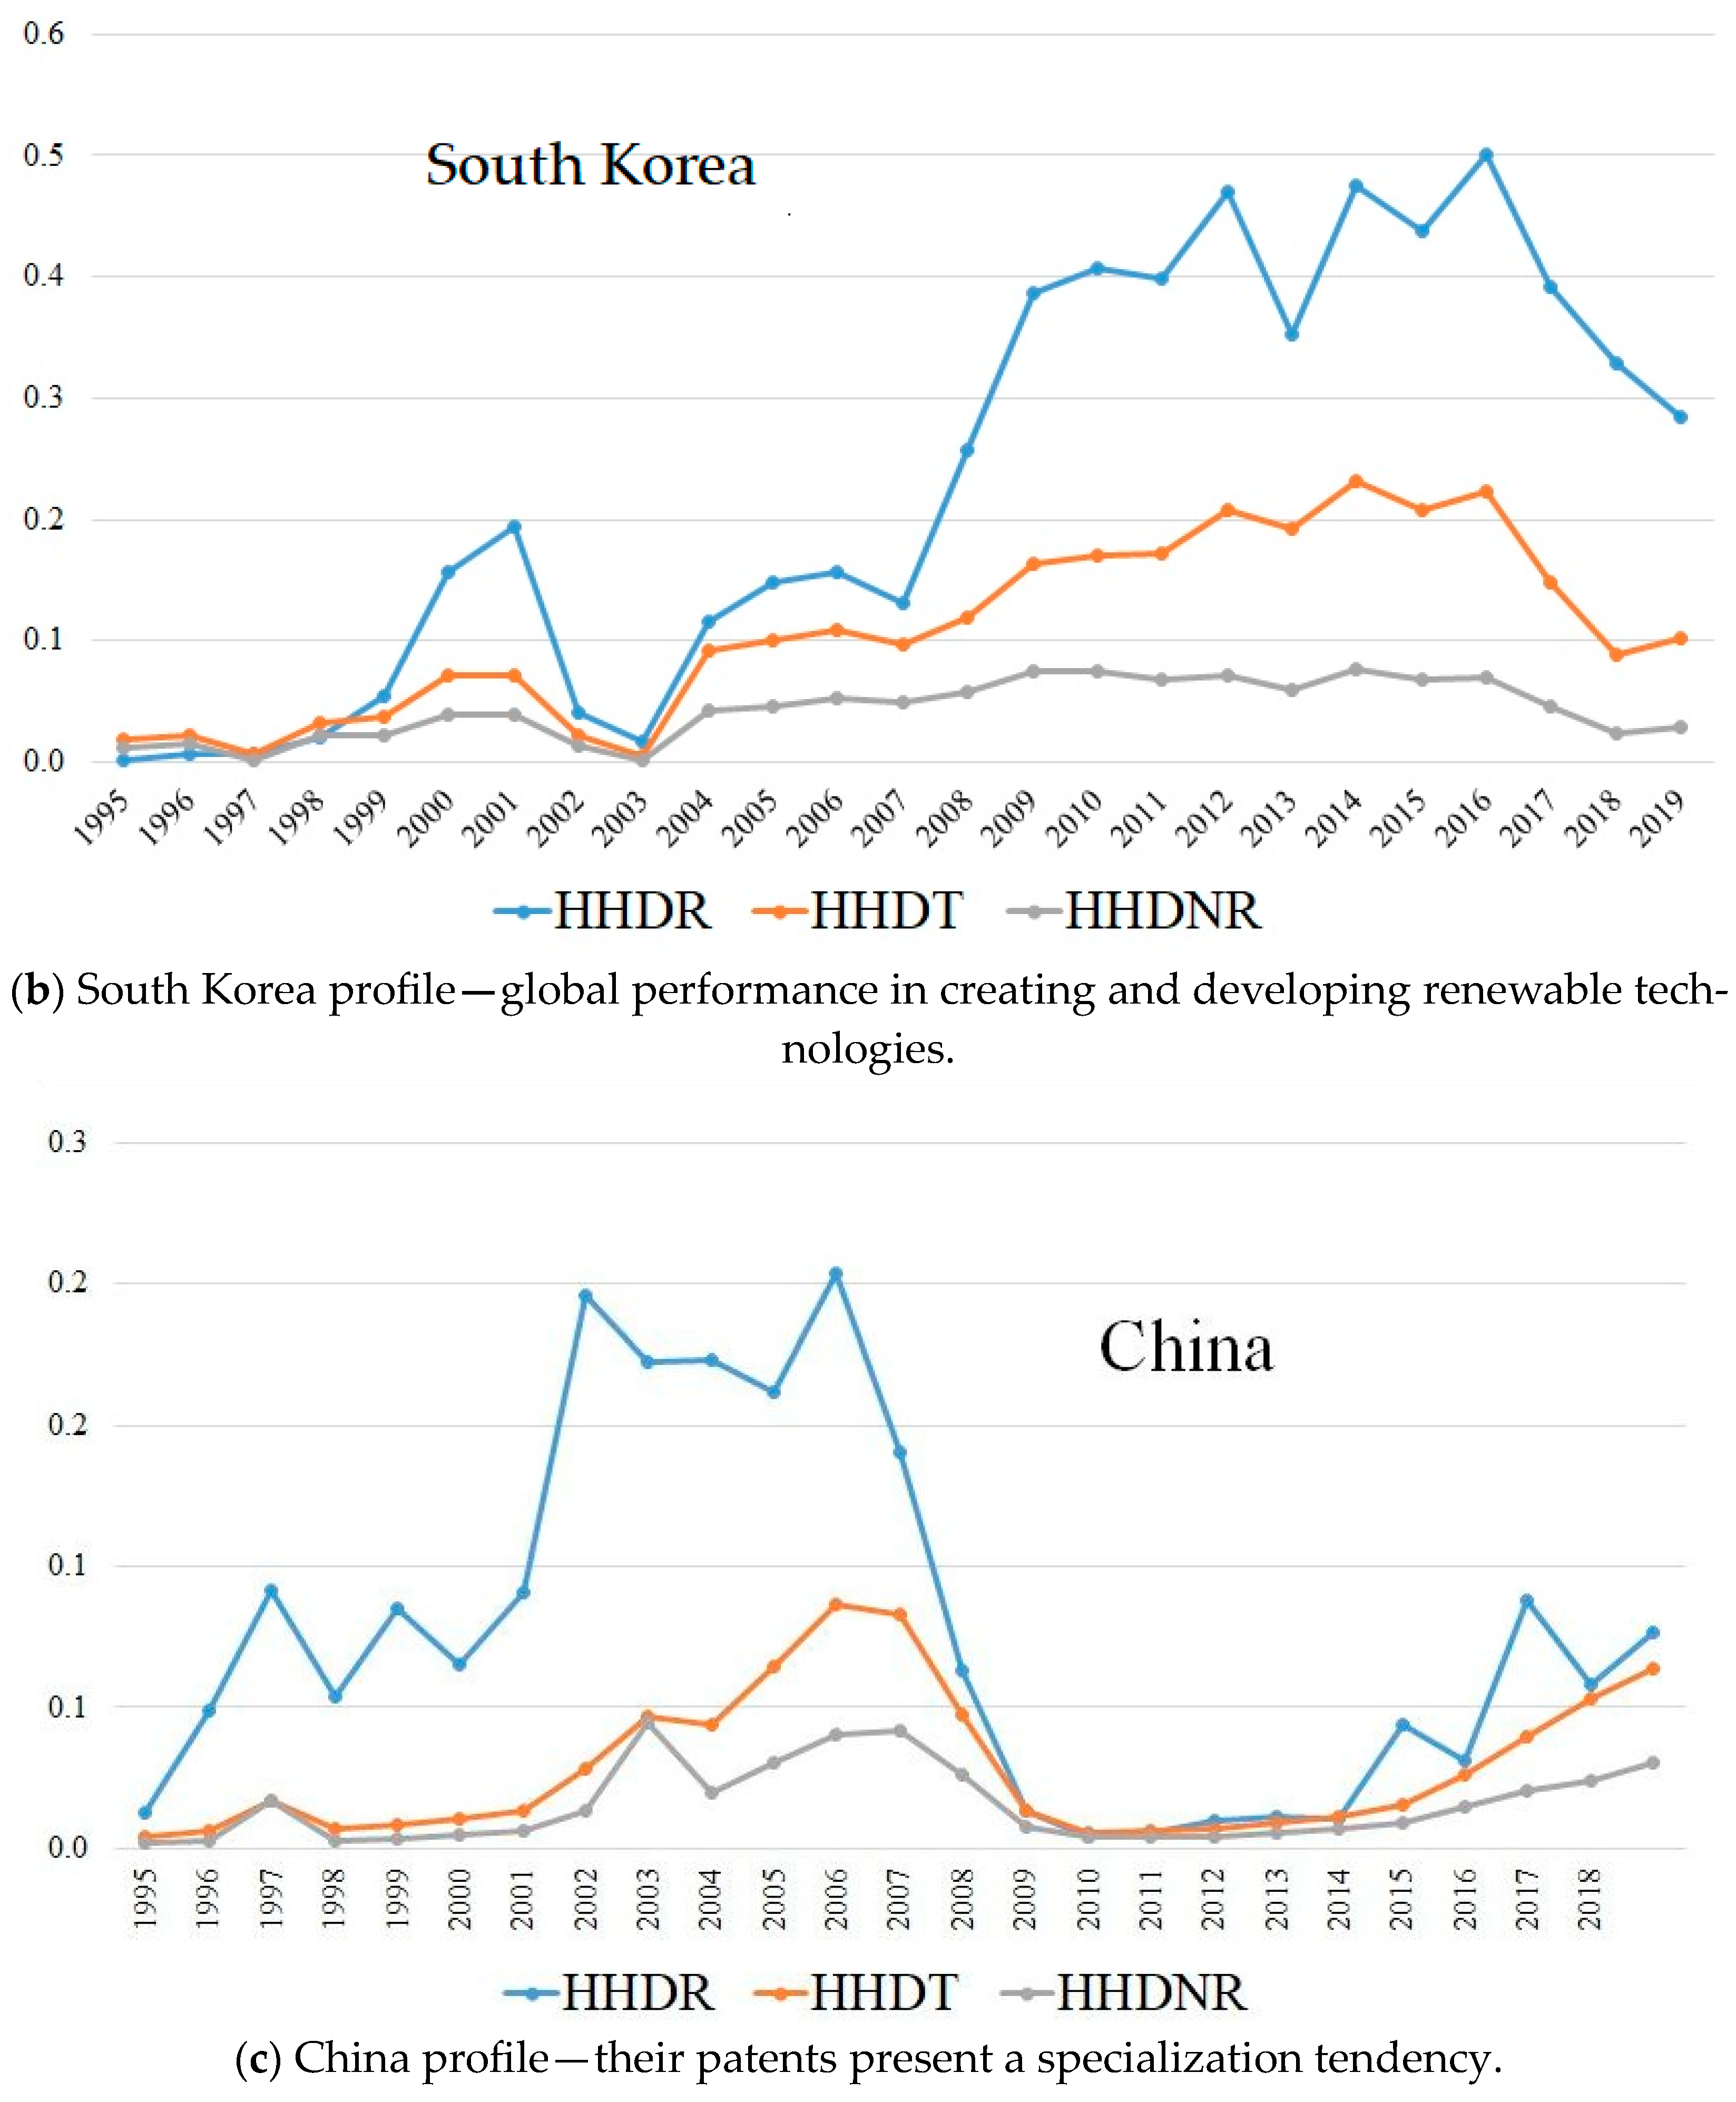
The best global performers in creating and developing renewable technologies leaders are the USA (with a share of 0.2% of total related renewable energy patents in 2019) and Korea (with a share of 0.4%). These shares decreased by 0.17 pp in the USA and increased by 0.082 pp in the case of Korea (
Figure 5a,b). Both countries exhibited low performance in renewable energy production. In 2015, according to the World Meter, the USA generated 17.9% of the world’s energy share, of which only 16% was renewable energy (7% hydroelectricity and wind 5.54%). Korea generated 2.3% of the world’s energy share, of which only 3% was renewable energy (7% hydroelectricity and wind 5.54%). The USA model is original for related and unrelated renewable energy creation, while the mainstream model is oriented toward related renewable energy patents.
Renewable energy generation patents present a specialization tendency after 2016 in the case of China (with a share of 0.064% of the total related renewable energy patents, thus ranked 3rd), France (with a share of 0.00454% of the total related renewable energy patents, rated 6) and Denmark (with a share of 0.0168% of the total related renewable energy patents). These countries had a positive trend of over 0.0158pp (
Figure 5c–e).
Moreover, according to Worldometer, China generates a global energy share of 25.5%, of which only 26% is renewable energy (20% hydroelectricity and wind 4.03%); France generates 2.1% of the world’s energy share, of which only 19% is renewable energy (11% hydroelectricity and wind 4%); and Denmark generates 0.151% of the world’s energy share, of which 64% is renewable energy (wind 42.8%, biomass and waste 18.8%, and solar 2.49%).
Germany ranks fifth in the global hierarchy of renewable energy technologies (
Figure 5f). It generates 2.5% of the world’s share, of which 32% is renewable energy (wind, 12.76%; biomass and waste, 9.5%; and solar, 6.22%). Between 1997 and 2017, Germany registered a sharp and continuously decreasing tendency in the HHDR. This trend began to change in 2019, but only slightly. A similar pattern was observed in Japan (
Figure 5g).
Other countries with decreasing tendencies were found to be Canada (with a share of 0.001% of the total related renewable energy patents) and the UK (with a share of 0.018% of the total related renewable energy patents). Canada generates 2.4% of the world share, of which 66% is renewable energy (59% hydroelectricity and wind 4.69%), and the UK generates 1.4% of the world share, of which 28% is renewable energy (wind, 11.74%; biomass and waste, 10.95%).
In conclusion, technology creation specialization shapes knowledge leaders who are not patent users. Renewable energy generation technology development is more efficient if diversification increases, and renewable energy technologies develop more if unrelated domains develop—as in the case of the USA and South Korea. The second tendency is the countries’ specialization in the development of renewable energy generation technologies by increasing the number of patents in related domains (of renewable energy generation). The governments of which this tendency applied were China, France, and Denmark.
H1 was confirmed by the results, showing different specialization patterns according to the country profile. There are three clear patterns among the leaders of patents for renewable energy generation technologies: (1) global performance; (2) specialized performance; and (3) performance in decline.
4.2. Clusters Maps by Renewable Energy Generation Technology—Development Specialization Patterns across Countries
4.2.1. The Global Cluster Map by Renewable Energy Generation Technology—Development Specialization Patterns
Using the clustering method K_MEANS with the initialization method OPTIMIZED_SEED_LOCATIONS, the optimal number of clusters was four based on the highest pseudo-F-statistic chosen from
Figure 5d.
The variable HHD divided the countries into the most effective clusters, and this process was based on the highest R
2 value of 92%. Meanwhile, “the larger the R
2 value for a particular variable, the better the variable discriminates among the features” (
Table 1).
EPER2019 Renewable energy productivity was the second-best discriminating variable, with an R
2 of 67.4%. The EP_C2019 variable was less efficient, whereas the per capita variable was less efficient (
Table 1).
In
Figure 6a–d, the four clusters created are presented.
The four clusters were characterized by their behavior toward renewable energy-generating technologies (
Figure 6).
Yellow Cluster—the 4th cluster. The leader in
renewable technology development from which there are two countries: the USA and South Korea (
Figure 6c). Interestingly, these countries are present in the first quartile concerning the level of energy productivity in both analyzed dimensions—the production of renewable energy and the energy productivity in terms of energy efficiency use. These countries are among the richest, with a GDP per capita in the 4th quartile.
Green Cluster—the 3rd cluster. This includes 30 countries and represents the leaders regarding EP_C2019Energy productivity and GDP per unit of TPES. These countries present an excellent performance in the 4th quartile, as well as in their energy efficiency use and the level of economic–social development (as modeled through the GDP/capita). These values were close to the yellow cluster characteristics (i.e., the same in the 4th quartile).
The Red Cluster—the 2nd cluster. This includes 37 countries and represents the leaders in renewable energy production in the 4th quartile. The second-best performance was for energy efficiency use, which was close to the median value of the EP_C2019 in 2019.
Blue Cluster—the 1st cluster. This includes 65 countries with the lowest performance of all the four studied variables.
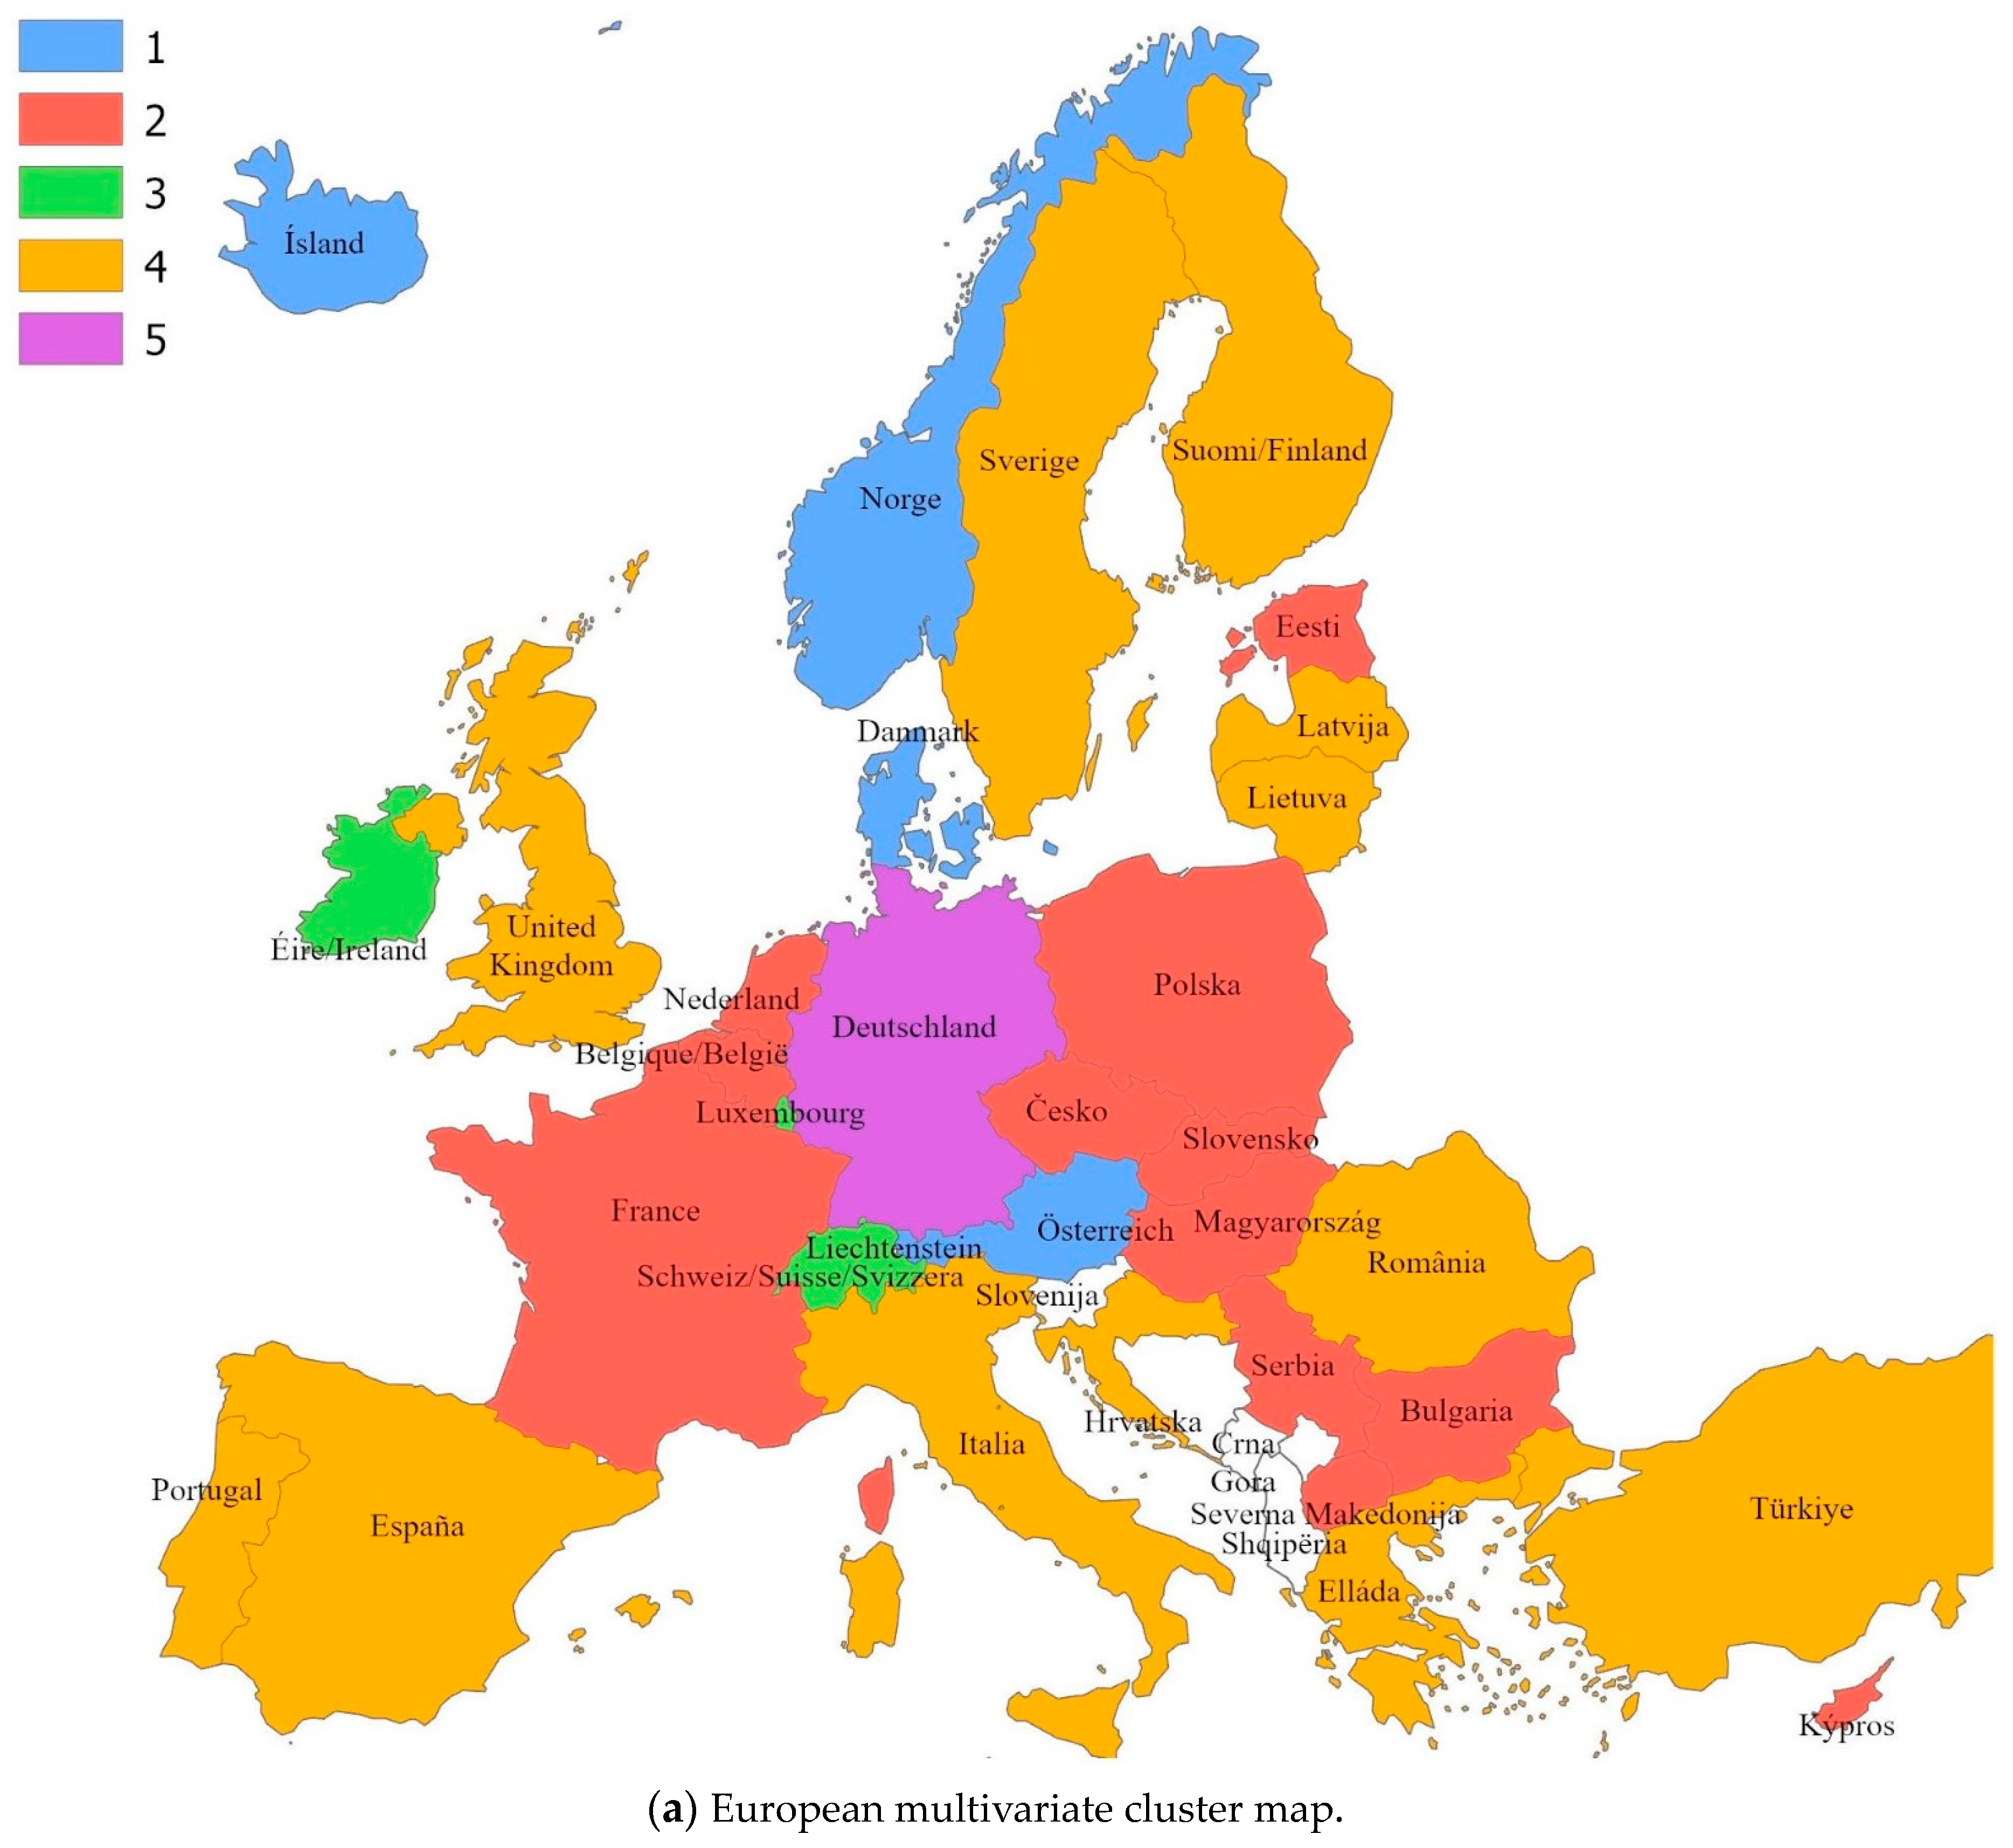
4.2.2. The European Cluster Map by Renewable Energy Generation Technology—Development Specialization Patterns
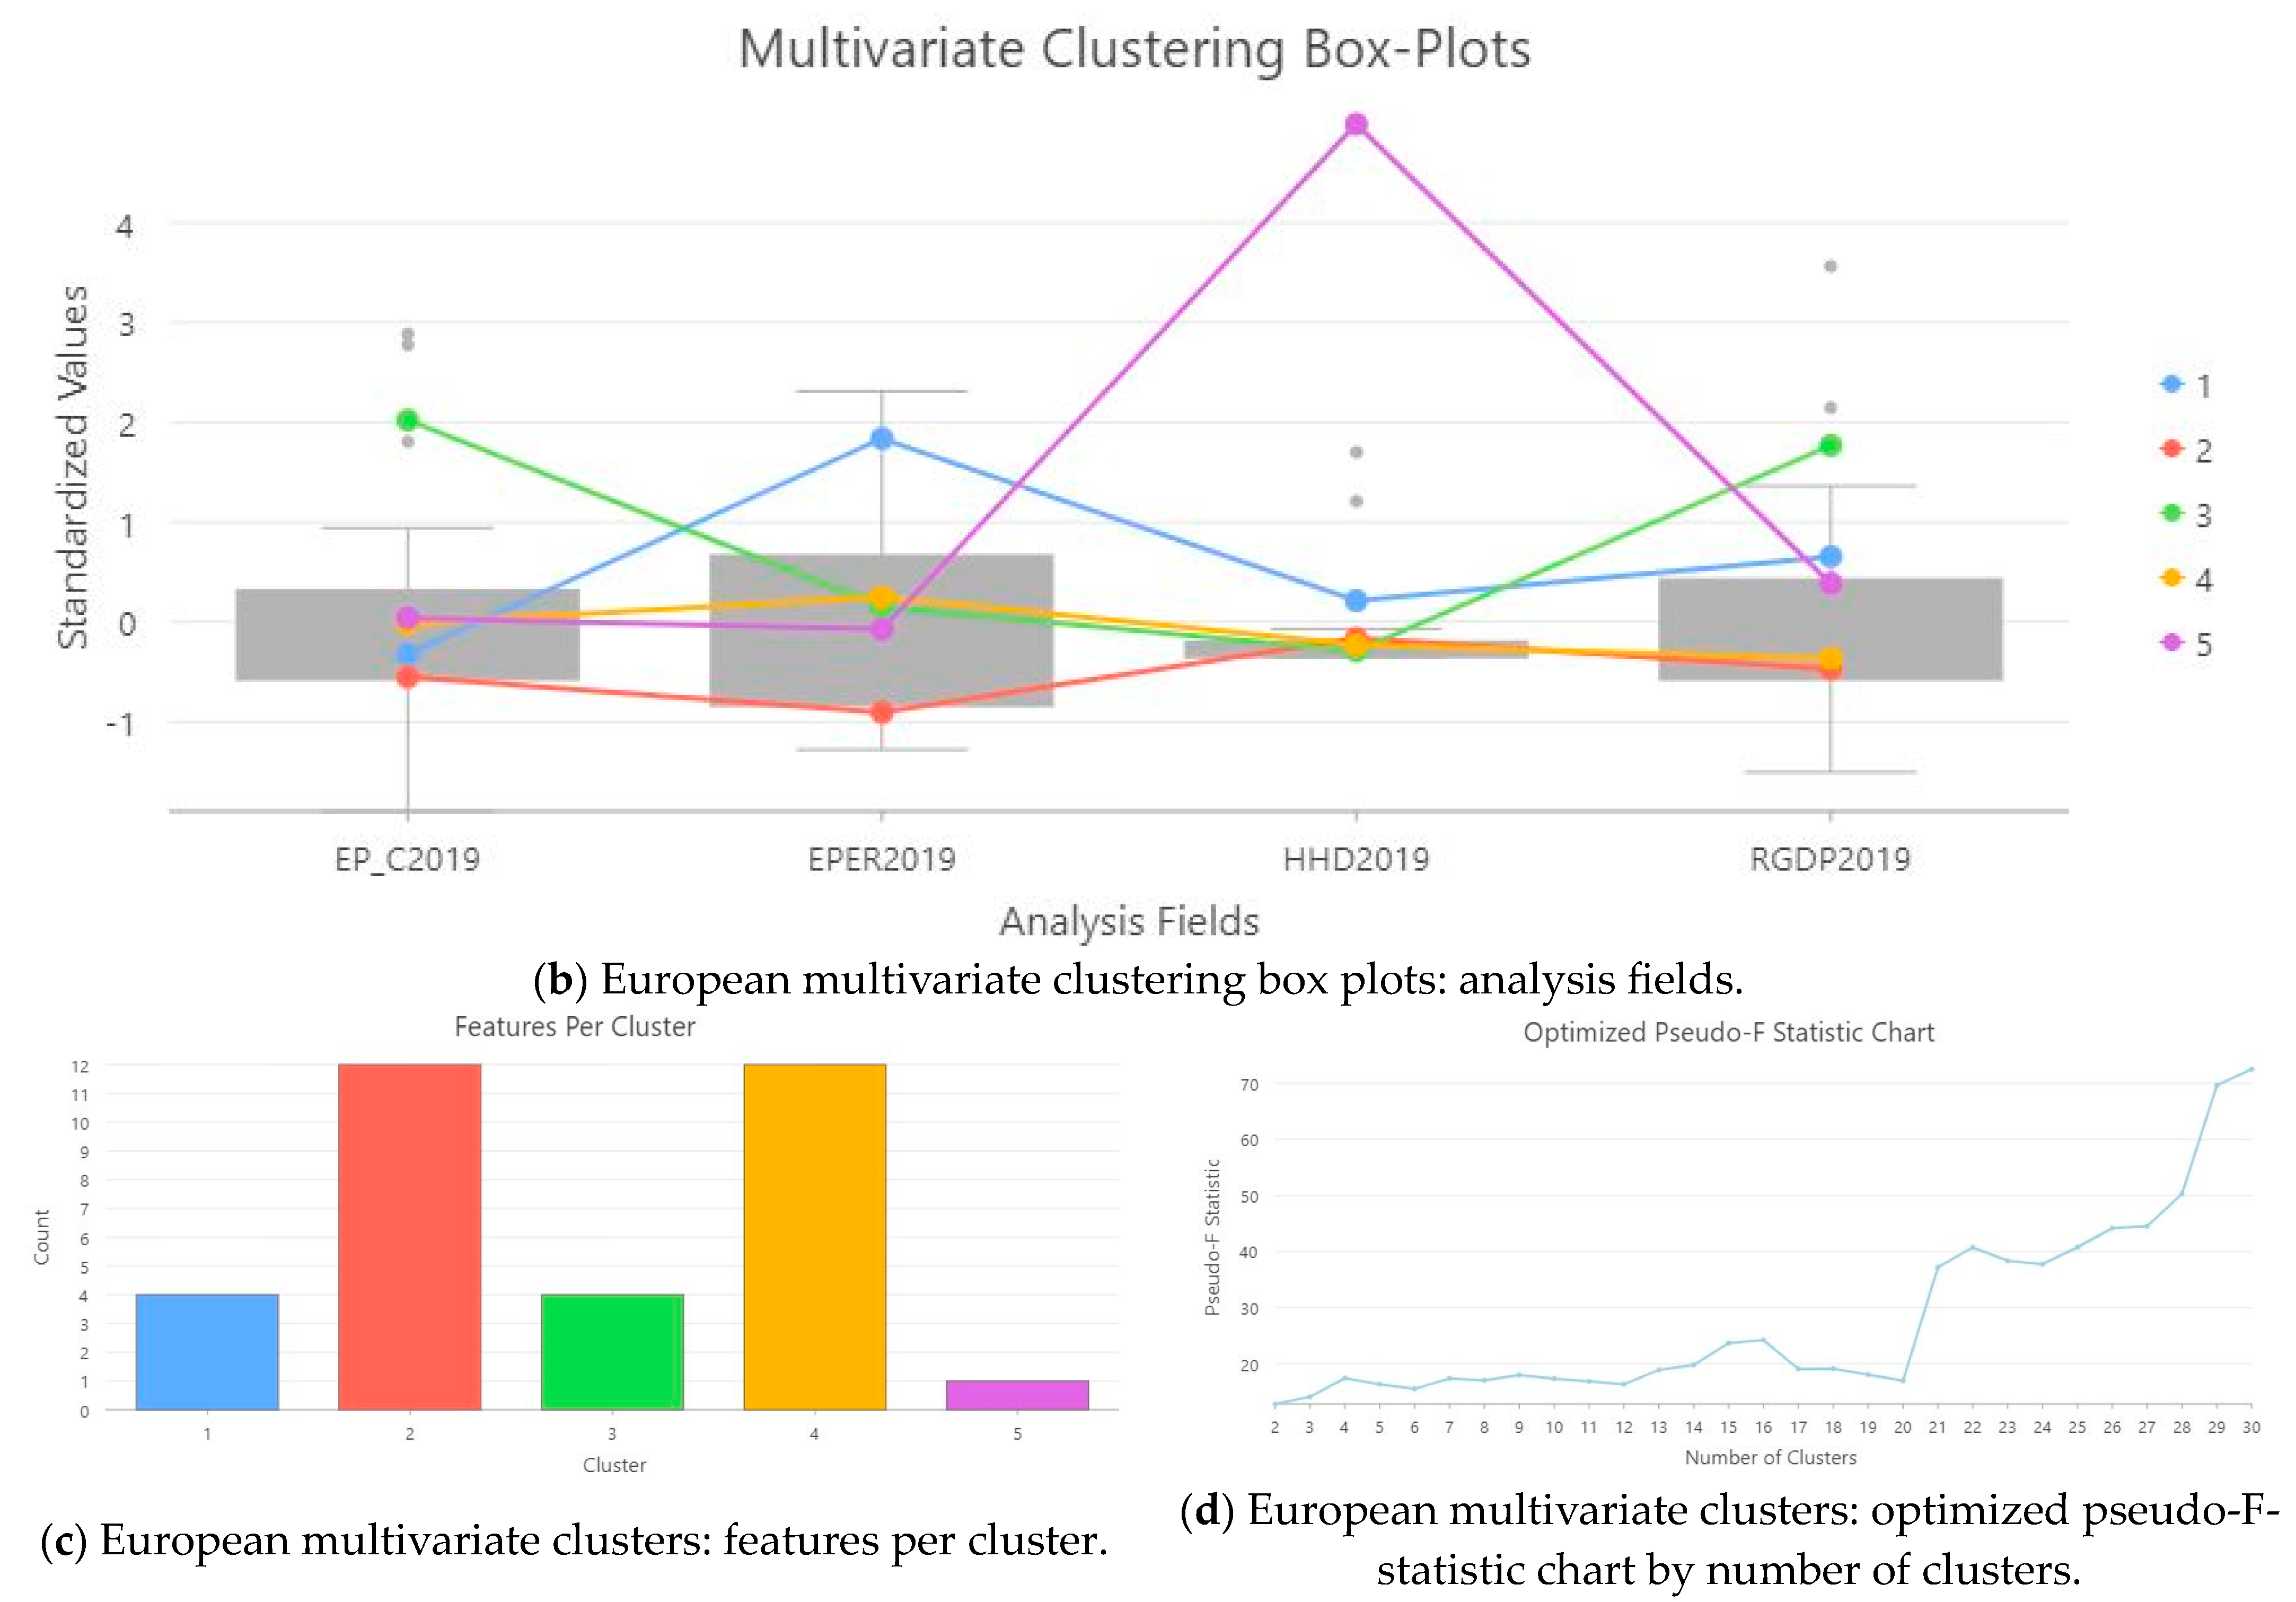
The optimal number of clusters was 30 based on the highest pseudo-F-statistic (
Figure 7d). Since the number of countries considered was 30 and the clusters were identified globally, we chose the five clusters as the local maximum of the pseudo-F-statistics.
The variable HHD divided the countries into the most effective clusters based on the highest R
2 value of 82.2% (
Table 2). EPER2019 Energy productivity (renewable electricity and % total electricity generation) was the second-best discriminating variable, with an R
2 of 75.8%. The third variable, EP_C2019, was less efficient, while the GDP per capita was the least efficient variable at 58.2 (
Table 2). Except for the HHD, all variables proved more efficient in Europe than in other countries. This indicated a higher potential for European countries to produce renewable energy and use energy with a higher productivity than the global average, albeit with a lower performance in creating and developing renewable technologies.
Figure 7a–d presents the five clusters identified. The only variable without outliers was EPER2019.
Mauve cluster—the 5th cluster. This included one country—one that was the leader in renewable energy development, i.e., Germany—as the center. It is an outlier with the maximum value of the HHD2019 variable. Cluster 5 reflects the tracts with above-average quality in the 3rd quartile (GDP2019), which is close to the mean value for EPER2019 and slightly above the mean value of EP_C2019.
Yellow cluster—the 4th cluster. This includes 12 countries distributed around the center with medium performance, i.e., those without a leader across any of the four variables. The best performance was achieved above the average but below the 3rd quartile for renewable energy production and energy efficiency (EP_C2019). The lowest performance was observed for technological development (HHD2019) and socioeconomic development (RGDP2019).
Green Cluster—the 3rd cluster. This includes four countries as the leaders in efficiently using energy and having the highest GDP/capita. These countries had a good performance in the production of renewable energy over the mean of the countries set and a low performance in renewable energy development. This cluster includes Switzerland, Lichtenstein, Luxembourg, and Ireland, countries close to the center.
Red Cluster—the 2nd cluster. This includes 12 countries and is the cluster with the lowest performance actors in all four variables studied, i.e., those below the mean and incredibly close to the 1st quartile.
Blue Cluster—the 1st cluster. This includes four countries and represents the leaders in renewable energy production and those that showed a good performance in renewable technology development and GDP/capita (with an average in the 4th quartile). This cluster performed less well regarding energy efficiency, with an average below the countries’ set mean. These include Norway, Iceland, Denmark, and Austria. We found that the Scandinavian countries have preserved their renewable energy production culture, such as with Iceland’s used the geothermal energy for generation. Norway is also using hydro energy (97%), Denmark using wind energy (42%) and biomass waste (18.8%) energy production and Austria using hydroelectricity energy (62%) (
https://www.worldometers.info/electricity/ (accessed on 2 September 2022)).
5. Discussion
Hypothesis 1 (H1). Countries develop different patterns of green innovation for renewable energy to achieve carbon neutrality.
Hypothesis 2 (H2). Clusters of country profiles exist.
Hypothesis 3 (H3). Countries with the same or similar profile are geographically grouped.
Profile identification was achieved with the HHD and confirmed by Hypothesis 1 regarding the existence of different country profiles of specialization in terms of patterns of green innovation for renewable energy to achieve carbon neutrality. The results were like those of other studies, but they provided a more specific image of innovation for renewable energy.
Using the panel data from 30 countries, Kim and Park [
56] highlighted that renewable energy-generating technologies are favored by better and developed financial systems. The domains influenced by emerging renewable energy technologies [
41,
57] are relevant for policy makers to support development accordingly.
Hypothesis 2 was confirmed by the similarities of the country’s profiles in 3 or 4 classes. The ESDA representation of the countries by clusters confirmed the findings of other studies and offered a clearer picture of their geographical distribution.
The geographical breakdown of renewable energy, i.e., the gains by 2018/2050 [
58], showed that the USA and China will be the leaders, followed by India, Europe, and Japan.
The cost-effectiveness of renewable energy-generating technologies has higher uncertainty than fossil or nuclear technologies; however, even so, solar PV and onshore wind are close to affordability [
59]. In addition to affordability, individuals’ readiness to adopt and take advantage of new technologies has been analyzed [
60].
Jurasz et al. [
61] studied the theoretical interest in complementary energy sources and hybrid solutions using spatial and temporal models. Their findings confirmed our results for the leading countries (USA and Korea), the second-most productive countries (EU and Japan, China, Pakistan, and Australia), and those from Eastern Asia, South America, and Africa.
Miyamoto and Takeuchi [
62] considered the patent applications of 133 countries between 1990 and 2013. They concluded that the Kyoto Protocol accelerated the number of patents for countries with objectives related to emissions, as well as in, surprisingly, Brazil, China, India, and Mexico, i.e., countries with high pollution. In other words, multipartite agreements stimulate and accelerate these measures, which, in our case, are innovation, patents, regulations, and compliant behavior. A sample of 194 countries between 1990 and 2016 was studied from the perspective of patent evolution and support policies for renewable energy [
63]. It was found that there were increases and decreases, but feed-in tariffs appear to be an essential levier for patents [
64,
65]. The authors highlight the relationship between R&D support and technology implementation based on the number of patents. A similar study was conducted in EU countries [
66], and the same conclusion was drawn: the Kyoto Protocol and strict legislation are accelerating patent application and implementation in South Asian countries [
67].
To justify the interest in patents, Cheng and Yao [
68] developed a model to estimate emissions reduction due to renewable energy technology innovation, and the impact is small in the short term but significant in the long term. The need for innovation and patents for renewable energy is confirmed by studies on emission reduction in the short- and long-term, and the economic and population growth interfering with it in a negative way that must be counterbalanced [
69,
70].
Hypothesis 3 of our study was confirmed, and the countries’ geographical positions are grouped based on the cluster to which the country profile belongs. We can conclude that geography and, more precisely, its natural resources influence the country’s pattern.
6. Conclusions, Implications, and Limitations
Our main conclusion is that there are four main models (classes) of SPD-REGT across countries in the field of green innovation, distinctive mainly by the level of knowledge development and energy management cultural model but dependent on the spatial analysis scale. Green innovation for renewable energy is at the embryonic stage of development, and in 2019, no country fulfilled all four criteria at the same time.
Our study confirms that not all countries are patent producers; they can be technology users or patent dealers, as confirmed by Lin and Zhu [
57]. Raiser et al. [
71] highlighted that patents for renewable energy are one step that stimulates innovation, but restrictions in commercialization act as barriers. Patterns offer protection for intellectual property but limit their use in new technologies. Categories of countries or potential end users that cannot afford their high costs are excluded. Based on the results of our study, a possible solution could be the financial support for patent generation in specialized countries and open access to patents under specific commercial regulations for the supporting conglomerate (e.g., EU funds for EU countries and BRIICS funds for BRIICS countries).
The global and European clusters provided by our spatial model offer policy makers a hint of how to deal with the regulations for renewable energy sources, patterns, and emissions restrictions. In our opinion, it is better to stimulate regions/countries specialized in innovation to speed up and grow it. Countries specialized in new technology usage to extend their practice to other areas.
Each county or region can use the SPD-REGT model as a competitive advantage over other competitors in the market. Moreover, the technology developer and patent dealers need to access the users and fight for them, offering the best technological and innovative solutions for renewable energy production, storage, transport, and consumption. Considering also the five types of renewable energy, we are offering a starting point for policy makers to design their strategies on an enormous emerging market with a high development speed.
An in-depth analysis of the patent categories (production, storage, distribution, and consumption) must be performed to identify the specific country’s specialization in renewable energy [
72].
The most important finding is the correlation between renewable energy and economic growth, with the same conclusion that a mix of fossil and renewable energy (solar, photovoltaic, hydro, wind, and bio) allows for the sustainable economic development and long-term reduction in emissions with a significant positive impact on pollution.
The novelty and the contributions of the present research are as follows:
- -
The identification of four, respectively, five main country patterns of SPD-REGT;
- -
Innovative use of HHD index for specialization pattern identification;
- -
Clustering the country’s patterns at the global and EU levels;
- -
Mapping the clusters to offer a geographic perspective of the renewable energy generation technologies market.
Our study is limited to a neighborhood spatial analysis performed using the exploratory-visual technique ESDA without a spatial autocorrelation analysis. Moreover, the analysis considers the patent number, but does not dig deep into the patent’s typology such as quality, cost, novelty, and effectiveness. Qualitative research of the patent’s typology overlap on our study will better clarify the market perspectives of patents and technology for renewable energy.
Currently, the impact of digital transformation on technological development [
73,
74] is consistent and relevant. In the present study, we did not consider and analyze the effect of digital adoption in renewable energy technologies or other side effects of digital transformation or digital innovation. These are potential topics to be explored in further studies.
The proposed model can be used to identify the country patterns for other domains and the geographic dispersion. At the same time, a further study could analyze the link between the geographic position, neighborhood, and natural resources in determining the pattern. The other developments of the present study could be considered the optimization models at the country level [
75] or building scenarios for reaching carbon neutrality [
76].
Author Contributions
Conceptualization, A.G., C.L. and V.R.L.R.; methodology, C.L., E.C. and A.G.; software, C.L.; validation, E.C. and V.R.L.R.; formal analysis, C.L. and V.R.L.R.; investigation, C.L. and E.C.; resources, E.C.; data curation, C.L.; writing—original draft preparation, A.G.; writing—review and editing, E.C. and V.R.L.R.; visualization, C.L.; supervision, A.G. and V.R.L.R.; project administration, A.G.; funding acquisition, E.C. All authors have read and agreed to the published version of the manuscript.
Funding
This research received no external funding.
Institutional Review Board Statement
This study did not involve animal experimentation or human participants.
Data Availability Statement
All data used in the study are public and can be accessed at the provided links.
Acknowledgments
This work was carried out under research program of National Institute of Economic Research “Costin C. Chiritescu” (INCE). This work was supported by a grant from the Romanian Ministry of Research, Innovation, and Digitalization, Programme NUCLEU, 2022–2026, Spatio-temporal forecasting of local labour markets through GIS modelling [P5]/Previziuni spatio-temporale pentru pietele muncii locale prin modelare în GIS [P5] PN 22_10_0105.
Conflicts of Interest
The authors declare no conflict of interest.
Abbreviations
| NCCT | All other technologies except climate change mitigation |
| CCT1 | Climate change mitigation exceptions of energy generation, transmission, and distribution |
| CCTDE | Climate change mitigation technologies related to transmission or distribution |
| CCGRE | Renewable energy generation |
| Y | Year |
| WE | Wind energy |
| STE | Solar thermal energy |
| SPVE | Solar photovoltaic (PV) energy |
| STPVH | Solar thermal–PV hybrids |
| GTE | Geothermal energy |
| MEW | Marine energy, e.g., using wave energy or a salinity gradient |
| HYE | Hydro energy |
References
- Falkner, R. The Paris agreement and the new logic of international climate politics. Int. Aff. 2016, 92, 1107–1125. [Google Scholar] [CrossRef]
- Green, F. Anti-fossil fuel norms. Clim. Chang. 2018, 150, 103–116. [Google Scholar] [CrossRef]
- Connor, L.H. Energy futures, state planning policies and coal mine contests in rural New South Wales. Energy Policy 2016, 99, 233–241. [Google Scholar] [CrossRef]
- Blondeel, M.; Van de Graaf, T. Toward a global coal mining moratorium? A comparative analysis of coal mining policies in the US, China, India, and Australia. Clim. Chang. 2018, 150, 89–101. [Google Scholar] [CrossRef]
- United Nations. UN Climate Change Conference (COP21) in Paris, France, on 12 December 2015. Available online: https://unfccc.int/process-and-meetings/the-paris-agreement (accessed on 2 September 2022).
- Sung, B.; Wen, C. Causal dynamic relationships between political–economic factors and export performance in the renewable energy technologies market. Energies 2018, 11, 874. [Google Scholar] [CrossRef]
- Ministry of the Environment, Energy and Climate of Iceland. Available online: https://www.government.is/topics/business-and-industry/energy/#:~:text=About%2085%25%20of%20the%20total,any%20national%20total%20energy%20budget (accessed on 2 March 2023).
- Benediktsson, K. Conflicting imaginaries in the energy transition? Nature and renewable energy in Iceland. Morav. Geogr. Rep. 2021, 29, 88–100. [Google Scholar] [CrossRef]
- Jasanoff, S.; Kim, S.H. Containing the atom: Sociotechnical imaginaries and nuclear power in the United States and South Korea. Minerva 2009, 47, 119–146. [Google Scholar] [CrossRef]
- Lee, S.K.; Mogi, G. Relative efficiency of energy technologies in the Korean mid-term strategic energy technology development plan. Renew. Sustain. Energy Rev. 2018, 91, 472–482. [Google Scholar] [CrossRef]
- Hussain, A.; Arif, S.M.; Aslam, M. Emerging renewable and sustainable energy technologies: State of the art. Renew. Sustain. Energy Rev. 2017, 71, 12–28. [Google Scholar] [CrossRef]
- Abdmouleh, Z.; Gastli, A.; Ben-Brahim, L.; Haouari, M.; Al-Emadi, N.A. Review of optimization techniques applied for the integration of distributed generation from renewable energy sources. Renew. Energy 2017, 113, 266–280. [Google Scholar] [CrossRef]
- Egli, F.; Steffen, B.; Schmidt, T.S. A dynamic analysis of financing conditions for renewable energy technologies. Nat. Energy 2018, 3, 1084–1092. [Google Scholar] [CrossRef]
- Grigorescu, A.; Ion, A.E.; Lincaru, C.; Pirciog, S. Synergy Analysis of Knowledge Transfer for the Energy Sector within the Framework of Sustainable Development of the European Countries. Energies 2021, 15, 276. [Google Scholar] [CrossRef]
- Owusu, P.A.; Asumadu-Sarkodie, S. A review of renewable energy sources, sustainability issues and climate change mitigation. Cogent Eng. 2016, 3, 1167990. [Google Scholar] [CrossRef]
- Zhou, J.; Mao, Y.; Grigorescu, A.; Condrea, E. Industrial growth and change of energy consumption behaviour in Eastern European Countries, Austria and China. J. Environ. Prot. Ecol. 2020, 21, 1107–1116. [Google Scholar]
- Østergaard, P.A.; Duic, N.; Noorollahi, Y.; Mikulcic, H.; Kalogirou, S. Sustainable development using renewable energy technology. Renew. Energy 2020, 146, 2430–2437. [Google Scholar] [CrossRef]
- Timilsina, G.R. Are renewable energy technologies cost competitive for electricity generation? Renew. Energy 2021, 180, 658–672. [Google Scholar] [CrossRef]
- Qazi, A.; Hussain, F.; Rahim, N.A.; Hardaker, G.; Alghazzawi, D.; Shaban, K.; Haruna, K. Towards sustainable energy: A systematic review of renewable energy sources, technologies, and public opinions. IEEE Access 2019, 7, 63837–63851. [Google Scholar] [CrossRef]
- Batel, S.; Devine-Wright, P. Towards a better understanding of people’s responses to renewable energy technologies: Insights from Social Representations Theory. Public Underst. Sci. 2015, 24, 311–325. [Google Scholar] [CrossRef]
- Eleftheriadis, I.M.; Anagnostopoulou, E.G. Identifying barriers in the diffusion of renewable energy sources. Energy Policy 2015, 80, 153–164. [Google Scholar] [CrossRef]
- Cheng, C.; Ren, X.; Wang, Z.; Yan, C. Heterogeneous impacts of renewable energy and environmental patents on CO2 emission-Evidence from the BRIICS. Sci. Total Environ. 2019, 668, 1328–1338. [Google Scholar] [CrossRef]
- Chen, Y.S.; Lai, S.B.; Wen, C.T. The Influence of Green Innovation Performance on Corporate Advantage in Taiwan. J. Bus. Ethics 2006, 67, 331–339. [Google Scholar] [CrossRef]
- Bódis, K.; Kougias, I.; Jäger-Waldau, A.; Taylor, N.; Szabó, S. A high-resolution geospatial assessment of the rooftop solar photovoltaic potential in the European Union. Renew. Sustain. Energy Rev. 2019, 114, 109309. [Google Scholar] [CrossRef]
- Ekins, P.; Zenghelis, D. The costs and benefits of environmental sustainability. Sustain. Sci. 2021, 16, 949–965. [Google Scholar] [CrossRef]
- Giannelos, S.; Konstantelos, I.; Strbac, G. Investment Model for Cost-effective Integration of Solar PV Capacity under Uncertainty using a Portfolio of Energy Storage and Soft Open Points. In Proceedings of the 2019 IEEE Milan PowerTech, Milan, Italy, 23–27 June 2019; pp. 1–6. [Google Scholar] [CrossRef]
- Lehmann, P.; Söderholm, P. Can technology-specific deployment policies be cost-effective? The case of renewable energy support schemes. Environ. Resour. Econ. 2018, 71, 475–505. [Google Scholar] [CrossRef]
- Peszko, G.; van der Mensbrugghe, D.; Golub, A.; Ward, J.; Zenghelis, D.; Marijs, C.; Schopp, A.; Rogers, J.A.; Midgley, A. Diversification and Cooperation in a Decarbonizing World: Climate Strategies for Fossil Fuel-Dependent Countries; World Bank Group: Washington, DC, USA, 2020; Volume 9. [Google Scholar]
- Haščič, I.; Migotto, M. Measuring Environmental Innovation Using Patent Data; OECD Environment Working Papers, No. 89; ENV/WKP (2015)10; OECD Publishing: Paris, France, 2015. [Google Scholar]
- Elangovan, S. Recent trends in sustainable development of renewable energy. In Proceedings of the International Conference on Advances in Electrical Technology for Green Energy (ICAETGT), Coimbatore, India, 23 September 2017; pp. 148–150. [Google Scholar] [CrossRef]
- Dewangan, V.; Godse, M. Towards a holistic enterprise innovation performance measurement system. Technovation 2014, 34, 536–545. [Google Scholar] [CrossRef]
- Dziallas, M.; Blind, K. Innovation indicators throughout the innovation process: An extensive literature analysis. Technovation 2019, 80, 3–29. [Google Scholar] [CrossRef]
- Ponta, L.; Puliga, G.; Manzini, R. A measure of innovation performance: The Innovation Patent Index. Manag. Decis. 2021, 59, 73–98. [Google Scholar] [CrossRef]
- Baumann, M.; Domnik, T.; Haase, M.; Wulf, C.; Emmerich, P.; Rösch, C.; Zapp, P.; Naegler, T.; Weil, M. Comparative patent analysis for the identification of global research trends for the case of battery storage, hydrogen, and bioenergy. Technol. Forecast. Soc. Chang. 2021, 165, 120505. [Google Scholar] [CrossRef]
- Bogdanov, D.; Breyer, C. North-East Asian Super Grid for 100% renewable energy supply: Optimal mix of energy technologies for electricity, gas and heat supply options. Energy Convers. Manag. 2016, 112, 176–190. [Google Scholar] [CrossRef]
- Sinsel, S.R.; Riemke, R.L.; Hoffmann, V.H. Challenges and solution technologies for the integration of variable renewable energy sources—A review. Renew. Energy 2020, 145, 2271–2285. [Google Scholar] [CrossRef]
- Garcia Vera, Y.E.; Dufo-López, R.; Bernal-Agustín, J.L. Energy management in microgrids with renewable energy sources: A literature review. Appl. Sci. 2019, 9, 3854. [Google Scholar] [CrossRef]
- Giannelos, S.; Borozan, S.; Aunedi, M.; Zhang, X.; Ameli, H.; Pudjianto, D.; Konstantelos, I.; Strbac, G. Modelling Smart Grid Technologies in Optimisation Problems for Electricity Grids. Energies 2023, 16, 5088. [Google Scholar] [CrossRef]
- Etxeberria, A.; Vechiu, I.; Camblong, H.; Vinassa, J.M. Hybrid energy storage systems for renewable energy sources integration in microgrids: A review. In 2010 Conference Proceedings IPEC; IEEE: Piscataway, NJ, USA, 2010; pp. 532–537. [Google Scholar]
- Haščič, I.; Silva, J.; Johnstone, N. The Use of Patent Statistics for International Comparisons and Analysis of Narrow Technological Fields; OECD Publishing: Paris, France, 2015. [Google Scholar] [CrossRef]
- Noailly, J.; Smeets, R. Directing technical change from fossil-fuel to renewable energy innovation: An application using firm-level patent data. J. Environ. Econ. Manag. 2015, 72, 15–37. [Google Scholar] [CrossRef]
- De Rosa, M.; Gainsford, K.; Pallonetto, F.; Finn, D.P. Diversification, concentration, and renewability of the energy supply in the European Union. Energy 2022, 253, 124097. [Google Scholar] [CrossRef]
- Dyatlov, S.A.; Didenko, N.I.; Ivanova, E.A.; Soshneva, E.B.; Kulik, S.V. Prospects for alternative energy sources in the global energy sector. In IOP Conference Series: Earth and Environmental Science; IOP Publishing: Bristol, UK, 2020; Volume 434, p. 012014. [Google Scholar]
- Akrofi, M.M. An analysis of energy diversification and transition trends in Africa. Int. J. Energy Water Resour. 2021, 5, 1–12. [Google Scholar] [CrossRef]
- Li, D.; Heimeriks, G.; Alkemade, F. The emergence of renewable energy technologies at country level: Relatedness, international knowledge spillovers and domestic energy markets. Ind. Innov. 2020, 27, 991–1013. [Google Scholar] [CrossRef]
- Noailly, J.; Shestalova, V. Knowledge spillovers from renewable energy technologies: Lessons from patent citations. Environ. Innov. Soc. Transit. 2017, 22, 1–14. [Google Scholar] [CrossRef]
- Perruchas, F.; Consoli, D.; Barbieri, N. Specialisation, diversification and the ladder of green technology development. Res. Policy 2020, 49, 103922. [Google Scholar] [CrossRef]
- Hache, E. Do renewable energies improve energy security in the long run? Int. Econ. 2018, 156, 127–135. [Google Scholar] [CrossRef]
- Yadav, R.; Pradhan, A.K.; Kamwa, I. A Spectrum Similarity Approach for Identifying Coherency Change Patterns in Power System Due to Variability in Renewable Generation. IEEE Trans. Power Syst. 2019, 34, 3769–3779. [Google Scholar] [CrossRef]
- Kerby, A.; Marx, D.; Samal, A.; Adamchuck, V. Spatial Clustering Using the Likelihood Function. In Proceedings of the Seventh IEEE International Conference on Data Mining Workshops (ICDMW 2007), Omaha, NE, USA; 2007; pp. 637–642. [Google Scholar] [CrossRef]
- Li, K.; Cao, X.; Ge, X.; Wang, F.; Lu, X.; Shi, M.; Yin, R.; Mi, Z.; Chang, S. Meta-heuristic optimization-based two-stage residential load pattern clustering approach considering intra-cluster compactness and inter-cluster separation. IEEE Trans. Ind. Appl. 2020, 56, 3375–3384. [Google Scholar]
- OECD. Stat, Dataset: Technology Development, Family Size One and Greater (All Inventions). Available online: https://stats.oecd.org/Index.aspx?DataSetCode=PAT_DEV# (accessed on 29 October 2022).
- Goschin, Z.; Constantin, D.-L.; Roman, M.; Ileanu, B. Specialisation and Concentration Patterns in the Romanian Economy. J. Appl. Quant. Methods 2018, 4, 95–111. [Google Scholar]
- NIBUSINESS INFO.CO.UK. Is an Official Online Channel for Business Advice and Guidance in North Ireland Created by Invest Northern Ireland & Indirect (n.d.) Guide—Assess Your Options for Business Growth. Business Growth through Diversification. Available online: https://www.nibusinessinfo.co.uk/content/business-growth-through-diversification (accessed on 30 September 2022).
- ESRI ArcGis Pro. How Multivariate Clustering Works—ArcGIS Pro|Documentation. 2020. Available online: https://pro.arcgis.com/en/pro-app/tool-reference/spatial-statistics/how-multivariate-clustering-works.htm (accessed on 30 April 2020).
- Kim, J.; Park, K. Financial development and deployment of renewable energy technologies. Energy Econ. 2016, 59, 238–250. [Google Scholar] [CrossRef]
- Lin, B.; Zhu, J. Determinants of renewable energy technological innovation in China under CO2 emissions constraint. J. Environ. Manag. 2019, 247, 662–671. [Google Scholar] [CrossRef] [PubMed]
- Gielen, D.; Boshell, F.; Saygin, D.; Bazilian, M.D.; Wagner, N.; Gorini, R. The role of renewable energy in the global energy transformation. Energy Strategy Rev. 2019, 24, 38–50. [Google Scholar] [CrossRef]
- Tran, T.T.; Smith, A.D. Incorporating performance-based global sensitivity and uncertainty analysis into LCOE calculations for emerging renewable energy technologies. Appl. Energy 2018, 216, 157–171. [Google Scholar] [CrossRef]
- Grigorescu, A.; Lincaru, C. The Skill Readiness for Energy Prosumer Behavior at the Household Level. In Brawijaya International Conference on Economics 2022, Business and Finance 2021 (BICEBF 2021); Atlantis Press: Amsterdam, The Netherlands, 2022; pp. 113–126. [Google Scholar]
- Jurasz, J.; Canales, F.A.; Kies, A.; Guezgouz, M.; Beluco, A. A review on the complementarity of renewable energy sources: Concept, metrics, application and future research directions. Sol. Energy 2020, 195, 703–724. [Google Scholar] [CrossRef]
- Miyamoto, M.; Takeuchi, K. Climate agreement and technology diffusion: Impact of the Kyoto Protocol on international patent applications for renewable energy technologies. Energy Policy 2019, 129, 1331–1338. [Google Scholar] [CrossRef]
- Hille, E.; Althammer, W.; Diederich, H. Environmental regulation and innovation in renewable energy technologies: Does the policy instrument matter? Technol. Forecast. Soc. Chang. 2020, 153, 119921. [Google Scholar] [CrossRef]
- Lin, B.; Chen, Y. Does electricity price matter for innovation in renewable energy technologies in China? Energy Econ. 2019, 78, 259–266. [Google Scholar] [CrossRef]
- Yang, F.; Cheng, Y.; Yao, X. Influencing factors of energy technical innovation in China: Evidence from fossil energy and renewable energy. J. Clean. Prod. 2019, 232, 57–66. [Google Scholar] [CrossRef]
- Nicolli, F.; Vona, F. Heterogeneous policies, heterogeneous technologies: The case of renewable energy. Energy Econ. 2016, 56, 190–204. [Google Scholar] [CrossRef]
- Murshed, M.; Rahman, M.A.; Alam, M.S., Ahmad; Ahmad, P.; Dagar, V. The nexus between environmental regulations, economic growth, and environmental sustainability: Linking environmental patents to ecological footprint reduction in South Asia. Environ. Sci. Pollut. Res. 2021, 28, 49967–49988. [Google Scholar] [CrossRef] [PubMed]
- Cheng, Y.; Yao, X. Carbon intensity reduction assessment of renewable energy technology innovation in China: A panel data model with cross-section dependence and slope heterogeneity. Renew. Sustain. Energy Rev. 2021, 135, 110157. [Google Scholar] [CrossRef]
- Sun, Y.; Razzaq, A.; Sun, H.; Irfan, M. The asymmetric influence of renewable energy and green innovation on carbon neutrality in China: Analysis from non-linear ARDL model. Renew. Energy 2022, 193, 334–343. [Google Scholar] [CrossRef]
- Lin, B.; Zhu, J. The role of renewable energy technological innovation on climate change: Empirical evidence from China. Sci. Total Environ. 2019, 659, 1505–1512. [Google Scholar] [CrossRef]
- Raiser, K.; Naims, H.; Bruhn, T. Corporatization of the climate? Innovation, intellectual property rights, and patents for climate change mitigation. Energy Res. Soc. Sci. 2017, 27, 1–8. [Google Scholar] [CrossRef]
- Lazkano, I.; Nøstbakken, L.; Pelli, M. From fossil fuels to renewables: The role of electricity storage. Eur. Econ. Rev. 2017, 99, 113–129. [Google Scholar] [CrossRef]
- Van Veldhoven, Z.; Vanthienen, J. Digital transformation as an interaction-driven perspective between business, society, and technology. Electron. Mark. 2022, 32, 629–644. [Google Scholar] [CrossRef]
- Jafari-Sadeghi, V.; Garcia-Perez, A.; Candelo, E.; Couturier, J. Exploring the impact of digital transformation on technology entrepreneurship and technological market expansion: The role of technology readiness, exploration and exploitation. J. Bus. Res. 2021, 124, 100–111. [Google Scholar] [CrossRef]
- Giannelos, S.; Jain, A.; Borozan, S.; Falugi, P.; Moreira, A.; Bhakar, R.; Mathur, J.; Strbac, G. Long-Term Expansion Planning of the Transmission Network in India under Multi-Dimensional Uncertainty. Energies 2021, 14, 7813. [Google Scholar] [CrossRef]
- Frerk, M. Investing for Net Zero in the Face of Uncertainty: Real Options and Robust Decision-Making; Working Paper; The Oxford Martin School Programme on Integrating Renewable Energy: Oxford, UK, 2021; Available online: https://www.oxfordmartin.ox.ac.uk/downloads/academic/Oxford-strategic-investment-150321.pdf (accessed on 1 November 2021).
| Disclaimer/Publisher’s Note: The statements, opinions and data contained in all publications are solely those of the individual author(s) and contributor(s) and not of MDPI and/or the editor(s). MDPI and/or the editor(s) disclaim responsibility for any injury to people or property resulting from any ideas, methods, instructions or products referred to in the content. |
© 2023 by the authors. Licensee MDPI, Basel, Switzerland. This article is an open access article distributed under the terms and conditions of the Creative Commons Attribution (CC BY) license (https://creativecommons.org/licenses/by/4.0/).


