Article

Empowering Sustainable Energy Solutions through Real-Time Data, Visualization, and Fuzzy Logic

1
Institute of Spatial Management and Socio-Economic Geography, University of Szczecin, 70-453 Szczecin, Poland
2
Institute of Economics and Finance, University of Szczecin, 70-453 Szczecin, Poland
*
Author to whom correspondence should be addressed.
Energies 2023, 16(21), 7451; https://doi.org/10.3390/en16217451
Submission received: 2 October 2023 / Revised: 19 October 2023 / Accepted: 3 November 2023 / Published: 5 November 2023
(This article belongs to the Special Issue Fuzzy Decision Support Systems for Efficient Energy Management)

Abstract

:
This article shows the evaluation of the Integrated Real-time Energy Management Framework (IREMF), a cutting-edge system designed to develop energy management practices. The framework leverages real-time data collection, advanced visualization techniques, and fuzzy logic to optimize energy consumption patterns. To assess the performance and importance of each layer and main factor within IREMF, we employ a multi-step methodology. First, the Fuzzy Delphi Method is utilized to harness expert insights and collective intelligence, providing a holistic understanding of the framework’s functionality. Researchers used a fuzzy analytic hierarchy process (AHP) to determine the relative importance of each component of the energy system (first stage). This careful evaluation process helps ensure that resources are allocated effectively and that strategic decisions are made based on sound data. The findings of the study not only improve our understanding of the capabilities of the IREMF platform but also pave the way for future developments in energy system management. The study highlights the critical role of real-time data, visualization, fuzzy logic, and advanced decision-making methods in shaping a sustainable energy future.

1. Introduction

The world’s growing population, cities, and factories are using more and more energy. This is putting a strain on our limited fossil fuel resources and increasing carbon dioxide emissions, which are causing climate change [1]. To address these challenges, one is turning to renewable energy sources such as solar, wind, hydro, and geothermal power, which are cleaner and more sustainable [2]. One is also working to improve energy efficiency in all sectors of the economy, which means reducing the amount of energy one uses to receive the same results [3]. By using energy-efficient technologies, adopting energy management systems, and changing behaviors, one can achieve sustainable energy consumption patterns [4].
Energy stands as an essential linchpin of contemporary civilization, underpinning economic expansion, societal progress, and driving technological breakthroughs [5]. Its ubiquitous influence spans a gamut of applications, from industrial processes to residential power consumption, affirming its pivotal role across diverse sectors [6]. However, the world’s growing demand for energy and the urgent need to fight climate change and environmental damage are driving the search for sustainable energy solutions [7]. This compelling mandate has spurred the exploration of alternative energy reservoirs, the refinement of energy-efficient practices, and the innovation of dynamic energy management strategies, all geared towards forging a resilient future for humanity [8].
The quest for sustainable energy solutions has led to the exploration of advanced technologies, particularly real-time data collection and visualization tools, as well as fuzzy logic. These innovative approaches are transforming energy systems by enabling intelligent decision-making and sophisticated energy management, thereby offering a dynamic method to optimize energy consumption [9]. By analyzing large datasets, identifying consumption patterns, and creating accurate predictive models, these methodologies empower key stakeholders, including energy policymakers, grid operators, and consumers, to make informed decisions. This holistic approach not only enhances the efficiency of energy systems but also contributes to their sustainability [10,11,12].
The objective of this paper is to delve into the synergies between real-time data collection and visualization tools, as well as fuzzy logic, in the realm of energy management. This exploration underscores the transformative potential of these technologies in reshaping the landscape of energy generation, distribution, and utilization. This manuscript delineates a variety of theoretical constructs and pragmatic implementations, wherein the power of real-time data acquisition and visualization instruments can be leveraged to address the extant energy conundrums. This, in turn, paves the way for substantial contributions towards the realization of a more ecologically responsible and sustainable future.

2. The Real-Time Data Collection and Visualization in Energy Systems

The evolution of real-time data collection in energy systems marks a pivotal milestone in the quest for efficient and sustainable energy management. By integrating advanced sensor technologies and networked monitoring systems, organizations can now capture and process a wealth of dynamic energy data in real time. This influx of information offers unprecedented insights into energy consumption patterns, grid operations, and demand fluctuations [13]. Moreover, with the infusion of fuzzy logic, this data can be interpreted and analyzed with a nuanced understanding of uncertainty and imprecision. Fuzzy logic, a mathematical framework that accommodates degrees of truth and allows for flexible decision-making, lends a crucial layer of intelligence to the data processing pipeline, enabling more refined and context-aware insights [14].
The integration of real-time data collection in energy systems has profound implications for grid resilience and stability. With the ability to capture granular information about energy supply and demand in real time, grid operators can respond swiftly to fluctuating conditions [15]. Fuzzy logic further fortifies this capability by enabling intelligent decision-making in the face of uncertain or ambiguous data [16]. By employing fuzzy sets and membership functions, the system can adapt to varying degrees of truth, ensuring that responses are judiciously tailored to the prevailing conditions. This combination of real-time data collection, fuzzy logic, and rapid response mechanisms represents a formidable toolset in fortifying energy grids against disruptions and optimizing resource allocation [17].
Data visualization emerges as a critical companion to real-time data collection, translating raw streams of data into actionable insights. Advanced visualization techniques, such as interactive dashboards and 3D representations, empower stakeholders to intuitively grasp complex energy trends. When coupled with fuzzy logic, these visualizations can convey not only precise information but also the degree of uncertainty associated with it [18]. This nuanced representation is invaluable in scenarios where imprecise data points are encountered, providing decision-makers with a comprehensive understanding of the underlying complexities. Consequently, the fusion of real-time data collection, data visualization, and fuzzy logic equips energy professionals with a powerful toolkit for optimizing operations and resource allocation [19].
At the heart of this paper is the amalgamation of real-time data collection, state-of-the-art visualization tools, and the sophisticated logic of fuzzy systems, all unified by the transformative power of artificial intelligence (AI). This integrated approach represents a paradigm shift in energy system management, fundamentally altering how we perceive, analyze, and act upon energy-related data. With AI acting as the catalyst, the system gains the ability to adapt dynamically to changing conditions, discern subtle patterns within complex datasets, and make nuanced decisions in the face of uncertainty [20]. Real-time data collection ensures that information is continuously harvested, whereas advanced visualization tools provide an intuitive means of comprehending intricate energy trends [21]. The incorporation of fuzzy logic enables the system to grapple with imprecise or uncertain data, a common occurrence in the dynamic context of energy systems. Altogether, this fusion of technologies empowers organizations to optimize energy utilization, enhance efficiency, and reduce environmental impact with unprecedented precision and agility [22,23,24,25].

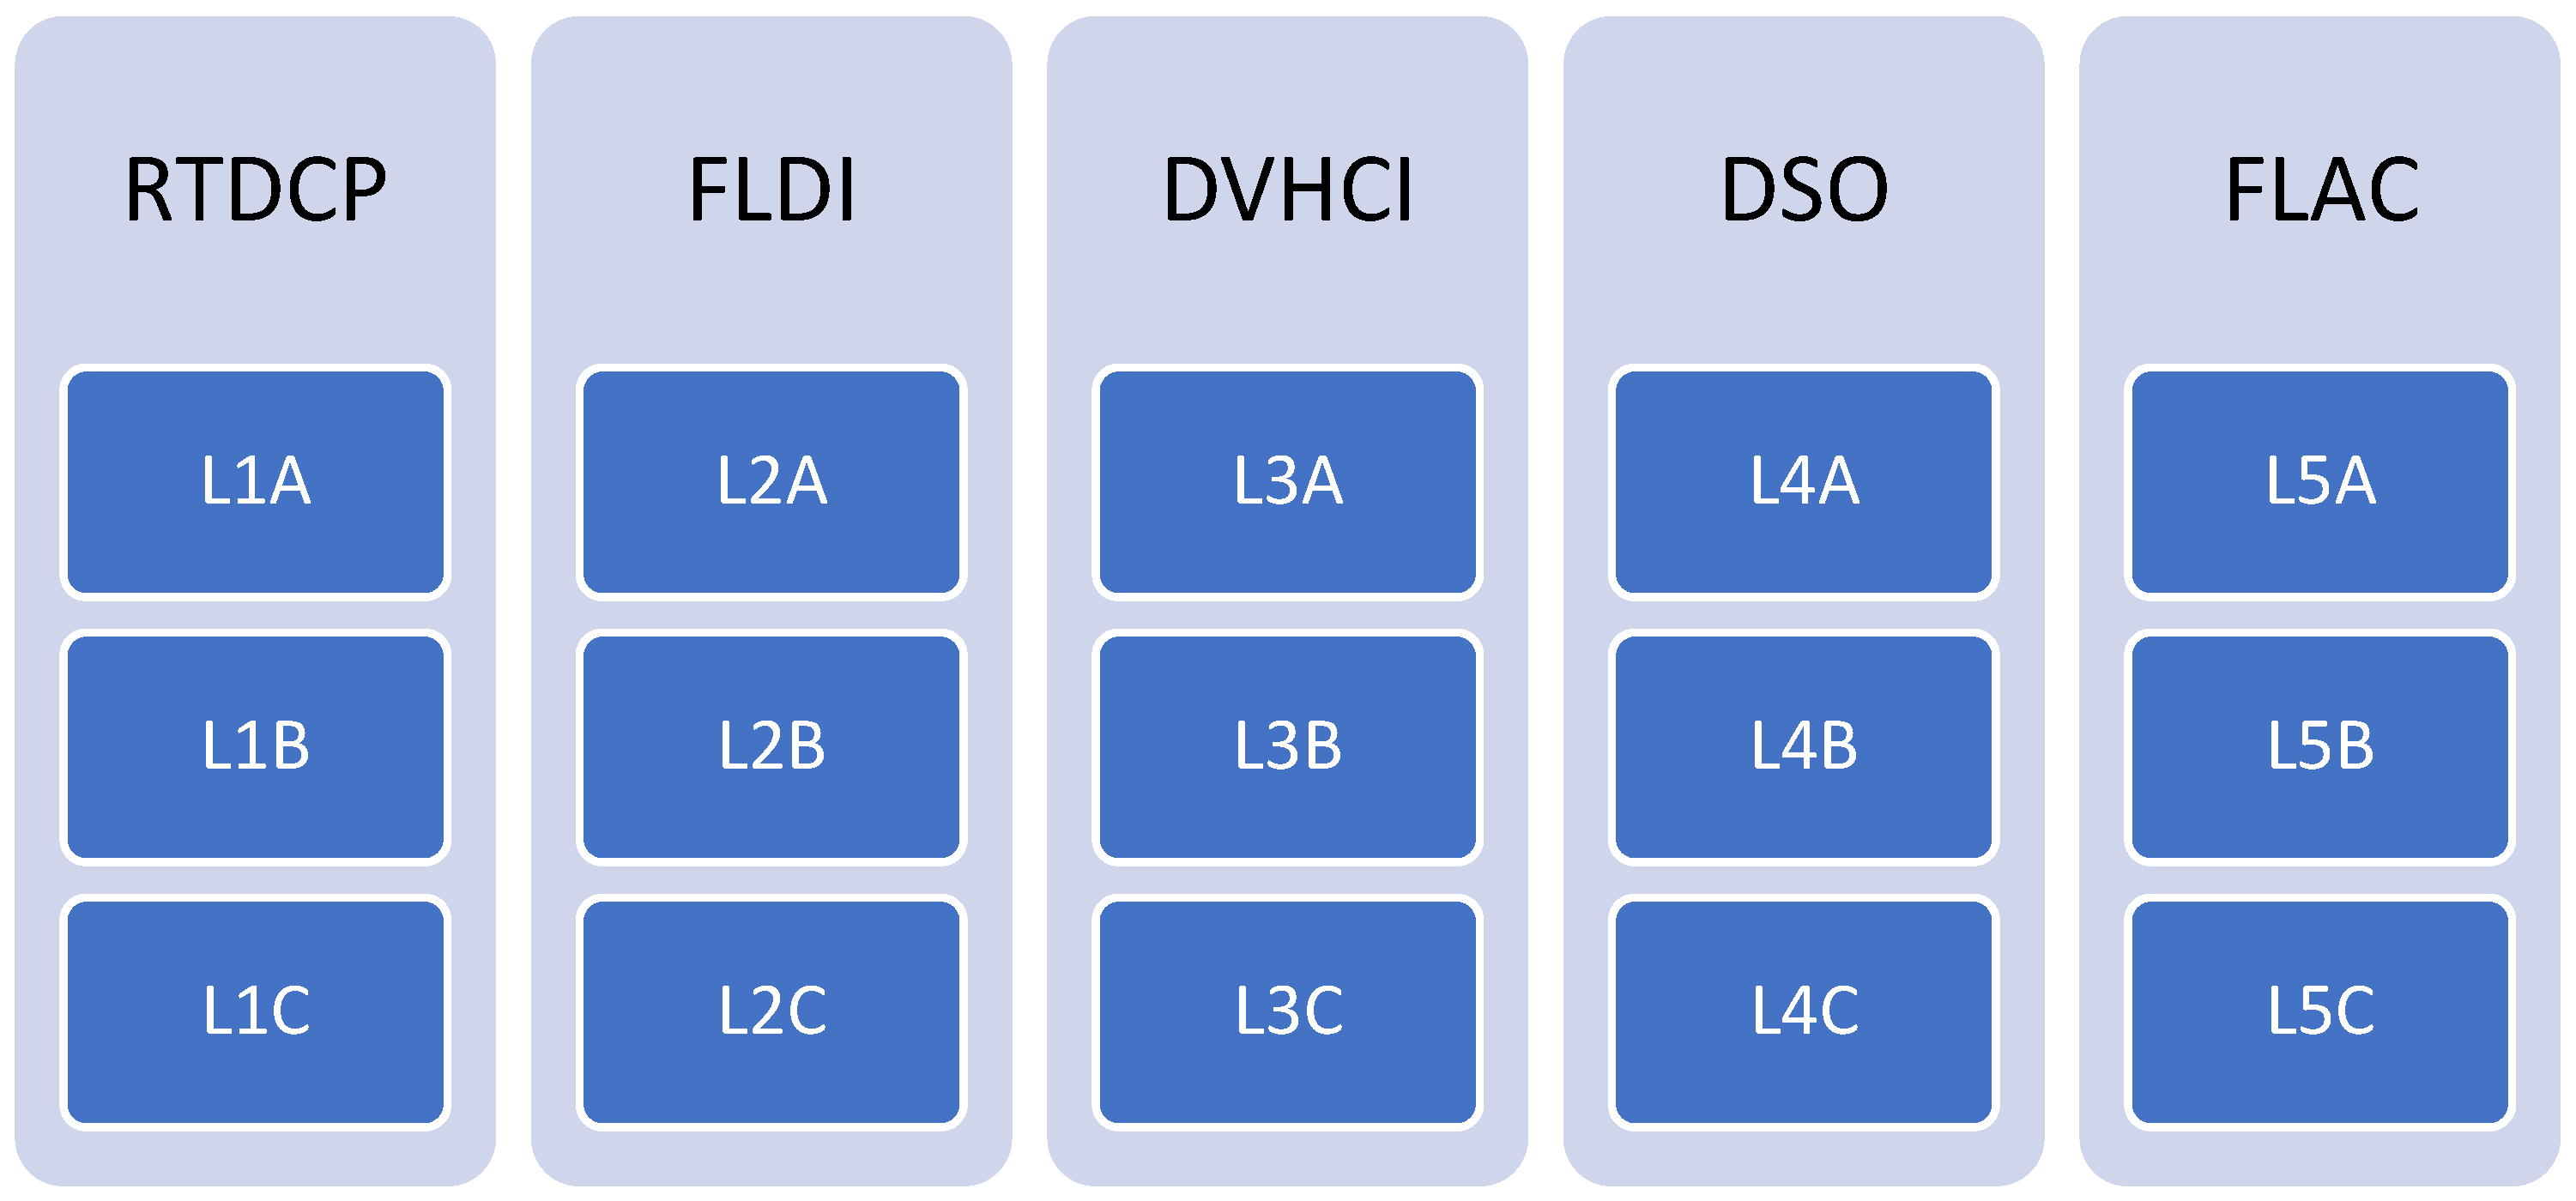
3. Integrated Real-Time Energy Management Framework (IREMF)

IREMF stands at the forefront of modern energy management paradigms, offering a cohesive and dynamic solution that addresses the pressing need for efficiency, sustainability, and resilience in energy utilization. In this framework, real-time data collection serves as the bedrock, ensuring that a continuous stream of information is captured to inform decision-making. There are six main layers in IREMF model:
Layer 1: Real-time Data Collection and Preprocessing (RTDCP)
  • L1A—Sensor Network Deployment: Placement of sensors with AI-enhanced predictive maintenance capabilities to ensure optimal performance.
  • L1B—Data Transmission and Aggregation: Utilizing AI algorithms for efficient data compression and transmission, reducing bandwidth requirements.
  • L1C—Data Preprocessing: Employing AI-powered anomaly detection techniques to identify and rectify erroneous data points.
Layer 2: Fuzzy Logic-based Data Interpretation (FLDI)
  • L2A—Fuzzy Membership Functions: Incorporating techniques to dynamically adjust membership functions based on real-time data characteristics.
  • L2B—Rule Base Creation: Leveraging machine learning algorithms to autonomously refine and expand the rule base over time.
  • L2C—Inference Engine: Enhancing the inference engine with reinforcement learning capabilities for adaptive decision-making.
Layer 3: Data Visualization and Human–computer Interaction (DVHCI)
  • L3A—Interactive Dashboards: Integrating various algorithms to tailor dashboards to individual user preferences and roles.
  • L3B—Graphical Representations: Applying AI-powered anomaly detection to visually highlight abnormal trends or patterns in the data.
  • L3C—Alerting and Notification Systems: Utilizing natural language processing for sentiment analysis in alert notifications.
Layer 4: Decision Support and Optimization (DSO)
  • L4A—Decision Support Algorithms: Implementing tools for dynamic decision-making, utilizing reinforcement learning to refine recommendations.
  • L4B—Optimization Models: Integrating AI-based predictive modeling for more accurate load forecasting and energy supply demand matching.
  • L4C—Scenario Analysis and Predictive Modeling: Employing deep learning models for more accurate and granular predictions in scenario analysis.
Layer 5: Feedback Loop and Adaptive Control (FLAC)
  • L5A—Learning and Adaptation Mechanisms: Incorporating deep reinforcement learning techniques to enable the system to learn from its own actions and adapt in real time.
  • L5B—Closed-Loop Control Systems: Employing AI-based control algorithms with predictive capabilities to anticipate system behavior and proactively make adjustments.
  • L5C—Performance Monitoring and Evaluation: Utilizing AI-powered anomaly detection to automatically identify performance deviations and trigger corrective actions.
Layer 6: Regulatory and Policy Compliance (RPC)
  • L6A—Compliance Assessment: Applying compliance monitoring tools to automatically flag potential regulatory violations and ensure adherence.
  • L6B—Reporting and Documentation: Using natural language processing and AI-driven summarization techniques to automate the generation of compliance reports.
The IREMF model integrates real-time data collection, fuzzy logic-based interpretation, advanced visualization, decision support, and adaptive control with AI-powered solutions. This comprehensive framework leverages AI’s capabilities to enhance the efficiency, adaptability, and intelligence of energy systems management, aiding in the creation of a more enduring and adaptable energy future. Here are main advantages of adopting IREMF:
  • Real-time Optimization: IREMF enables organizations to make instantaneous adjustments to energy consumption, production, and distribution.
  • Enhanced Efficiency: By harnessing the power of AI-driven decision support and optimization algorithms, IREMF maximizes energy efficiency, reducing waste and operational costs.
  • Adaptability to Uncertainty: The incorporation of fuzzy logic allows IREMF to effectively handle imprecise or uncertain data, ensuring accurate decision-making even in dynamic and uncertain energy environments.
  • Predictive Capabilities: Through the integration of AI-powered predictive modeling, IREMF can anticipate future energy demands, enabling proactive measures to be taken to meet evolving needs.
  • Resilient Grid Operations: IREMF’s real-time data collection and adaptive control mechanisms fortify energy grids, enabling them to respond swiftly to fluctuations in demand, ensuring stability and reliability.
  • Compliance and Regulatory Adherence: The model’s ability to monitor and report on energy-related metrics ensures organizations remain in compliance with local, regional, and international energy regulations.
  • Sustainable Practices: IREMF promotes supportable energy management by minimizing environmental impact, contributing to a more sustainable future.
Although the IREMF presents numerous advantages, it is crucial to also weigh potential drawbacks. Below are some considerations regarding its potential disadvantages:
  • Implementation Costs: The initial investment required to deploy IREMF, including the integration of sensors, AI systems, and visualization tools, may be substantial and could pose a barrier for some organizations.
  • Complexity of Integration: Integrating diverse technologies and ensuring seamless interoperability can be a complex undertaking, requiring specialized expertise and careful planning.
  • Data Security and Privacy Concerns: As IREMF relies heavily on real-time data collection, organizations must implement robust cybersecurity measures to safeguard sensitive information from potential threats or breaches.
  • Dependence on Technology Infrastructure: Reliance on a sophisticated technological infrastructure may leave organizations vulnerable to disruptions in the event of system failures or cyber-attacks.
  • Learning Curve for Stakeholders: Training and familiarizing stakeholders with the intricacies of IREMF, particularly in interpreting data and utilizing advanced visualization tools, may pose challenges.
  • Regulatory Compliance Complexity: Adhering to evolving energy regulations and policies may require ongoing adjustments and enhancements to the IREMF model, potentially incurring additional costs.
  • Scalability Challenges: Scaling IREMF to meet the needs of larger, more complex energy systems may require significant adjustments and expansions, potentially leading to logistical challenges.
The Integrated Real-time Energy Management Framework (IREMF) brings forth a host of benefits in energy system management. It enables real-time optimization, enhancing efficiency and resilience in energy utilization. Through the incorporation of fuzzy logic and AI technology, IREMF adapts dynamically to uncertain data, predicts future demands, and ensures compliance with energy regulations. However, implementing IREMF may incur high initial costs and require a complex integration process. Data security concerns and the need for a robust technological infrastructure also pose potential challenges. Additionally, training stakeholders and addressing scalability for larger energy systems may necessitate additional investments and resources.

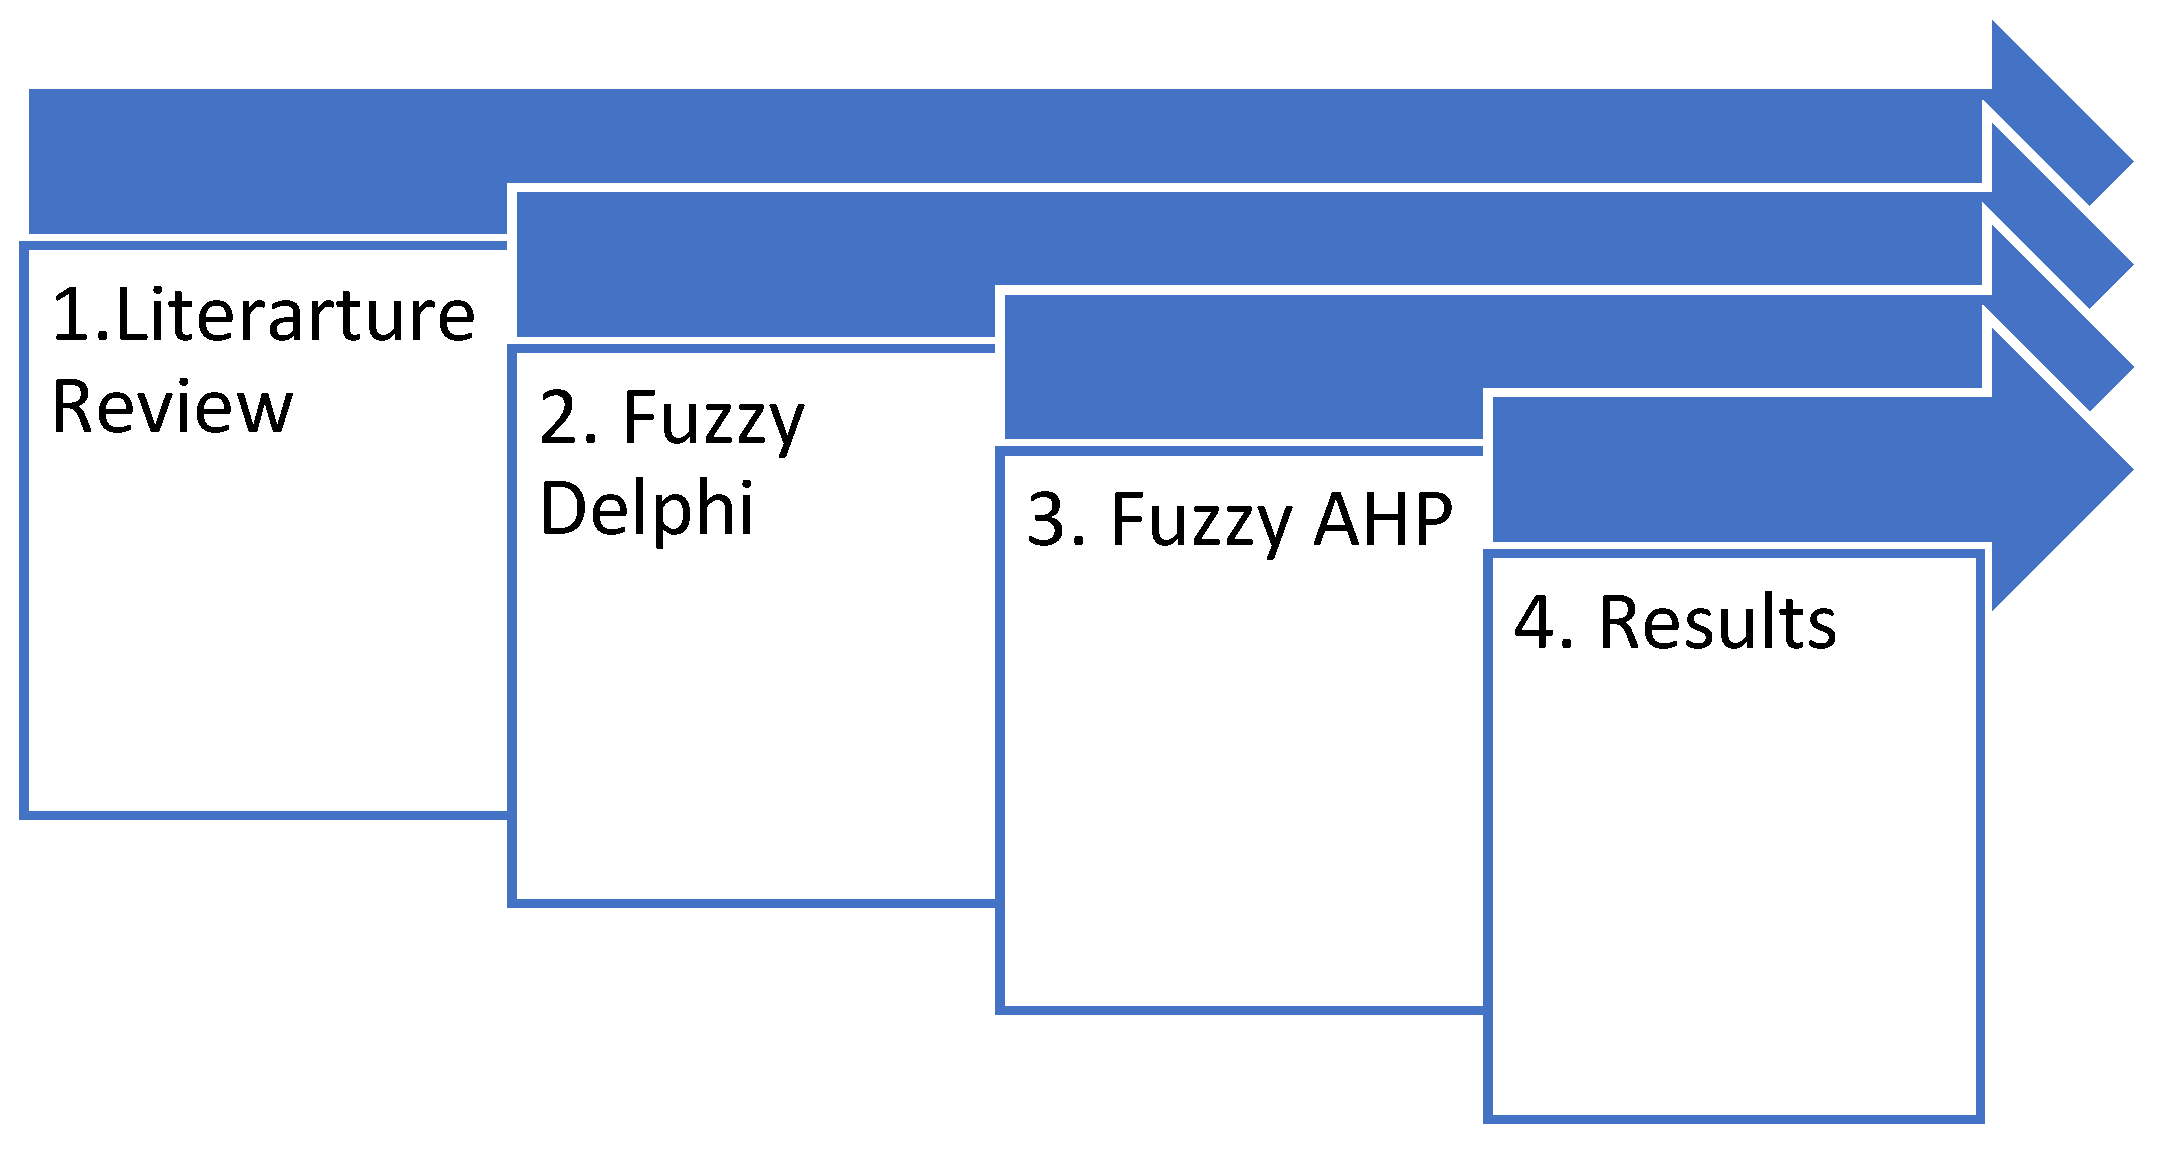
4. Research Design and Methodology

The research adopts a comprehensive approach to evaluate the Integrated Real-time Energy Management Framework (IREMF) by employing advanced fuzzy decision-making techniques. The assessment process involves two pivotal methodologies: the Fuzzy Delphi Method [26,27] and Fuzzy Analytic Hierarchy Process (FAHP) [28,29]. Initially, the Fuzzy Delphi Method will be applied to harness expert opinions and collective intelligence for the evaluation of every layer and main factor within IREMF. This inclusive assessment aims to elicit and aggregate diverse perspectives, ensuring a comprehensive understanding of the framework’s performance. Subsequently, the Fuzzy method will be employed to ascertain the relative importance and weights assigned to each layer and factor. These weightings are pivotal for prioritizing and allocating resources effectively, thus influencing the future development and successful implementation of IREMF. The research underscores the critical role these weightings play in steering the trajectory of future projects, ensuring their alignment with the overarching objectives of IREMF for efficient and sustainable energy management.
The research process begins with a comprehensive review of existing literature on the subject. This is followed by an assessment of the IREMF model using the Fuzzy Delphi method [30]. Next, the Fuzzy AHP method [31] is employed to determine the weights for the layers and main factors. The final steps involve interpreting the results and formulating development recommendations. The research model encompasses four pivotal steps in its evaluation approach (Figure 1).
The initial phase involves the utilization of the Fuzzy Delphi method to validate the layers and factors proposed in the IREMF model. In academic discourse, the Delphi method is characterized as a technique to structure group communication, aiming to enhance the problem-solving efficiency of a collective of independent individuals. The Delphi technique is categorized among creative thinking research methods and defined as an iterative evaluation procedure based on selection analysis of empirical data gathered. Given that the conventional Delphi method has certain constraints, including lengthy procedure time and associated high research costs, its modification, the Fuzzy Delphi method, is often employed in scientific research [32,33].
For the purposes of this investigation, an expert panel was assembled, proposing 6 layers and 17 associated factors. The panel comprised six experts in the field of energy management and three experts specializing in modern technologies and real-time data collection. The expert panel’s process was divided into several stages.
The first stage involved the evaluation of the proposed layers. This was followed by the assessment of the primary factors for each layer. Next, the values obtained were fuzzified using triangular fuzzy numbers. The fourth stage entailed data aggregation, after which the aggregated data were defuzzified. An acceptance threshold was then established, culminating in the acceptance of layers and factors. This systematic approach ensured a comprehensive and rigorous analysis of the proposed layers and factors.
Upon the determination of the triangular fuzzy spectrum, the linguistic expressions (opinions) of the experts were gathered and subsequently fuzzified, as depicted in Table 1. In the ensuing step, the opinions of the experts were amalgamated in accordance with Formula (1). The lower fuzzy number l (min) signifies the smallest conceivable value for the layer (or factor) as perceived by the experts, whereas the upper fuzzy number u (max) denotes the largest conceivable value for the layer (or factor) as perceived by the experts. The geometric mean (middle fuzzy number m) represents the most likely value of each layer and factor.
F a g r = ( m i n { l } , ( i = 1 n { m } ) 1 n , max { u } )
To determine the acceptance threshold for the layer and factor, the aggregated values were subjected to defuzzification using the Centre of Area method, as per Formula (2):
C O A = ( l + m + u ) 3
The final step in this phase involved setting the acceptance threshold at S = 0.6. This threshold was used to filter and select the suitable layers and factors. As a result, 5 out of the 6 proposed layers were accepted (as shown in Table 2), and 15 out of the 17 proposed factors met the acceptance criteria.
A graphical representation of the IREMF model is shown in Figure 2, along with all 15 main factors responsible for the proper operation of the energy management system.
The next stage of this investigation seeks to determine the weights for the identified layers and factors using the Fuzzy Analytic Hierarchy Process (FAHP) [34]. The Analytic Hierarchy Process (AHP) is a renowned multi-criteria decision-making method, designed to tackle complex problems across various fields. The fundamental principle of the AHP method is its ability to break down the decision problem into a hierarchical structure and then choose the best solution based on the defined criteria and sub-criteria (layers and factors). However, a significant limitation of the AHP method is its inability to handle uncertainties or inaccuracies inherent in group decision-making. To overcome these limitations, a combination of AHP and fuzzy theory, known as FAHP, has been proposed [16]. An essential step in the FAHP process is the creation of a pairwise comparison matrix. In this step, crisp numerical values are transformed into fuzzy numbers using a specific membership function, often using the triangular membership function described in Formula (3). This transformation follows Saaty’s fundamental scale, as explained in Table 3, which outlines the scale of relative importance.
A ˜ = ( l , m , u )
The primary objective of pairwise comparisons is to ascertain the extent to which one element supersedes another in terms of their relative significance. If element A is exceedingly preferred over B, the fuzzy number is denoted as A ˜ = (6, 7, 8), and the fuzzy reciprocal value is represented as A ˜ 1 = ( 1 8 , 1 7 , 1 6 ) , in accordance with Formula (4).
A ˜ 1 = ( u , m , l ) 1
In the subsequent stage of the research, the Consistency Ratio (C.R.) is scrutinized. It is posited that for matrices of dimensions 3 × 3 and 4 × 4, the C.R. value should be confined within 5% and 8%, respectively. For larger matrices, the C.R. should not surpass 10% (C.R. ≤ 10%). If the consistency ratio C.R. adheres to these stipulated thresholds, the pairwise comparisons executed are considered consistent. On the contrary, if the C.R. exceeds 10%, it necessitates a reassessment of criteria to rectify the inconsistency in pairwise comparisons. During this phase, the FAHP method entails computing a defuzzied, normalized matrix for selected criteria and pinpointing the largest eigenvalue (λmax) of the matrix. The method’s progenitor demonstrated that pairwise comparisons tend to exhibit greater consistency when the λmax value closely approximates the number of matrix elements (n). Consequently, the Consistency Index (C.I.) is computed in accordance with Formula (5).
C . I . = λ m a x n n 1
and C.R. to Formula (6),
C . R . = 100 % × C . I . R . I .
where R.I. represents a random consistency index, which is derived from several thousand matrices and presented by the author in the form of Table 4.
Once the consistency of the experts’ opinions has been confirmed, the fuzzy geometric mean r ˜ i (as per Formula (7)) and the fuzzy weights w ˜ i for all the criteria were computed (in accordance with Formula (8)).
r ˜ i = ( ( i = 1 n { l } ) 1 n , ( i = 1 n { m } ) 1 n , ( i = 1 n { u } ) 1 n )
w ˜ i = r ˜ i ( r ˜ 1 r ˜ 2 r ˜ n ) 1
Subsequently, the fuzzy weights were defuzzified into crisp values wi using the Centre of Area method (as per Formula (9)) and then normalized to yield w_(i-norm) values, in accordance with Formula (10).
w i = ( l i + m i + u i ) 3
w i - n o r m = w i i = 1 n w i
In the concluding phase, the aggregation of results from nine experts was executed utilizing the geometric mean. This procedure yielded the ultimate weights for the six specified layers (refer to Table 5, Table 6 and Table 7).
Following this, the subsequent phase in the Fuzzy Analytic Hierarchy Process (FAHP) entailed the application of the identical analytical methodology (as delineated in Formulas 3–10) to all factors within each layer.
Within the research framework presented here, this analytical process encompassed six layers, entailing the comparison of all factors within each respective group. This extensive analysis was conducted by a panel of nine experts, resulting in the generation of a total of 36 tables. Given the intricacy of the empirical data, this article provides only select excerpts of this calculation.
Following the acceptance (FAHP consistency test, CR < 10%) and combination (geometric mean) of the assessments from the 9 experts for all pairwise comparisons (layers and factors), the results yielded: weights for the 5 layers, local weights for the 15 factors and global weights for the 15 factors, which were calculated as the product of the layer weight and local factor weight.

5. Discussion

The Integrated Real-time Energy Management Framework (IREMF) stands at the forefront of modern energy management paradigms, offering a cohesive and dynamic solution for optimizing energy utilization and enhancing grid stability. As the quest for effective and supportable energy answers intensifies, the adaptability of IREMF becomes increasingly evident. Recognizing the diverse landscapes in which energy management operates, we propose four distinct variants of IREMF, each tailored to specific scenarios. These variants reflect the paramount importance of adapting IREMF to address the unique challenges and opportunities presented by different domains. Here, we delve into the significance of these variations and their pivotal roles in shaping the future of energy management.
Here are four variants of the Integrated Real-time Energy Management Framework (IREMF) for future analysis and development, each with distinct configurations in terms of layers and main factors:
Variant 1: IREMF with Enhanced Data Analytics:
  • Real-time Data Collection and Preprocessing
  • Advanced Data Analytics and Machine Learning
  • Data Visualization and Human–Computer Interaction
  • Decision Support and Optimization
  • Feedback Loop and Adaptive Control
Enhanced Data Analytics: This variant places a strong emphasis on leveraging advanced data analytics techniques, including machine learning, for in-depth analysis of real-time energy data. This layer is equipped with predictive modeling and anomaly detection capabilities.
Variant 2: IREMF with IoT Integration:
  • IoT-enabled Real-time Data Collection
  • Fuzzy Logic-based Data Interpretation
  • Visualization and User Interface Design
  • AI-driven Decision Support
  • Adaptive Control and IoT Feedback Loop
IoT Integration: This variant incorporates a dedicated layer for IoT-enabled data collection, allowing for a more extensive network of sensors and devices to provide real-time data. This layer enhances the granularity and scope of data collection.
Variant 3: IREMF with Demand Response Emphasis:
  • Real-time Data Collection and Preprocessing
  • Fuzzy Logic-based Data Interpretation
  • Visualization and Human–computer Interaction
  • Demand Response Optimization
  • Feedback Loop and Adaptive Control
Demand Response Optimization: This variant places a significant focus on optimizing demand response mechanisms, enabling the system to dynamically adapt energy consumption patterns to align with grid conditions and cost-effectiveness goals.
Variant 4: IREMF for Microgrid Management:
  • Microgrid Data Aggregation and Preprocessing
  • Fuzzy Logic-based Data Interpretation for Microgrid
  • Visualization and Human–computer Interaction for Microgrid
  • Optimization for Microgrid Operations
  • Feedback Loop and Adaptive Control for Microgrid
Microgrid Focus: This variant is tailored specifically for managing microgrids, with layers and factors designed to address the unique challenges and requirements of decentralized energy systems.
The diverse scenarios addressed by our four variants exemplify the adaptability and versatility of IREMF. Through these tailored solutions, we seek to empower industries, microgrid operators, and other stakeholders with the precise tools necessary to maximize efficiency, optimize demand response, and ensure regulatory compliance. By honing in on the unique features of each context, these variants promise to revolutionize energy management practices, resulting in not only improved operational efficiency but also reduced environmental impact.
In practical application, these tailored solutions are poised to bring about transformative changes. For industries, the specialized variant offers a set of precise tools meticulously designed to optimize energy consumption within complex industrial processes. This means that manufacturers and industrial operators can now harness the power of IREMF to streamline their operations, reduce energy wastage, and ultimately enhance their bottom line. This innovation contributes to the body of theoretical knowledge by demonstrating how a nuanced understanding of industry-specific processes can be translated into an effective energy management strategy.
Similarly, for microgrid operators, the dedicated variant represents a monumental leap forward in the management of decentralized energy systems. By providing a framework that is finely tuned to the unique challenges and requirements of microgrids, IREMF empowers operators to make more informed decisions in real-time. This, in turn, leads to greater stability and reliability in energy supply, fostering a more resilient and sustainable energy ecosystem. This practical application advances theory by showcasing how a tailored approach can significantly enhance the efficiency and reliability of microgrid operations, thus contributing to the broader discourse on decentralized energy management.

6. Conclusions

The research delves into the Integrated Real-time Energy Management Framework (IREMF), an innovative model designed to revolutionize energy management practices. Initially, a comprehensive evaluation process was employed, involving the identification of five distinct layers and fifteen main factors within the IREMF framework. These layers and factors were meticulously selected based on a consensus reached by an expert panel, facilitated by the rigorous application of the Fuzzy Delphi method. This initial phase established a robust foundation for the subsequent analytical stages, ensuring that the chosen criteria were both pertinent and reflective of the framework’s multifaceted nature.
Following this, the research aimed to figure out the relative importance of the identified layers and factors, and, for this purpose, it used the first two main stages of Fuzzy Analytic Hierarchy Process (AHP). This analytical method was used to calculate exact weights for each of the five layers and their corresponding main factors. The goal of using the Fuzzy AHP method was to assess in a quantitative manner the hierarchical relationships and contributions of each component. The calculations of the weights are extremely important because they play a key role in guiding the future development and successful implementation of IREMF. They help in making decisions about resource allocation and strategy, ensuring that the framework is optimized to meet the changing needs of the energy management landscape.

Author Contributions

This paper was inspired by the assistance of artificial intelligence tools such as Chat GPT, BARD, BING AI, and DEEPL GOOGLE. The authors of this paper utilized the capabilities of the AI tools to generate ideas and assist in formulating the main concepts discussed herein. However, it is important to note that the literature review, research, methodology, and conclusions presented in this paper were conducted entirely by the authors. While the AI tools provided valuable assistance in generating ideas and content, the authors took full responsibility for the research process, including the selection of the topic, the development of the methodology, the data collection, and the interpretation of the results. The authors used their expertise in the field of new technologies, real-time data collection, visualization, AI, and energy systems to conduct the research and ensure the accuracy and reliability of the information presented. All authors have read and agreed to the published version of the manuscript.

Funding

This research was funded from the programme of the Minister of Science and Higher Education “Regional Excellence Initiative” in 2019–2023; project number 001/RID/2018/19; the amount of financing: PLN 10,684,000.00. Research results are a part of research project financed by the National Science Centre Poland (NCN) Miniatura 6 2022/06/X/HS4/01426.

Data Availability Statement

Data are contained within the article.

Conflicts of Interest

The authors declare no conflict of interest.

References

  1. Ye, Y.; Koch, S.F.; Zhang, J. Modelling Required Energy Consumption with Equivalence Scales. Energy J. 2022, 43, 123–145. [Google Scholar] [CrossRef]
  2. Gaitan, N.C.; Ungurean, I.; Corotinschi, G.; Roman, C. An Intelligent Energy Management System Solution for Multiple Renewable Energy Sources. Sustainability 2023, 15, 2531. [Google Scholar] [CrossRef]
  3. Liu, R.E.; Ravikumar, A.P.; Bi, X.T.; Zhang, S.; Nie, Y.; Brandt, A.; Bergerson, J.A. Greenhouse Gas Emissions of Western Canadian Natural Gas: Proposed Emissions Tracking for Life Cycle Modeling. Environ. Sci. Technol. 2021, 55, 9711–9720. [Google Scholar] [CrossRef]
  4. Streimikiene, D.; Kyriakopoulos, G.L.; Lekavicius, V.; Pazeraite, A. How to support sustainable energy consumption in households? Acta Montan. Slovaca 2022, 27, 479–490. [Google Scholar] [CrossRef]
  5. Su, T.; Meng, L.; Wang, K.; Wu, J. The role of green credit in carbon neutrality: Evidence from the breakthrough technological innovation of renewable energy firms. Environ. Impact Assess. Rev. 2023, 101, 107135. [Google Scholar] [CrossRef]
  6. Sun, L.; Wang, Z.; Yang, L. Efficiency and Influencing Factors of Energy Conservation and Emission Reduction in High-Energy-Consuming Industries Driven by Technological Innovation. Pol. J. Environ. Stud. 2023, 32, 3769–3785. [Google Scholar] [CrossRef] [PubMed]
  7. Oladapo, B.I.; Bowoto, O.K.; Adebiyi, V.A.; Ikumapayi, O.M. Energy harvesting analysis of hip implantin achieving sustainable development goals. Structures 2023, 55, 28–38. [Google Scholar] [CrossRef]
  8. Wang, X.; Huang, Y.; Guo, F.; Zhao, W. Energy Management Strategy based on Dynamic Programming Considering Engine Dynamic Operating Conditions Optimization. In Proceedings of the 39th Chinese Control Conference, Shenyang, China, 27–29 July 2020; Fu, J., Sun, J., Eds.; IEEE: New York, NY, USA, 2020; pp. 5485–5492. Available online: https://www.webofscience.com/wos/woscc/full-record/WOS:000629243505107 (accessed on 1 October 2023).
  9. Li, V.O.K.; Lam, J.C.K.; Han, Y.; Chow, K. A Big Data and Artificial Intelligence Framework for Smart and Personalized Air Pollution Monitoring and Health Management in Hong Kong. Environ. Sci. Policy 2021, 124, 441–450. [Google Scholar] [CrossRef]
  10. Breitbach, M.; Edinger, J.; Kaupmees, S.; Trotsch, H.; Krupitzer, C.; Becker, C. Voltaire: Precise Energy-Aware Code Offloading Decisions with Machine Learning. In Proceedings of the 2021 IEEE International Conference on Pervasive Computing and Communications (Percom), Kassel, Germany, 22–26 March 2021; IEEE: New York, NY, USA, 2021. [Google Scholar] [CrossRef]
  11. da Silva, E.T.; Martins, M.A.F.; Ferreira, A.M.S.; Rodriguez, J.L.M. A Fuzzy Approach to Assess the Perception of a Rural Community Concerning the Impact of Distributed Power Generation on Local Sustainability. Braz. Arch. Biol. Technol. 2021, 64, e21200486. [Google Scholar] [CrossRef]
  12. Abdallah, A.; Chaker, A.; Allaoui, T. An adaptive RST fuzzy logic and an adaptive PI fuzzy logic controllers of a DFIG in Wind Energy Conversion. Prz. Elektrotechniczny 2021, 97, 11–20. [Google Scholar] [CrossRef]
  13. Kwon, I.; Shin, D.; Oh, J.; Kim, C.-H.; Kim, H. Preprocessing Energy Intervals on Spectrum for Real-Time Radionuclide Identification. IEEE Trans. Nucl. Sci. 2021, 68, 2202–2209. [Google Scholar] [CrossRef]
  14. Harb, H.; Nader, D.A.; Sabeh, K.; Makhoul, A. Real-time Approach for Decision Making in IoT-based Applications. In Proceedings of the 11th International Conference on Sensor Networks (Sensornets), Online, 7–8 February 2021; Prasad, R.V., Pesch, D., Ansari, N., BenaventePeces, C., Eds.; Scitepress: Setubal, Portugal, 2021; pp. 223–230. [Google Scholar] [CrossRef]
  15. Smith, O.; Cattell, O.; Farcot, E.; O’Dea, R.D.; Hopcraft, K. The effect of renewable energy incorporation on power grid stability and resilience. Sci. Adv. 2022, 8, eabj6734. [Google Scholar] [CrossRef] [PubMed]
  16. Boutkhoum, O.; Hanine, M.; Agouti, T.; Tikniouine, A. A decision-making approach based on fuzzy AHP-TOPSIS methodology for selecting the appropriate cloud solution to manage big data projects. Int. J. Syst. Assur. Eng. Manag. 2017, 8 (Suppl. S2), 1237–1253. [Google Scholar] [CrossRef]
  17. Zulfiqar, M.; Kamran, M.; Rasheed, M.B. A blockchain-enabled trust aware energy trading framework using games theory and multi-agent system in smat grid. Energy 2022, 255, 124450. [Google Scholar] [CrossRef]
  18. Zehra, S.S.; Wood, M.J.; Grimaccia, F.; Mussetta, M. A Cost-Effective Fuzzy-based Demand-Response Energy Management for Batteries and Photovoltaics. In Proceedings of the 2023 11th International Conference on Smart Grid, Icsmartgrid, Paris, France, 4–7 June 2023; IEEE: New York, NY, USA, 2023. [Google Scholar] [CrossRef]
  19. Singh, V.K.; Govindarasu, M. A Novel Architecture for Attack-Resilient Wide-Area Protection and Control System in Smart Grid. In 2020 Resilience Week (RWS); IEEE: New York, NY, USA, 2020; pp. 41–47. [Google Scholar] [CrossRef]
  20. Aljohani, T.M.; Ebrahim, A.; Mohammed, O. Real-Time metadata-driven routing optimization for electric vehicle energy consumption minimization using deep reinforcement learning and Markov chain model. Electr. Power Syst. Res. 2021, 192, 106962. [Google Scholar] [CrossRef]
  21. Matthieu, M.; Toufik, A.; Mehdi, M.; Chaibet, A. Real-time and multi-layered energy management strategies for fuel cell electric vehicle overview. In Proceedings of the 2022 IEEE 95th Vehicular Technology Conference: VTC2022-Spring, Helsinki, Finland, 19–22 June 2022; IEEE: New York, NY, USA, 2022. [Google Scholar] [CrossRef]
  22. Mdluli, N.; Sharma, G.; Akindeji, K.; Narayanan, K.; Sharma, S. Development of short term solar radiation forecasting using AI techniques. In Proceedings of the 30th Southern African Universities Power Engineering Conference (Saupec 2022), Durban, South Africa, 25–27 January 2022; IEEE: New York, NY, USA, 2022. [Google Scholar] [CrossRef]
  23. Strezoski, L. Distributed energy resource management systems-DERMS: State of the art and how to move forward. Wiley Interdiscip. Rev. Energy Environ. 2023, 12, e460. [Google Scholar] [CrossRef]
  24. Akkaoui, R.; Stefanov, A.; Palensky, P.; Epema, D.H.J. A Taxonomy and Lessons Learned from Blockchain Adoption within the Internet of Energy Paradigm. IEEE Access 2022, 10, 106708–106739. [Google Scholar] [CrossRef]
  25. Bokkisam, H.R.; Singh, S.; Acharya, R.M.; Selvan, M.P. Blockchain-based Peer-to-Peer Transactive Energy System for Community Microgrid with Demand Response Management. CSEE J. Power Energy Syst. 2022, 8, 198–211. [Google Scholar] [CrossRef]
  26. Ribeiro, A.S.; DeCastro, M.; Costoya, X.; Rusu, L.; Dias, J.M.; Gomez-Gesteira, M. A Delphi method to classify wave energy resource for the 21st century: Application to the NW Iberian Peninsula. Energy 2021, 235, 121396. [Google Scholar] [CrossRef]
  27. Shah, S.A.A.; Cheng, L. Evaluating renewable and sustainable energy impeding factors using an integrated fuzzy-grey decision approach. Sustain. Energy Technol. Assess. 2022, 51, 101905. [Google Scholar] [CrossRef]
  28. Dey, B.; Roy, B.; Datta, S. Identification and prioritisation of barriers and drivers for achieving ethanol blending target in India using Delphi-PESTEL-Fuzzy-AHP method. Environ. Dev. Sustain. 2022, I, 143–156. [Google Scholar] [CrossRef]
  29. Saraswat, S.K.; Digalwar, A.K.; Yadav, S.S. Sustainability Assessment of Renewable and Conventional Energy Sources in India Using Fuzzy Integrated AHP-WASPAS Approach. J. Mult. Valued Log. Soft Comput. 2021, 37, 335–362. [Google Scholar]
  30. Noor, N.M.; Rasli, A.; Rashid, M.A.A.; Mubarak, M.F.; Abas, I.H. Ranking of Corporate Governance Dimensions: A Delphi Study. Adm. Sci. 2022, 12, 173. [Google Scholar] [CrossRef]
  31. Saaty, T.L. Fundamentals of Decision Making and Priority Theory with the Analytic Hierarchy Process; RWS Publications: New York, NY, USA, 2012. [Google Scholar]
  32. Li, S.; Gu, X. A Risk Framework for Human-centered Artificial Intelligence in Education: Based on Literature Review and Delphi-AHP Method. Educ. Technol. Soc. 2023, 26, 187–202. [Google Scholar] [CrossRef]
  33. Ullah, S.; Jianjun, Z.; Hayat, K.; Palmucci, D.N.; Durana, P. Exploring the factors for open innovation in post-COVID-19 conditions by fuzzy Delphi-ISM-MICMAC approach. Eur. J. Innov. Manag. 2021; ahead of print. [Google Scholar] [CrossRef]
  34. Turk, A.; Ozkok, M. Shipyard location selection based on fuzzy AHP and TOPSIS. J. Intell. Fuzzy Syst. 2020, 39, 4557–4576. [Google Scholar] [CrossRef]
Figure 1. Research design and methodology. Source: own elaboration.
Energies 16 07451 g001
Figure 2. Five layers of IREMF model with main factors. Source: own elaboration.
Energies 16 07451 g002
Table 1. Triangular fuzzy number of seven-point Likert scale.
Extremely UnimportantVery UnimportantUnimportantMerely ImportantImportant Very ImportantExtremely Important
(0; 0; 0.1)(0; 0.1; 0.3)(0.1; 0.3; 0.5)(0.3; 0.5; 0.75)(0.5; 0.75; 0.9)(0.75; 0.9; 1)(0.9; 1; 1)
Source: own elaboration.
Table 2. Fuzzification and data aggregation for 6 layers of IREMF model.
LayerExpert 1Expert 9lmuCoAResult
RTDCP0.9; 1; 10.9; 1; 10.750.941.000.90Accepted
FLDI0.9; 1; 10.9; 1; 10.500.901.000.80Accepted
DVHCI0.75; 0.9; 10.9; 1; 10.750.821.000.81Accepted
DSO0.75; 0.9; 10.9; 1; 10.500.921.000.81Accepted
FLAC0.5; 0.75; 0.90.75; 0.9; 10.500.821.000.77Accepted
RPC0.1; 0.3; 0.50.3; 0.5; 0.750.200.720.680.57Not accepted
Source: own elaboration.
Table 3. The fundamental scale for pairwise comparisons [28].
Intensity of ImportanceExplanationAHPFAHP (l, m, u)
Equal importanceElement a and b contribute equally to the objective1(1, 1, 1)
Moderate importance of one over anotherSlightly favor element A over B3(2, 3, 4)
Essential importanceStrongly favor element A over B5(4, 5, 6)
Demonstrated importanceElement A is favored very strongly over B7(6, 7, 8)
Absolute importanceThe evidence favoring element A over B is of the highest possible order of importance9(9, 9, 9)
Intermediate values between the two adjacent judgments When compromise is needed. For example, 4 can be used for the intermediate value between 3 and 52, 4, 6, 8(1, 2, 3)
(3, 4, 5)
(5, 6, 7)
(7, 8, 9)
Source: [31].
Table 4. Consistency indices for a randomly generated matrix.
n123456789101112131415
R.I.000.520.891.111.251.351.401.451.491.521.541.561.581.59
Source: [31].
Table 5. Pairwise comparison of five layers and weight calculations by Expert 1–part 1.
RTDCPFLDIDVHCIDSOFLAC
RTDCP1.001.001.001.001.001.000.330.501.000.330.501.000.330.501.00
FLDI1.001.001.001.001.001.000.330.501.000.330.501.000.330.501.00
DVHCI1.002.003.031.002.003.001.001.001.001.002.003.001.001.001.00
DSO1.002.003.031.002.003.030.330.501.001.001.001.001.001.001.00
FLAC1.002.003.031.002.003.031.001.001.001.001.001.001.001.001.00
Table 6. Pairwise comparison of five layers and weight calculations by Expert 1–part 2.
Geometric MeanFuzzy WeightCenter of AreaWeight
lmulmu
RTDCP0.510.661.000.070.120.260.1513.54%
FLDI0.520.661.000.070.120.260.1513.55%
DVHCI1.001.521.940.140.290.510.3127.57%
DSO0.801.151.560.110.220.410.2521.78%
FLAC1.001.321.560.140.250.410.2723.56%
Sum3.835.307.05 Sum1.10100.00%
Reciprocal0.140.190.26
Source: own elaboration.
Table 7. List of all 15 factors and their weights.
Layer WeightLocal Factor WeightGlobal Weight
13.54%33.07%4.48%
13.54%28.80%3.90%
13.54%38.13%5.16%
13.55%47.80%6.48%
13.55%27.40%3.71%
13.55%24.80%3.36%
27.57%46.00%12.68%
27.57%26.60%7.33%
27.57%27.40%7.56%
21.78%38.50%8.39%
21.78%22.50%4.90%
21.78%39.00%8.49%
23.56%36.00%8.48%
23.56%33.00%7.77%
23.56%31.00%7.30%
Sum100.00%
Disclaimer/Publisher’s Note: The statements, opinions and data contained in all publications are solely those of the individual author(s) and contributor(s) and not of MDPI and/or the editor(s). MDPI and/or the editor(s) disclaim responsibility for any injury to people or property resulting from any ideas, methods, instructions or products referred to in the content.

