Abstract
The use of solar photovoltaic (PV) panels is one of the most promising ways to generate electricity. However, the complex technical parameters associated with them make the choice between different PV panels a complicated task. The aim of the article is the analysis and multi-criteria evaluation of PV panels available on the Polish market and to indicate the optimal solar PV panels according to the adopted technical criteria. The practical goal was achieved using a fuzzy approach, taking into account the uncertainty of operational parameters. Based on the applied approach and multi-criteria NEAT F-PROMETHEE method, a fuzzy decision model was built for the evaluation of PV panels. The results of this model were compared with the results of an analogous model that did not take into account the uncertainty of the data. As a result of the research, it was found that the results of the fuzzy model should be considered more reliable, because fuzzy numbers allow for capturing more data than real numbers, which translates into greater reliability of the results of the fuzzy model.
1. Introduction
Energy is of great importance for the economic development of every country in the world. Its sources include both fossil fuels: coal, gas, and crude oil; and renewable energy: sun, wind, water, biomass, hydrogen, and geothermal energy [1,2]. Fossil fuel deposits are limited. They have a negative impact on the environment and climate change. All this makes it very necessary to increase the degree of use of renewable energy sources (RES) [3]. More than 75% of the source of greenhouse gases emitted in the European Union (EU) is the production and use of energy. Reducing or completely excluding CO2 production from the EU energy system is important for achieving the climate goals for 2030. To reduce greenhouse gas emissions by at least 55% by 2030, the share of renewable energy should be increased and energy efficiency improved. It is also extremely important in the longer term, as a stage on the path leading to climate neutrality by 2050 [4].
Existing technological innovations enable the replacement of fossil fuels with low-emission solutions. This leads to an energy balance characterized by an adequacy between the generation and use of energy. The operation of a sustainable energy system is within the limits of environmental tolerance, which means that it has little or no negative impact on the environment. Moreover, it enables conducting normal economic and social activity in the country [5].
The use of RESs is currently enjoying great interest. However, the complex issues involved make the choice between different proposals for the use of RESs a complicated task. There are institutional, legal, political, technical, socio-economic, and environmental barriers to be overcome [3]. One of the more promising ways of supplying and generating electricity is the use of solar energy [6].
Solar energy can be converted into heat or electricity. Depending on the type of energy obtained, solar panels and photovoltaic (PV) panels are distinguishable. Solar panels are primarily used to heat water [7,8,9]. On the other hand, PV panels directly transform the sun rays falling on their surface into electricity [10,11,12]. The electricity generated in this way can be used to power all electrical equipment, including, for example, a heat pump. In this respect, PV panels can be considered more universal, which is why in this article we focused primarily on PV panels. However, since in the literature PV panels are most often referred to as solar PV panels, in the further part of the article we also often use this name.
Currently, several types of solar PV panel manufacturing technologies are available. They differ in the elements that are used to produce the cells that make up the panel. The elements used determine the color, structure, and efficiency of the cell. The following basic types of cells are distinguished [6,10,13,14,15,16,17,18]:
- Monocrystalline silicon—are made of melted silica sand with the addition of boron; cells produced on their basis are characterized by the highest efficiency, but also the highest price;
- Polycrystalline silicon—they are made of ground silicon, which is melted and cast in the form of a block composed of non-homogenous crystals with a diameter of several millimeters to several centimeters; the distances between the crystals weaken the efficiency of the cell compared to monocrystalline cells;
- Cadmium telluride—they are created in the process of applying a thin layer of cadmium telluride to glass or other substrate; the entire photovoltaic module is usually made of one cell;
- Copper indium gallium selenide—they can absorb more solar radiation than other cells, which is why they work well in poorer insolation;
- Amorphous silicon—they are created in the process of applying a thin layer of allotropic silicon to glass or another substrate; due to the small amount of semiconductor used and low energy consumption in the production process, their production is quick and cheap, but their efficiency is worse than other types of cells.
Monocrystalline and polycrystalline cells belong to the group of crystalline silicon cells, while amorphous silicon, cadmium telluride, and copper indium gallium selenide cells belong to the thin-film group, while amorphous cells are thin film Si, and the others belong to thin film non-Si. Thin-film cells have much worse efficiency than crystalline silicon cells. In terms of market share, there is a huge advantage for crystalline silicon cells, which have an approx. 98% share in the global market of PV panels [19].
One of the basic decision problems in the field of solar energy is the selection of the appropriate solar PV panel. In order to find the best solar PV panel, the properties of each panel should be examined, taking into account carefully selected criteria [18]. It should be noted that many of the criteria for evaluating solar PV panels are uncertain and imprecise. One of the main causes of uncertainty is the testing of PV panels under benchmark conditions. As a result of such tests, the technical characteristics of solar PV panels describe their performance in standard test conditions. Meanwhile, in the real working environment, solar PV panels obtain diametrically different values of the generated power and current–voltage characteristics. Unfortunately, articles on the selection of solar PV panels do not usually take into account the uncertainty and imprecision of PV panel operating parameters. Therefore, a research gap is visible, consisting of the need to include uncertain criteria describing the parameters of the operation of solar PV panels.
Consideration of a decision problem from the perspective of many uncertain and often contradictory criteria is possible with the use of fuzzy multi-criteria decision-making (MCDM) methods. They give the opportunity to take into account the multidimensionality of the problem under consideration and enable a comparative analysis of the assessed solar PV panels according to the considered criteria. The MCDM approach supports rational decision-making that takes into account the decision-maker’s priorities, resulting in a pareto-optimal solution combining all the decision-maker’s goals [20,21]. In other words, the MCDM methods are suitable for evaluating the available alternatives, taking into account many attributes and selecting the most advantageous of them. A relatively new method of this kind is new easy approach to fuzzy preference ranking organization method for enrichment evaluation (NEAT F-PROMETHEE). This method eliminates the basic disadvantages of other fuzzy variants of the PROMETHEE method [22], and its applicability in decision problems related to RES has been confirmed in previous studies [22,23,24,25,26].
The aim of the article and its practical contribution is to analyze and evaluate the PV panels available on the Polish market and to indicate the optimal solar PV panels according to the adopted technical criteria. In turn, the scientific contribution involves the use of a fuzzy approach that takes into account the uncertainty of operational parameters and the construction of a fuzzy decision model for the assessment of solar PV panels. Since some parameters of solar PV panels are precise, this model must combine uncertain and imprecise data with certain and precise data.
The rest of the article is prepared in the following order. Section 2 provides an overview of contemporary work on the application of MCDM methods to solar energy research. In Section 3, we discussed the research procedure and methodology. The results obtained using the developed methodology are presented in Section 4. Section 5 contains a discussion of the results, and in Section 6 we include a conclusion along with an indication of research limitations and further research directions.
2. Review of the Literature
In the contemporary literature, there are many studies on the use of renewable energy sources, including solar energy. MCDM methods have been used by the authors of scientific publications, among others, to assess PV technology as a potential alternative for future energy generation and consumption of fossil fuels [27,28,29]. In each of the cited studies, the authors used the analytic hierarchy process (AHP) method. The study by Garni et al. [28] presents a case study of Saudi Arabia. The obtained results show that PV panels are the most advantageous technologies. Next came the concentrated solar power. Ahmad and Tahar [29] set out to review the potential of various RESs for electricity generation in Malaysia. They characterized the power system as a social, technical, and institutional complex. They used an AHP method to rank renewable sources. The ranking was to serve the decision-makers in developing a strategy for the development of a sustainable electricity generation system. Also in this ranking, solar energy was indicated as the most promising RES. In turn, Seddiki and Bennadji [27] used the integrated Delphi–fuzzy AHP–fuzzy preference ranking organization method for enrichment evaluation (PROMETHEE) methodology. The authors studied the selection of the best available RES alternatives for generating electricity in a residential building. To this end, the researchers used the Delphi method, which was also used to define an initial set of criteria (environmental, social, economic, etc.). A questionnaire was used to examine the preferences of the building’s residents regarding the potential use of alternative renewable energy sources. The fuzzy AHP method was used to obtain the weights of the criteria, taking into account the uncertainty in the expert assessments. Finally, using the FPROMETHEE method, a ranking of alternative renewable energy solutions was developed, taking into account the uncertainties associated with the assessments of the alternatives. As in the previously cited studies, here various variants of PV technology also turned out to be dominant over other solutions.
The MCDM methods were also used in scientific research to indicate effective criteria for the location of solar power plants and their construction technology [30,31,32,33,34,35,36]. Chen et al. [34] examined the interdependence and influence of weights between the selection criteria for the location of solar PV farms. They used a hybrid MCDM model using decision-making trial and evaluation laboratory (DEMATEL) and DEMATEL-based analytic network process (DANP) methods based on a geographic information system (GIS). Watson and Hudson [33] used the GIS–MCDM approach in their work to assess the impact of wind and solar PV farms on the development of the region and compared the results with the existing degree of development in the study area. They used the AHP method to weigh the variables and validated them through consultation with experts who were professionals in the field of renewable energy localization. Kereush and Perovych [32] also used the AHP method in their work. They proposed a way of defining and classifying individual criteria taken into account when choosing the location of a solar PV farm. The credibility of the criteria helping decision-makers in planning new investments in solar PV power plants has been tested and proven in the pilot area (the Zastavna district within the Chernivtsi region). In turn, in the study by Vafaeipour et al. [36], a hybrid MCDM approach was applied and priorities were set for 25 dispersed cities across the country where future investments in solar PV power plants should be implemented. Stepwise weight assessment ratio analysis (SWARA) was performed to rank the identified criteria, and the weighted aggregates sum product assessment (WASPAS) method was then used for evaluation and prioritization. In the work of Sánchez-Lozano et al. [35], GIS and a combination of fuzzy AHP and fuzzy technique for order of preference by similarity to ideal solution (TOPSIS) methods were used. The fuzzy AHP method was used to weight the criteria, while the fuzzy TOPSIS method was used to rank alternative locations. In order to compare the results obtained with fuzzy TOPSIS, the elimination and choice translating reality (ELECTRE-TRI) method was additionally used. GIS was also used in the study by Kengpol et al. [30]. The aim of the study was to develop a decision support system that served for the optimal selection of a place for a solar power plant in Thailand. The study sought a location that would meet all the expectations of the decision-makers, i.e., avoiding the effects of flooding, reducing costs, time, and reducing environmental impact. Qualitative and quantitative variables based on the fuzzy AHP and TOPSIS models were integrated in the work. Fuzzy AHP was used to model linguistic ambiguity, vagueness, and incomplete knowledge. The TOPSIS method was used to rank locations based on overall performance. In a study by Mokarram et al. [31], an innovative solution was proposed to select locations for the construction of PV farms in the Fars province in Iran. In the first stage of the research, a fuzzy system was used to homogenize data from various inputs. Then, the fuzzy output data was fed into the AHP and Dempster–Shafer (DS) systems. Finally, maps were generated using fuzzy AHP (no confidence level) and fuzzy DS (at 95%, 99%, and 99.5% confidence levels), and the capabilities of both methods were compared and evaluated.
In an article by Ponce et al. [37], the problem of selection of optimal suppliers of solar PV panels for three production companies was considered, using the fuzzy TOPSIS method for this purpose. In articles by van de Kaa et al. [17], Balo and Şağbanşua [38], Kozlov and Sałabun [39], Mehr et al. [18], and Bączkiewicz et al. [40], the selection of the best PV technology or panel was considered. In each of these studies, after taking into account the adopted criteria, the most useful type of solar PV panel from a specific set of alternative solutions was indicated. In the aforementioned studies, the assessment was carried out using following MCDM methods: logarithmic fuzzy preference programming (LFPP) [17], AHP [17,38], COMET [39,40], TOPSIS [39], best–worst method (BWM) [18], MULTIMOOSRAL [18], and SPOTIS [40]. All cited studies are included in the overview presented in Table 1.

Table 1.
Applications of MCDM methods in solar PV panels study.
Among the discussed studies, the most important in the context of the purpose of this article are the works of Balo and Şağbanşua [38], Kozlov and Sałabun [39], Mehr et al. [18], and Bączkiewicz et al. [40], in which many criteria describing the technical parameters of PV panels are considered. Based on the analysis of these publications, the most important characteristics that act as criteria for the assessment of solar PV panels can be identified. These criteria are presented in Table 2.
Table 2.
Basic criteria for assessing solar PV panels.
It should be noted that the maximum power, open-circuit voltage, and short-circuit current values vary over time, as they are highly dependent on atmospheric conditions (ambient temperature, cell temperature, irradiance, etc.). In the case of maximum power, it should also be pointed out that modern solar PV panels have a positive power tolerance, so the maximum power value may actually be slightly higher than the results from the technical specification of the PV panel. The panel efficiency value also changes over time and is dependent on the age of the PV panel. In the case of each of the given criteria, there is uncertainty and imprecision regarding the numerical value of this criterion. Meanwhile, in each of the articles cited in Table 2, the assessment criteria had crisp, precise, and certain values. These criteria reflect the operating parameters of PV panels only in the standard test conditions. Moreover, in the article by Bączkiewicz et al. [40], the open-circuit voltage criterion was ill-defined because the direction of preference of this criterion was incorrectly indicated as the minimum. The indicated errors and research limitations mean that the assessment of solar PV panels in the given articles can be largely undermined. Therefore, in this study, a fuzzy approach was used to define uncertain and imprecise values of parameters describing solar PV panels. Thanks to this, the study did not use only the values obtained by PV panels in the standard test conditions, but a wider range of values of the basic characteristics of solar PV panels was captured, making their assessments more realistic.
3. Materials and Methods
3.1. Preliminaries
One of the most popular techniques for capturing the uncertainty and imprecision of data is the fuzzy set theory, developed by Zadeh [41]. Of particular importance in this context is the trapezoidal membership function , defining trapezoidal fuzzy number (TFN) . The trapezoidal membership function is described by the Formula (1) [42]:
The trapezoidal membership function is a generalization of simpler membership functions: triangular, interval, or singleton. In the literature, it is recognized that the advantage of the trapezoidal membership function over more complex representations of fuzzy sets is the ease of interpretation and ease of use [43]. Moreover, it was found that trapezoidal membership functions are a reasonable compromise between the tendency to lose too much information and the tendency to introduce forms of approximation too sophisticated from the computational point of view [44]. Therefore, using the trapezoidal membership functions, a relatively high universality is obtained, in principle without increasing the difficulty of use and interpretation. The choice of TFNs still allows the use of simpler representations, i.e., triangular fuzzy numbers (TrFNs), interval numbers (INs) and real numbers—singletons (RNs) [23,42]. Fuzzy arithmetic defines the basic operations performed on TFNs, which are the addition, subtraction, multiplication, and division of two TFNs. These algebraic operations are described by Formulas (2)–(5):
Operations on simpler fuzzy representations are carried out in the same way, assuming that for RN , dla IN and , a dla TrFN .
The NEAT F-PROMETHEE fuzzy method used in the study is based on TFNs, and, at the same time, allows the use of TrFNs, Ins, and RNs. Calculation details of the method are presented, among others, in Ziemba’s paper [22]. In the NEAT F-PROMETHEE method, a set of fuzzy alternatives defined by criteria belonging to the set is considered. The most important steps of this method are deviation mapping of alternatives, calculation of preference indices, calculation of outranking flows, and ranking of alternatives. The mapping is performed using the selected preference function (6):
Preference indices are calculated based on the Formula (7):
where is the weight of the j-th criterion. Positive, negative, and net outranking flows are determined using Formulas (8)–(10), respectively:
Then the outranking flows are defuzzified and RNs are obtained: , , and . A partial order is constructed from the positive and negative outranking flow, and the net outranking flow is used to construct a total order of the alternatives.
3.2. Uncertain Criteria and a Fuzzy Model for Assessing PV Panels
At the beginning of the development of the decision model, information about the considered set of decision alternatives was collected. The study included popular models of PV panels with a power of approx. 400 W in Poland. Their parameters are presented in Table 3.
Table 3.
Technical parameters of the analyzed solar PV panels.
On the basis of the assessment criteria used in the literature presented in Table 2 and using the information on the technical parameters of PV panels given in Table 3, a fuzzy model for the assessment of solar PV panels was developed. The criteria presented in Table 4 were used in the model.
Table 4.
Evaluation criteria for PV panels used in the study.
Criterion C1 was defined as TFN based on the characteristics: power—NOCT (PNOCT), power—STC (Pmax), positive power tolerance (PT), and temperature coefficient of Pmax (TCP) according to Formula (11):
Criterion C2 took the form TrFN using the characteristics: module efficiency (ME), guaranteed power performance after 1 year (PP1), and guaranteed power performance after 25 years (PP25) (12):
Criteria C3 and C4 are also expressed as TrFN using the characteristics, respectively: open-circuit voltage—NOCT (VOCNOCT), open-circuit voltage—STC (VOCSTC), and temperature coefficient of VOCSTC (TCV) for C3 (13), and short-circuit current—NOCT (ISCNOCT), short-circuit current—STC (ISCSTC), and temperature coefficient of ISCSTC (TCI) for C4 (14):
In the case of criteria C1, C3, and C4, as one of the values of the trapezoidal membership function, the values of power, open-circuit voltage, and short- circuit current were used, respectively, determined for standard test conditions (STC), but with the cell temperature increased by 60 °C (from 25 °C to 85 °C). It should be noted that the cell temperature of 85 °C is the maximum allowable operating temperature for all tested PV panels, so this is how the operation of the cells in peak conditions (but with high irradiance of 1000 W/m2) was included.
Criteria C5—price per watt (PW) and C6—weight (We) were taken directly from Table 3, and their values were RNs: , . Similarly, criterion C7 was expressed as RN, but its value was determined as the product of length (DL) and width (DW) dimensions and normalized to m2 (15):
The last criterion, C8, took the form of a IN , built using the following values: product warranty (PrW) and performance warranty (PfW) (16):
Table 5 presents alternative values for the following criteria, prepared in accordance with the formulas given above. The fuzzy decision model was supplemented with a preference model defining the preference functions, thresholds, and criteria weights. The preference model is presented in Table 6. The preference model uses a V-shaped preference function whose value increases linearly in the range [0, 1]. A value of 0 means that the compared alternatives have the same numerical value of a given criterion (indifference relation), and 1 means that the first of the compared alternatives outranks the second by at least the value of the preference threshold (strict preference relation). Intermediate values in the range (0, 1) indicate a weak preference relation. The preference thresholds were determined as twice the sample standard deviation, and all values of a given criterion included in the TFN were taken into account when determining it. The criteria were assigned weights in the form of linguistic values used in the NEAT F-PROMETHEE method. The most important criteria were power and price per watt. Slightly less important are module efficiency, warranty, open-circuit voltage and short-circuit current. Area and weight were considered the least important criteria. The correctness of the assigned weights was confirmed by comparing the defined importance of the criteria with the importance ranks of the criteria in the article by Mehr et al. [18]. Although in the compared article the weights are expressed numerically, the ordering of the criteria by weights is very similar to this article.
Table 5.
Fuzzy decision matrix containing alternative values on individual criteria.
Table 6.
Model of criteria preferences.
4. Results
Preference models together with a fuzzy decision model allowed us to generate rankings of the tested PV panels. In accordance with the NEAT F-PROMETHEE calculation procedure, rankings based on positive and negative outranking flows are obtained, allowing for the construction of a partial order of alternatives, and a ranking based on net outranking flow, which is also a total order of alternatives. These rankings, together with fuzzy and defuzzified outranking flows, are presented in Table 7 and Figure 1. On the other hand, Figure 2 shows a partial order constructed on the basis of positive and negative outranking flows.
Table 7.
Values of outranking flows and rankings of alternatives.
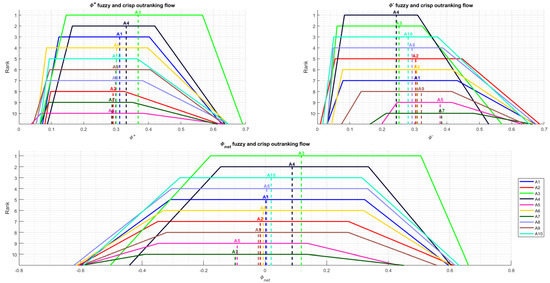
Figure 1.
Outranking flows and alternative rankings.
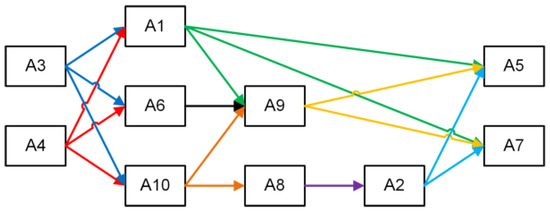
Figure 2.
Partial order of alternatives.
According to the ranking based on the value of (total order), the best PV panel among those considered is A3—Jinko Solar JKM430N-54HL4. However, taking into account the values of , , and partial order created on their basis, the A3 panel is matched by A4—Kensol KS395M-SH. These two alternatives definitely outrank the next group of alternatives, which include A1—Astronergy CHSM54M-HC (182), A2—JA Solar JAM60S20 390/MR, A6—Phono Solar PS420M4-22/WH, A8—Risen RSM40-8-410M, A9—Selfa SV108M.3-410, and A10—Trina Solar TSM-DE09.08 405W. At the forefront of this group are the alternatives A10, A1, and A6, which, according to partial order, are second only to the A3 and A4 panels. However, in total order, the alternatives A1 and A6 are outranked by the alternative A8. According to both orders, at the end of this group there are A2 and A9 panels, which are outranked by the other alternatives. Both according to partial order as well as according to total order, the worst panels are A5—Meyer Burger White, and A7—REC 380AA, which form the last group of alternatives and are strongly outranked by all other alternatives.
When analysing the characteristics of PV panels occupying the highest places in the rankings, it should be noted that A3 is characterized by the highest values of the criteria C1—power, C2—module efficiency C4—short-circuit current. In turn, the A4 dominates the other alternatives in terms of the criteria C3—open-circuit voltage, and C6—weight. Alternative A4 also has the longest product warranty period, which makes it better than the other alternatives in terms of criterion C8—warranty. As for the alternatives A5 and A7, which occupy the last positions in the rankings, their position is mainly influenced by the very high price per watt (C5), because the other considered characteristics of these panels are relatively good.
5. Discussion
As indicated in Section 2, in previous studies on multi-criteria assessment of solar PV panels, the parameters of panels obtained in standard test conditions were usually used, and the numerical data were treated as reliable and precise. Therefore, it is interesting to compare the results of the developed fuzzy model with the results of the corresponding model without uncertainty, based on the parameters of solar PV panels obtained in standard test conditions. The comparison model used the same criteria as the fuzzy model, but the values were in the form of RNs. The values of the criteria were taken from Table 3. For C1, C3, and C4, these were current–voltage parameters obtained in standard test conditions (power—STC, open-circuit voltage—STC, short-circuit current—STC). The initial value of module efficiency was used as C2, and the average duration of the product warranty and performance warranty was indicated as C8. A comparative model using precise numerical values is presented in Table 8. The evaluation results obtained using the model based on precise values are presented in Table 9 and Figure 3 and Figure 4.
Table 8.
Decision matrix containing precise values of alternatives.
Table 9.
Outranking flows and alternative rankings according to the precise model.
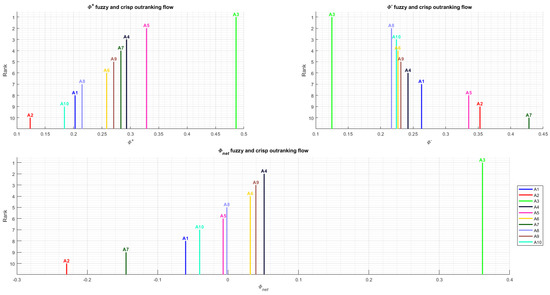
Figure 3.
Outranking flows and alternative rankings according to the precise model.
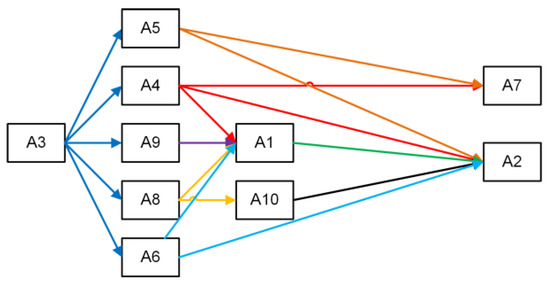
Figure 4.
Partial order of alternatives according to the precise model.
Comparison of the results of the fuzzy evaluation model with the results of the precise model shows that in the case of the total order and the precise model (Figure 1 and Figure 3), the advantage of A3 over the other alternatives, in particular over A4, increase significantly. Substantial changes also take place in subsequent positions in this ranking. Alternative A2 significantly weakens and is no longer superior to alternatives A9, A5, and A7, but is worse than them. Similarly, the ranks of alternatives A10 and A1 deteriorate, while the ranks of other alternatives improve or do not change significantly. Also, when comparing partial orders (Figure 2 and Figure 4), it can be seen that in the case of the precise model, the positions of alternatives A4, A1, A10, and A2 deteriorate, and the positions of alternatives A5 and A9 improve significantly.
The observed differences between the results of the fuzzy model and the precise model show how important it is to properly build the decision model and to take into account the uncertainty and imprecision of the data. It should be emphasized that both models differ only in the numbers describing the criteria C1–C4 and C8. However, for criteria C5–C7, criteria weights and preference functions are the same, and the values of preference thresholds are defined in the same way (as twice the sample standard deviation). However, the indicated differences cause significant discrepancies between the rankings obtained based on the fuzzy decision model and the precise model.
The indicated differences in the rankings are related to the fact that the amount of data included in TFNs, TrFNs, and Ins is greater than in RNs (singletons). A fuzzy number contains information about two, three or four values of a given alternative, while RN is a carrier of only one value. Generally speaking, fuzzy numbers carry information about the entire range of possible values of a given criterion, thus, taking into account the uncertainty of data and the imprecision of measurements. As a result, the ranking obtained based on fuzzy numbers is more “conservative” than the ranking obtained on the basis of RNs, which are assumed to be certain and precise. The fuzzy ranking takes into account a certain margin of uncertainty as to the mutual advantages between the alternatives, is more “soft”, less categorical, and less definitively determines the order of the alternatives.
6. Conclusions
The practical purpose of the article was to evaluate the PV panels available on the Polish energy market and to select solar PV panels with the best technical parameters, taking into account many criteria. Based on the conducted research, Jinko Solar JKM430N-54HL4 and Kensol KS395M-SH panels are indicated as optimal. The scientific contribution of the article include capturing the uncertainty and imprecision of technical parameters using a fuzzy approach. The conducted research partly fills the identified research gap, consisting of the need to take into account uncertain criteria describing the operating parameters of solar PV panels in study. During the research, a fuzzy PV panel assessment model was developed, based on TFNs and the NEAT F-PROMETHEE multi-criteria method. The calculation results obtained using this model were compared with the results of the model based on precise RNs. As a result of the conducted investigations, it is found that the precise model can give completely different results than the fuzzy model. However, the results of the fuzzy model should be considered more reliable, because fuzzy numbers allow for the capturing of more data than RNs, which translates into greater reliability of the obtained results.
The presented study, both in practical and scientific terms, had some limitations. Referring to the practical goal, the limited number of PV panels considered in the study should be indicated as the basic limitation. Collecting reliable data on solar PV panels requires finding and carefully analysing their specification sheets. Data collection takes a long time, which automatically limits the number of solar PV panels that can be analyzed in one study. The basic limitation related to the scientific aspect is also related to data collection. Namely, collecting more data would improve the accuracy of mapping reliability by fuzzy numbers, and this would further increase the credibility of the obtained results. Other membership functions and alternative ways of constructing fuzzy numbers describing individual technical parameters of PV panels can also be considered. Further research should lead to the elimination of the indicated limitations and include works leading to increasing the accuracy of the assessment by using fuzzy numbers describing the given alternatives in more detail.
Author Contributions
Conceptualization, P.Z.; methodology, P.Z.; software, P.Z.; validation, M.S.; formal analysis, M.S.; data curation, P.Z. and M.S.; writing—original draft preparation, P.Z. and M.S.; writing—review and editing, P.Z. and M.S.; supervision, P.Z. All authors have read and agreed to the published version of the manuscript.
Funding
This research was funded by the National Science Centre, Poland, grant number 2019/35/D/HS4/02466.
Data Availability Statement
Data are contained within the article.
Conflicts of Interest
The authors declare no conflict of interest.
References
- Li, K.; Liu, C.; Jiang, S.; Chen, Y. Review on Hybrid Geothermal and Solar Power Systems. J. Clean. Prod. 2020, 250, 119481. [Google Scholar] [CrossRef]
- Tian, M.-W.; Yan, S.-R.; Han, S.-Z.; Nojavan, S.; Jermsittiparsert, K.; Razmjooy, N. New Optimal Design for a Hybrid Solar Chimney, Solid Oxide Electrolysis and Fuel Cell Based on Improved Deer Hunting Optimization Algorithm. J. Clean. Prod. 2020, 249, 119414. [Google Scholar] [CrossRef]
- Strantzali, E.; Aravossis, K. Decision Making in Renewable Energy Investments: A Review. Renew. Sustain. Energy Rev. 2016, 55, 885–898. [Google Scholar] [CrossRef]
- Decarbonising Our Energy System to Meet Our Climate Goals; European Union: Brussels, Belgium, 2021.
- Wang, J.-J.; Jing, Y.-Y.; Zhang, C.-F.; Zhao, J.-H. Review on Multi-Criteria Decision Analysis Aid in Sustainable Energy Decision-Making. Renew. Sustain. Energy Rev. 2009, 13, 2263–2278. [Google Scholar] [CrossRef]
- Ju, X.; Xu, C.; Hu, Y.; Han, X.; Wei, G.; Du, X. A Review on the Development of Photovoltaic/Concentrated Solar Power (PV-CSP) Hybrid Systems. Sol. Energy Mater. Sol. Cells 2017, 161, 305–327. [Google Scholar] [CrossRef]
- Guyer, J.P. Introduction to Solar Collectors for Heating and Cooling of Buildings and Domestic Hot Water Heating; Continuing Education and Development, Inc.: Stony Point, NY, USA, 2012. [Google Scholar]
- Kalogirou, S.A. Solar Thermal Collectors and Applications. Prog. Energy Combust. Sci. 2004, 30, 231–295. [Google Scholar] [CrossRef]
- Wojcik, W.; Amirgaliyev, Y.; Kunelbayev, M.; Kalizhanova, A.; Kozbakova, A.; Sundetov, T.; Yedilkhan, D. Developing the System of Collecting, Storing and Processing Information from Solar Collectors. Int. J. Electron. Telecommun. 2021, 67, 65–70. [Google Scholar] [CrossRef]
- Chacko, J.; Thomas, K. Analysis of Different Solar Panel Arrangements Using PVSYST. Int. J. Eng. Res. Technol. 2015, 4, 510–513. [Google Scholar] [CrossRef]
- Budea, S.; Safta, C.A. Review on Modern Photovoltaic Panels—Technologies and Performances. IOP Conf. Ser.: Earth Environ. Sci. 2021, 664, 012032. [Google Scholar] [CrossRef]
- Zeman, M. Introduction to Photovoltaic Solar Energy. Solar Cells. Available online: https://www.aerostudents.com/courses/solar-cells/solarCellsTheoryFullVersion.pdf (accessed on 27 June 2023).
- Joël Tchognia Nkuissi, H.; Kouadio Konan, F.; Hartiti, B.; Ndjaka, J.-M. Toxic Materials Used in Thin Film Photovoltaics and Their Impacts on Environment. In Reliability and Ecological Aspects of Photovoltaic Modules; Gok, A., Ed.; IntechOpen: London, UK, 2020; ISBN 978-1-78984-822-9. [Google Scholar]
- Kushiya, K. CIS-Based Thin-Film PV Technology in Solar Frontier K.K. Sol. Energy Mater. Sol. Cells 2014, 122, 309–313. [Google Scholar] [CrossRef]
- Nowak, W. Kolektory Słoneczne I Panele Fotowoltaiczne Jako Źródło Energii W Małych Instalacjach Cieplnych I Elektroenergetycznych. Autom. Elektr. Zakłócenia 2011, 2, 55–64. [Google Scholar]
- Tan, D.; Kian Seng, A. Handbook for Solar Photovoltaic (PV) Systems; Energy Market Authority, Building and Construction Authority: Singapore, 2009; ISBN 978-981-08-4462-2. [Google Scholar]
- van de Kaa, G.; Rezaei, J.; Kamp, L.; de Winter, A. Photovoltaic Technology Selection: A Fuzzy MCDM Approach. Renew. Sustain. Energy Rev. 2014, 32, 662–670. [Google Scholar] [CrossRef]
- Shayani Mehr, P.; Hafezalkotob, A.; Fardi, K.; Seiti, H.; Movahedi Sobhani, F.; Hafezalkotob, A. A Comprehensive Framework for Solar Panel Technology Selection: A BWM- MULTIMOOSRAL Approach. Energy Sci. Eng. 2022, 10, 4595–4625. [Google Scholar] [CrossRef]
- Schmela, M.; Rossi, R.; Lits, C.; Chunduri, S.K.; Shah, A.; Muthyal, R.; Moghe, P.; Kalam, S.; Jamkhedkar, A.; Goel, S.; et al. Advancements in Solar Technology, Markets, and Investments—A Summary of the 2022 ISA World Solar Reports. Sol. Compass 2023, 6, 100045. [Google Scholar] [CrossRef]
- Nesticò, A.; Elia, C.; Naddeo, V. Sustainability of Urban Regeneration Projects: Novel Selection Model Based on Analytic Network Process and Zero-One Goal Programming. Land Use Policy 2020, 99, 104831. [Google Scholar] [CrossRef]
- Nesticò, A.; Somma, P. Comparative Analysis of Multi-Criteria Methods for the Enhancement of Historical Buildings. Sustainability 2019, 11, 4526. [Google Scholar] [CrossRef]
- Ziemba, P. NEAT F-PROMETHEE—A New Fuzzy Multiple Criteria Decision Making Method Based on the Adjustment of Mapping Trapezoidal Fuzzy Numbers. Expert Syst. Appl. 2018, 110, 363–380. [Google Scholar] [CrossRef]
- Ziemba, P. Multi-Criteria Approach to Stochastic and Fuzzy Uncertainty in the Selection of Electric Vehicles with High Social Acceptance. Expert Syst. Appl. 2021, 173, 114686. [Google Scholar] [CrossRef]
- Ziemba, P. Uncertain Multi-Criteria Analysis of Offshore Wind Farms Projects Investments—Case Study of the Polish Economic Zone of the Baltic Sea. Appl. Energy 2022, 309, 118232. [Google Scholar] [CrossRef]
- Ziemba, P. Selection of Electric Vehicles for the Needs of Sustainable Transport under Conditions of Uncertainty—A Comparative Study on Fuzzy MCDA Methods. Energies 2021, 14, 7786. [Google Scholar] [CrossRef]
- Ziemba, P. Energy Security Assessment Based on a New Dynamic Multi-Criteria Decision-Making Framework. Energies 2022, 15, 9356. [Google Scholar] [CrossRef]
- Seddiki, M.; Bennadji, A. Multi-Criteria Evaluation of Renewable Energy Alternatives for Electricity Generation in a Residential Building. Renew. Sustain. Energy Rev. 2019, 110, 101–117. [Google Scholar] [CrossRef]
- Al Garni, H.; Kassem, A.; Awasthi, A.; Komljenovic, D.; Al-Haddad, K. A Multicriteria Decision Making Approach for Evaluating Renewable Power Generation Sources in Saudi Arabia. Sustain. Energy Technol. Assess. 2016, 16, 137–150. [Google Scholar] [CrossRef]
- Ahmad, S.; Tahar, R.M. Selection of Renewable Energy Sources for Sustainable Development of Electricity Generation System Using Analytic Hierarchy Process: A Case of Malaysia. Renew. Energy 2014, 63, 458–466. [Google Scholar] [CrossRef]
- Kengpol, A.; Rontlaong, P.; Tuominen, M. A Decision Support System for Selection of Solar Power Plant Locations by Applying Fuzzy AHP and TOPSIS: An Empirical Study. J. Softw. Eng. Appl. 2013, 6, 470–481. [Google Scholar] [CrossRef]
- Mokarram, M.; Mokarram, M.J.; Khosravi, M.R.; Saber, A.; Rahideh, A. Determination of the Optimal Location for Constructing Solar Photovoltaic Farms Based on Multi-Criteria Decision System and Dempster–Shafer Theory. Sci. Rep. 2020, 10, 8200. [Google Scholar] [CrossRef]
- Kereush, D.; Perovych, I. Determining Criteria for Optimal Site Selection for Solar Power Plants. GLL 2017, 39–54. [Google Scholar] [CrossRef]
- Watson, J.J.W.; Hudson, M.D. Regional Scale Wind Farm and Solar Farm Suitability Assessment Using GIS-Assisted Multi-Criteria Evaluation. Landsc. Urban Plan. 2015, 138, 20–31. [Google Scholar] [CrossRef]
- Chen, C.-R.; Huang, C.-C.; Tsuei, H.-J. A Hybrid MCDM Model for Improving GIS-Based Solar Farms Site Selection. Int. J. Photoenergy 2014, 2014, e925370. [Google Scholar] [CrossRef]
- Sánchez-Lozano, J.M.; García-Cascales, M.S.; Lamata, M.T. Evaluation of Suitable Locations for the Installation of Solar Thermoelectric Power Plants. Comput. Ind. Eng. 2015, 87, 343–355. [Google Scholar] [CrossRef]
- Vafaeipour, M.; Hashemkhani Zolfani, S.; Morshed Varzandeh, M.H.; Derakhti, A.; Keshavarz Eshkalag, M. Assessment of Regions Priority for Implementation of Solar Projects in Iran: New Application of a Hybrid Multi-Criteria Decision Making Approach. Energy Convers. Manag. 2014, 86, 653–663. [Google Scholar] [CrossRef]
- Ponce, P.; Pérez, C.; Fayek, A.R.; Molina, A. Solar Energy Implementation in Manufacturing Industry Using Multi-Criteria Decision-Making Fuzzy TOPSIS and S4 Framework. Energies 2022, 15, 8838. [Google Scholar] [CrossRef]
- Balo, F.; Şağbanşua, L. The Selection of the Best Solar Panel for the Photovoltaic System Design by Using AHP. Energy Procedia 2016, 100, 50–53. [Google Scholar] [CrossRef]
- Kozlov, V.; Sałabun, W. Challenges in Reliable Solar Panel Selection Using MCDA Methods. Procedia Comput. Sci. 2021, 192, 4913–4923. [Google Scholar] [CrossRef]
- Bączkiewicz, A.; Kizielewicz, B.; Shekhovtsov, A.; Yelmikheiev, M.; Kozlov, V.; Sałabun, W. Comparative Analysis of Solar Panels with Determination of Local Significance Levels of Criteria Using the MCDM Methods Resistant to the Rank Reversal Phenomenon. Energies 2021, 14, 5727. [Google Scholar] [CrossRef]
- Zadeh, L.A. Fuzzy Sets. Inf. Control 1965, 8, 338–353. [Google Scholar] [CrossRef]
- Liu, G.; Wang, X. A Trapezoidal Fuzzy Number-Based VIKOR Method with Completely Unknown Weight Information. Symmetry 2023, 15, 559. [Google Scholar] [CrossRef]
- Buckley, J.J. Portfolio Analysis Using Possibility Distributions. In Approximate Reasoning in Intelligent Systems, Decision and Control; Sanchez, E., Zadeh, L.A., Eds.; Pergamon: Amsterdam, The Netherlands, 1987; pp. 69–76. ISBN 978-0-08-034335-8. [Google Scholar]
- Brândaş, A. Approximation of Fuzzy Numbers by Trapezoidal Fuzzy Numbers Preserving the Core and the Expected Value. Stud. Univ. Babes-Bolyai Math. 2011, 56, 247–259. [Google Scholar]


Disclaimer/Publisher’s Note: The statements, opinions and data contained in all publications are solely those of the individual author(s) and contributor(s) and not of MDPI and/or the editor(s). MDPI and/or the editor(s) disclaim responsibility for any injury to people or property resulting from any ideas, methods, instructions or products referred to in the content. |
© 2023 by the authors. Licensee MDPI, Basel, Switzerland. This article is an open access article distributed under the terms and conditions of the Creative Commons Attribution (CC BY) license (https://creativecommons.org/licenses/by/4.0/).