Abstract
This paper proposes a new automatic tuning method for the proportional-integral (PI) controllers of photovoltaic irrigation systems (PVIS) without the need for any other power source or batteries. It enables the optimisation of the values of the PI parameters ( and ) automatically, eliminating the requirement for skilled personnel during the installation phase of PVIS. This method is based on the system’s voltage response when a disturbance signal is introduced through the feedforward input of the PI controller. To automatically assess the response properties, two indicators are proposed: the total harmonic distortion (THD), used to evaluate the sine response, and the total square distortion (TSD), used to evaluate the square response. The results indicate that the tuning changes for different irradiance and temperature conditions due to the non-linearity of the system, obtaining the most conservative values at maximum irradiance and temperature. The robustness of the results of the new automatic tuning method to abrupt photovoltaic (PV) power fluctuations due to clouds passing over the PV generator has been experimentally tested and the results show that the obtained tuning values make the PVIS stable, even when PV power drops of 66% occur abruptly.
1. Introduction
In the photovoltaic (PV) industry, automatically finding the PV generator voltage that corresponds to its maximum power point is a major challenge in maximising the efficiency and energy production of grid-connected PV systems. A significant part of research in the PV world focuses on finding the most suitable maximum power point tracking (MPPT) algorithm for this purpose. There are a number of techniques that have been proposed to achieve this goal [1,2,3]. In addition to the most widespread ones [4], such as perturbation and observation (P&O) [5,6] and incremental conductance [7,8], there are newer ones that use more modern techniques, such as neural networks [9,10]. Since the electrical grid where PV systems are connected has no inertia, the MPPT algorithm only depends on PV power fluctuations due to irradiance fluctuations, with the relationship being almost linear for medium and high G values [11].
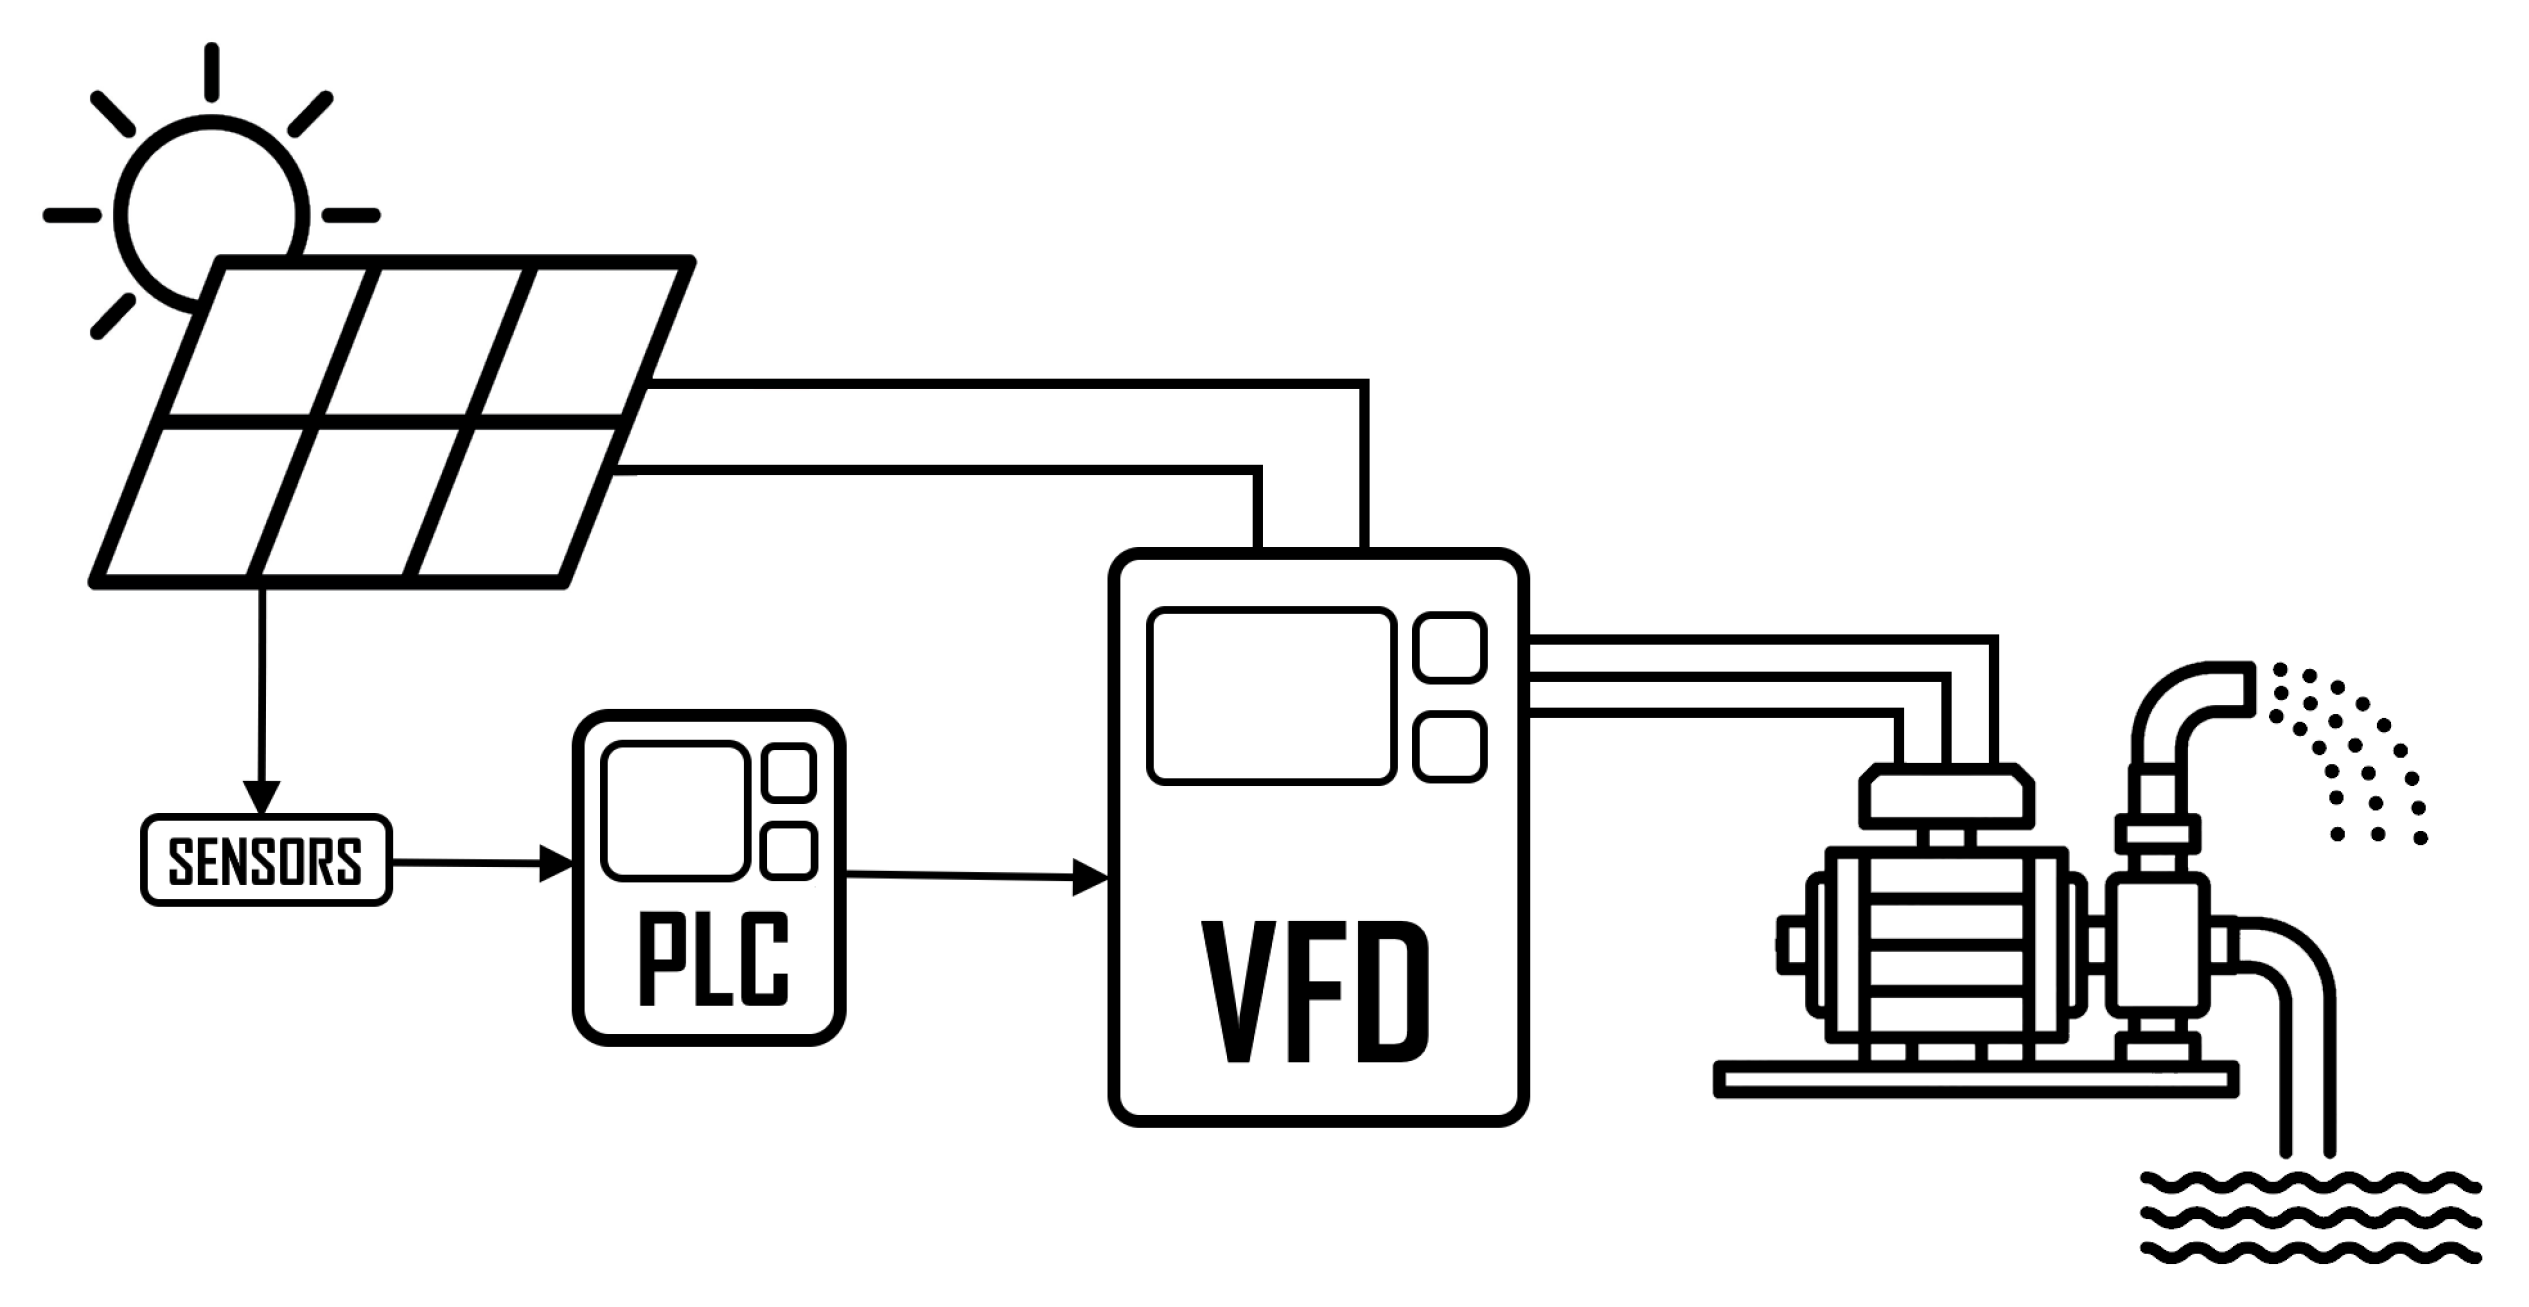
However, when the PV system is not connected to the grid but to a subsystem with inertia, the MPPT control algorithm no longer depends only on the fluctuations of G but also on other variables related to this subsystem. This is the case for PV irrigation systems (PVIS), which are composed of a PV generator, a variable frequency drive (VFD) and a centrifugal pump coupled to a hydraulic system that lifts a variable water flow to a certain height depending on the power provided by the PV generator (see Figure 1).
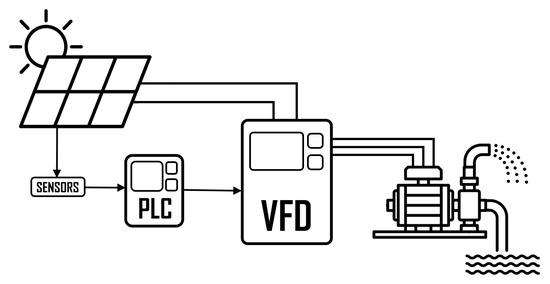
Figure 1.
PVIS architecture.
These systems are not normally supported by another power source or batteries. When there is a sharp drop in PV power, the power consumed by the centrifugal pump must also drop sharply in order to keep the voltage of the PV generator stable. This is achieved by a complementary control algorithm to the MPPT that decreases the operating frequency of the VFD [12]. If this control algorithm does not reduce the operating frequency rapidly, the DC voltage in the VFD (which is the same as the PV generator voltage) destabilises and starts to oscillate and the VFD stops abruptly, causing a water hammer in the hydraulic subsystem and an overvoltage between the VFD output and the centrifugal pump motor.
The most common and effective method in performing this type of control is to use proportional-integral-derivative (PID) controllers. The best-known methods of tuning PID controller parameters, such as Ziegler–Nichols (ZN) [13,14], Cohen–Coon (CC) [15], Chien–Hrones–Reswick (CHR) [16], Lambda [17], and AMIGO [18,19,20,21,22], are difficult to apply to PVIS as they are non-linear systems. Therefore, manual tuning methods must be used, which are tedious and require highly skilled personnel and specific instrumentation [23]. This practically limits the introduction of PVIS on the market. Some examples of the application of these manual tuning methods are found in [24,25,26].
PVIS control is of the inverse type, which means that an increase in the control variable (the voltage of the PV generator) generates a decrease in the output variable (the operating frequency at the VFD output) and vice versa. These types of systems generate a large amount of electromagnetic noise, so, usually, the derivative component of the control, whose response is very sensitive to any noise, is cancelled. Therefore, the type of control commonly implemented is an inverse proportional-integral (PI) type. Its general expression is as shown in Equation (1):
where is the output frequency of the VFD, is the PV generator voltage and is the setpoint voltage, which must be equal to the maximum power point of the PV generator. In many applications, this formula is often expressed in terms of a new parameter, the integral time , as seen in Equation (2):
Although, in general, the physical magnitude of the control and output signals may be different (for example, in a PVIS, the magnitude of is s−1 and that of is volts), in the controller, their magnitude is measured by transducers, whose output is usually voltage values. It is for this reason that the parameter is defined as dimensionless, has a dimension of s−1 and has a dimension of s.
The mass market introduction of PVIS requires research into automatic tuning methods that do not require the intervention of qualified personnel. Automatic tuning (or auto-tuning) means a method by which, from a set of input parameters, the optimal PI control parameters are automatically obtained for a given PVIS without the need for the intervention of skilled personnel.
Auto-tuning methods are divided into two groups: model-based methods and rule-based methods.
Model-based methods [27] focus on the analysis of the transient response of the system [28], its frequency response [29,30] or the estimation of parameters [31]. The difficulty of their use lies in the fact that it is necessary to start with a dynamic model of the system to be controlled. Mathematical models have been developed for some of the subsystems that make up the PVIS [32,33], but there is no complete model of the entire system, mainly due to their great diversity and because they have non-linear characteristics.
Rule-based methods [34,35] do not require an explicit model of the system. They are based on imitating the manual tuning procedure performed by a qualified engineer. The procedure may be based on transient responses, forced oscillations or load disturbances. The system response to the disturbance is analysed and a set of general rules is applied to adjust the PI parameter values until the optimum values are reached.
A rule-based tuning method for the tuning of the proportional-integral (PI) control parameters of a PVIS is presented in [36]. This method is based on the addition of a disturbance signal at the feedforward (FWD) input of the VFD. However, this method still requires the supervision of qualified personnel to ensure that the system is kept operating in its stable zone, and it has the following drawbacks that prevent its automation.
- The initial values of the parameters and for the tuning process and the type, amplitude and frequency of the FWD input signal are not defined.
- The evaluation of system response signals is qualitative.
- External instrumentation (oscilloscope and signal generator) is required for the implementation of the tuning method.
- The PI control included in the internal programme of VFD is used. This has important limitations, as both the range of variation of the control parameters and their accuracy often differ from one model of drive to another. Another disadvantage is that information on important aspects of the PID control, such as the sample time or even the definition of the PI control parameters, is usually not available. As a consequence, the results of the tuning method will be highly dependent on the VFD model used.
The novelty presented in this paper is the development of an automatic method for the tuning of the PVIS PI parameters, proposing the following solutions to the problems identified.
- Two types of disturbance signals have been defined at the FWD input of the controller: the same triangular one proposed in [36] and another one of sinusoidal type.
- To evaluate the quality of the system response signals, two indicators are proposed. For the response to the sinusoidal signal, a standardised indicator, the total harmonic distortion (THD), is proposed. As the response to the triangular signal corresponds to a square signal, the total square distortion (TSD) is proposed as an indicator. For the calculation of both indicators, the Fast Fourier Transform (FFT) is used.
- The PI control algorithm has been implemented in an external programmable logic controller (PLC), which has allowed the definition of the range and precision of the control parameters without any restrictions associated with a specific VFD model.
The proposed new method is iterative. The calculation of the PI parameters is approximated in successive iterations. During the tuning process, the method adjusts the PI controller parameters gradually, ensuring that the system always operates in a stable zone.
Different tests have been performed to validate the performance of the proposed automatic method. The results obtained show that the method is able to obtain optimal values of the PI control parameters without affecting the stability of the system during the tuning process and in a time interval of less than 15 min in all cases.
2. Materials and Methods
2.1. Laboratory Experimentation System
The tests reported in this paper have been performed with a system composed of the following components:
- A programmable logic controller (PLC);
- A personal computer;
- A hydraulic pump simulator;
- Three VFDs from different manufacturers;
- A 680 PV generator;
- Irradiance, cell temperature and PV generator voltage sensors.
2.1.1. PLC
The external PLC implements the PI control of the entire system, which provides great advantages over the use of the internal control algorithm incorporated in the VFDs:
- The possibility to choose any value of the parameters and ;
- The possibility to apply the tuning and control algorithm to any VFD model with an analogue input to set the frequency;
- The start-up time in PVIS implementation is reduced since studying all VFD model parameters is unnecessary.
The PI algorithm executed by the PLC generates the frequency at which the VFD should operate. The output calculation period in the PI algorithm is 5 ms. Because of this, the analogue input of the VFD must be used, which requires the PLC to have a digital-to-analogue converter (DAC).
The controller chosen (Industruino IND.I/O D21G) includes a DAC with 12 bit resolution.
2.1.2. Personal Computer
The self-tuning method has been developed in Python. Communication with the PLC is via a USB interface. The PLC responds to
- Command the VFD to start or stop;
- Modify the tuning constants and ;
- Apply a sinusoidal or triangular signal to the VFD feedforward input.
2.1.3. Hydraulic Motor-Pump Simulator
The water pump is simulated by an air turbine connected to a 275 W induction motor in order to simulate the water flow. This procedure has been widely used in the literature [37,38,39,40].
2.1.4. VFDs
Three different models of commercial VFDs have been used for the tests:
- Omron (Kyoto, Japan) 3G3RX-A2004-E1F (three-phase 200 V; 0.75 kW);
- Yaskawa (Kitakyushu, Japan) A100 CIMR-AC2A0010FAA (three-phase 200 V; 2.2 kW);
- Fuji (Tokyo, Japan) Frenic Ace Drive-FRN0005E2E-7GA (monophase 200–240 V; 0.75 kW).
2.1.5. PV Array
The PV generator consists of 4 strings connected in parallel. Each string has 17 PV modules in series of 10 and a maximum power voltage at standard test conditions (STC) of 16.3 V, so the PV generator has a rated power of 680 W and a voltage at the maximum power point of 277.1 V. It is oriented to the south with a 45° inclination. It is possible to switch the strings on and off independently, which is useful to simulate very sharp power drops and to be able to test with different power ratings.
2.1.6. Irradiance, Temperature and PV Generator Voltage Sensors
Cell temperature (), ambient temperature () and irradiance (G) data are obtained from a calibrated cell.
A sensor with an input of 0 to 1000 is used to measure the PV generator voltage. It provides feedback to the PI controller.
2.1.7. System Architecture
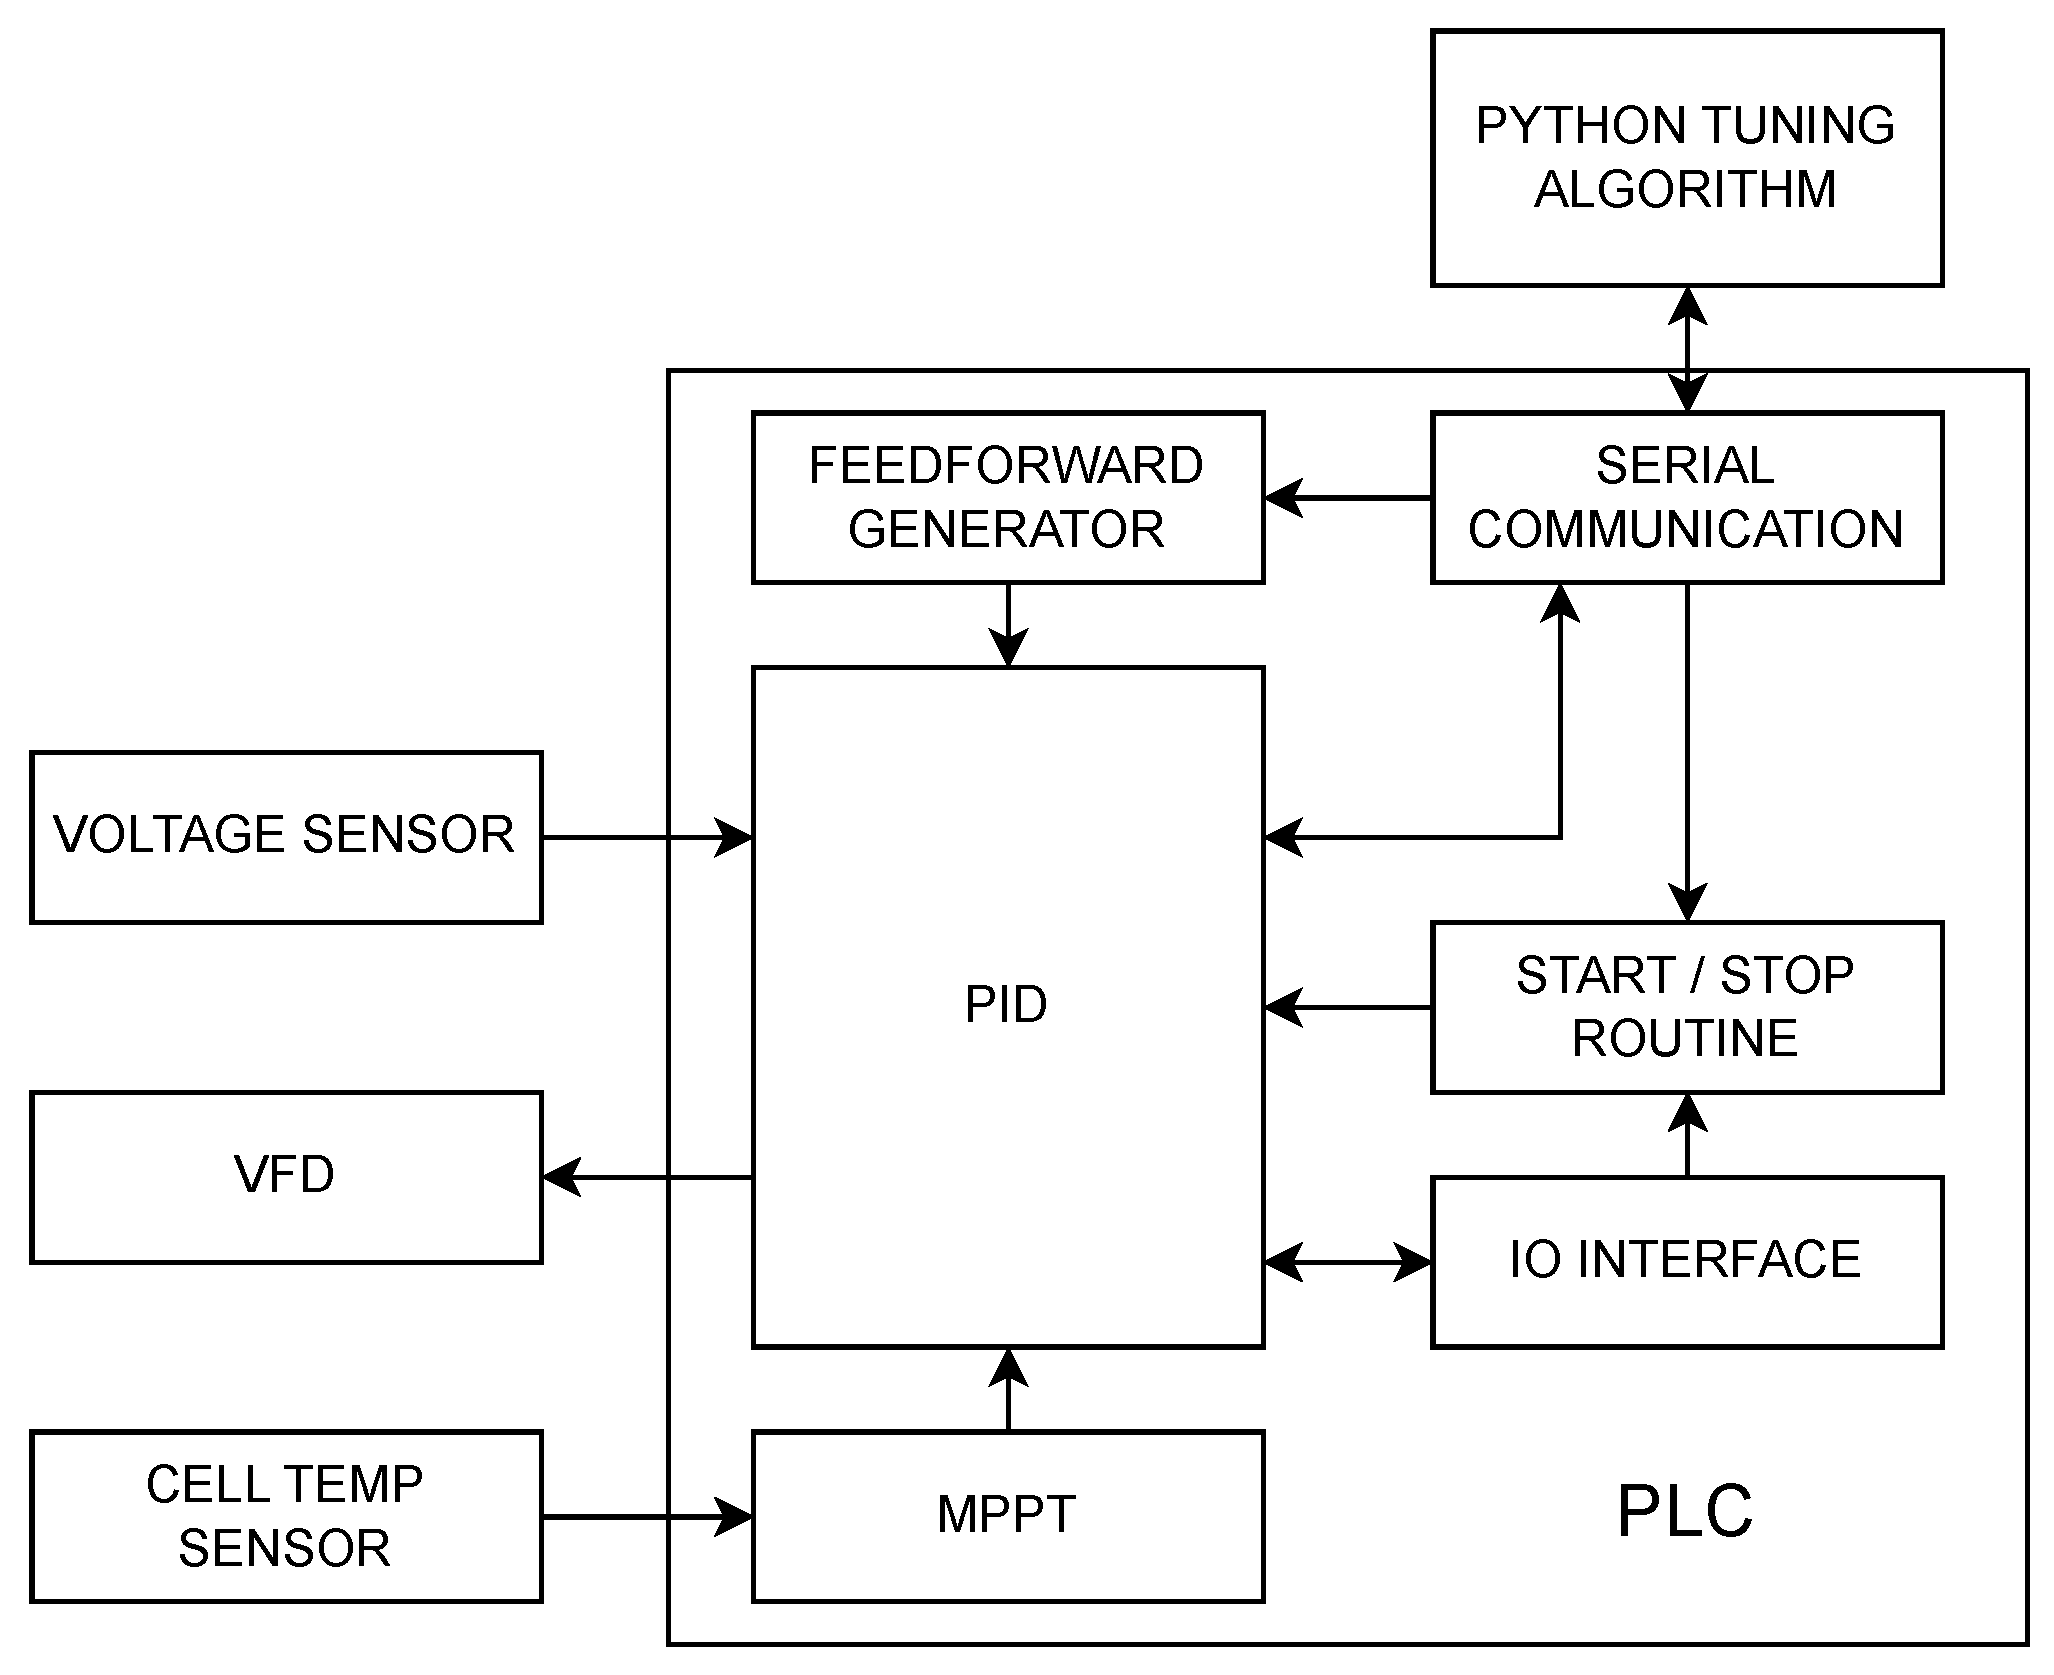
The diagram in Figure 2 shows the architecture of the control system.
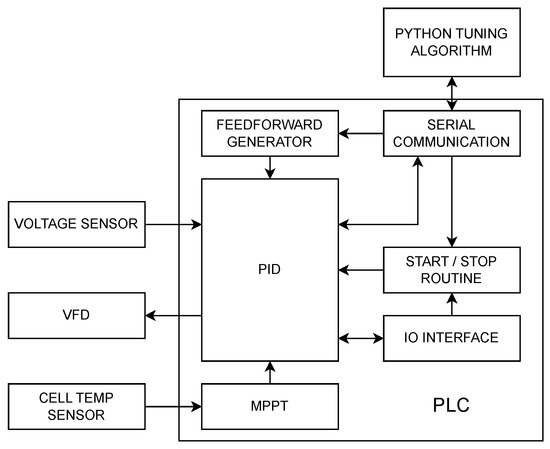
Figure 2.
Control system architecture.
2.2. Fundamentals of the New Tuning Method
The proposed method is based on the fact that when a feedforward signal (FWD) is applied, the output frequency of the PI controller is given by Equation (3).
where
| = frequency at which the VFD must operate; | |
| = frequency value of feedforward signal; | |
| = output frequency calculated by the PI controller; | |
| = proportional constant of PI controller; | |
| = integral constant of PI controller; | |
| = generator voltage setpoint (set by the MPPT algorithm); | |
| = generator voltage. |
When an optimally tuned system is perturbed, the instantaneous error should be much smaller than the cumulative error, , so it can be neglected from Equation (3) and we obtain Equation (4):
If the disturbance is performed at constant G and , the maximum power provided by the PV generator is also constant, so that the output frequency of the VFD remains constant in an optimally tuned system, as seen in Equation (5).
The variation in the system voltage around the setpoint voltage is directly proportional to the derivative of the disturbance signal FWD (with a negative sign) and inversely proportional to the value of .
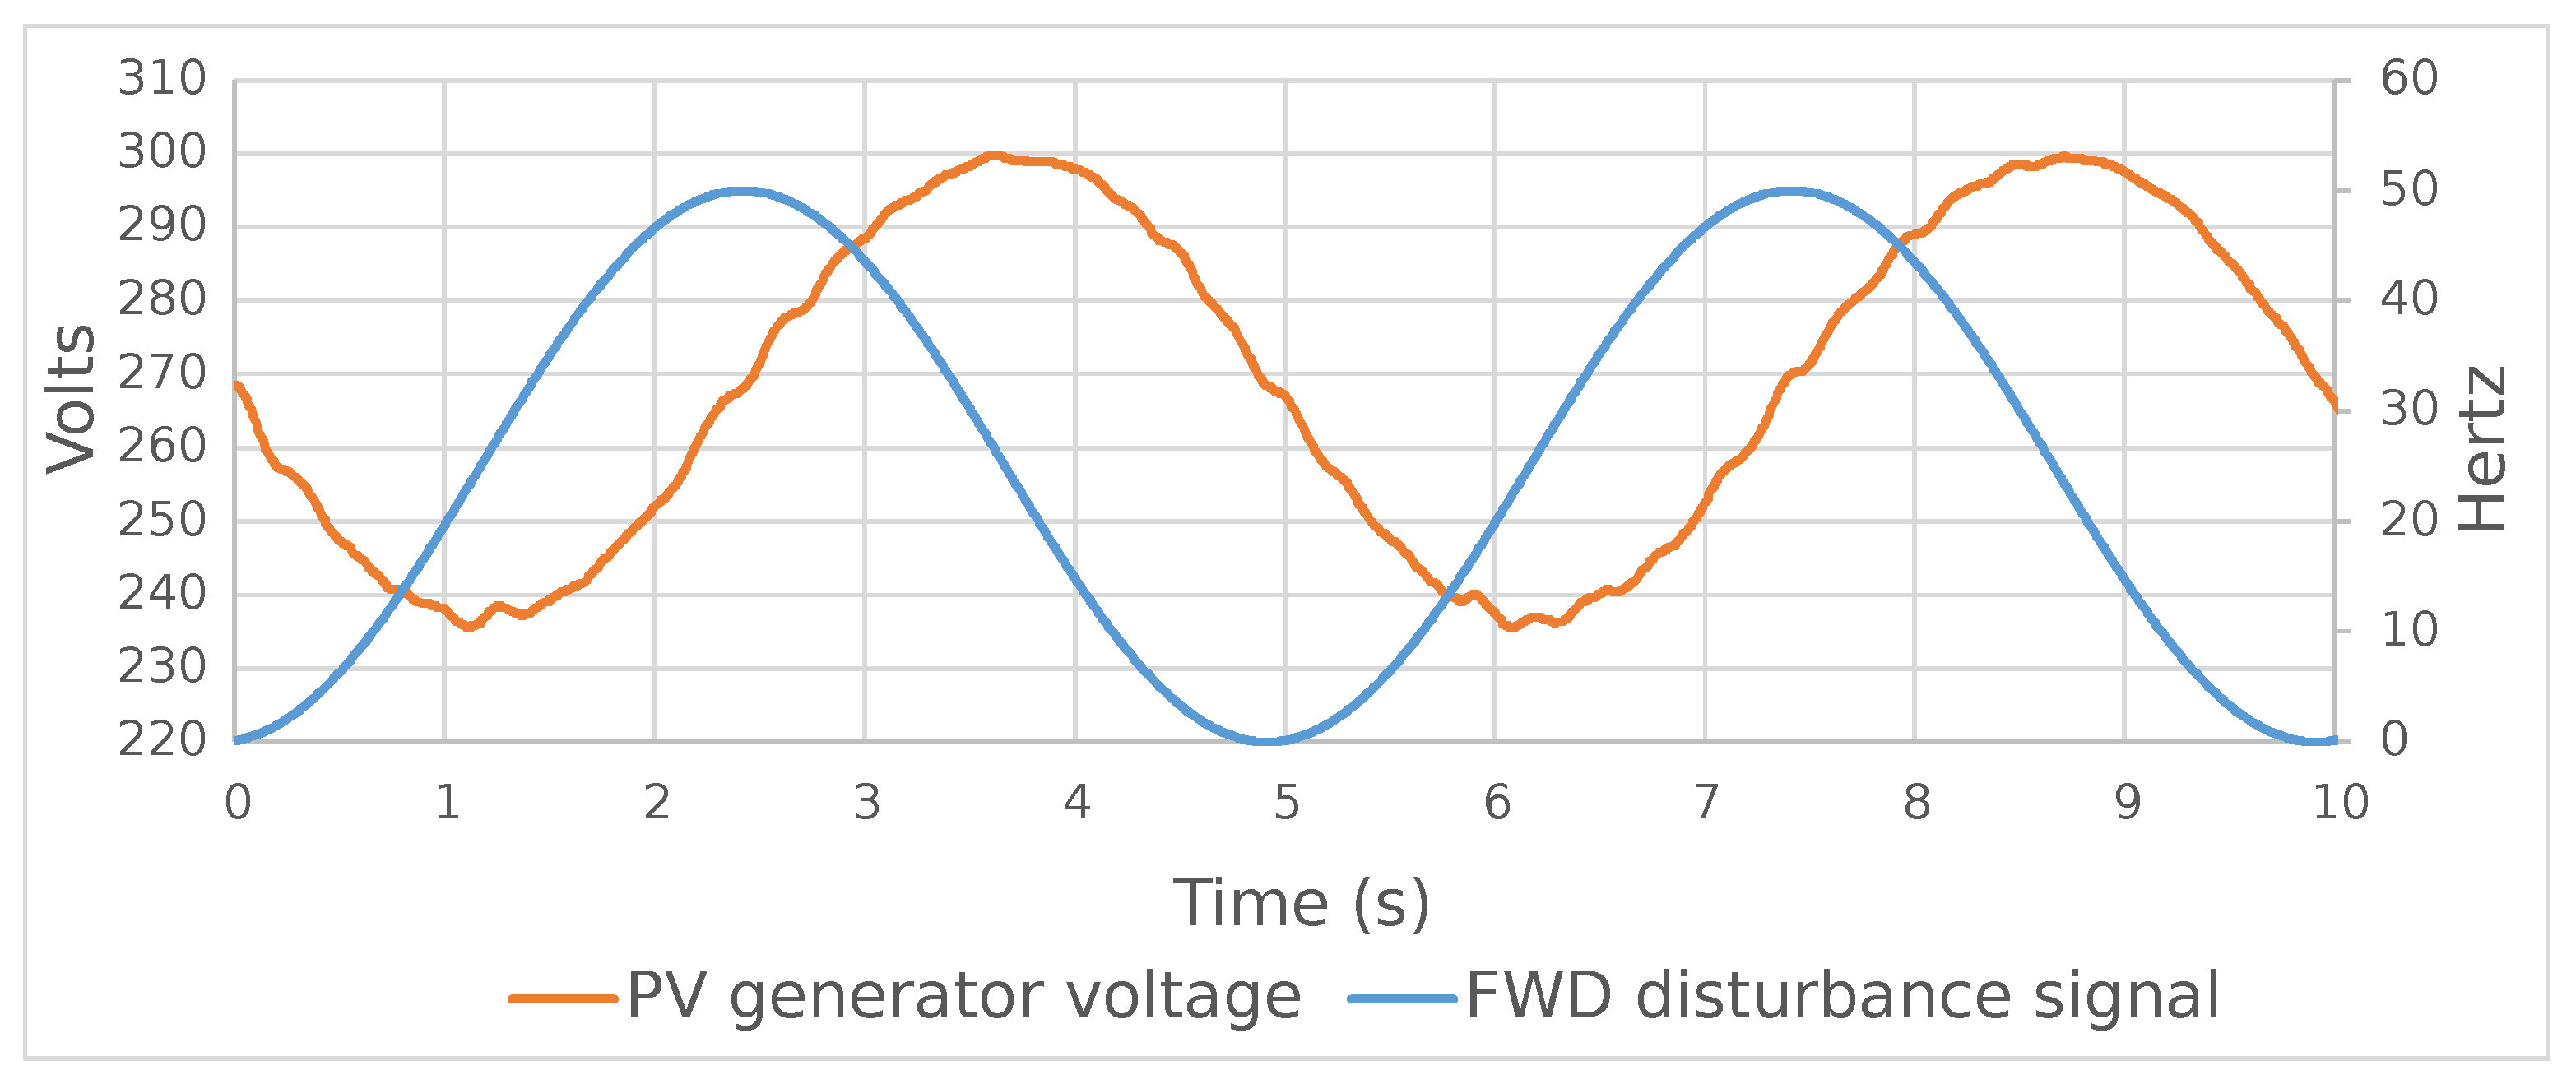
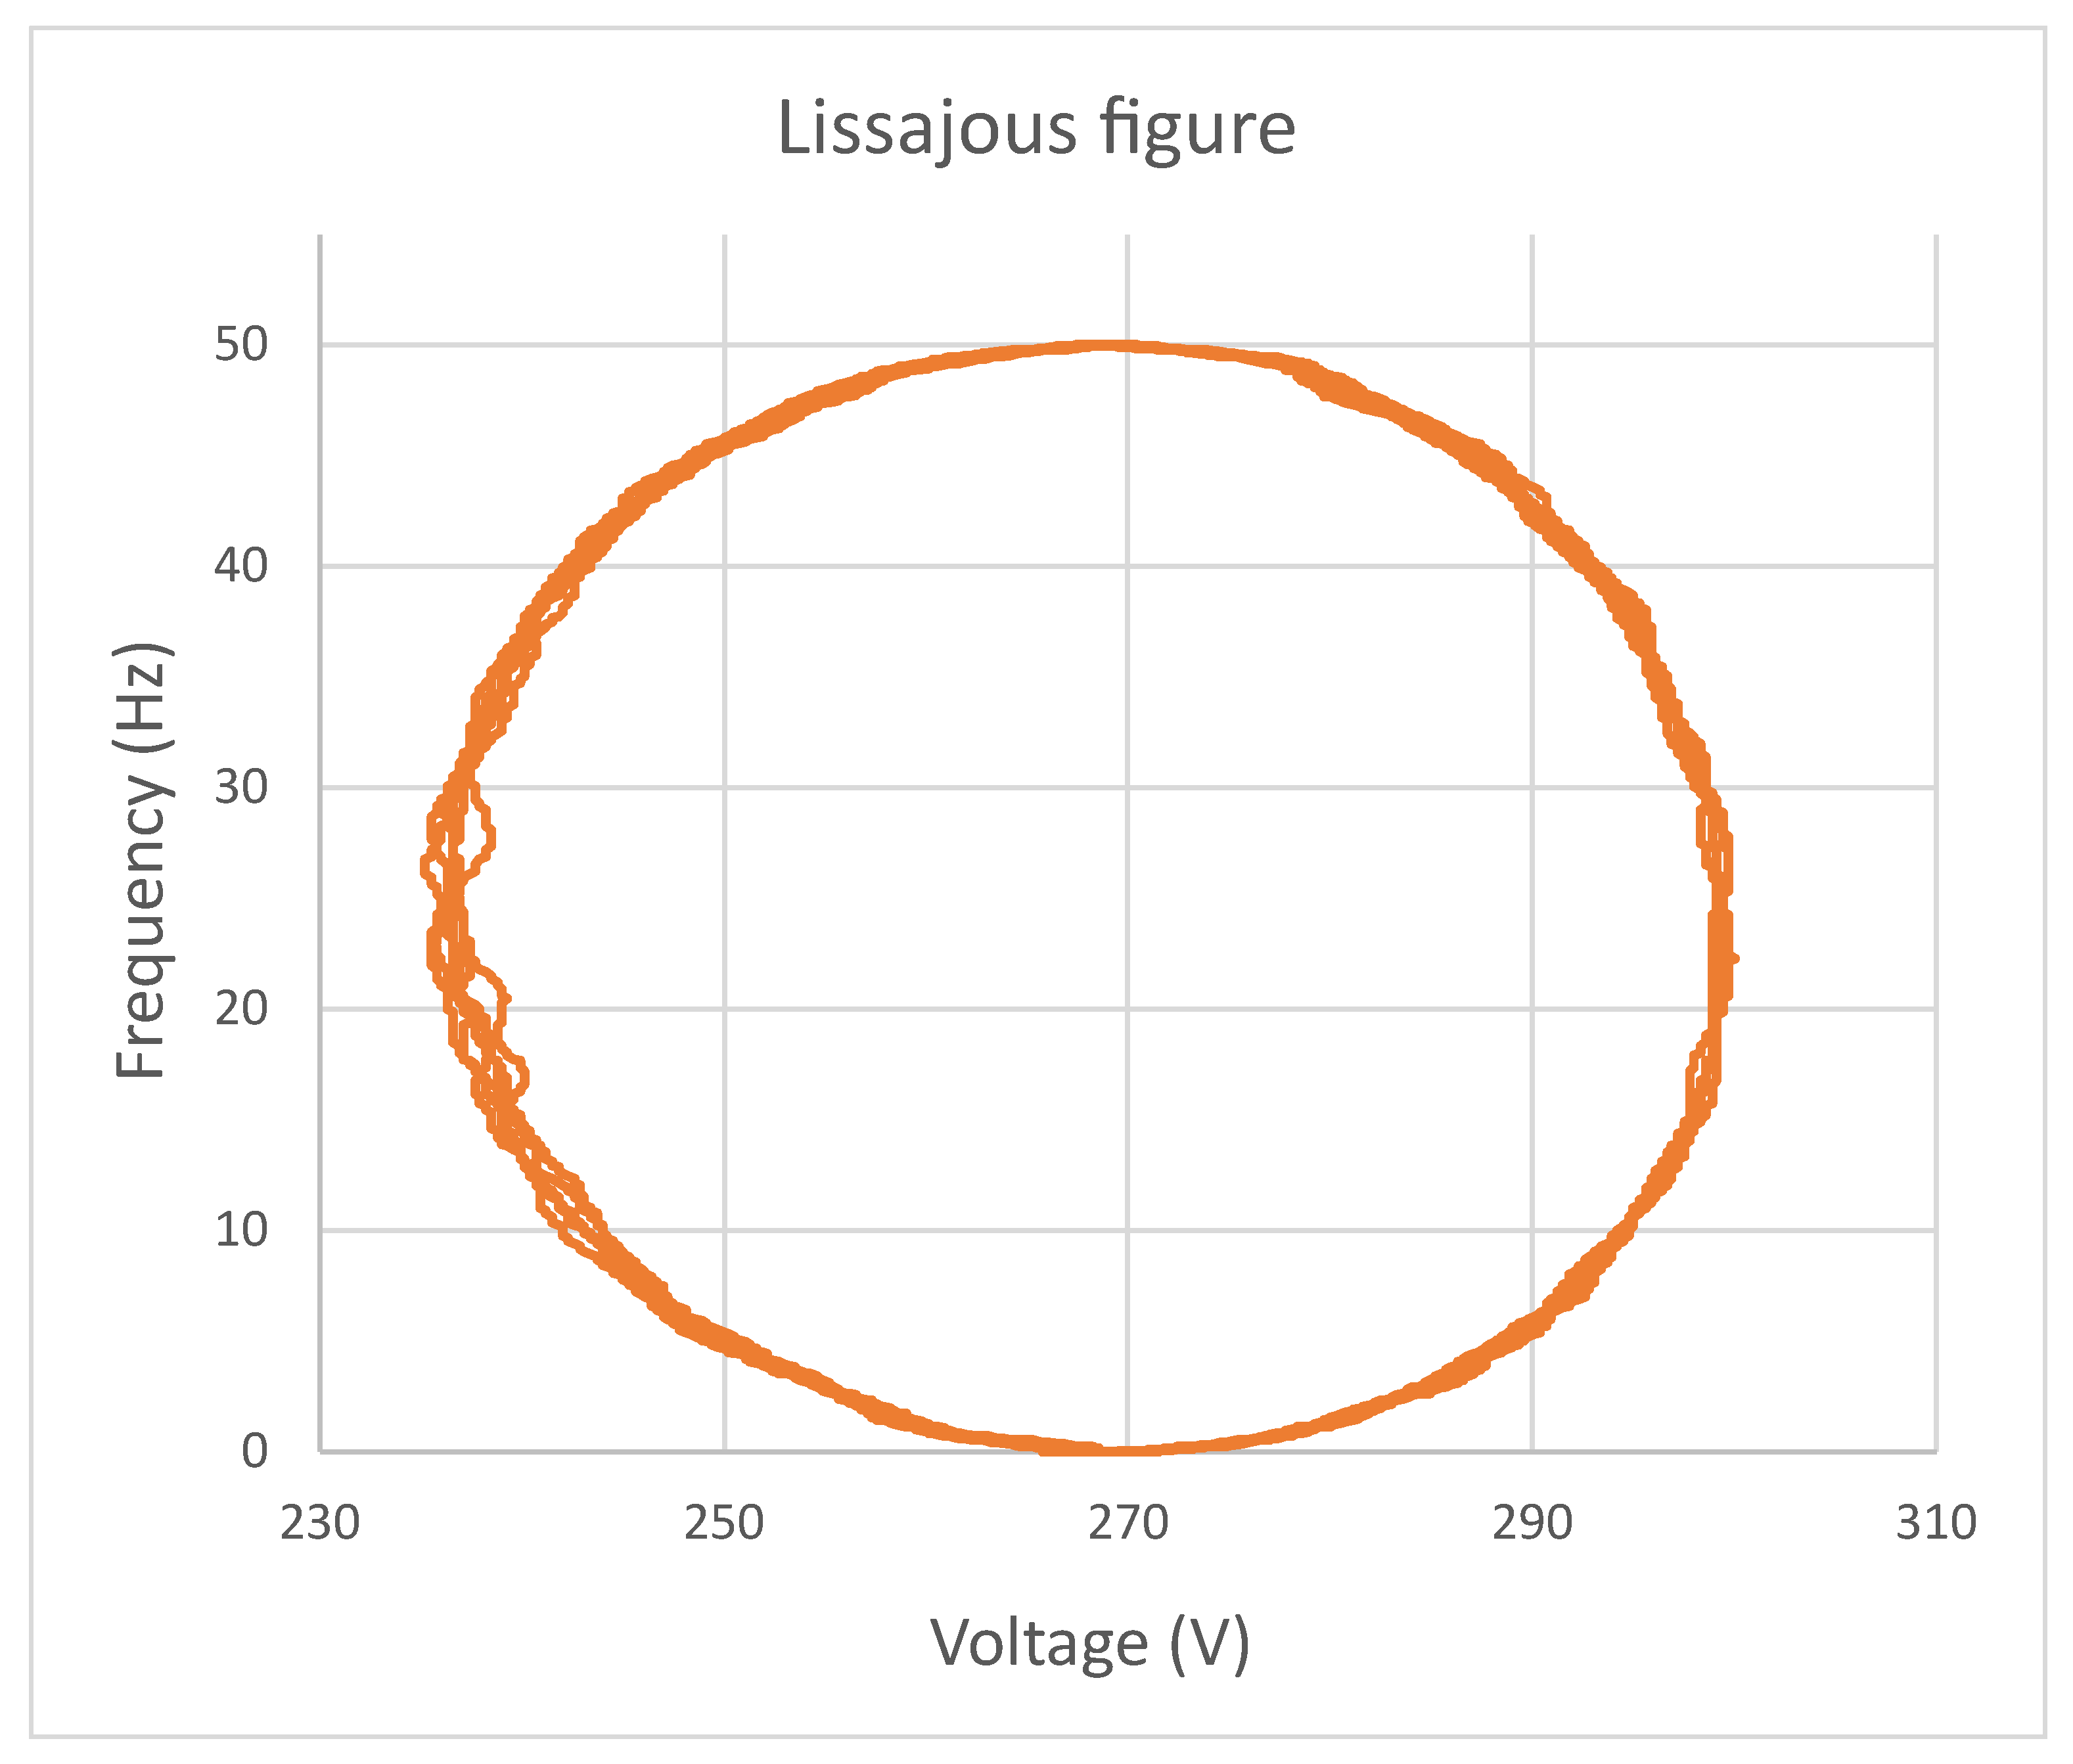
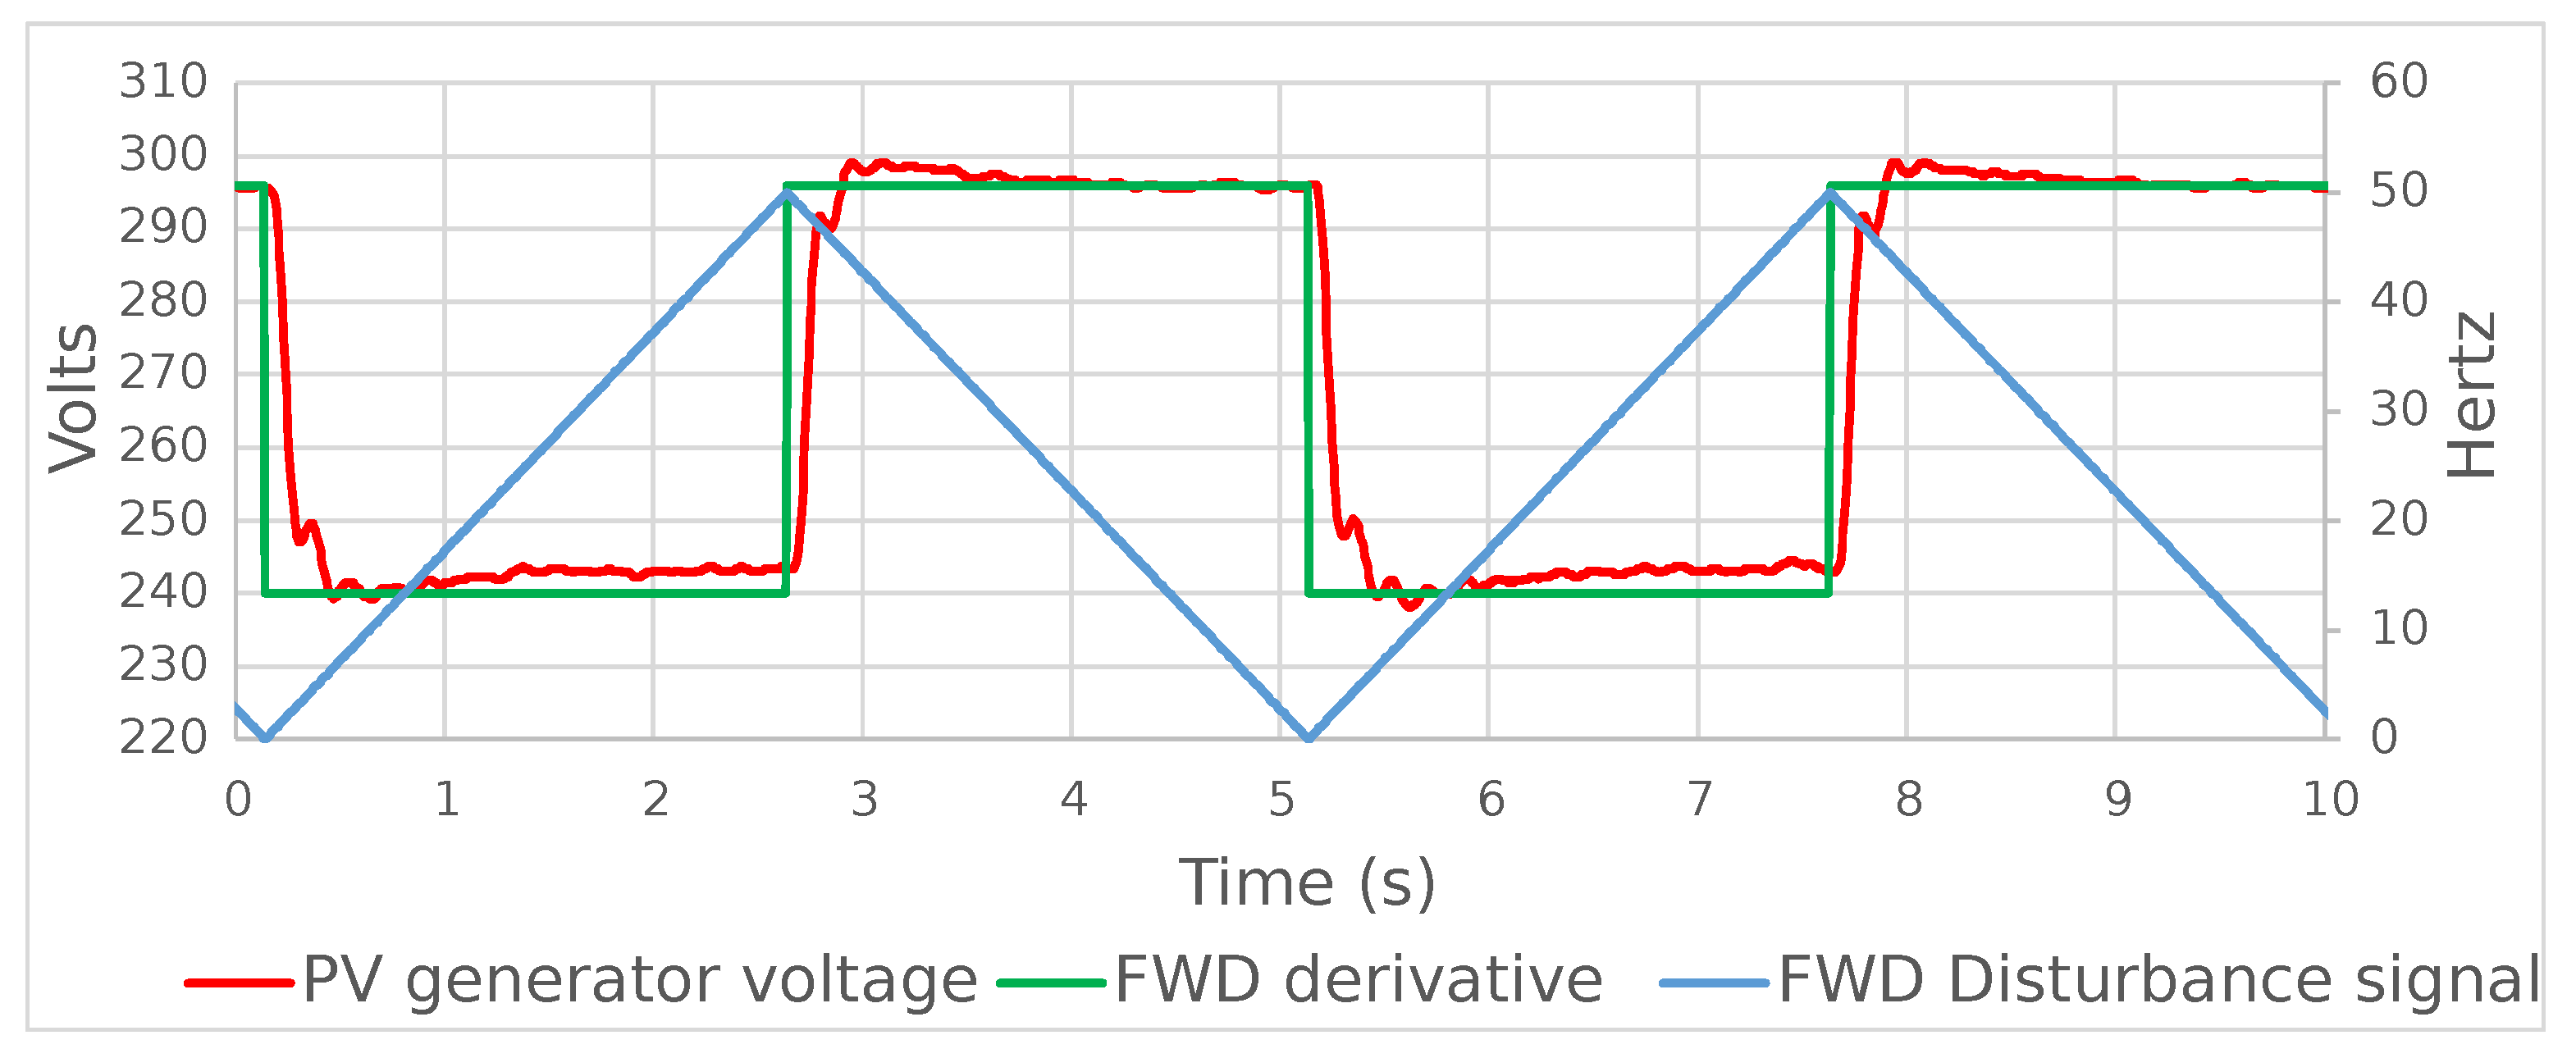
Experimental confirmation of the validity of these expressions can be seen in Figure 3, Figure 4 and Figure 5. Figure 3 and Figure 4 show the response of the system (PV generator voltage) to a sinusoidal disturbance at the FWD input. Figure 3 shows the two signals in time, and Figure 4 shows the Lissajous diagram, in which the circular shape shows the 90° phase shift, which is the phase shift between a sinusoidal function and its derivative. Figure 5 shows the response of the system to a triangular disturbance and its comparison with the derivative of the triangular disturbance, which is a square signal.
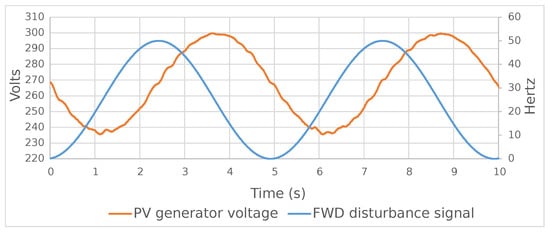
Figure 3.
Comparison between the response of the system (PV generator voltage) and the sinusoidal disturbance feedforward signal in the time domain.
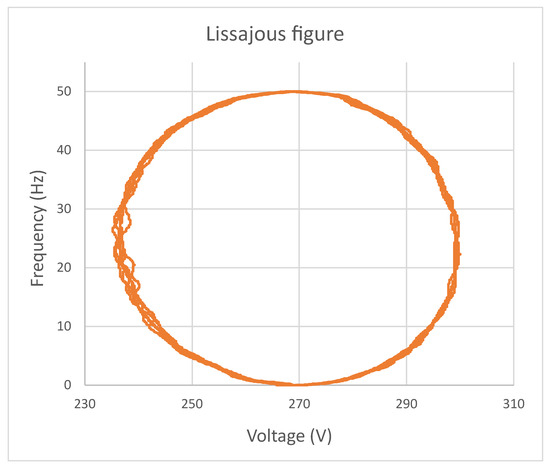
Figure 4.
Lissajous diagram of the signals shown in Figure 3.
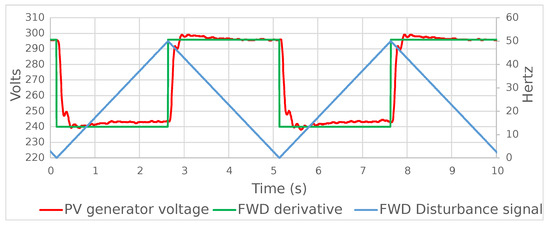
Figure 5.
Comparison between PV generator voltage, feedforward (triangular) signal and feedforward signal derivative.
2.3. Description of the New Tuning Method
To define the characteristics of the FWD disturbance signals, we have considered the results of the paper [36], which relates the FWD disturbance signal to the PV power fluctuation due to the passage of a cloud over the PV generator of a PVIS. It is assumed that the fastest possible cloud passage would cause the VFD operating frequency to drop from its maximum value (50 Hz) to its minimum value (0 Hz) in 2.5 s, which is higher than all the fluctuations recorded in the paper. Based on this, the characteristics of these FWD disturbance signals are as follows.
- Range: 0 Hz to 50 Hz.
- Period: 5 s, including a drop in 2.5 s and a rise of the same magnitude.
Consider that we apply a sinusoidal FWD perturbation. Based on Equation (5), we can establish that the better tuned the system is, the closer to a perfect sine the system response will be. To measure the perfection of the system response, we have applied a widely used standard indicator, the total harmonic distortion (THD) (Equation (6)).
where corresponds to the amplitude of the i-th harmonic of the analysed signal and is the amplitude corresponding to its fundamental frequency. For a perfect sinusoidal signal, the THD value is zero. For any type of signal, the smaller this THD value is, the better its approximation to a perfect sinusoidal signal.
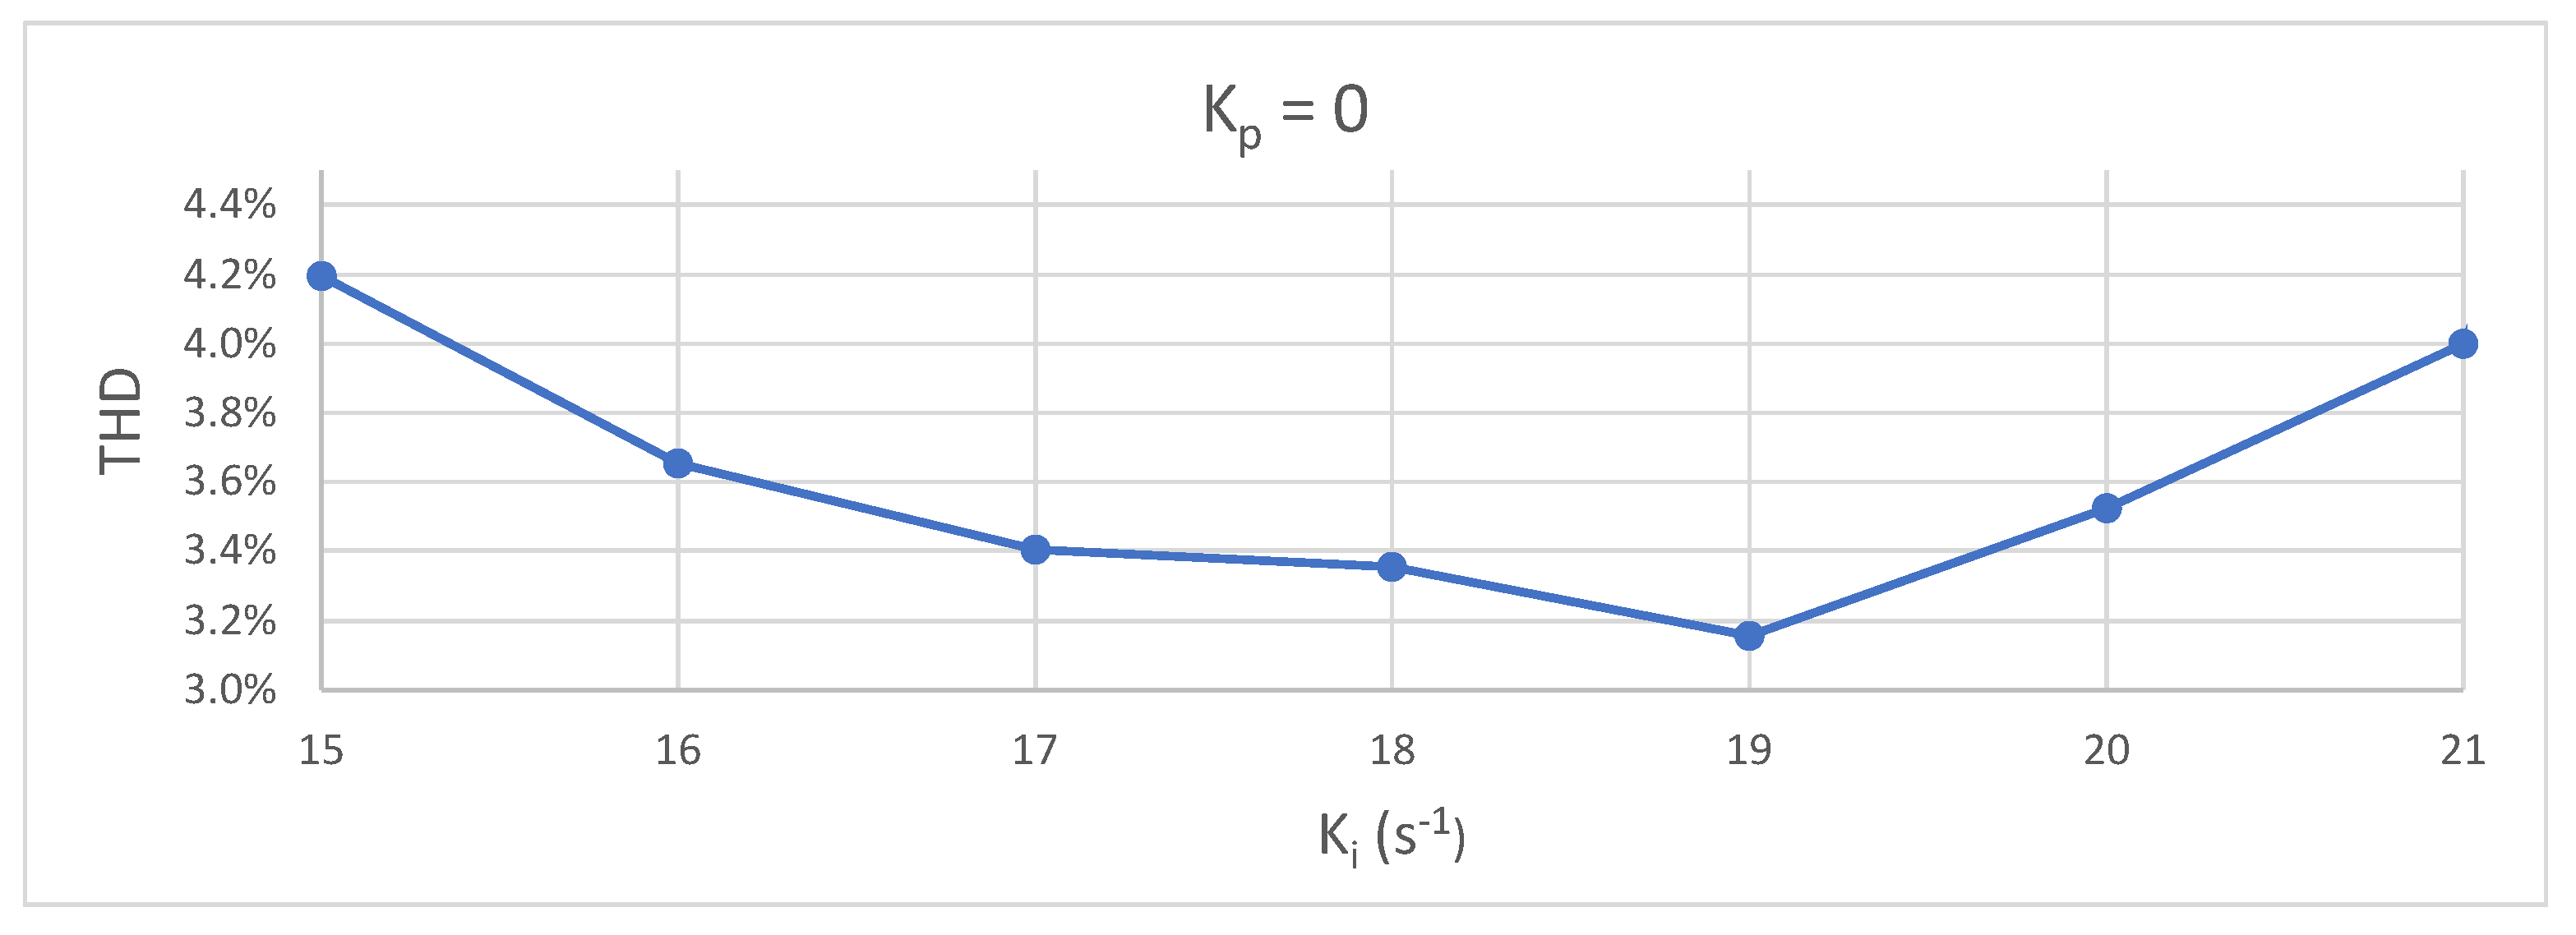
Figure 6 shows the results of applying a sinusoidal FWD disturbance to the system for different values of the parameter and a value of . It can be clearly seen that an absolute minimum of appears for −1.
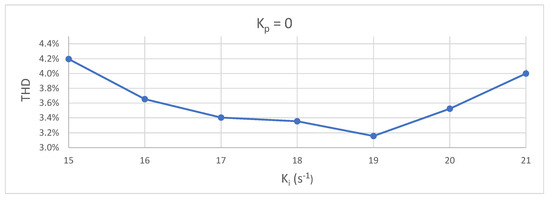
Figure 6.
Values of THD with and different values of for sinusoidal feedforward signal.
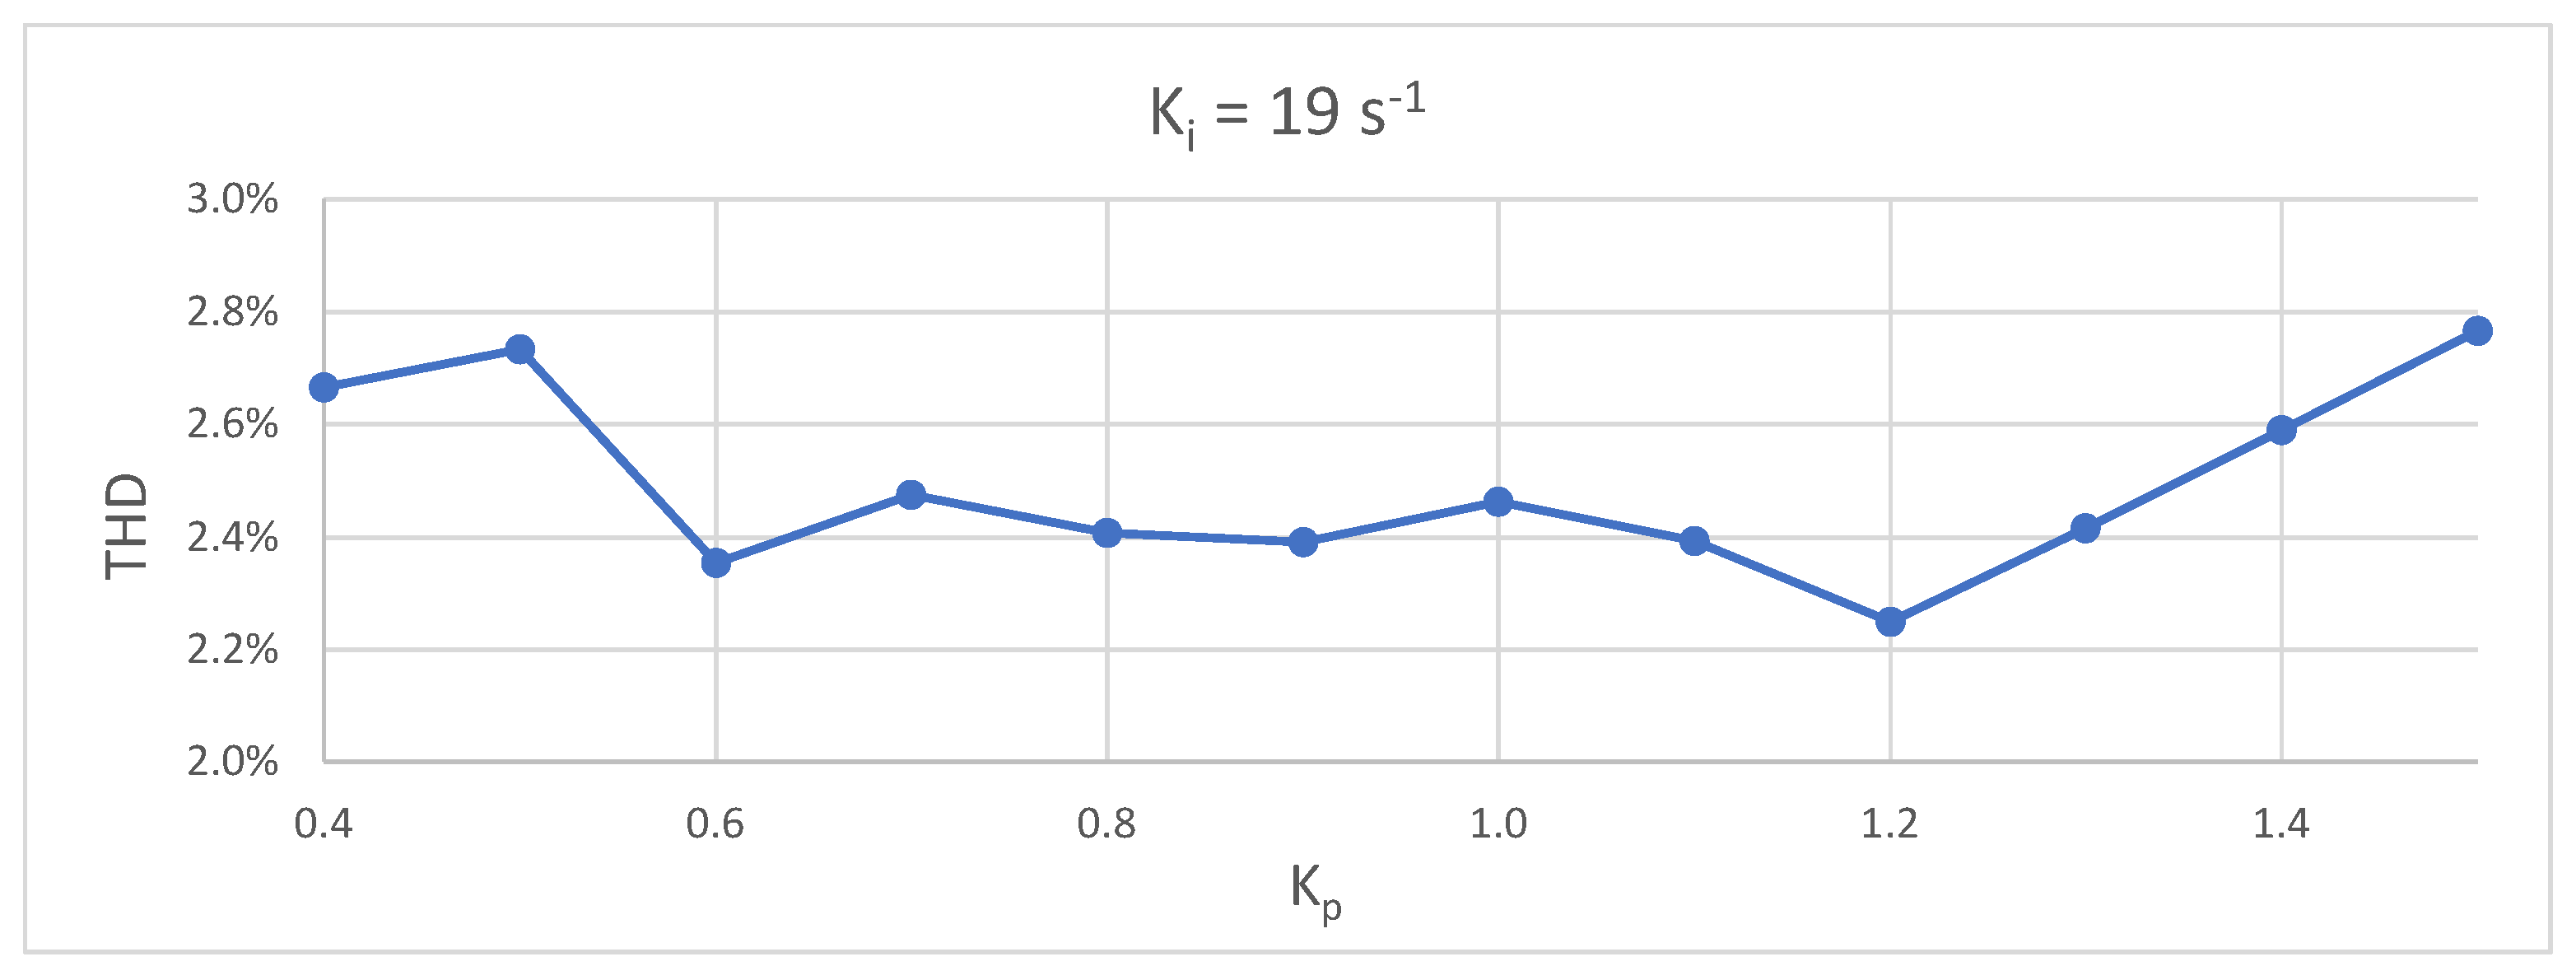
Once the optimum value of has been found, it is necessary to obtain the optimum value of . To do so, we use a similar method: is fixed at its optimum value and a sinusoidal FWD perturbation is applied for different values of until we find the one that gives the lowest THD. The results are shown in Figure 7. It is observed that there is no clear absolute minimum and that, in addition, its range of variation is much smaller, less than 0.6%.
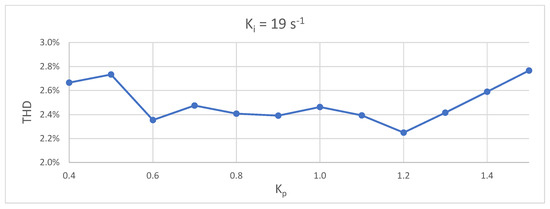
Figure 7.
Values of THD with and different values of for sinusoidal FWD signal.
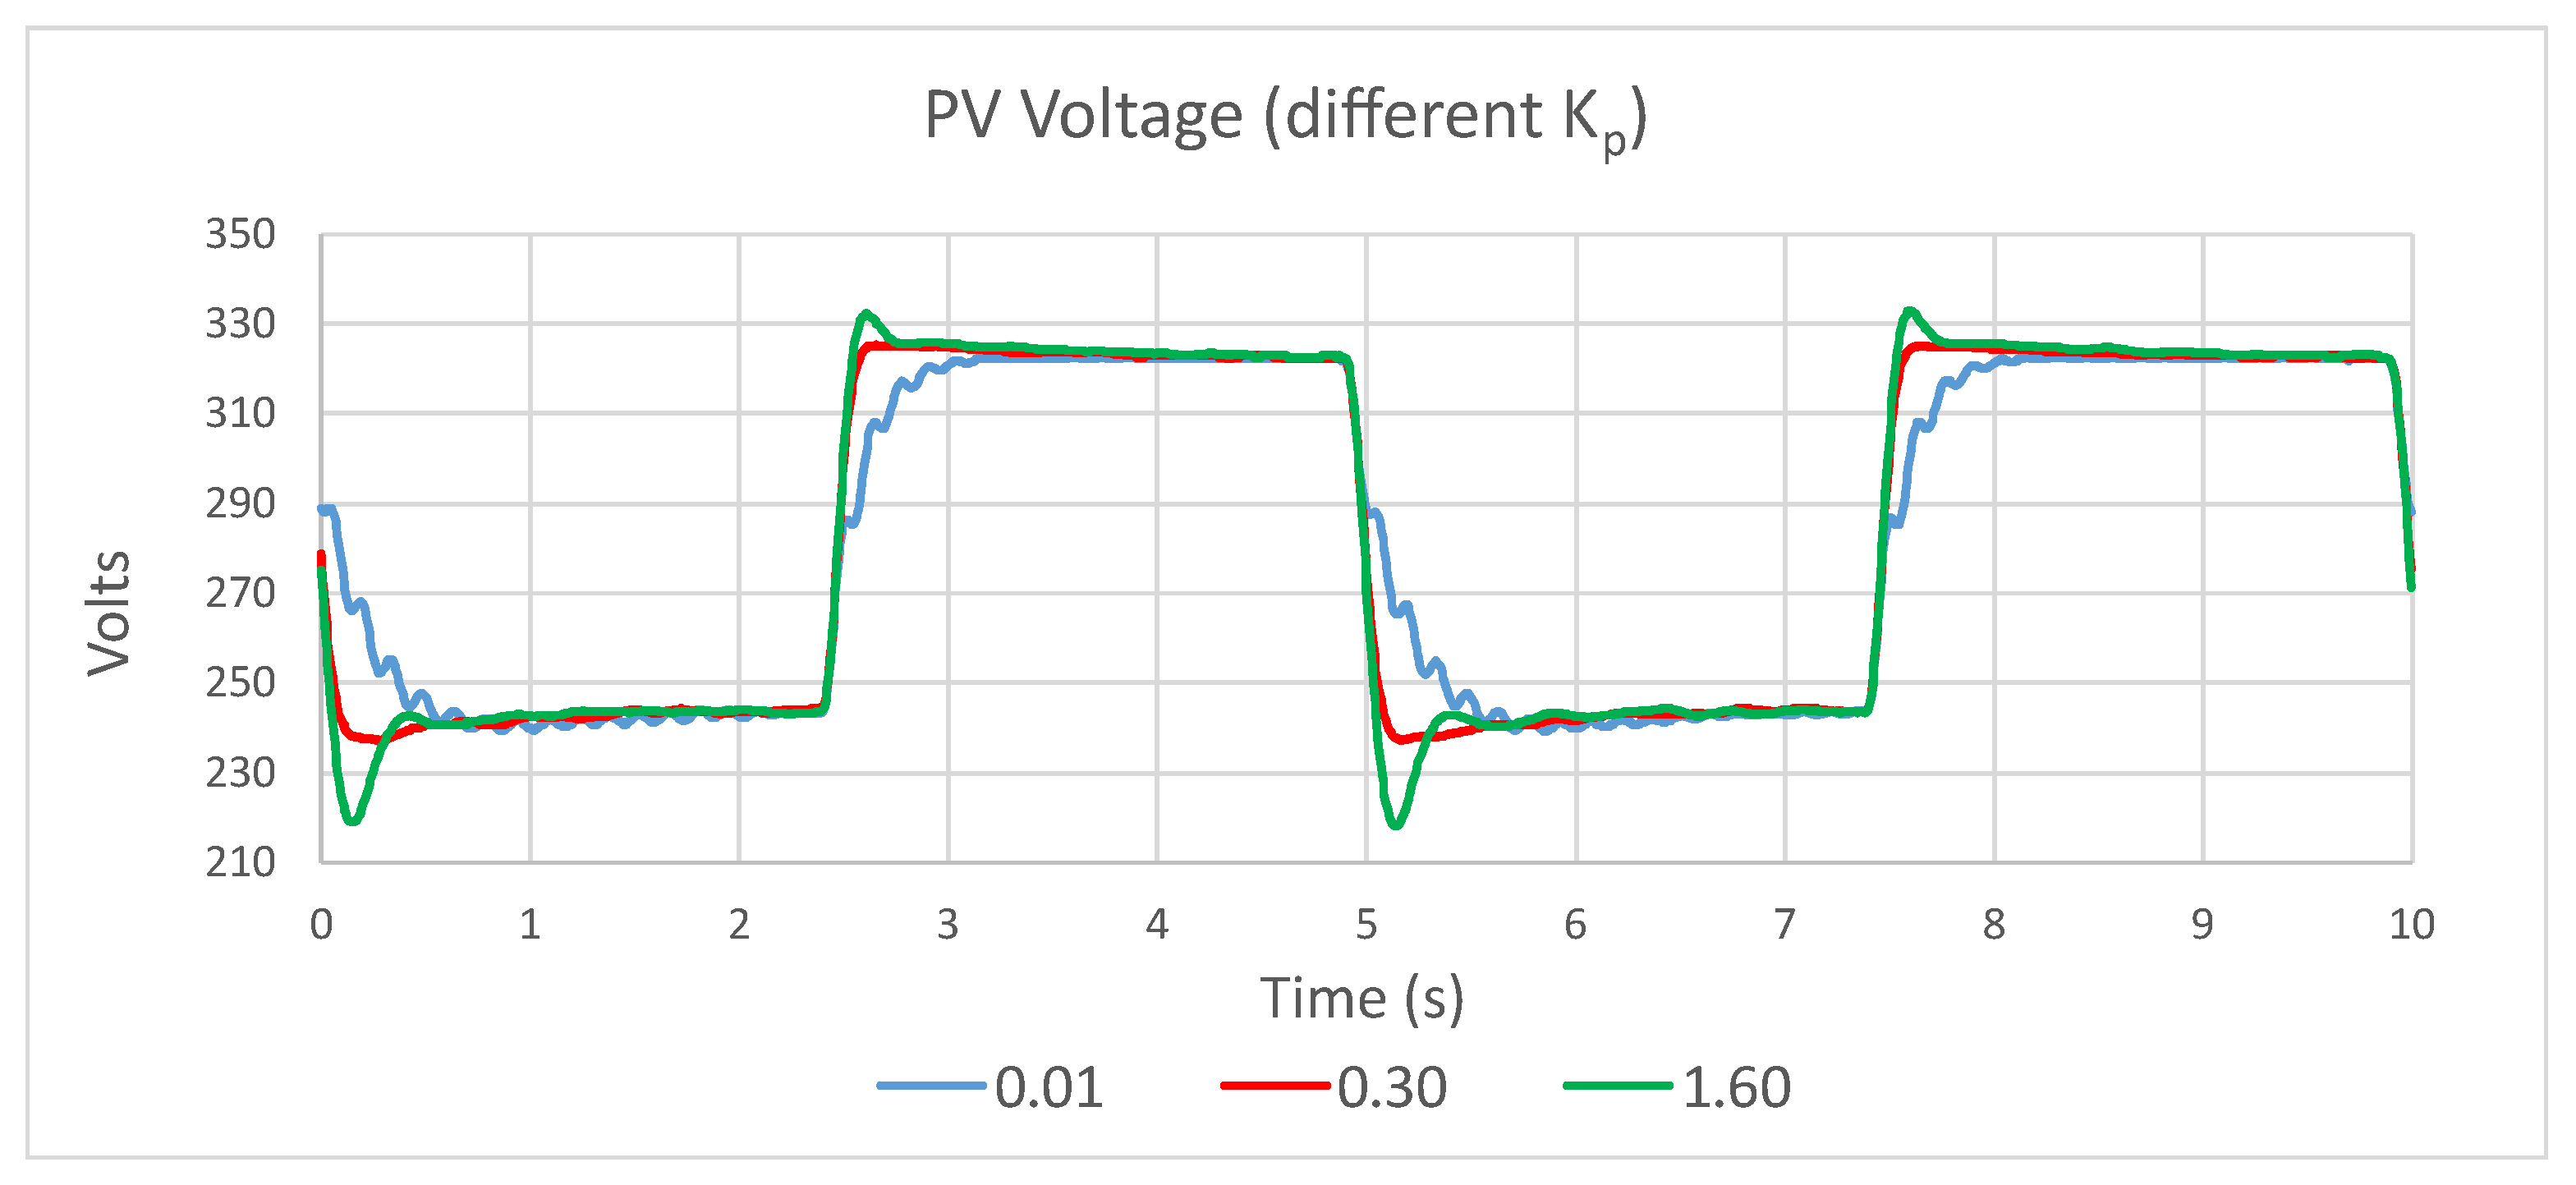
From this result, it is concluded that this method is not suitable for obtaining the optimum value of . Alternatively, a triangular disturbance signal is tested, since the response to this type of signal shows higher sensitivity to variations in , as can be seen in Figure 8.
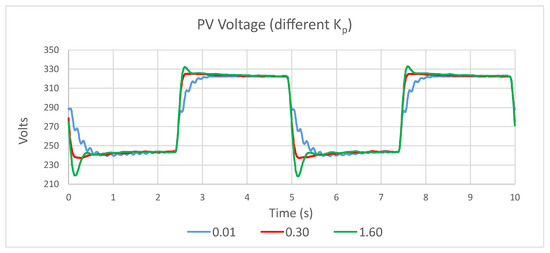
Figure 8.
Voltage response using triangle as FWD signal (, different values of ).
The figure shows the system response with and three different values of . A smaller value of than the optimum has been chosen for illustrative purposes in order to reduce the high frequency ripple and to make the effect of the variation more visible. At , a distorted signal appears with overshoot on both the rise and the drop. At , the signal shows damped rises and falls, while the value of is the one that shows a signal closer to a perfect square. In order to quantify this behaviour, we have defined a new indicator that allows us to evaluate which signal is closest to the ideal square. We have called this indicator total square distortion (TSD) and its interpretation is equivalent to the THD of sinusoidal signals: the smaller its value, the more similar the analysed signal is to the perfect square signal. It is calculated using Equation (7):
where is the amplitude of the odd harmonics of the perfect square signal and H is the amplitude of the harmonics of the analysed signal ( and are the amplitudes corresponding to the fundamental frequency of the signal). It has been experimentally verified that, in this type of system, it is sufficient to consider only the first six odd harmonics from the third one to obtain relevant values.
Figure 8 shows the values obtained: ; and . It can be seen that the resolution of this indicator is much higher than that provided by the THD of the sinusoidal FWD disturbance signal.
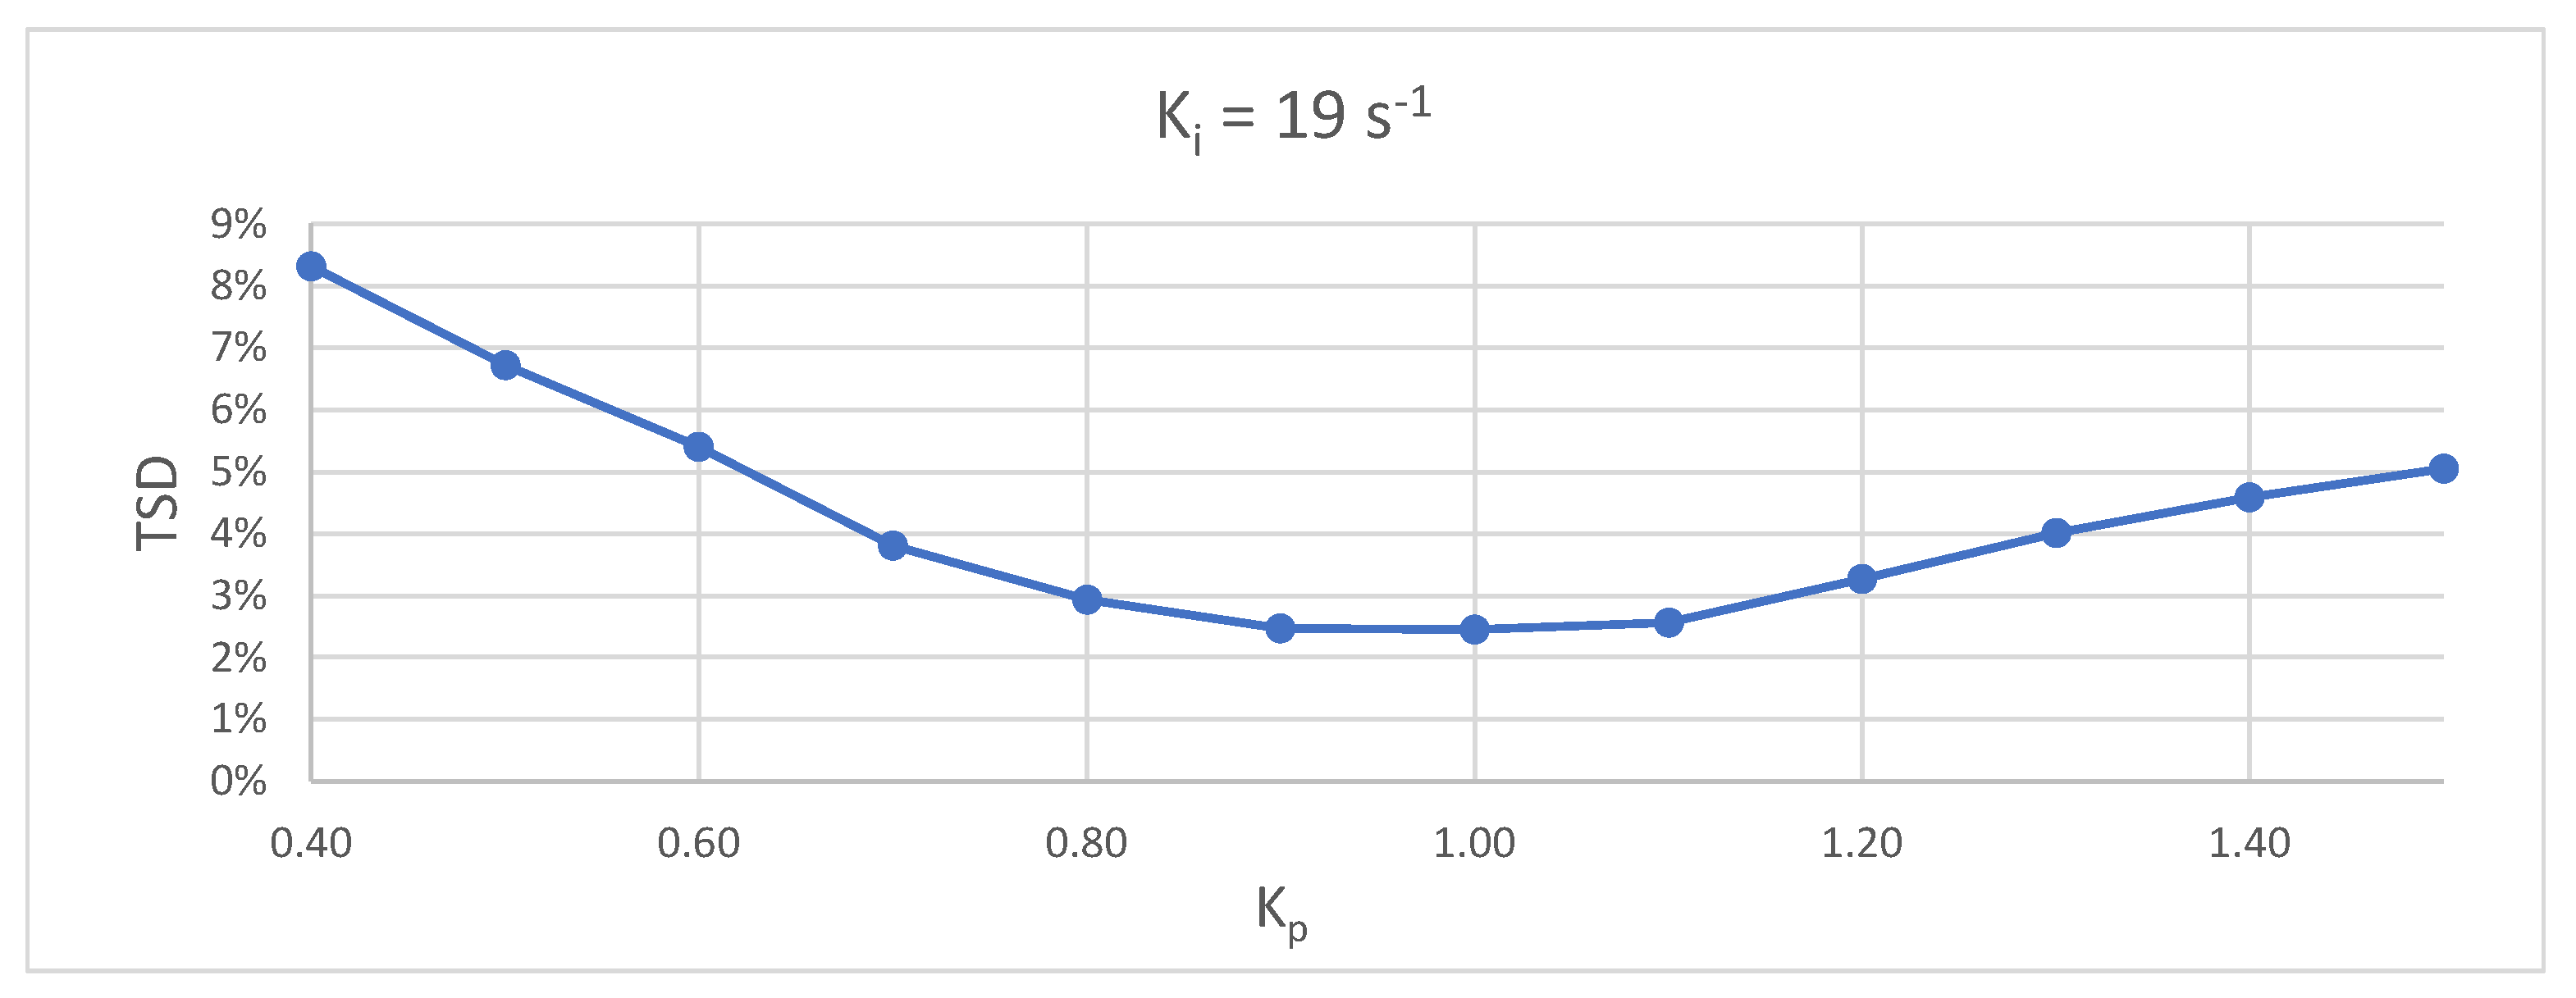
To finish the tuning, this procedure is applied for the optimum value of s−1 and the result is shown in Figure 9. It can be seen that it shows an absolute minimum at .
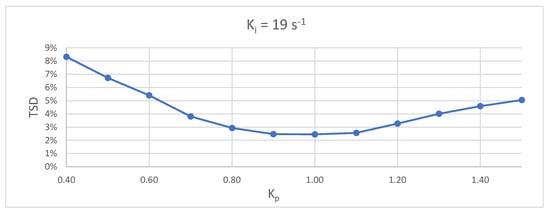
Figure 9.
Values of TSD with and different values of for triangular FWD signal.
Automation of the New Tuning Method
The new tuning process defined above is quite suitable to be developed automatically due to the following characteristics.
- The quality indicators of the tuning parameters, THD and TSD, are concretely defined and can be obtained in real time from the FFT calculation.
- The optimal tuning values of the control parameters correspond to the absolute minimums of both indicators. can be obtained by calculating the minimum THD for a sinusoidal FWD disturbance signal and by calculating the minimum TSD for a triangular FWD disturbance signal. This makes them easily identifiable by an automatic method.
However, the system imposes a number of restrictions that must be considered when designing and implementing the tuning method. The most important aspect is to prevent the system from becoming unstable. In order to do so, it is necessary to take the following requirements into consideration.
- The system tends to become unstable when the value of any of the parameters or exceeds, even by a small magnitude, their optimal tuning values. This makes most classical function minimum search algorithms inapplicable.
- Correct initialisation of the parameter values and is important to ensure that the first iteration always produces a stable system response.
The first requirement is to find the minimum of the THD or TSD function by approaching the optimum value of the tuning parameters from values below it. The second requirement is to find initial values for these parameters that meet the stable response condition.
This is easy to do for the initial setting because a zero initial value will always be less than its optimum value and does not cause system instability in the presence of a sinusoidal FWD disturbance. However, the initial value of is more difficult to set because the amplitude of the PV generator voltage variation is inversely proportional to its value. Thus, an excessively low value of could produce a voltage oscillation that leads to system instability. Therefore, in order to define the initial value of , it is necessary to rely on the experience accumulated in the manual tuning of this type of system. According to this experience, a value of s−1 is adequate for the stable operation of these systems, regardless of the nominal power of the PV generator.
Based on this, the initial values for the control parameters of the method are and s−1.
Finally, a minimum value for the increments of both control parameters must also be defined. For this purpose, the THD and TSD have been calculated for 4 different periods of the signal for different values of and and their mean value and standard deviation have been obtained. It has been established that the difference between the mean values of TSD and THD between two consecutive values of and , respectively, must be greater than the standard deviation of these measurements. After performing different tests, the results are as shown in Table 1 and Table 2. It has been concluded that increments of of 1 s−1 and increments of of 0.05 will be performed. It can be seen that this criterion is only met for some values of and , which are the closest to the minimum values of TSD and THD, respectively.

Table 1.
THD mean and standard deviation for and different values of .

Table 2.
TSD mean and standard deviation for and different values of .
Two methods of automatic tuning have been developed, which differ in the execution time and in the accuracy of the control parameter values. Both methods always start with a check that the initial value of is appropriate and that the system is stable.
- -
- Fast method
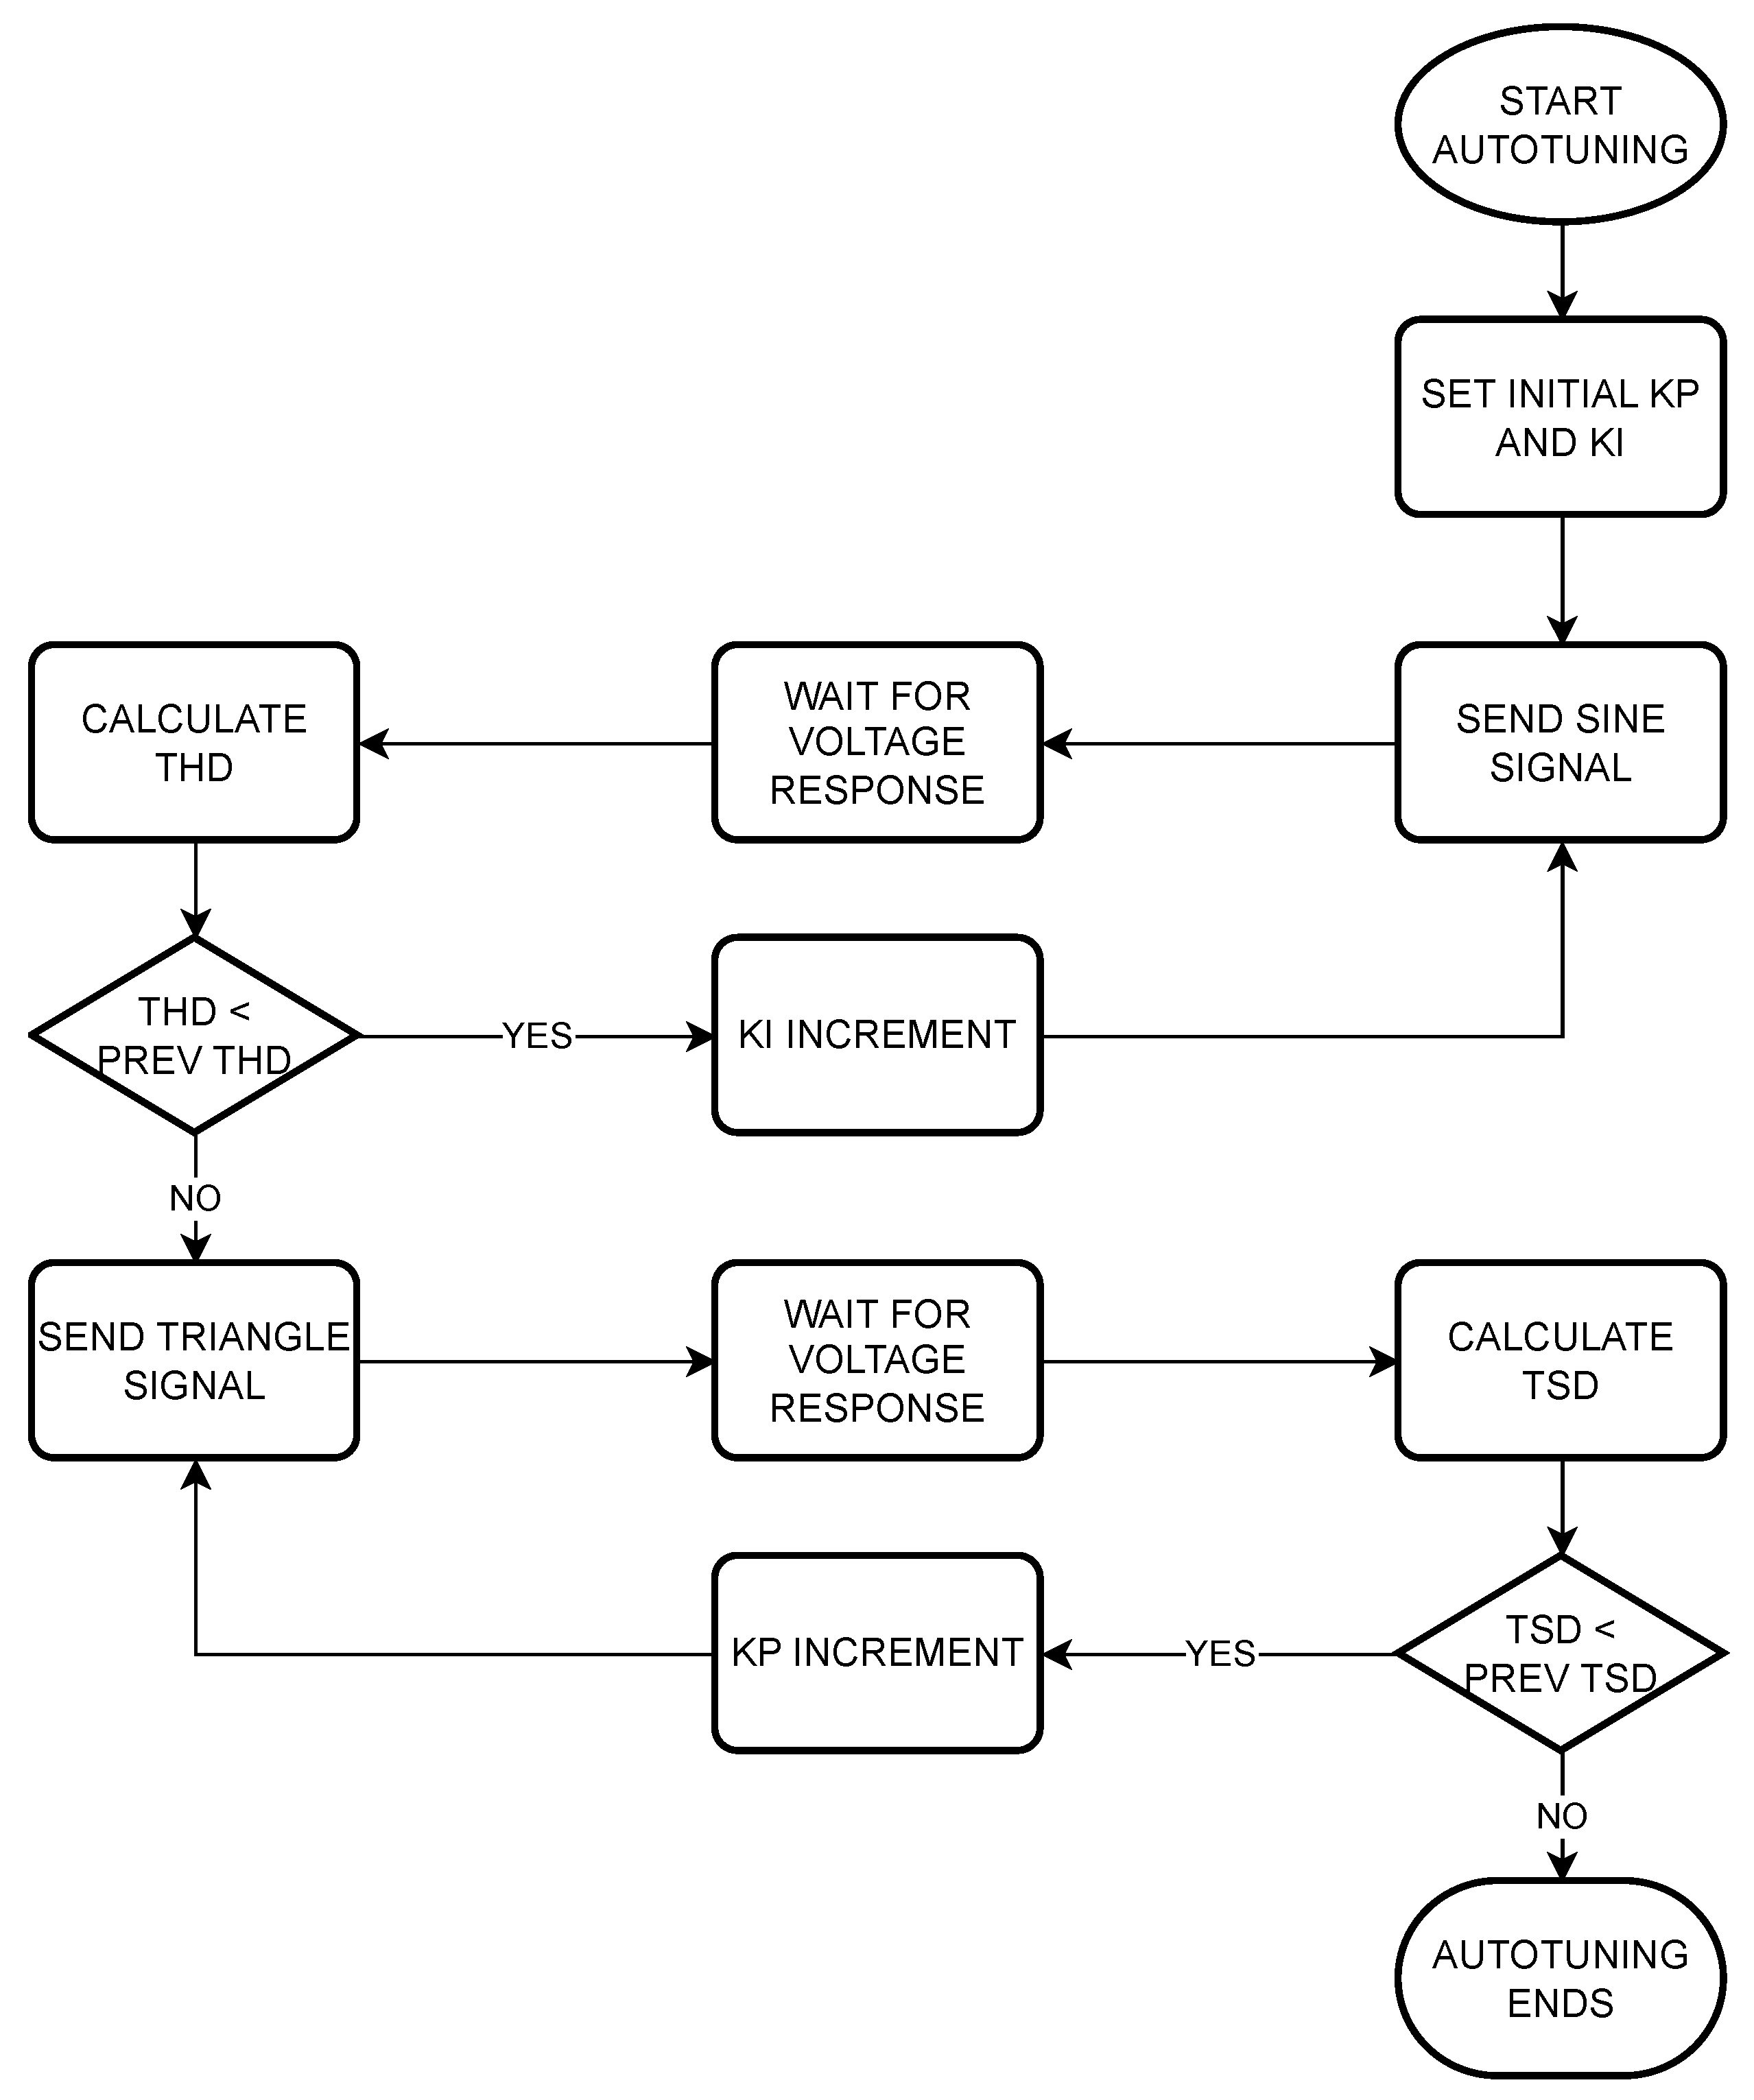
The flowchart of the fast method is shown in Figure 10. It can be seen that it follows almost the same procedure as described in the previous section.
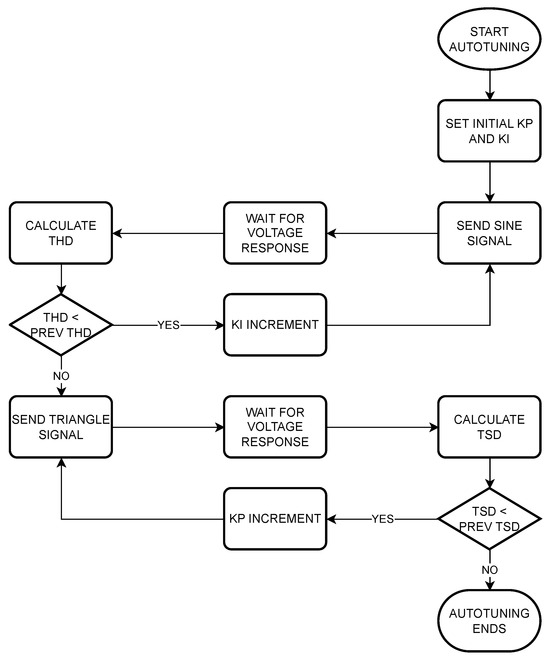
Figure 10.
Fast method flowchart.
This method performs only two iterations. In the first iteration, the optimal is calculated. The starting point is a value of and a value of s−1. The voltage setpoint is set to the value of the maximum power point of the PV generator and a sinusoidal disturbance is applied to the FWD input. The calculation period of the PI control is set to 5 ms. The voltage values of the PV generator are stored in memory with the same periodicity. When the disturbance ends, the FFT of the PV generator voltage signal is calculated and, based on its results, the THD indicator is calculated considering the first 100 harmonics. The process is repeated with 1 s−1 increments in the value of . The iteration is repeated as long as the THD value is less than the previously calculated value. At the moment that an increase in THD occurs, it is stopped and the value of from the previous iteration, which corresponds to the minimum THD, is selected as the optimum value of .
In the second iteration, the starting point is the optimal value obtained in the previous iteration and . The process is similar to the previous one, except that, in this case, the applied FWD disturbance is a triangular signal and the TSD indicator is calculated considering only the first six odd harmonics, starting with the third one. The process is repeated for increasing values of in 0.05 increments. The iteration is performed as long as the TSD value is less than the previous one. The process stops at the moment when an increase in TSD occurs and the value of the previous iteration, which corresponds to the minimum TSD, is selected as the optimal value.
- -
- Complete method
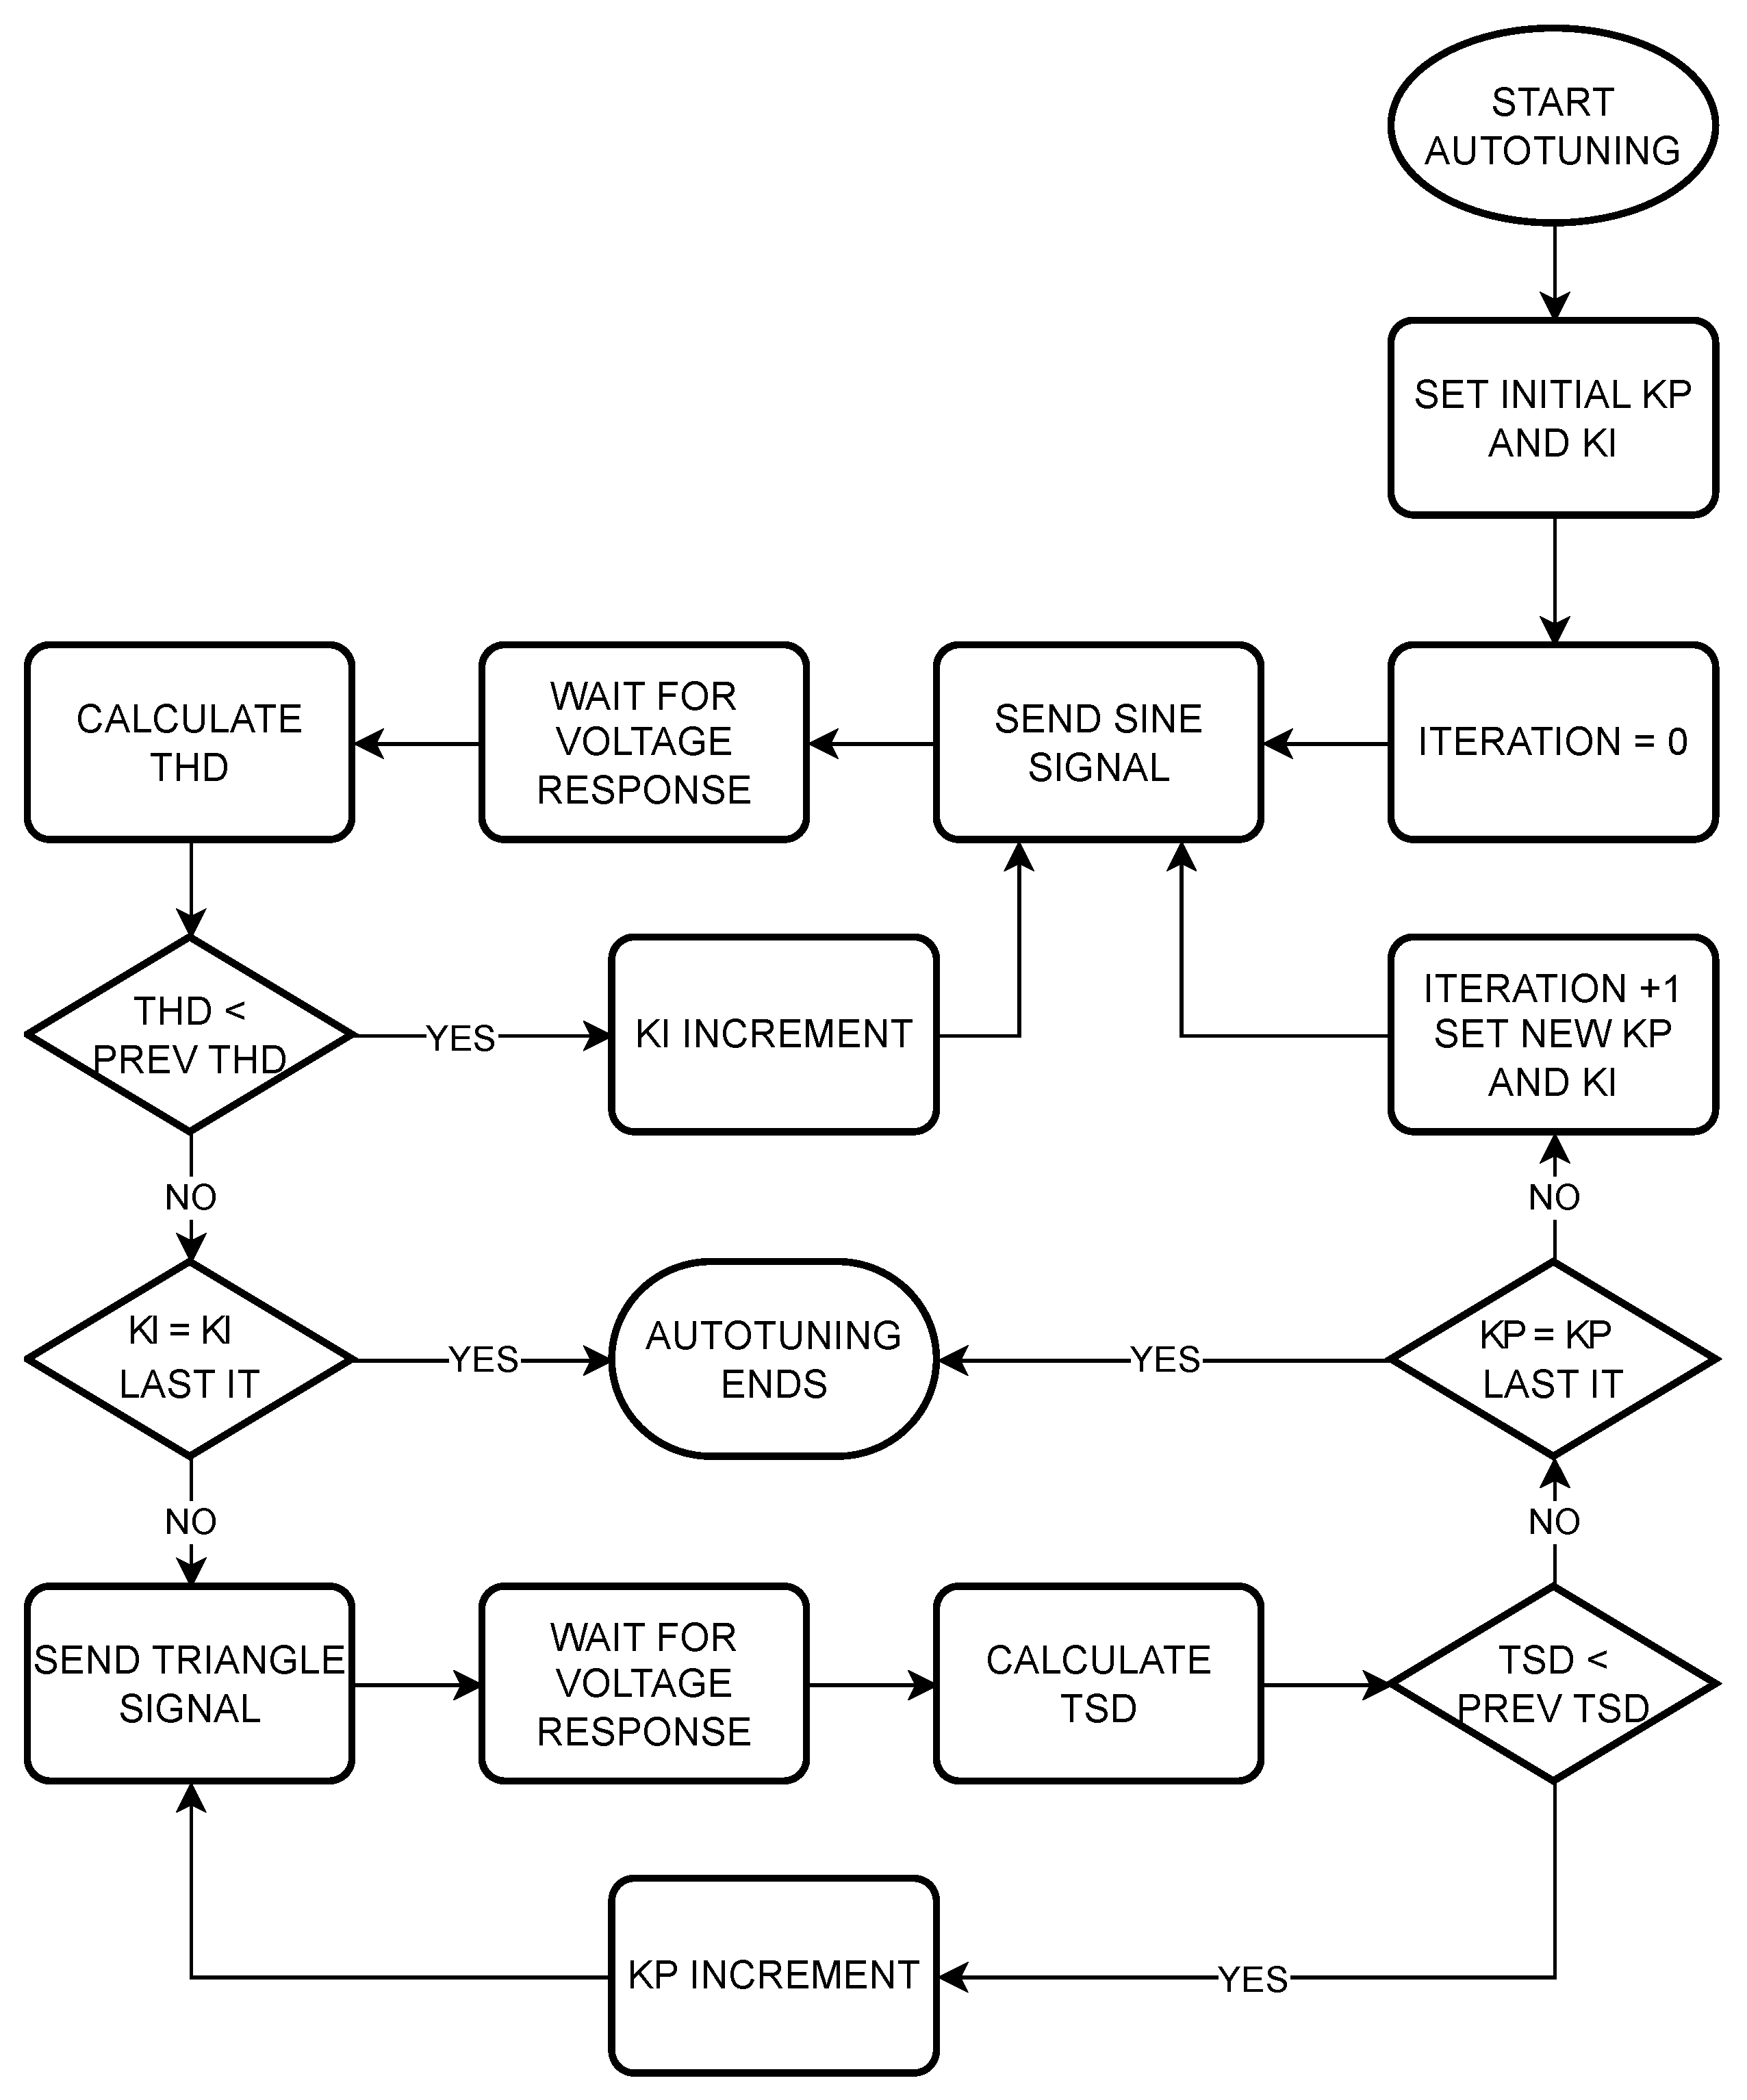
The fast method has the disadvantage that the optimal value of has been obtained for a value of , but it is not guaranteed to be optimal for the final value of . To overcome this problem, a more precise method has been developed, which we call the complete method, whose flowchart is shown in Figure 11.
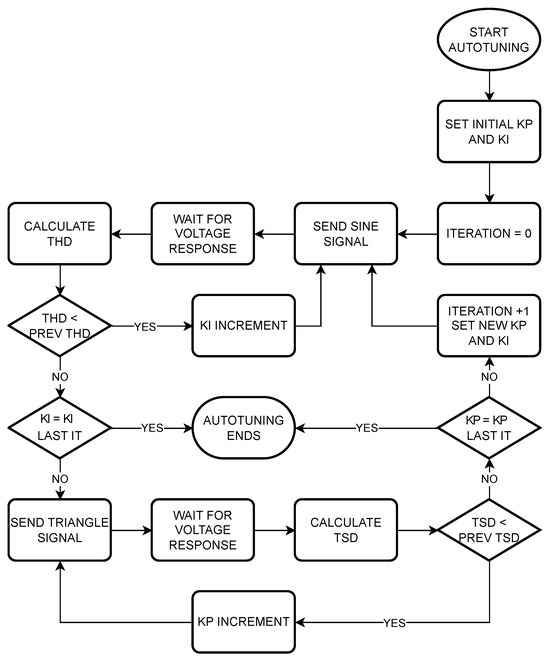
Figure 11.
Complete method flowchart.
The number of iterations of this method is higher than that of the fast method. The initial procedure is similar to the fast method but does not end with the calculation of the in the second iteration. A third iteration is performed to recalculate with sinusoidal FWD perturbation: increments of are performed, but now the optimum value of of the second iteration is set instead of . If the value of minimum THD corresponds to the same value of as that obtained in the first iteration, the process is complete and the same result as in the fast method is obtained. If this is not the case, a fourth iteration is performed, starting from the new value of obtained in the previous one and again applying the triangular FWD perturbation and making increments of until a minimum TSD value is obtained. It is compared again, now with the value of obtained in the second iteration. If it matches, the process ends, and, if it does not match, a new iteration is performed again, starting from this new .
The process is repeated indefinitely until the value of one of the two parameters matches that of the previous iteration.
It should be noted that the initial values of the variables in each new iteration do not match those of the previous one. To reduce the number of steps in each iteration and speed up the process, the initial value of the parameter is obtained by multiplying the previous optimal value by a factor of less than one and rounding it off.
3. Evaluation of the Result of Automatic Tuning
Once the tuning process has been completed, it is convenient to design a method to evaluate whether the values of the control PI parameters obtained in the tuning process are optimal for the system.
This evaluation should be performed by testing the robustness of the system against the passage of clouds of different types, but this type of test requires waiting for the appropriate weather conditions to occur. A simpler evaluation method that guarantees the robustness of the system’s response to any real clouds is to abruptly decrease the PV power of the system. In our experimental setup, this can be easily done by instantly disconnecting some branches of the PV generator. Accordingly, the following test has been designed.
- The starting point is low irradiance conditions so that, with all three PV generator branches activated, the frequency is close to 50 Hz but does not reach it. This ensures that the system is operating at the voltage of the maximum power point of the PV generator.
- At one point, two generator strings are instantly disconnected, leaving the system powered by only one string, so that the available PV power has been reduced by 66%. This drop is considerably sharper than any real cloud can generate, so that we can guarantee that, if the system responds without any alarm due to VFD destabilisation, the tuning can be considered adequate.
- If the system responds without destabilisation, it can be concluded that the control parameters obtained with this automatic tuning method are adequate for the correct operation of the system.
4. Results and Discussion
In order to evaluate the suitability of the new automatic tuning methods, a series of tests have been carried out, which are detailed below.
- Automatic tuning tests with the VFD model YASKAWA CIMR-AC2A0010FAA.
- Automatic tuning tests with other VFD models, OMRON 3G3RX-A2004-E1F and FUJI FAD FRN0005E2E-7GA.
- Cloud pass-through testing of the above systems with the control parameters obtained in auto-tuning.
In all the tests, the configuration of the VFDs was equivalent.
- Operating mode: V/f.
- Maximum frequency: 50 Hz.
- Frequency reference: analogue input 0–10 V.
- Acceleration/deceleration time: 0.01 s.
There is one key feature that is not fully configurable, which is how quickly the VFD output responds to a change in the frequency reference. This is a fundamental factor in the performance of the VFD, since it would be useless for the PI controller to perform calculations every 5 ms if the refresh of the VFD output frequency occurs with a delay much longer than this value. Normally, this information does not appear in the data sheets of commercial VFDs, so the suitability of a particular model cannot be assessed beforehand. However, in many VFD models, there is a parameter that allows a filter to be applied to the analogue input signal. This type of filter is intended to reduce the noise that may be coupled to the signal, but it has the effect of introducing a delay. For this reason, it is advisable to select VFD models that include this parameter and set it so that the delay introduced in the frequency reference signal is the minimum. Based on this criterion, the three commercial VFD models used in this paper have been chosen.
PVIS are non-linear systems [24], so the optimal value of the control parameters can be different depending on the weather conditions in which the tuning process is performed. To evaluate the influence of these conditions, three tests have been performed for each VFD under different available power () and conditions: low G–low , high G–low , and high G–high .
The PV power available from the PV generator has been calculated using Equation (8) [11].
where
| n | = number of PV generator branches connected; |
| = nominal power of each branch under STC conditions (); | |
| = power correction factor with temperature ( %/°C); | |
| = cell temperature (°C); | |
| G | = incident irradiance on the PV generator (W/m2). |
4.1. Auto-Tuning Tests with Yaskawa A1000 VFD
Three tests have been performed under different and conditions, which are shown Table 3.

Table 3.
Yaskawa VFD auto-tuning conditions for three different tests.
The tests have been performed by feeding the VFD with a single branch of the PV generator, with the exception of test 3, which was performed at low irradiance but connecting two branches of the PV generator.
From the third iteration onwards, the initial values of the parameters have been obtained by multiplying the final value obtained in the previous iteration by 0.85 and rounding the result to its nearest test value.
4.1.1. Test 1: High G and High
The results of this test are shown in Table 4 and Table 5. The number of steps specifies the number of values tested for the calculation of or in each iteration.

Table 4.
Auto-tuning process for high G and high .

Table 5.
Final auto-tuning results for high G and high .
4.1.2. Test 2: Low G and Low

Table 6.
Auto-tuning process for low G and low .

Table 7.
Final auto-tuning results for low G and low .
4.1.3. Test 3: High G and Low

Table 8.
Auto-tuning process for high G and low .

Table 9.
Final auto-tuning results for high G and low .
From the results of these three tests, we can highlight a series of important aspects regarding the performance of the automatic tuning method.
Firstly, it should be noted that the value of the PI parameters is different in all cases, both if we compare those obtained in the fast method and in the complete method and if we compare those obtained in the three different meteorological conditions. This result is expected due to the non-linearity of the system.
The maximum variation of occurs from a minimum of 0.95 to a maximum of 1.15 (a percentage variation of 21%). The maximum percentage of variation of between the fast and the complete method is 20%, which occurs between a minimum value of 20 s−1 and a maximum of 24 s−1. If we compare the results for the three meteorological conditions, we obtain a minimum of 20 s and a maximum of 28 s, with a percentage variation of 40%.
It can be concluded that the results of the automatic tuning method are highly dependent on the meteorological conditions in which it is performed. Therefore, it has to be questioned under which conditions it has to be performed in order for its results to be valid in all conditions. It should be noted that the resulting PI parameter values should ensure the stable operation of the system under all weather conditions, but will only be optimal under the conditions under which the tuning process has been carried out. The smallest values of both and are those that produce the smoothest response of the system, which ensures that there are no oscillations, so they are the ones that should be chosen from all the results obtained in the different tests carried out. These values have been obtained as a result of the complete method in the conditions of maximum G and maximum , so we can conclude that these are the meteorological conditions in which the automatic tuning method should be executed.
Regarding the execution time of the methods, the difference between the fast method and the complete method is very variable, reaching 109% in test 2 and only 31.5% in test 3. This difference is mainly due to the fact that, in test 2, there were 11 iterations, and, in test 3, there were only four. Analysing the initial and final values of G and in test 2, it can be seen that there was a 34% variation in G and a 15% variation in . It is reasonable to suggest that the long duration of this test may be due to the large variation that these magnitudes have experienced throughout the process.
Based on this, we can conclude that the tuning must be carried out by running the complete method under conditions of maximum G and maximum and that these conditions remain stable throughout the process.
4.2. Evaluation of Cloud-Pass Test with Yaskawa A1000 VFD
After applying the automatic tuning method, its suitability for sudden fluctuations in PV power was evaluated by performing a cloud-pass test. This test was performed in low G conditions and three branches of the PV generator were connected, allowing the drive to operate at a frequency slightly below 50 Hz. Two branches were disconnected instantaneously, so the PV power was reduced by 66%.
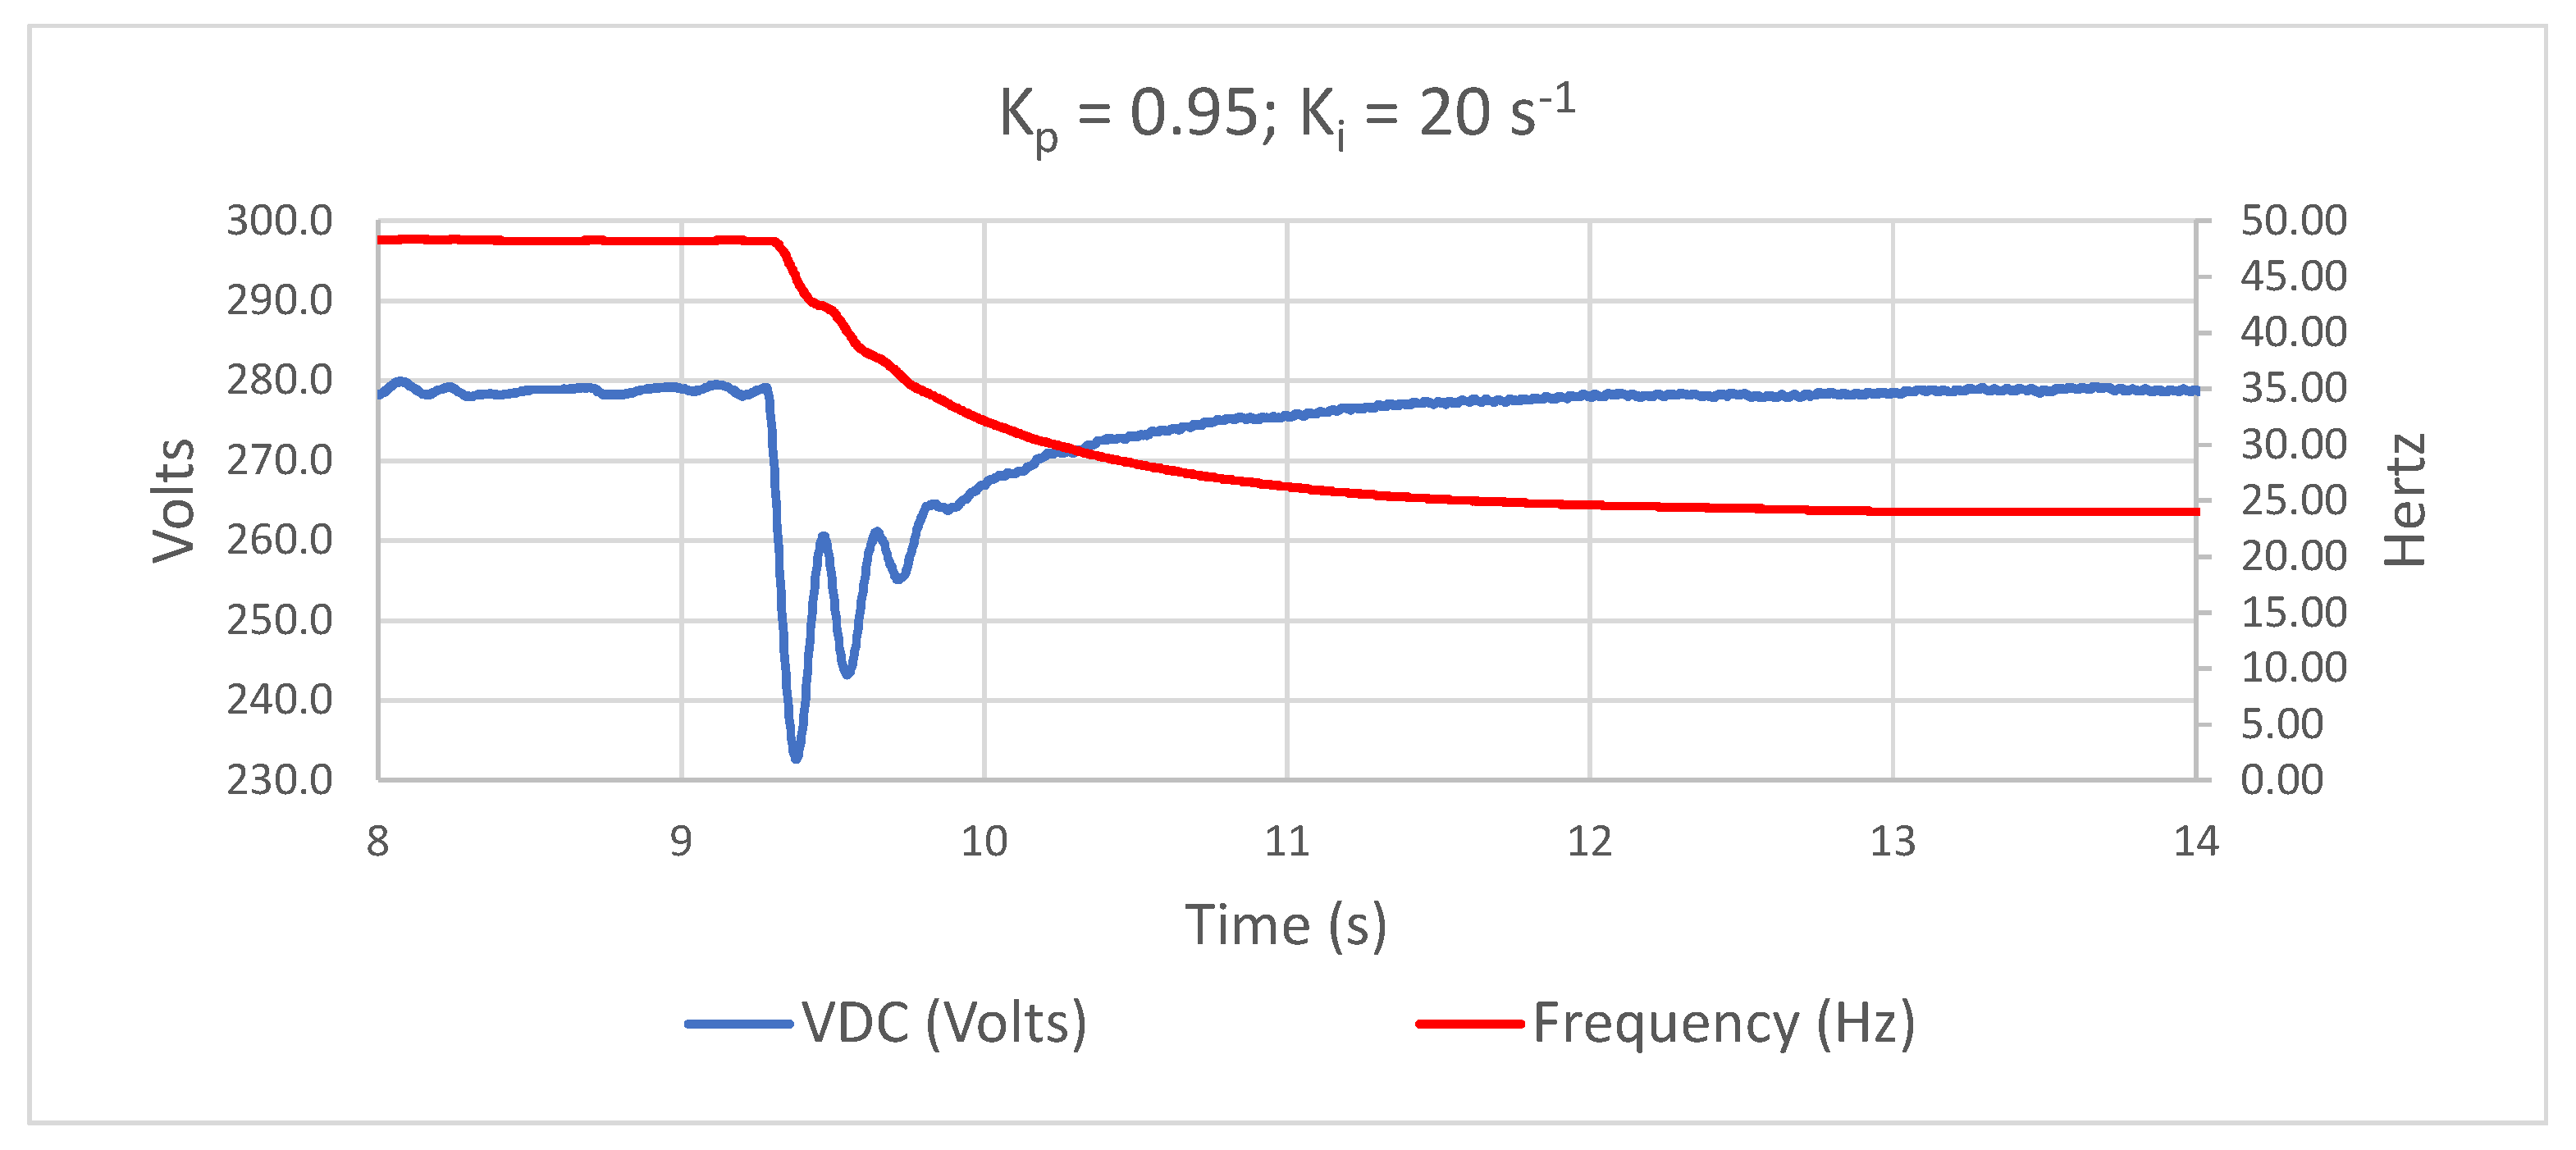
The control parameters were set with the values s−1 and , which were the values obtained in the high G and high test. The test result is shown in Figure 12.
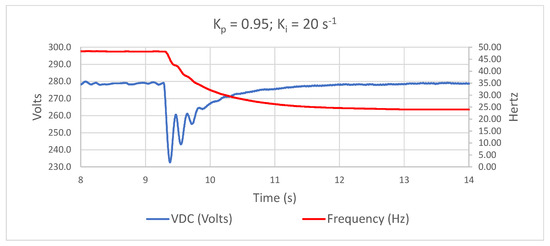
Figure 12.
Voltage and frequency response to the cloud-pass test.
It can be seen that the system can perfectly support the instantaneous loss of 66% of its PV power without extreme fluctuations in the VFD DC voltage, causing an undervoltage alarm or an uncontrolled shutdown. The VFD voltage drop does not exceed 50 V and returns to its setpoint in less than 3 s. Even if a slight oscillation occurs, it is quickly damped and does not compromise the stability of the system. With regard to the operating frequency of the motor pump, it is observed that the controller reduces it progressively and smoothly, without abrupt changes, which has a positive effect on the mechanical durability of both the motor and the rest of the system.
This result confirms that the tuning parameters obtained with the automatic tuning method described in this section guarantee the robustness of the system’s response to any power fluctuations caused by cloud passage.
The analysis of the robustness achieved in the system through this tuning method is rigorous, given that it results in a power drop scenario that is unlikely to occur in real cloud conditions. By successfully withstanding this drop, the system demonstrates its resilience to sudden power fluctuations caused by passing clouds. This approach eliminates the necessity for prolonged data collection and analysis to verify the correctness of the tuning.
4.3. Automatic Tuning Tests with Other VFD Models and the Improved Complete Method
In order to analyse the influence of the VFD model used on the results of the new automatic tuning method, tests have been carried out with two other VFD models, the OMRON 3G3RX and the FUJI FAD.
For these tests, some modifications have also been introduced in the automatic tuning method with the intention of improving it by minimising the execution time. These modifications are as follows.
- The increase in the parameter has been doubled in the first iteration, as well as the increase in the parameter in the second iteration. In the rest of the iterations, the one used in the previous tests has been maintained. The aim of this change is to speed up the development of these first two iterations before moving on to the following iterations, where fine tuning is performed.
- From the third iteration onwards, the initial values of the parameters have been obtained by subtracting a single increment of the parameter from the final value obtained in the previous iteration. For example, if, in the second iteration, a final value of was obtained, the initial value of in the fourth iteration is .
- To consider the error in the measurement of the THD and TSD values, the comparisons made by the method take the standard deviation (STD) of these measurements into consideration. For example, if, in one test, the measured THD value is lower than in the previous test, but the sum of this measured value and the STD is higher than the previous measurement, then the iteration is finished.
The tests have been carried out for the three VFD models under the maximum G and maximum conditions allowed by the meteorological conditions at the time of testing, as shown in Table 10.

Table 10.
Auto-tuning conditions for testing with different VFDs.
Results obtained are shown in Table 11.

Table 11.
Auto-tuning results for different VFDs.
The following conclusions can be drawn from the results.
- The final values of the parameters and obtained for the A1000 VFD with this improved method agree with those obtained by the complete method in the previous test. The difference between them is equal to the minimum increment applied by the method (0.05 in and 1 s−1 in ), which is, in practice, the margin of error made in the process. This shows that both methods give equivalent results.
- The computation time is, in all cases, shorter than that used in the previous test, even with the fast method, which shows that this improved method performs better.
- The maximum difference between the final results for and between the three VFD models is 13% for and 15% for . This indicates that the VFD model used influences the optimal values of the PI parameters. The cause of this is not obvious, but we can attribute it to the analogue frequency reference input of the drives. As already indicated, the delay introduced by the drive at this input is not known, nor is its resolution. These two magnitudes have a direct impact on the oscillations of the PV generator voltage around its setpoint.
5. Conclusions
In this paper, in a PVIS controlled by a PI control with a FWD input, it is verified that the variations in the voltage of the PV generator (control variable) are proportional to the derivative of the signal applied to the FWD input, which is added to the controller output to provide the motor-pump operating frequency (output variable).
Considering the above, a new automatic PI parameter tuning method for PVIS has been developed. The main features are as follows.
- It uses two types of FWD disturbance signals applied to the feedforward input, one of sinusoidal type and the other of triangular type. Ideally, the sinusoidal signal should cause a sinusoidal response in the PV generator voltage and the triangular signal should cause a square response.
- Two indicators have been proposed to quantify the properties of the PV generator voltage response. For the response to the sinusoidal disturbance, the classical THD has been chosen. For the triangular disturbance, a new indicator has been defined (TSD) that provides an estimate of the similarity to a square signal. Both indicators are expressed in percentages and their ideal value is 0%.
- Two independent procedures have been developed to obtain the optimal values of the control parameters and . To obtain the optimum value of the parameter, a sinusoidal FWD perturbation is applied and the value that provides the minimum THD in the drive voltage signal is selected. To obtain the optimum value of the parameter, a triangular perturbation is applied and the value that gives the minimum TSD in the drive voltage signal is selected.
- The new automatic tuning method has been implemented in an external controller, independent of the VFD model. It is iterative: the two previous procedures are alternated until the minimum values of and are reached.
Tuning tests have been carried out in different meteorological conditions of G and , obtaining different optimum values of the control parameters in each test due to the non-linear nature of the system. It has been found that the most conservative values are obtained at maximum G and maximum . It has been established that these are the most suitable conditions for carrying out the new automatic tuning process.
Tests have also been carried out with different commercial VFD models, obtaining small differences in the optimum values of the PI tuning parameters, from which it is deduced that it is advisable to carry out the tuning with the same VFD model that will be definitively used in the system.
The robustness of the results of the new automatic tuning method to abrupt PV power fluctuations due to clouds passing over the PV generator has been experimentally tested. For this purpose, the system has been started up operating at the maximum power point of the PV generator and at a motor frequency very close to its maximum value of 50 Hz. Under these conditions, an instantaneous drop in PV power of 66% has been caused. The system responds appropriately, lowering the frequency progressively and avoiding the destabilisation of the VFD in the form of voltage oscillations that exceed the acceptable range for the VFD. This demonstrates the validity of the new automatic tuning method developed in this paper.
Author Contributions
Conceptualisation, F.J.G.-A., J.F.-R. and L.N.; methodology, F.J.G.-A. and J.F.-R.; software, F.J.G.-A.; validation, F.J.G.-A.; formal analysis, F.J.G.-A.; investigation, F.J.G.-A.; resources, J.F.-R. and L.N.; data curation, F.J.G.-A.; writing—original draft preparation, F.J.G.-A.; writing—review and editing, F.J.G.-A., J.F.-R. and L.N.; visualisation, F.J.G.-A.; supervision, J.F.-R. and L.N.; project administration, J.F.-R. and L.N.; funding acquisition, L.N. All authors have read and agreed to the published version of the manuscript.
Funding
This research was made possible thanks to funding from the European Union’s Horizon 2020 research and innovation programme for the SOLAQUA project under grant agreement No. 952879.
Institutional Review Board Statement
Not applicable.
Informed Consent Statement
Not applicable.
Data Availability Statement
Not applicable.
Conflicts of Interest
The authors declare no conflict of interest.
Abbreviations
- The following abbreviations are used in this manuscript:
| DAC | Digital to Analogue Converter |
| FWD | Feedforward |
| MPPT | Maximum Power Point Tracking |
| PID | Proportional-Integral-Derivative |
| PI | Proportional-Integral |
| PLC | Programmable Logic Controller |
| PV | Photovoltaic |
| PVIS | Photovoltaic Irrigation System |
| TSD | Total Square Distortion |
| THD | Total Harmonic Distortion |
| VFD | Variable Frequency Drive |
References
- Gupta, A.K.; Saxena, R. Review on widely-used MPPT techniques for PV applications. In Proceedings of the 2016 International Conference on Innovation and Challenges in Cyber Security (ICICCS-INBUSH), Greater Noida, India, 3–5 February 2016; IEEE: New York, NY, USA, 2016; pp. 270–273. [Google Scholar]
- Karami, N.; Moubayed, N.; Outbib, R. General review and classification of different MPPT Techniques. Renew. Sustain. Energy Rev. 2017, 68, 1–18. [Google Scholar] [CrossRef]
- Eltawil, M.A.; Zhao, Z. MPPT techniques for photovoltaic applications. Renew. Sustain. Energy Rev. 2013, 25, 793–813. [Google Scholar] [CrossRef]
- Sera, D.; Mathe, L.; Kerekes, T.; Spataru, S.V.; Teodorescu, R. On the perturb-and-observe and incremental conductance MPPT methods for PV systems. IEEE J. Photovoltaics 2013, 3, 1070–1078. [Google Scholar] [CrossRef]
- Elgendy, M.; Zahawi, B.; Atkinson, D. Evaluation of perturb and observe MPPT algorithm implementation techniques. In Proceedings of the 6th IET International Conference on Power Electronics, Machines and Drives (PEMD 2012), Bristol, UK, 27–29 March 2012; IET: New Jersey, NJ, USA, 2012; pp. 1–6. [Google Scholar]
- Ahmed, J.; Salam, Z. An improved perturb and observe (P & O) maximum power point tracking (MPPT) algorithm for higher efficiency. Appl. Energy 2015, 150, 97–108. [Google Scholar]
- Tey, K.S.; Mekhilef, S. Modified incremental conductance MPPT algorithm to mitigate inaccurate responses under fast-changing solar irradiation level. Sol. Energy 2014, 101, 333–342. [Google Scholar] [CrossRef]
- Shang, L.; Guo, H.; Zhu, W. An improved MPPT control strategy based on incremental conductance algorithm. Prot. Control Mod. Power Syst. 2020, 5, 14. [Google Scholar] [CrossRef]
- Villegas-Mier, C.G.; Rodriguez-Resendiz, J.; Álvarez-Alvarado, J.M.; Rodriguez-Resendiz, H.; Herrera-Navarro, A.M.; Rodríguez-Abreo, O. Artificial neural networks in MPPT algorithms for optimization of photovoltaic power systems: A review. Micromachines 2021, 12, 1260. [Google Scholar] [CrossRef]
- Messalti, S. A new neural networks MPPT controller for PV systems. In Proceedings of the IREC2015 the Sixth International Renewable Energy Congress, Sousse, Tunisia, 24–26 March 2015; IEEE: New York, NY, USA, 2015; pp. 1–6. [Google Scholar]
- Hegedus, S.; Luque, A. Handbook of Photovoltaic Science and Engineering; John Wiley & Sons: Hoboken, NJ, USA, 2011. [Google Scholar]
- Alonso Abella, M.; Lorenzo, E.; Chenlo, F. PV water pumping systems based on standard frequency converters. Prog. Photovoltaics Res. Appl. 2003, 11, 179–191. [Google Scholar] [CrossRef]
- Ziegler, J.G.; Nichols, N.B. Optimum settings for automatic controllers. Trans. Am. Soc. Mech. Eng. 1942, 64, 759–765. [Google Scholar] [CrossRef]
- Anto, E.K.; Asumadu, J.A.; Okyere, P.Y. PID control for improving P & O-MPPT performance of a grid-connected solar PV system with Ziegler-Nichols tuning method. In Proceedings of the 2016 IEEE 11th Conference on Industrial Electronics and Applications (ICIEA), Hefei, China, 5–7 June 2016; pp. 1847–1852. [Google Scholar] [CrossRef]
- Cohen, G.; Coon, G. Theoretical consideration of retarded control. Trans. Am. Soc. Mech. Eng. 1953, 75, 827–834. [Google Scholar] [CrossRef]
- Chien, K.L.; Hrones, J.; Reswick, J. On the automatic control of generalized passive systems. Trans. Am. Soc. Mech. Eng. 1952, 74, 175–183. [Google Scholar] [CrossRef]
- Rivera, D.E.; Morari, M.; Skogestad, S. Internal model control: PID controller design. Ind. Eng. Chem. Process Des. Dev. 1986, 25, 252–265. [Google Scholar] [CrossRef]
- Åström, K.J.; Panagopoulos, H.; Hägglund, T. Design of PI controllers based on non-convex optimization. Automatica 1998, 34, 585–601. [Google Scholar] [CrossRef]
- Åström, K.J.; Hägglund, T. Revisiting the Ziegler–Nichols step response method for PID control. J. Process Control 2004, 14, 635–650. [Google Scholar] [CrossRef]
- Åström, K.; Hägglund, T. Advanced PID Control; ISA—The Instrumentation, Systems, and Automation Society Research: Triangle Park, NC, USA, 2006. [Google Scholar]
- Hägglund, T.; Åström, K.J. Revisiting the Ziegler-Nichols tuning rules for PI control. Asian J. Control 2002, 4, 364–380. [Google Scholar] [CrossRef]
- Hägglund, T.; J. åström, K. Revisiting the Ziegler-Nichols tuning rules for PI control—Part II the frequency response method. Asian J. Control 2004, 6, 469–482. [Google Scholar] [CrossRef]
- Somefun, O.A.; Akingbade, K.; Dahunsi, F. The dilemma of PID tuning. Annu. Rev. Control 2021, 52, 65–74. [Google Scholar] [CrossRef]
- Brito, A.; Zilles, R. Systematized procedure for parameter characterization of a variable-speed drive used in photovoltaic pumping applications. Prog. Photovoltaics Res. Appl. 2006, 14, 249–260. [Google Scholar] [CrossRef]
- Fernández-Ramos, J.; Narvarte-Fernández, L.; Poza-Saura, F. Improvement of photovoltaic pumping systems based on standard frequency converters by means of programmable logic controllers. Sol. Energy 2010, 84, 101–109. [Google Scholar] [CrossRef]
- Herraiz, J.I.; Fernández-Ramos, J.; Almeida, R.H.; Báguena, E.M.; Castillo-Cagigal, M.; Narvarte, L. On The Tuning And Performance Of Stand-Alone Large-Power Pv Irrigation Systems. Energy Convers. Manag. X 2022, 13, 100175. [Google Scholar] [CrossRef]
- Leva, A.; Schiavo, F. On the role of the process model in model-based autotuning. IFAC Proc. Vol. 2005, 38, 361–366. [Google Scholar] [CrossRef]
- Jeng, J.C.; Tseng, W.L.; Chiu, M.S. A one-step tuning method for PID controllers with robustness specification using plant step-response data. Chem. Eng. Res. Des. 2014, 92, 545–558. [Google Scholar] [CrossRef]
- Hang, C.; Astrom, K.; Wang, Q. Relay feedback auto-tuning of process controllers—A tutorial review. J. Process Control 2002, 12, 143–162. [Google Scholar] [CrossRef]
- McCormack, A.S.; Godfrey, K.R. Rule-based autotuning based on frequency domain identification. IEEE Trans. Control Syst. Technol. 1998, 6, 43–61. [Google Scholar] [CrossRef]
- Bányász, C.; Keviczky, L. Design of adaptive PID regulators based on recursive estimation of the process parameters. J. Process Control 1993, 3, 53–59. [Google Scholar] [CrossRef]
- Kicsiny, R. Transfer functions of solar heating systems with pipes for dynamic analysis and control design. Sol. Energy 2017, 150, 596–607. [Google Scholar] [CrossRef][Green Version]
- Yumurtaci, M.; Yabanova, İ.; Oguz, Y. Dynamic model extraction for speed control of induction motor driven by a voltage source inverter with using system identification application. Int. J. Electr. Energy 2015, 3, 19–27. [Google Scholar] [CrossRef]
- da Silva, M.A.; Gomide, F.; Amaral, W. A rule based procedure for self-tuning PID controllers. In Proceedings of the 27th IEEE Conference on Decision and Control, Austin, TX, USA, 7–9 December 1988; IEEE: New York, NY, USA, 1988; pp. 1947–1951. [Google Scholar]
- Mitra, P.; Dey, C.; Mudi, R.K. Fuzzy rule-based set point weighting for fuzzy PID controller. SN Appl. Sci. 2021, 3, 651. [Google Scholar] [CrossRef]
- Guillén-Arenas, F.J.; Fernández-Ramos, J.; Narvarte, L. A New Strategy for PI Tuning in Photovoltaic Irrigation Systems Based on Simulation of System Voltage Fluctuations Due to Passing Clouds. Energies 2022, 15, 7191. [Google Scholar] [CrossRef]
- Gilman, F.C. Testing Pumps as Fans and Fans as Pumps. J. Eng. Power 1968, 90, 140–142. [Google Scholar] [CrossRef]
- King, J.A. Testing Pumps in Air. J. Eng. Power 1968, 90, 97–104. [Google Scholar] [CrossRef]
- Bario, F.; Barral, L.; Bois, G. Air Test Flow Analysis of the Hydrogen Pump of Vulcain Rocket Engine. J. Fluids Eng. 1991, 113, 654–659. [Google Scholar] [CrossRef]
- Choi, J.S.; McLaughlin, D.K.; Thompson, D.E. Experiments on the unsteady flow field and noise generation in a centrifugal pump impeller. J. Sound Vib. 2003, 263, 493–514. [Google Scholar] [CrossRef]
Disclaimer/Publisher’s Note: The statements, opinions and data contained in all publications are solely those of the individual author(s) and contributor(s) and not of MDPI and/or the editor(s). MDPI and/or the editor(s) disclaim responsibility for any injury to people or property resulting from any ideas, methods, instructions or products referred to in the content. |
© 2023 by the authors. Licensee MDPI, Basel, Switzerland. This article is an open access article distributed under the terms and conditions of the Creative Commons Attribution (CC BY) license (https://creativecommons.org/licenses/by/4.0/).

