
Technical Control and Optimal Dispatch Strategy for a Hybrid Energy System


Abstract
:1. Introduction
- The development of a novel control dispatch model that controls the PV, BES, and FC arbitrarily during the optimization process and economically serves the load demand at the minimum NPC.
- A hybrid analysis of the PV-FC-BES system, considering sizing optimization and energy management planning with the aim of increasing the FC capacity factor during FC operation.
- Analysis of the benefits of the PD strategy versus LF and CC control dispatch, based on a case study of an off-grid zero-energy office building with 100% renewables.
2. Renewable Energy Resources and Load Demand
2.1. Study Building
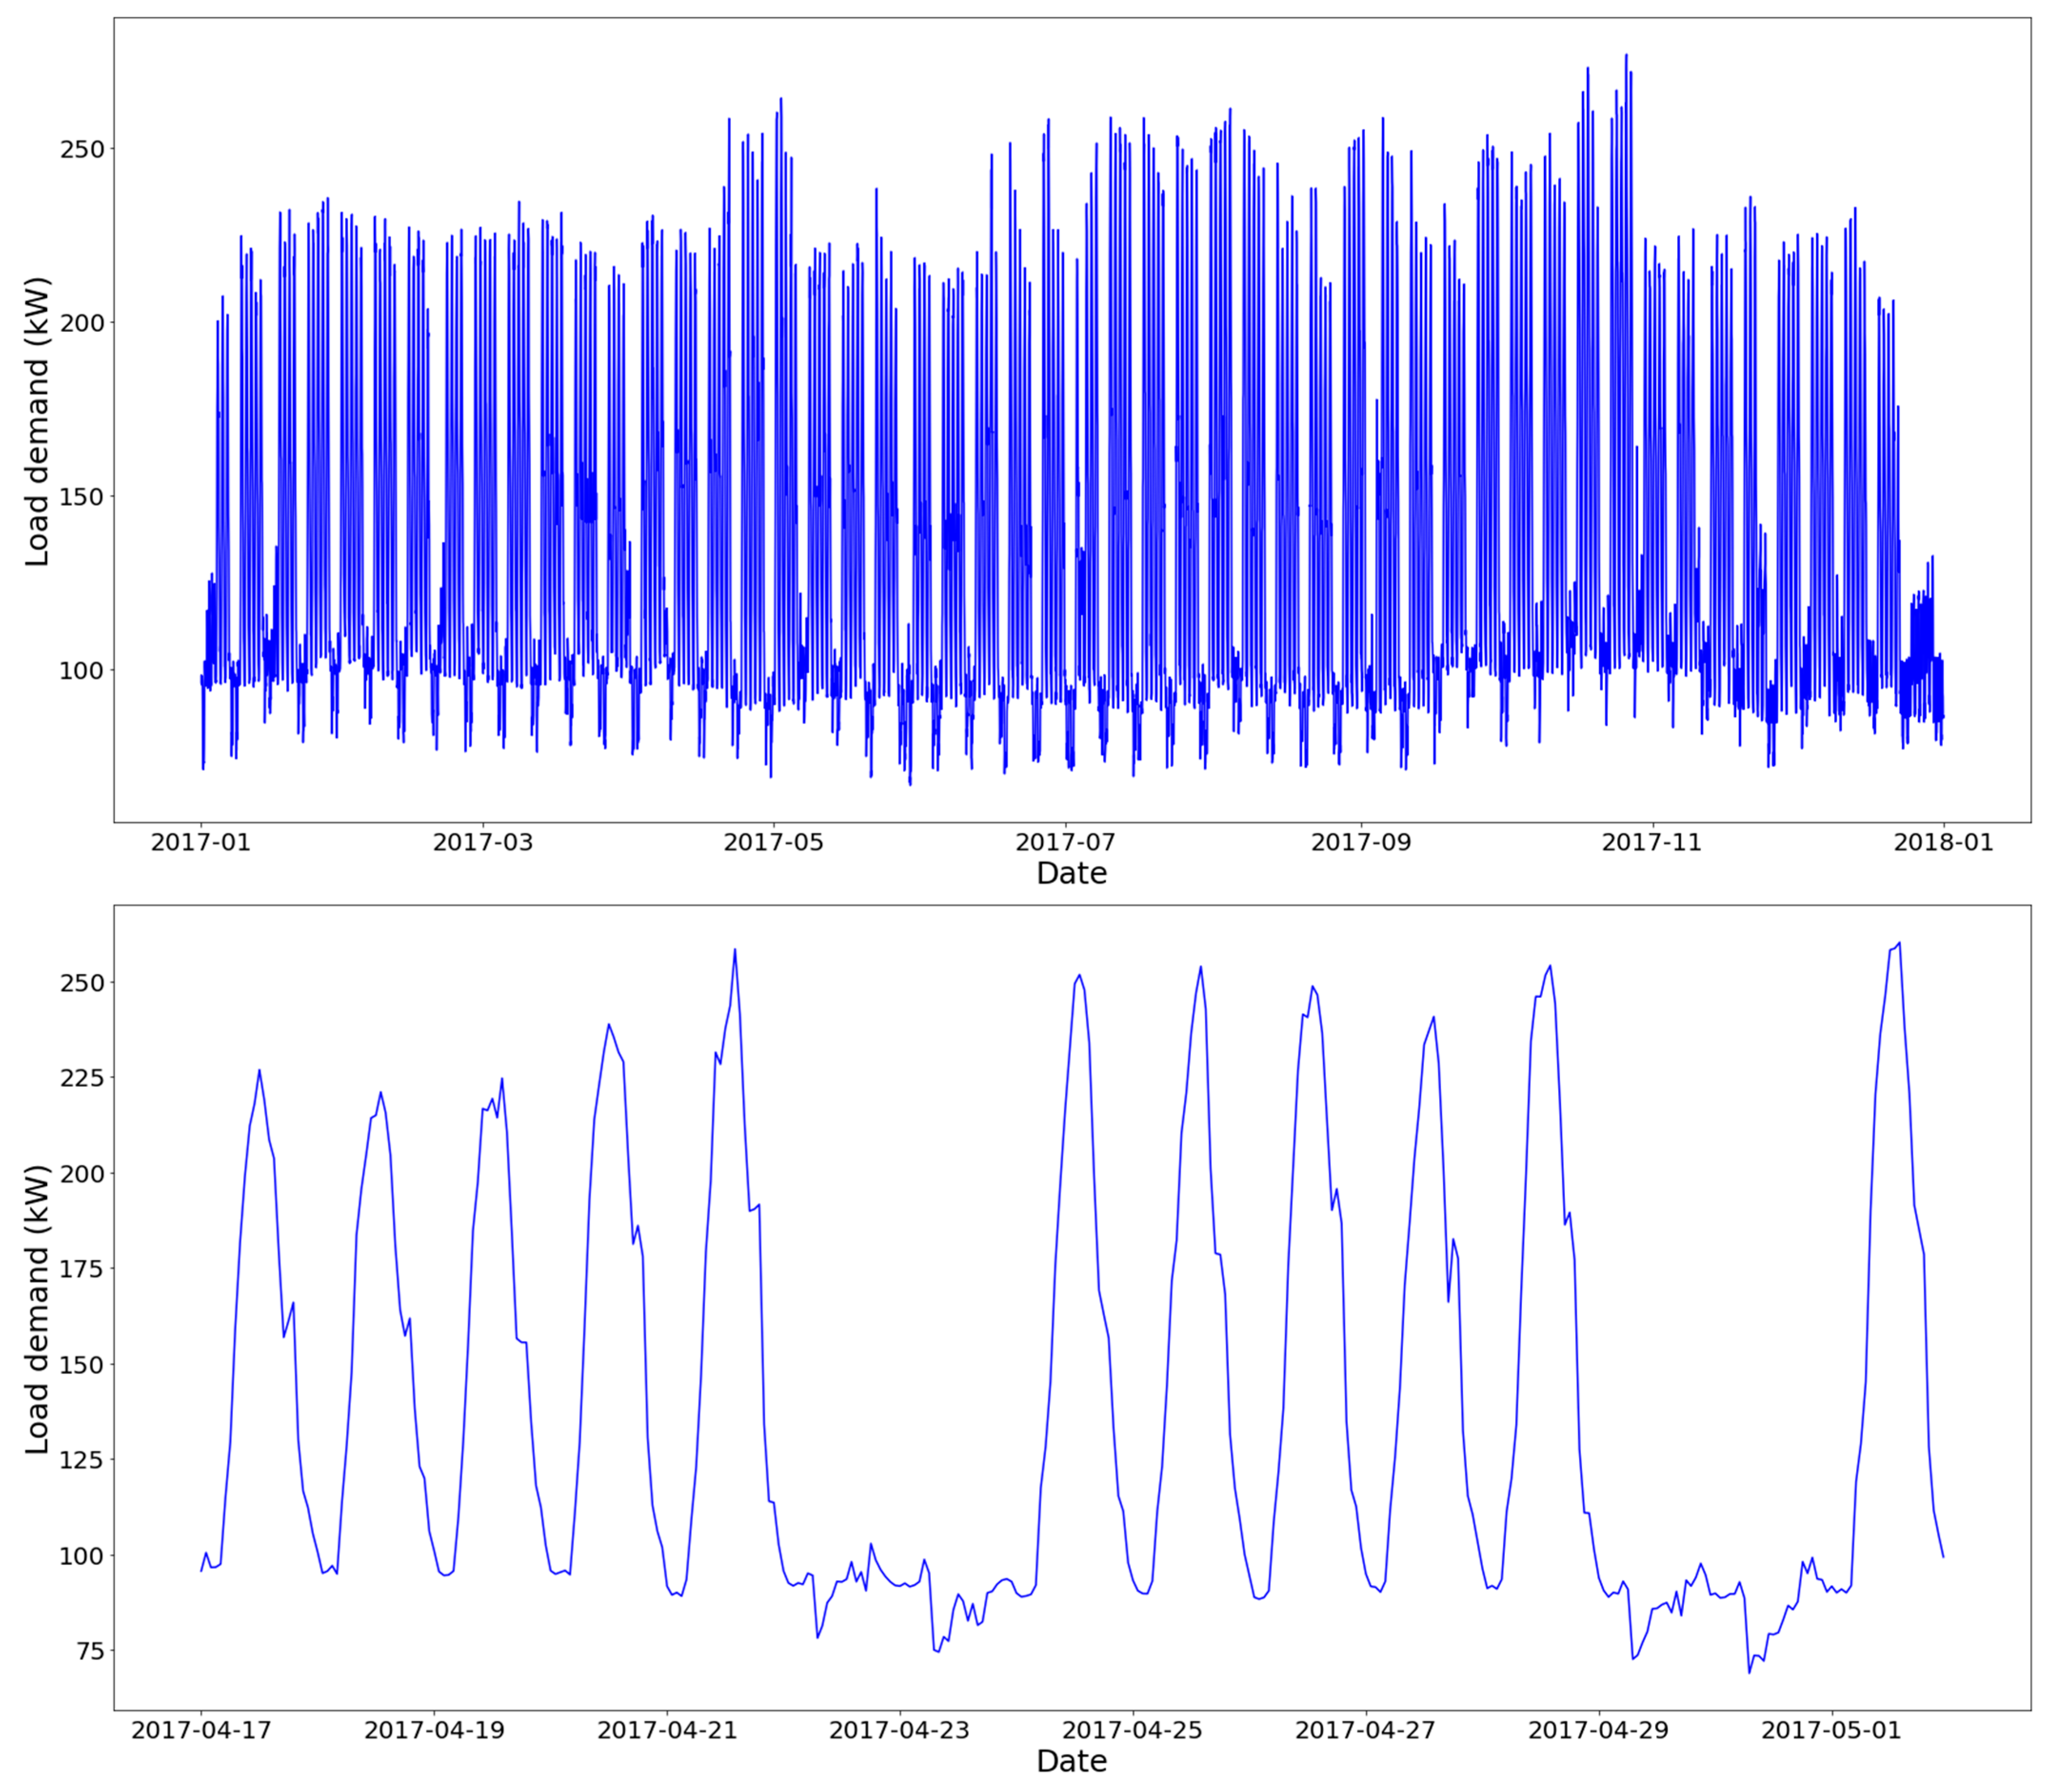
2.2. Load
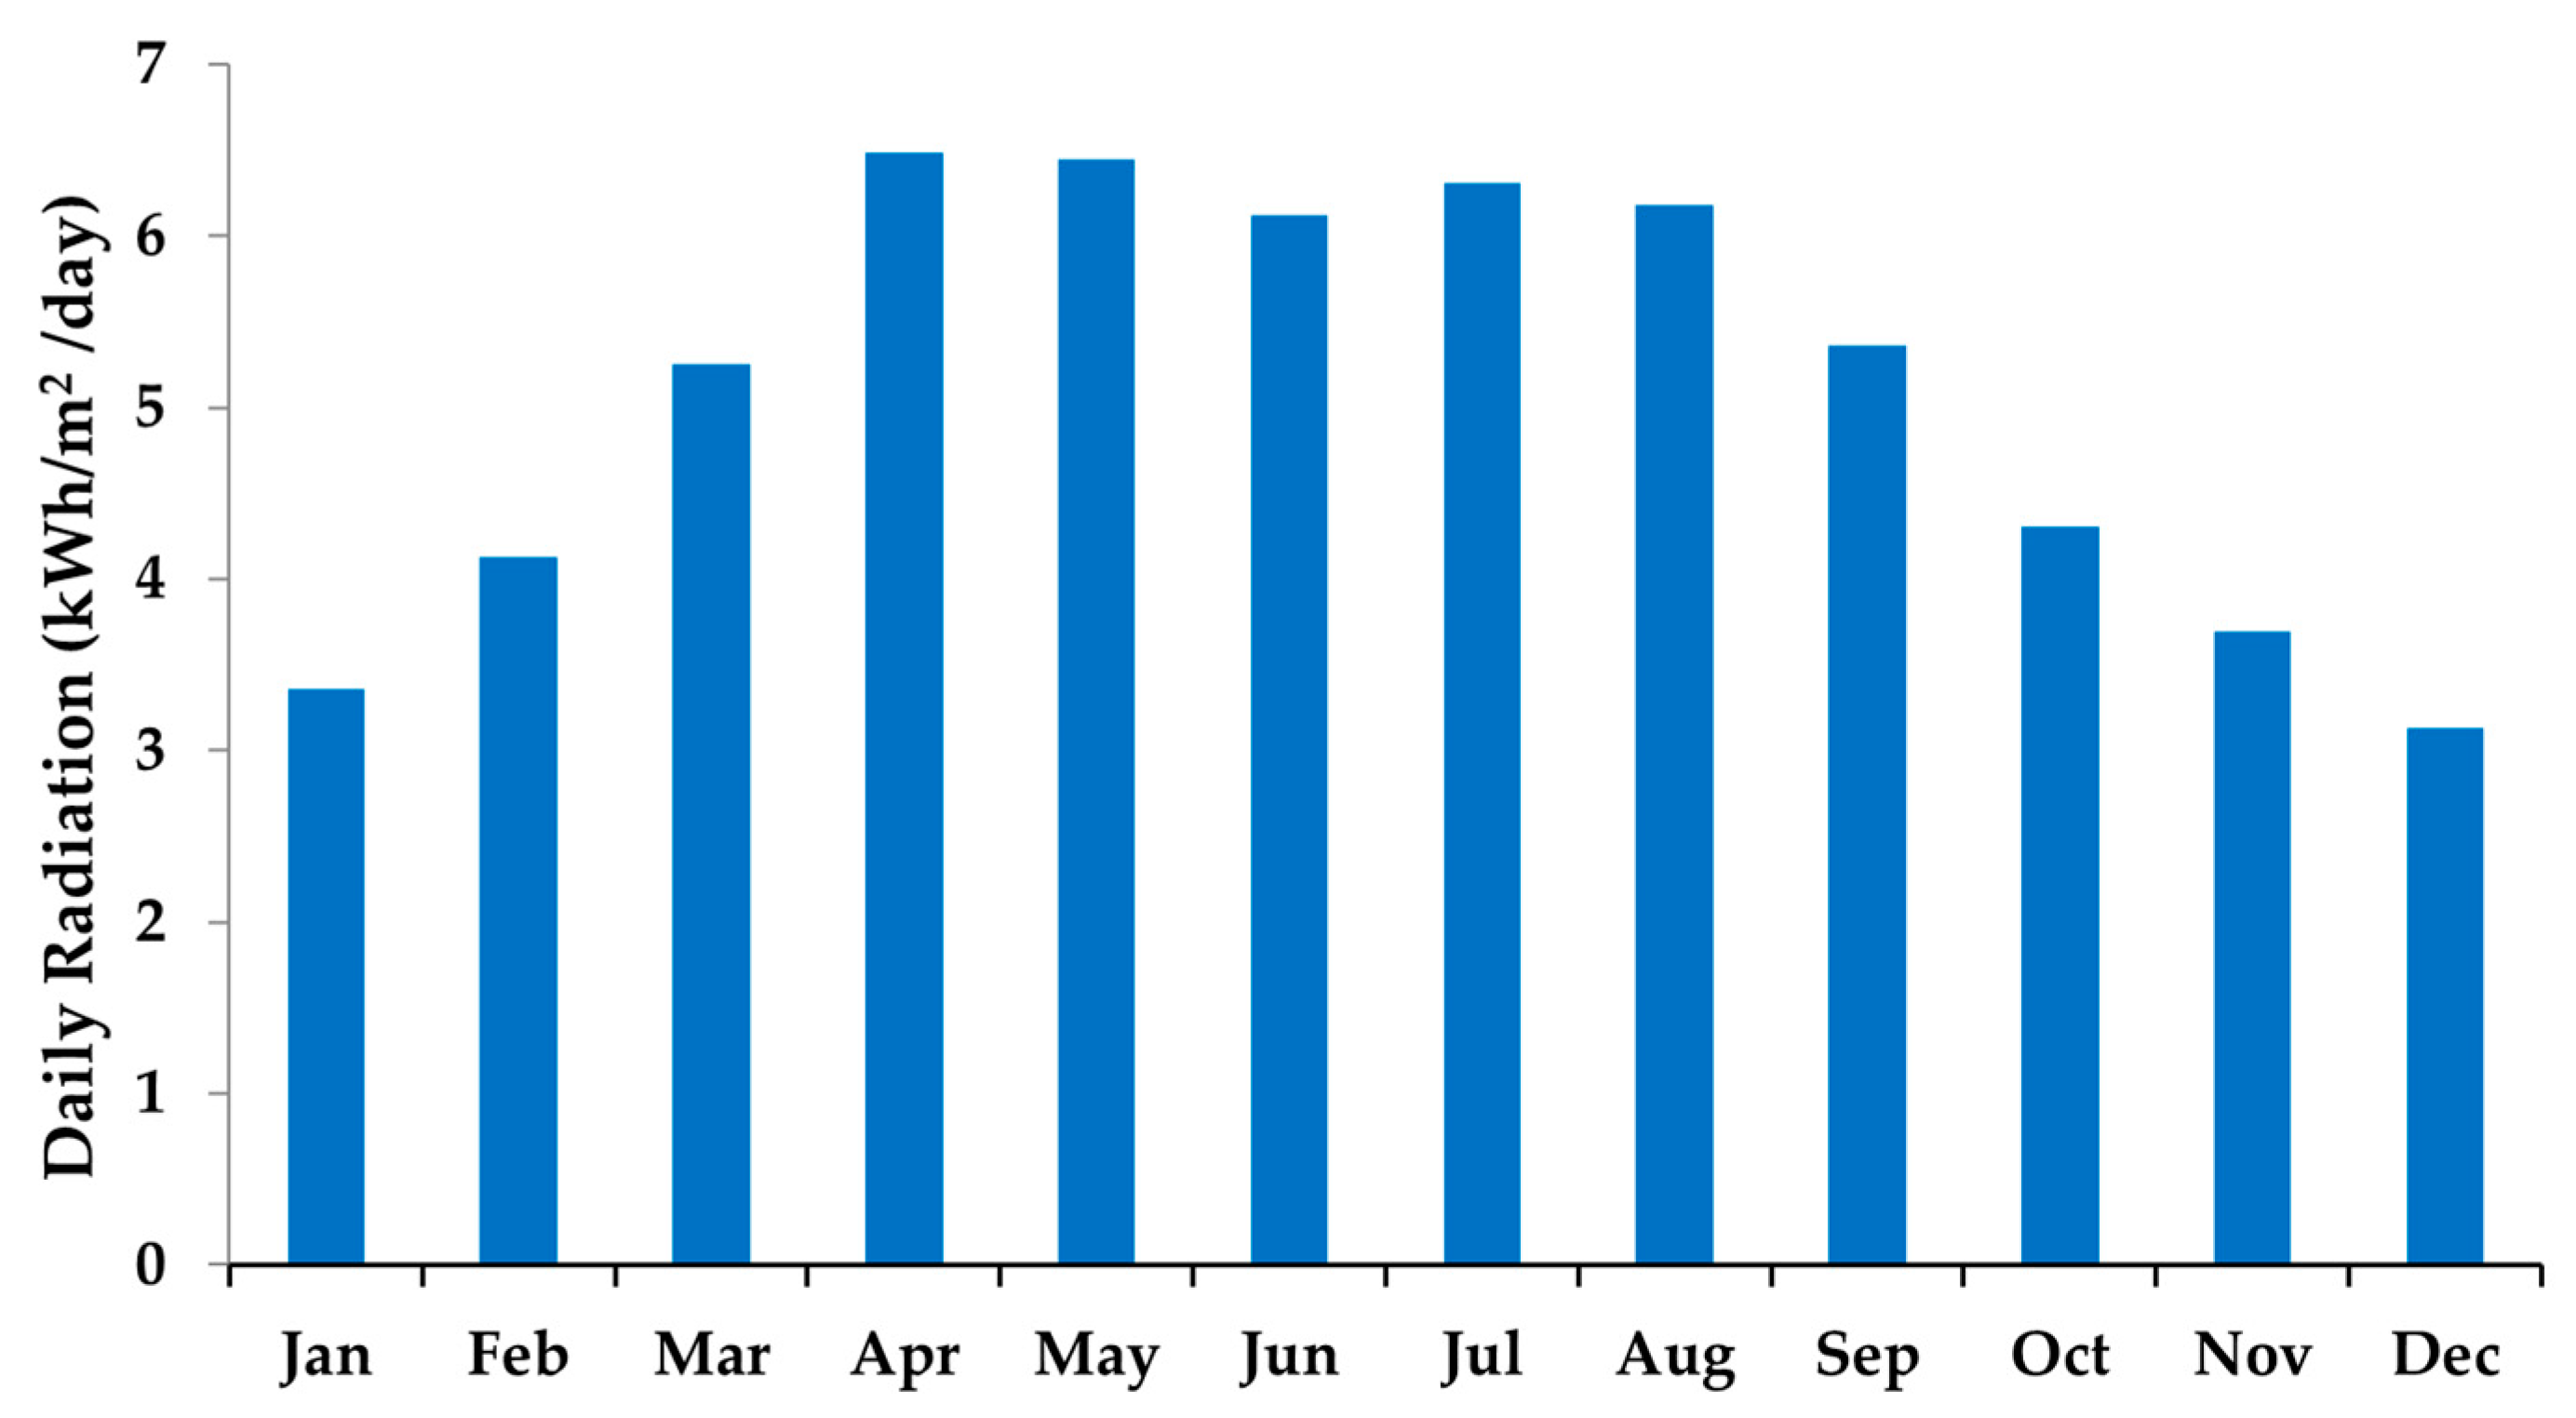
2.3. Renewable Energy Resources
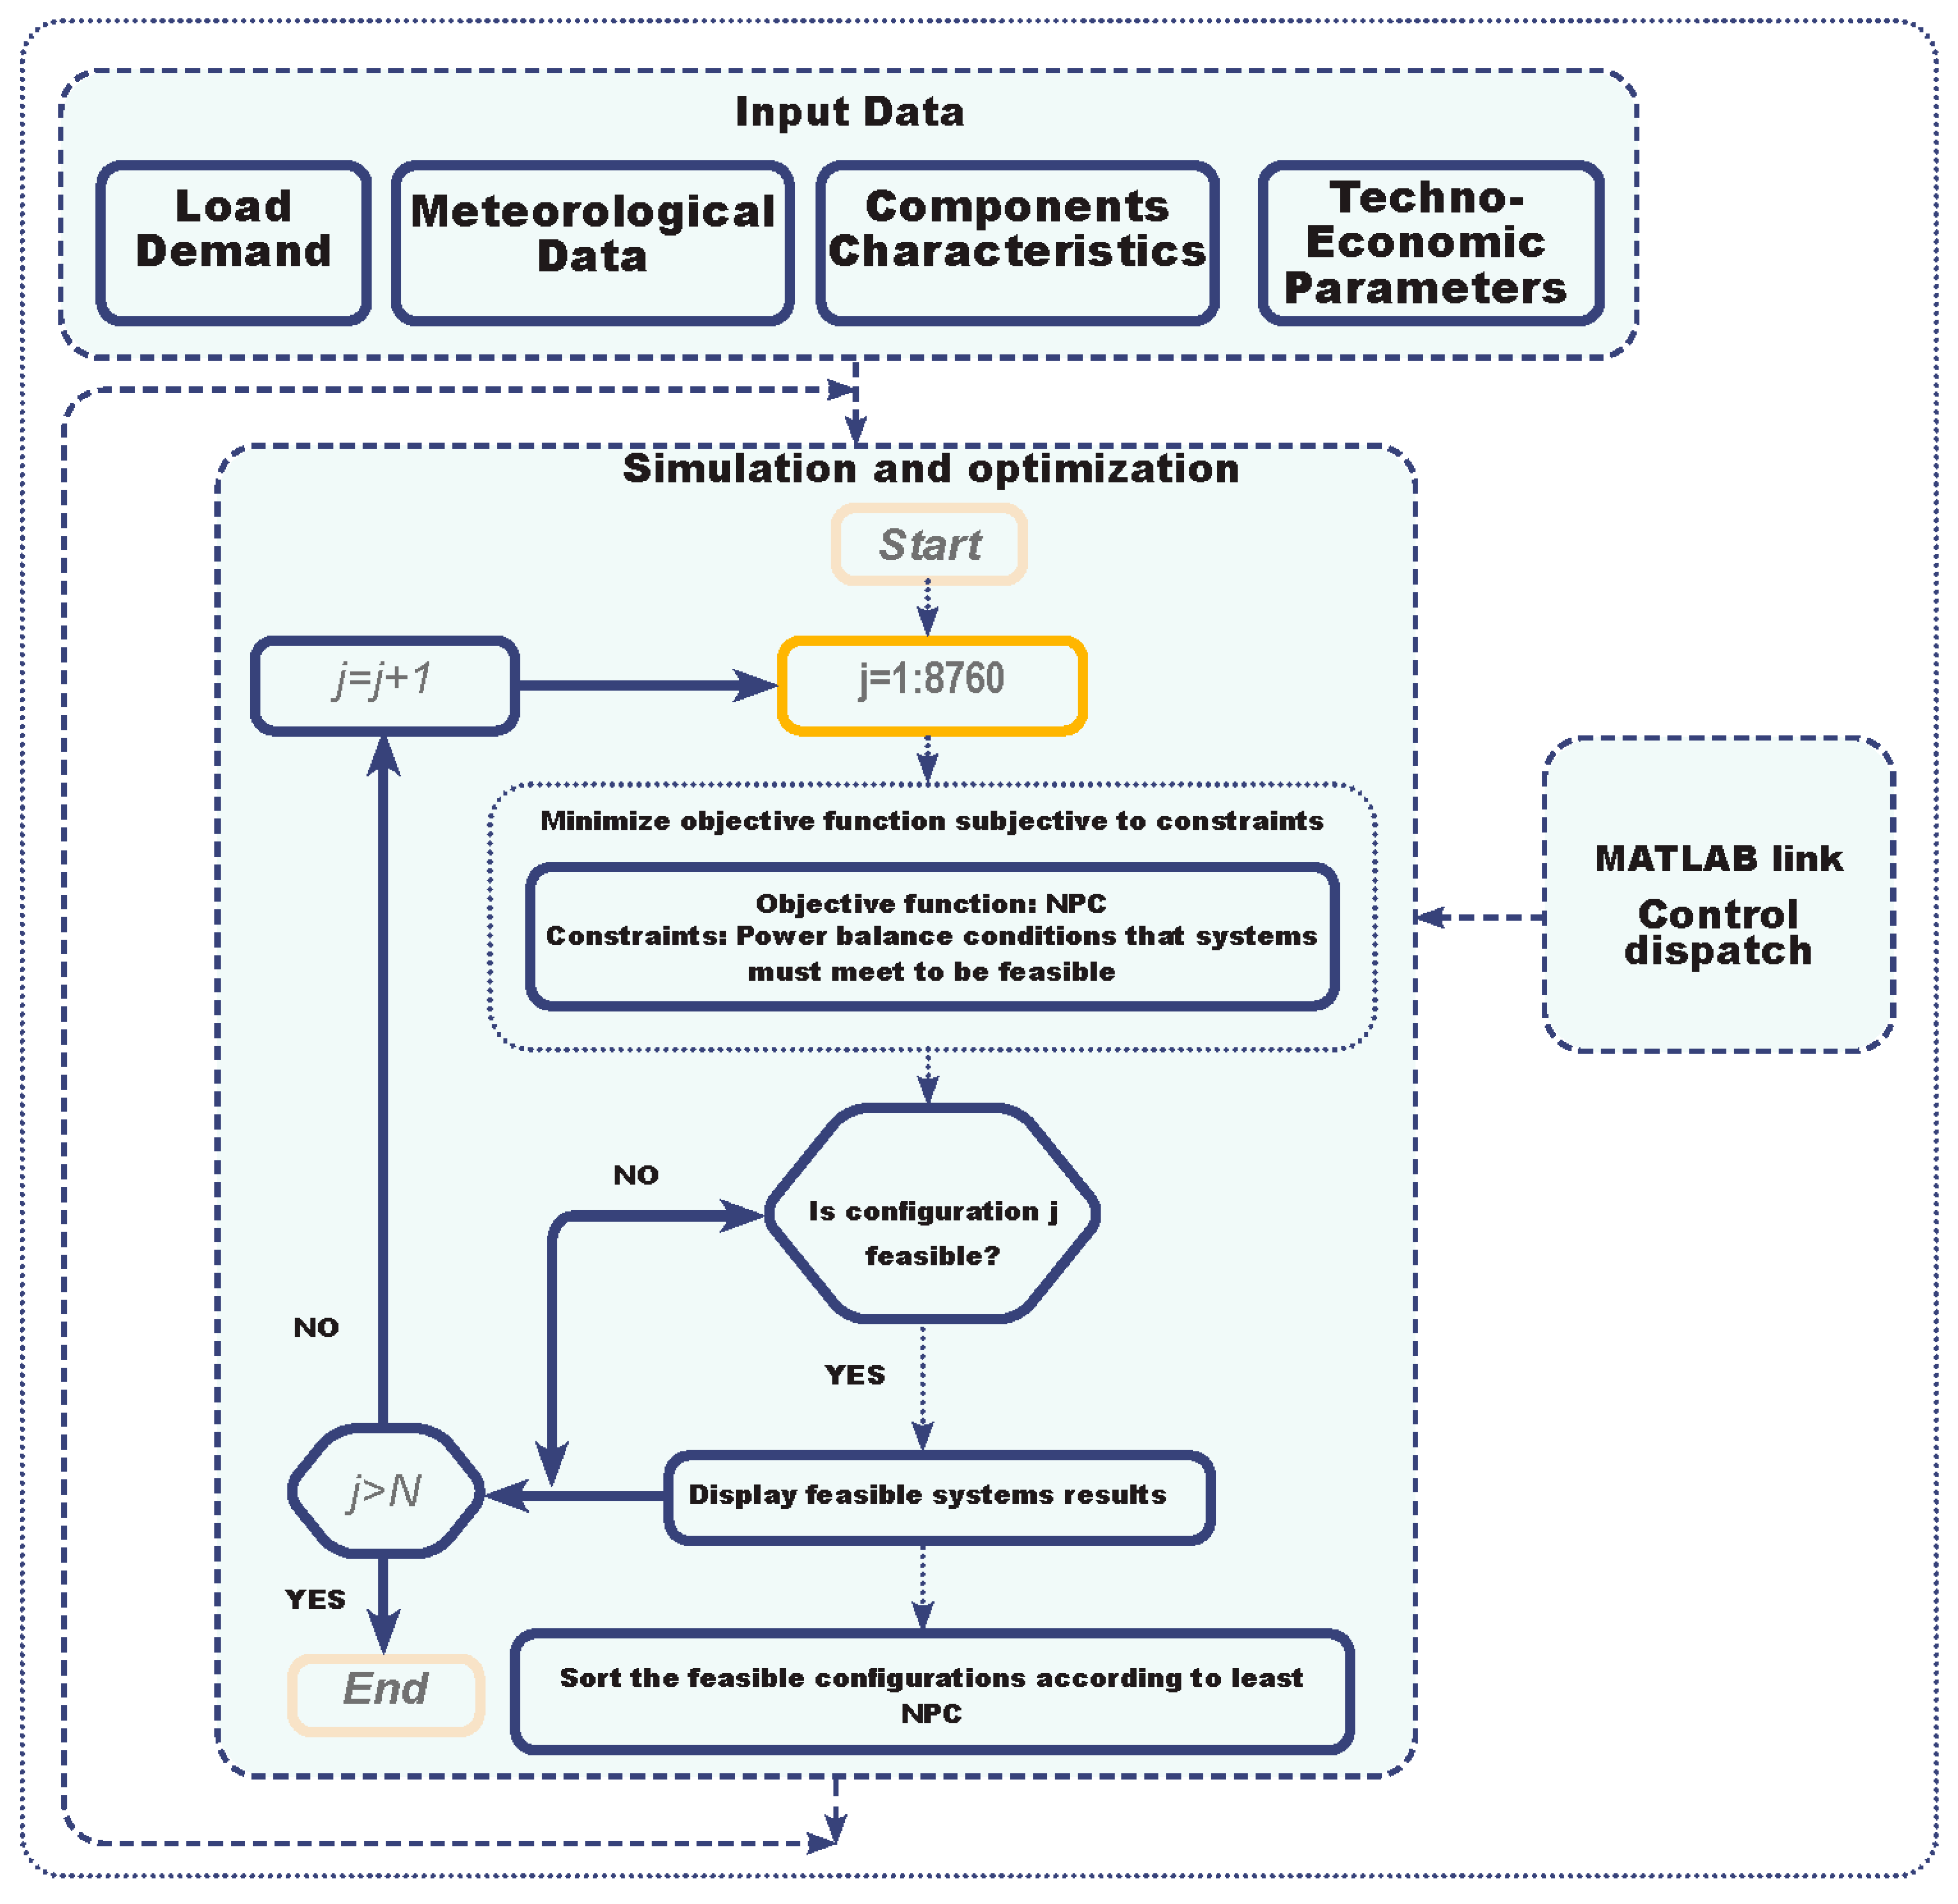
3. Methodology
3.1. Overview
3.2. System Design and Economic Components
3.3. Models of Major Components
3.3.1. PV Modules
3.3.2. Battery Energy Storage System (BES)
3.3.3. Fuel Cell Systems (FC)
3.4. Economic Indicators
3.5. Formulation of the Optimization
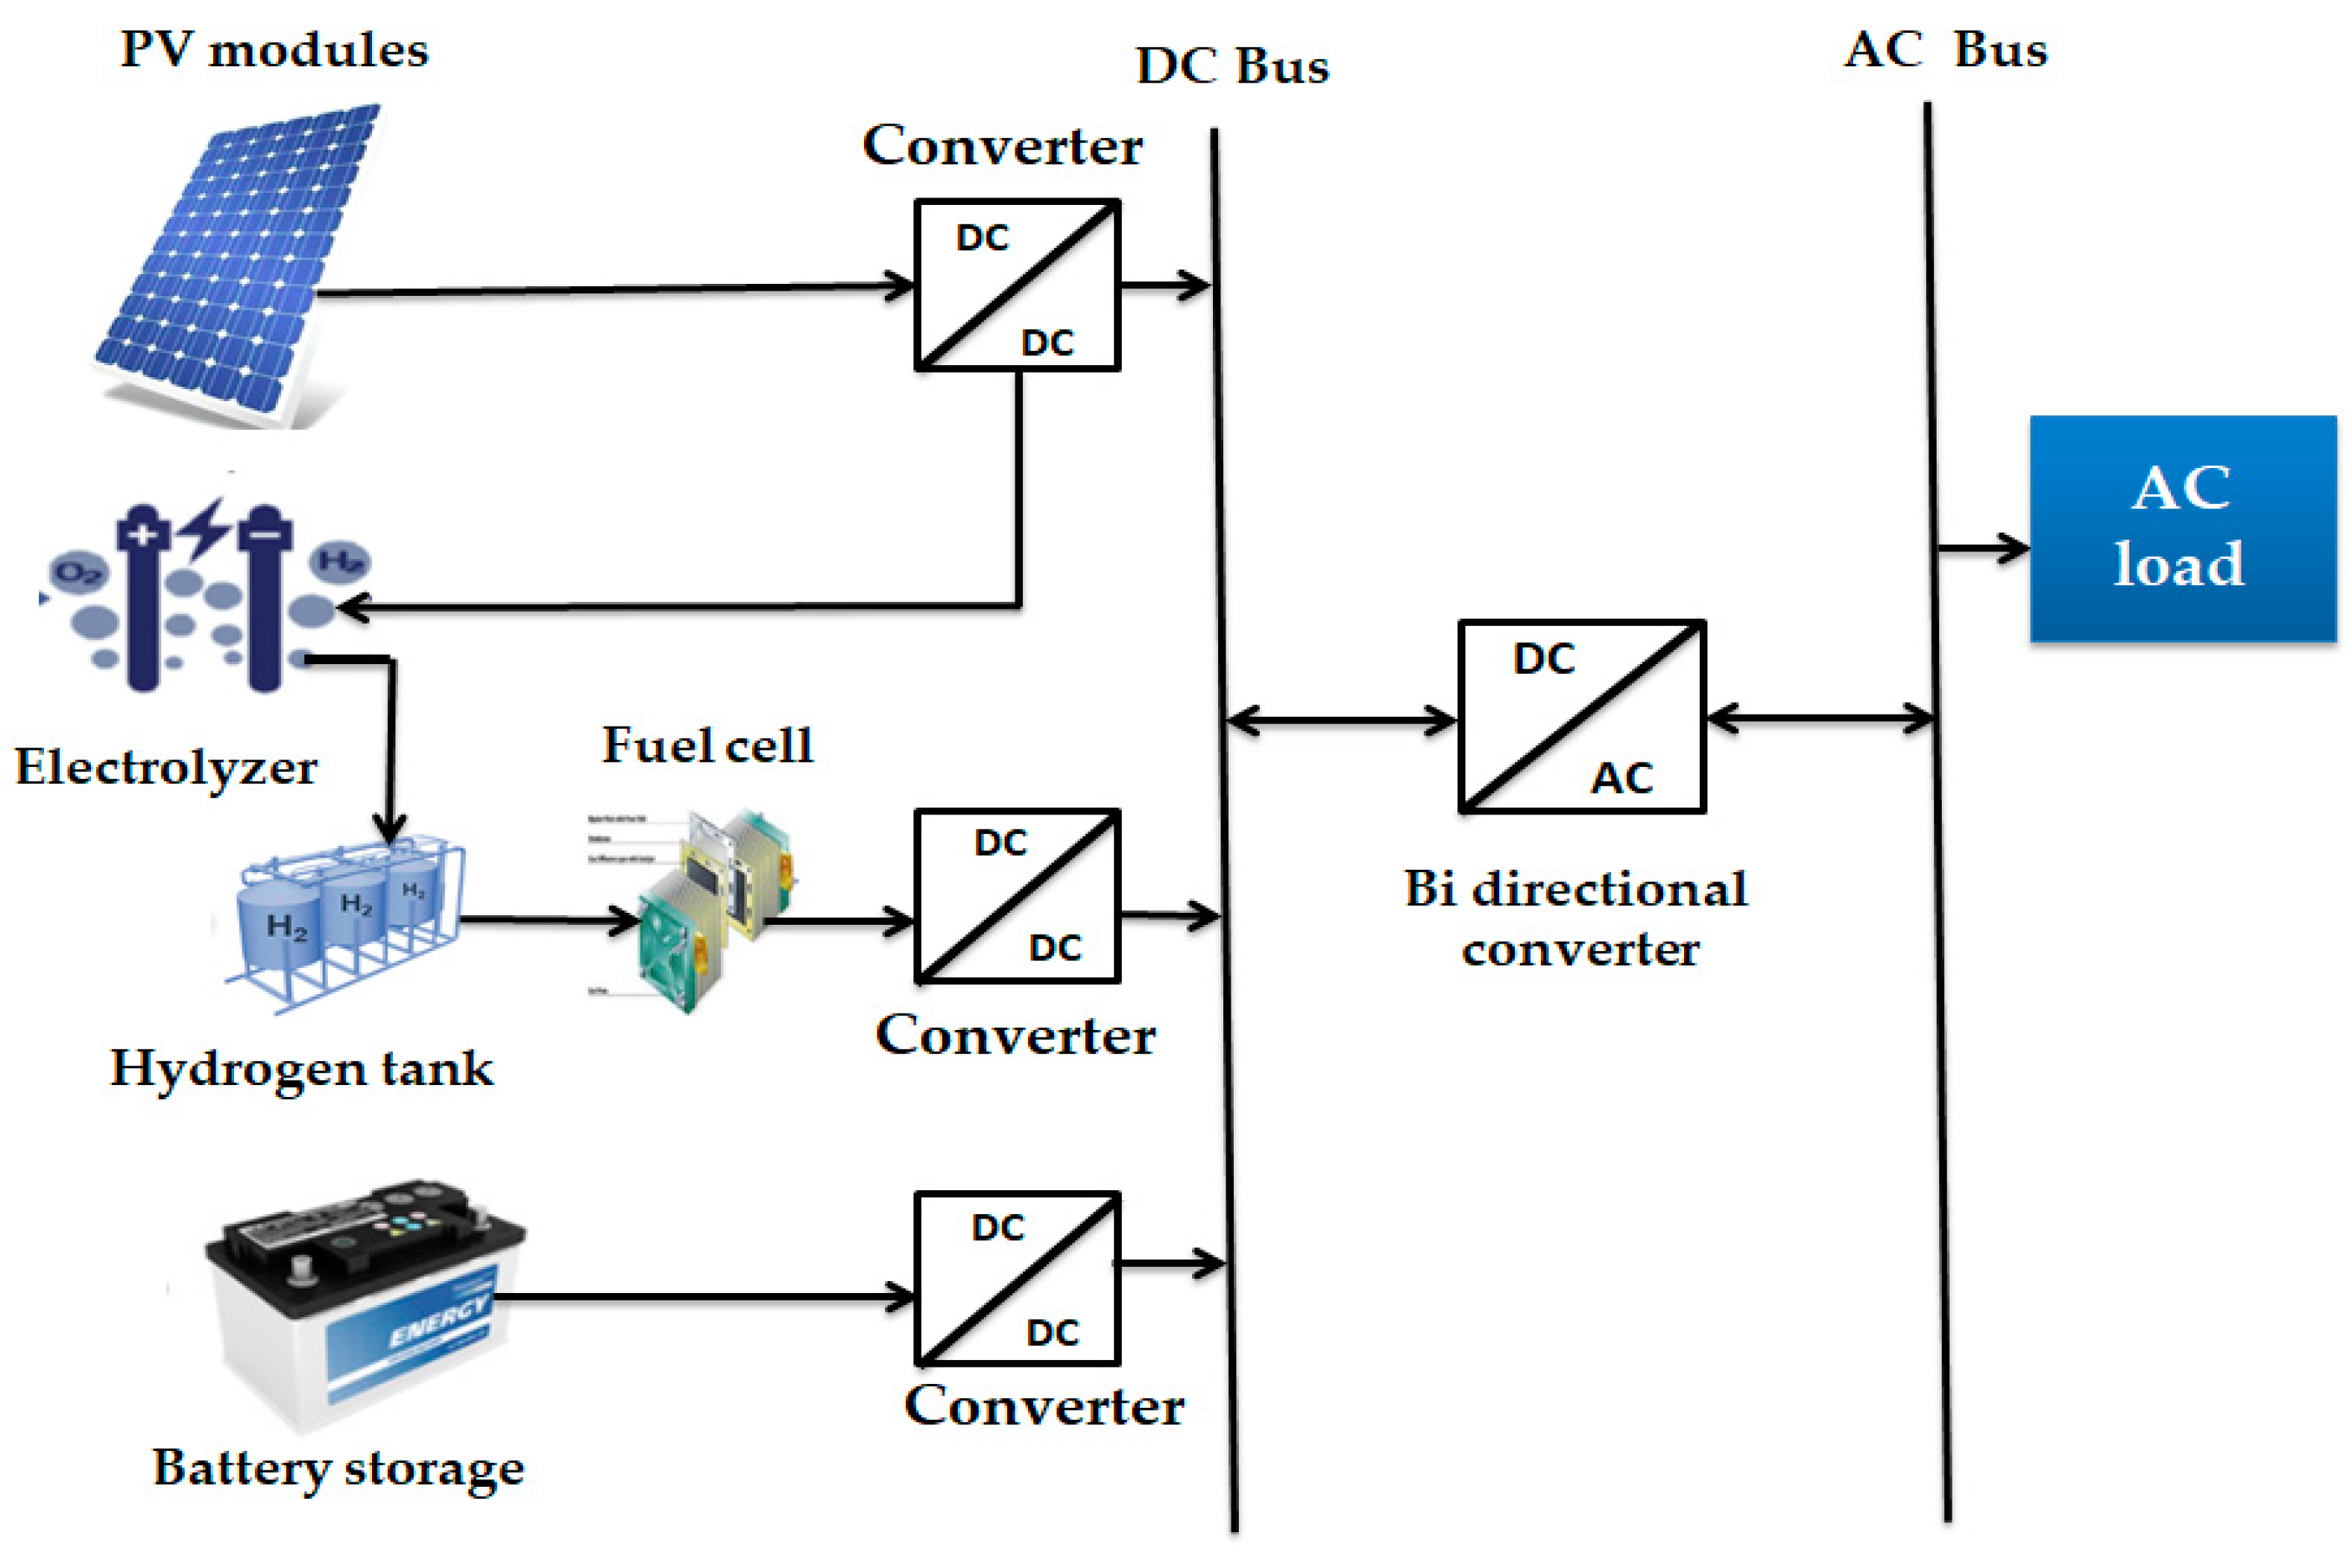
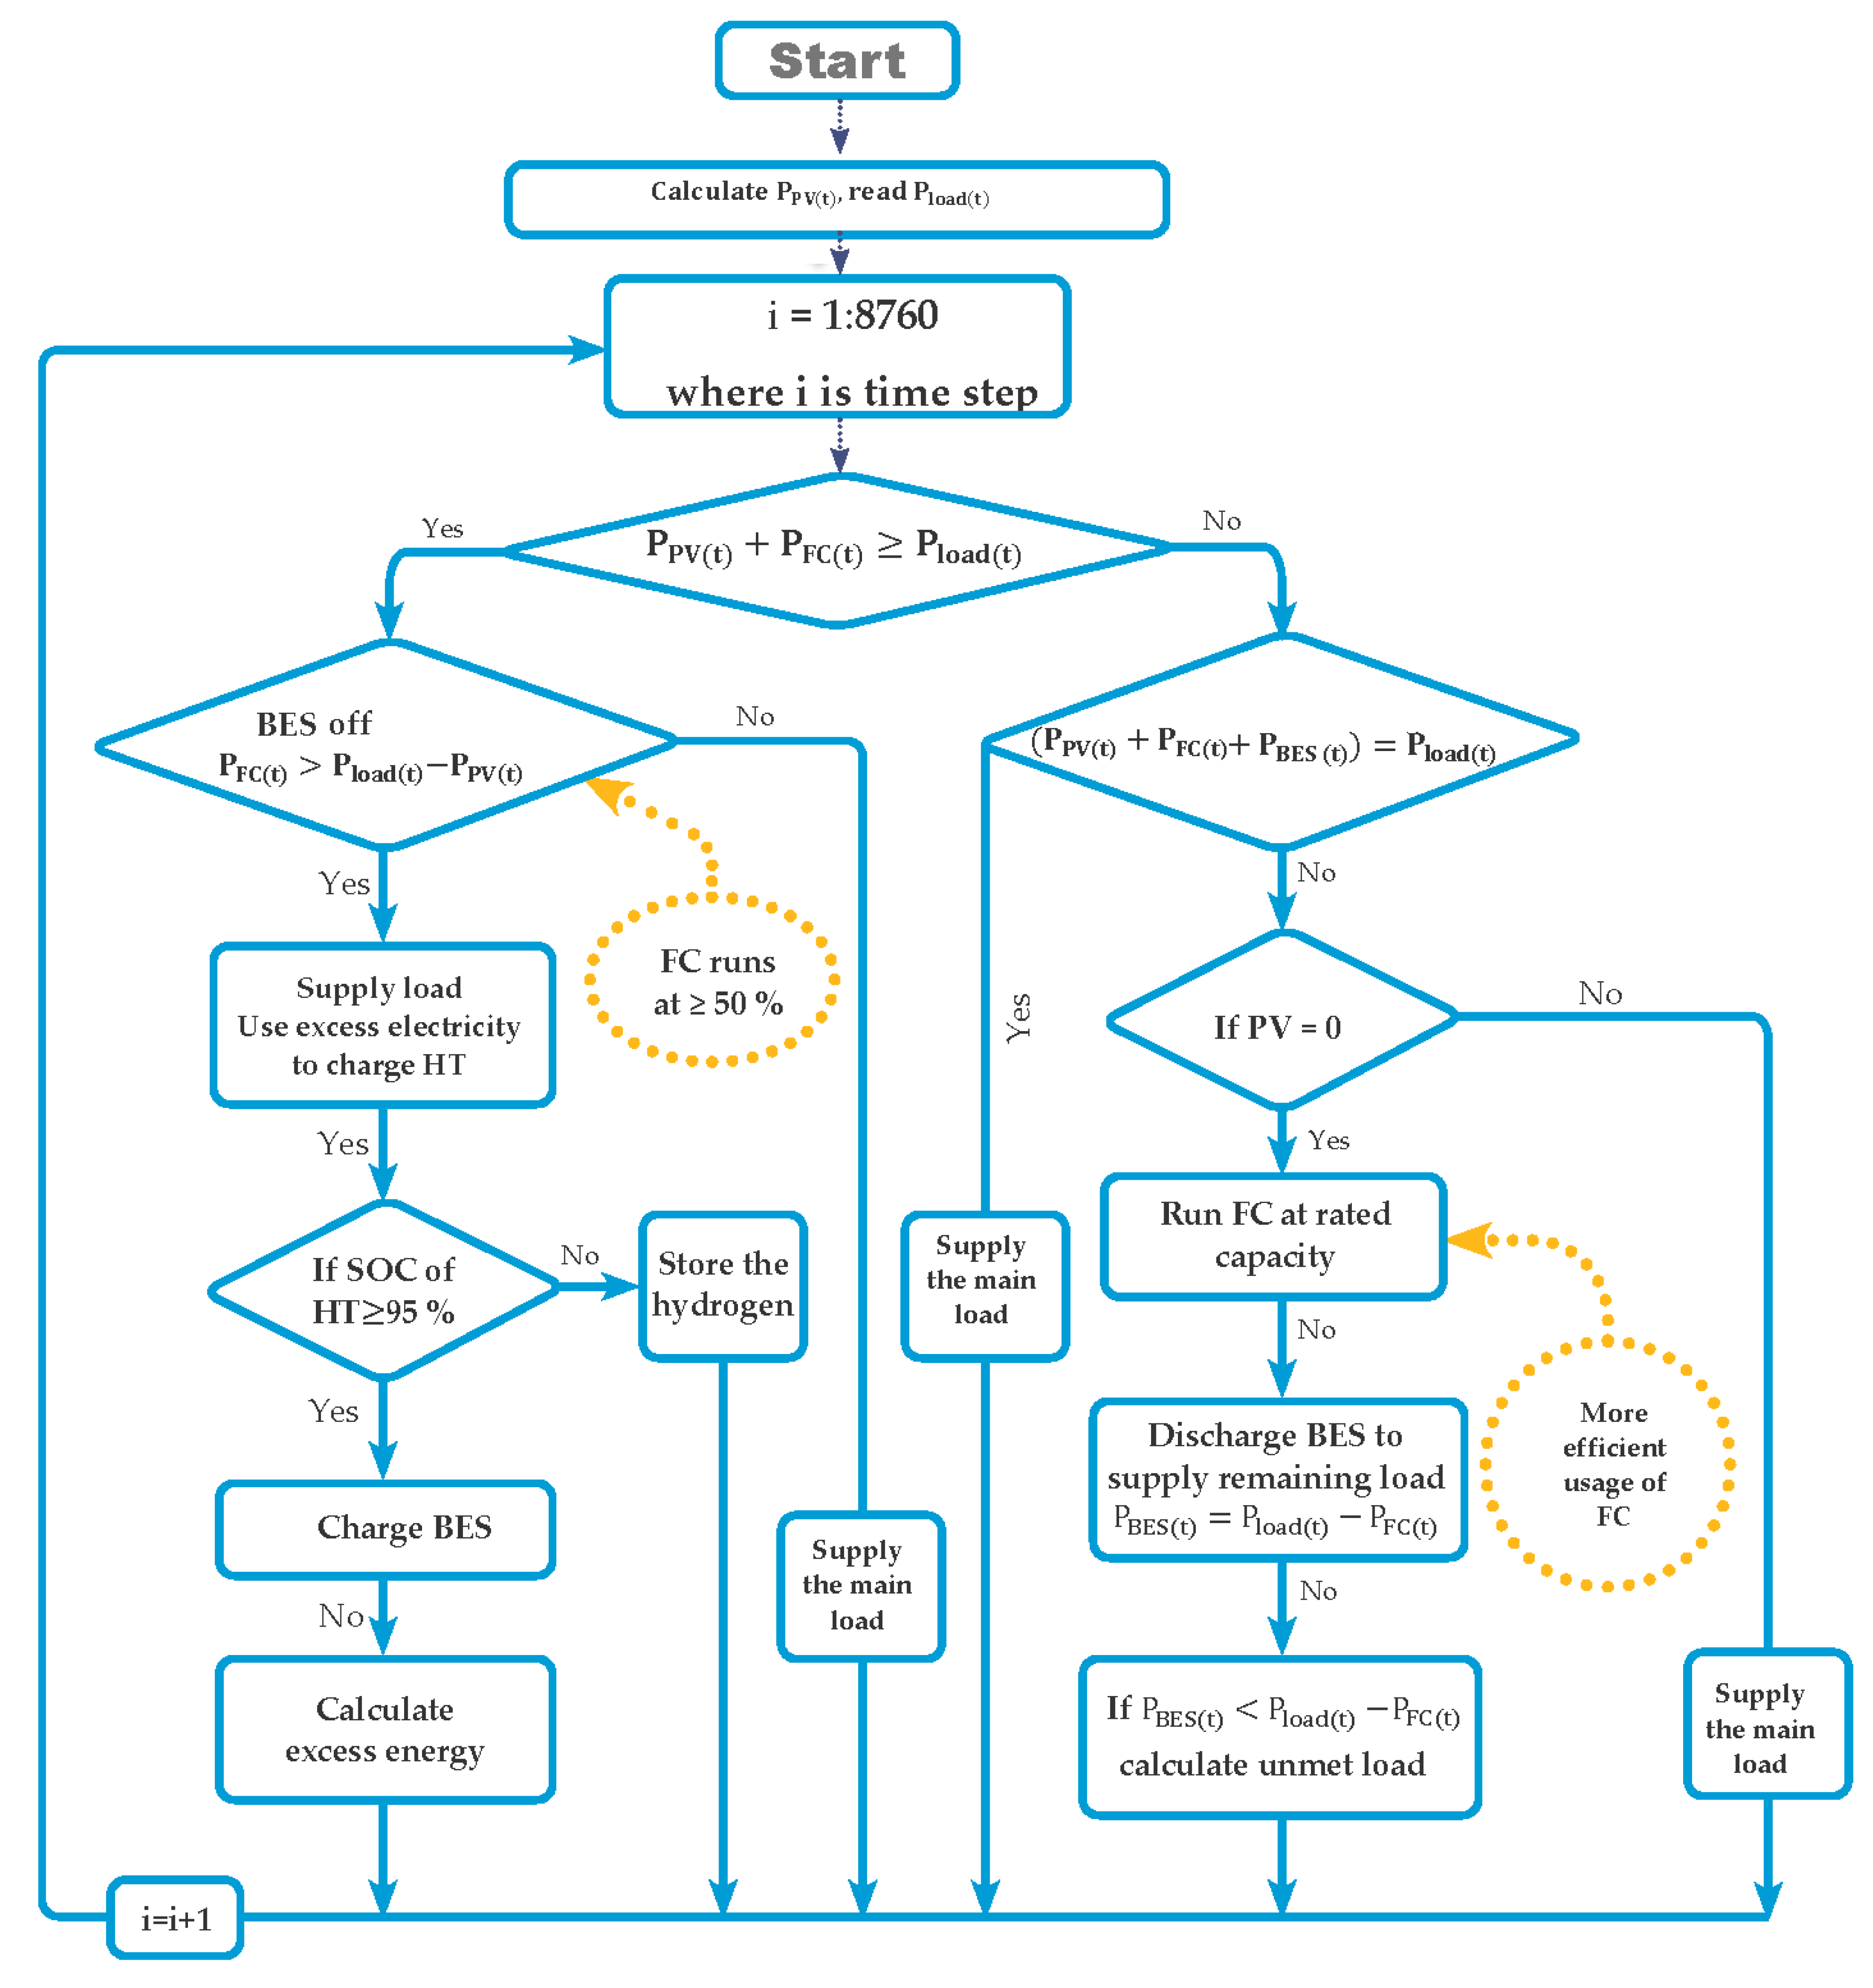
- The PV + FC can satisfy the load demand, and the remaining power to satisfy the load demand is provided by the FC. The minimum load ratio of the FC was set to 50% of its capacity to prevent the FC from operating under a low load with low efficiency. The authors [46] found that when the partial-load demand was larger than 51.1%, the electrical efficiency increased, whereas a low-partial load decreased the electrical efficiency. Therefore, if the required electricity from the FC is less than 50% of its capacity, then the FC operates at 50%. The difference between power generation and power demand is then . If then the remaining power is fed to the EL (PEL(t) = ∆P(t)) to produce hydrogen for storage. If the power fed to the EL is greater than the power rating of the electrolyzer (PrEL), the remaining power is used to charge the BES.
- The PV + FC cannot satisfy the load demand, that is, , so the FC runs at full-rated capacity (100%) and the BES supplements the remaining power to meet the energy demand; i.e., .
- If , the FC power output can satisfy all load demands, and the BES is not used.
- If the FC cannot satisfy the load demand, then the BES will assist in satisfying the load demand, that is,
4. Results and Discussion
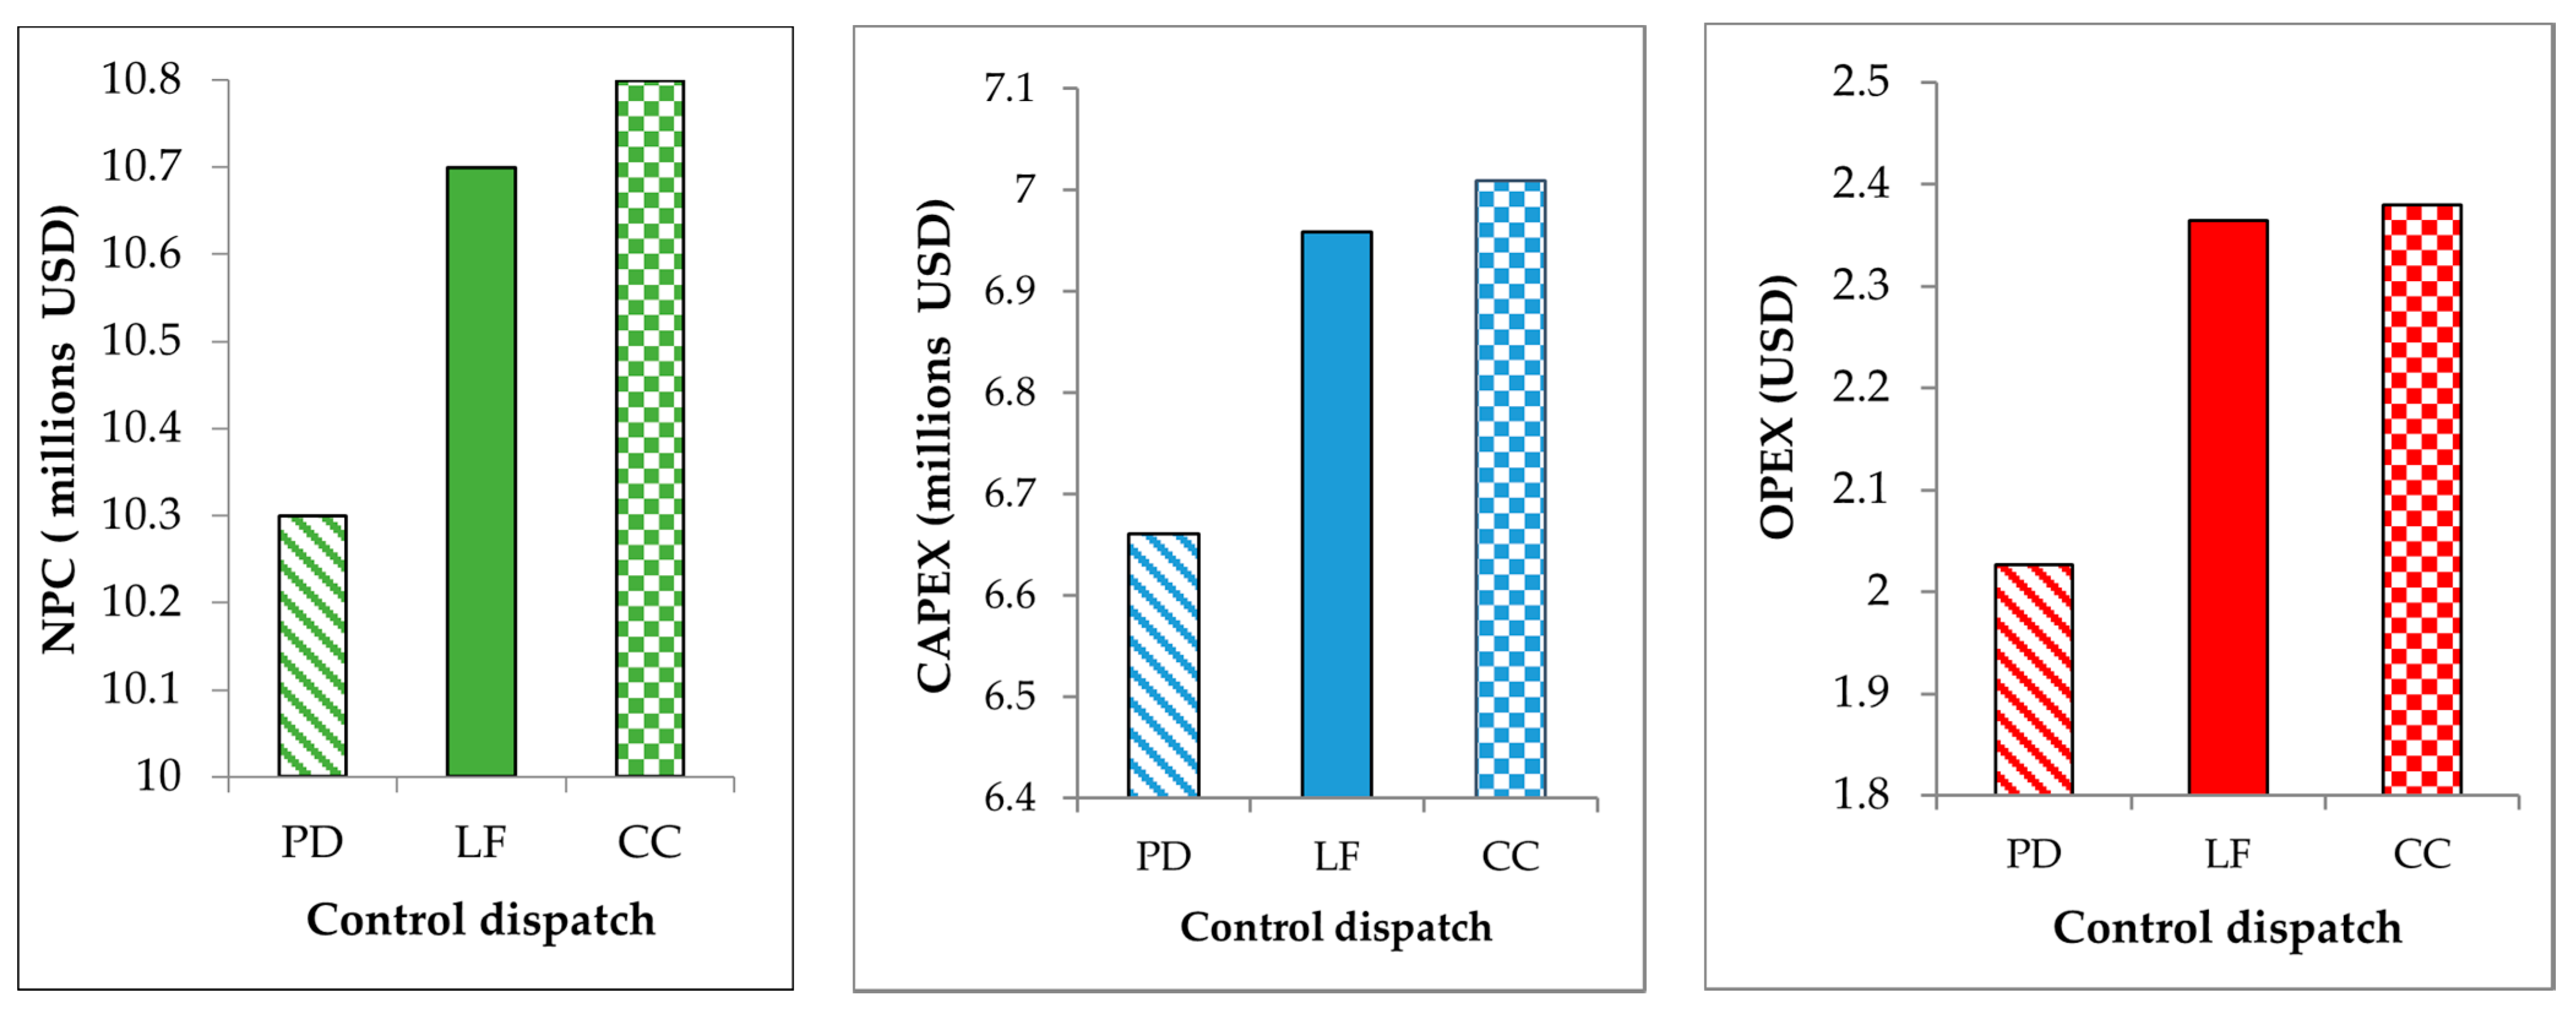
4.1. Economic Analysis
4.2. Performance Analysis
4.3. Comparison to Systems in the Literature
5. Conclusions
- The PD strategy met the load demand with more reliable optimization results than the CC and LF control dispatches. Furthermore, the PD was found to be the most feasible and cost-effective compared to LF and CC dispatches, as the prioritization of the energy supply between the PV, BES, and FC was managed more effectively than in the LF and CC cases.
- The PD strategy presented in this study reduced the NPC by increasing the operation of the FC compared to CC and LF, both in terms of hours and capacity factor. Therefore, the PD strategy can promote FC systems and a solar-based 100% renewable energy supply in an off-grid system.
Author Contributions
Funding
Institutional Review Board Statement
Informed Consent Statement
Data Availability Statement
Conflicts of Interest
Nomenclature
| AC | Alternating current |
| BES | Battery energy storage system |
| c | Storage capacity ratio |
| CAPEX | Capital cost |
| CC | Cycle-charging |
| CRF | Capacity recovery factor |
| DC | Direct current |
| DG | Diesel generator |
| Output energy of the fuel cell component | |
| EL | Electrolysis |
| FC | Fuel cell system |
| Load factor of fuel cell | |
| Co-efficient due to the fuel curve intercepts | |
| Slope of the hydrogen curve | |
| F(t) | Mass of hydrogen used in the fuel cell in relation to the electricity output |
| Derating factor | |
| GA | Genetic algorithm |
| Incident plane of array solar irradiance | |
| GT,STC | Incident solar irradiance under test conditions. |
| HES | Hybrid energy system |
| HOMER | Hybrid Optimization of Multiple Energy Resources |
| HT | Hydrogen tank |
| i | Annual real discount rate |
| k | Storage rate constant |
| Power temperature coefficient | |
| LCOE | Levelized cost of energy |
| LF | Load-following |
| Min | Minimum |
| MOPSO | Multi-objective particle swarm optimization |
| NASA | National Aeronautics and Space Administration |
| n | Project lifetime |
| Efficiency of fuel cell system | |
| OPEX | Operational and maintenance cost |
| NPC | Net present cost |
| PD | Proposed dispatch |
| Rated output power of fuel cell | |
| PSO | Particle swarm optimization |
| PV | Photovoltaic system |
| PrEL | Power rating of electrolyzer |
| Unmet power demand | |
| P(t) | Output power of fuel cell |
| Q(t) | Total amount of energy at the beginning of the time step |
| Qmax | Total storage capacity |
| Qs(t) | Available energy at the beginning of the time step |
| SOC | State of charge |
| SDO | Simulink design optimization |
| State of charge of hydrogen storage system | |
| t | Time |
| TAC | Total annualized cost |
| Photovoltaic cell temperature | |
| Temperature at standard test conditions | |
| UCSD | University of California, San Diego |
| Photovoltaic array power at standard test conditions |
References
- Shan, Y.; Guan, D.; Liu, J.; Mi, Z.; Liu, Z.; Liu, J.; Schroeder, H.; Cai, B.; Chen, Y.; Shao, S.; et al. Methodology and applications of city level CO2 emission accounts in China. J. Clean. Prod. 2017, 161, 1215–1225. [Google Scholar] [CrossRef] [Green Version]
- Shin, H.K.; Cho, J.M.; Lee, E.B. Electrical Power Characteristics and Economic Analysis of Distributed Generation System Using Renewable Energy: Applied to Iron and Steel Plants. Sustainability 2019, 11, 6199. [Google Scholar] [CrossRef] [Green Version]
- Mengelkamp, E.; Gärttner, J.; Rock, K.; Kessler, S.; Orsini, L.; Weinhardt, C. Designing microgrid energy markets: A case study: The Brooklyn Microgrid. Appl. Energy 2018, 210, 870–880. [Google Scholar] [CrossRef]
- Mehrpooya, M.; Ghorbani, B.; Mousavi, S.A. Integrated power generation cycle (Kalina cycle) with auxiliary heater and PCM energy storage. Energy Convers. Manag. 2018, 177, 453–467. [Google Scholar] [CrossRef]
- Al Mouatamid, A.; Ouladsine, R.; Bakhouya, M.; El Kamoun, N.; Khaidar, M.; Zine-Dine, K. Review of Control and Energy Management Approaches in Micro-Grid Systems. Energies 2021, 14, 168. [Google Scholar] [CrossRef]
- Brenna, M.; Foiadelli, F.; Longo, M.; Abegaz, T. Integration and optimization of renewables and storages for rural electrification. Sustainability 2016, 8, 982. [Google Scholar] [CrossRef] [Green Version]
- Jiang, F.; Xie, H.; Ellen, O. Hybrid energy system with optimized storage for improvement of sustainability in a small town. Sustainability 2018, 10, 2034. [Google Scholar] [CrossRef] [Green Version]
- Mazzola, S.; Astolfi, M.; Macchi, E. A detailed model for the optimal management of a multi good microgrid. Appl. Energy 2015, 154, 862–873. [Google Scholar] [CrossRef]
- Chauhan, A.; Upadhyay, S.; Khan, M.; Hussain, S.M.; Ustun, T.S. Performance Investigation of a Solar Photovoltaic/Diesel Generator Based Hybrid System with Cycle Charging Strategy Using BBO Algorithm. Sustainability 2021, 13, 8048. [Google Scholar] [CrossRef]
- Dawood, F.; Shafiullah, G.M.; Anda, M. Stand-alone microgrid with 100% renewable energy: A case study with hybrid solar PV-battery-hydrogen. Sustainability 2020, 12, 2047. [Google Scholar] [CrossRef] [Green Version]
- Singh, A.; Baredar, P.; Gupta, B. Techno-economic feasibility analysis of hydrogen fuel cell and solar photovoltaic hybrid renewable energy system for academic research building. Energy Convers. Manag. 2017, 145, 398–414. [Google Scholar] [CrossRef]
- Ghenai, C.; Bettayeb, M. Optimized design and control of an off grid solar PV/hydrogen fuel cell power system for green buildings. IOP Conf. Ser. Earth Environ. Sci. 2017, 93, 012073. [Google Scholar] [CrossRef]
- Kansara, B.U.; Parekh, B.R. Penetration of renewable energy resources based dispatch strategies for isolated hybrid systems. Int. J. Electr. Electron. Eng. Res. 2013, 3, 121–130. [Google Scholar]
- Arévalo, P.; Benavides, D.; Lata-García, J.; Jurado, F. Techno-economic evaluation of renewable energy systems combining PV-WT-HKT sources: Effects of energy management under Ecuadorian conditions. Int. Trans. Electr. Energy Syst. 2020, 30, e12567. [Google Scholar] [CrossRef]
- Shoeb, M.; Shafiullah, G. Renewable energy integrated islanded microgrid for sustainable irrigation—A Bangladesh perspective. Energies 2018, 11, 1283. [Google Scholar] [CrossRef] [Green Version]
- Arévalo, P.; Jurado, F. Performance analysis of a PV/HKT/WT/DG hybrid autonomous grid. Electr. Eng. 2021, 103, 227–244. [Google Scholar] [CrossRef]
- Rezzouk, H.; Mellit, A. Feasibility study and sensitivity analysis of a stand-alone photovoltaic diesel battery hybrid energy system in the north of Algeria. Renew. Sustain. Energy Rev. 2015, 43, 1134–1150. [Google Scholar] [CrossRef]
- Yilmaz, S.; Dincer, F. Optimal design of hybrid PV-Diesel-Battery systems for isolated lands: A case study for Kilis, Turkey. Renew. Sustain. Energy Rev. 2017, 77, 344–352. [Google Scholar] [CrossRef]
- Rajbongshi, R.; Borgohain, D.; Mahapatra, S. Optimization of PV-biomass-diesel and grid base hybrid energy systems for rural electrification by using HOMER. Energy 2017, 126, 461–474. [Google Scholar] [CrossRef]
- Rashid, F.; Hoque, M.; Aziz, M.; Sakib, T.N.; Islam, M.; Robin, R.M. Investigation of Optimal Hybrid Energy Systems Using Available Energy Sources in a Rural Area of Bangladesh. Energies 2021, 14, 5794. [Google Scholar] [CrossRef]
- Arévalo, P.; Benavides, D.; Lata-García, J.; Jurado, F. Energy control and size optimization of a hybrid system (photovoltaic-hydrokinetic) using various storage technologies. Sustain. Cities Soc. 2020, 52, 101773. [Google Scholar] [CrossRef]
- Ghorbani, N.; Kasaeian, A.; Toopshekan, A.; Bahrami, L.; Maghami, A. Optimizing a hybrid wind-PV-battery system using GA-PSO and MOPSO for reducing cost and increasing reliability. Energy 2018, 154, 581–591. [Google Scholar] [CrossRef]
- Fodhil, F.; Hamidat, A.; Nadjemi, O. Potential, optimization and sensitivity analysis of photovoltaic-diesel-battery hybrid energy system for rural electrification in Algeria. Energy 2019, 169, 613–624. [Google Scholar] [CrossRef]
- Arévalo, P.; Eras-Almeida, A.A.; Cano, A.; Jurado, F.; Egido-Aguilera, M.A. Planning of electrical energy for the Galapagos Islands using different renewable energy technologies. Electr. Power Syst. Res. 2022, 203, 107660. [Google Scholar] [CrossRef]
- Emad, D.; El-Hameed, M.A.; El-Fergany, A.A. Optimal techno-economic design of hybrid PV/wind system comprising battery energy storage: Case study for a remote area. Energy Convers. Manag. 2021, 249, 114847. [Google Scholar] [CrossRef]
- Mukherjee, U.; Maroufmashat, A.; Ranisau, J.; Barbouti, M.; Trainor, A.; Juthani, N.; El-Shayeb, H.; Fowler, M. Techno-economic, environmental, and safety assessment of hydrogen powered community microgrids; case study in Canada. Int. J. Hydrogen Energy 2017, 42, 14333–14349. [Google Scholar] [CrossRef]
- Kim, C.K.; Cho, H.S.; Kim, C.H.; Cho, W.; Kim, H.G. A Feasibility Study of Photovoltaic—Electrolysis—PEM Hybrid System Integrated Into the Electric Grid System Over the Korean Peninsula. Front. Chem. 2021, 9, 750. [Google Scholar] [CrossRef]
- Chen, X.; Cao, W.; Zhang, Q.; Hu, S.; Zhang, J. Artificial intelligence-aided model predictive control for a grid-tied wind-hydrogen-fuel cell system. IEEE Access 2020, 8, 92418–92430. [Google Scholar] [CrossRef]
- Torreglosa, J.P.; García, P.; Fernández, L.M.; Jurado, F. Energy dispatching based on predictive controller of an off-grid wind turbine/photovoltaic/hydrogen/battery hybrid system. Renew. Energy 2015, 74, 326–336. [Google Scholar]
- Abdelghany, M.B.; Shehzad, M.F.; Liuzza, D.; Mariani, V.; Glielmo, L. Optimal operations for hydrogen-based energy storage systems in wind farms via model predictive control. Int. J. Hydrogen Energy 2021, 46, 29297–29313. [Google Scholar] [CrossRef]
- Jamshidi, M.; Askarzadeh, A. Techno-economic analysis and size optimization of an off-grid hybrid photovoltaic, fuel cell and diesel generator system. Sustain. Cities Soc. 2019, 44, 310–320. [Google Scholar] [CrossRef]
- Sánchez-Sáinz, H.; García-Vázquez, C.A.; Llorens Iborra, F.; Fernández-Ramírez, L.M. Methodology for the optimal design of a hybrid charging station of electric and fuel cell vehicles supplied by renewable energies and an energy storage system. Sustainability 2019, 11, 5743. [Google Scholar] [CrossRef] [Green Version]
- Kansara, B.U.; Parekh, B.R. Dispatch, control strategies and emissions for isolated wind-diesel hybrid power system. Int. J. Innov. Technol. Explor. Eng. 2013, 2, 152–156. [Google Scholar]
- Eu-Tjin, C.; Huat, C.K.; Seng, L.Y. Control strategies in energy storage system for standalone power systems. In Proceedings of the 4th IET Clean Energy and Technology Conference, Kuala Lumpur, Malaysia, 14–15 November 2016. [Google Scholar]
- Silwal, S.; Mullican, C.; Chen, Y.A.; Ghosh, A.; Dilliott, J.; Kleissl, J. Open-source multi-year power generation, consumption, and storage data in a microgrid. J. Renew. Sustain. Energy 2021, 13, 025301. [Google Scholar] [CrossRef]
- Monteiro, L.A.; Sentelhas, P.C.; Pedra, G.U. Assessment of NASA/POWER satellite-based weather system for Brazilian conditions and its impact on sugarcane yield simulation. Int. J. Climatol. 2018, 38, 1571–1581. [Google Scholar] [CrossRef]
- Bahramara, S.; Moghaddam, M.P.; Haghifam, M.R. Optimal planning of hybrid renewable energy systems using HOMER: A review. Renew. Sustain. Energy Rev. 2016, 62, 609–620. [Google Scholar] [CrossRef]
- Anoune, K.; Bouya, M.; Astito, A.; Abdellah, A.B. Sizing methods and optimization techniques for PV-wind based hybrid renewable energy system: A review. Renew. Sustain. Energy Rev. 2018, 93, 652–673. [Google Scholar] [CrossRef]
- Al Garni, H.Z.; Awasthi, A.; Ramli, M.A. Optimal design and analysis of grid-connected photovoltaic under different tracking systems using HOMER. Energy Convers. Manag. 2018, 155, 42–57. [Google Scholar] [CrossRef]
- Luta, D.N.; Raji, A.K. Optimal sizing of hybrid fuel cell-supercapacitor storage system for off-grid renewable applications. Energy 2019, 166, 530–540. [Google Scholar] [CrossRef]
- Mamaghani, A.H.; Escandon, S.A.A.; Najafi, B.; Shirazi, A.; Rinaldi, F. Techno-economic feasibility of photovoltaic, wind, diesel and hybrid electrification systems for off-grid rural electrification in Colombia. Renew. Energy 2016, 97, 293–305. [Google Scholar] [CrossRef]
- Das, B.K.; Alotaibi, M.A.; Das, P.; Islam, M.S.; Das, S.K.; Hossain, M.A. Feasibility and techno-economic analysis of stand-alone and grid-connected PV/wind/diesel/Batt hybrid energy system: A case study. Energy Strategy Rev. 2021, 37, 100673. [Google Scholar] [CrossRef]
- Baneshi, M.; Hadianfard, F. Techno-economic feasibility of hybrid diesel/PV/wind/battery electricity generation systems for non-residential large electricity consumers under southern Iran climate conditions. Energy Convers. Manag. 2016, 127, 233–244. [Google Scholar] [CrossRef]
- Thorstensen, B. A parametric study of fuel cell system efficiency under full and part load operation. J. Power Sources 2001, 92, 9–16. [Google Scholar] [CrossRef]
- Getting Started Guide for HOMER (Version 2.8). Available online: https://www.homerenergy.com/products/pro/docs/latest/how_homer_creates_the_generator_efficiency_curve.html (accessed on 14 February 2022).
- Liu, J.; Kim, S.C.; Shin, K.Y. Feasibility Study and Economic Analysis of a Fuel-Cell-Based CHP System for a Comprehensive Sports Center with an Indoor Swimming Pool. Energies 2021, 14, 6625. [Google Scholar] [CrossRef]
- Stiel, A.; Skyllas-Kazacos, M. Feasibility study of energy storage systems in wind/diesel applications using the HOMER model. Appl. Sci. 2012, 2, 726–737. [Google Scholar] [CrossRef] [Green Version]
- Masrur, H.; Howlader, H.O.R.; Elsayed Lotfy, M.; Khan, K.R.; Guerrero, J.M.; Senjyu, T. Analysis of techno-economic-environmental suitability of an isolated microgrid system located in a remote island of bangladesh. Sustainability 2020, 12, 2880. [Google Scholar] [CrossRef] [Green Version]
- Ghenai, C.; Bettayeb, M. Modelling and performance analysis of a stand-alone hybrid solar PV/Fuel Cell/Diesel Generator power system for university building. Energy 2019, 171, 180–189. [Google Scholar] [CrossRef]
- Mandal, S.; Das, B.K.; Hoque, N. Optimum sizing of a stand-alone hybrid energy system for rural electrification in Bangladesh. J. Clean. Prod. 2018, 200, 12–27. [Google Scholar] [CrossRef]
- Ajlan, A.; Tan, C.W.; Abdilahi, A.M. Assessment of environmental and economic perspectives for renewable-based hybrid power system in Yemen. Renew. Sustain. Energy Rev. 2017, 75, 559–570. [Google Scholar] [CrossRef]
- Rosenstiel, A.; Monnerie, N.; Dersch, J.; Roeb, M.; Pitz-Paal, R.; Sattler, C. Electrochemical Hydrogen Production Powered by PV/CSP Hybrid Power Plants: A Modelling Approach for Cost Optimal System Design. Energies 2021, 14, 3437. [Google Scholar] [CrossRef]
- Quitoras, M.R.; Campana, P.E.; Rowley, P.; Crawford, C. Remote community integrated energy system optimization including building enclosure improvements and quantitative energy trilemma metrics. Appl. Energy 2020, 267, 115017. [Google Scholar] [CrossRef]
- Jufri, F.H.; Aryani, D.R.; Garniwa, I.; Sudiarto, B. Optimal Battery Energy Storage Dispatch Strategy for Small-Scale Isolated Hybrid Renewable Energy System with Different Load Profile Patterns. Energies 2021, 14, 3139. [Google Scholar] [CrossRef]
- Toopshekan, A.; Yousefi, H.; Astaraei, F.R. Technical, economic, and performance analysis of a hybrid energy system using a novel dispatch strategy. Energy 2020, 213, 118850. [Google Scholar] [CrossRef]
- Cano, A.; Arévalo, P.; Jurado, F. A comparison of sizing methods for a long-term renewable hybrid system. Case study: Galapagos Islands 2031. Sustain. Energy Fuels 2021, 5, 1548–1566. [Google Scholar] [CrossRef]


| Reference | Year | Generator Technology | Dispatch Strategy | Optimization Models | Site | Results |
|---|---|---|---|---|---|---|
| Rezzouk et al. [17] | 2015 | PV/BES/DG | LF | HOMER | North Algeria | Increasing renewable energy reduces energy cost. |
| Yilmaz et al. [18] | 2017 | PV/BES/DG | LF and CC | HOMER | Turkey | HOMER sizing results are sensitive to the optimization model. |
| Rajbongshi et al. [19] | 2017 | PV/Biomass/DG/BES/Grid | CC | HOMER | India | Grid-connected system had a lower LCOE than the off-grid system. |
| Rashid et al. [20] | 2019 | PV/BES/DG | LF, CC, and custom dispatch | HOMER + GA | Bangladesh | The proposed control dispatch yields higher economical and performance benefits than LF and CC. |
| Arévalo et al. [21] | 2020 | PV/BES/hydro- kinetic | LF, CC, and custom dispatch | HOMER + MATLAB | Ecuador | The proposed dispatch reduces NPC and LCOE compared to LF. |
| Ghorbani et al. [22] | 2018 | PV/BES /wind turbines | LF and custom dispatch | GAPSO/MOPSO + HOMER | Iran | GAPSO/MOPSO algorithm improves over HOMER. |
| Fodhil et al. [23] | 2019 | PV/BES/DG | LF and CC | HOMER + PSO | Algeria | PSO is more cost effective than CC and LF control strategy. |
| Arévalo et al. [24] | 2022 | PV/BES/wind turbines/hydro- electric storage | Energy control models | HOMER+ MATLAB | Galapagos Islands | Increasing PV capacity and pumped hydraulic storage reduces LCOE. |
| Emad et al. [25] | 2021 | PV/BES/wind turbines | LF, CC, and metaheuristic algorithms | HOMER + PSO + GA + grey wolf optimizer | Egypt | The grey wolf optimizer is more efficient than dispatch algorithms. |
| Components | Lifetime (Years) | CAPEX ($/kW) | OPEX ($/kW) |
|---|---|---|---|
| PV | 25 | 1720 | 2.5% of CAPEX |
| BES | 15 | 700 | 3% of CAPEX |
| FC | 7 | 2500 | 0.02 |
| EL | 15 | 2500 | 80 |
| HT | 15 | 1000 | 10 |
| Components | Capacity Constraints |
|---|---|
| PV | |
| FC | |
| BES | |
| EL | |
| HT |
| Components | Control Strategies | ||
|---|---|---|---|
| LF | CC | PD | |
| PV (kW) | 1300 | 1350 | 1100 |
| BES (kWh) | 90 | 80 | 70 |
| FC (kW) | 205 | 205 | 180 |
| EL (kW) | 1200 | 1200 | 1200 |
| HT (kg) | 1200 | 1200 | 1200 |
| NPC (million $) | 10.7 | 10.8 | 10.3 |
| LCOE ($/kWh) | 0.590 | 0.592 | 0.570 |
| Components | LF | CC | PD | % Errors (PD versus LF Control Dispatch) | % Errors (PD versus CC Control Dispatch) | |||
|---|---|---|---|---|---|---|---|---|
| kWh/Year | % | kWh/Year | % | kWh/Year | % | |||
| PV | 2,274,113 | 81.4 | 2,361,579 | 81.8 | 1,924,250 | 76.3 | −6.68 | −6.55 |
| FC | 520,310 | 18.6 | 525,798 | 18.2 | 589,016 | 23.7 | 18.56 | 23.20 |
| BES | 7550 | 7917 | 4833 | −56.21 | −63.81 | |||
| Unmet load (%) | 0.433 | 0.306 | 0.050 | −7.66 | −5.12 | |||
| FC run time (hours) | 4871 | 4913 | 5312 | 8.30 | 7.51 | |||
| Average SOC of BES (%) | 92.81 | 98.26 | 98.14 | 5.43 | −0.12 | |||
| Criterion | CC | LF | PD |
|---|---|---|---|
| BES utilization | -BES is only discharged if it was discharged in the previous time step or it is at maximum SOC. | -BES is allowed to discharge energy while the FC is supplying the load. | -PD does not decide the BES discharging operation based on BES’s maximum SOC, or charge/discharge status of the previous time step. -BES discharging operation is determined based on the BES’s capacity to supply the net required load after the FC power has been exhausted. |
| FC operation | -FC operates at full-rated power to meet power demand. -When the FC runs, excess FC energy is used to charge the BES. | -FC works frequently at partial load. -BES is only charged from PV systems. -FC never charges BES. | -Higher operational efficiency of FC by operating FC only at 50% capacity or more. -The BES is charged with surplus FC energy. |
| Optimization process | Single objective optimization. At each time step, the decision to use the FC or the BES is made based on the lowest-cost choice. The technical performances are not taken into the higher priority in finding the optimal design. | Same as CC | Multi-objective techniques. Combine technical parameters and economic control strategy to increase the system performance, components lifetime, and system stability achieve synergy between the lowest NPC of microgrid system and coordinated control of PV/FC/BES devices. |
| Reference/Year | Location | Components | Dispatch Strategy | LCOE ($/kWh) | Percentage of Renewable Energy (%) |
|---|---|---|---|---|---|
| Jufri et al. [54], 2021 | Indonesia | PV/BES | HOMER Optimal BES | 0.19 0.18 | 22.4 34.0 |
| Toopshekan et al. [55], 2020 | Iran | PV/wind/DG/BES/grid | HOMER Predictive dispatch | 0.13 0.12 | 37.0 46.4 |
| Cano et al. [56], 2021 | Galapagos Islands | PV, BES, DG, wind turbines, hydraulic pumping | HOMER SDO | 0.25 0.26 | 74.3 74.3 |
| Our findings | USA | PV/FC/BES | HOMER PD strategy | 0.59 0.57 | 100 100 |
Publisher’s Note: MDPI stays neutral with regard to jurisdictional claims in published maps and institutional affiliations. |
© 2022 by the authors. Licensee MDPI, Basel, Switzerland. This article is an open access article distributed under the terms and conditions of the Creative Commons Attribution (CC BY) license (https://creativecommons.org/licenses/by/4.0/).
Share and Cite
Uwineza, L.; Kim, H.-G.; Kleissl, J.; Kim, C.K. Technical Control and Optimal Dispatch Strategy for a Hybrid Energy System. Energies 2022, 15, 2744. https://doi.org/10.3390/en15082744
Uwineza L, Kim H-G, Kleissl J, Kim CK. Technical Control and Optimal Dispatch Strategy for a Hybrid Energy System. Energies. 2022; 15(8):2744. https://doi.org/10.3390/en15082744
Chicago/Turabian StyleUwineza, Laetitia, Hyun-Goo Kim, Jan Kleissl, and Chang Ki Kim. 2022. "Technical Control and Optimal Dispatch Strategy for a Hybrid Energy System" Energies 15, no. 8: 2744. https://doi.org/10.3390/en15082744
APA StyleUwineza, L., Kim, H.-G., Kleissl, J., & Kim, C. K. (2022). Technical Control and Optimal Dispatch Strategy for a Hybrid Energy System. Energies, 15(8), 2744. https://doi.org/10.3390/en15082744