Abstract
Currently, the world is moving rapidly toward carbon neutrality, and renewable energy technology is very important in carbon neutrality. Among various renewable energy technologies, wind power is attracting much attention due to its sustainability, resource abundance, and high applicability. This study analyzed wind power patents from 2010 to 2021 to derive current global originality and convergence information. For IP5 countries, the growth stages of technology and the patent convergence networks were inferred by time series analysis and an association rule mining algorithm, respectively. The results showed that, during the analysis period, about 5000 patents were applied on annual average, and it was analyzed that China held the most patents at 48%, followed by the US, Europe, Korea, and Japan. According to the technology convergence network of patent codes from all the IP5 countries, patents related to ‘wind turbines with rotation axes in the wind direction’ occupied a very central position, and ‘power conversion electric or electronic aspects’ and ‘integration of patents related to renewable energy sources in buildings with wind power’ were found to show high connection strength. By country, it was analyzed that the US and China showed high patent competitiveness onshore and possessed many ‘independent power conversion cluster’ technologies. The research hypothesis was that technology development trends can be analyzed and the characteristics of each country can be understood through patent analysis in the wind power field. This hypothesis was analyzed through various patent analysis techniques, and this paper has novelty in that it presents the global megatrend in the wind power field through patent analysis and quantitatively presents the current status of technology development in five major countries.
1. Introduction
In order to realize carbon neutrality by 2050, a large-scale and large-capacity energy conversion centered on wind and solar power is required [1,2,3]. To achieve the 2050 carbon-neutral target, global energy-related emissions must be reduced by 30% by 2030 and 75% by 2040 compared to 2019 [4]. The key is to reduce emissions in the electricity sector, which accounts for three-quarters of the total energy-related emissions, and it is necessary to reduce it by 57% by 2030 and 89% by 2040 compared to 2019 through the rapid expansion of wind and solar power generation [4].
As of 2020, the global wind power capacity is 743 GW, of which onshore wind power accounts for 707 GW and offshore wind power accounts for 35 GW [3]. From 2020 to 2025, the wind power industry is expected to increase its new installed capacity by 94 GW annually, growing at an annual rate of 4%, resulting in a total new capacity increase of 459 GW over the next five years [5]. At the current rate, global wind power capacity will increase to 1455 GW in 2030 and 2434 GW in 2050, but it is expected that 6044 GW in 2050 will be needed to achieve net zero [6].
In the global wind power market, the competition to secure innovative source technologies for realizing 15–20 MW ultra-large wind turbines is accelerating as wind power generators are becoming larger in size. Only a few companies, including GE (USA), Vestas (Denmark), and Siemens (Spain), possess large-scale wind turbine technology of 10 MW or more. GE currently has 12 to 14 MW turbines as of 2021, while Siemens Gamesa plans to develop a 15 MW turbine and commercialize it in 2024 [7,8]. In the case of Vestas, a 15 MW turbine is scheduled for production in 2024 [9]. It is predicted that the country that possesses the core technology for super-large wind turbines of 20 MW or more will become the leader in the future offshore wind power industry.
This paper uses various research methods to analyze the global megatrend through a quantitative analysis of wind power patents and to verify the hypothesis that future wind technology development strategy information can be provided through a detailed analysis of each country. Therefore, this study intends to analyze the technological innovation status of wind power by country using Cooperative Patent Classification (CPC), one of the international patent classifications. In addition, we try to understand the technology trends and convergence characteristics in the wind power field through analyses using association rules. Among the wind-power-related patents registered from 2010 to 2021, 57,689 patents in Korea, Japan, the United States, Europe, and China are subject to analysis. It is expected that this study can suggest implications for the future direction of research and development in the field of wind power generation by identifying related technology trends and convergence characteristics through the analysis of patents in major countries in the relevant field.
The structure of this paper is as follows: Section 2 shows related studies with explanations of CPC and association analysis. Section 3 then presents the research process, data collection, data preprocessing, and basic statistical analysis. Section 4 summarizes the results of the association analysis, and we present our conclusions in Section 5.
2. Previous Studies
2.1. Cooperative Patent Classification (CPC)
The most significant and main purpose of a patent is to protect a newly developed technology from being imitated by competitors. A patent document contains a variety of detailed information on the developed technology, such as the technology name, application date, applicant, nationality, inventor, patent classification, etc. Each patent is classified into several related patent classification codes according to IPC (International Patent Classification), CPC (Cooperative Patent Classification), and others.
Cooperative Patent Classification (CPC), developed in 2012 by the United States Patent and Trademark Office (USPTO) and the European Patent Office (EPO), is an international patent classification system. International Patent Classification (IPC) is another global classification system developed in 1971 that has been used in 62 countries until today, but there is an issue of low search efficiency with its 70,000 codes. CPC offers over 250,000 codes developed based on 90% European patent classifications and 10% US patent classifications and includes new classifications according to technology development, such as a Y section code related to climate change. CPC code is now used in more than 30 offices around the globe, including not only the USPTO of the USA and the EPO of the EU, but also the KIPO of Korea, the CNIPA (also known as SIPO) of China, the IP Australia of Australia, the INPI Brazil of Brazil, etc. (Figure 1).
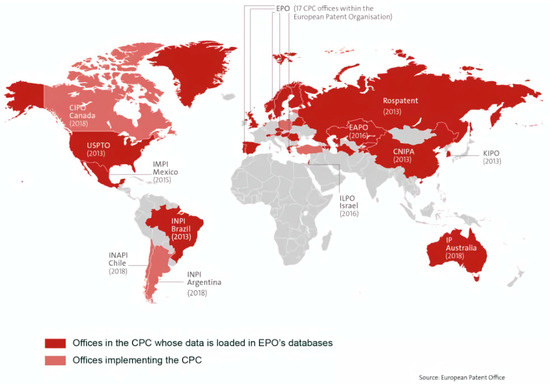
Figure 1.
CPC offices in the world [10].
Recently, international patent information classified in CPC has been widely used for research and development technical analysis. Kim et al. used patent information classified by CPC code for technology forecasting [11]. Park et al. performed a study on a patent citation network to identify building information modeling technology structure and the characteristics of knowledge flow with patent information classified by CPC [12]. Chae and Gim proposed a model for showing the common invention patterns of applicants and an analysis of their technical invention based on IPC and CPC [13].
2.2. Association Rule Mining and Patent
Association rule mining, or association analysis, is also commonly referred to as market basket analysis or sequence analysis. Association analysis targets clusters grouped by cluster analysis as a method to investigate group characteristics. In other words, the characteristics of each group are identified by grouping similar objects into clusters, and in a large database, all the data are grouped into similar clusters. Association analysis can be described with three indicators: support, confidence, and lift.
Support means how frequently the itemset appears in the dataset. For example, 0.05 support indicates that 5% of the dataset contains the itemset. Given itemsets A and B, the support is calculated by Equation (1).
Confidence indicates the ratio of the number of transactions that include both items A and B out of the number of the data containing item A. It is the conditional probability of the probability of B given A, and it is defined as Equation (2).
Lift means the ratio of increase in the probability of B when A is given compared to the probability of B when A is not given. If the lift is greater than one, it indicates that the two items, A and B, are dependent on each other. On the contrary, items A and B are more independent as the lift converges to zero. Lift is defined as Equation (3).
Therefore, it is possible that patent clusters classified by the same patent code can reveal how each patent is linked through association analysis. Altuntas and Gök used patent information classified with CPC to find the associations between wind energy technologies with utility mining [14]. Ampornphan and Tongngam obtained knowledge on emerging technology and technology trends using association rule mining and social network analysis, respectively [15]. Kim and Lee conducted a study on the industry of United States shale and tight petroleum of natural gas and crude oil for its technological progress utilizing association rule mining [16].
Generally, there are several association rule mining algorithms, such as Apriori, DHP (direct hashing and pruning), and FP (frequent pattern)-growth. Among them, the Apriori algorithm reduces the number of candidates being considered by only exploring the itemset whose support count is greater than the minimum support count. The Apriori algorithm can be very slow for a large number of datasets [17], but this study limited the datasets to published and granted patents related to wind power, and the number of datasets was under 100,000. Therefore, the technology convergence network was mined by the Apriori algorithm in this study.
3. Analytical Framework
3.1. Research Process
This study followed the procedure shown in Figure 2 below. Among the published patents, patents related to wind power technology were collected from 2010 to 2021, and then a basic statistical analysis on the patents was performed as shown in Table 1. In addition, association rule mining was performed to analyze support, confidence, and lift by applying the Apriori algorithm to the patent CPC code target. Finally, the network structure of the CPC code itemset composed of two items was visualized.
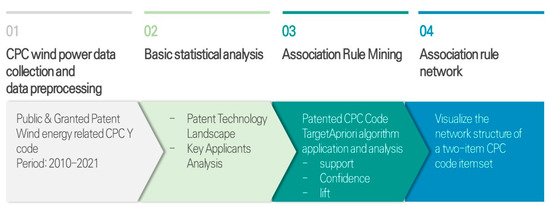
Figure 2.
Research process.

Table 1.
Analysis patent range.
3.2. Data Collection and Data Preprocessing
The CPC code is broadly divided into nine sections, A-H and Y, and each section is subdivided into classes, subclasses, groups, and subgroups. The Y section covers new technological developments, and the Y02 subclass contains “technologies or applications for mitigation or adaptation against climate change”. Y02 has eight subclasses from A to W, and the Y02E code is related to energy production, as shown in Table 2. Y02E covers the “reduction of greenhouse gas (GHG) emissions, related to energy generation, transmission or distribution”, and the Y02E10 code indicates energy generation through renewable energy sources. Finally, wind energy is classified in Y02E 10/70, and its subgroup is shown in Figure 3.
Table 2.
Subclasses of CPC Y02 code and their definitions.
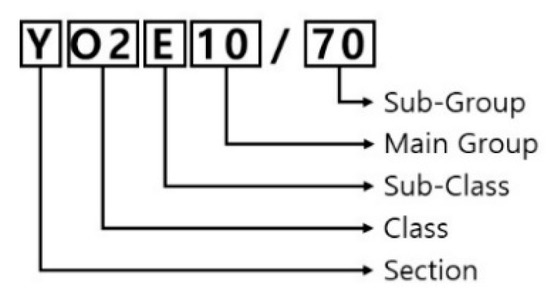
Figure 3.
A structure of Cooperative Patent Classification (CPC).
The classification of wind energy is divided into horizontal axis wind turbines (Y02E 10/72), which are again divided into offshore (Y02E 10/727) and onshore (Y02E 10/728) wind turbines; vertical axis wind turbines (Y02E 10/74); and power-related technology (Y02E 10/76) as shown in Table 3.
Table 3.
Wind energy codes of Cooperative Patent Classification.
3.3. Basic Statistical Analysis
Looking at the overall patent trend of wind power technology from the beginning of the analysis section to 2010, there have been recurrent increases and decreases, and a certain level of applications was made as shown in Figure 4. Although there was a temporary decline in the mid-2010s, it has recently shown a recovery trend due to an increase in Chinese applications. In terms of wind energy utilization and development, in Korea, 420 applications on average were made between the years 2010 and 2019, the analysis target period. Compared to the initial 5 years (about 590 cases), the number of applications for the last 5 years (about 245 cases) decreased by about 50%. The recent application trend is led by China, with an average of 2950 applications over the past five years, representing a 50% increase compared to the previous section.
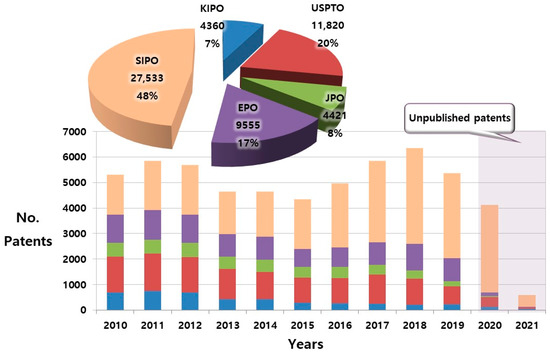
Figure 4.
Patent trend by year and major country.
For the past 10 years, the patent trend has been increasing, except for the period from 2013 to 2015. In order to explain the decline from 2013 to 2015, it is necessary to understand the status of the wind power industry between 2010 and 2012, considering it takes about 2–3 years for actual patent registration after the technology development [18]. After Lehman Brothers went into bankruptcy in 2008, the global economy went into a severe recession, leading to economic crises in major countries such as Europe, the United States, and China [19]. Wind turbine production capacity continued to increase, but the severe slowdown in demand exacerbated the oversupply situation, deteriorating profits. In addition, in the case of wind power, the cost of power generation is higher than that of other energy sources, so the subsidy plays a large role [20].
As for wind energy technology, the ratio of domestic applications to foreign nationals was high in Korea (KIPO), China (SIPO), Japan (JPO), and Europe (EPO) as shown in Figure 5. In the case of the United States (USPTO), it is understood that the number of applications for foreign applicants to secure the market is increasing. The globalization of a country’s technology market can be estimated by examining the proportion of domestic and foreign applicants by country. It was found to be slightly higher than that of China, but considering the fact that Chinese patents were concentrated on patent applications in the last three to four years and the large size of the Chinese market, it is necessary to pay attention to future changes, as the attractiveness of China’s technology market is expected to rise.
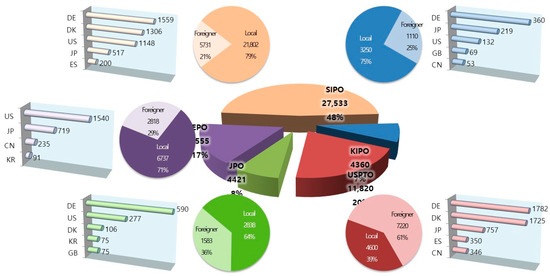
Figure 5.
Current status of domestic and foreign patents by major country.
In the case of the technology of wind turbines with a rotational axis in the wind direction, the overall weight of patents appears to be gradually decreasing as the technology is maturing, and a few large wind turbine companies occupy the market as shown in Figure 6. On the other hand, in order to utilize the abundant wind speed of the sea, as the proportion of the market for offshore wind power increases, it is expected that the number of patents related to offshore wind power will increase in the future. As offshore wind power technology increases, technology related to offshore wind power transmission facilities, such as high-voltage direct current (HVDC) technology, will also increase in proportion.
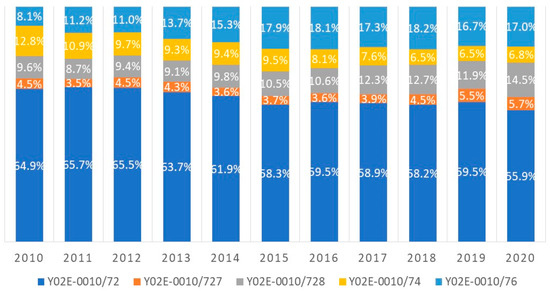
Figure 6.
Proportion of wind-power-related CPC patent codes during 2010–2020.
In the analysis of the growth stage of patent technology, an increase in the number of patents indicates active technology development, and an increase in the number of applicants indicates an increase in new entrants into the technology market, meaning that the market is expanding as shown in Figure 7. Among the growth stages of patent technology, the emerging stage is a stage in which the number of applicants and patents starts to increase, and it is expected that research and development activities will become active thereafter. It can be interpreted as the stage in which research and development activities in the relevant technical field are being carried out. The division between the emerging and the growth periods can be determined by considering the number of increases in the corresponding section compared to the parameters of the analysis data, the characteristics of the technical field, and the characteristics of the applicants. In the maturity stage, the increase in the number of patents slows down, the number of applicants decreases, and only some of the advanced applicants maintain their applications, while other entrants are eliminated. The decline stage can be interpreted as a stage in which the market for the relevant technology is shrinking in the form of a decrease in both the number of applications and the number of patents. The recovery stage can be judged as the stage in which the market is reformed by using source technologies to develop technologies that match the latest technology trends and new ideas.
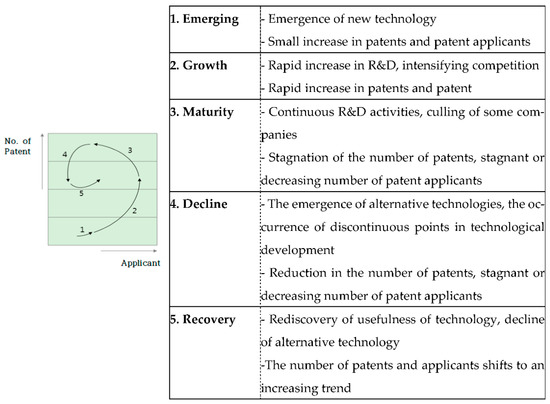
Figure 7.
Meanings of patent technology growth stages.
In order to analyze the growth stage of patent technology in the wind energy field, the total analysis period of 10 years was divided into five periods of two-year units, establishing period 1 (2010–2011), period 2 (2012–2013), period 3 (2014–2015), period 4 (2016–2017), and period 5 (2018–2019). 2020 and 2021 were sections in which unpublished patents existed and were excluded from the analysis target section
The growth stage of the wind energy technology field based on patent technology was in the form of an increase in the number of applications, as well as the number of applicants, on the graph, which can be interpreted as a stage of recovery.
From Section 1 to Section 4, the number of applicants and applications decreased, but as the technological excellence of wind energy increased, a number of new market entrants occurred, giving rise to an increase in the number of applications as shown in Figure 8. In particular, there were many market entrants from China, and this phenomenon is expected to continue for a while. In China, more than 3400 applications were made in the recent unpublished section, and the number of applications was higher than the average for the last five years.
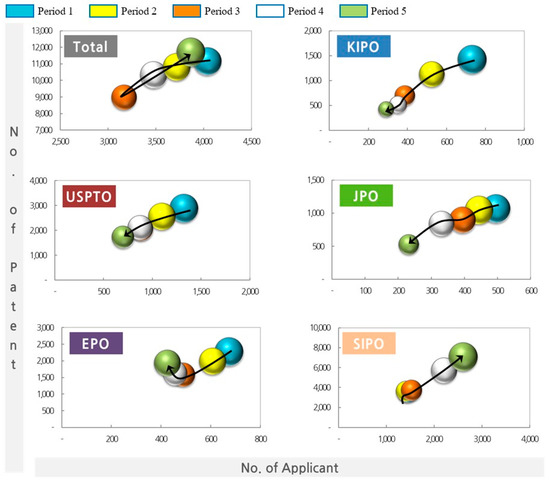
Figure 8.
Growth stages of patent technology by major country.
4. Results
The 57,689 patents aforementioned in Section 3.2 were analyzed with association rule mining algorithms. The processes were performed with Python 3.8 and libraries such as apyori (1.1.2) and mlxtend (0.19). The figures in this chapter show the technology convergences by illustrating the connections between CPC (or IPC) codes.
Figure 9 shows the color schema of the convergence network graphs (Figure 10, Figure 11, Figure 12, Figure 13, Figure 14 and Figure 15) for certain CPC and IPC code groups. In the CPC code terms, technologies for adaptation to climate change (Y02) are illustrated in green. Among these, the reductions in GHG emissions related to energy generation, transmission, or distribution technologies (Y02E) are illustrated in magenta; among these, technologies related to wind power (Y02E 10/7X) are illustrated in dark blue. In the IPC code terms, technologies that are related to wind motors (F03D) are illustrated in gray, and brown is used for the others. Additionally, the size of the nodes in Figure 10, Figure 11, Figure 12, Figure 13, Figure 14 and Figure 15 indicates how frequently the patent codes (CPC or IPC) appeared in the results of the association rule mining algorithm.
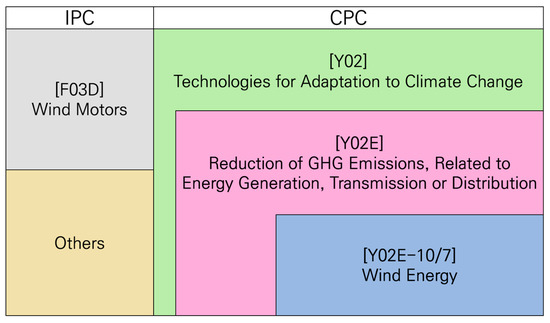
Figure 9.
Color schema for technology convergence network graphs.
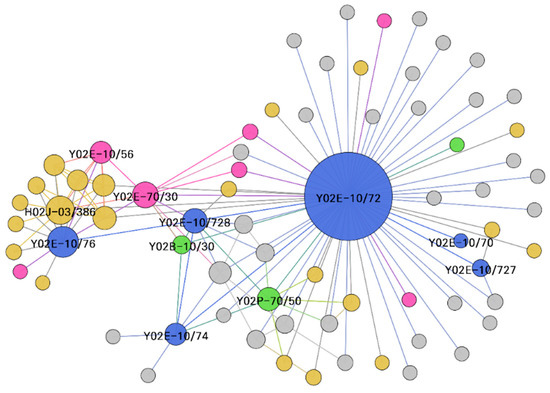
Figure 10.
Technology convergence network of patent codes (all).
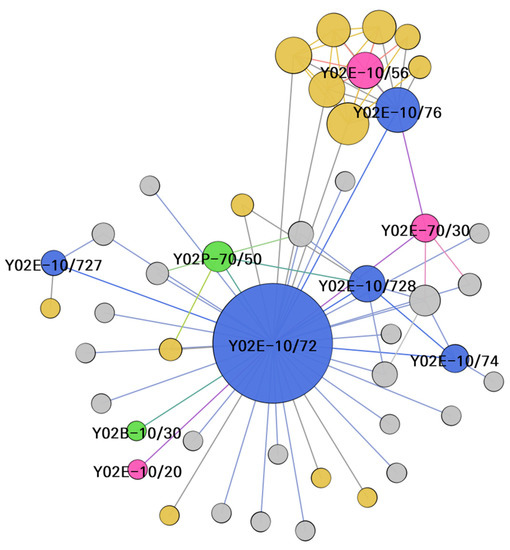
Figure 11.
Technology convergence network of patent codes (United States).
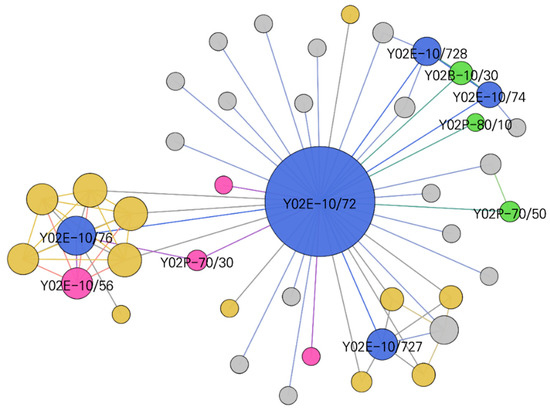
Figure 12.
Technology convergence network of patent codes (Japan).
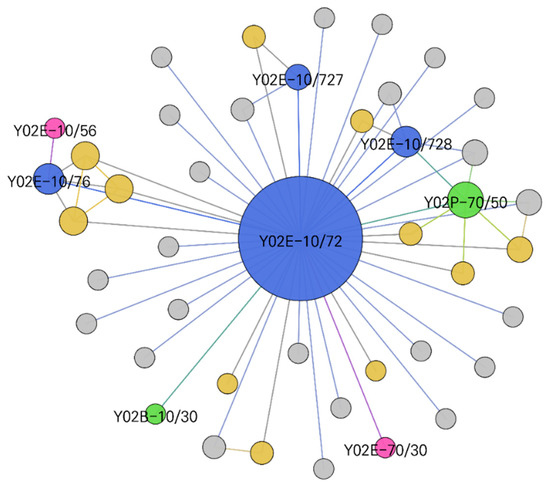
Figure 13.
Technology convergence network of patent codes (Europe Union).
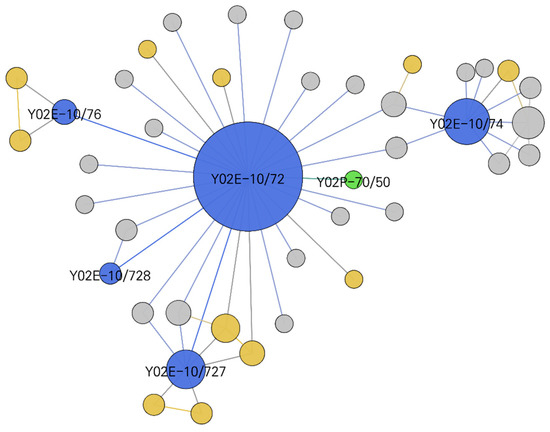
Figure 14.
Technology convergence network of patent codes (South Korea).
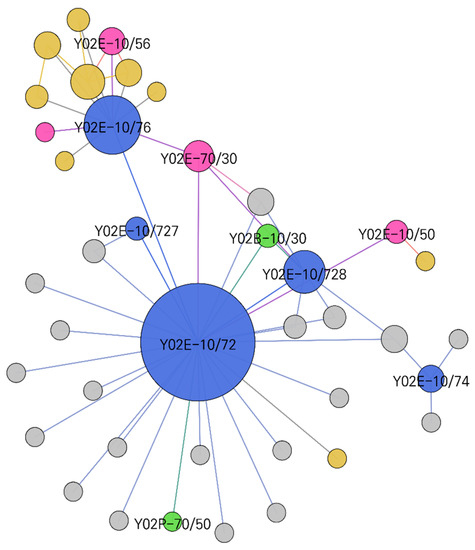
Figure 15.
Technology convergence network of patent codes (China).
4.1. All Datasets
Figure 10 shows the technology convergence network of patent codes from all the IP5 countries that were analyzed by association rule mining analysis. The minimum support was set to 0.02 for figure readability, and 71 nodes (circle) and 127 edges (line) were inferred. The network consisted of Y02E 10/72 (wind turbines with rotational axes in the wind direction) as the center. The Y02E-70/30 code (systems combining energy storage with energy generation from non-fossil origins) connected to another cluster (left) comprised of power-conversion-related patent codes such as Y02E 10/76 (power conversion electric or electronic aspects) and Y02E 10/56 (power conversion systems). Also, Y02E 10/728 (onshore wind turbines), Y02E 10/74 (wind turbines with rotational axes perpendicular to the wind direction), Y02B-10/30 (integration of renewable energy sources in buildings with wind power), and Y02P-70/50 (manufacturing or production processes) tended to converge with other patent codes.
4.2. United States (USTPO)
Figure 11 shows the technology convergence network of patent codes from the United States (USTPO). The minimum support was set to 0.03 for figure readability, and 45 nodes (circle) and 80 edges (line) were inferred. Similar to the dataset with all the IP5, the network consisted of Y02-10/72 (wind turbines with rotational axes in the wind direction) as the center. The Y02E 10/76 (power conversion electric or electronic aspects) and Y02E 10/56 (power conversion systems) codes formed another cluster and were partially converged with Y02E-70/30 (systems combining energy storage with energy generation from non-fossil origins). The onshore wind turbine technology was centered in the convergence network, while offshore wind turbine technology was located outside. It is worth noting that Y02E 10/728 (onshore wind turbines) was more centered than Y02E 10/727 (offshore wind turbines). Also, Y02B-10/30 (integration of renewable energy sources in buildings with wind power), Y02E 10/20 (hydro energy), and Y02P-70/50 (manufacturing or production processes) tended to converge with Y02E 10/72 technology.
4.3. Japan (JPO)
Figure 12 shows the technology convergence network of patent codes from Japan (JPO). The minimum support was set to 0.02 for figure readability, and 42 nodes (circle) and 74 edges (line) were inferred. Similar to the US, the network consisted of Y02E 10/72 (wind turbines with rotational axes in the wind direction) as the center, and the power-conversion-technology-related patent codes, such as Y02E 10/76 and Y02E 10/56, made up another independent cluster partially converging with Y02E-70/30 (systems combining energy storage with energy generation from non-fossil origins). Particularly, the Y02E 10/727 (offshore) and Y02E 10/728 (onshore) technologies appeared with a similar frequency. Furthermore, Y02B-10/30 technology converged with Y02E 10/728 (onshore) and Y02E 10/74 (wind turbines with rotational axes perpendicular to the wind direction). Also, Y02P-70/50 (manufacturing or production processes) and Y02P-80/10 (efficient use of energy, e.g., using compressed air or pressurized fluid as energy carrier) technologies tended to converge with wind power technology.
4.4. European Union (EPO)
Figure 13 shows the technology convergence network of patent codes from the European Union (EPO). The minimum support was set to 0.03 for figure readability, and 43 nodes (circle) and 61 edges (line) were inferred. Similar to the dataset with all the IP5, the network consisted of Y02E 10/72 (wind turbines with rotational axes in the wind direction) as the center, but the cluster of power-conversion-related technologies was smaller than other major countries. Thus, the network seemed to be more centralized for Y02E 10/72 technology. The Y02E 10/727 (offshore) and Y02E 10/728 (onshore) technologies appeared on a similar scale. The product manufacturing, production, and network were centered around inland wind power generation, but it showed a low convergence tendency compared to other major countries. Also, Y02B-10/30 (integration of renewable energy sources in buildings with wind power) and Y02E-70/30 (systems combining energy storage with energy generation from non-fossil origins) tended to converge with wind power technology.
4.5. South Korea (KIPO)
Figure 14 shows the technology convergence network of patent codes from South Korea (KIPO). The minimum support was set to 0.02 for figure readability, and 41 nodes (circle) and 54 edges (line) were inferred. Similar to the dataset with all the IP5, the network consisted of Y02E 10/72 (wind turbines with rotational axes in the wind direction) as the center. However, the technology cluster structure was different from the other major countries. The Y02E 10/74 (wind turbines with rotational axes perpendicular to the wind direction) technology formed an independent cluster. The Y02E 10/727 (offshore wind turbines) technology constructed a larger cluster than Y02E 10/728 (onshore wind turbines) technology (Ocean, Small, Peninsula). Also, Y02P-70/50 (manufacturing or production processes) tended to converge with Y02E 10/72 technology. Particularly, in the KIPO patents, the convergence network of wind power technology did not converge with other technologies in CPC patent codes, except for Y02P-70/50.
4.6. China (SIPO)
Figure 15 shows the technology convergence network of patent codes from China (SIPO). The minimum support was set to 0.02 for figure readability, and 40 nodes (circle) and 54 edges (line) were inferred. Similar to the dataset with all the IP5, the network consisted of Y02E 10/72 (wind turbines with rotational axes in the wind direction) as the center. The power-conversion-technology-related patent codes, such as Y02E 10/76 and Y02E 10/56, made up another independent cluster partially converging with Y02E-70/30 (systems combining energy storage with energy generation from non-fossil origins). In contrast to South Korea, the Y02E 10/728 (onshore wind turbines) technology constructed a larger cluster than Y02E 10/727 (offshore wind turbines) technology. It is worth noting that the energy sources of wind power in building technology (Y02B-10/30) converged with onshore wind turbines with photovoltaic energy technology (Y02E 10/50). Also, Y02E 10/74 (wind turbines with rotational axes perpendicular to the wind direction) and Y02P-70/50 (manufacturing or production processes) tended to converge with Y02E 10/72 technology.
5. Conclusions and Future Study
This study focused on figuring out the status of wind power technology by analyzing patents that have CPC codes related to wind power energy from IP5 countries and how the technologies converged for each country. Given 57,689 registered patents from 2010 to 2021, basic statistical analysis and association analysis were performed to infer the status of wind power technology. As a result, some notable conclusions were drawn as follows.
From 2010 to 2019, wind power patents were registered at a number of 5000 per year. Among the registered patents, the SIPO had the highest, with 48% of patents registered, followed by the USPTO at 20%, EPO at 17%, KIPO at 7%, and JPO at 8%. From 2013 to 2015, the trend of patent registration showed a rather low trend, but since 2016, it has shown a continuous increase. Looking at the nationality of patent applicants, the SIPO, KIPO, and EPO had more than 70% of their patents, but the JPO and USPTO showed a more multinational tendency with less than 70% of nationals.
From the results of the technology convergence networks from Figure 11, Figure 12, Figure 13, Figure 14 and Figure 15, there were some notable characteristics to consider for each country, as summarized in Table 4.
Table 4.
Technology convergence characteristics for each IP5 country.
- (1)
- In terms of technology convergence, it was different when the country was focused on onshore or offshore wind turbines. In Japan and Europe, both sites were considered at a similar scale. The United States and China were more focused on onshore wind turbines than offshore, while Korea was more focused on offshore wind turbines than onshore. This is reasonable considering that the geological characteristics are different for each country. The United States and China have great inland conditions for installing wind turbines due to their large land area. Although Korea has a small land size, the fact that it is a peninsula surrounded by the sea on three sides makes it advantageous to utilize offshore wind turbines.
- (2)
- The technology convergence networks of some countries, such as the United States, Japan, and China, showed large power conversion technology clusters, while Europe and Korea showed medium- and small-sized clusters, respectively. In the cases of the United States and China, the distance between states is far, so the demand for large power conversion technology is expected to be high; because Japan uses a simple national network, it is thought that the power grid was enlarged.
- (3)
- There were also differences regarding whether each country integrated building and wind power energy or not. Japan and China showed medium-sized building integration technology nodes that were connected to onshore wind turbine technology. The United States and Europe showed small-sized building integration technology nodes, which were only connected to center node. In Korea, the building integration technology node was absent.
- (4)
- Even though the horizontal axis wind turbine was dominant due to its energy conversion efficiency, the vertical axis (perpendicular to the wind direction) appeared in the technology convergence networks. Korea showed a large-sized vertical wind turbine technology node consisting of an independent cluster, while the node was absent in the technology convergence network of Europe. Other countries, such as the United States, Japan, and China, showed a medium-sized vertical wind turbine technology node.
As a result, this paper has novelties such as (i) a quantitative analysis of global patents in the wind power field over the past 10 years, (ii) a new wind power patent analysis method presented in CPC code format, (iii) CPC codes presented as a network analysis method, (iv) a detailed analysis of five major countries, and (v) the first analysis of technology convergence using three-level indicators. Furthermore, a study on providing insights into the direction of technological development through continuous patent tracking in the wind power field is planned as a future study. In addition, this study limited technology areas to wind-power-energy-related patents to figure out the detailed patterns of technology convergences. As renewable energy is one of the most important keys to achieving carbon neutrality (net zero), other renewable energy resources such as solar, hydro, and geothermal power, could also be analyzed through the procedure performed in this study.
Author Contributions
Conceptualization, M.L. and G.L.; methodology, M.L.; software, K.J.; validation, K.J., M.L. and G.L.; formal analysis, K.J.; investigation, K.J.; resources, K.J.; data curation, K.J.; writing—original draft preparation, M.L.; writing—review and editing, K.J. and M.L.; visualization, M.L. and K.J.; supervision, G.L.; project administration, G.L.; funding acquisition, M.L. All authors have read and agreed to the published version of the manuscript.
Funding
This research received no external funding.
Acknowledgments
This work was supported by the Green Technology Center (R2210501-A study on the net-zero scenario model for technology application in units of space).
Conflicts of Interest
The authors declare no conflict of interest.
References
- International Renewable Energy Agency (IRENA). Offshore Renewables: An Action Agenda for Deployment; International Renewable Energy Agency Publication: Abu Dhabi, United Arab Emirates, 2021. [Google Scholar]
- International Renewable Energy Agency (IRENA). Tracking the Impacts of Innovation: Offshore Wind as a Case Study; International Renewable Energy Agency Publication: Abu Dhabi, United Arab Emirates, 2021. [Google Scholar]
- International Renewable Energy Agency (IRENA). Fostering a Blue Economy: Offshore Renewable Energy; International Renewable Energy Agency Publication: Abu Dhabi, United Arab Emirates, 2020. [Google Scholar]
- Bloomberg New Energy Finance. New Energy Outlook 2021; Bloomberg New Energy Finance Publication: Paris, France, 2021. [Google Scholar]
- Global Wind Energy Council (GWEC). Global Wind Report 2021; Global Wind Energy Council: Brussels, Belgium, 2021. [Google Scholar]
- International Renewable Energy Agency (IRENA). Global Renewables Outlook: Energy Transformation 2020 (Edition: 2020); International Renewable Energy Agency Publication: Abu Dhabi, United Arab Emirates, 2020. [Google Scholar]
- Future Wind. Groundbreaking Ceremony at Future Haliade-X 12 M Prototype Site in Rotterdam. Available online: https://www.futurewind.nl/2019/04/01/ground-breaking-ceremony-at-future-haliade-x-12-mw-prototype-site-in-rotterdam (accessed on 27 March 2022).
- Siemens Gamesa. SG 14-222 DD Offshore Wind Turbine. Available online: https://www.siemensgamesa.com/products-and-services/offshore/wind-turbine-sg-14-222-dd (accessed on 27 March 2022).
- Durakovic, A. Vestas 15 MW Prototype Offshore Wind Turbine to Spin in Denmark. Available online: https://www.offshorewind.biz/2021/10/15/vestas-15-mw-prototype-offshore-wind-turbine-to-spin-in-denmark (accessed on 27 March 2022).
- USTPO; EPO. In Proceedings of the EPO-USTPO 8th Cooperative Patent Classification Annual Meeting with Industry Users; 2019. Available online: https://www.cooperativepatentclassification.org/sites/default/files/attachments/970c93f0-c03f-4cde-a88a-a72bac6b7c2c/CPC+Annual+meeting+with+industry+users+29+March+2021.pdf (accessed on 27 March 2022).
- Kim, G.; Bae, J. A novel approach to forecast promising technology through patent analysis. Technol. Forecast. Soc. Change 2021, 117, 228–237. [Google Scholar] [CrossRef]
- Park, Y.-N.; Lee, Y.-S.; Kim, J.-J.; Lee, T. The structure and knowledge flow of building information modeling based on patent citation network analysis. Autom. Constr. 2018, 87, 215–224. [Google Scholar] [CrossRef]
- Chae, S.; Gim, J. A Study on Trend Analysis of Applicants Based on Patent Classification Systems. Information 2019, 10, 364. [Google Scholar] [CrossRef]
- Altuntas, F.; Gök, M.Ş. Analysis of patent documents with utility mining: A case study of wind energy technology. Kybernetes 2020, 50, 2548–2582. [Google Scholar] [CrossRef]
- Ampornphan, P.; Tongngam, S. Exploring Technology Influencers from Patent Data Using Association Rule Mining and Social Network Analysis. Information 2020, 11, 333. [Google Scholar] [CrossRef]
- Kim, J.-H.; Lee, Y.-G. Progress of Technological Innovation of the United States’ Shale Petroleum Industry Based on Patent Data Association Rules. Sustainability 2020, 12, 6628. [Google Scholar] [CrossRef]
- Al-Maolegi, M.; Arkok, B. An improved apriori algorithm for association rules. Int. J. Nat. Lang. Process. 2014, 3, 21–28. [Google Scholar] [CrossRef]
- Gurmu, S.; Pérez-Sebastián, F. Patents, R&D and lag effects: Evidence from flexible methods for count panel data on manufacturing firms. Empir. Econ. 2008, 35, 507–526. [Google Scholar]
- Wiggins, R.Z.; Piontek, T.; Metric, A. The Lehman Brothers Bankruptcy A: Overview. J. Financ. Cris. 2014, 1, 39–62. [Google Scholar] [CrossRef][Green Version]
- Global Wind Energy Council (GWEC). Global Wind Report 2011; Global Wind Energy Council: Brussels, Belgium, 2011. [Google Scholar]
Publisher’s Note: MDPI stays neutral with regard to jurisdictional claims in published maps and institutional affiliations. |
© 2022 by the authors. Licensee MDPI, Basel, Switzerland. This article is an open access article distributed under the terms and conditions of the Creative Commons Attribution (CC BY) license (https://creativecommons.org/licenses/by/4.0/).