Article

Method of Reduction in Energy Consumption by the Drive Systems of a Mobile Device with a Controlled Gear Ratio

Warsaw University of Technology, Faculty of Mechatronics, św. A. Boboli 8, 02-525 Warsaw, Poland
*
Author to whom correspondence should be addressed.
Energies 2022, 15(7), 2674; https://doi.org/10.3390/en15072674
Submission received: 25 February 2022 / Revised: 30 March 2022 / Accepted: 4 April 2022 / Published: 6 April 2022
(This article belongs to the Special Issue Research on the Optimal Selection of Electromechanical Drives)

Abstract

:
The degree of autonomy of a battery-powered mobile device depends, among others, on the efficient use of energy by the powered devices. Using an example of electric drive systems of an orthotic robot, the authors present a method of reducing the energy demand of these systems by using a gear with a controlled ratio. The gear ratios are selected on the basis of special graphs illustrating the instantaneous energy consumption during drive operations. The simulation studies proved a possibility of achieving energy savings during the implementation of the robotic functions of the robot as high as 50%. The article presents the course and results of the research as well as the concept of their use while designing electric drive systems for mobile devices.

1. Introduction

Among mechatronic devices driven by electric drive systems, those that consume energy from sources of limited capacity, mainly batteries or accumulators, have an increasing share. The progress in the construction of such efficient sources, which we are currently witnessing, resulted in the fact that device designers use battery power not only in situations where there is no electricity in the immediate vicinity but also when it is only the convenience of using the device that is at stake. One of the basic problems connected with the use of batteries is the need to replenish the energy stored in them [1], which often involves a necessity to put the device out of use for a certain period of time. A spectacular example of striving to increase the capacity of electric energy sources is the development of batteries for electric vehicles [2], resulting in an increase in the range of traffic of these vehicles so that they can replace the currently dominant cars with internal combustion engines. Modern lithium-ion batteries have a capacity of up to 130 Wh/kg and can withstand even thousands of charging cycles [3]. A typical structure of a battery-powered device is shown in Figure 1.
Efficient energy sources are the basic solution to the problem of the autonomy of battery-powered devices; however, they are not the only one. In addition to the works related to the construction of these sources, parallel efforts can be placed into ensuring the fact that electrically driven systems perform their functions while consuming as little energy from the batteries supplying them as possible. Examples of such an approach can be found in the available literature [4,5,6,7,8,9]. The research described in this article is based on this approach. The authors’ participated in a four-year “ECO-Mobility” program, under which they developed a construction of an orthotic robot powered by a battery set and placed it into operation [10] (Figure 2). The task of orthotic robots is to replace the motor activities of people with disabled legs [11,12,13]. The designed robot performs the basic motor functions of patients: walking on a flat surface, climbing and descending stairs, as well as getting up and down. The electric drives of the individual joints draw the necessary energy from the cells placed in a special backpack carried by the user. If we know the actual demand for electric power of functional modules of the device, then the time T0 during which the robot will operate properly without a need to charge the battery can be calculated from the following formula
T o = E b P c + P a + P s ,
where Eb is the capacity of the battery set (J); Pc is the average power demand of the central and local controllers (W); Pa is the average power demand of actuators (W); and Ps is the average power demand of the measuring systems (W).
In the case of devices used for movement generation, actuators have the largest share in the balance of power drawn from the battery. In the presented robot, it amounts to more than 90% of the average consumption, which results from the power of the drive systems amounting to more than 400 W, whereas the power necessary to supply controllers and measuring systems does not exceed 20 W. For this reason, when trying to reduce this consumption, it is worth dealing with the actuators in the first place. During the work on the orthotic robot, a special simulation model of the actuators of the robot was used for this purpose.

2. Materials and Methods

2.1. Simulation Research of the Robot

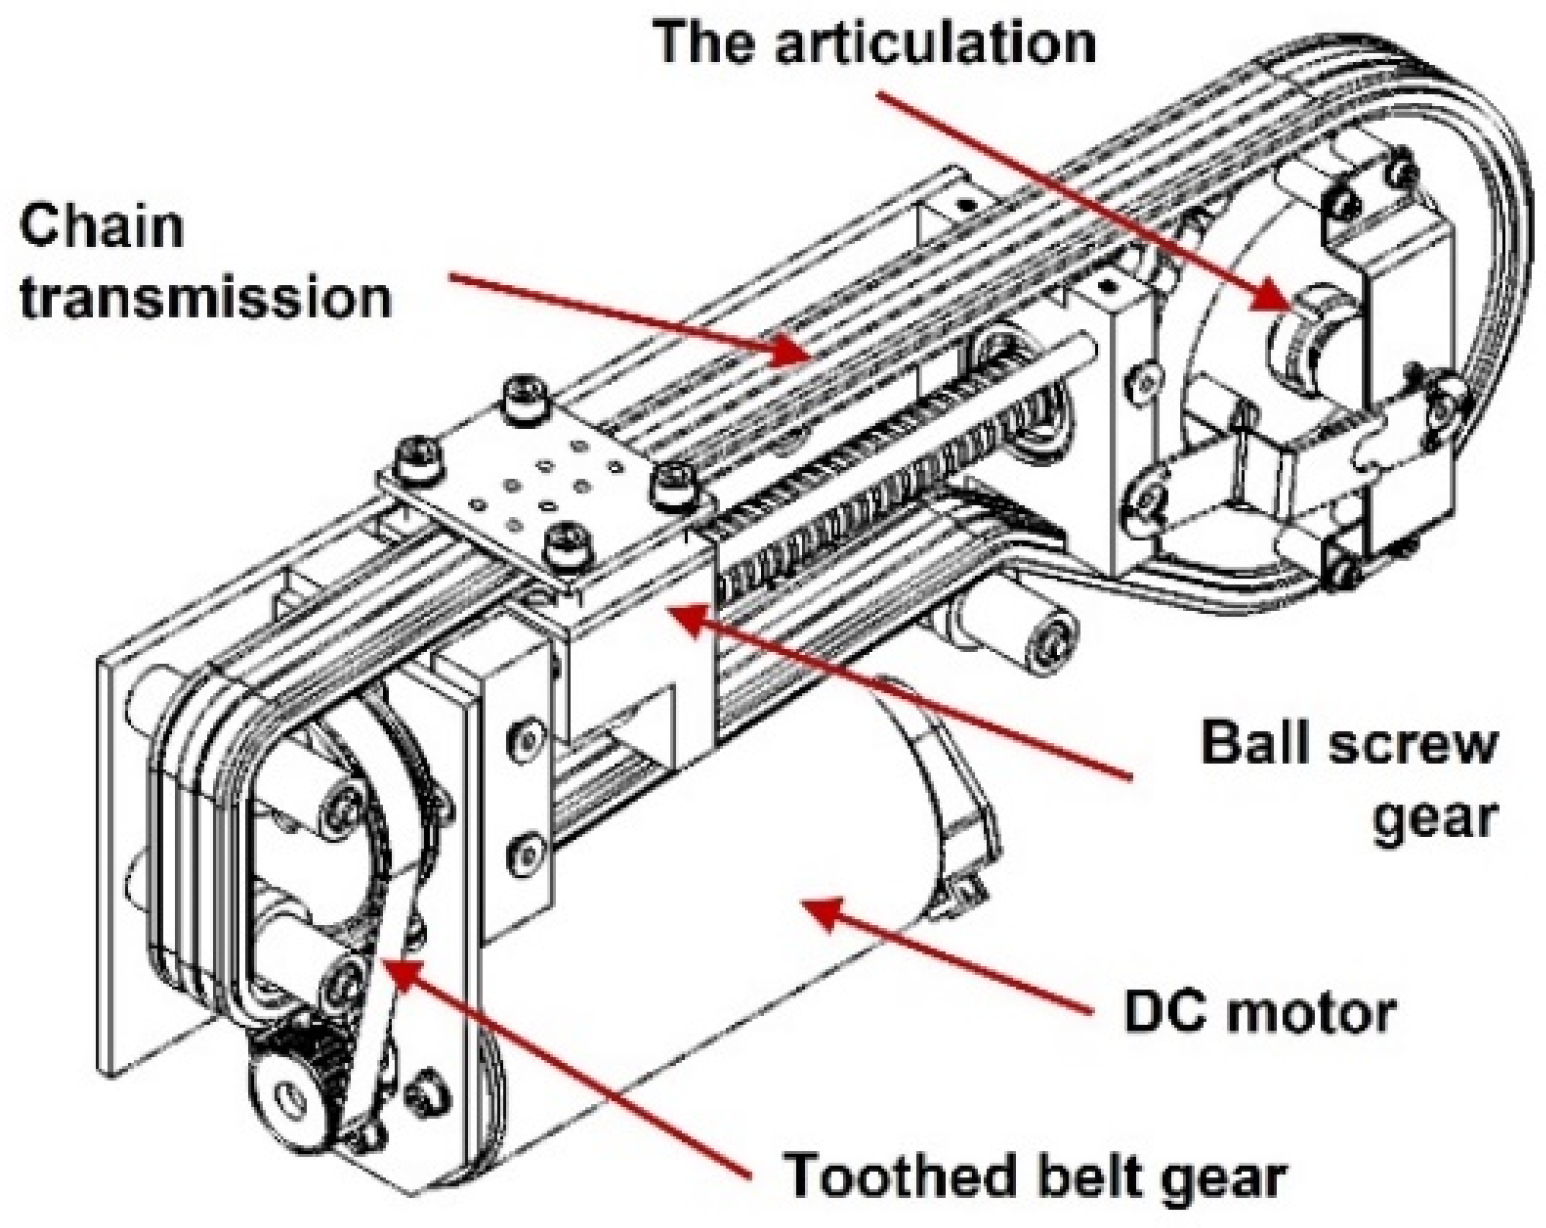
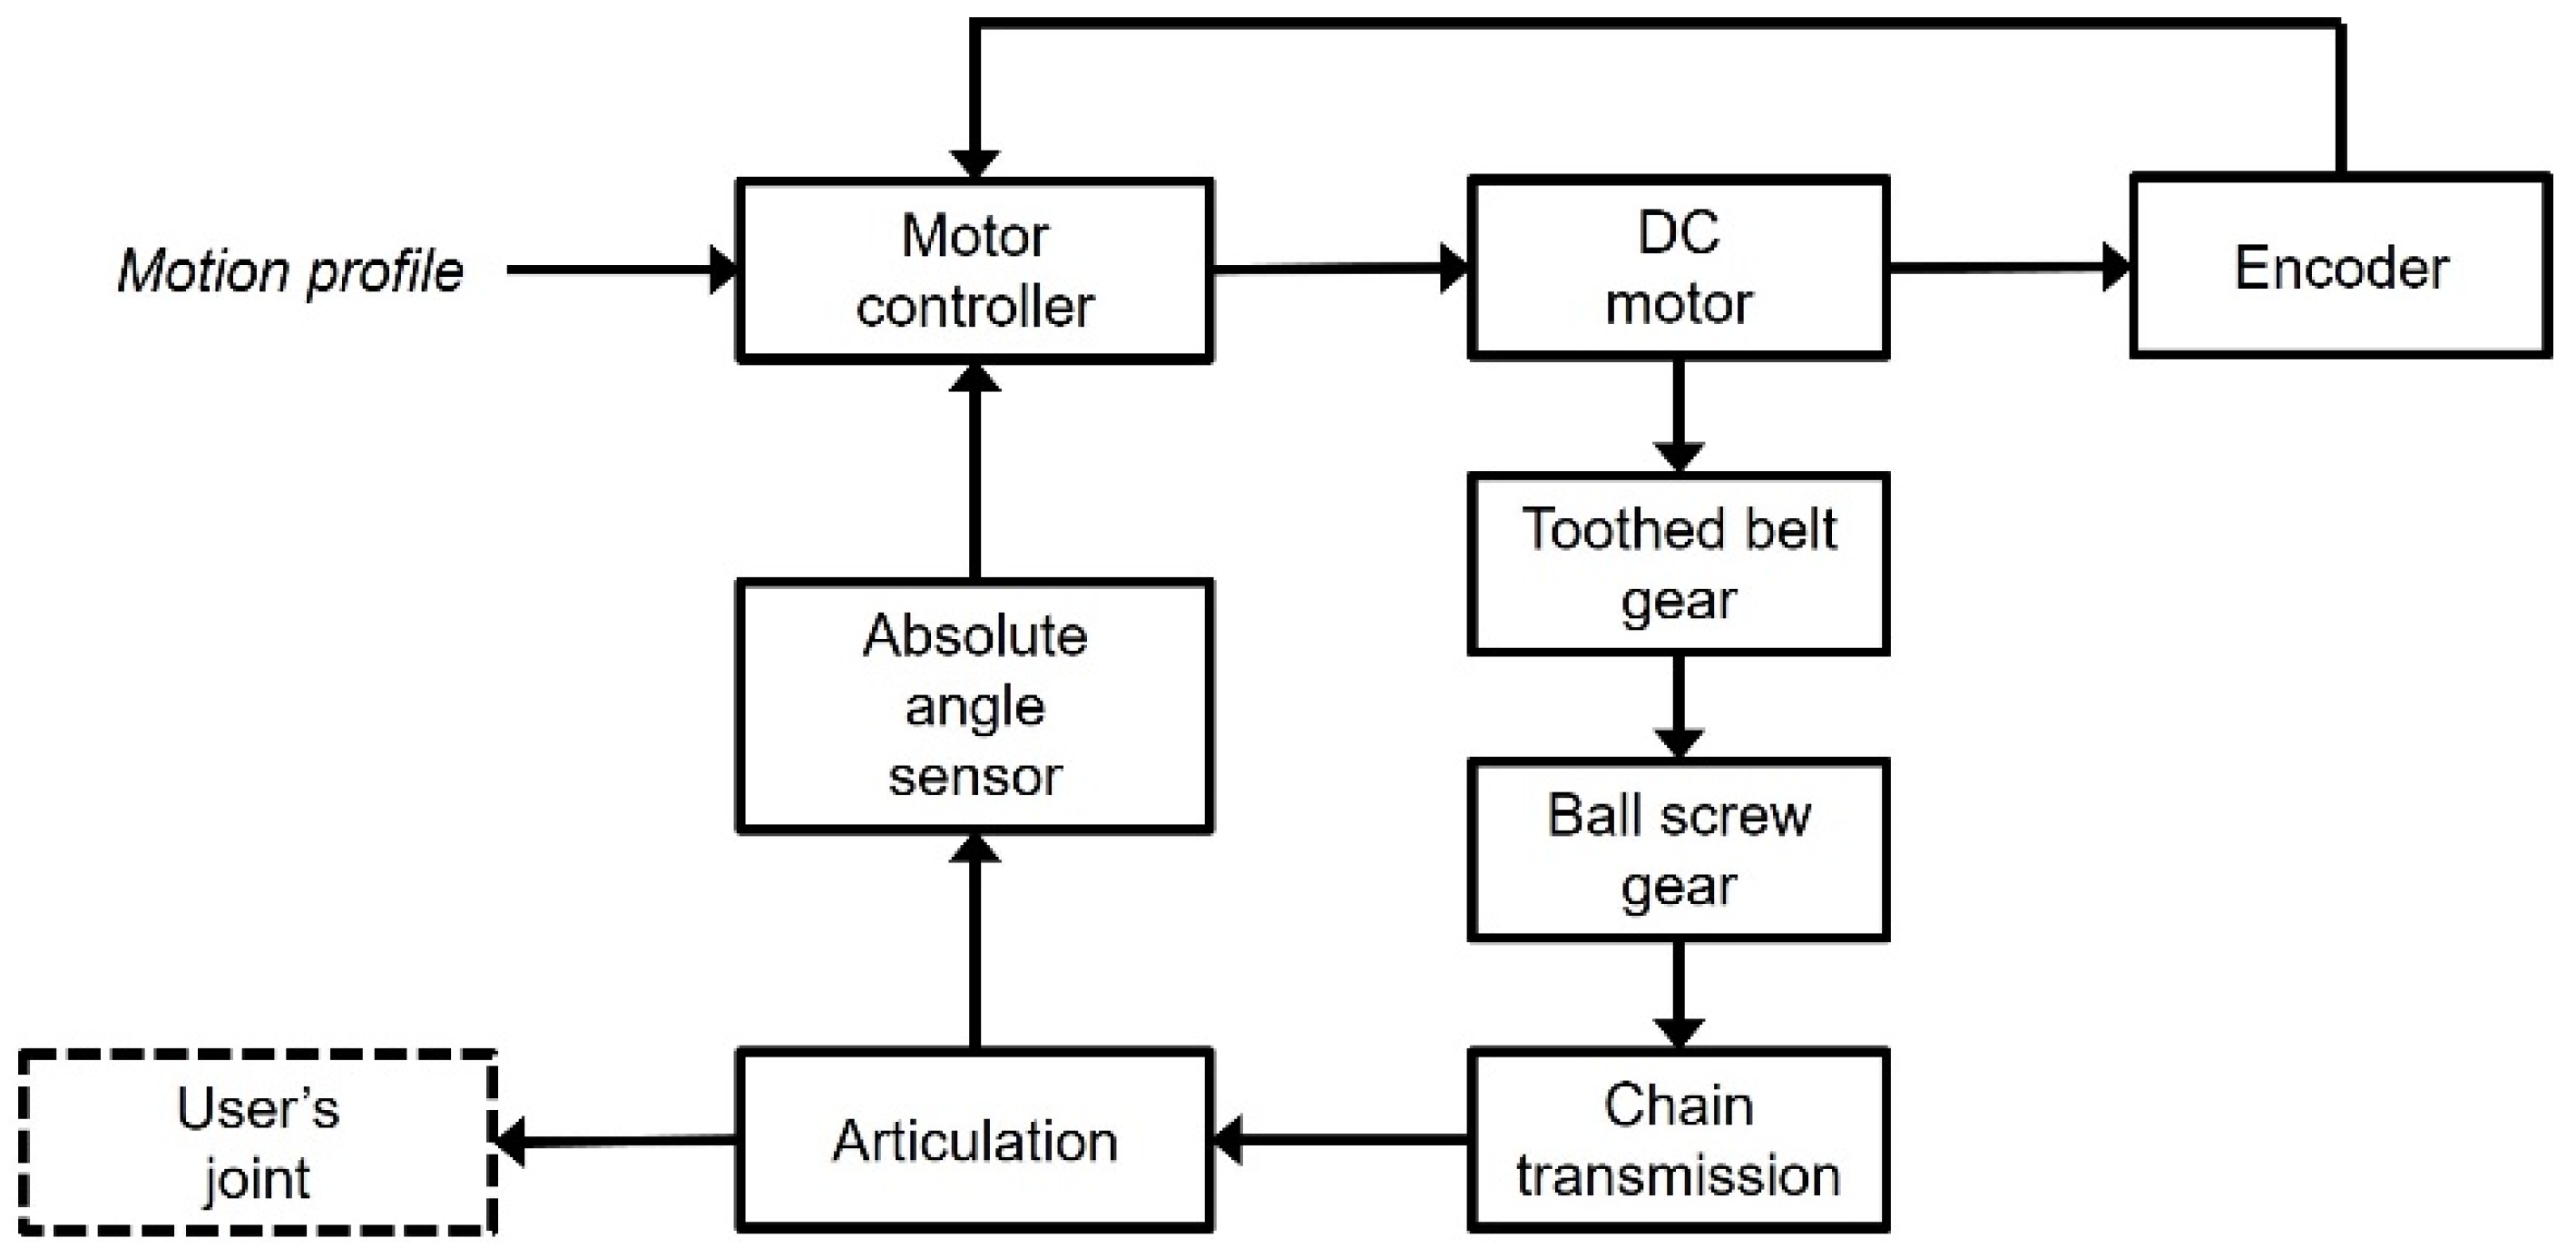
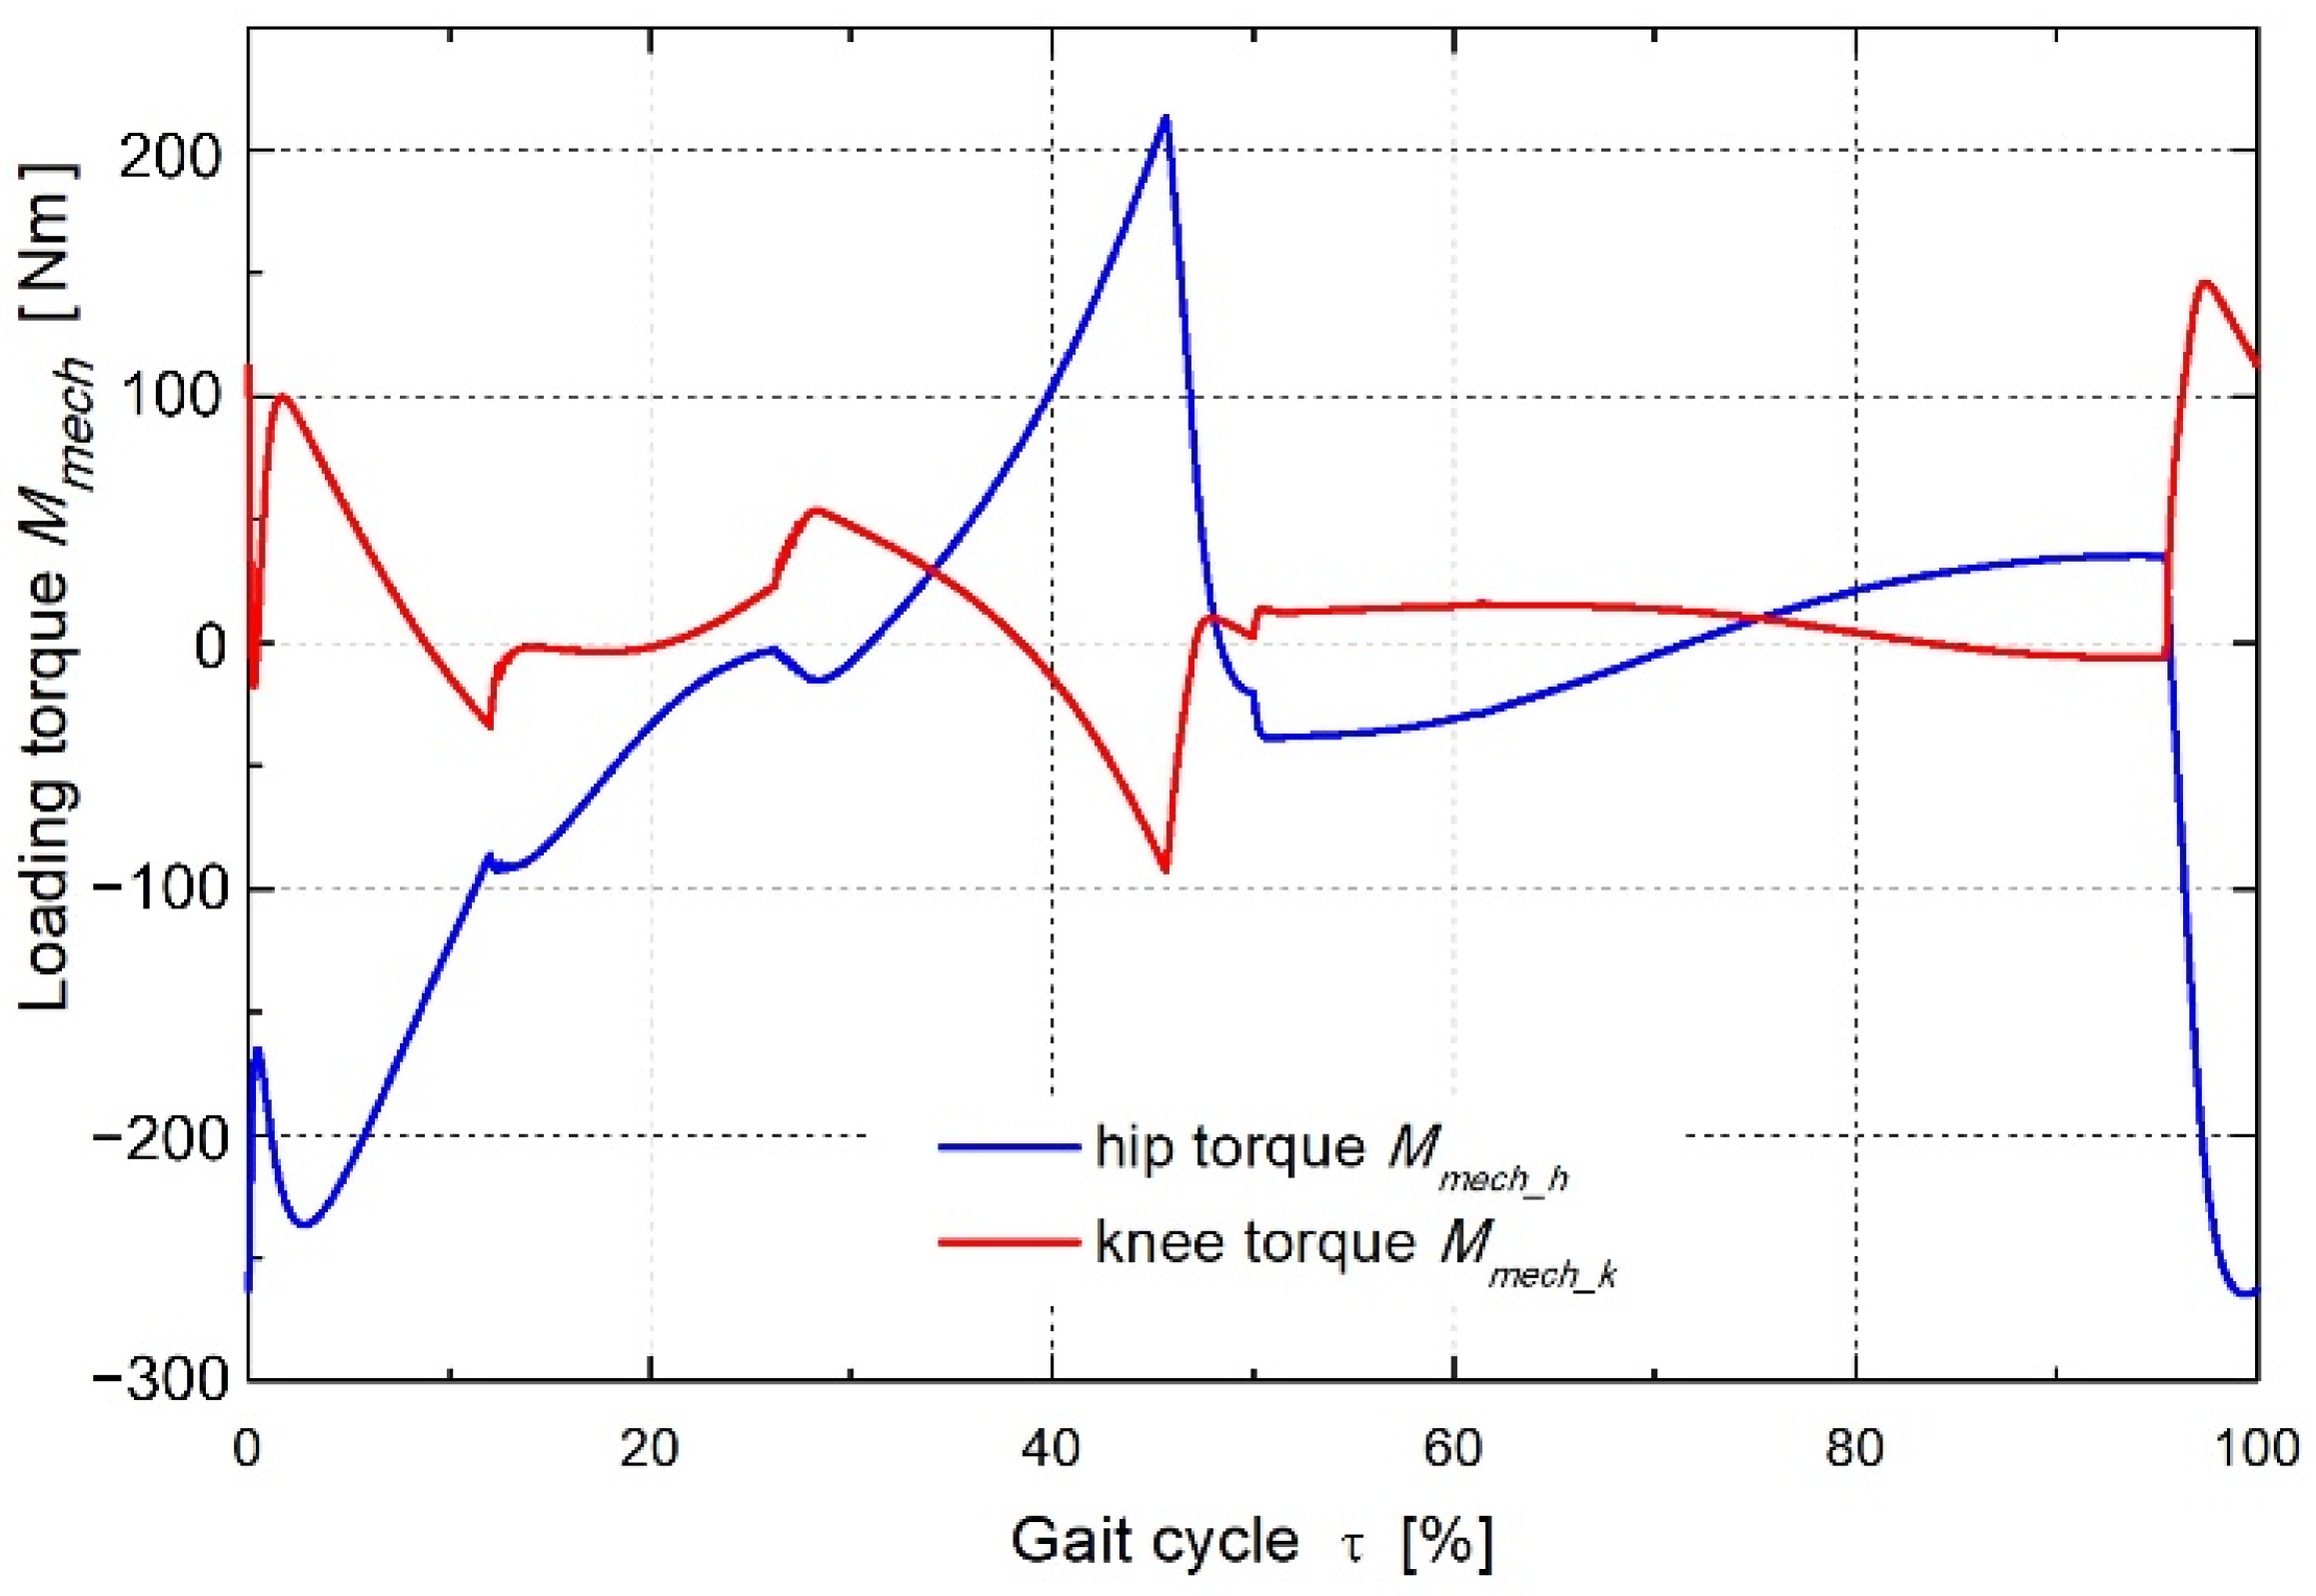
2.1.1. Model of the Robot

The structure of the model is shown in Figure 3. The MATLAB/Simulink package was used as the basic modelling tool. The key to the description of the mechanical structure of the orthotic robot was the use of the SimMechanics software, which enables modelling multi-body mechanical structures, especially the user’s body. The reference signals for the control systems are the courses of the joints angles based on the so-called standard of human gait (Figure 4). In the biomechanical literature, these courses are presented in the conventional domain of the so-called gait or stride cycle τ (%) [14], and they are calculated as follows:
τ = t T c · 100 % ,
where t is the current time (s), and Tc is the gait cycle length (s).
The robot is equipped with four identical drive systems to move the hip and knee joints of a disabled person [15]. The design of the drive system according to [16] is shown in Figure 5, and its functional block diagram is shown in Figure 6. The Dunkermotoren GR63Sx55 DC motor with a maximum power of 130 W drives the ball screw gear via a toothed belt transmission. The screw gear nut moves linearly and displaces the cable, which causes the driven joint to rotate. The total ratio of the gears used is equal ip = 167.
Modelling drive systems was based on the principle of reducing mechanical loads with respect to the electric drive device. The sources of active and passive loads are the driven elements of the mechanical structure of the robot together with the parts of the user’s body moved by them. Drive models implement motion profiles developed on the basis of experimental data [17]. Classic formulas were used to describe the drive transmission units:
M r e d = M m e c h η g i g
ω m e c h = ω m i g ,
in which ig denotes the gear ratio, Mred denotes the load torque reduced to the motor shaft, Mmech denotes the torque required to drive the joint, ηg denotes gear efficiency, ωmech. denotes the angular speed at the joint, and ωm denotes angular speed of the motor, assuming constant values of the gear ratio and gear efficiency. Due to complexity of the loads of drive systems, both the motor and generator works of the drive motor occur. In the first case, the transmission is a reducer; in the second, it is a multiplier. Therefore, the efficiency values are changed depending on the type of motor operation in the model.

2.1.2. Simulation Research

The described model made it possible to perform research on the influence of various factors on the functional and operational characteristics of the device. A particularly important topic of this research was to check how these factors affect the energy consumption of the actuators during the implementation of the basic functions of the robot. In this way, inter alia, the dependence of energy demands the following investigated items: selected physical characteristics of users, parameters of the gait performed by the device, and, above all, on selected design features of electric robot drive systems [17]. These experiments revealed the ranges of occurrence of different modes of operation of driving motors during the implementation of orthotic robot functions, particularly the gait function. Figure 7 shows the course of the moment loading the robot’s hip joint obtained by simulating a walk with a cycle length of 3 s. The course of the angular velocity at this joint is shown in Figure 8, and the instantaneous mechanical power is calculated as follows in Figure 9.
P m e c h = M m e c h · ω m e c h ,
The characteristics of the mechanical power show that, in some phases of the robot motion, the drive motor performs motor work, and in others—generator work. When the speed and torque signs match each other, then we are dealing with motor work (power greater than zero); when the signs of the torque and speed are different, the motor is driven by external forces: both static (due to the weight of the driven limbs) and dynamic. Then, it works as a generator or a brake.
Figure 9 shows the areas of motor operation of the drive motor on the diagram of mechanical power. The simulation tests presented below concerned only those parts of the joint movement in which the motor operated in the motor mode, excluding the parts of operation as the generator. This limitation was dictated by the greater reliability of the controller model for this type of work. Subsequently, it was found that for established walking algorithms appropriate for the health and physical condition of a given individual, the parameters of their drive systems have the greatest impact on the energy consumption of the actuators. Figure 10 shows the dependence of electric energy consumed by the drive system of the hip joint during one gait cycle for two drive systems with different parameters of the motors used. The method of calculating energy in a single gait cycle is explained by the following formula:
E 1 = 0 T c P 1 d t = 0 T c u ( t ) i ( t ) d t  
where u denotes the instantaneous value of the control voltage, i denotes the instantaneous value of the current intensity, and Tc denotes the length of the walking cycle. The tests were carried out for the total gear ratios ig of the reduction gear in the range from 100 to 700. The obtained curves showed the possibility of reducing energy consumption by selecting an appropriate gear ratio.

2.2. Calculation of Electrical Energy Drawn from the Source

The results of the research motivated the authors to consider the use of gears with a variable, controlled ratio in the drive systems. Strongly variable courses of torque and speed at the driven joints were observed (Figure 11), indicating the occurrence of both motor and generator operations of the drives, and they were analysed.
During the work on the drive system with a variable ratio, an attempt was made to develop a method that allows such values of the ratio to be selected where minimization of energy consumption by the system is ensured. Starting from Formula (6) for electric energy E1 absorbed by the drive from the source it was decided to derive a relationship making the value of the energy consumed dependent on the gear ratio. For this purpose, the voltage calculated from the static equation of voltages in DC motor was substituted into Formula (6):
u ( t ) = K E ω m ( t ) + R t i ( t )
where ωm denotes the angular speed of the motor, KE denotes back EMF constant, and Rt denotes winding resistance and current i necessary to develop the required torque:
i ( t ) = M m e c h ( t ) i g η g λ K T
where Mmech denotes the value of the torque loading the given joint, KT denotes the torque constant of the motor, ηg denotes gear efficiency, and λ denotes the exponent that determines the influence of efficiency on the reduction in the load in the relationship between the motor torque and the loading torque.
λ = { 1   when   M m M m e c h > 0 1   when   M m M m e c h < 0 .
The speed of the motor is calculated on the basis of the required speed ωmech at the joint.
ω m = ω m e c h i g .
In this way, the instantaneous electric power drawn by the motor from the source is given by the following formula:
P 1 ( i g ,   t ) = 1 K T ( R t M m e c h ( t ) 2 i g 2 η g λ 2 + ω m e c h ( t ) M m e c h ( t ) K E η g λ ) ,
and the energy consumed in the gait cycle.
E 1 ( i g ,   t ) = 1 K T 0 T c ( R t M m e c h ( t ) 2 i g 2 η g 2 λ + ω m e c h ( t ) M m e c h ( t ) K E η g λ ) d t .
The efficiency of the gear depends on the number of its stages and, therefore, indirectly on its ratio. For the purposes of the conducted research, it was assumed that this quantity is linearly dependent on the ratio.
η g = 0.000134 i g + 0.901 .
The coefficients in the above dependence were determined on the basis of analysing catalogue transmission data [18,19].
In order to determine the time courses of the values of Mmech and ωmech, simulation experiments were carried out in which the robot imitated the movements of the user’s limbs during walking. The gait cycle period was 3.8 s—for step length l = 0.4 m and 6 s for step length l = 0.7 m. In this way, it was ensured that a constant forward speed during walking was maintained in both cases. The temporal responses of the torque, angular velocity, and required instantaneous mechanical power at the knee and hip joints were determined. Figure 12 shows the courses of moments loading the hip and knee joints, obtained as a result of simulations for 0.4 m step length, while Figure 13 shows the corresponding torque courses for 0.7 m step length.
The courses of the required angular velocity at the driven joints for both step lengths are shown in Figure 14 and Figure 15.

3. Results

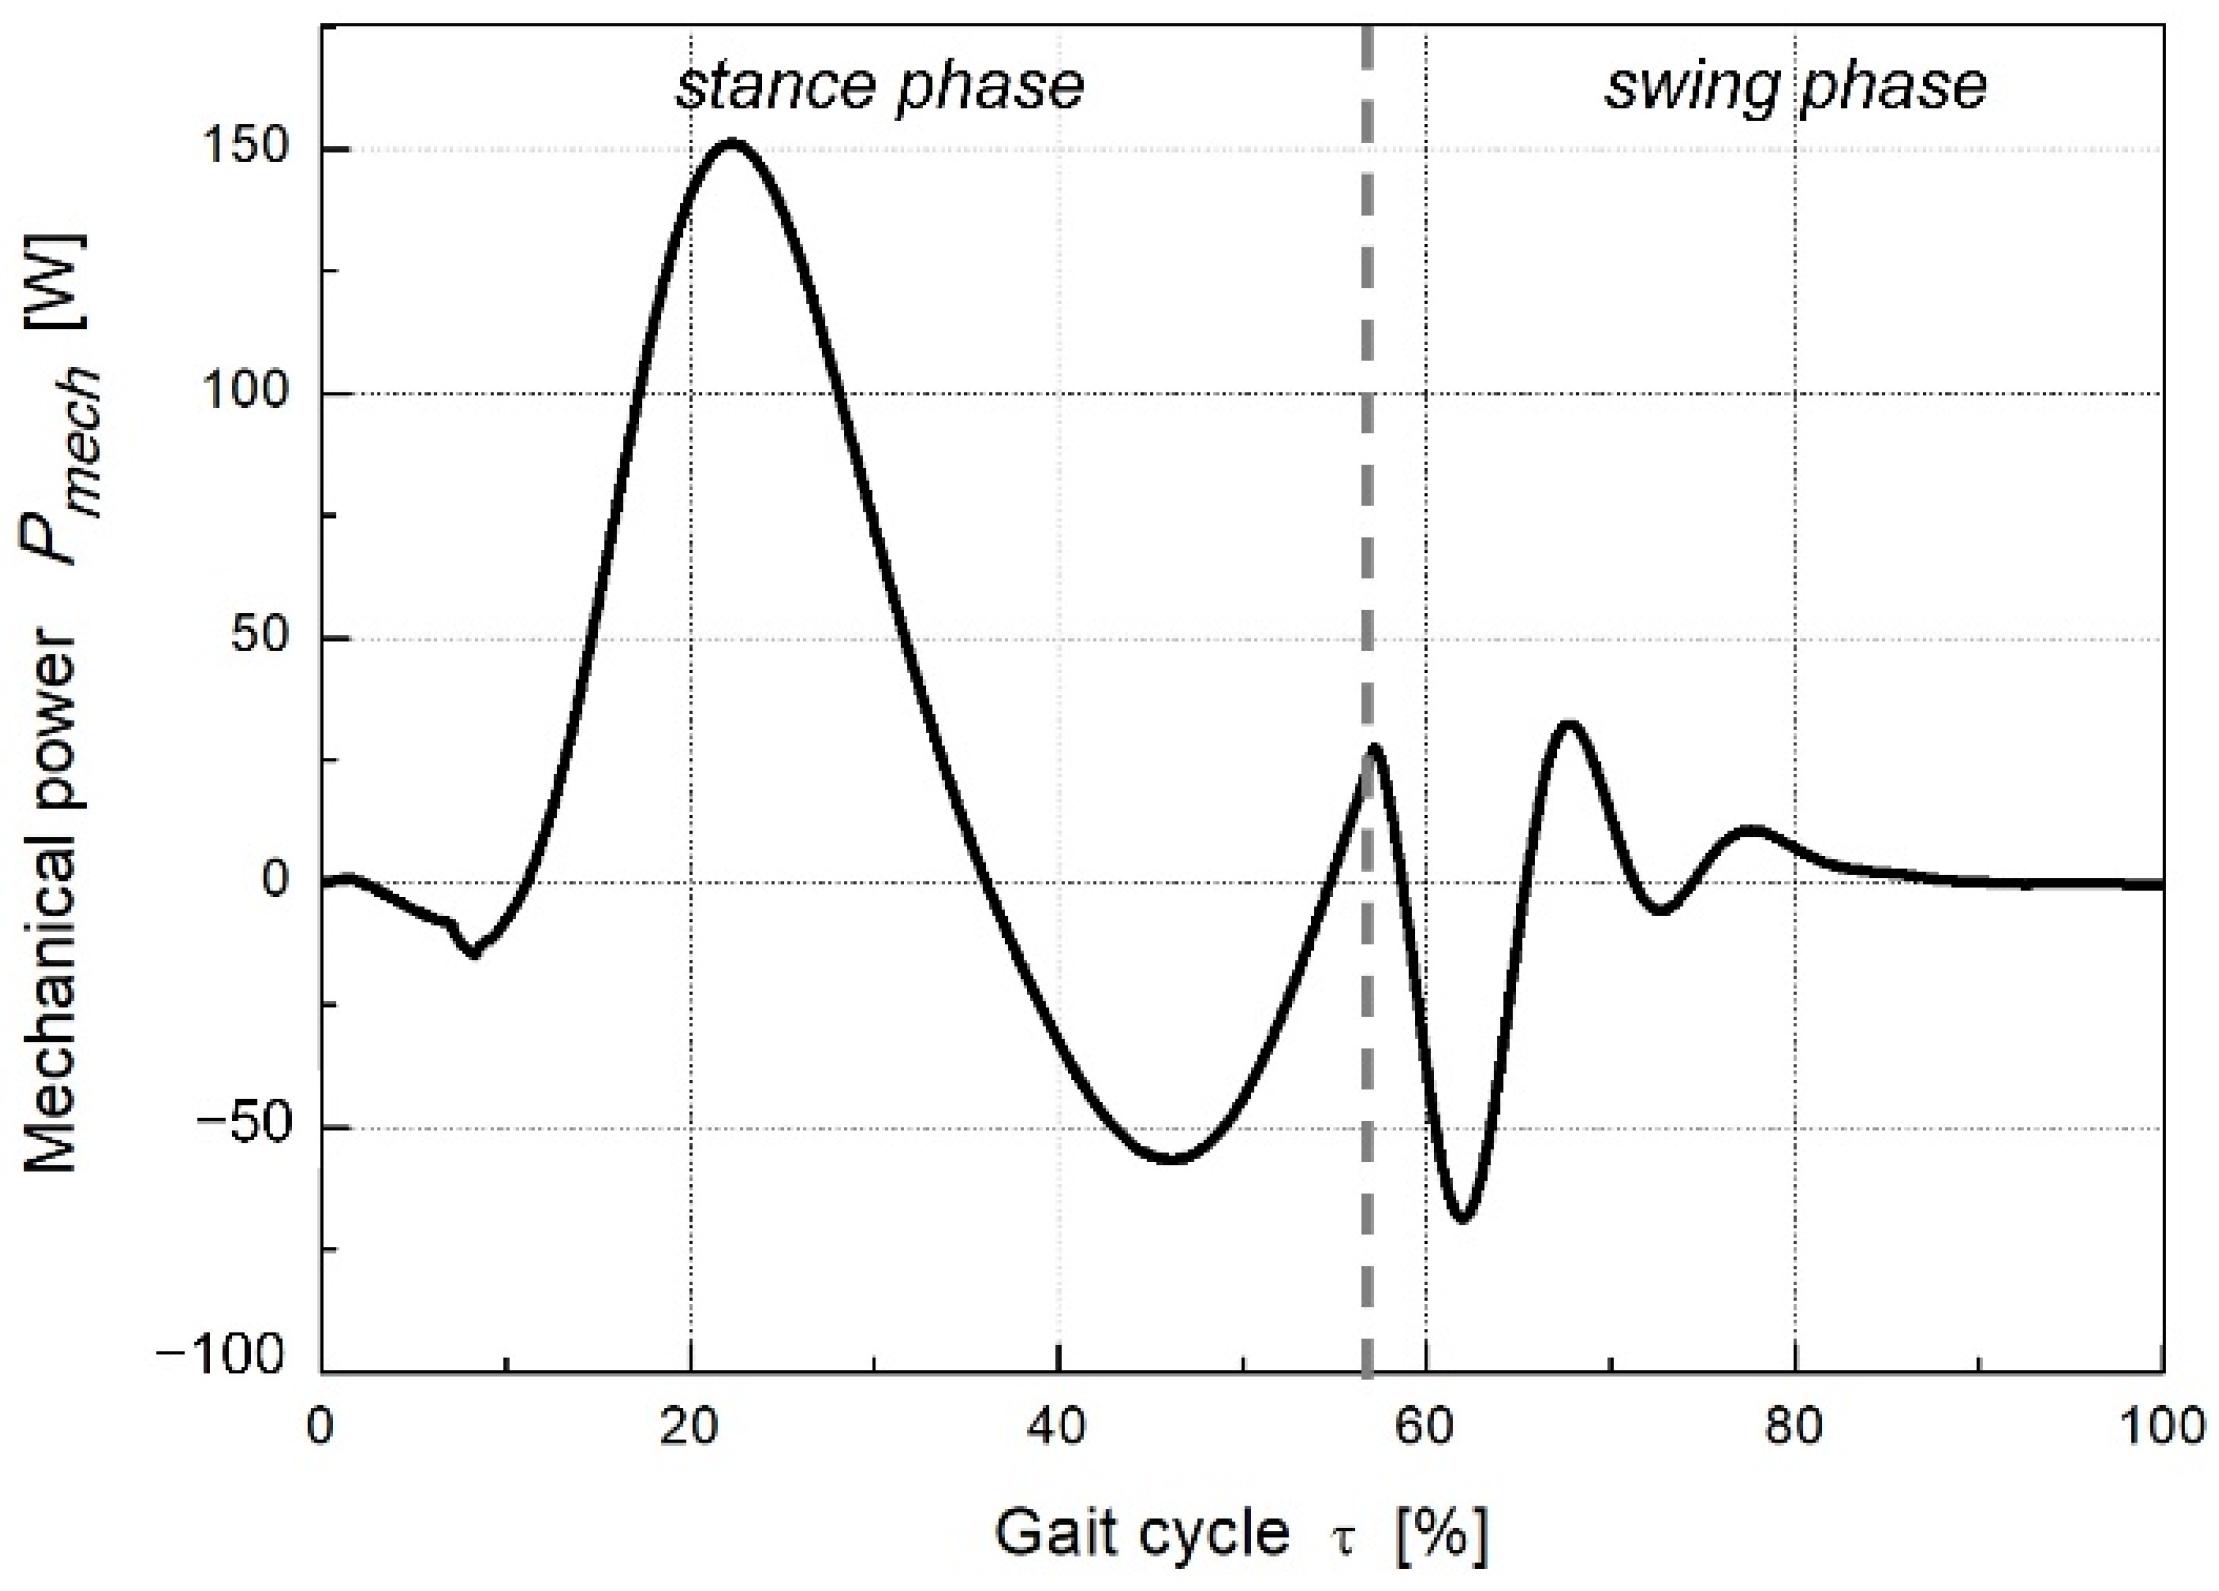
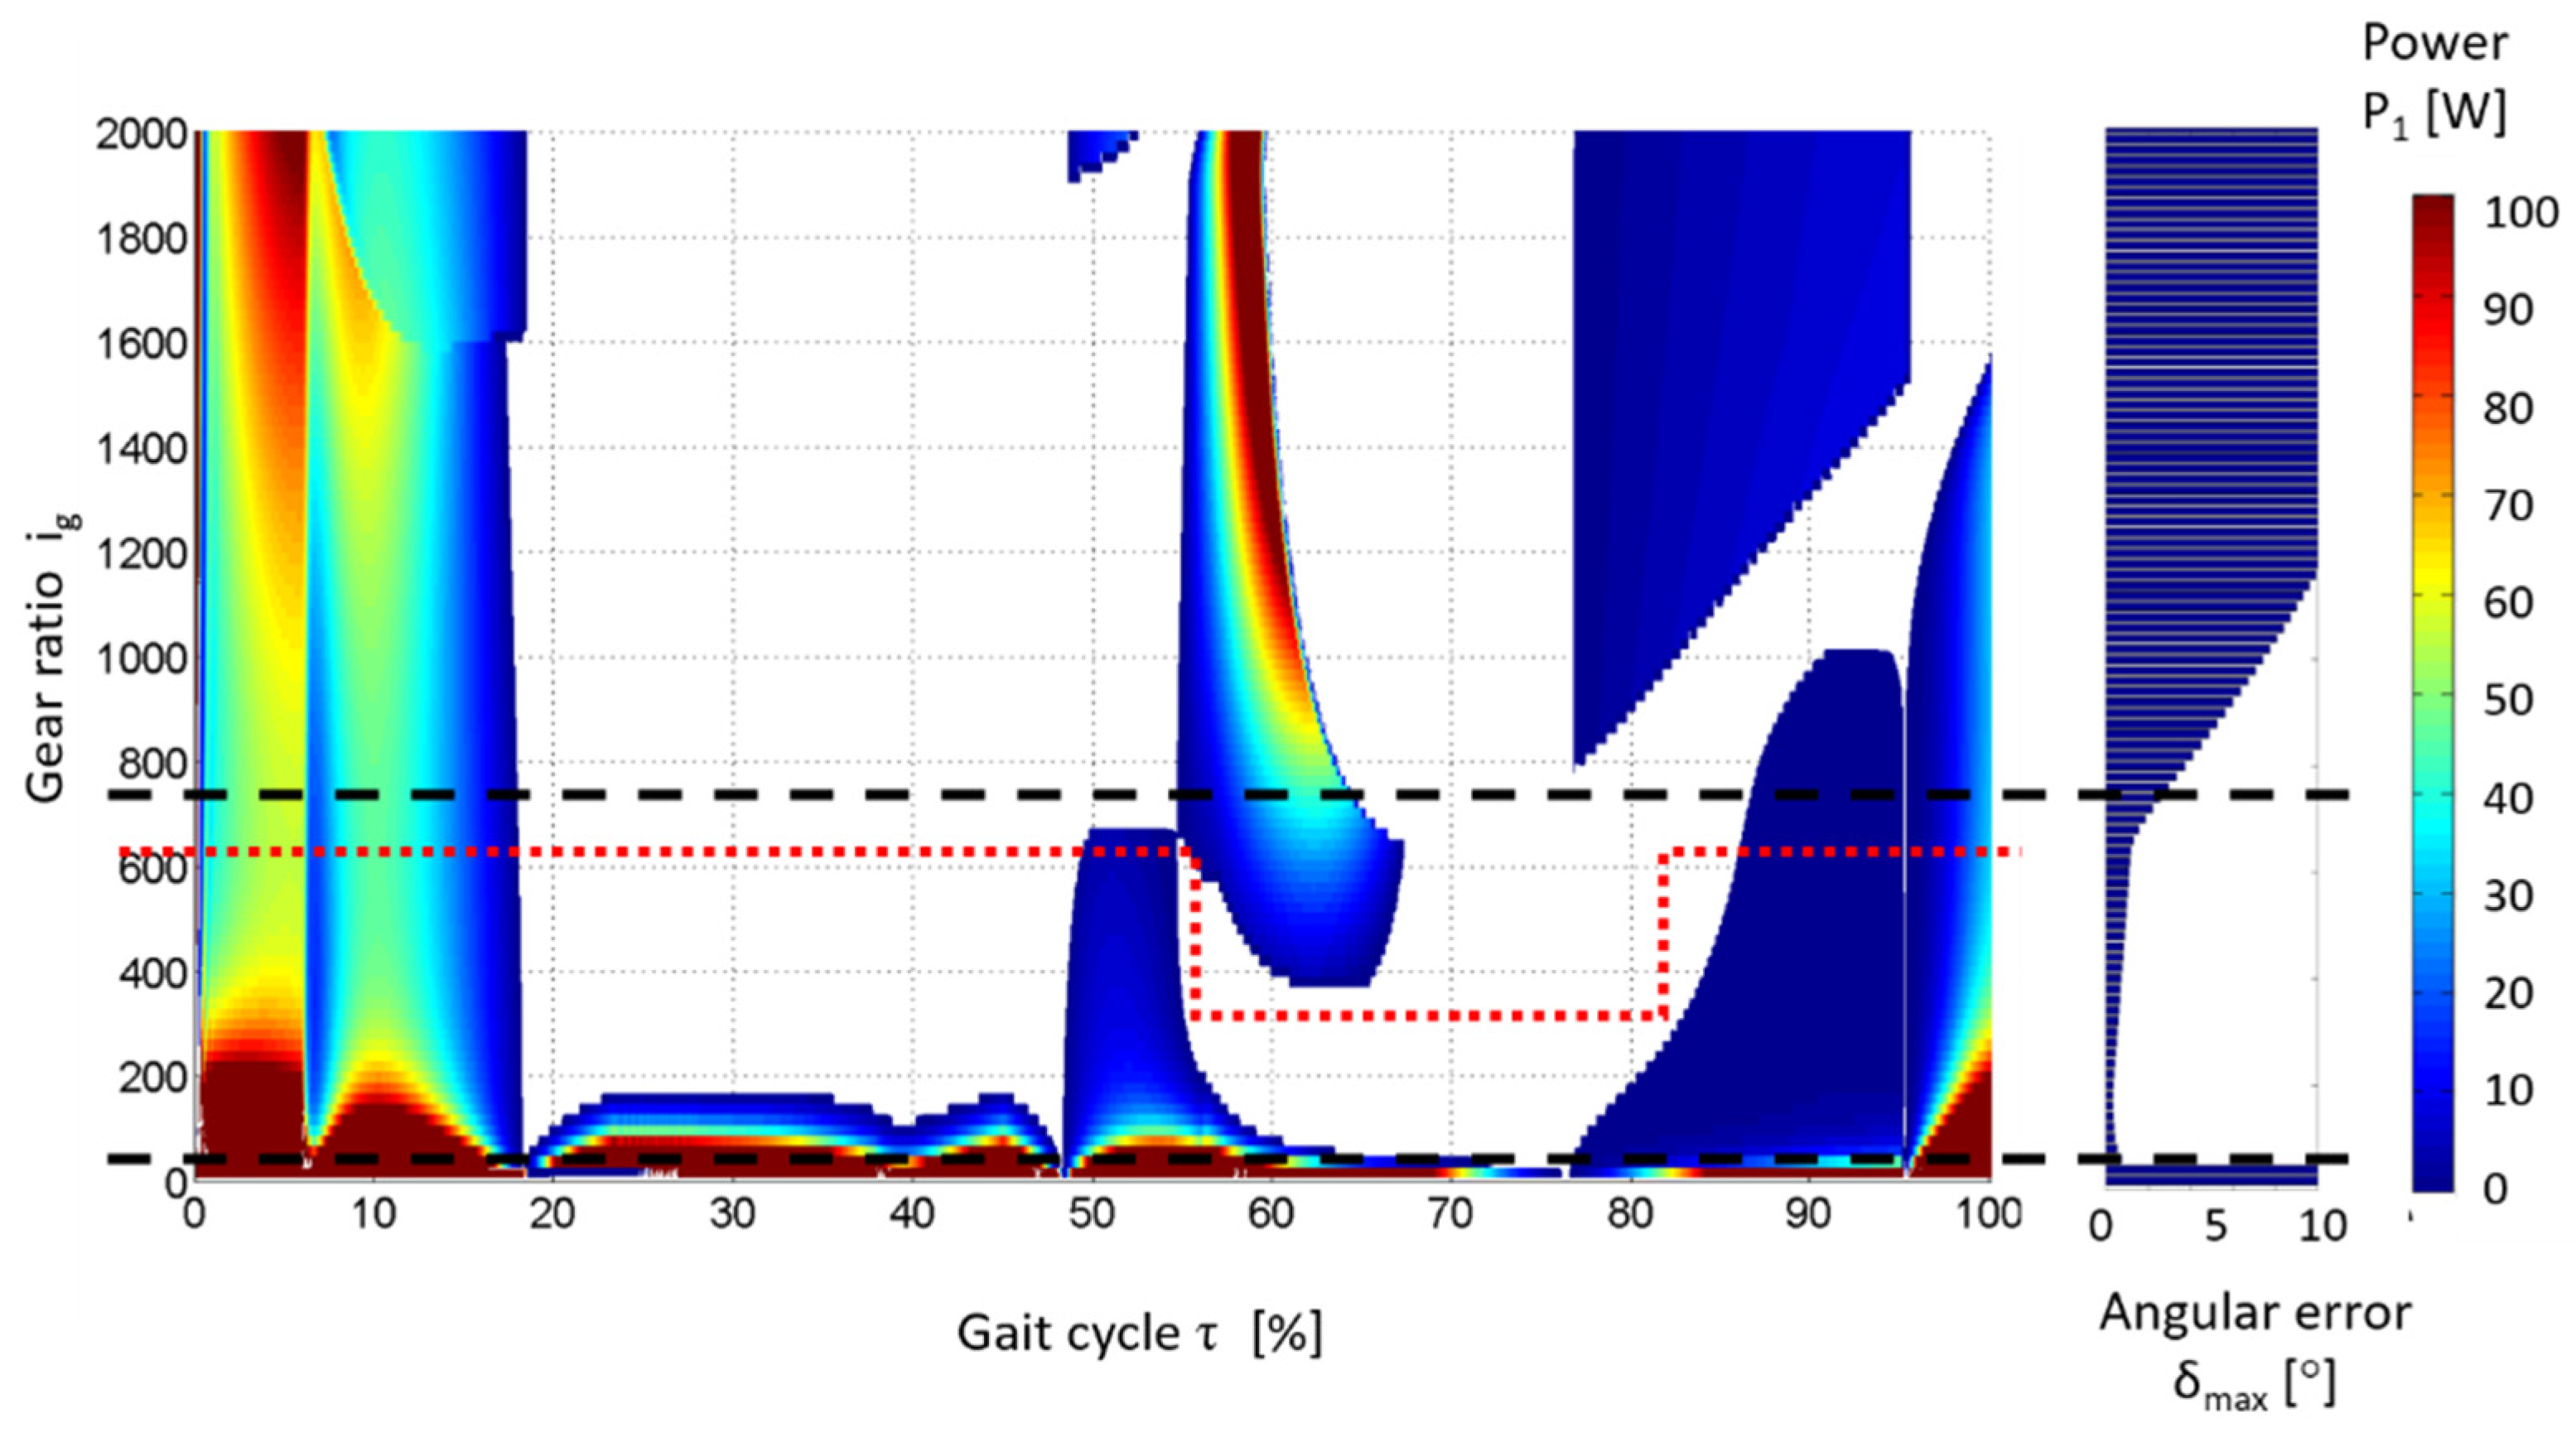
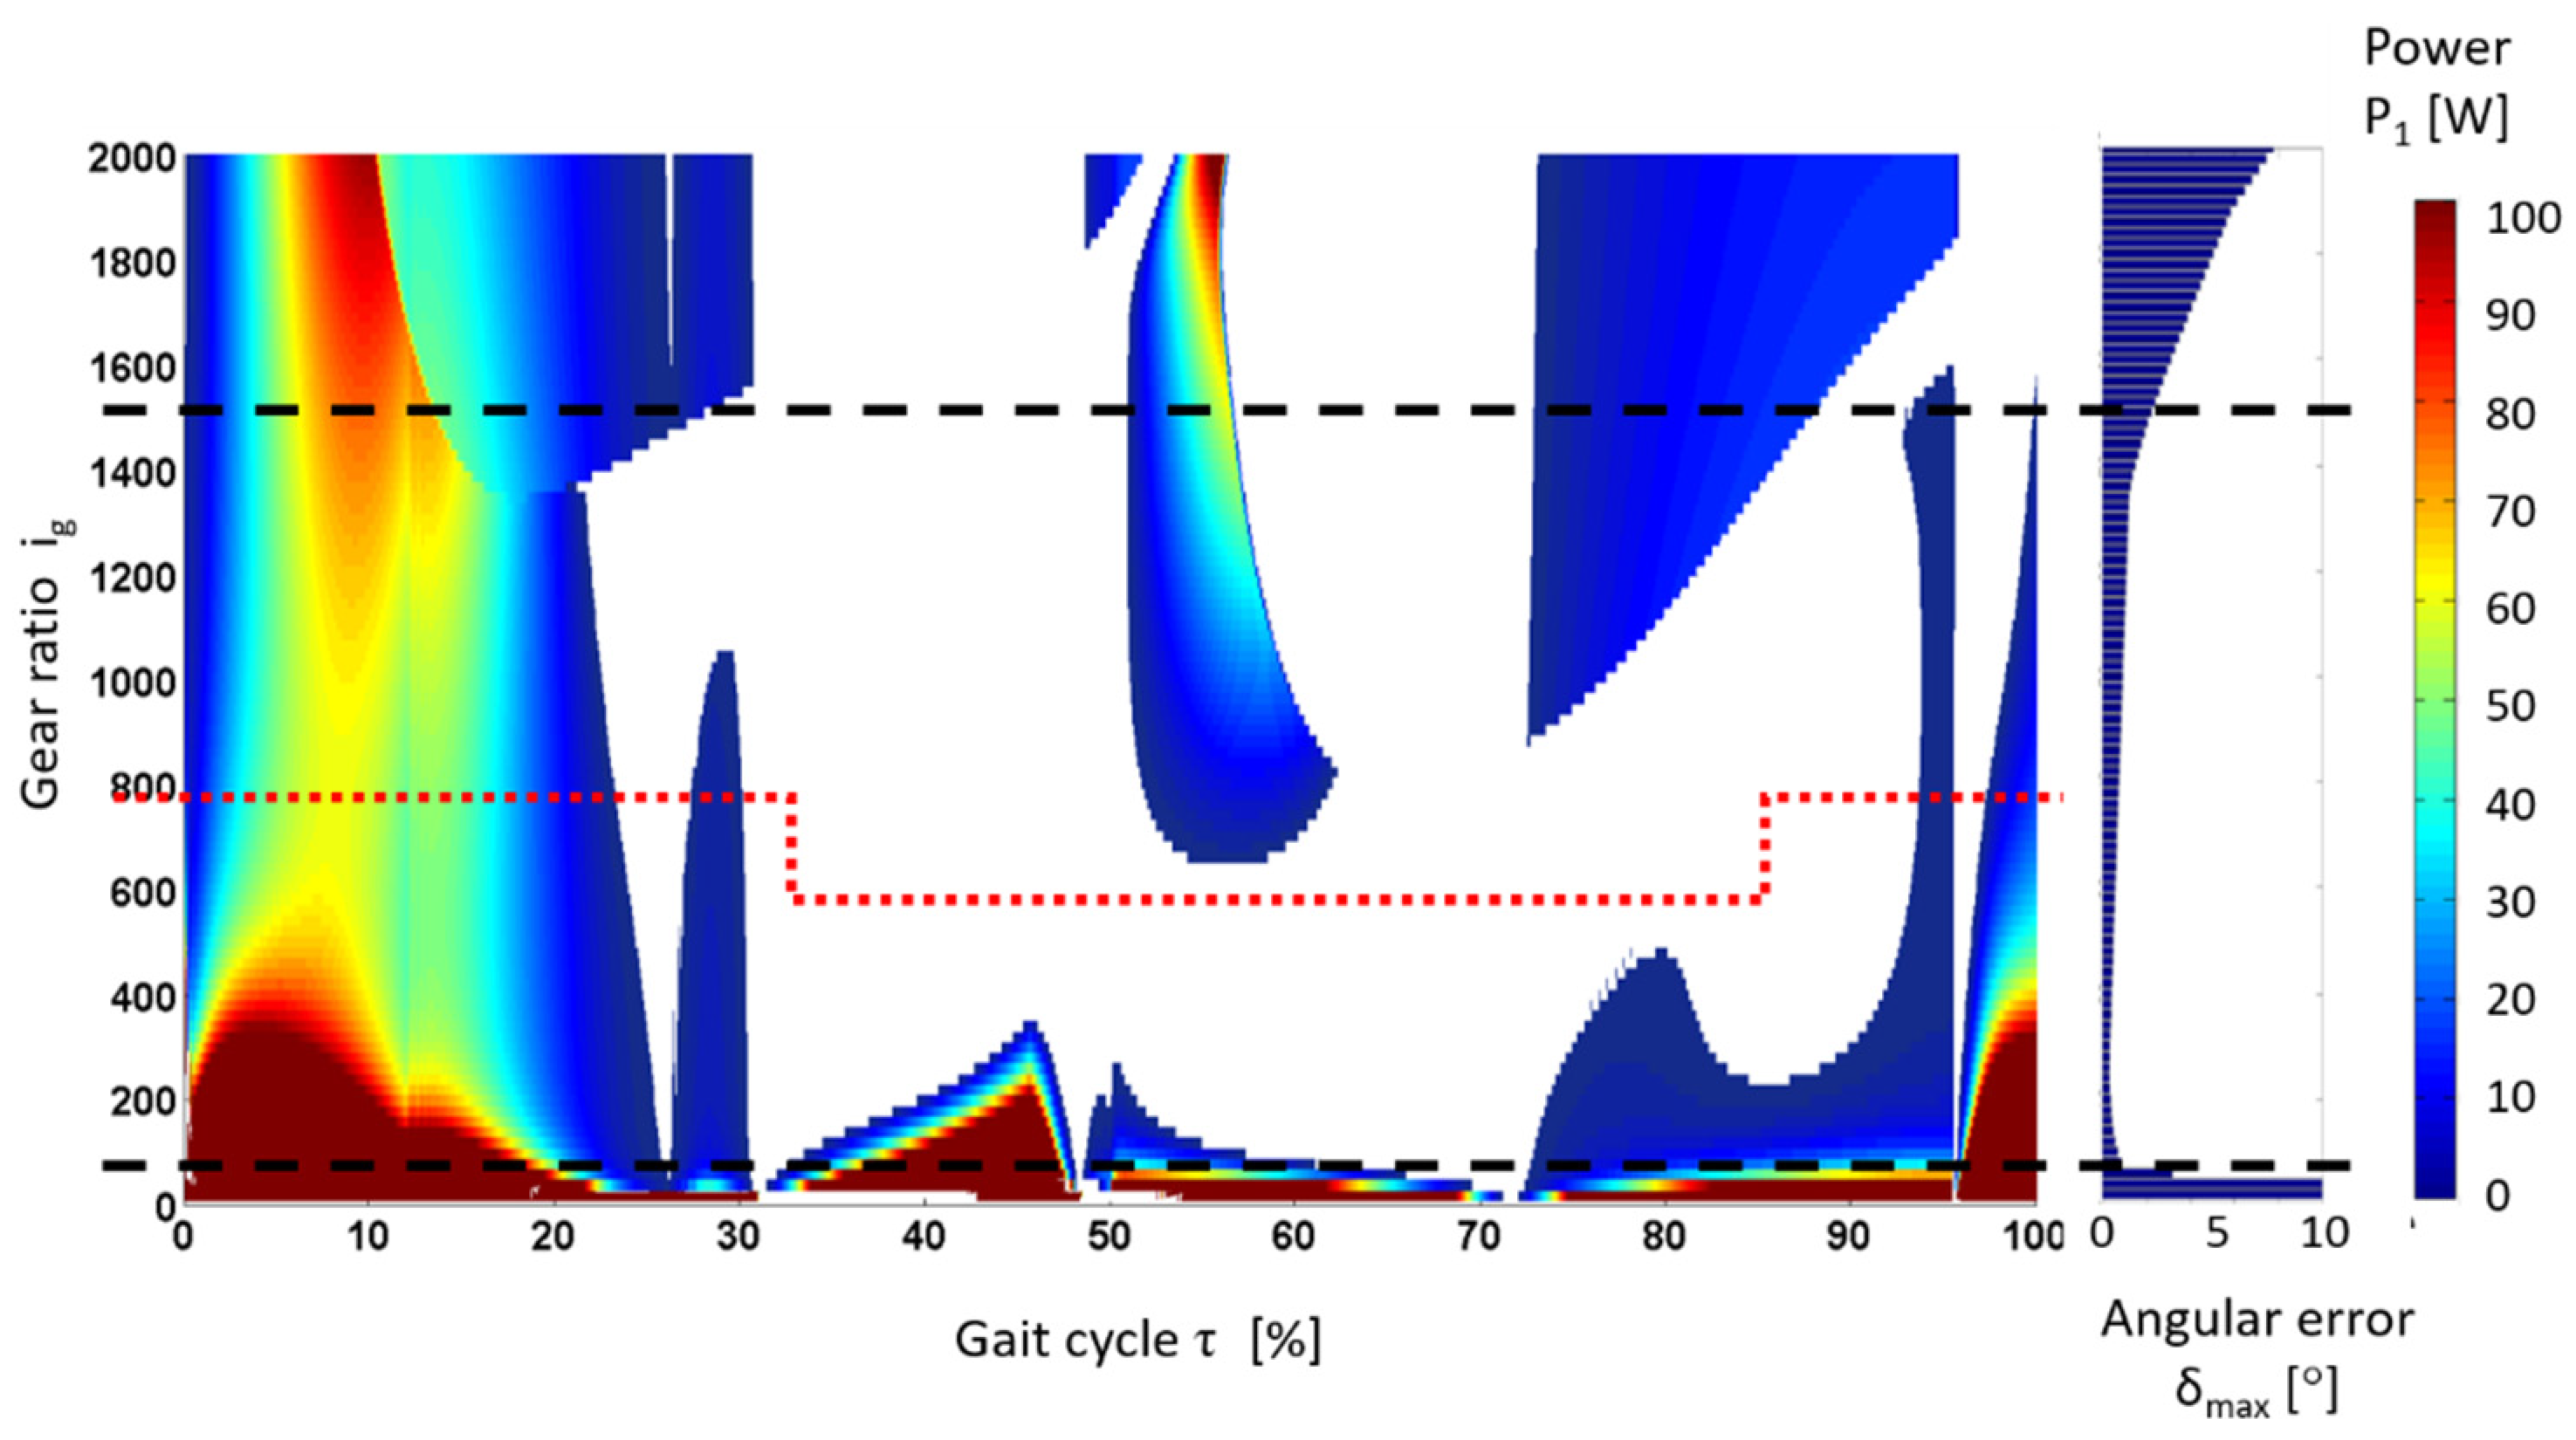
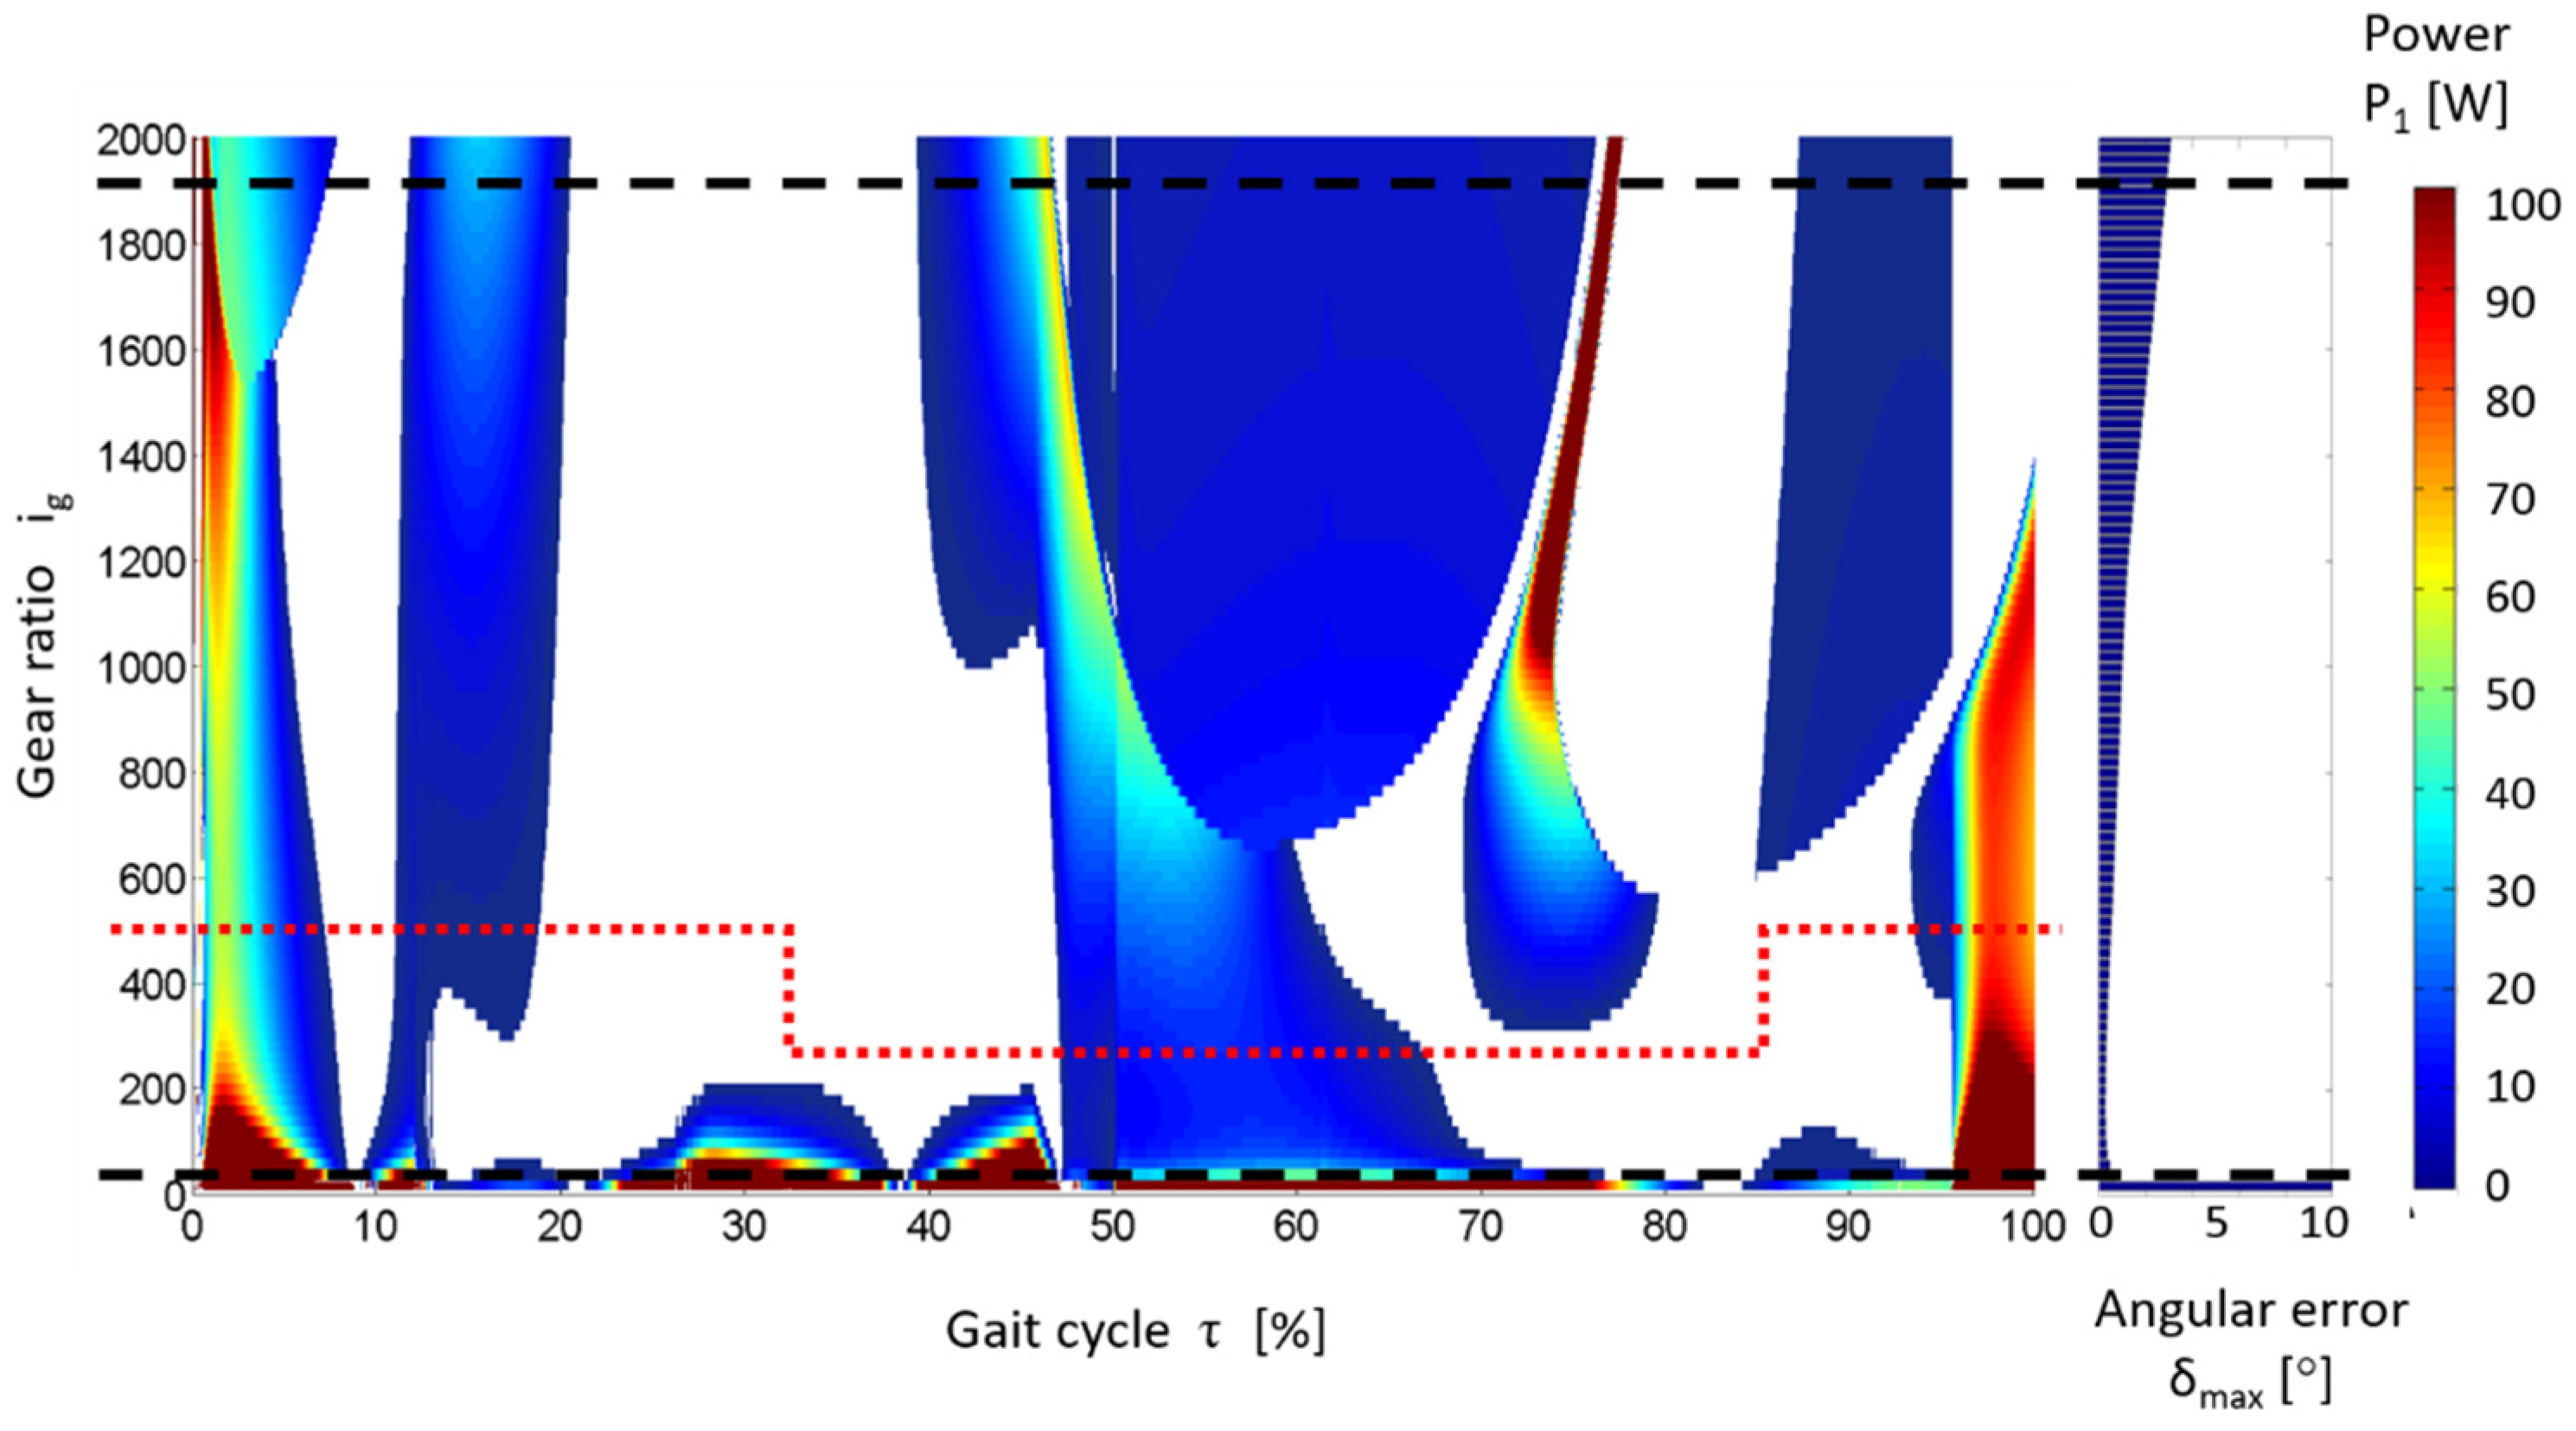
3.1. Determination of the Characteristics of the Consumed Power

For gear ratios in the range of ig = (10, 2000), simulation experiments were carried out in which the instantaneous electric power consumed by the driving motors of the hip and knee joints was calculated. Additionally, the maximum angular errors were determined in the experiments for each of the joints:
δ m a x = max | ( α c a l c α s e t ) | .
as the maximum absolute difference between the calculated value of the joint angle αcalc(t) and its reference value αset(t). Figure 16, Figure 17, Figure 18 and Figure 19 show a graphical illustration of the obtained results in the form of time courses of the power consumed by the drive systems for individual gear ratios and the maximum errors in mapping the motion as a function of the gear ratio. All plots are shown in the normalised time domain of τ as in Equation (2).

3.2. Development of Proposals for Changes in the Ratio

The coloured areas in the graphs indicate the motor operation of the drive motors at the power consumption possessing values specified by the legend. White areas indicate the generator operation of the motors. The additional graphs on the right show the motion profile mapping errors that increase with increasing gear ratio. These plots are the basis for proposing such gear ratios where the drive systems work at the lowest possible energy consumption from the source while executing the gait function by the robot (maintaining at the same time the acceptable accuracy of motion) and where the duration of the operation as a generator is possibly long. In order to simplify the initial simulation work on the drive system with a variable gear ratio, it was assumed that, during the gait cycle, the gear ratio would be changed only twice according to the following formula:
i g = { i g 1   for   t T c [ τ 1 ; τ 2 ] i g 2   for   t T c [ 0 ; τ 1 ) ( τ 2 ; 100 ]
where ig denotes the current gear ratio, ig1 denotes the first gear ratio, ig2 denotes the second gear ratio, t denotes time, and Tc denotes the period of the gait cycle. In addition, it was assumed that the drive system allows only two values of gear ratios to be set, and their change takes place abruptly at certain moments of the gait cycle. Limiting the number of gear ratios to only two allows proposing a relatively light and small gear design so that it has a slight effect on the increase in weight and dimensions of the drive. Another problem associated with the operation of this transmission is the risk of discontinuity in the transmission of the drive torque which must be solved, for example, by using friction clutches. Gear ratios for which the following profile error values:
δ m a x > 3 ° .
were not taken into account in the selection. In the graphs of energy demand (Figure 16, Figure 17, Figure 18 and Figure 19), black dashed lines mark the area of gear ratios that meet the requirement for the accurate reconstruction of given angular profiles. The graphs were analysed in terms of indicating the gear ratios ensuring the longest possible periods of operation in the generator area and minimum energy consumption in the motor area. In the case of a 0.4 m step at the hip joint, the following gear ratios were found to be the most effective in terms of energy saving:
i g h = { 300   for   τ c [ 55 ; 82 ] % 620   for   τ c [ 0 ; 55 ) ( 82 ; 100 ] %
and they were used for further simulation studies. At the knee joint, for the same length of steps, the proposed gear ratios were as follows.
i g k = { 160   for   τ c [ 35 ; 85 ] % 360   for   τ c [ 0 ; 35 ) ( 85 ; 100 ] % .
For a 0.7 m step, the drive ratio at the hip joint was determined as follows:
i g h = { 600   for   τ c [ 35 ; 85 ] % 780   for   τ c [ 0 ; 35 ) ( 85 ; 100 ] % ,
and at the knee joint.
i g k = { 300   dla   τ c [ 32 ; 85 ] % 500   dla   τ c [ 0 ; 32 ) ( 85 ; 100 ] % .
The proposed ratios are marked in the diagrams with a dashed red line.

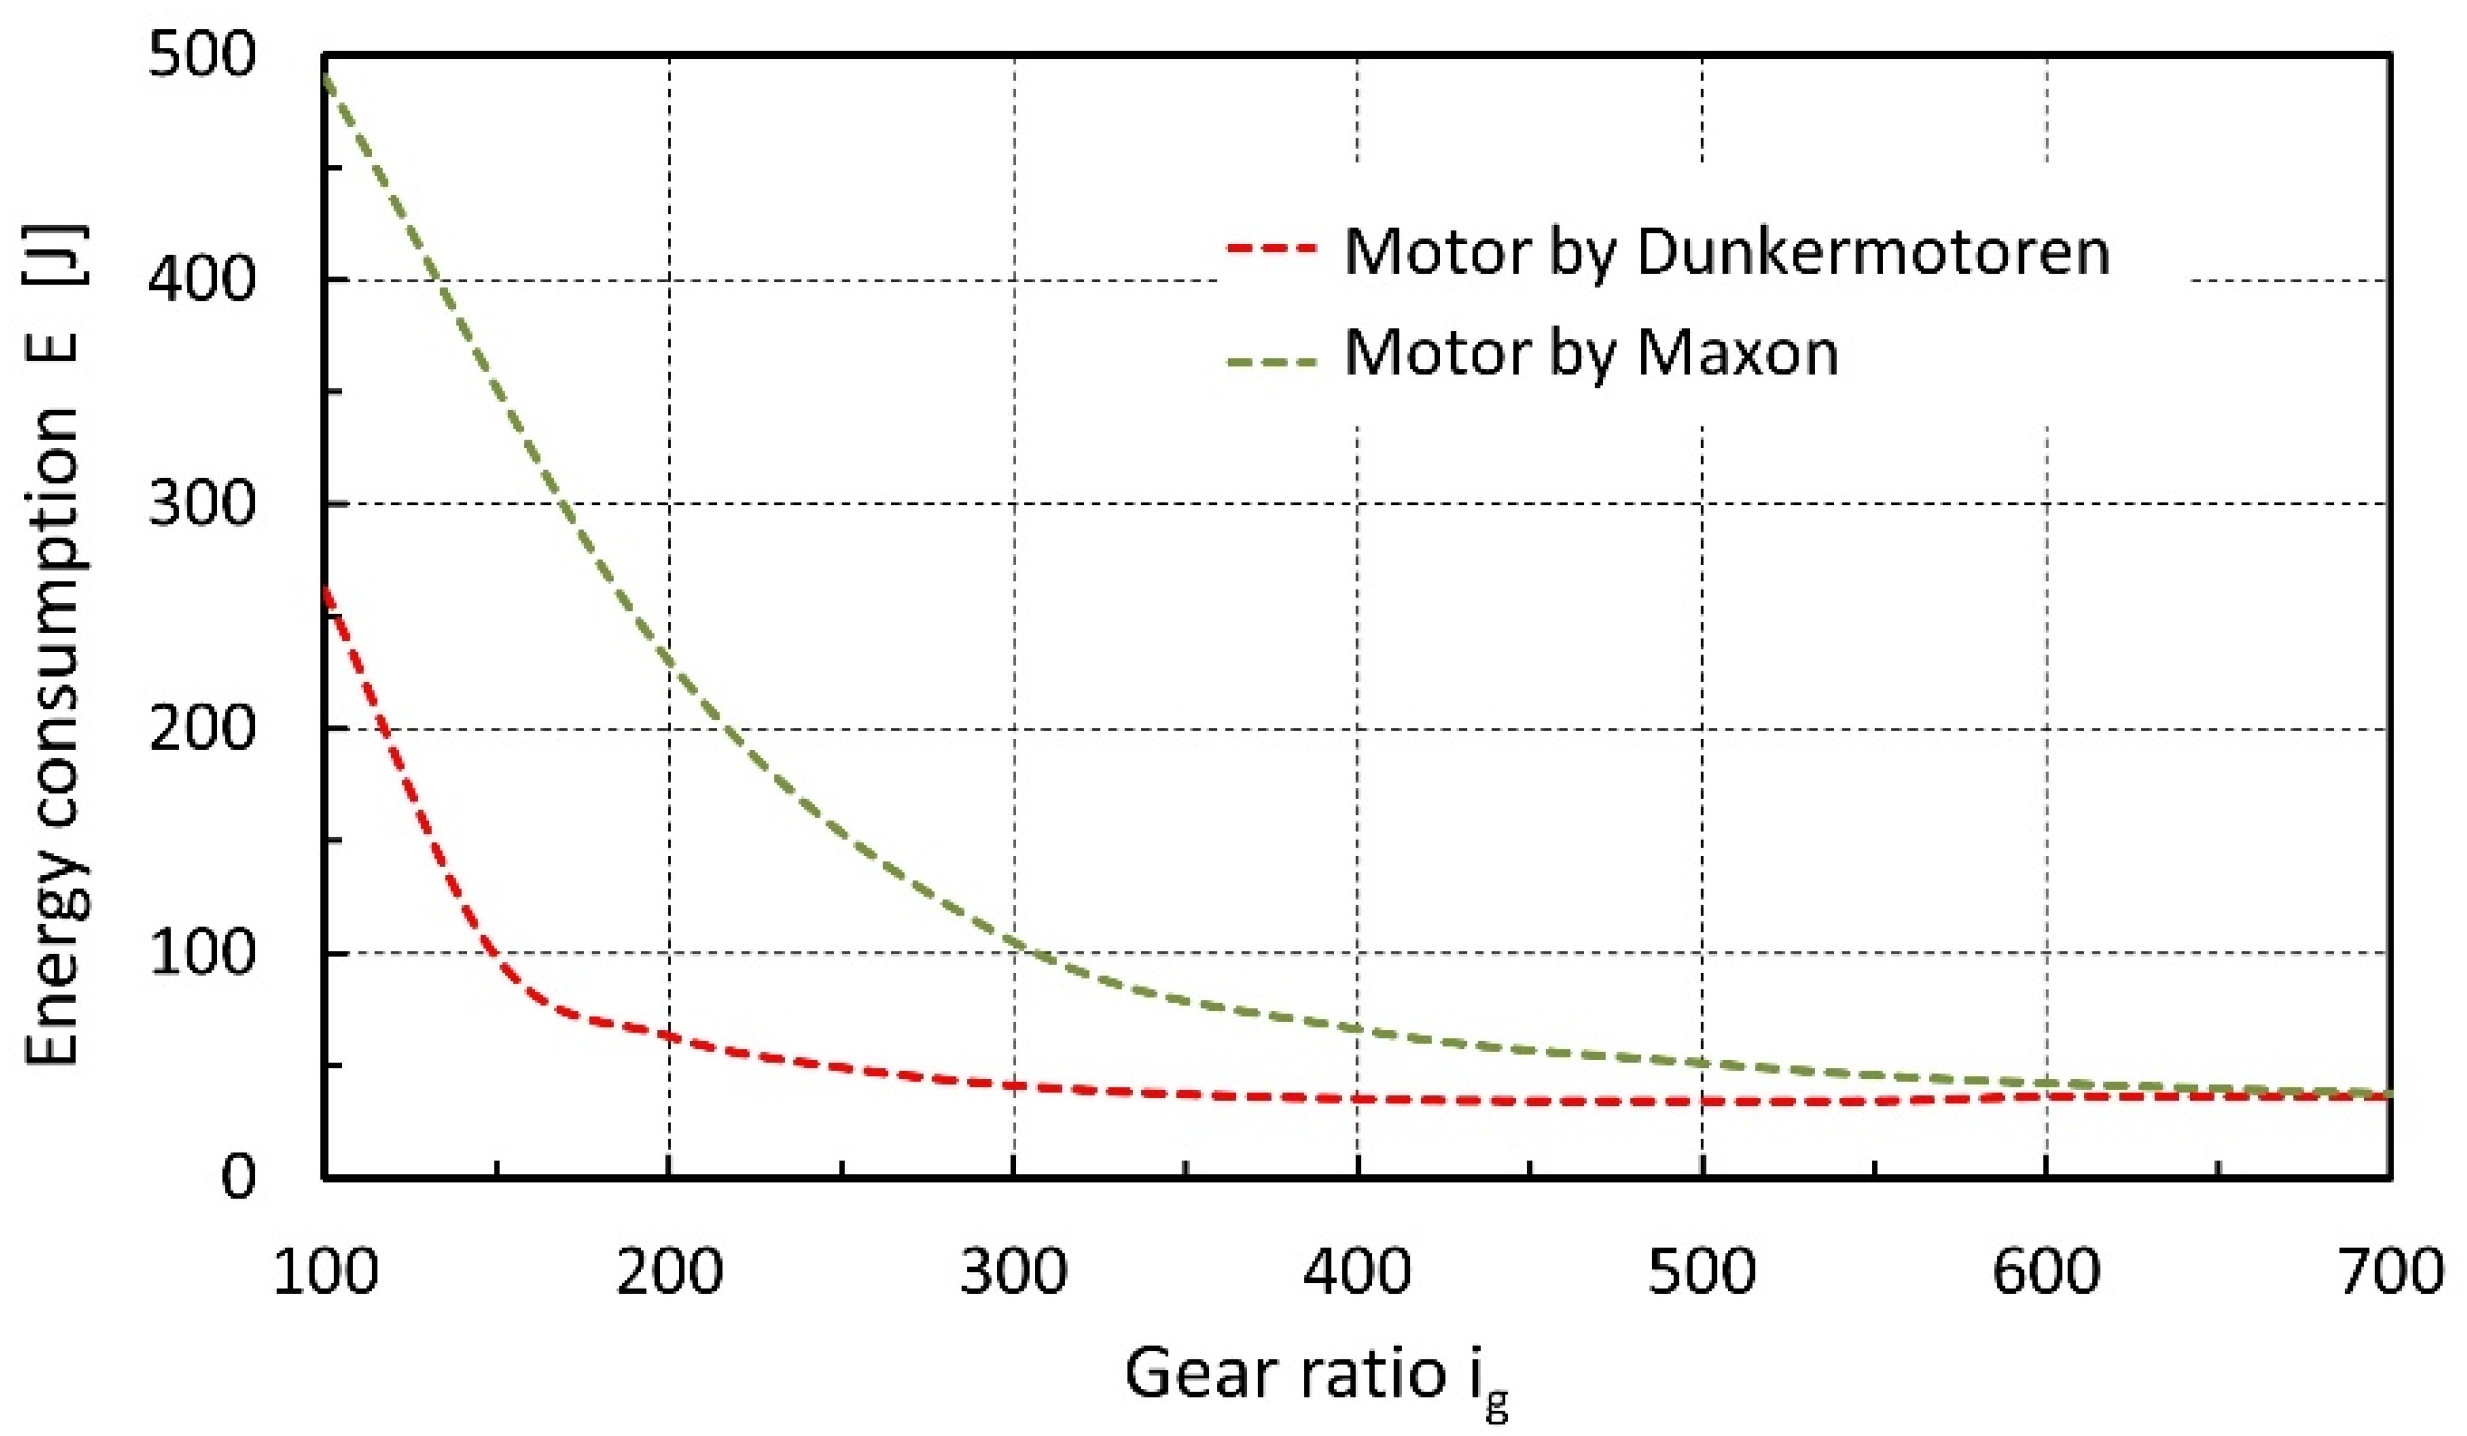
3.3. Determination of Energy Consumed in the Gait Cycle

Simulation experiments were carried out to analyse the performance of gait by actuators with gear ratios changed according to the proposed algorithms. The total energy E consumed during one gait cycle by all four drive systems was determined—two for the knee joints and two for the hip joints:
E = 2 · E 1 h + 2 · E 1 k ,  
where E1h denotes the energy consumed by the drive of the hip joint and E1k denotes the energy consumed by the drive of the knee joint, and both were determined in accordance with Formula (12), limiting the calculations to the areas of motor operation work:
i . e . ,   u k ( t ) i k ( t ) > 0     u h ( t ) i h ( t ) > 0 ,
where uk denotes the control voltage at the knee joint drive, uh denotes control voltage at the hip joint drive, ik denotes the current consumed at the knee joint drive, ih denotes the current consumed at the hip joint drive. At this stage of research, the areas of generator operation of the motors were not considered. For the above values of gear ratios, tests were carried out on the total energy consumed by the drive systems during the full cycle of walking in the area of motor operation in accordance with Formulas (20) and (21). The results of these tests presented in Table 1 show significant benefits with regard to energy consumption that can be obtained by changing the gear ratios in the robot drive systems. The reduction in energy consumption at the level exceeding even 50% confirmed the correctness of the applied method of gear selection and indicated the advisability of continuing work on the drive system with a variable gear ratio.
An example illustrating the impact of step changes in the gear ratio on the instantaneous electric power consumed by the robot drive system is shown in Figure 20. Electric power Pe1 is drawn by the drive system of the hip joint with a constant gear ratio i1 equal to 167 as in the case of the real robot presented in Figure 2. Power Pe2 corresponds to the drive with the gear ratio i2 changed stepwise between 380 and 100. The values of Eh energy consumed in a single gait cycle by each of the systems were, respectively, Eh1 = 76.8 J and Eh2 = 49.2 J, which produces energy reduction by 35%.

3.4. Experimental Research

3.4.1. Research Plan

The promising results of simulation tests prompted the authors to verify the proposed concept by testing the drive systems at the laboratory. First, it was planned to investigate the influence of the gear ratio on energy consumption by the robot drive system modified for this purpose (Figure 21), ensuring operation with three ratios: i1 = 103, i2 = 206, and i3 = 412. It was possible thanks to the addition of a coupling gear with possible gear ratios 1:1, 2:1, and 4:1. The drive system was coupled with an inverted pendulum mechanism, which ensures loading of the system with both a variable static torque as well as a dynamic torque. The range of motion of the arm guaranteed a possibility of both motor and generator mode of operation of the drive system, which in selected parts of the motion is consistent with the working conditions of the robot actuators.
The research included the following stages:
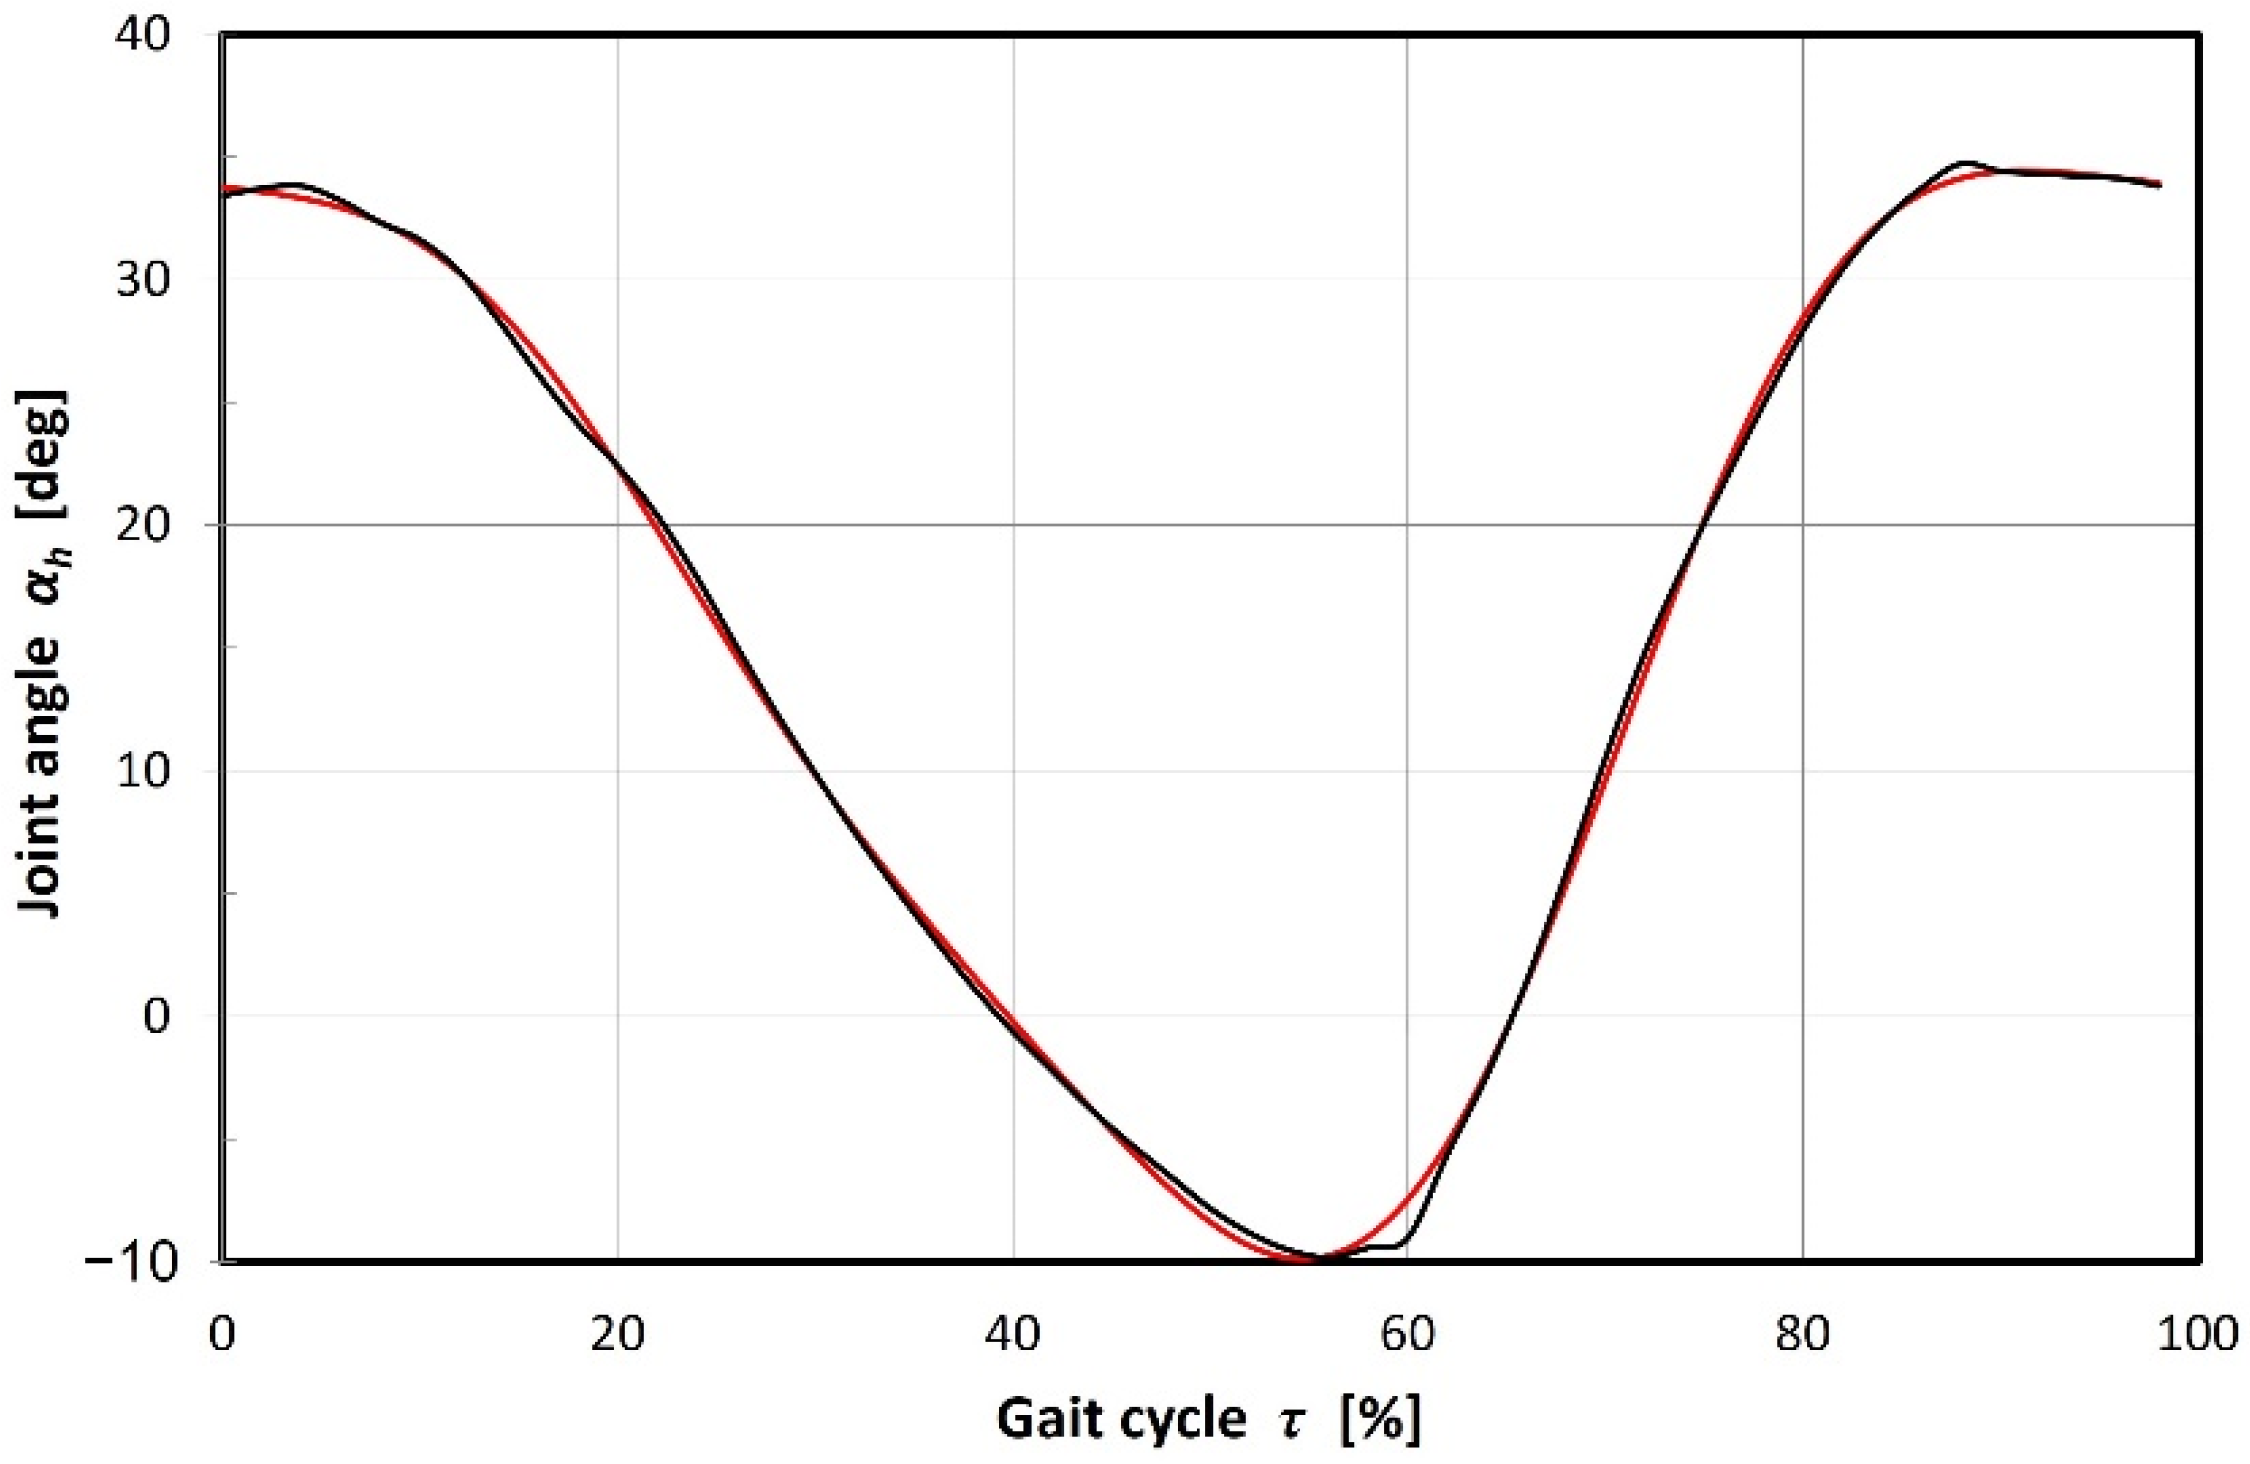
  • Implementation of selected motion profiles at the driven joint for several different gear ratios of the drive system and at different loads on the joint, with simultaneous recording of the time courses of electric power consumed by the drive motor, and checking at the same time the course of the rotation angle at the joint in order to guarantee compliance with the assumed functional requirements;
  • Presentation of the recorded results in a form of plots of the electric power consumed for each of the gear ratios and each of the loads, as well as the calculation of the amount of energy consumed for each of the cases;
  • An attempt to synthesise, for each load, the temporal fragments of power courses in such a way, as to obtain the lowest possible energy consumption. The result of this operation is to indicate the suggested moments of time, when the gear ratio is to be changed during the standard operation of the drive.

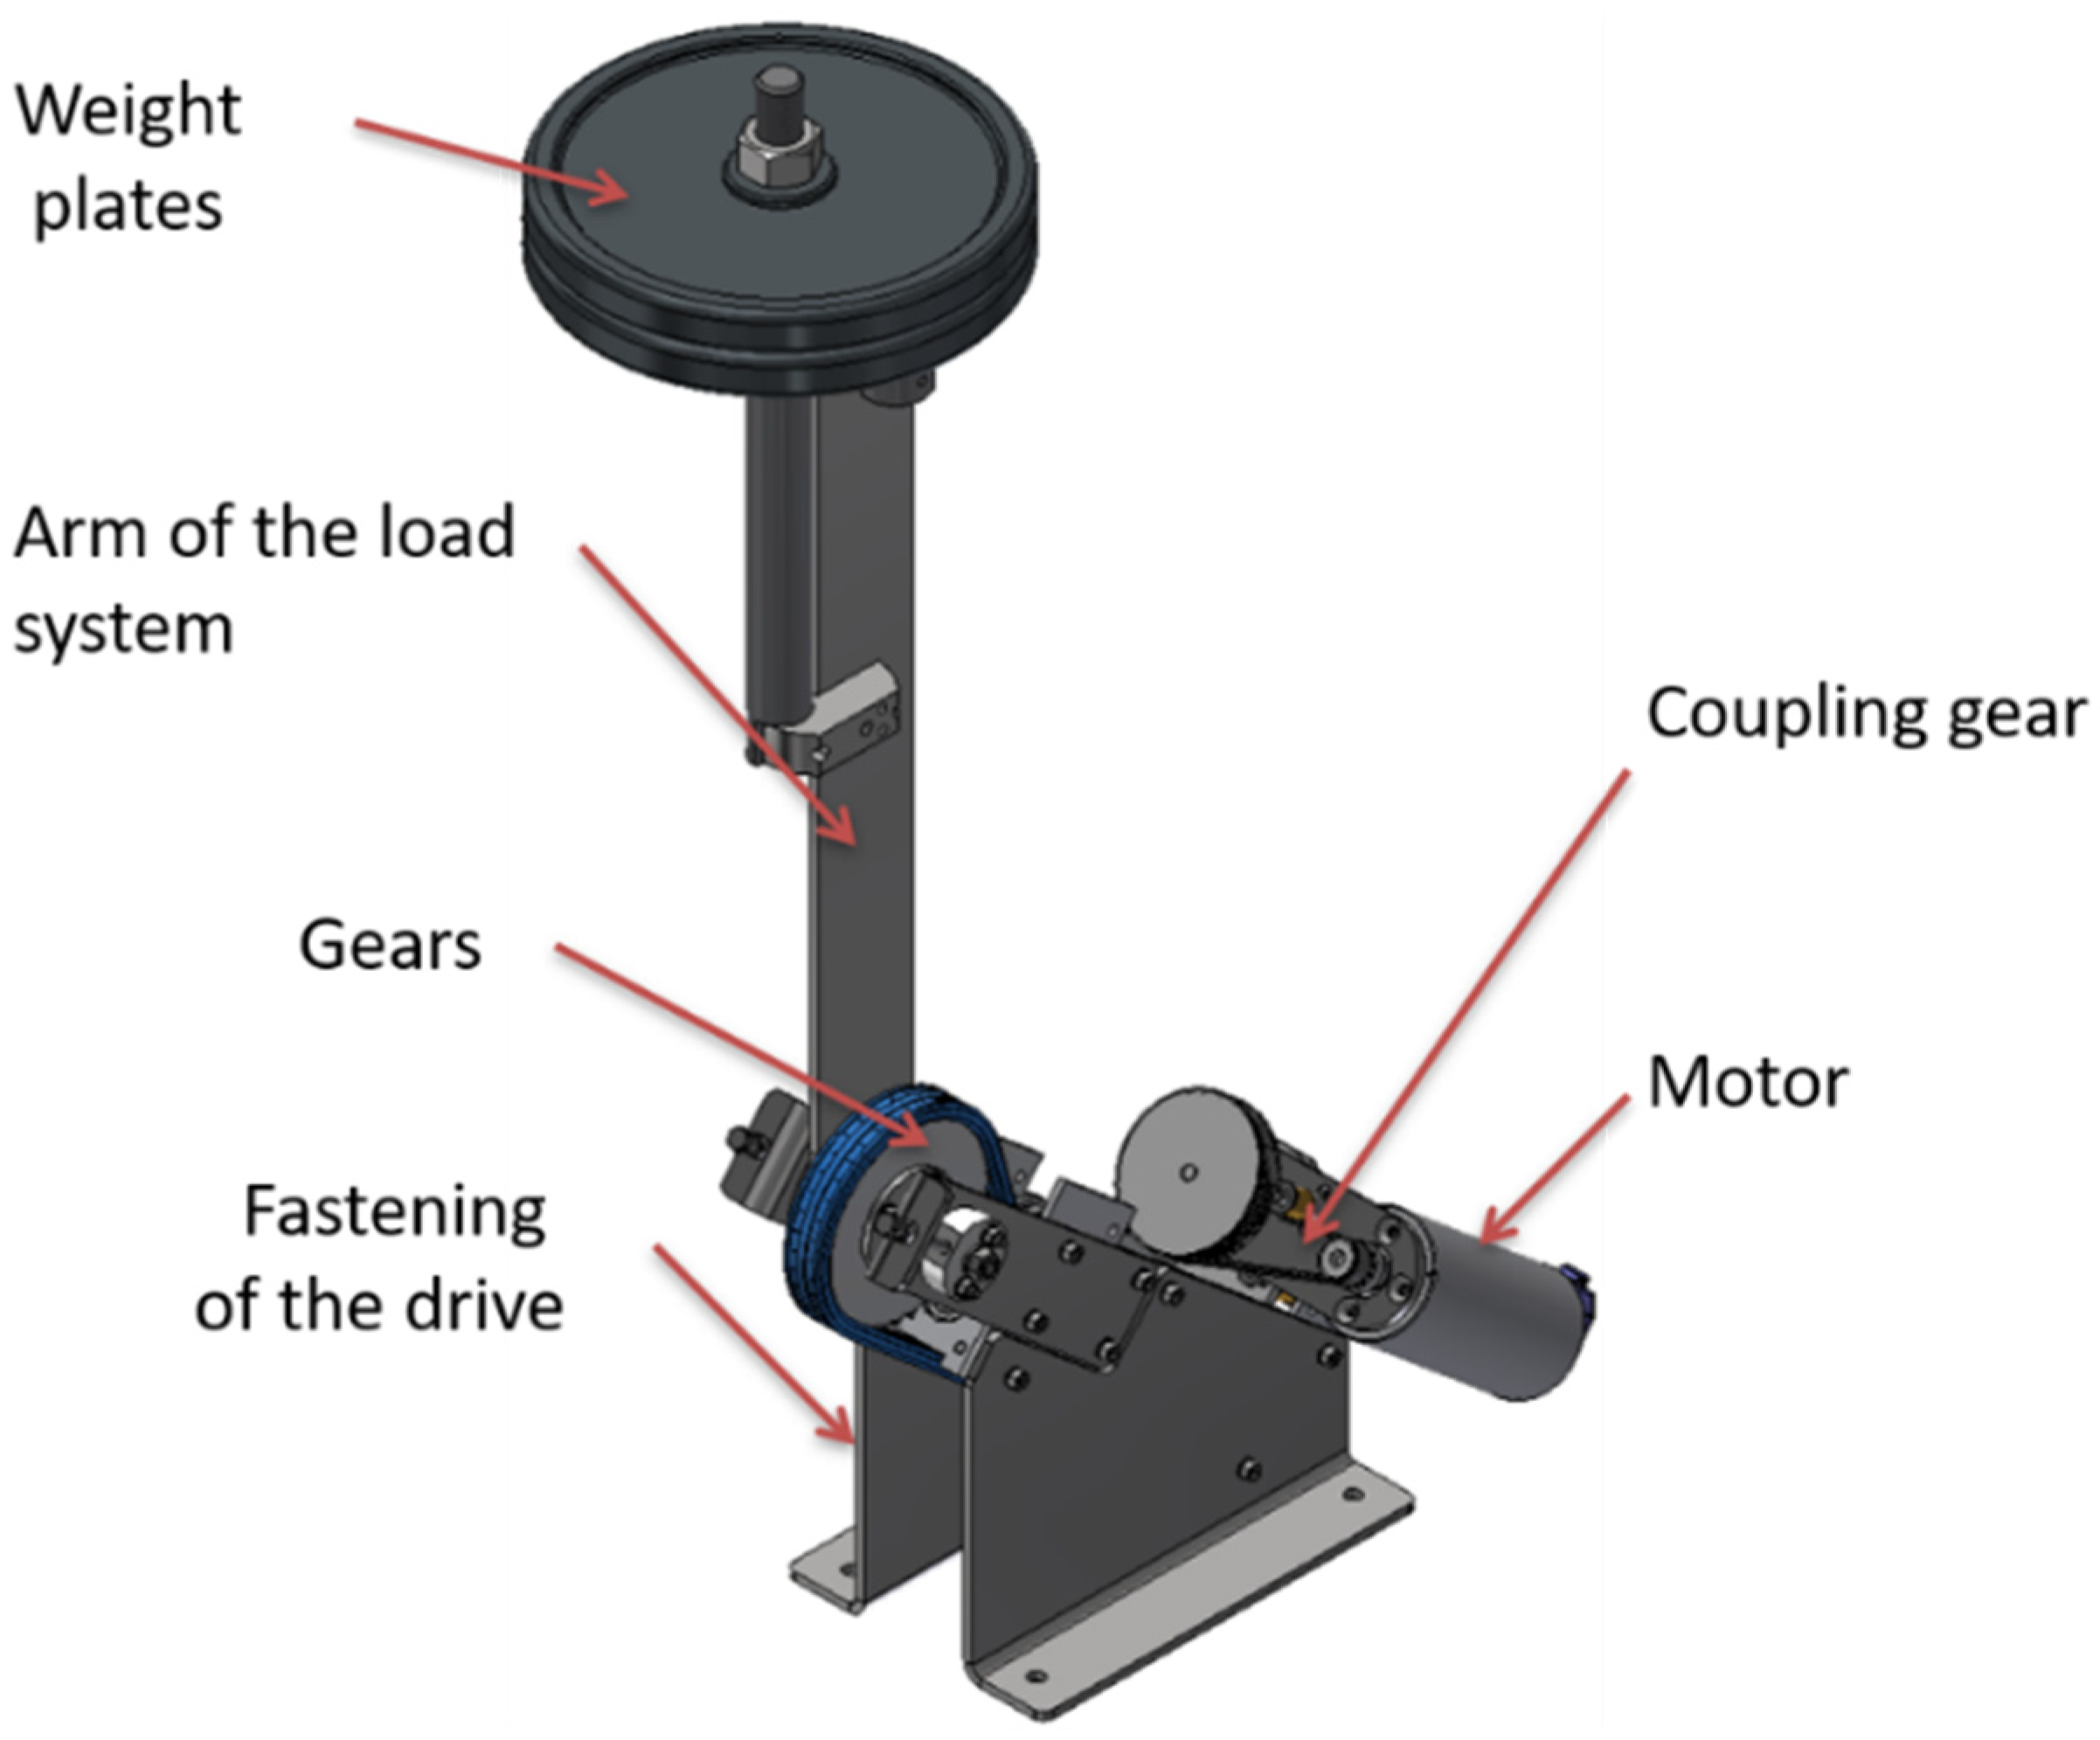
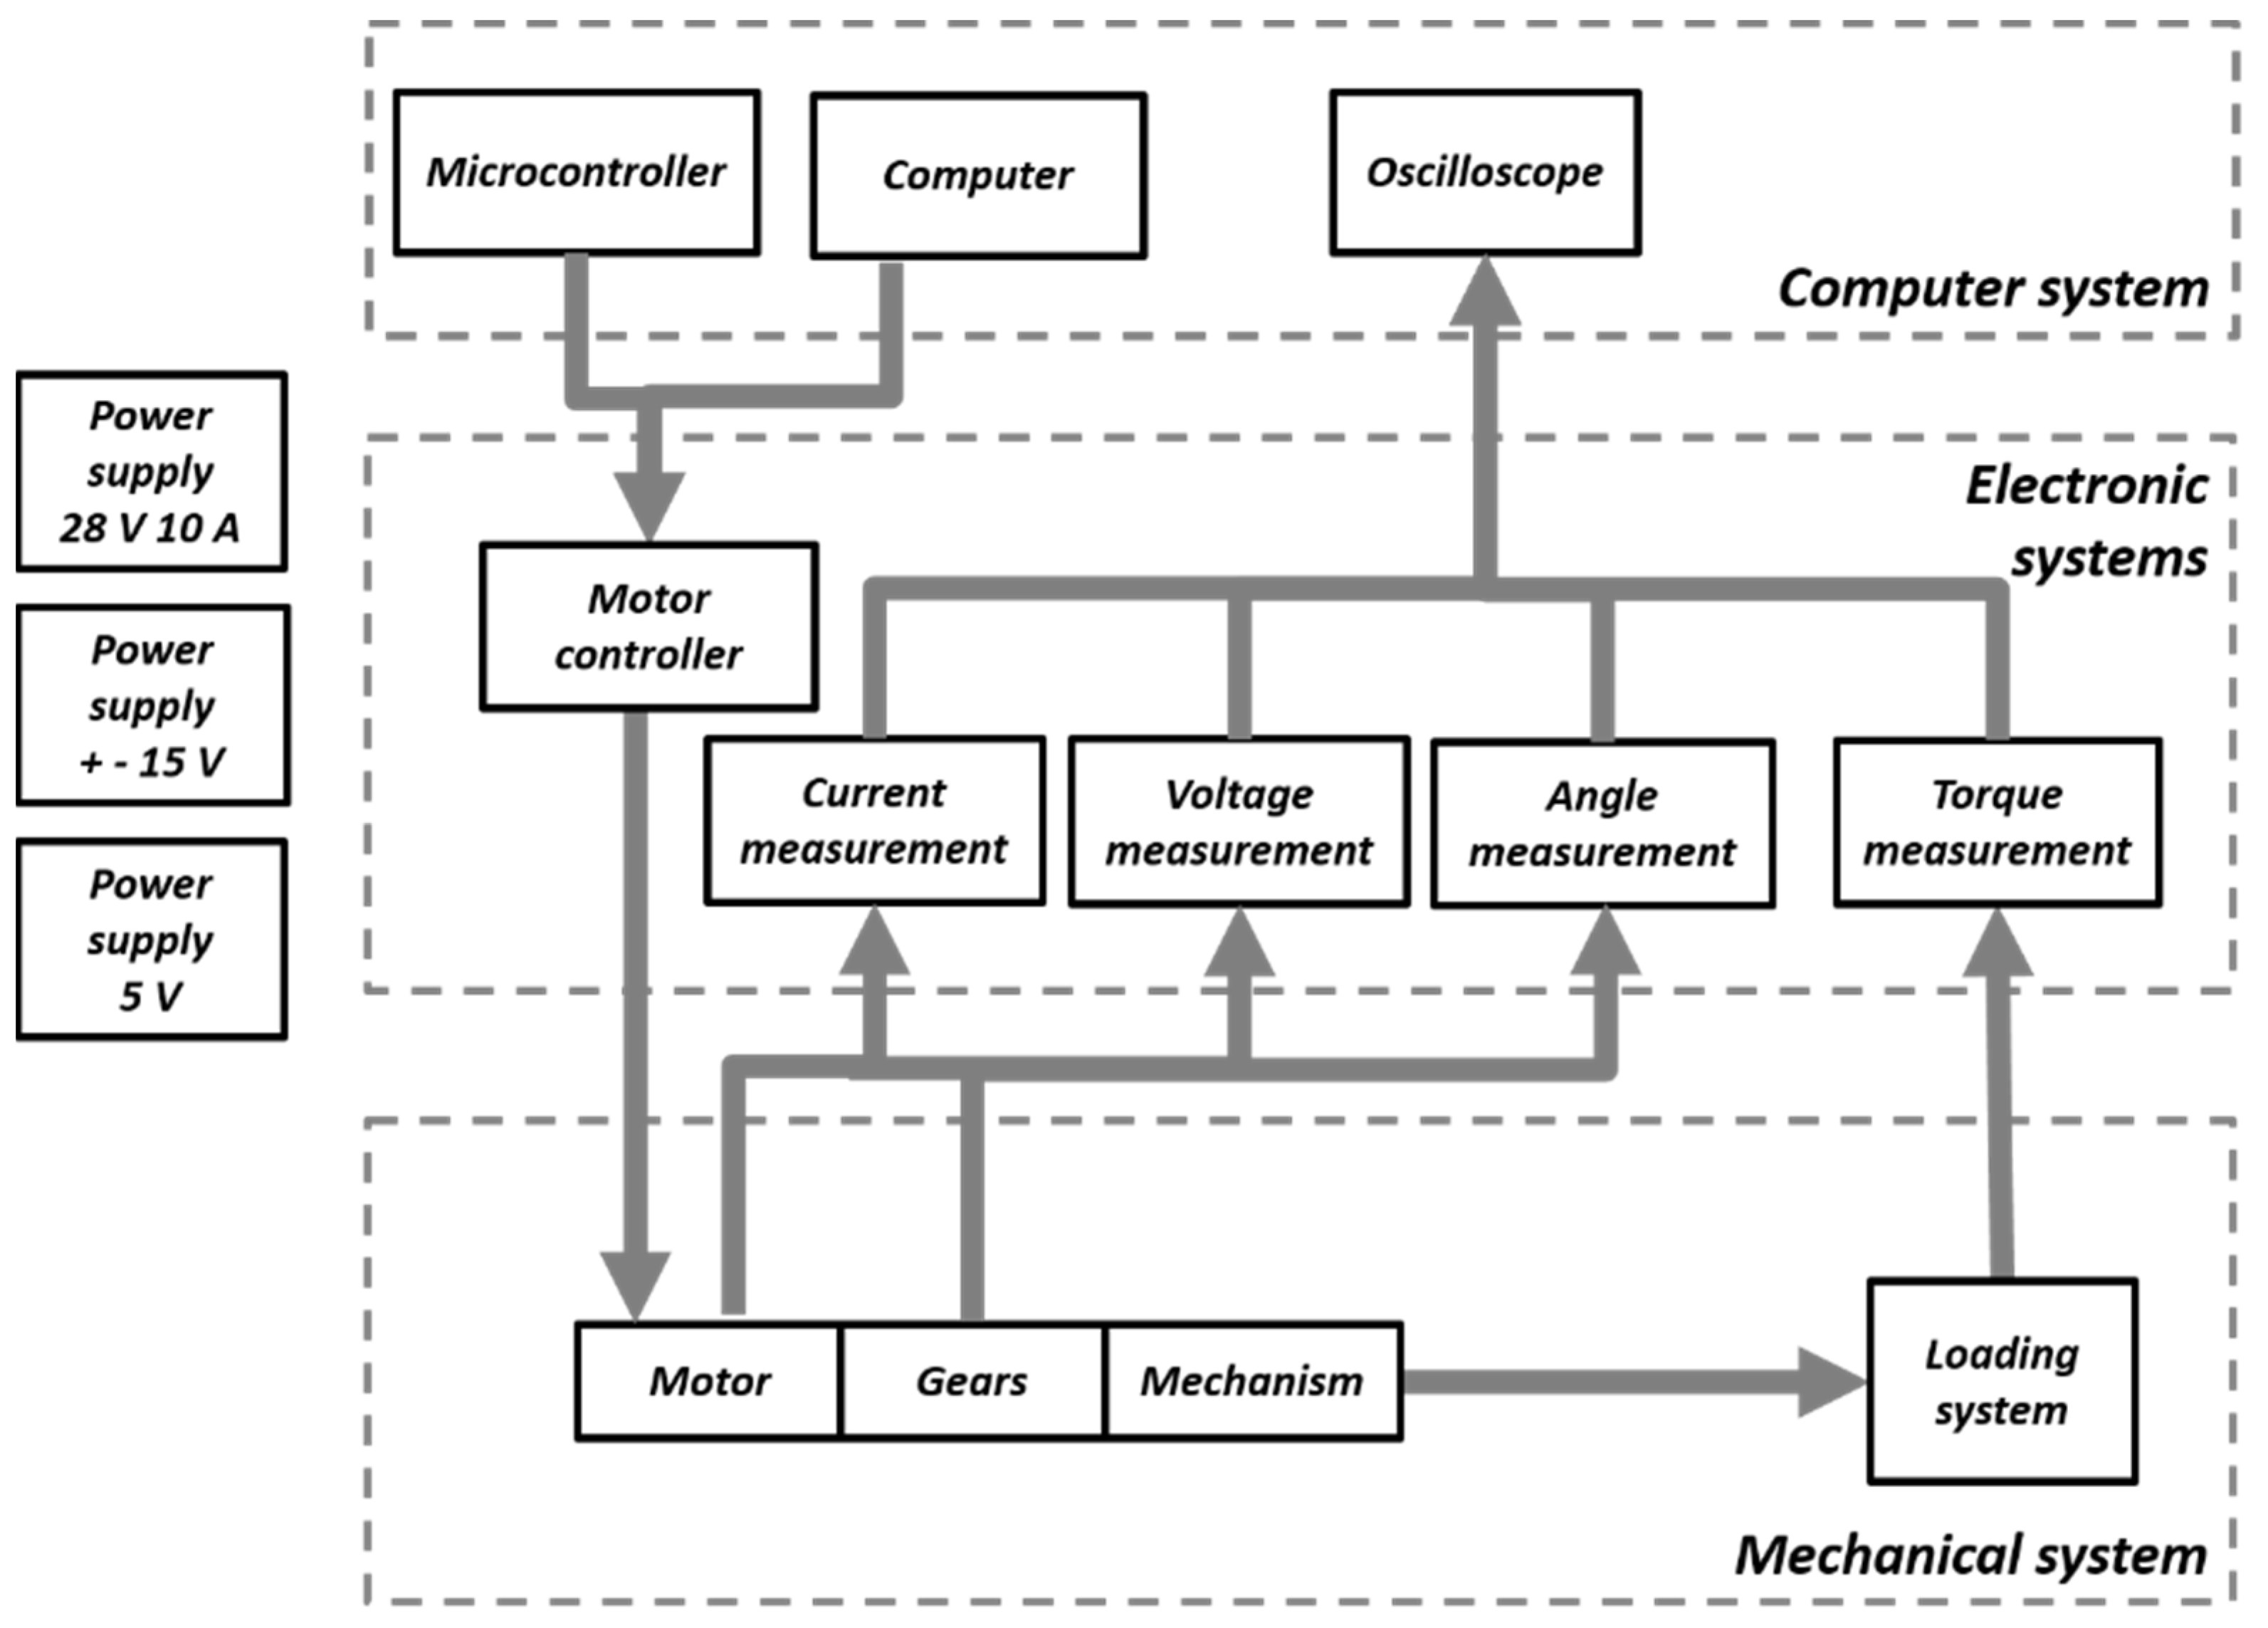
3.4.2. The Test Stand

To conduct experimental tests of the modified drive system, a test stand was built; its block diagram is shown in Figure 22. The station uses the ATmega8 microcontroller, which generates control pulses according to the developed angular position trajectory. The motor of the tested drive system is a Dunkermotoren product with the symbol GR63Sx55, nominal voltage 24 V DC, and nominal power 117 W. The starting torque of the motor is 3.4 Nm. The motor is controlled by a programmable SID 116 controller. The angular position of the joint is measured with the use of Megatron’s MAB18A absolute 12-bit magnetic converter. The measurement of the motor current is performed by a LEM current transducer, which uses the Hall effect. The value of the loading torque is determined by measuring the force acting on a known, fixed arm. This force is measured with the use of the KM500 strain gauge transducer from Megatron. The motor control voltage was PWM modulated and a low-pass filter is used for its measurement. The same filtering is applied to the remaining measurement signals. The signals are recorded on a digital oscilloscope. The real view of the stand is shown in Figure 23.
Due to the technical limitations of the test stand, it was not possible to repeat the experiments previously performed using computer simulation. Therefore, other, simplified movement profiles have been proposed: sinusoidal and triangular. The sinusoidal profile was the equivalent of a fragment of the motion profile in the knee joint during walking, and the triangular profile was adopted as a standard course, allowing for possible later comparisons of different solutions. Figure 24, Figure 25 and Figure 26 show the results of the recorded rotation angle at the joint, motor control voltage, and motor current during the sinusoidal motion of the arm loaded by a mass of 10 kg.

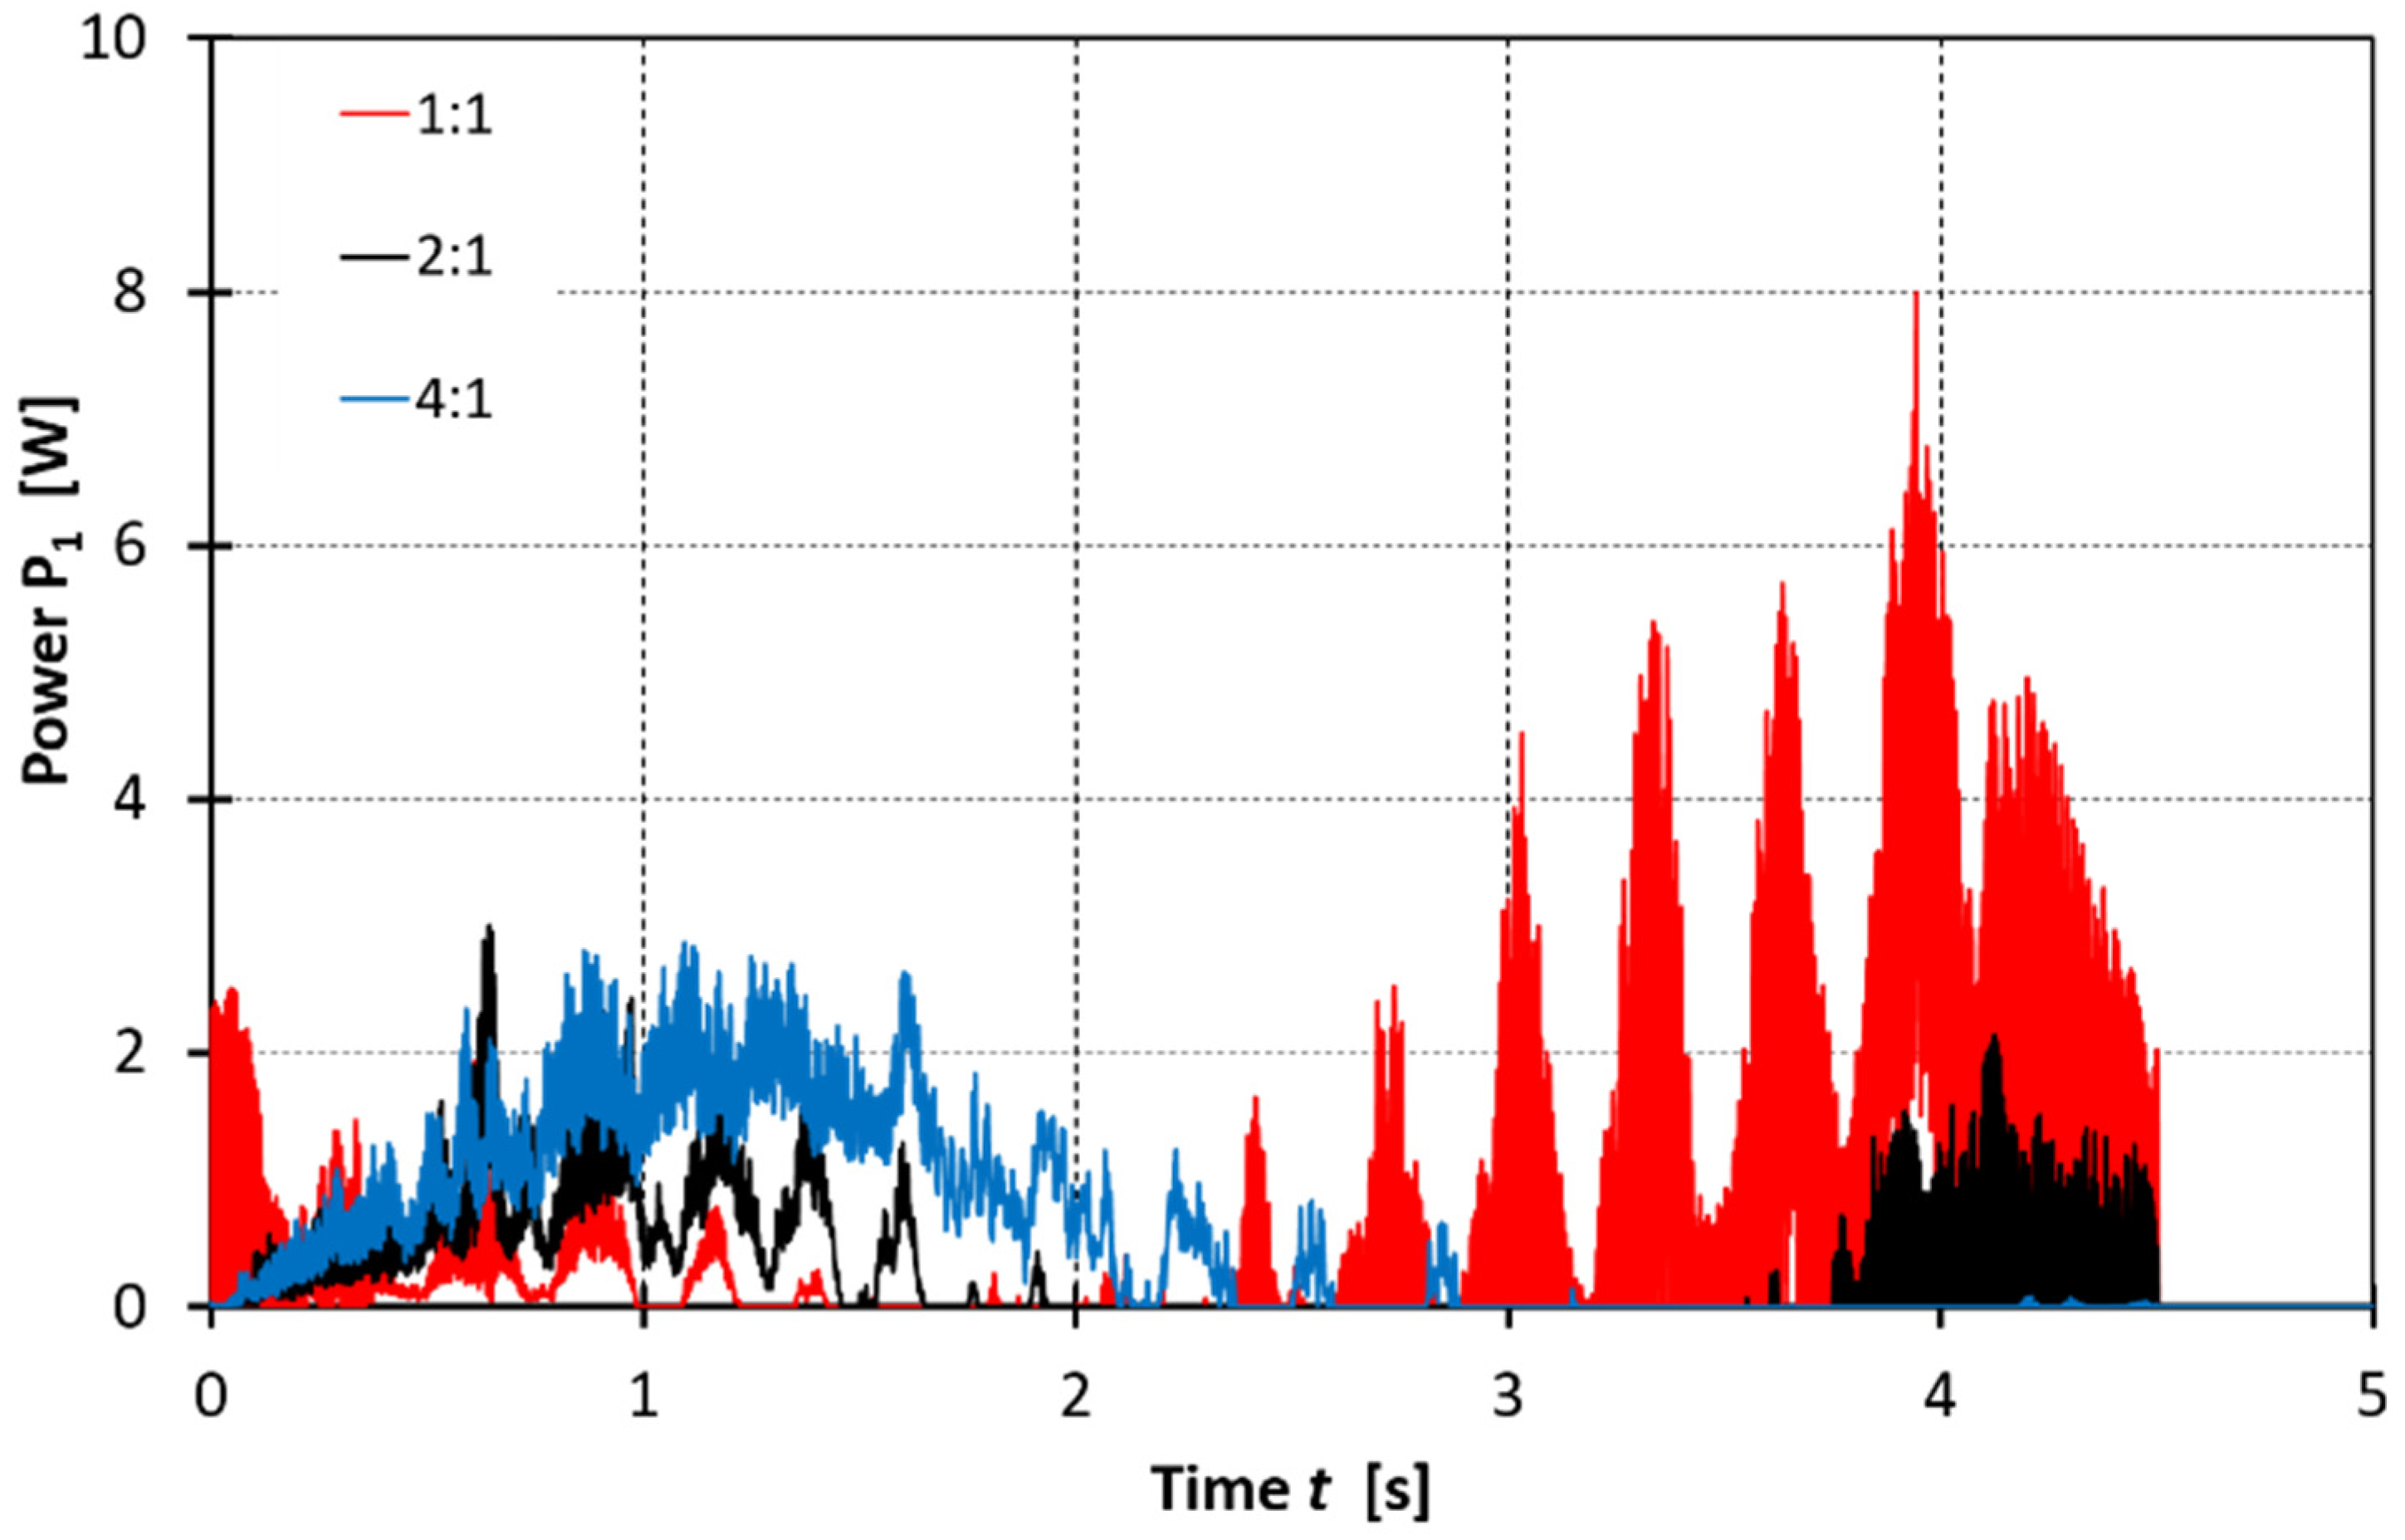
3.4.3. Research and the Obtained Results

A series of tests was performed with different loads imposed on the drive system. The research program was developed on the basis of qualitative and quantitative observations of the recorded courses. It was decided that the drive system would be loaded with weights of the following: 0, 5, 10, and 15 kg. For each of the loads, the experiments were carried out for both the triangular and sinusoidal angular displacement profiles at the joint. The vertical position (0°) was assumed as the initial position of the loading system levers, and the horizontal position (90°) was assumed as the final position. This procedure was aimed at emphasizing the generator phase of the drive operation, which had been not taken into account in the previous simulation tests. The period of the movement was set as T = 5 s, which reflects the typical periods in the operation of the orthotic robot. The experiments were repeated for each of the three ratios of the coupling gear: 1:1, 2:1, and 4:1. In accordance with the proposed research method, during the experiments, the current and voltage courses at the motor were recorded. Then, they were used to calculate the instantaneous electric power consumption and, finally, the total energy consumed. The signals obtained during the experiments were processed to obtain the following courses:
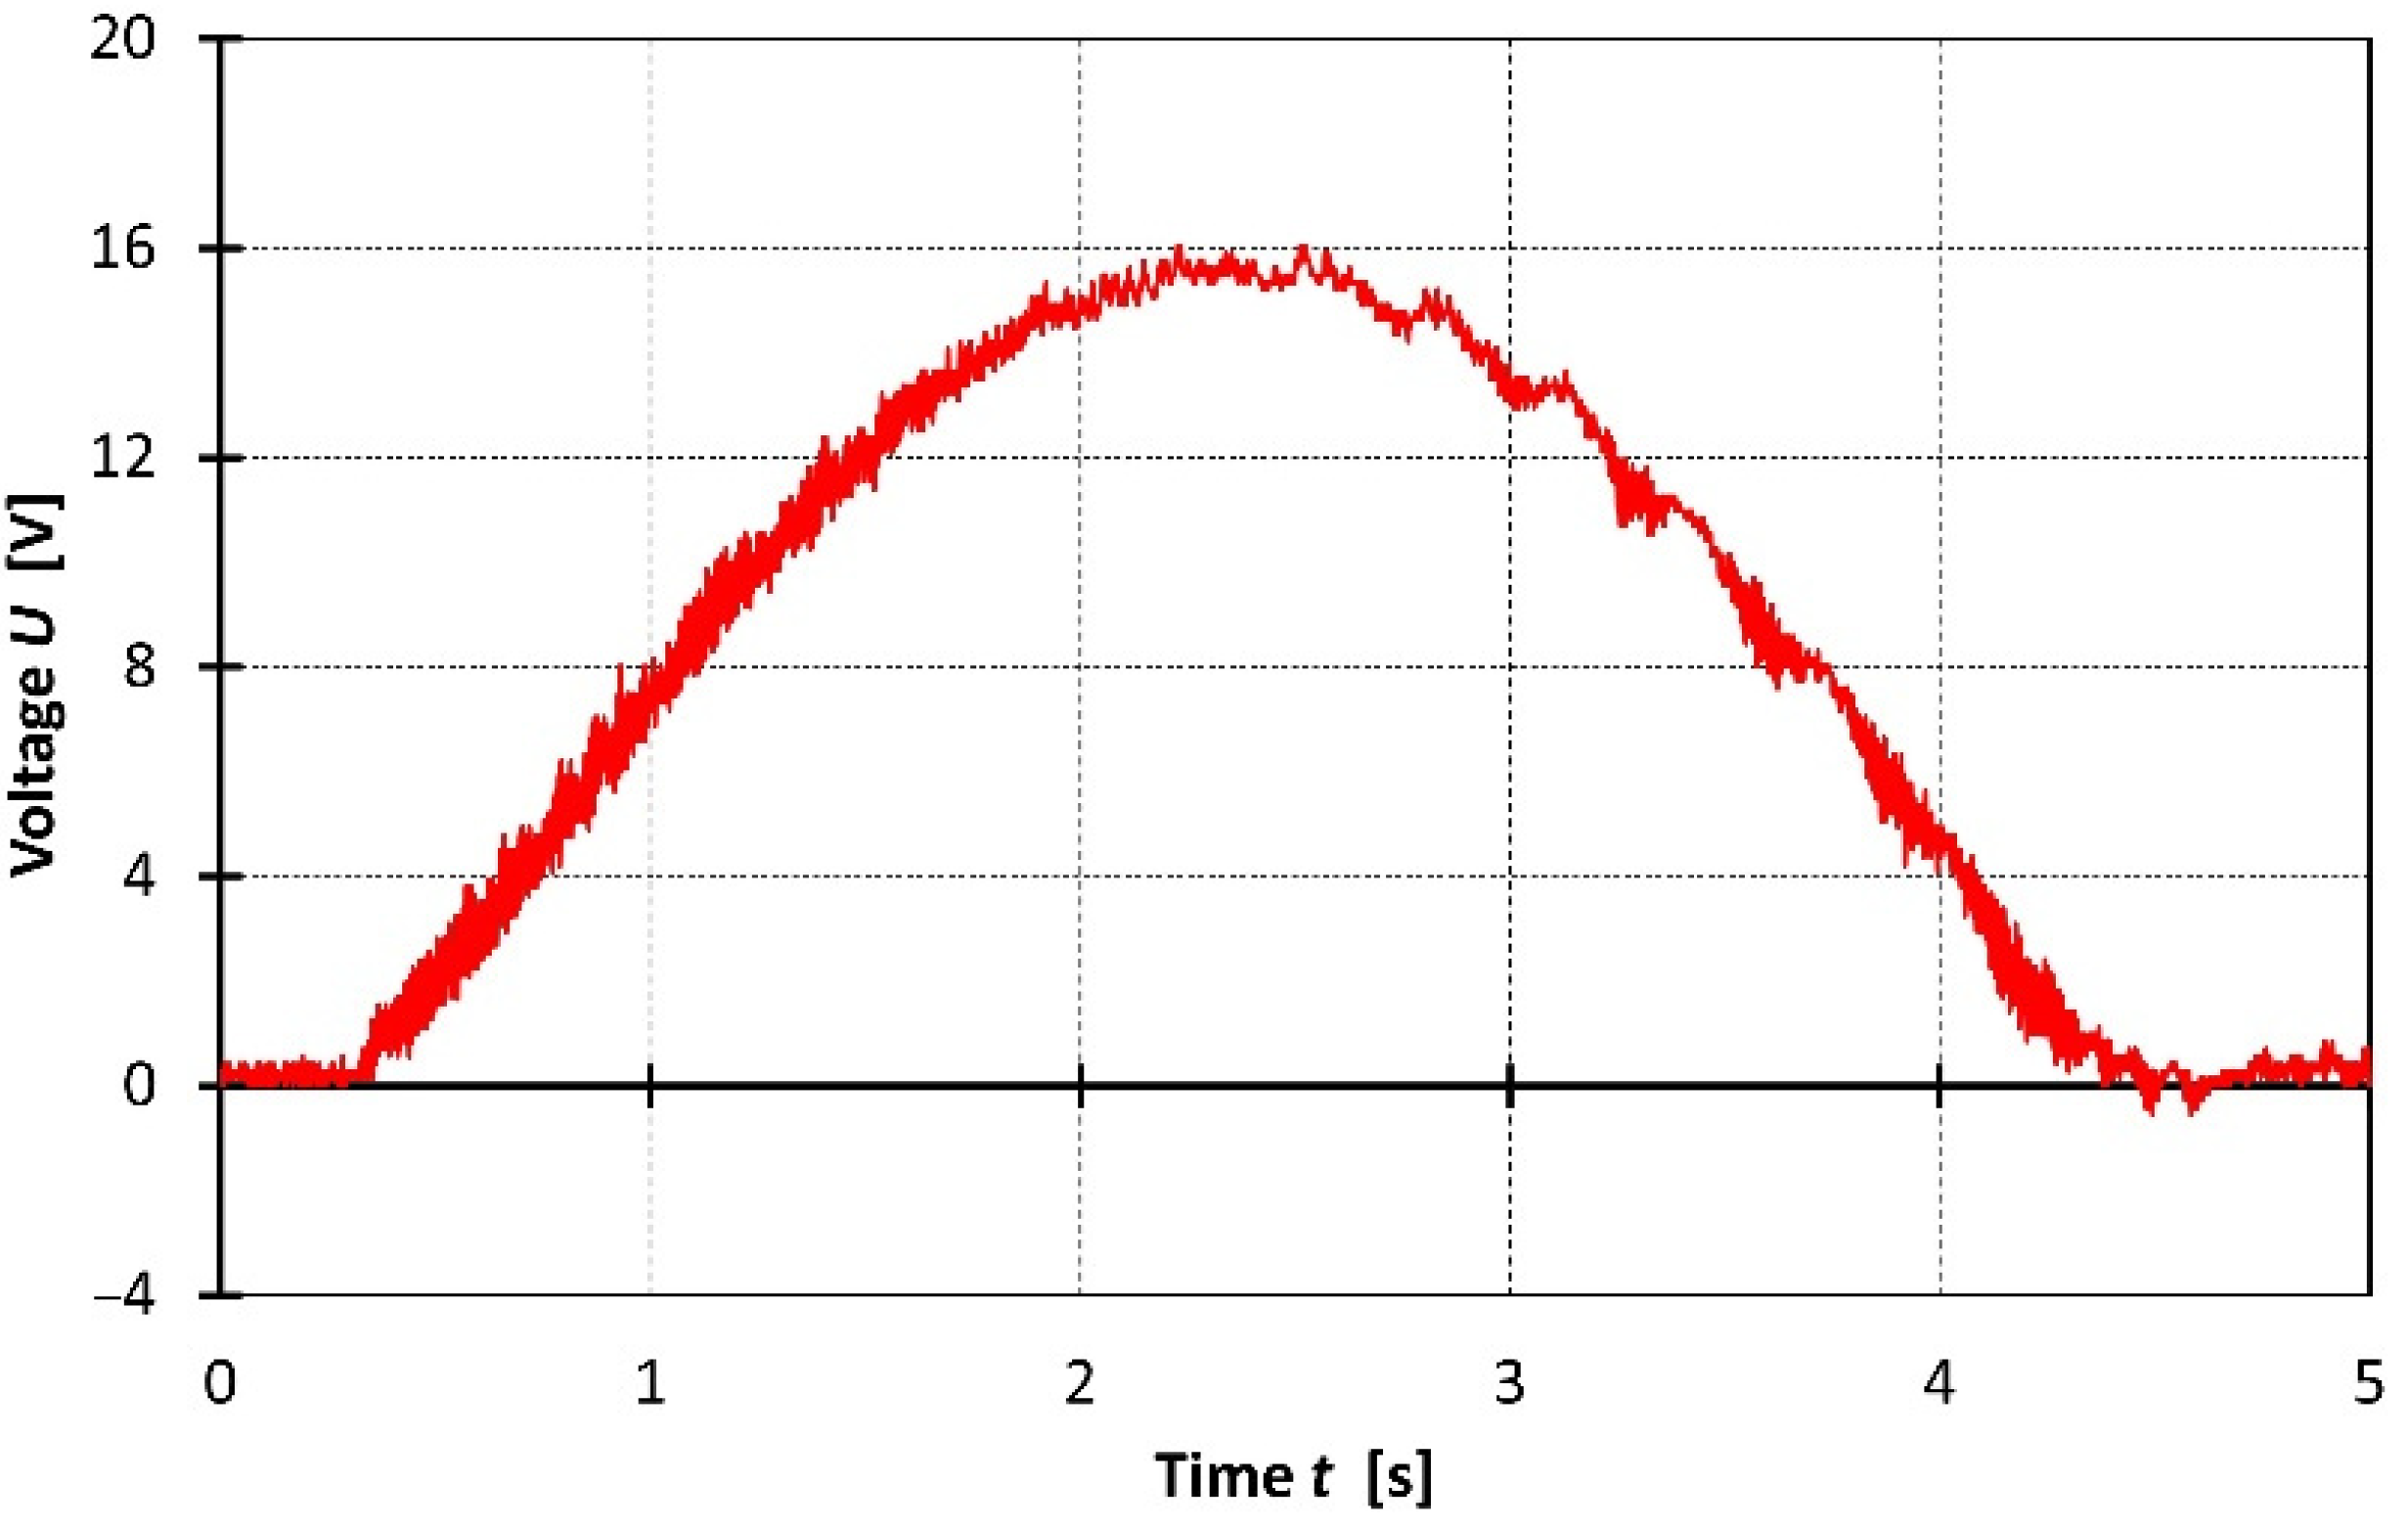
  • Voltage supplying the motor;
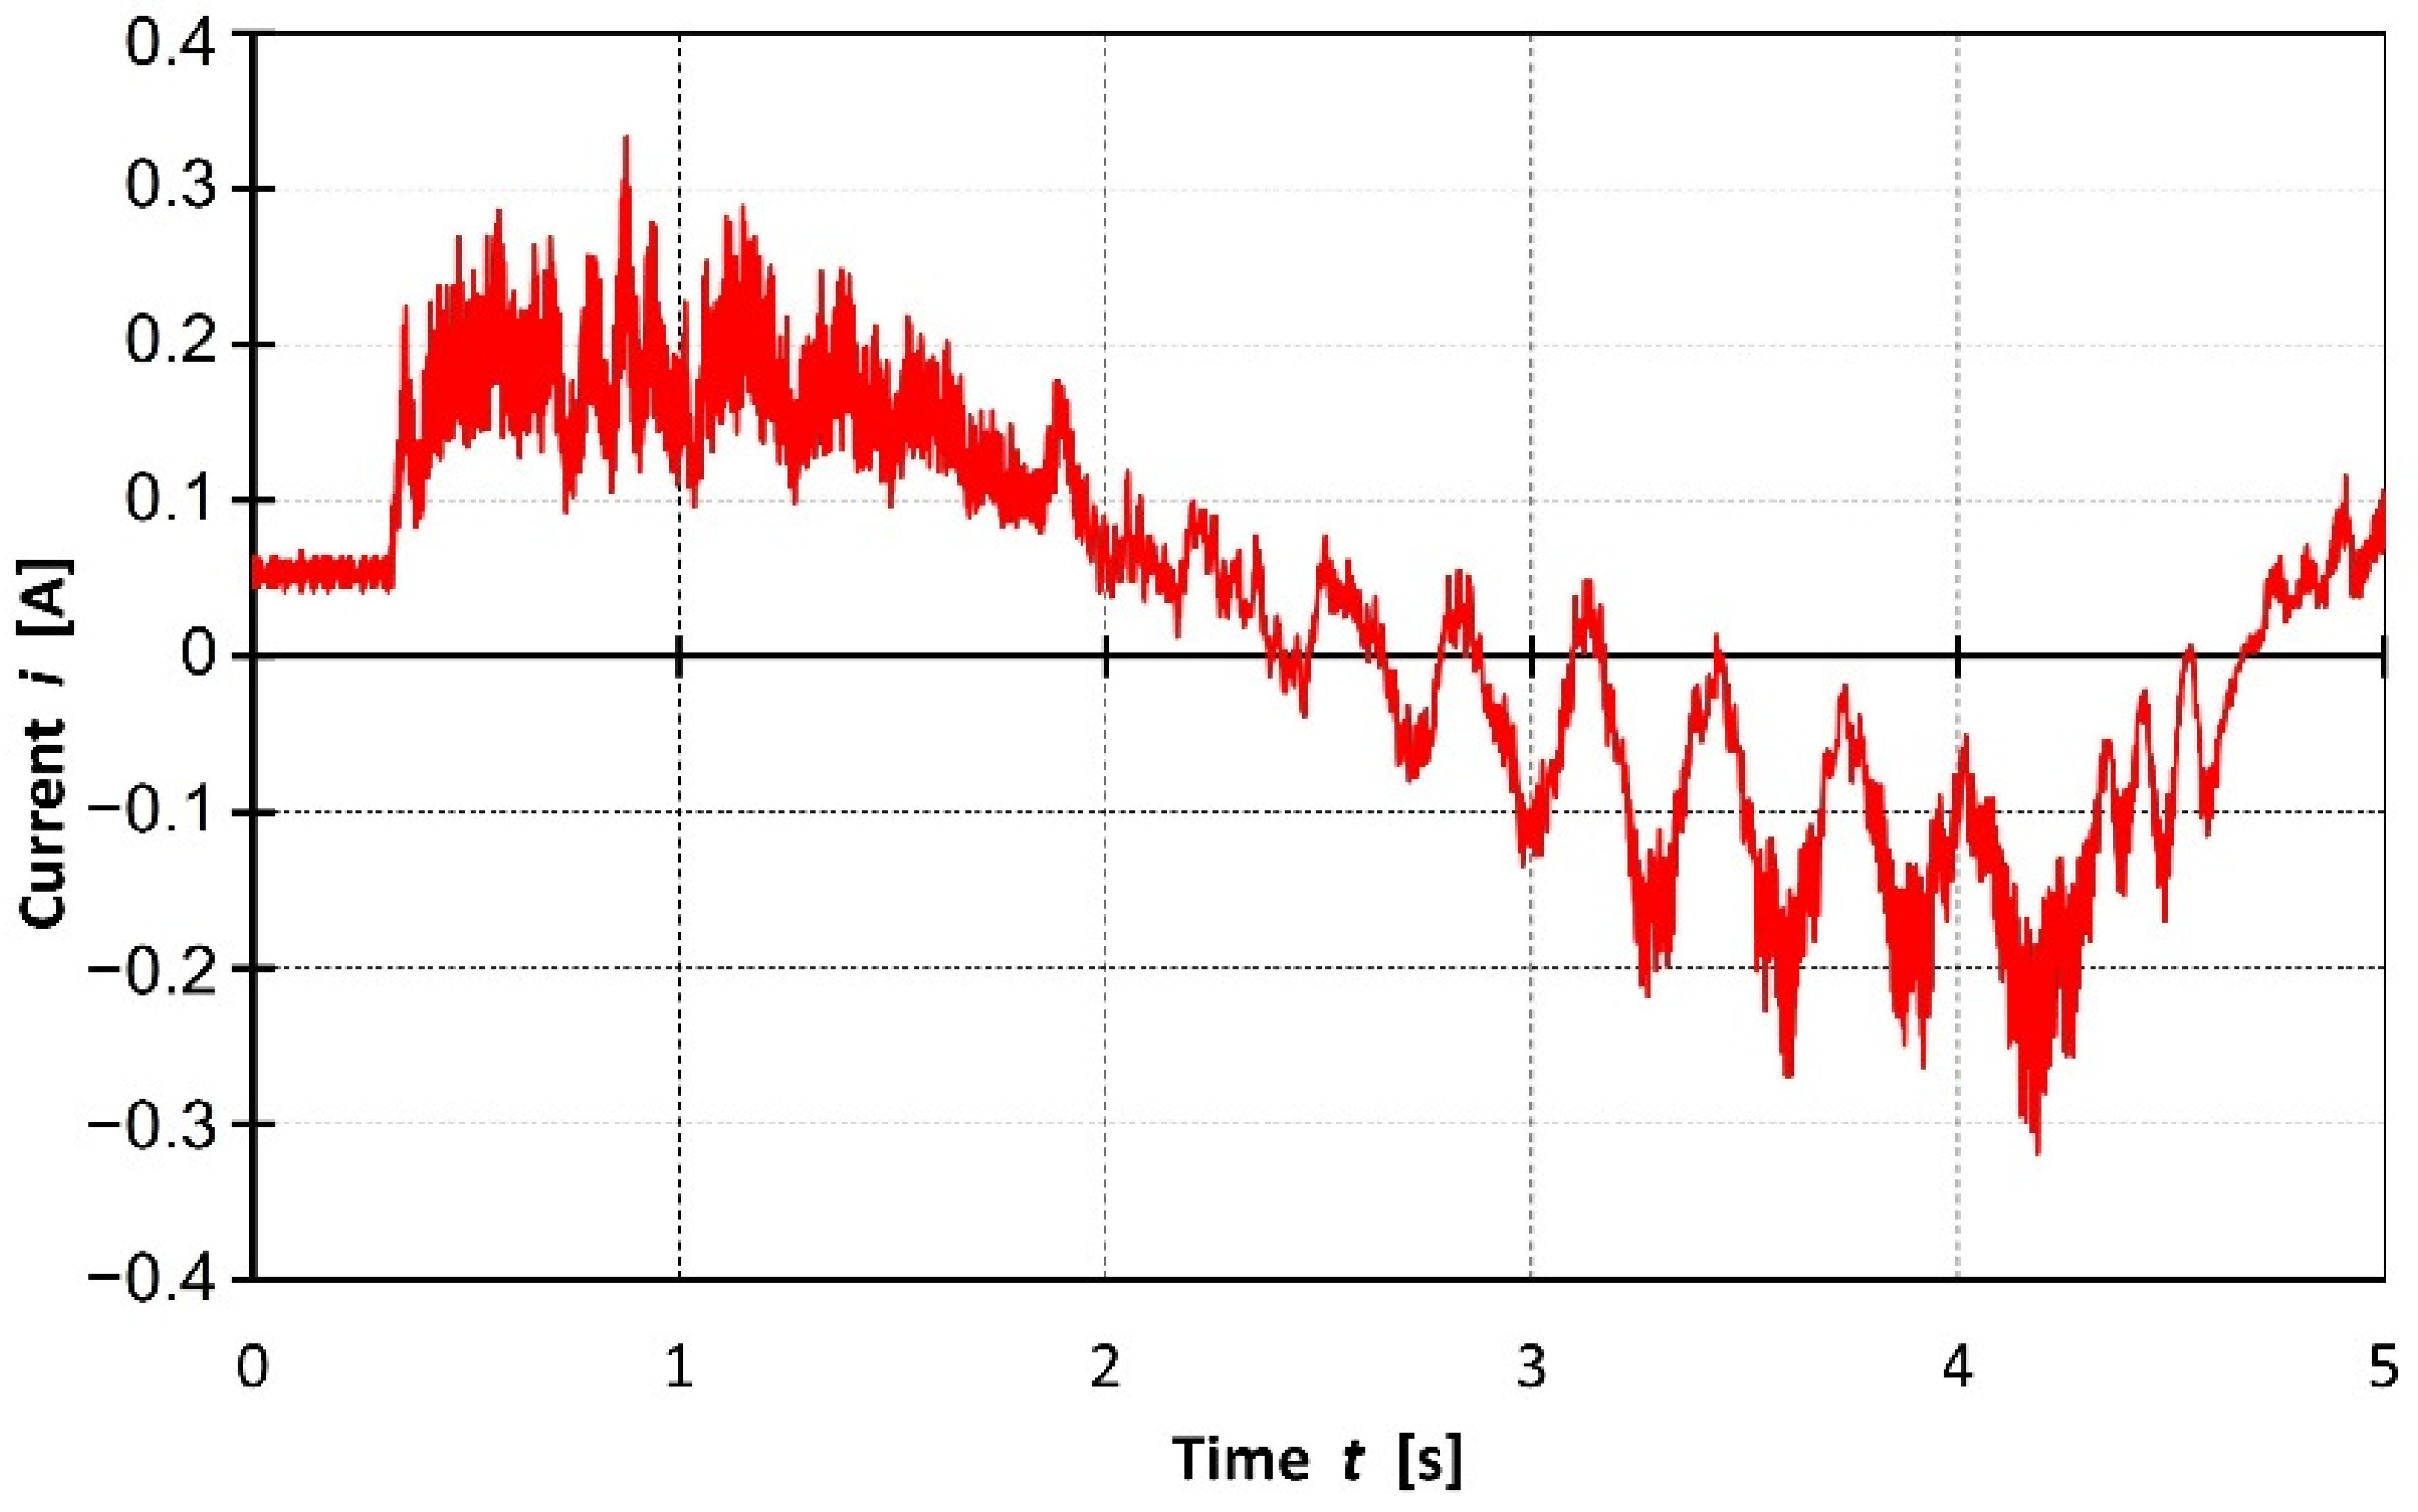
  • Motor current;
  • Instantaneous electric power P1;
  • Total electric energy E1;
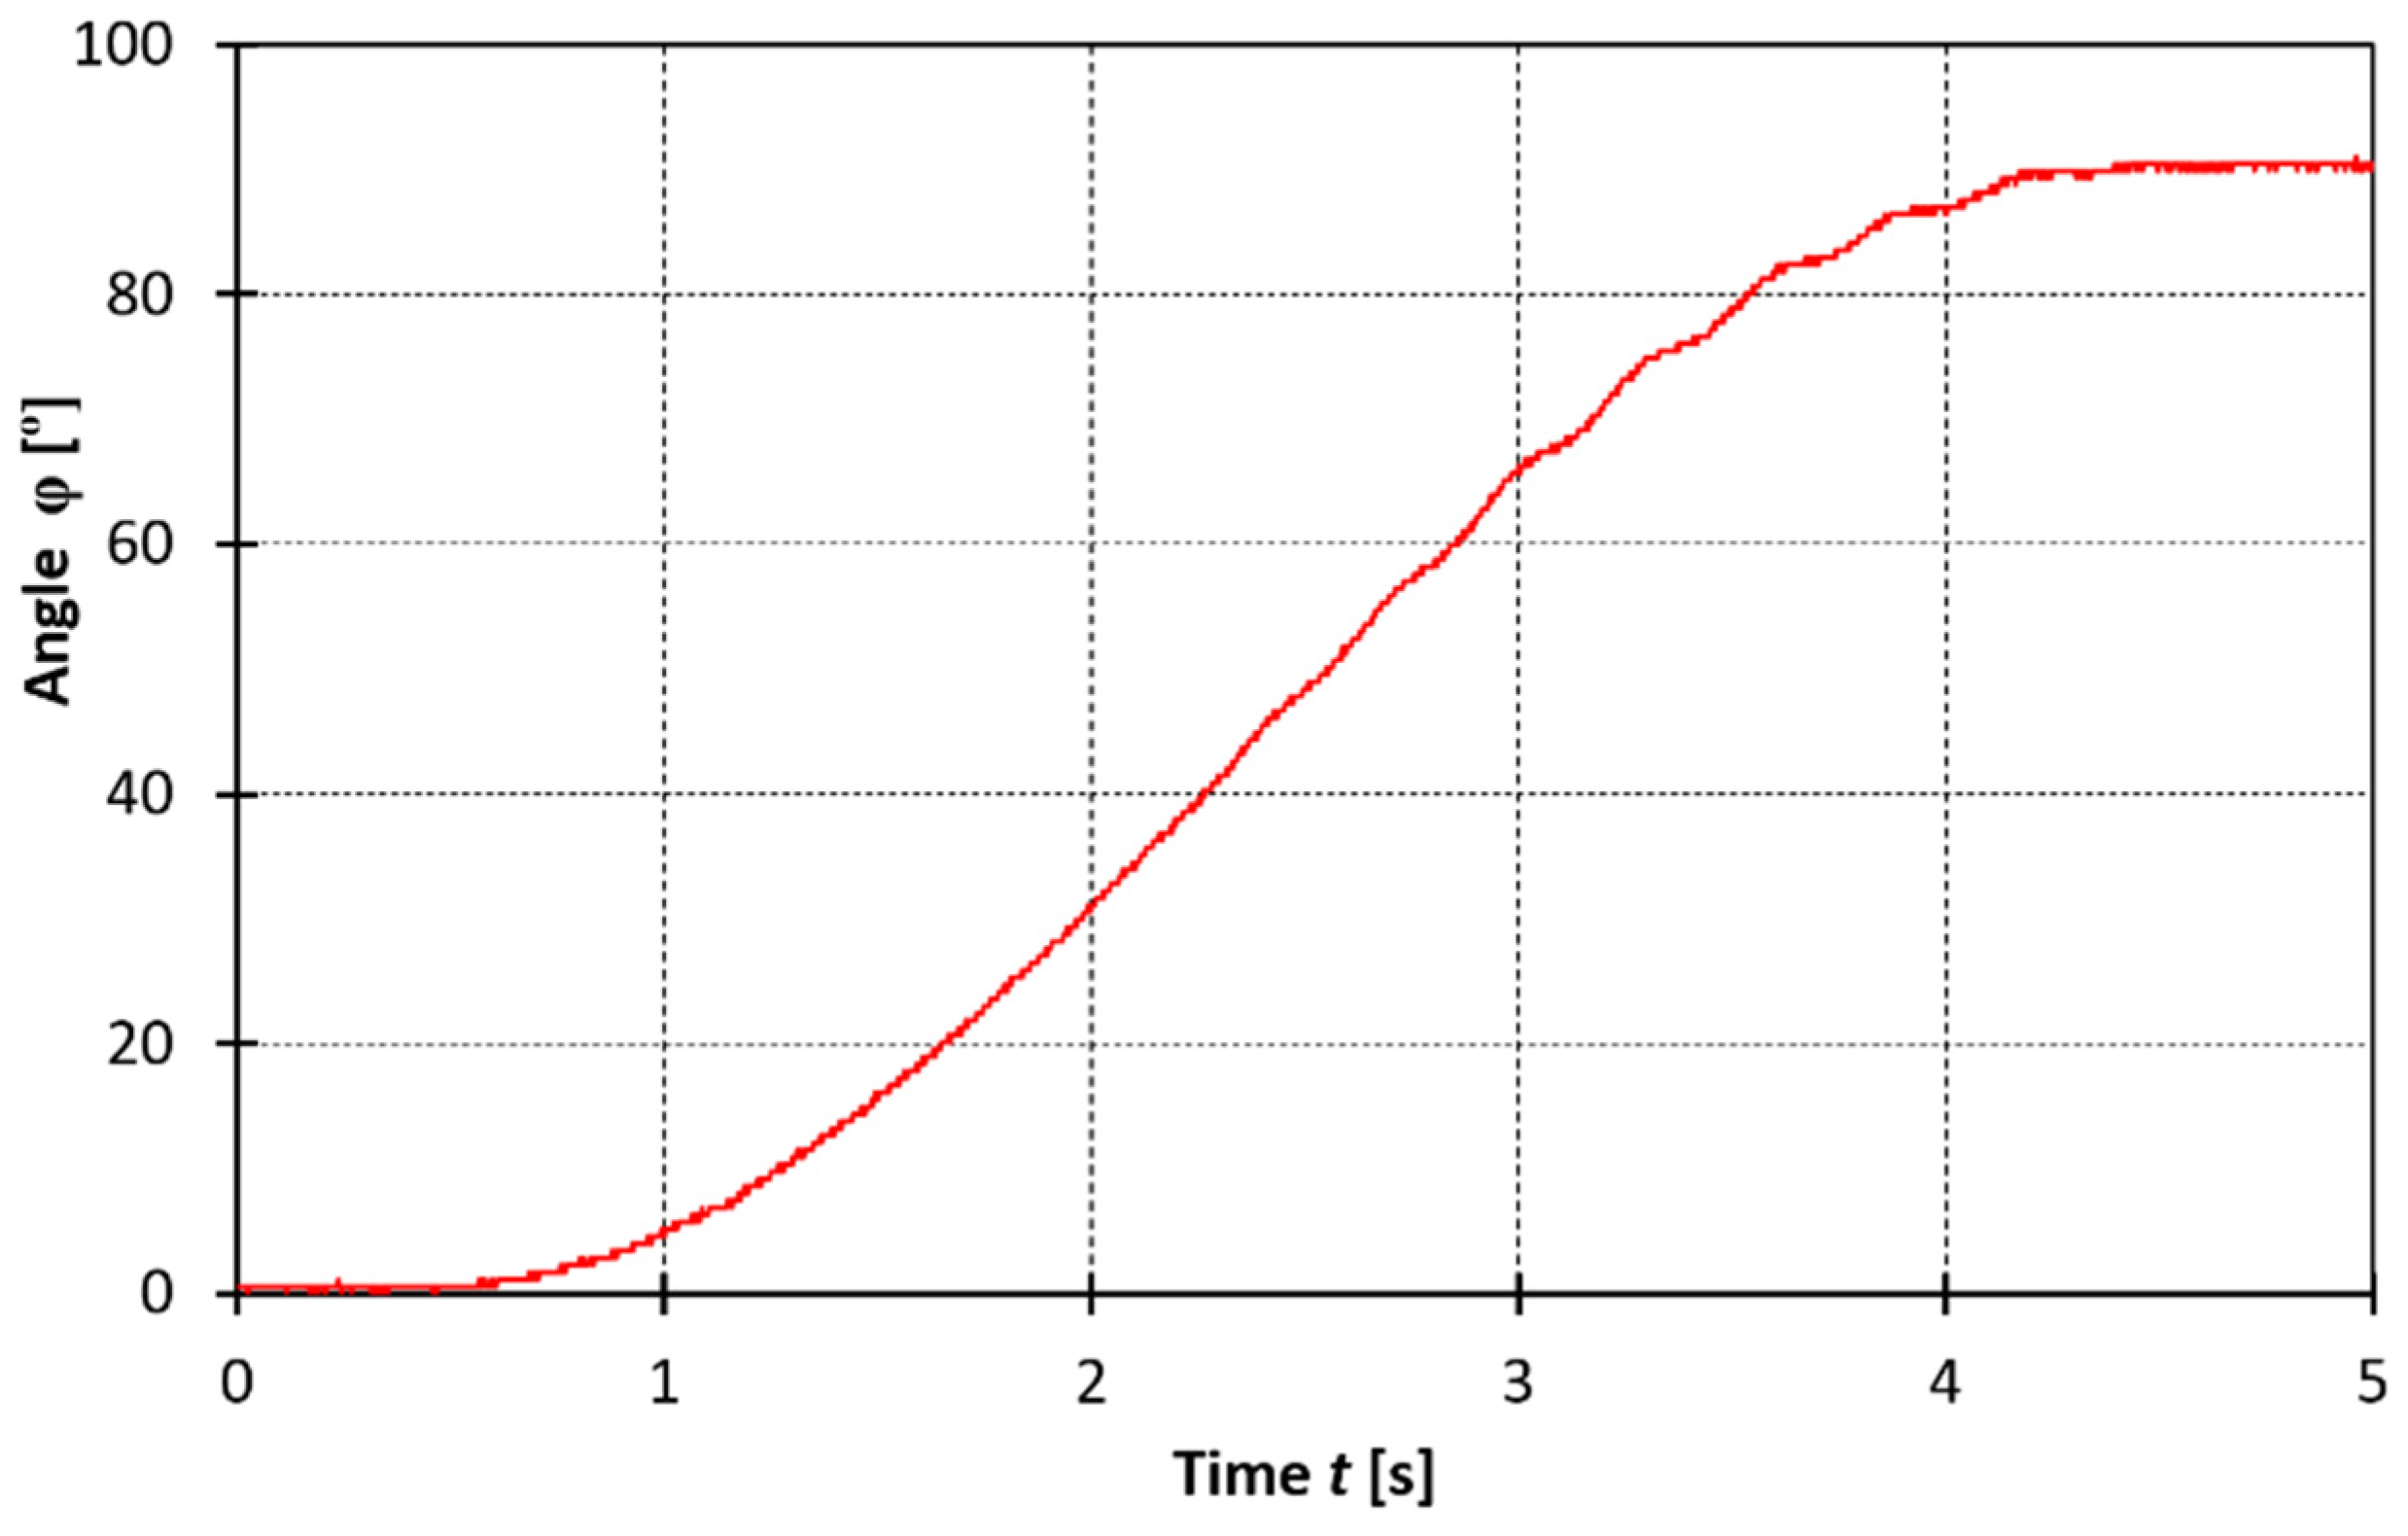
  • Angle α at the joint.
During the instantaneous power calculations, it was assumed that the negative power would not be analysed due to insufficient knowledge about the energy flow in the controller used. In the case of negative power, its value was assumed to be zero in the calculations. Figure 27 shows examples of power courses for the three gear ratios.
The total electric energy consumed by the motor during operation was calculated as the integral of the instantaneous power. The obtained test results are presented in Table 2 and Table 3.
The analysis of the results presented in the tables shows the following:
  • There is a visible relationship between the gear ratio and the electric energy consumed by the drive system during the movement, both at a constant speed and at a sine-profile of the speed;
  • Differences in energy consumption depending on the gear ratio reach exceed even 70% of the highest energy value measured for a given load;
  • The amount of energy consumed depends of course also on the load, but the analysis of the related influence in the situation, when generator operation is dominant, seems to be pointless.

4. Discussion

Both simulation and experimental studies have proved that in drive systems with DC motors, there is a significant influence of the gear ratio on the consumption of electric energy during the implementation of the mechanical functions of the systems. In this situation, it seems obvious to use the existing dependencies to reduce the energy demand of drive systems, particularly those powered by batteries, especially when a heavy set of batteries has to be carried personally by the user of the device. The reported works present one of the possible methods of achieving this goal. The example of actuators of an orthotic robot is representative for a system with programmed control. Therefore, the changes of ratio that are advantageous from an energetic point of view can be predefined and then successfully used during the standard operation of the device.
For this purpose, simulation-determined “maps” illustrating dependency between the gear ratio and the power consumption by the drive systems while they perform their mechanical functions are to be used. The analysis of these maps shows that the gear ratios used to minimise energy consumption change continuously; therefore, the application of a gear for which its ratio can be changed continuously could be considered while reconstructing its predetermined courses. For technical reasons, the authors put this solution aside, starting with a proposal of a simple change of gear ratios, and only between two values. Such an approach is favoured by the fact that even at the current stage, it guarantees a significant energy gain, exceeding 50%, which was what was proved both by computer simulations as well as laboratory experiments. It must be also realised that in the case of many devices, only simple, compact solutions can be used due to limitations concerning their spatial configuration and their overall dimensions or the permissible mass. It corresponds exactly to the case of the considered orthotic robot actuators.
When assessing benefits regarding energy consumption, obtained thanks to the use of a controlled ratio of the gear, it should be noted that the current research has not taken into consideration a possibility of recovering energy in generator areas of the operation of the drive motors (the energy consumption in these areas was assumed to be zero). Future studies will take into account this aspect of the motor operation, which should result in a further reduction in the energy demand of the drive systems.
Additionally, it was planned to test a transmission with a variable ratio, switched in a stepwise manner during the performance of the drive functions. The tests will enable, inter alia, the assessment of the energy consumed while switching the gear ratio and will reveal a possible impact of the gear ratio steps on the implementation of the predetermined motion profiles of the driven mechanisms. Still another idea to be applied is the recovery of energy from the heat dissipated in drive systems, as proposed in the case of an electric vehicle in [20].

5. Conclusions

The proposed method of controlling the drives is considered by the authors as a significant potential allowing for the improvement of electric drive systems of battery-powered mobile devices. In the first place, these improvements may concern drives that perform their functions according to predetermined programs. The method using power consumption maps prepared by means of computer simulations may be useful in this case. This method can be improved by replacing the visual analysis of maps with appropriately selected data processing algorithms. In the nearest future, the authors predict an attempt to extend the tested control method to event-controlled systems, e.g., electric vehicles. An example of such an approach applied for mobile electronic devices has already been presented in [21]. The results obtained by the authors in the form of energy savings at the level of several to ten percent make it possible to look with optimism at the application of the developed original method of controlling the ratio in drive systems with clear, predictable phases of generator operation. The examples of energy consumption reduction in electric vehicles due to the use of special mechanical transmissions described in the articles [3,6] do not exceed 20%. The authors consider their method an important scientific achievement. They also hope that, after conducting additional, planned tests, it will be possible to propose its use also in other biomechanical devices, e.g., portable devices for the rehabilitation of limbs, patient lifts, or rehabilitation beds. However, the most advantageous effects can be obtained in drive systems that operate with cyclically changing modes of operation of the drive motor.

Author Contributions

Conceptualization, K.B. and J.W.; methodology, K.B. and J.W.; software, K.B.; validation, K.B. and W.C.; formal analysis, K.B.; investigation, K.B., J.W. and W.C.; resources, W.C.; data curation, K.B.; writing—original draft preparation, K.B, W.C. and J.W.; writing—review and editing, J.W. and S.Ł.; visualization, K.B. and W.C.; supervision, S.Ł. All authors have read and agreed to the published version of the manuscript.

Funding

This research was partially funded by ECO-Mobility project No. UDA-POIG.01.03.01-14-154/09-00 supported by the European Union. Laboratory experiments were performed within grant No. 504/02790/1143/42.000100 funded by the Dean of Faculty of Mechatronics, Warsaw University of Technology.

Institutional Review Board Statement

Not applicable.

Informed Consent Statement

Not applicable.

Data Availability Statement

Data available upon request.

Conflicts of Interest

The authors declare no conflict of interest.

References

  1. Brandstetter, P.; Vanek, J.; Verner, T. Electric vehicle energy consumption monitoring. In Proceedings of the 15th International Scientific Conference on Electric Power Engineering (EPE), Brno, Czech Republic, 12–14 May 2014; pp. 589–592. [Google Scholar]
  2. Chemali, E.; Preindl, M.; Malysz, P.; Emadi, A. Electrochemical and Electrostatic Energy Storage and Management Systems for Electric Drive Vehicles: State-of-the-Art Review and Future Trends. IEEE J. Emerg. Sel. Top. Power Electron. 2016, 4, 1117–1134. [Google Scholar] [CrossRef]
  3. Khande, M.S.; Patil, A.S.; Andhale, G.C.; Shirsat, R.S. Design and Development of Electric scooter. IRJET 2020, 7, 359–364. [Google Scholar]
  4. Zoss, A.; Kazerooni, H. Design of an electrically actuated lower extremity exoskeleton. Adv. Robot. 2006, 20, 967–988. [Google Scholar] [CrossRef] [Green Version]
  5. Ahssan, M.R.; Ektesabi, M.; Gorji, S. Gear Ratio Optimization along with a Novel Gearshift Scheduling Strategy for a Two-Speed Transmission System in Electric Vehicle. Energies 2020, 13, 5073. [Google Scholar] [CrossRef]
  6. Ritari, A.; Vepsäläinen, J.; Kivekäs, K.; Tammi, K.; Laitinen, H. Energy Consumption and Lifecycle Cost Analysis of Electric City Buses with Multispeed Gearboxes. Energies 2020, 13, 2117. [Google Scholar] [CrossRef]
  7. Verstraten, T.; Furnémont, R.; Mathijssen, G.; Vanderborght, B.; Lefeber, D. Energy Consumption of Geared DC Motors in Dynamic Applications: Comparing Modeling Approaches. IEEE Robot. Autom. Lett. 2016, 1, 524–530. [Google Scholar] [CrossRef]
  8. Jatsu, S.; Savin, S.; Yatsun, A. Improvement of energy consumption for a lower limb exoskeleton through verticalization time optimization. In Proceedings of the 24th Mediterranean Conference on Control and Automation (MED), Athens, Greece, 21–24 June 2016; IEEE: New York, NY, USA, 2016; pp. 322–326. [Google Scholar]
  9. Kim, H.G.; Lee, J.W.; Jang, J.; Park, S.; Han, C. Design of an exoskeleton with minimized energy consumption based on using elastic and dissipative elements. Int. J. Control Autom. Syst. 2015, 13, 463–474. [Google Scholar] [CrossRef]
  10. Choromański, W. (Ed.) Ekomobilność. Tom: II. Innowacyjne Rozwiązania Poprawy i Przywracania Mobilności Człowieka. (“Eco-mobility. Volume: II. Innovative Solutions to Improve and Restore Human Mobility”); WKiŁ: Warsaw, Poland, 2015. (In Polish) [Google Scholar]
  11. Asbeck, A.T.; Schmidt, K.; Walsh, C.J. Soft exosuite for hip assistance. Robot. Auton. Syst. 2015, 73, 102–110. [Google Scholar] [CrossRef]
  12. Onen, U.; Botsali, F.M.; Kalyoncu, M.; Tinkir, M.; Yilmaz, N.; Sahin, Y. Design and actuator selection of a lower extremity exoskeleton. IEEE/ASME Trans. Mechatron. 2014, 19, 623–632. [Google Scholar] [CrossRef]
  13. Savin, S.; Yatsun, A.; Yatsun, S. Energy-Efficient Algorithm of Control of Exoskeleton Verticalization. J. Mach. Manuf. Reliab. 2017, 46, 512–517. [Google Scholar] [CrossRef]
  14. Winter, D.A. Biomechanics and Motor Control of Human Movement, 4th ed.; John Wiley & Sons, Inc.: Hoboken, NJ, USA, 2009; pp. 41–43. [Google Scholar]
  15. Bagiński, K.; Wierciak, J. Forming of operational characteristics of an orthotic robot by influencing parameters of its drive systems. In Progress in Automation, Robotics and Measuring Techniques, 1st ed.; Szewczyk, R., Zieliński, C., Kaliczyńska, M., Eds.; Springer: Cham, Switzerland, 2015; pp. 1–9. [Google Scholar]
  16. Wierciak, J.; Credo, W.; Bagiński, K. Selection of electric driving modules for orthotic robot. In Advanced Mechatronics Solutions, 1st ed.; Jabłoński, R., Březina, T., Eds.; Springer: Cham, Switzerland, 2016; pp. 297–303. [Google Scholar]
  17. Bagiński, K.; Cegielska, A.; Wierciak, J. Modelowanie chodu robota ortotycznego przy różnych długościach kroku. [Modelling the gait of an orthotic robot at different stride lengths]. Przegląd Elektrotechniczny 2014, 5, 82–85. (In Polish) [Google Scholar]
  18. Dunkermotoren. Motors, Gearboxes, Controllers 2021/22; Catalogue; Dunkermotoren: Bonndorf im Schwarzwald, Germany.
  19. Maxon. Precision Drive Systems. Product Range 2021/22; Catalogue; Maxon: Sachseln, Switzerland.
  20. Wei, C.; Hofman, T.; Ilhan Caarls, E.; van Iperen, R. A Review of the Integrated Design and Control of Electrified Vehicles. Energies 2020, 13, 5454. [Google Scholar] [CrossRef]
  21. Tang, Q.; Groba, Á.M.; Juárez, E.; Sanz, C.; Pescador, F. Real-Time Power-Consumption Control System for Multimedia Mobile Devices. IEEE Trans. Consum. Electron. 2016, 62, 362–370. [Google Scholar] [CrossRef]
Figure 1. Structure of a mobile device power supply system.
Energies 15 02674 g001
Figure 2. The orthotic robot designed and manufactured at the Division of Design of Precision Devices at the Faculty of Mechatronics, the Warsaw University of Technology.
Energies 15 02674 g002
Figure 3. The structure of the simulation model.
Energies 15 02674 g003
Figure 4. An example of the course of the hip bend angle in the gait cycle of a healthy person: black line—measurement data; red line—approximation for control needs.
Energies 15 02674 g004
Figure 5. Structure of the drive module with a ball screw.
Energies 15 02674 g005
Figure 6. Block diagram of the drive system.
Energies 15 02674 g006
Figure 7. Graph of the torque transmitted by the hip joint over the entire gait cycle.
Energies 15 02674 g007
Figure 8. Graph of the angular velocity at the hip joint for the entire gait cycle.
Energies 15 02674 g008
Figure 9. The course of the mechanical power.
Energies 15 02674 g009
Figure 10. Effect of the gear ratio on energy demand during one cycle of the gait.
Energies 15 02674 g010
Figure 11. Mechanical trajectory at the hip joint drive during a walk with a cycle period Tc = 3 s and a step length l = 0.46 m.
Energies 15 02674 g011
Figure 12. The load torque courses at the driven joints for step length of l = 0.4 m.
Energies 15 02674 g012
Figure 13. The load torque courses at the driven joints for steps with a length of l = 0.7 m.
Energies 15 02674 g013
Figure 14. The required angular velocity runs at the driven joints for step length of l = 0.4 m.
Energies 15 02674 g014
Figure 15. The required angular velocity course at the driven joints for step length of l = 0.7 m.
Energies 15 02674 g015
Figure 16. Graph of the instantaneous energy demand at the hip joint and the maximum profile error for the tested gear ratios while performing steps of 0.4 m.
Energies 15 02674 g016
Figure 17. Graph of the instantaneous energy demand at the knee joint and the maximum profile error for the tested gear ratios when performing steps of 0.4 m.
Energies 15 02674 g017
Figure 18. Graph of the instantaneous energy demand at the hip joint and the maximum profile error for the tested gear ratios when performing steps of 0.7 m.
Energies 15 02674 g018
Figure 19. Graph of the instantaneous energy demand at the knee joint and the maximum profile error for the tested gear ratios when performing steps of 0.7 m.
Energies 15 02674 g019
Figure 20. Comparison of the energy consumption of a system with a constant and variable ratio.
Energies 15 02674 g020
Figure 21. View of the developed mechanical subsystem.
Energies 15 02674 g021
Figure 22. Block diagram of the test stand.
Energies 15 02674 g022
Figure 23. View of the tested drive system.
Energies 15 02674 g023
Figure 24. Time profile of the angular position at the joint.
Energies 15 02674 g024
Figure 25. Courses of the voltage controlling the motor.
Energies 15 02674 g025
Figure 26. Current consumed by the motor.
Energies 15 02674 g026
Figure 27. Sample courses of the instantaneous power consumed for the three gear ratios while reconstructing a sinusoidal profile of the arm movement.
Energies 15 02674 g027
Table 1. Comparison of energy consumption by the robot systems operating with a constant versus a switchable gear ratio.
Step Length lEnergy Consumed EReduction in
Energy
Consumption
ig = 167 = Const.ig Switchable
mJJ
0.4236.7109.153%
0.7852.6230.473%
Table 2. Values of the energy E1 consumed during reconstruction of a sinusoidal motion profile.
Mass of the Weights
m (kg)
Consumed Energy P1 (J)
is = 1:1is = 2:1is = 4:1
03.025.308.17
51.382.154.66
103.071.402.65
155.971.371.88
Table 3. Values of energy E1 consumed during reconstruction of a triangular motion profile.
Mass of the Weights
m (kg)
Consumed Energy P1 (J)
is = 1:1is = 2:1is = 4:1
03.196.203.68
51.592.862.16
102.842.052.00
154.492.202.71
Publisher’s Note: MDPI stays neutral with regard to jurisdictional claims in published maps and institutional affiliations.

