Article

Numerical Simulation on Heating Effects during Hydrogen Absorption in Metal Hydride Systems for Hydrogen Storage

School of Mechatronic Engineering and Automation, Foshan University, Foshan 528225, China
*
Author to whom correspondence should be addressed.
Energies 2022, 15(7), 2673; https://doi.org/10.3390/en15072673
Submission received: 8 March 2022 / Revised: 29 March 2022 / Accepted: 1 April 2022 / Published: 6 April 2022

Abstract

:
A 2-D numerical simulation model was established based on a small-sized metal hydride storage tank, and the model was validated by the existing experiments. An external cooling bath was equipped to simulate the heating effects of hydrogen absorption reactions. Furthermore, both the type and the flow rate of the cooling fluids in the cooling bath were altered, so that changes in temperature and hydrogen storage capacity in the hydrogen storage model could be analyzed. It is demonstrated that the reaction rate in the center of the hydrogen storage tank gradually becomes lower than that at the wall surface. When the flow rate of the fluid is small, significant differences can be found in the cooling liquid temperature at the inlet and the outlet cooling bath. In areas adjacent to its inlet, the reaction rate is higher than that at the outlet, and a better cooling effect is produced by water. As the flow rate increases, the total time consumed by hydrogen adsorption reaction is gradually reduced to a constant value. At the same flow rate, the wall surface of the tank shows a reaction rate insignificantly different from that in its center, provided that cooling water or oil coolant is replaced with air.

1. Introduction

As a clean and efficient secondary energy source, hydrogen can be used to drive fuel cell vehicles, which are environmental friendly and have a fast charge. This is now deemed to be an important development direction of electric-powered vehicles. Efficient and safe hydrogen storage technology, as the key to hydrogen energy promotion and application, is, at present, a major technical obstacle. Compared with high-pressure gaseous hydrogen storage and liquefied hydrogen storage, solid-state hydrogen storage based on metal hydrides solves problems facing traditional hydrogen storage methods, such as low hydrogen storage density and safety factors. Without a doubt, metal hydride-based solid-state hydrogen storage has a promising application prospect. More particularly, the hydrogen absorption behavior of hydrogen storage alloy directly determines hydrogen energy utilization efficiency, which not only depends on the properties of hydrogen storage alloys but is also influenced by the materials of the reaction tank and the heat transfer performance of the structure [1]. In this scenario, we need to analyze both distribution and variations of temperature and hydrogen storage capacity of the hydrogen absorption alloy during hydrogen absorption for the purpose of predicting the hydrogen absorption efficiency of the alloy.
In terms of hydrogen storage alloys, how to improve their hydrogen absorption efficiency should be highlighted during research. Firstly, the hydrogen absorption reaction of the hydrogen storage alloy is exothermic, and there are certain differences in heat transfer properties of many hydrogen absorption alloys. Furthermore, the hydrogen absorption efficiency of such alloys depends on their heat transfer properties and hydrogen absorption behavior. Therefore, temperature distribution during hydrogen absorption by the alloys can be calculated by solving an equation expressing heat transfer inside the hydrogen storage tank. Secondly, the hydrogen absorption reaction rate determines the heat production rate of the hydrogen storage tank. In this aspect, a kinetic model of the hydrogen absorption reactions can be built to analyze the impacts of temperature and the mass fraction of reactants on both the reaction rate and the pressure intensity required by the equilibrium of reaction, and further predict the hydrogen absorption behavior of the alloys. Currently, axisymmetric reaction tank models and the reaction kinetics model, built through the coupling of heat and mass balance equations, are utilized in most cases to carry out a numerical simulation on the hydrogen absorption reactions of hydrogen absorption alloys. For instance, a dual-temperature model was established by Jemni et al [2]. during their numerical simulation on hydrogen absorption reactions, and the model was utilized to calculate the temperature values of the hydrogen storage alloy and the gaseous hydrogen. Additionally, the model was compared with another model constructed based on the local thermal equilibrium between metal hydride and gaseous hydrogen, proving that the maximum temperature difference of them is approximately 1 K, which only lasts for a short time. Therefore, they deemed that the impacts of local thermal equilibrium of the metal hydride on the model can be neglected. By extending the research made by Jemni et al. [3], Askri et al. [4] compared the hydrogen absorption reaction processes of hydrogen absorption tanks made from different materials and designed in various structures. It was demonstrated that the hydrogen absorption reaction rate of a tank provided with a cooling pipe in its central area could be improved by 80% compared with that without any cooling pipe. Moreover, some hydrogen absorption reaction models are simplified by assuming that local thermal equilibrium exists between the hydrogen storage alloy and the gaseous hydrogen [5,6,7,8,9,10,11,12,13,14,15,16,17,18,19,20,21,22].
In porous alloys, the flow rate of hydrogen is rather small. Considering this, impacts of pressure drop or advective heat transfer in reaction zones are ignored in many numerical analyses [2,3,4,5,6]. According to some numerical models for hydrogen absorption reactions, it is assumed that hydrogen absorption equilibrium pressure intensity is merely associated with temperature [7], which overlooks a relationship between the equilibrium pressure intensity and the H/M atomic ratio. Through simulation, the 3-D hydrogen absorption reaction model was verified by Nam et al. [8], and it is also pointed out that a numerical model that takes alloy temperature and hydrogen content in the alloy produces better fitting effects. In the process of their simulation experiment, pressure intensity at the hydrogen inlet was altered to analyze the influence of inlet pressure intensity on hydrogen absorption reactions. As shown by experimental results, increasing hydrogen transportation pressure intensity has the potential to both raise hydrogen storage rate and lower the cooling burden of the corresponding hydrogen storage tank. However, the research made by Nam et al. seldom involved the optimization of the materials and structures of the reaction tanks. In addition, massive research results verify a hydrogen absorption reaction model of LaNi5 alloy, including a flow mechanism of gaseous hydrogen in porous or non-porous medium, and the heat and mass transfer kinetics model for hydrogen absorption and desorption reactions, as well as combining calculations for mass conservation, momentum conservation, and energy conservation equations inside the reaction tank.
As the hydrogen absorption reaction mechanism is more profoundly comprehended, it seems particularly important to optimize the heat transfer structures of the reaction tank and further improve hydrogen storage behavior based on the heat transfer characteristics of alloys during hydrogen absorption reactions. Chippar et al. [9] proposed a stackable metal hydride reactor utilizing compartmentalization. Through numerical simulation, they found that a hydrogen absorption reactor with compartments could increase the contact surface between the alloy and the heat transfer zone, so that the temperature distribution in the reaction zone more uniform and effectively improves the hydrogen absorption efficiency of the reactor. Chandra et al. [10] designed a hydrogen storage reactor with internal conical fins and heat exchange tubes, which could be filled with 5 kg LaNi5 alloy. According to the numerical simulation results, it was found that the conical fin had a larger surface area, and a conical fin with a funnel effect can more effectively fill the hydrogen storage alloy powder, thus providing a better heat transfer effect. Mghari et al. [11] proposed the use of a phase change materials (PCM) to absorb the heat generated in the process of hydrogen absorption, and then use it in the process of hydrogen desorption. The effects of thermal conductivity and latent heat of PCM on hydrogen absorption and desorption were analyzed by establishing a two-dimensional coupling model of metal hydride and PCM. Chibani et al. [12] established a two-dimensional numerical model to study the hydrogen absorption reaction process in a metal hydride reactor; the results showed that the reaction rate coefficient, activation energy, thermal conductivity, and inlet pressure had a great impact on bed temperature and hydrogen absorption rate. Lewis et al. [13] proposed the integration of an embossed plate heat exchanger (EPHX) inside the metal hydride reactor, and studied the heat transfer performance and hydrogen absorption reaction characteristics of the reactor by numerical simulation.
On account of the above analyses, a numerical model has been established for hydrogen absorption reactions of the LaNi5-based metal hydride system for hydrogen storage. In addition to considering alloy temperature and hydrogen absorption capacity changes, the accuracy of the model was verified by comparison with the existing hydrogen storage tank temperature data measured during hydrogen absorption reaction experiments. On the basis of this model, an external heat dissipation channel is additionally provided for the tank on one hand; on the other hand, simulation analyses are made on the influence rules of flow rates and types of different cooling media on hydrogen absorption reaction temperature and hydrogen absorption capacity, provided that a cooling bath is equipped out of the reaction tank.

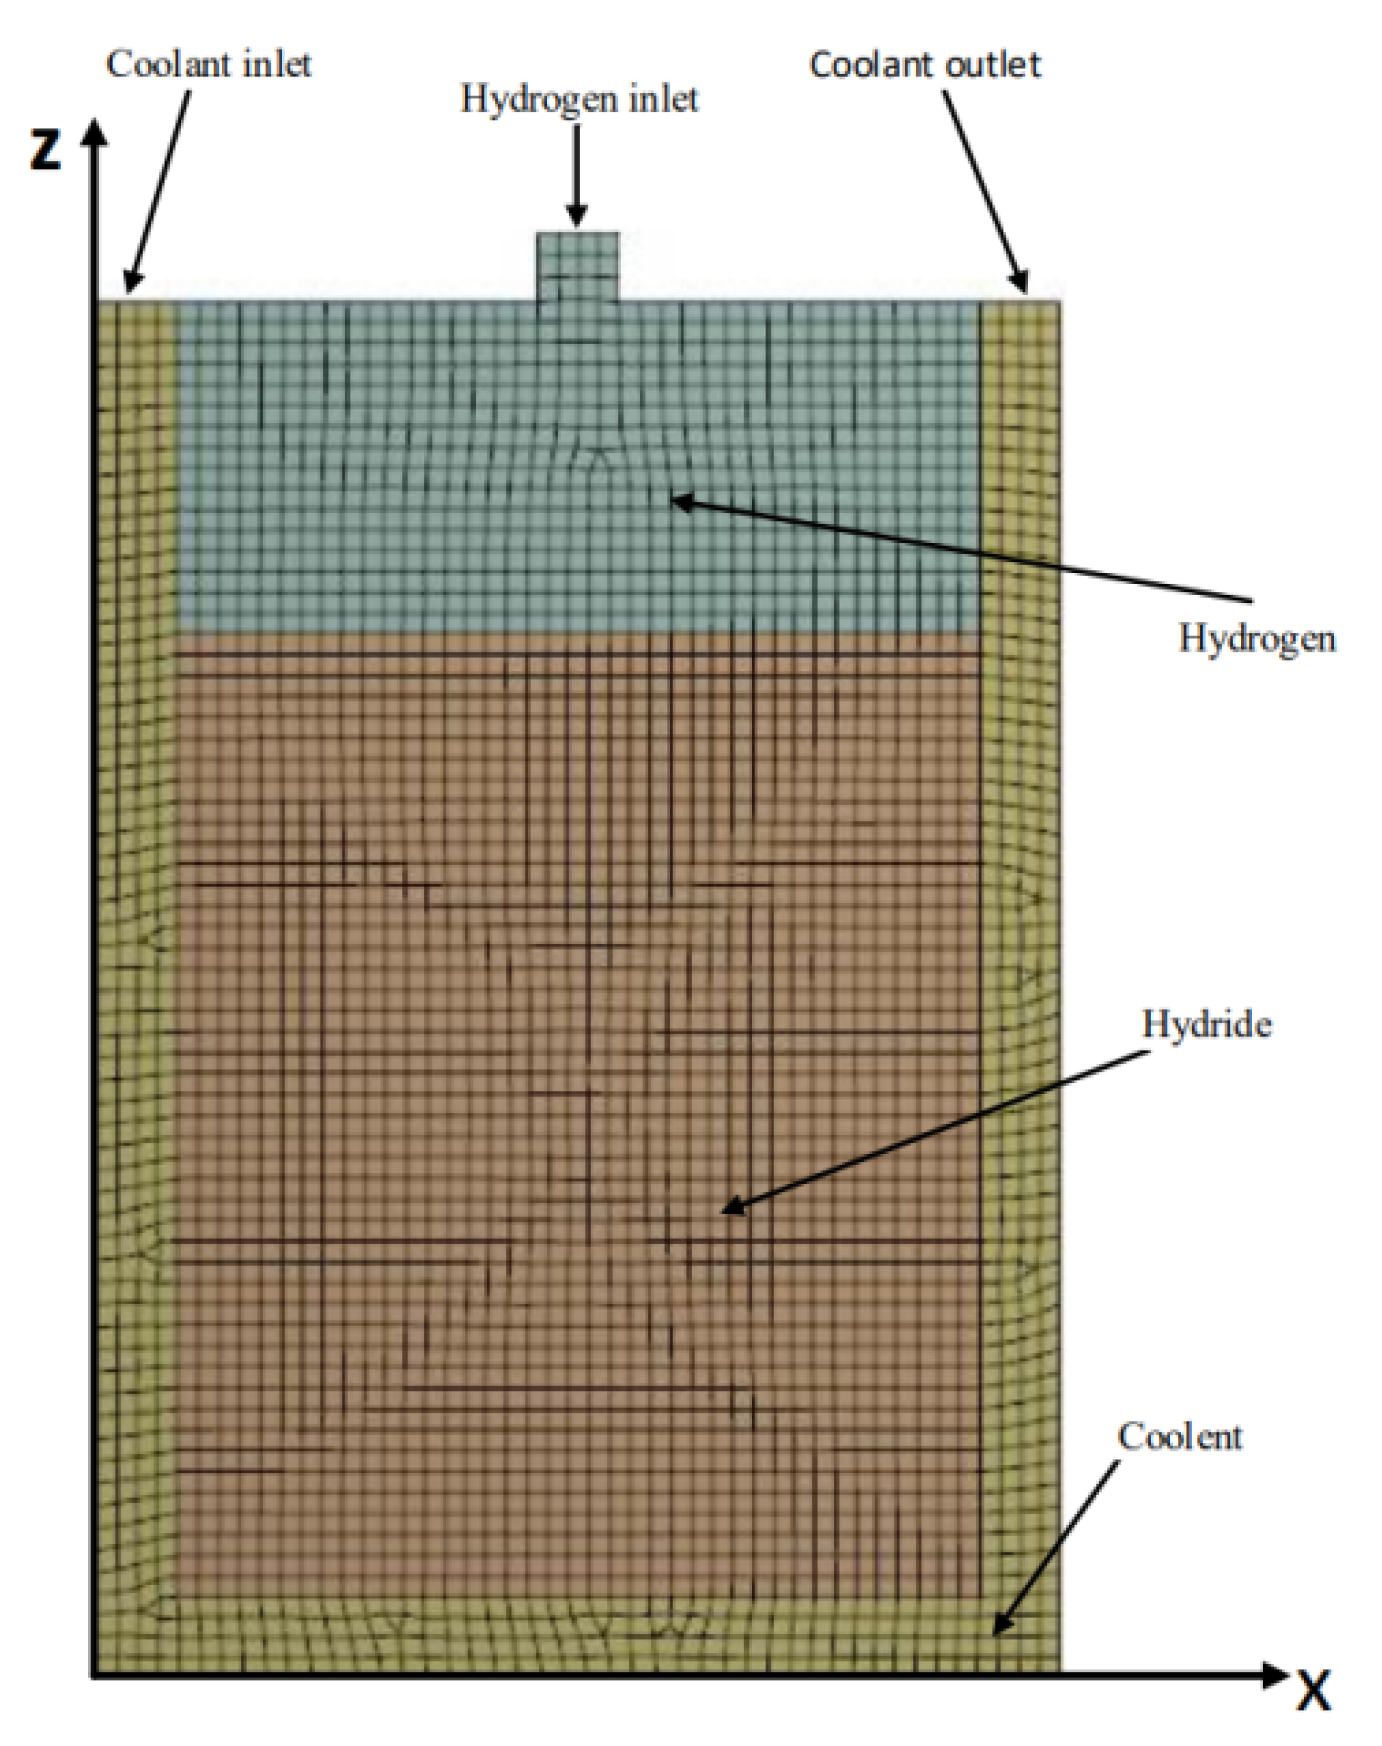
2. Numerical Model Building

A numerical model of hydrogen absorption reactions was established for hydrogen storage alloys, and the model was further utilized to acquire temperature and hydrogen storage capacity distribution details in the process of such reactions. To improve the solving efficiency of coupled equations, the following assumptions are made for the model [3,8]:
(1)
Hydrogen is assumed to be an ideal gas, and relevant physical parameters conform to the ideal gas law;
(2)
Local thermal equilibrium is assumed to exist between solid metal and hydrogen;
(3)
Metal hydride volume expansion during hydrogen absorption is assumed to be negligible;
(4)
Metal powder is assumed to possess uniform pore characteristics (e.g., pore size and porosity);
(5)
Properties such as porosity, permeability, and heat conductivity coefficient, etc., of the metal hydride are assumed to remain unchanged in the hydrogen absorption process.
Based on the above assumptions, the following three conservation laws should be followed by the numerical model built for reaction zones in the metal hydride system for hydrogen storage: mass conservation, momentum conservation, and energy conservation.

2.1. Conservation Equations for the Reaction Zone

Firstly, mass conservation in the hydrogen and the hydrogen storage alloy areas was analyzed. For the hydrogen item, a mass conservation expression can be written as follows:
ε ρ H t + ( ρ H v ) = S m
where, ρ H refers to hydrogen density, ε to the porosity of hydrogen storage alloys, and v to the hydrogen velocity vector. In addition, S m , a source item of mass, has a physical meaning that represents the mass stored in unit time by converting gaseous hydrogen in a unit volume to metal hydride in a solid state. As revealed in this expression, mass variations of hydrogen primarily consist of hydrogen flow and the hydrogen absorption reaction in the pore zone. Regarding the ideal gas, hydrogen density, ρ H , can be denoted by the following Equation (2):
ρ H = P H M H R T
where, P H is hydrogen pressure; M H is the molecular mass of hydrogen; and R and T are, respectively, gas constant and temperature. In terms of the hydrogen storage alloy item, its mass conservation expression is presented below.
( 1 ε ) ε ρ M t = S m
In the above equation, ρ M represents the alloy density. According to Equations (1) and (3), the hydrogen absorption mass of the metal hydride in unit volume and unit time is a function of its density, and the mass can also be denoted by the sum of hydrogen density variation in the pore zone and a hydrogen flux in the hydrogen zone. Moreover, the source item, S m , of mass can be written as [3,6,23].
S m = C a exp ( E a R T ) ln ( P H P e ) ρ M [ ( H M ) e ( H M ) ]
where C a stands for a hydrogen absorption speed constant, E a for the activation energy of hydrogen absorption reactions, P e for equilibrium pressure of hydrogen absorption reactions, and ( H / M ) e is a specific value of the number of hydrogen atoms to that of metal atoms in a state of equilibrium of reaction for the hydrogen absorption capacity of the hydrogen absorption reaction. In the above equation, P e is expressed in the following Van’t Hoff equation [3,6,23].
P e = exp ( Δ H R T Δ S R ) = f ( H M ) exp ( Δ H R ( 1 T 1 T e ) )         = ( a 0 + i = 1 7 a i ( H M ) i ) exp ( Δ H R ( 1 T 1 T e ) )
where Δ H and Δ S are, respectively, reaction entropy and enthalpy changes of hydrogen absorption reaction, T e refers to the reference temperature, f ( H / M ) to an interpolating polynomial [24], and a0, …, ai (i = 7) to an interpolating polynomial coefficient. As can be seen from this equation, the equilibrium pressure of the hydrogen absorption reaction is primarily under the influence of reaction temperature and an atomic ratio H / M . In Equation (5), the P-C-T curves of hydrogen absorption reactions in different temperature conditions are depicted for the LaNi5-based hydrogen storage alloy, and the curves are also compared with the measured data of the experiment. As shown in Figure 1, it is demonstrated that the fitting curves truthfully reflect the hydrogen absorption process of a hydrogen absorption alloy at various temperatures.
Moreover, momentum conservation can be defined for the hydrogen absorption area, as expressed in the following equation.
1 ε [ ρ H v t + 1 ε ( ρ H v v ) ] = P + τ + ρ H g + S v
In the above Equation (6), τ is shear stress. S v , the viscous resistance, is produced due to the existence of viscous resistance, and it represents the loss of momentum incurred when the hydrogen is flowing in a porous hydrogen storage alloy. Therefore, S v is equal to zero as far as the non-porous area of a hydrogen storage alloy is concerned, but for a porous area, S v can be expressed as follows.
S v = ( μ K ) v
where, μ is dynamic viscosity and K is permeability.
Finally, energy conservation is determined for the reaction zone, and it can be expressed in Equation (8) below.
ρ C p ¯ T t + ( ρ H c p H T v ) = ( k e T ) + S T
This is a governing equation for energy conservation of the energy source item, S T , caused by the chemical reactions taking place during hydrogen storage by an alloy. In the process of hydrogen storage reactions of alloy, energy transfer in the central reaction zone satisfies the law of energy conservation. To be specific, ρ C p ¯ stands for the total heat capacity of the reaction zone and k e stands for an effective thermal conductivity coefficient; regarding ρ C p ¯ and k e , they are expressed in the equations below, respectively.
ρ C p ¯ = ( 1 ε ) ρ M C p M + ε ρ H C p H
k e = ( 1 ε ) k M + ε k H
In Equation (10), the effective thermal conductivity coefficient, k M , in the hydrogen storage alloy area is a linear composite function of the atomic ratio, H / M , which is
k M = ( H M ) / ( H M ) s a t k M H + [ 1 ( H M ) / ( H M ) s a t ] k M
In Equation (8), S T represents the quantity of heat released during a hydrogen absorption reaction and can be expressed in Equation (12) below.
S T = S m [ Δ H T ( C p H C p M ) ]

2.2. Subsection

It is assumed that the reaction zone is initially in a state of thermodynamic equilibrium; then, initial conditions for the numerical model of hydrogen absorption reaction can be defined as: T = T 0 , P = P 0 , ρ M = ρ 0 M . Considering that no hydrogen exists in the reaction zone in the initial state, it is deemed that ρ 0 H = 0, and the initial flow rate of hydrogen is denoted as v 0 = 0 . By virtue of a convection boundary condition, heat transfer on the tank wall surface is calculated depending on the following equation.
k e T n = h ( T T s )
where, n stands for an outward unit vector perpendicular to the wall surface, T s for cooling temperature during hydrogen absorption, and h for heat transfer coefficient. Additionally, a boundary condition is established for the hydrogen inlet to figure out a particular temperature, pressure intensity, and hydrogen flow rate. In terms of numerical simulation on the hydrogen absorption model for alloys, it is primarily carried out by virtue of Fluent, the business software of hydromechanics; specifically, hydrogen absorption reactions are simulated by configuring the chemical reaction model and material parameters in Fluent. The main parameters are listed in Table 1 below.
The relevant calculation principle has been presented in Figure 2. According to Equations (4) and (5), hydrogen absorption reaction rate is associated with pressure intensity, temperature, and atomic ratio in the reaction zone. In this consideration, a macro definition in an option of User-Defined Functions in the Fluent based chemical reaction model was selected to read temperature, T, pressure intensity, P, and alloy mass fraction, Y, of this cell at a certain moment. On this basis, the reaction rate at this moment can be deduced for this cell and then imported into the corresponding reaction model. In this way, a decoupling calculation can be conducted for relevant physical parameters.

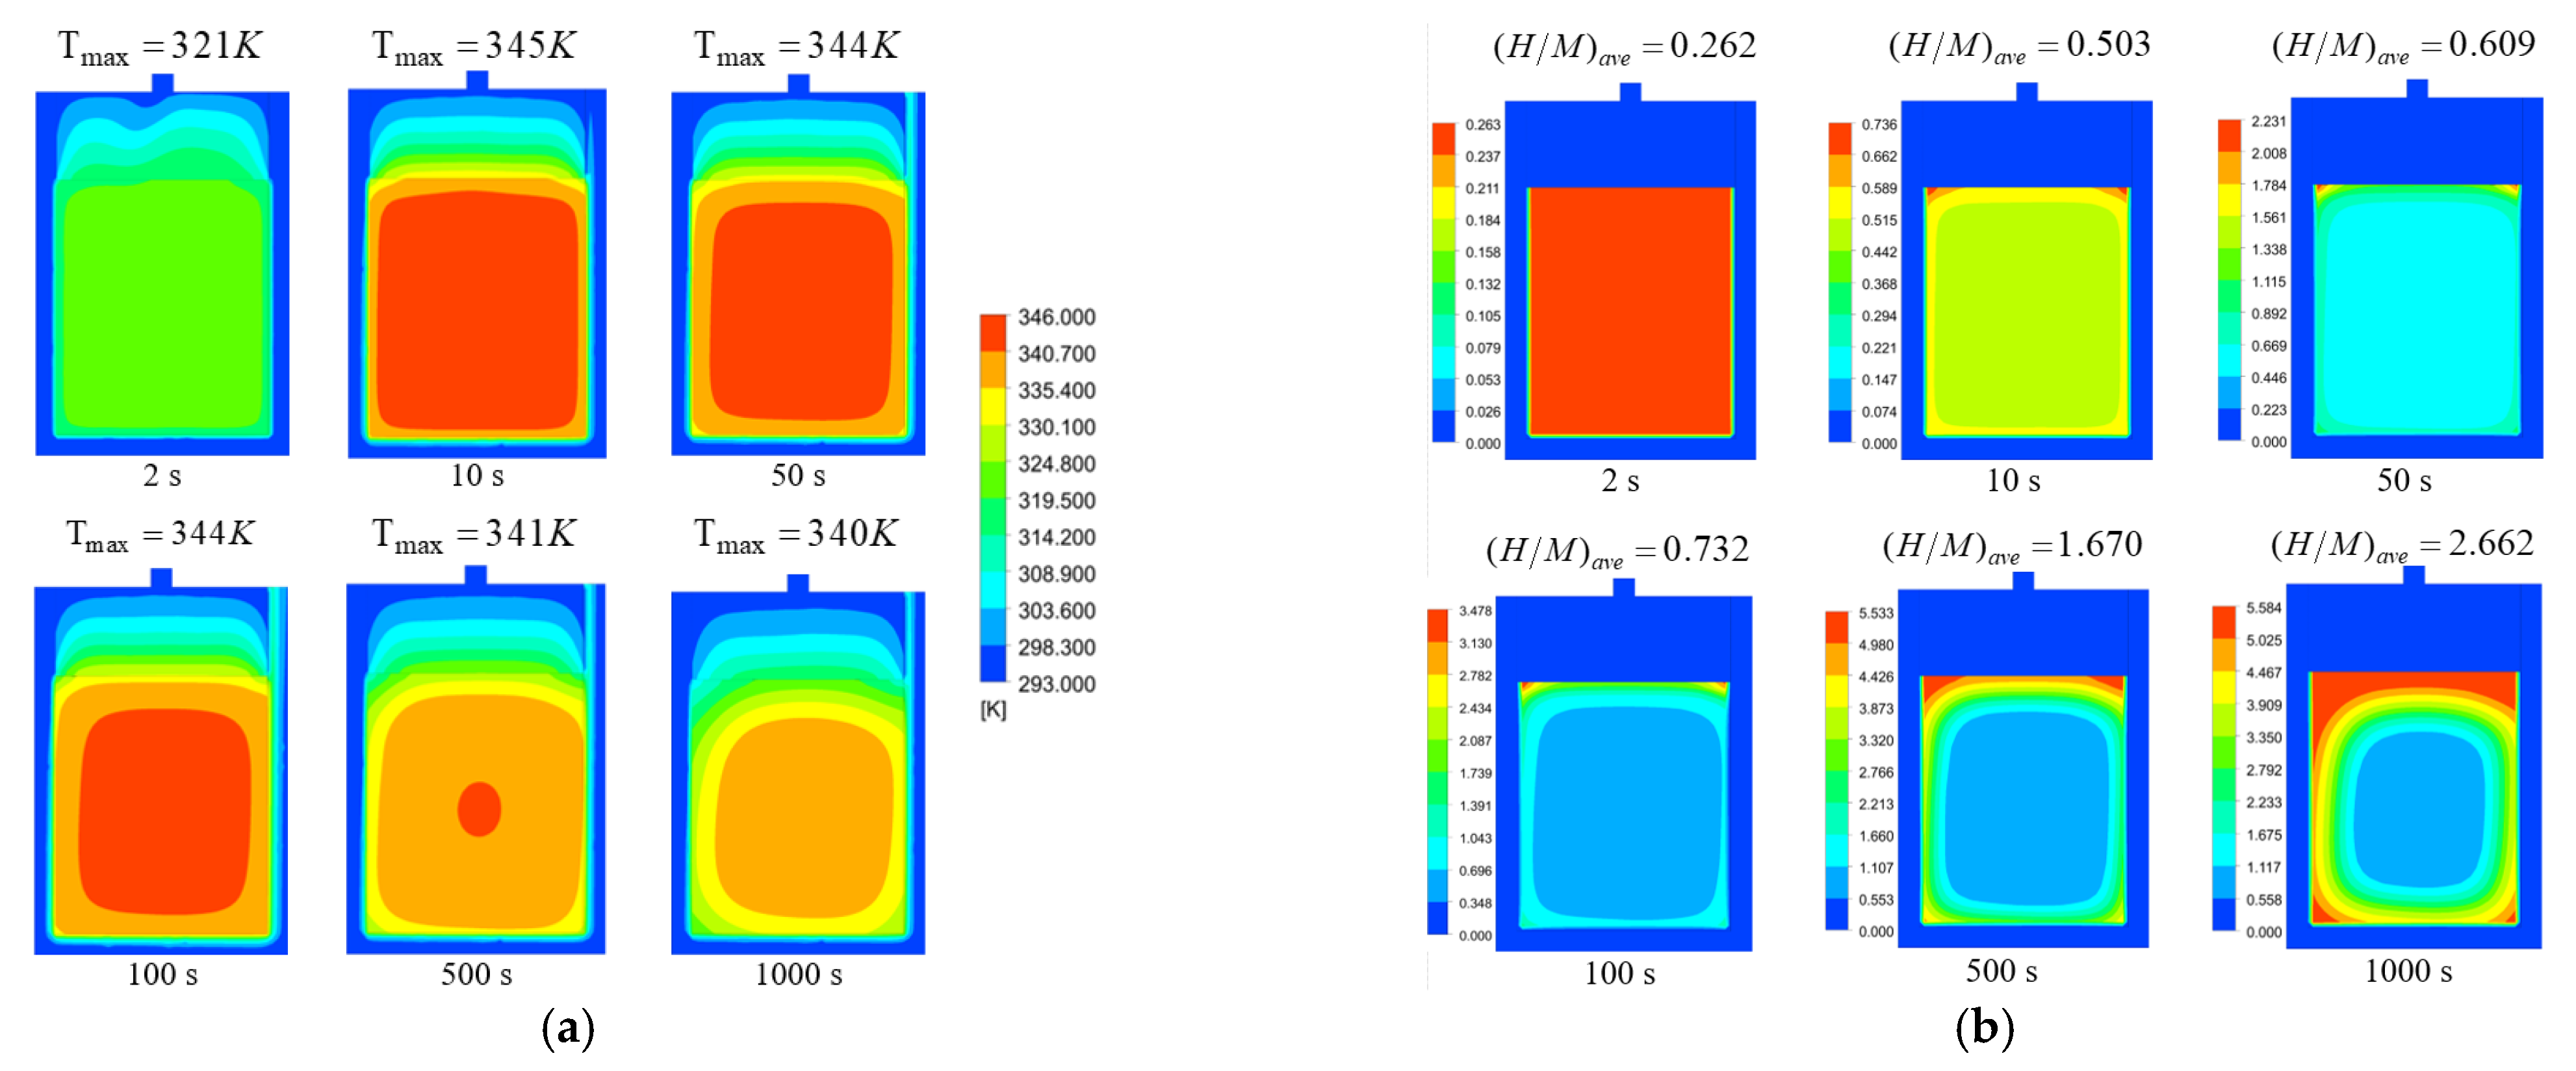
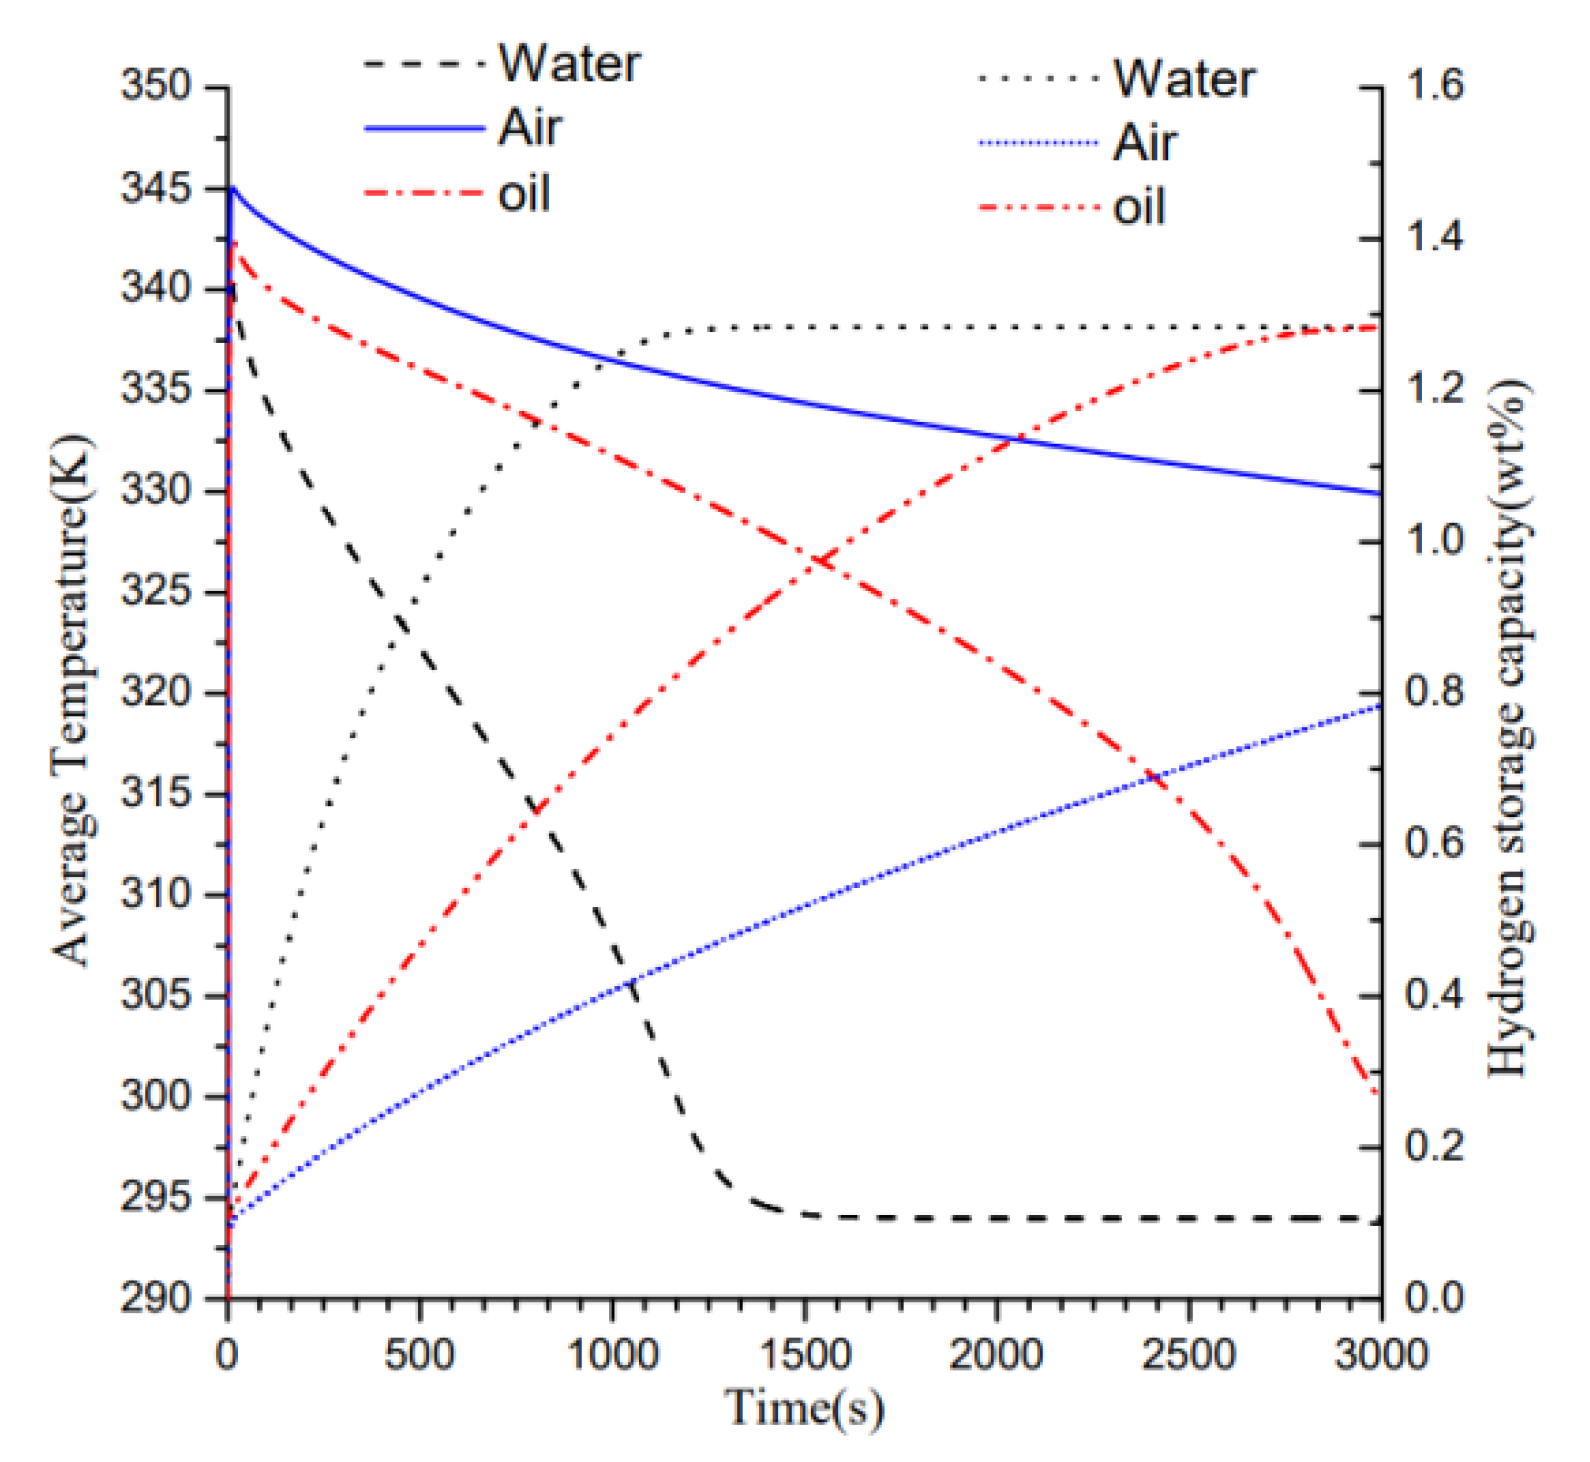
3. Results and Discussions

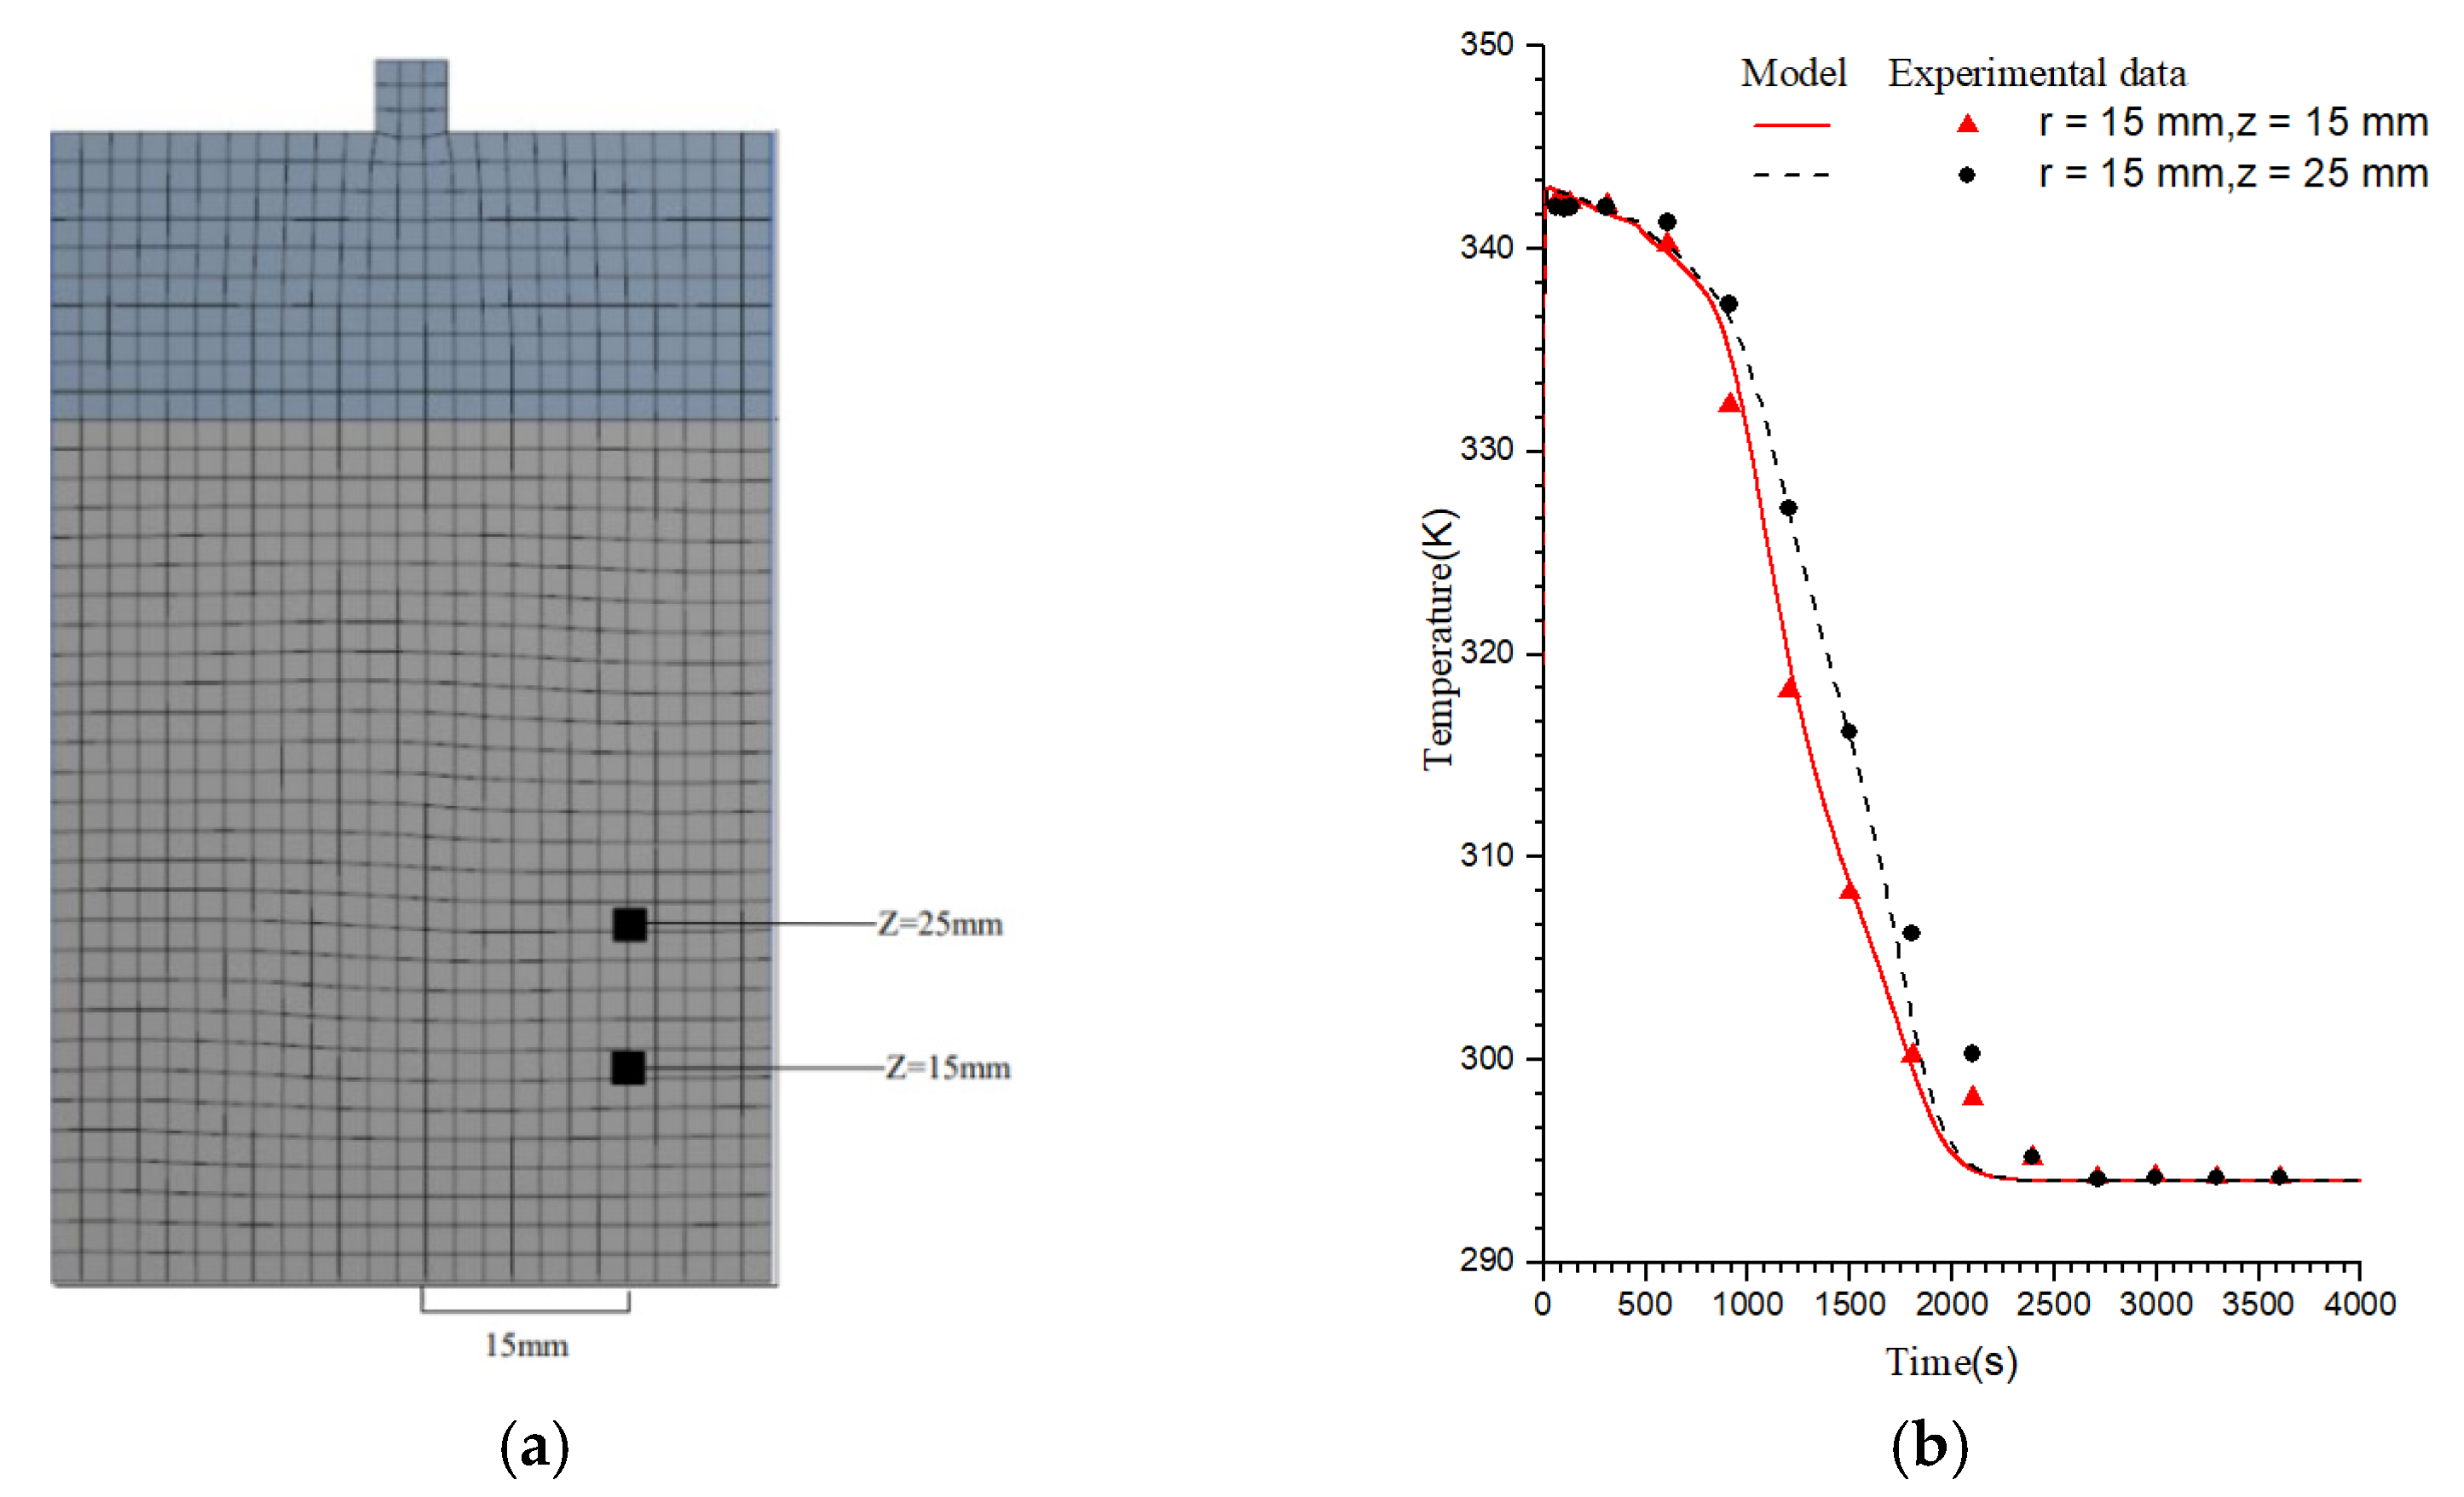
3.1. Model Validation

To validate the accuracy of the hydrogen absorption reaction numerical model, hydrogen absorption tests performed by Jemni et al. [3] for hydrogen storage alloys were used for reference to establish a numerical model of chemical reactions, as given in Figure 3a. Moreover, numerical simulation on hydrogen absorption reactions was carried out as well. The tests performed by Jemni et al. were carried out in a tank with a radius of 25 mm and a height of 80 mm. Moreover, the initial pressure intensity and temperature were set at 10 bars and 294 K, respectively. During the test, temperature variation curves were obtained for hydrogen absorption reactions at the sites (radius: 15 mm), respectively, 15 mm and 25 mm high in the tank.
At the measuring points, experimental and simulated temperature variation curves are portrayed in Figure 3b. It is shown by the relevant results that temperature variations at the measuring points of the numerical model preferably match the corresponding experimental data. At the initial stage, the overall hydrogen absorption reaction is rather fast inside the hydrogen storage tank; in this case, both temperature and hydrogen storage capacity in the tank abruptly go up. Moreover, the peak temperature within the tank reaches 343 K. As the internal temperature rises, the overall hydrogen absorption reaction rate begins to decline gradually. Considering that the tank wall surface plays a role in heat dissipation, the hydrogen absorption reaction firstly takes place on the wall surface and then extends towards the center of the tank. Therefore, the temperature curves obtained by the experiment are adjacent to a measuring point, with z = 25 mm in the central location of the tank; comparatively, the temperature drop takes a significant amount of time.
Because the hydrogen absorption rate of a hydrogen storage alloy is closely related to the heat dissipation performance of the reaction tank wall surface, a 2-D metal hydrogen storage tank model has been designed (see Figure 4) to further explore the impacts of flow rate and types of cooling media on the hydrogen absorption reactions of the hydrogen storage tank. Specifically, the proposed model consists of three zones: a pure hydrogen zone, a hydrogen storage alloy zone, and a cooling medium zone. Moreover, the model has been provided with three openings of a cooling medium inlet, a cooling medium outlet, and a hydrogen filling inlet. By altering the flow rates of the types of cooling media selected for the simulation model, analyses are made of the heat and mass transfer behavior in the hydrogen storage tank.

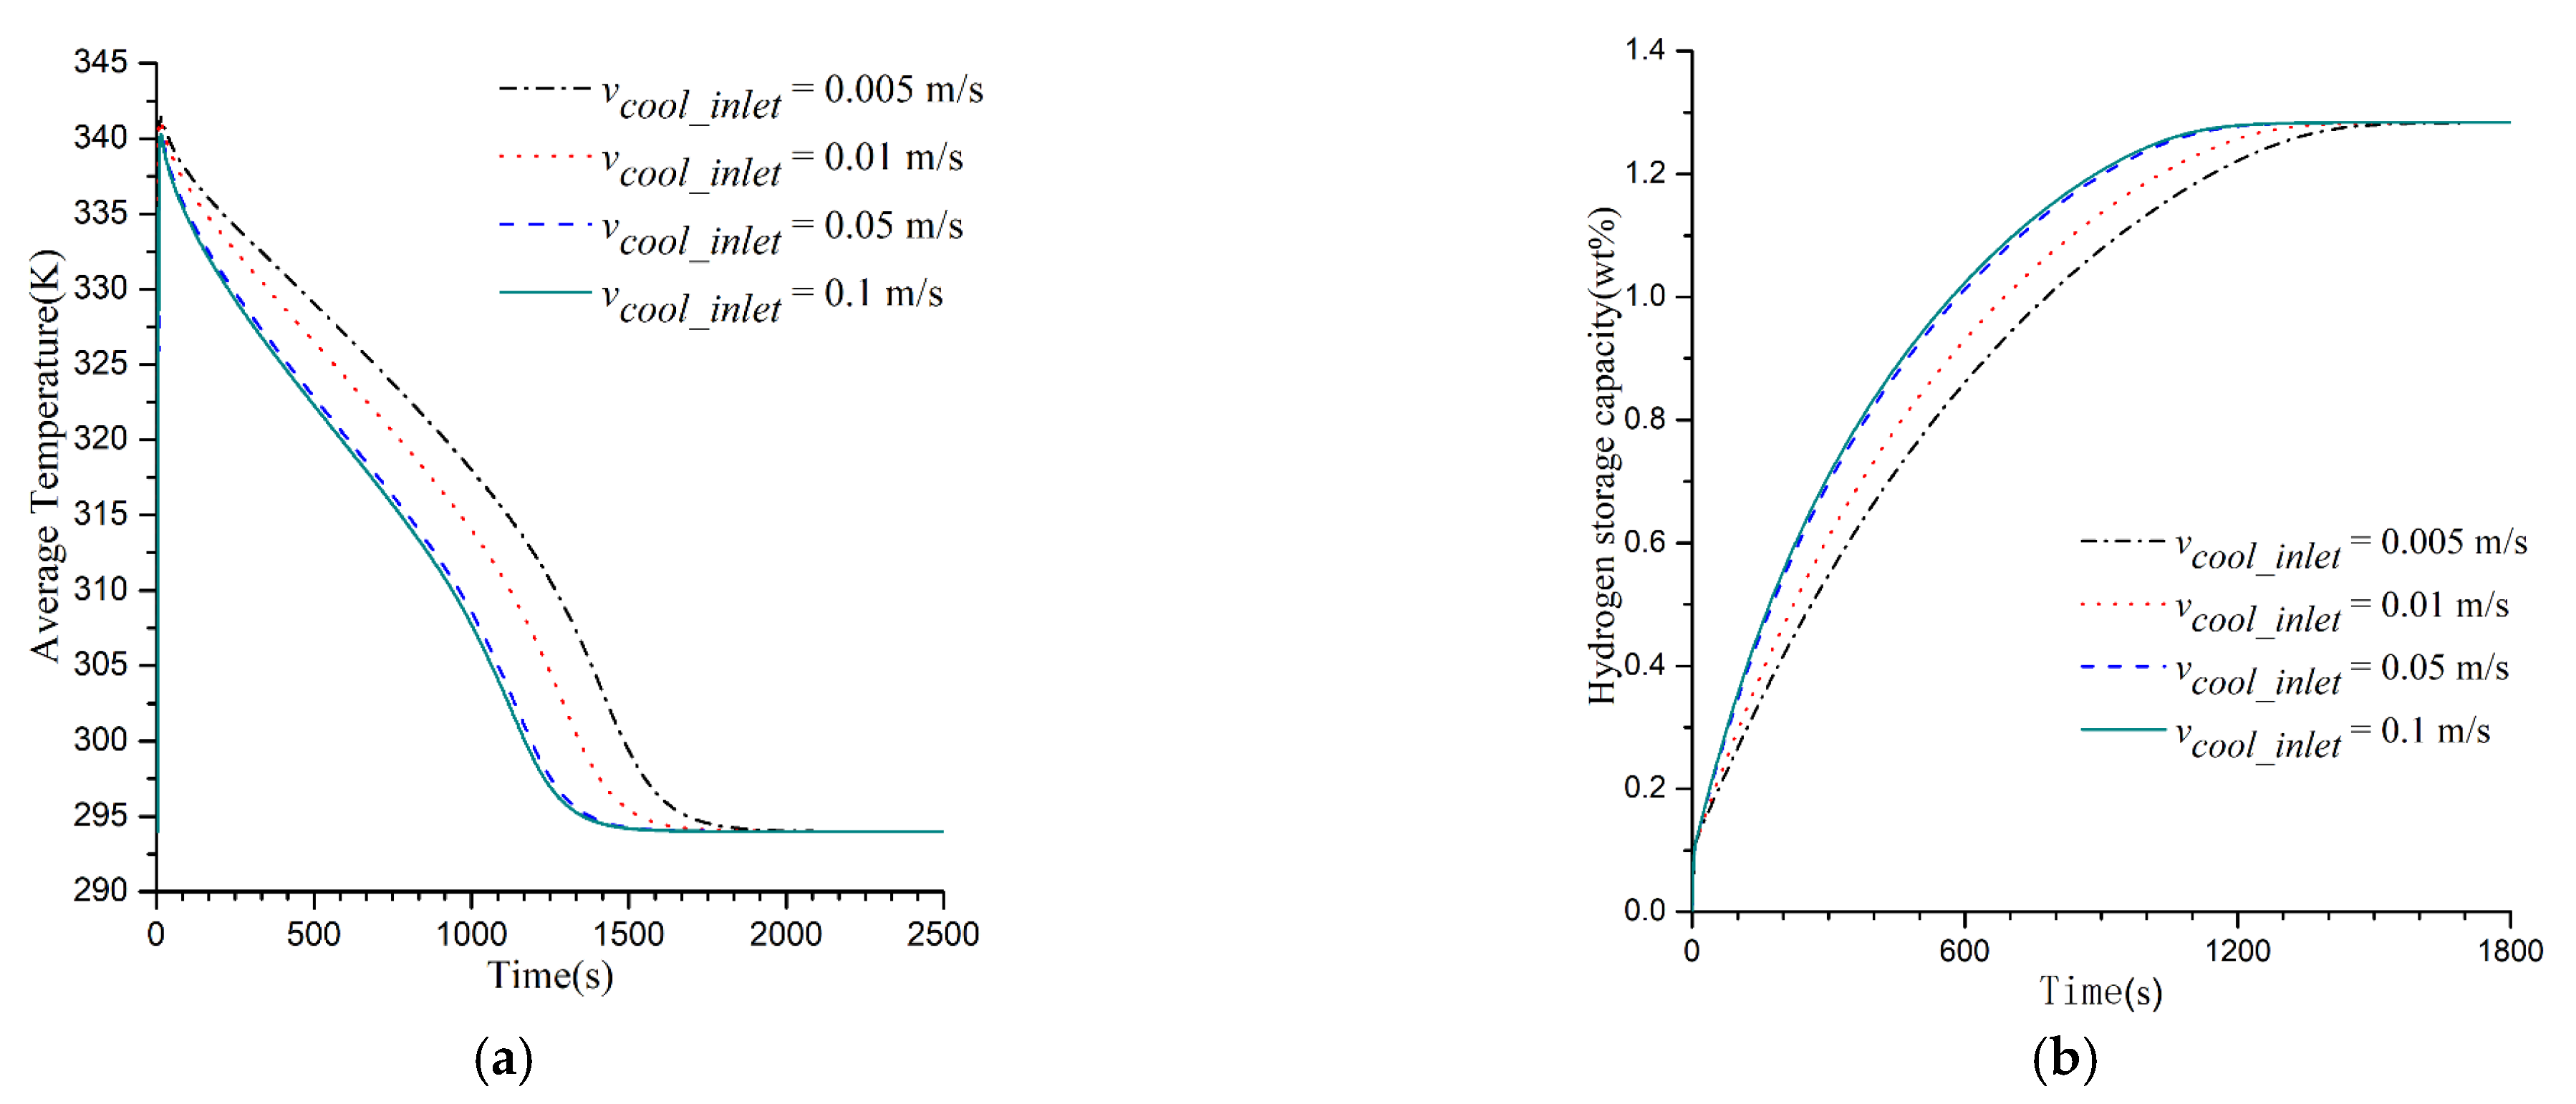
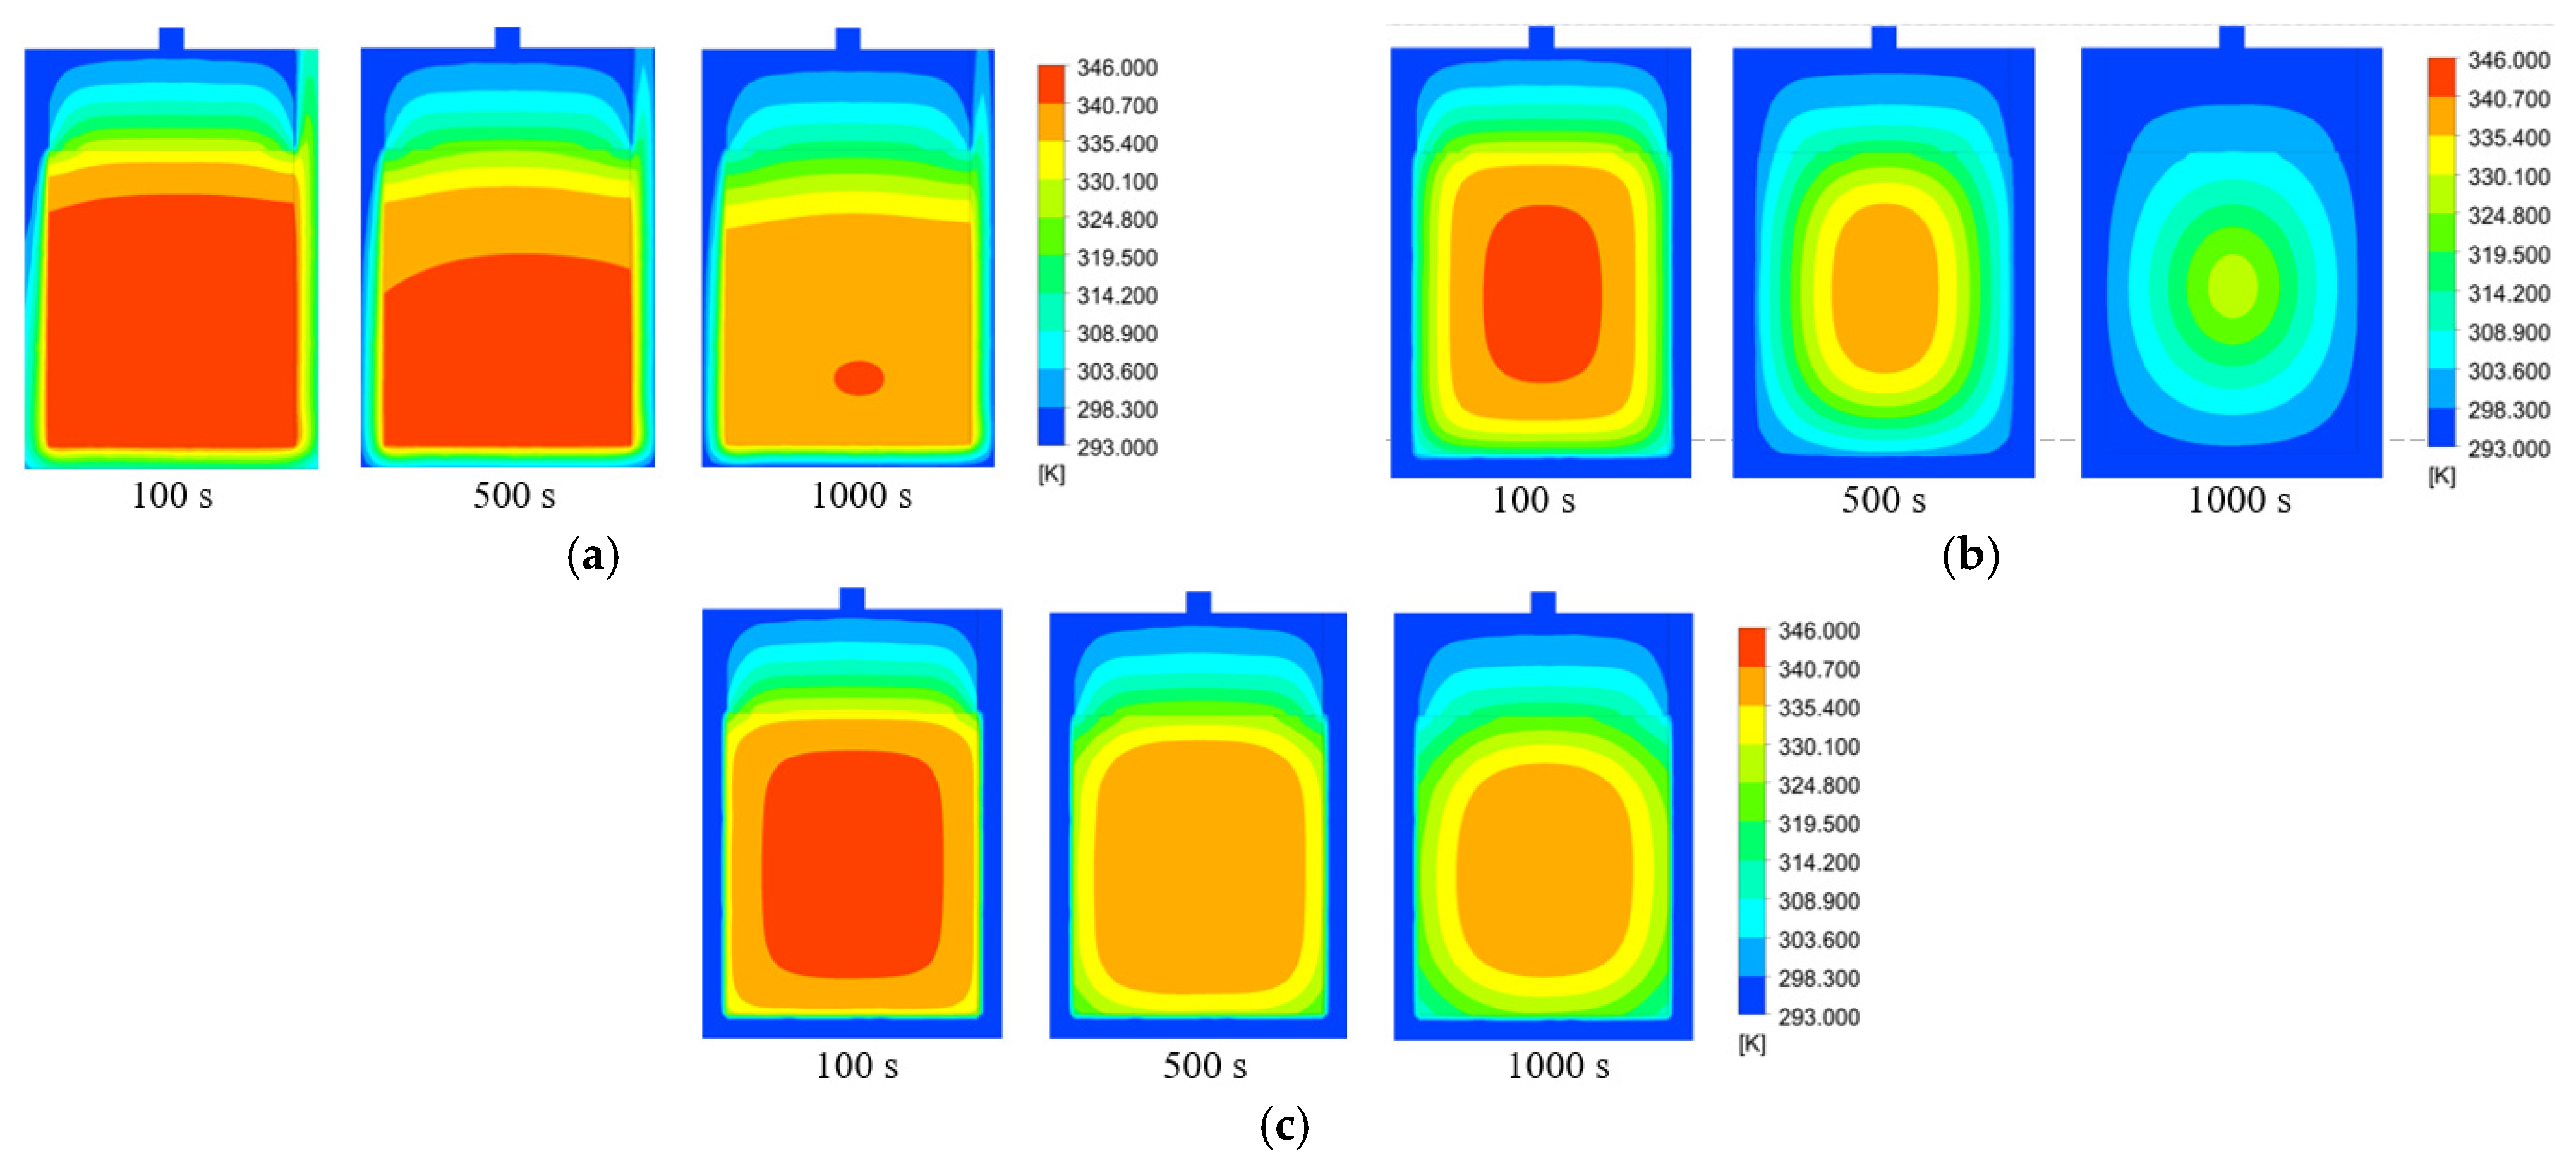
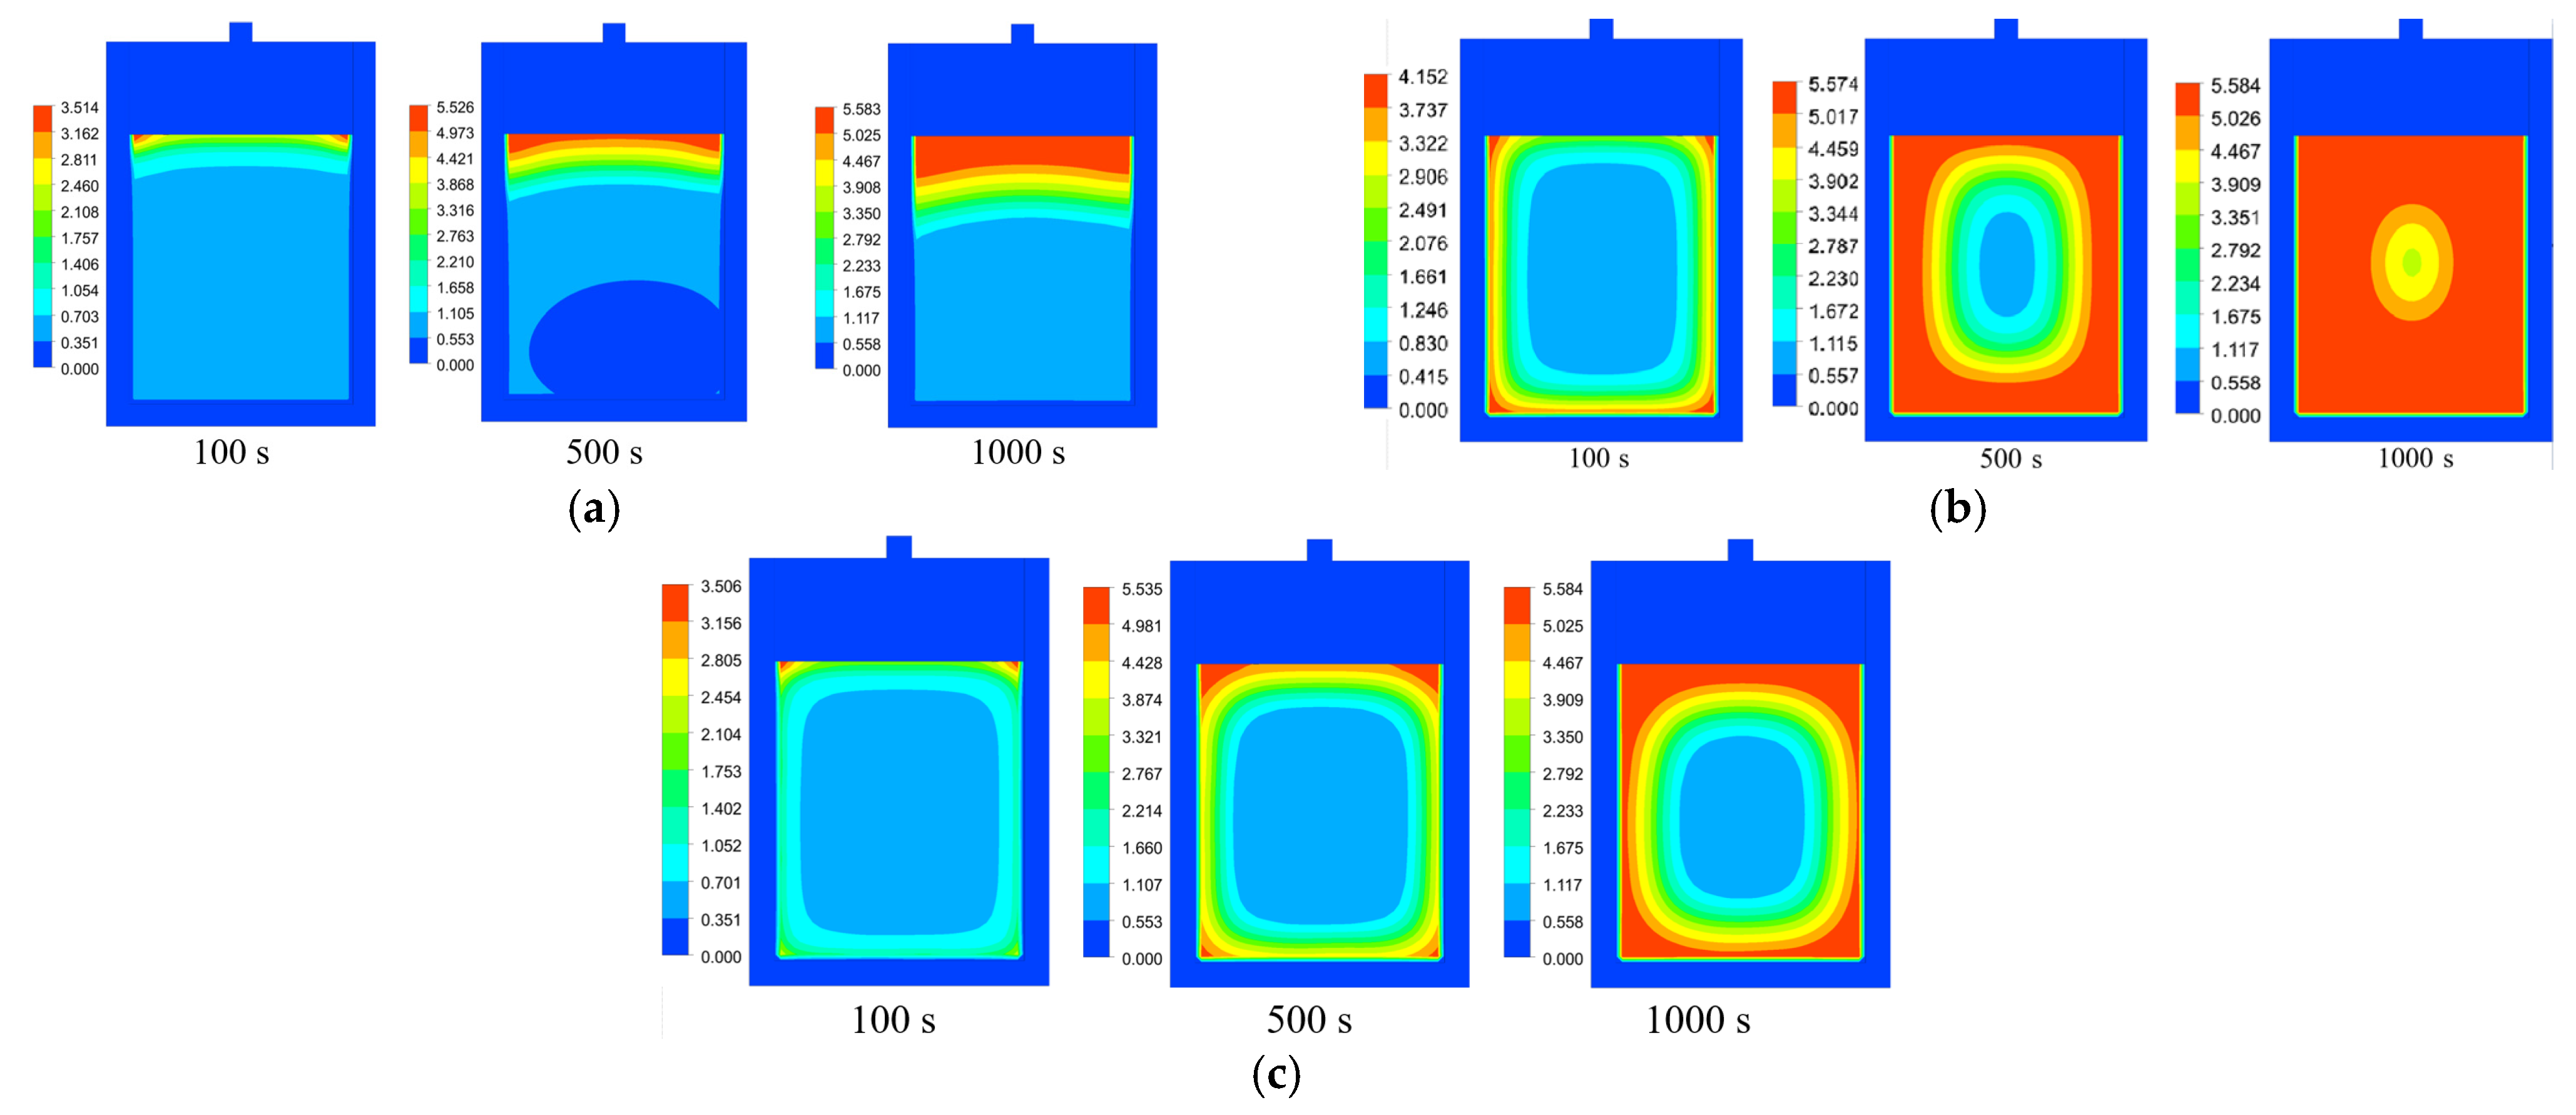
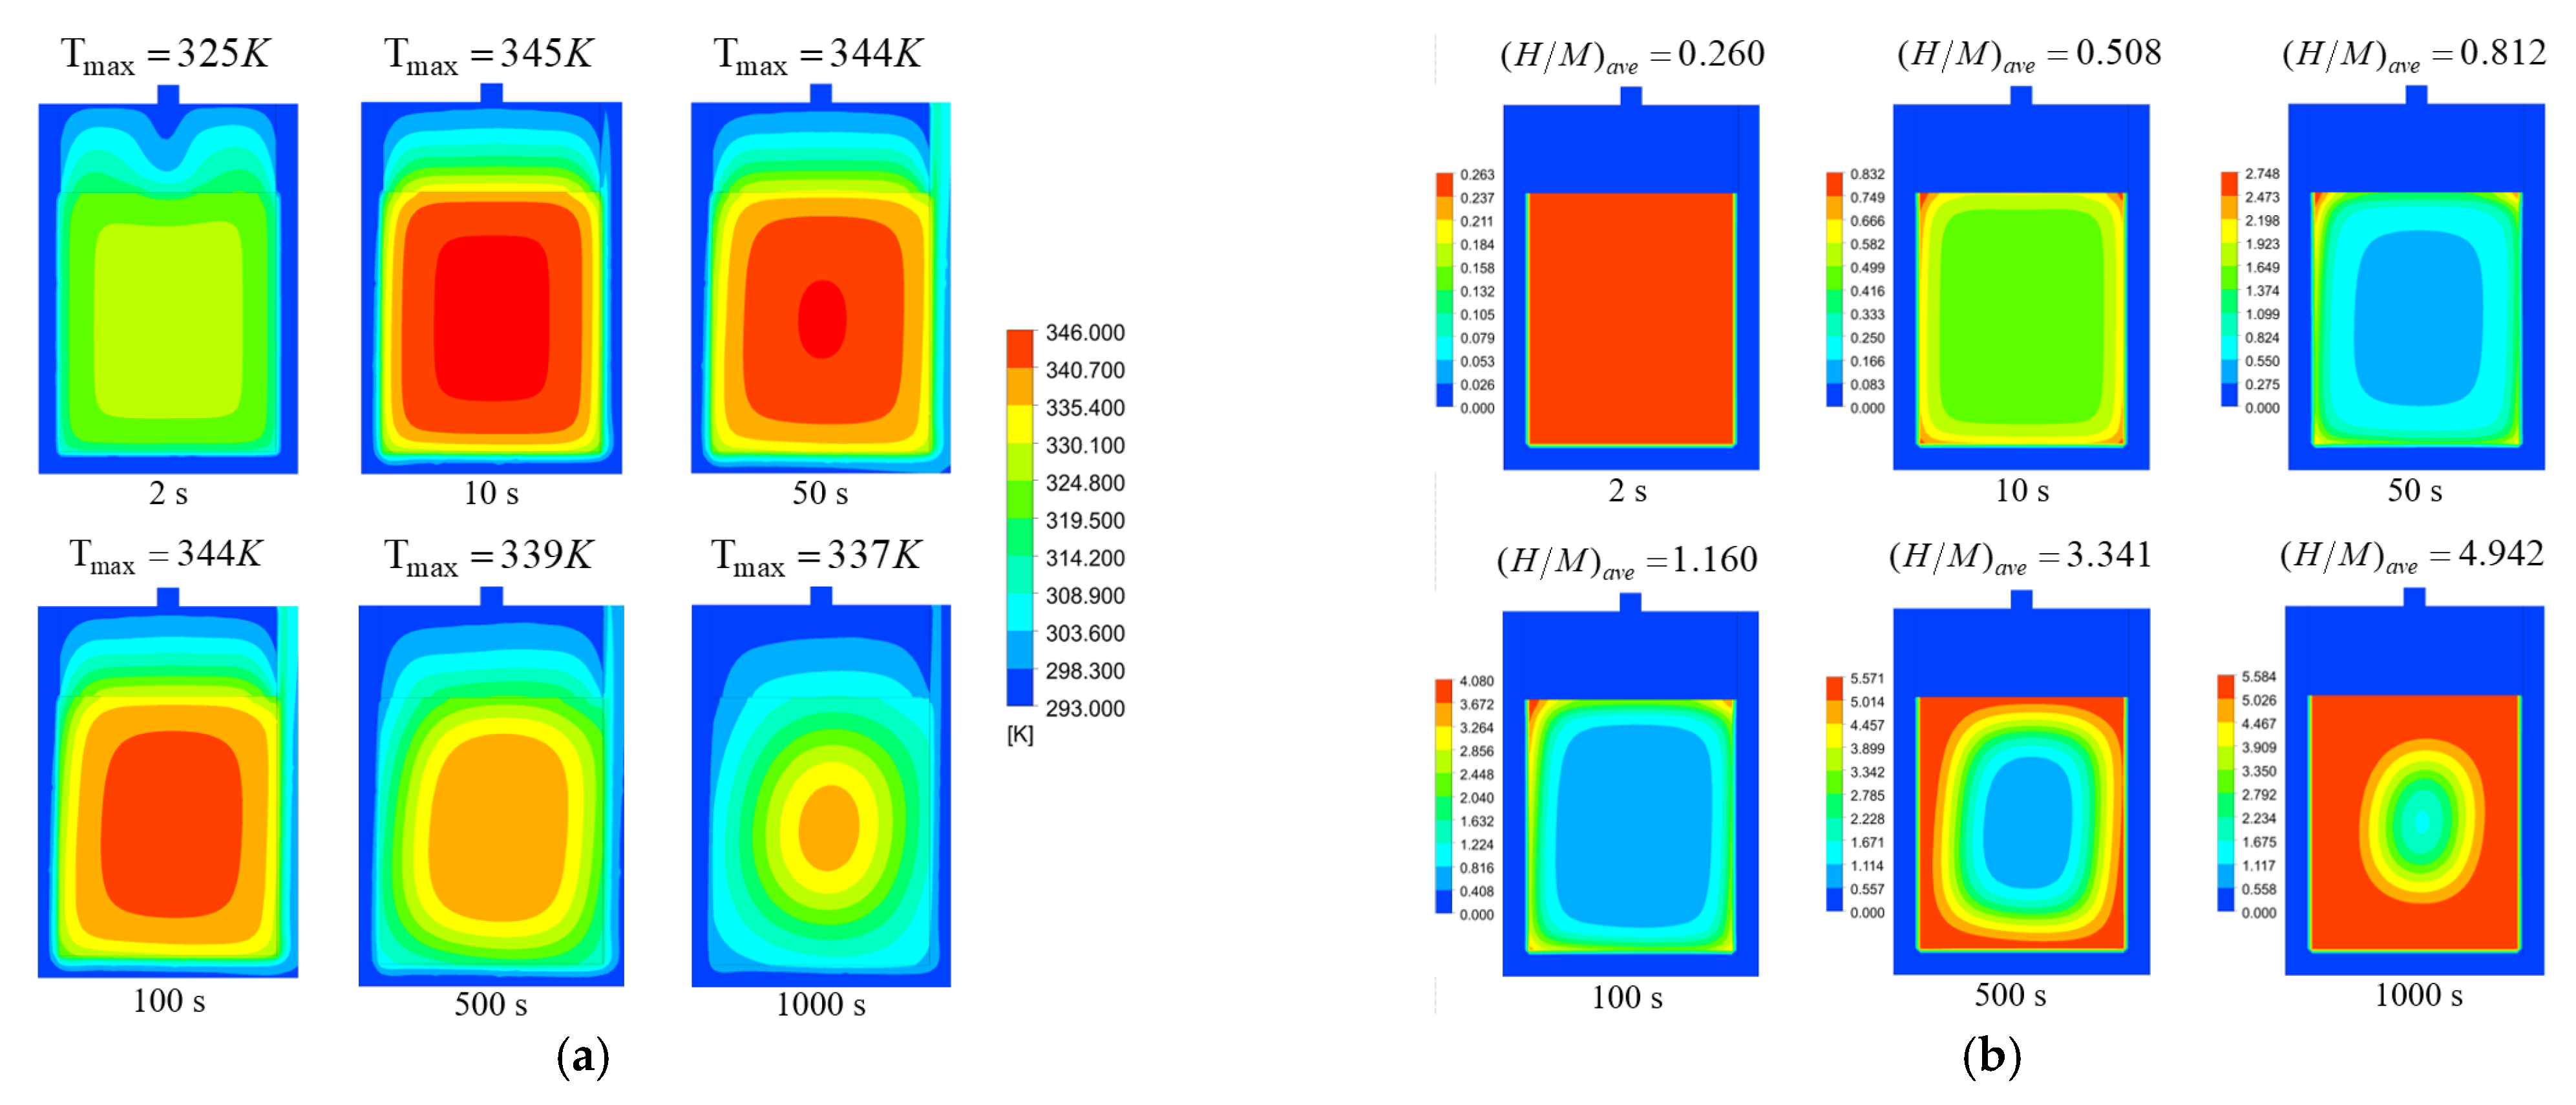
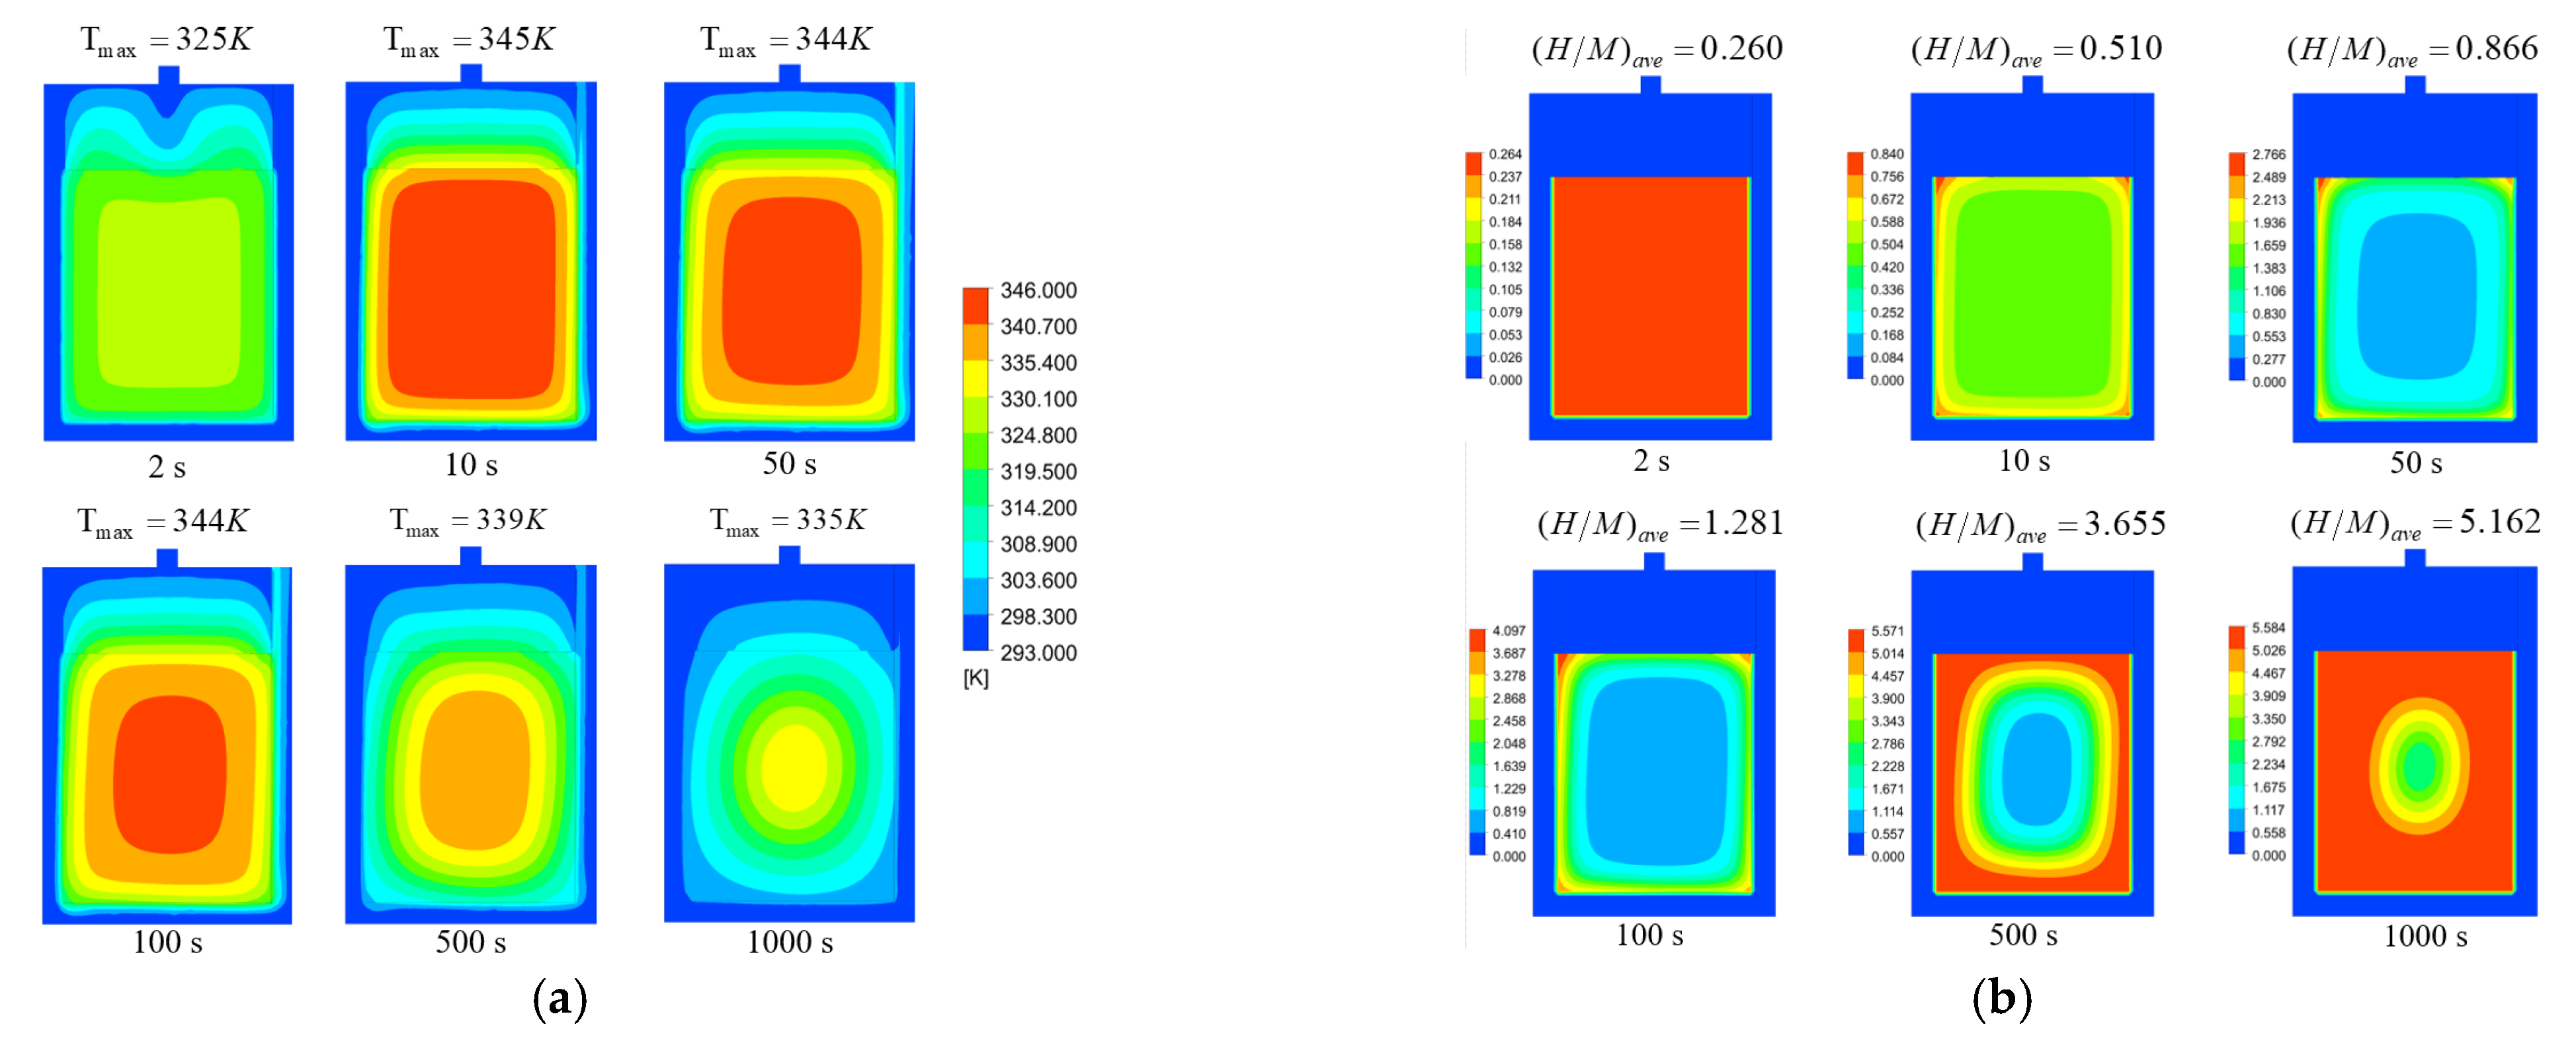
3.2. Impacts of Cooling Medium’s Flow Rate

To investigate how cooling media of different flow rates affect heat and mass transfer behavior of hydrogen storage tanks, we analyzed the variations in internal temperature and hydrogen storage capacity of the hydrogen storage tank under the circumstance that the cooling medium is selected to be water or oil and with a flow rate of 0.005 m/s, 0.01 m/s, 0.05 m/s, and 0.1 m/s.
Temperature and hydrogen storage capacity distribution cloud maps are presented in Figure 5 for the hydrogen storage tank at different times when the flow rate of the cooling water and the internal temperature are 0.005 m/s and 293 K, respectively. According to Figure 5a, the heat dissipation effect caused by the cooling water at the inlet is more obvious than that at the outlet. As a consequence, the temperature of the water outlet area is above that in the water inlet area, causing the temperature to be asymmetrically distributed in the left and right sections inside the tank. Ten seconds prior to the hydrogen absorption reaction, a rapid rise of temperature can be seen inside the tank. The reasons for this are that hydrogen supply pressure is dramatically different from the pressure of reaction equilibrium in the initial conditions; the hydrogen absorption reaction rate is rather high, and a significant amount of heat is dissipated within the unit time of reaction. In the context where a higher temperature corresponds to a greater pressure required by the equilibrium of reaction, the reaction rate declines and the internal temperature of the reaction tank reaches its peak value of 345 K. As the cooling water applies a cooling action on the tank wall surface, an asymmetrical temperature distribution phenomenon in the tank can be clearly observed in Figure 5a. At 1000 s, a temperature difference of nearly 40 °C is incurred between the center of the tank and its wall surface, and the temperature of the hydrogen storage alloy near the tank wall surface is close to that of the cooling water. This suggests that the hydrogen storage alloy neighboring the tank wall surface nearly reaches its maximum hydrogen absorption capacity and the hydrogen absorption reaction almost stops. In the center of the tank, its temperature is still comparatively high, signifying that the hydrogen absorption reaction there is still in progress.
The chemical equation expressing the hydrogen absorption reaction of the LaNi5-based hydrogen storage alloy is written below.
LaNi 5 + 3 H 2 LaNi 5 H 6
According to the above equation, the LaNi5-based alloy absorbs 6 mol hydrogen atoms. Moreover, the atomic ratio, H/M, is expressed in the following Equation (15).
H M = 2 ( ρ s ρ e m p s ) / M H 2 ρ e m p s / M L a N i 5
As shown in Figure 5b, the hydrogen storage capacity increases in an almost uniform manner inside the hydrogen storage tank in the first 10 s. Subsequently, temperature drops in the reaction zone of the tank wall surface due to the cooling action of cooling water on the surface; in addition, the hydrogen absorption reaction rate goes up. Zones next to the wall surface of the hydrogen storage tank take the lead in reaching a high atomic ratio. Moreover, the non-uniform water temperature distribution in the tank leads to a non-uniform cooling effect. For this reason, the hydrogen storage capacity inside the tank shows left–right asymmetry in the hydrogen storage capacity distribution cloud chart.
In Figure 6, temperature and hydrogen storage capacity distribution conditions are presented for the hydrogen storage tank at different times when the flow rate of the cooling water is set at 0.01 m/s. Through comparison between Figure 5a and Figure 6a, it can be observed that, different from the case where the water flow rate is 0.005 m/s, the temperature at the outlet area of the cooling bath is rather low, provided that the flow rate of cooling water is selected to be 0.01 m/s. At the same time, the maximum temperature within the tank covers a small area for the following reasons: due to a high flow rate of the cooling water, more heat is dissipated in unit time, which makes the interior temperature of the tank even lower. Likewise, comparison of Figure 5b and Figure 6b demonstrates that the area in a saturated state caused by hydrogen absorption becomes larger at 1000 s under the circumstance that a flow rate of 0.01 m/s is designed for the cooling water; this means that less time is consumed by hydrogen storage.
As shown in Figure 7, time-varying curves of average temperature and hydrogen storage percentage by weight are portrayed for the reaction zone filled with cooling water at four different flow rates (i.e., 0.005 m/s, 0.01 m/s, 0.05 m/s, and 0.1 m/s). According to Figure 7a, the average temperature can be rather high in the hydrogen storage tank where the cooling water flow rate is comparatively low. However, with a rise in the flow rate, differences in average temperatures in the reaction zone become increasingly small. Similarly, it is shown in Figure 7b that, when the flow rate increases, differences in the percentage by weight of hydrogen storage gradually decrease in the reaction zone. One reason for this is that the heat quantity drawn away by cooling water is limited in unit time. In the case where the flow rate of cooling water is constantly elevated, the heat dissipated in unit time remains almost unchanged, which results in an extremely minor difference in hydrogen absorption reactions inside the hydrogen storage tank.
The cooling water is then replaced with an oil coolant that serves as the cooling medium, and the flow rate of the oil coolant is set at 0.005 m/s and 0.01 m/s, respectively. In this case, the cloud charts given in Figure 8 and Figure 9 represent temperature and hydrogen storage capacity distribution in the hydrogen storage tank at different times. According to Figure 8a and Figure 9a, the heat dissipation performance of the tank when the oil coolant flow rate is 0.01 m/s is superior to that subjected to a flow rate of 0.005 m/s. Similarly, a left–right asymmetry phenomenon can be found in the cloud chart of temperature distribution in the tank. As shown in Figure 8b and Figure 9b, under the circumstance that the flow rate of oil coolant is 0.01 m/s, the saturation area for hydrogen absorption reactions becomes more extensive within 1000 s, which indicates that more hydrogen can be absorbed. In Figure 10, time-varying curves of average temperature and the percentage by weight for hydrogen storage are presented for the reaction zone, where different flow rates are designed for the oil coolant. In line with this figure, as the flow rate of oil coolant increases, differences in heat dissipation effects and hydrogen absorption efficiency gradually decrease in the hydrogen storage tank under the influence of different flow rates.

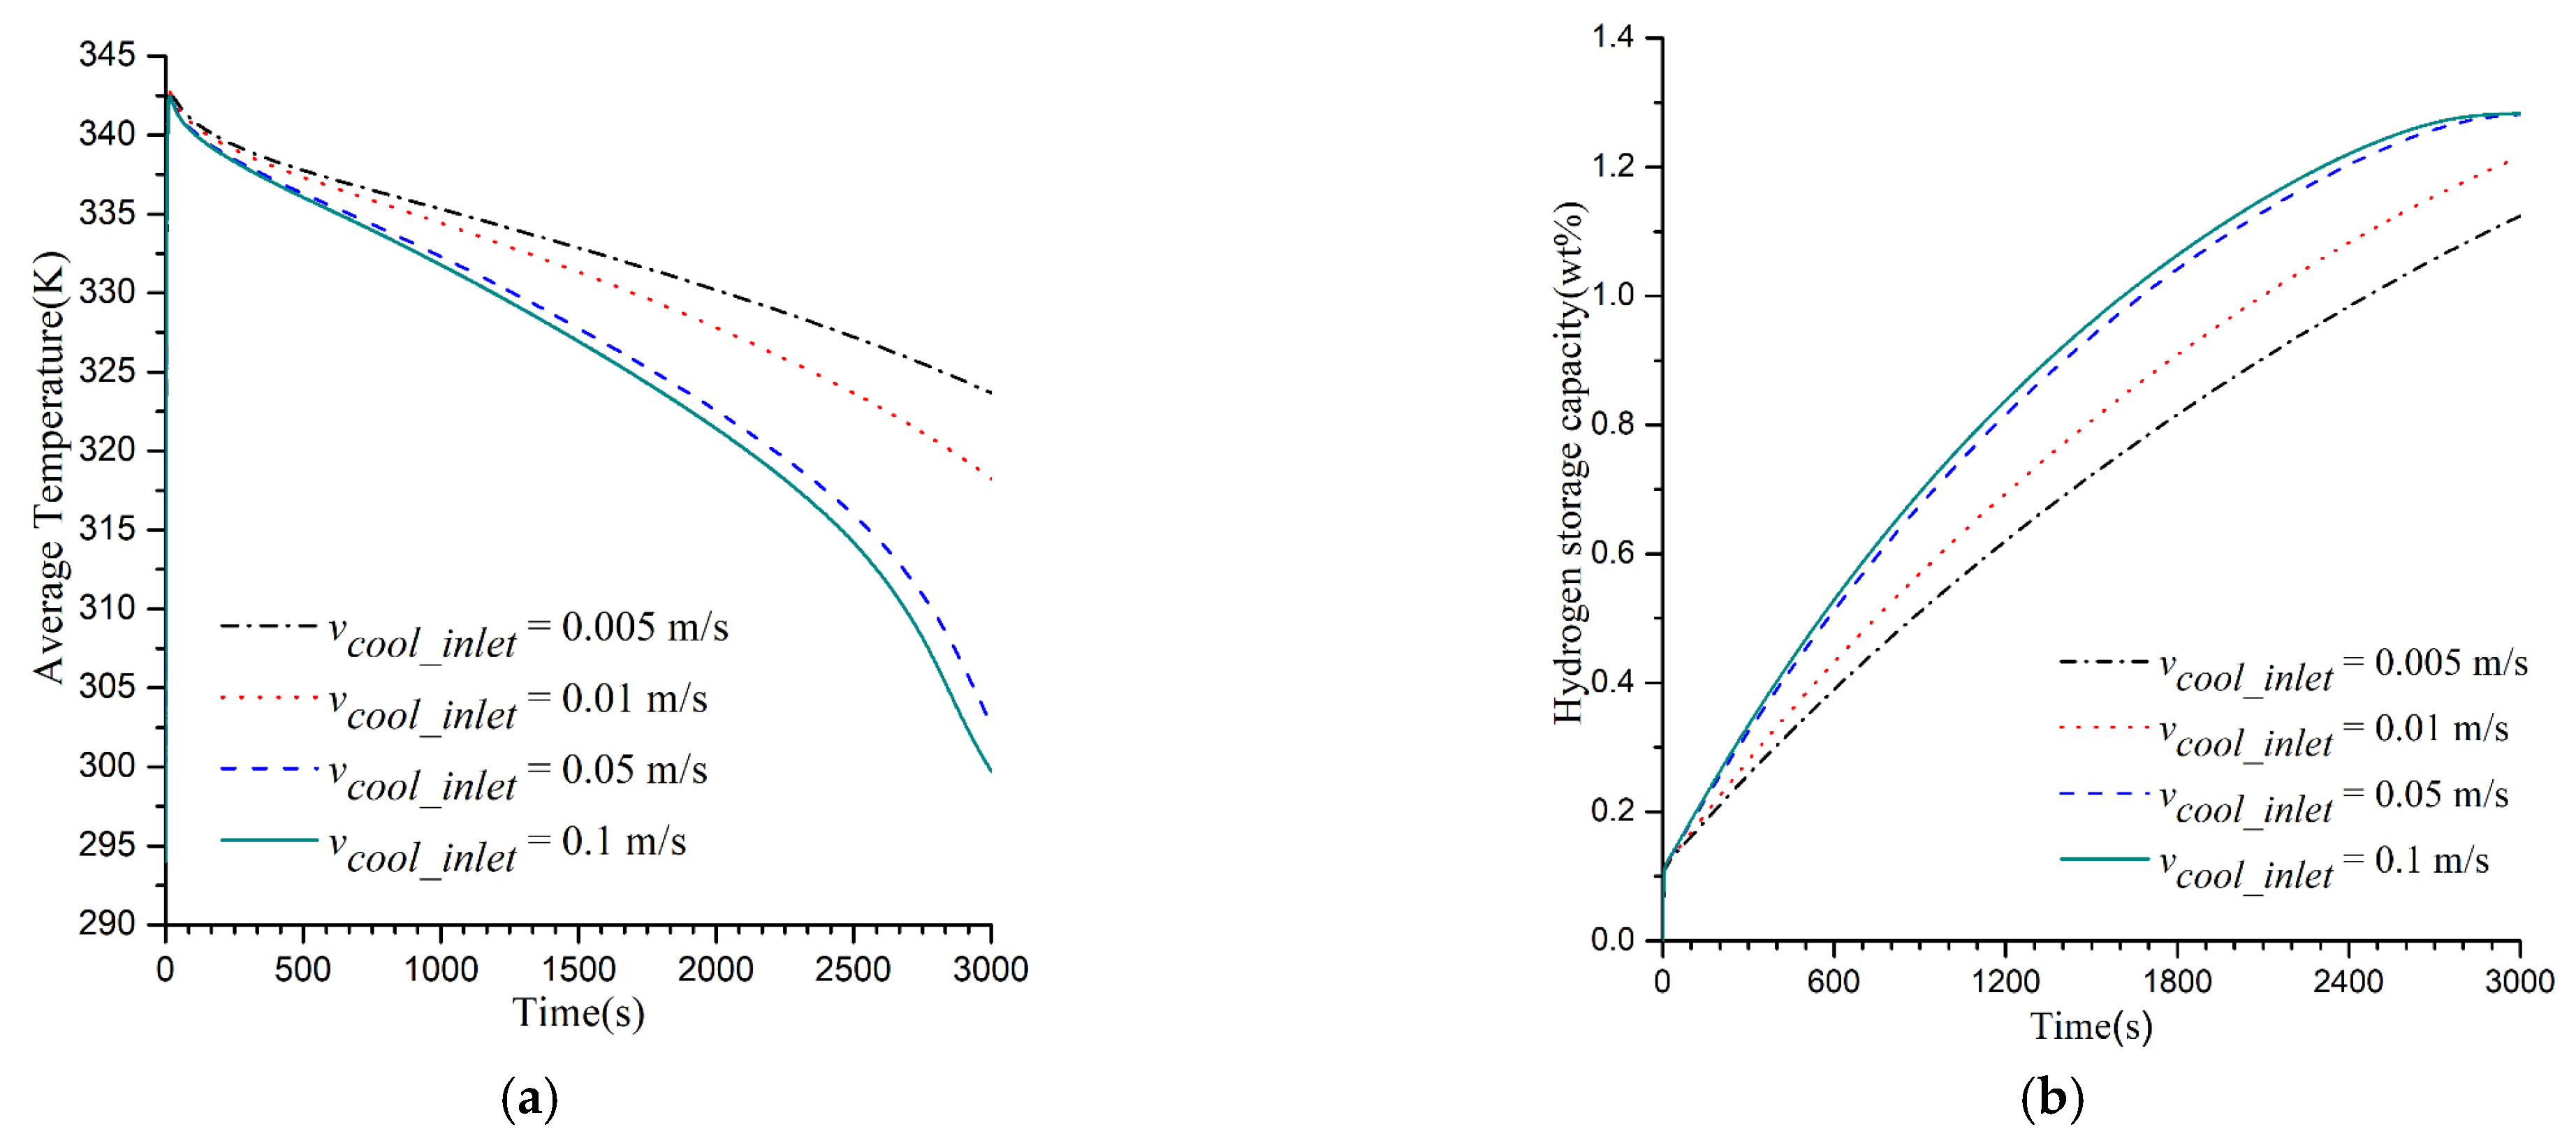
3.3. Impacts of Different Cooling Media

To investigate how the cooling media in the cooling bath affects hydrogen absorption reactions within the tank, air, water, and oil are separately selected as cooling media to perform simulation analyses on the hydrogen absorption process of hydrogen storage alloy. Regarding the reaction tank at different times, temperature and hydrogen storage capacity cloud charts are illustrated in Figure 11 and Figure 12 when the three cooling media of air, water, and oil flow into the tank at a rate of 0.1 m/s. According to Figure 11a, the temperature on the storage tank wall surface is basically the same as that inside the tank, provided that the cooling medium is air, but the corresponding heat dissipation effect is non-obvious. The reason for this is that air has a low coefficient of heat conduction and takes away only a small quantity of heat in unit time, which leads to insignificant changes in temperature on the wall surface of the hydrogen storage tank. This is reflected in Figure 11b,c, which show that, once the cooling medium is selected to be water or oil, rather obvious heat dissipation effects are generated on the wall surface of the hydrogen storage tank; moreover, the cooling effect of water outperforms oil. In Figure 12a, where air serves as the cooling medium, not only does hydrogen storage capacity in the reaction zone on the wall surface fail to increase, but the top area of the hydrogen absorption reaction zone gradually proceeds to the bottom. Under the circumstance that the flow rate of air as the cooling medium is set at 0.1 m/s, no obvious heat dissipation effects can be observed on the tank wall surface; furthermore, there exists a pure hydrogen zone with a comparatively high coefficient of heat conduction at the top of the reaction zone, which enables the hydrogen absorption reaction to firstly take place at its top. As the top of the reaction zone reaches its saturation state of hydrogen absorption, the temperature drops and the hydrogen absorption reaction gradually takes place towards the bottom of the reaction zone. It is revealed in Figure 12b,c that, if water or oil are selected as the cooling media, the saturation state of hydrogen absorption is first achieved on the wall surface area due to the low temperature there.
Time-varying curves of average temperature and percentage by weight of hydrogen storage capacity are presented in Figure 13 for the reaction zone subjected to different cooling media. Regarding the hydrogen storage model available to three cooling media, their maximum average temperatures have a difference of almost 5 °C. In 3000 s, the model that selects water or oil as its cooling medium has reached its saturation state of hydrogen absorption, and its temperature drops to 300 K and below. In terms of the model for which air serves as the cooling medium, the hydrogen absorption reaction is still on and the average temperature in the reaction zone declines slightly.

4. Conclusions

In the present paper, a heat and mass transfer model was established for hydrogen absorption reactions in a metal hydride tank of hydrogen storage, and numerical simulation was conducted. Moreover, an existing hydrogen absorption experiment of hydrogen storage alloys was used for reference to check the model validity. On this basis, a cooling bath was designed to cool down the hydrogen storage tank. In addition, simulation analyses were made on hydrogen reactions under the influence of different types of fluids and under various flow rates in the cooling bath. Conclusions can be drawn as follows:
(1) The initial stage of hydrogen absorption features a high reaction rate. During the reaction, a significant amount of heat is dissipated and the internal temperature of the hydrogen storage tank increases abruptly. With a continuous rise of temperature, the reaction rate begins to drop gradually. Once the temperature inside the tank reaches its peak, the hydrogen absorption reaction nearly stops.
(2) Under the actions of cooling water and oil coolant, two phenomena of gradual temperature drop and reaction rate rising can be observed on the wall surface of the tank, and the wall surface takes the lead in reaching its saturation state of hydrogen absorption. More particularly, the hydrogen absorption reaction first takes place on the wall surface and then proceeds towards the center of the tank. Although elevating flow rates of cooling water or oil coolant has the potential to shorten the time consumed by hydrogen storage to a certain extent, heat and mass transfer performance inside the tank cannot be significantly improved if their flow rates continue to rise.
(3) Under the circumstance that air serves as the cooling medium, the heat dissipation effect is reduced in the hydrogen storage tank under the influence of the same flow rate, and no obvious differences lie in reaction rates between the tank wall surface and its center. In this case, the peak temperature of the hydrogen absorption reaction goes up and the time of hydrogen storage substantially increases.

Author Contributions

Conceptualization, M.C. and K.H.; methodology, M.C.; software, J.T.; validation, J.T.; formal analysis, J.T.; investigation, J.T.; resources, Y.C.; writing—original draft preparation, J.T.; writing—review and editing, M.C.; visualization, Y.C.; supervision, M.C. All authors have read and agreed to the published version of the manuscript.

Funding

This research was funded by GuangDong Basic and Applied Basic Research Foundation, grant number No. 2020A1515110080, No. 2020B1515120006.

Conflicts of Interest

The authors declare no conflict of interest.

References

  1. Briki, C.; Rango, P.D.; Belkhiria, S.; Dhaou, M.H.; Jemni, A. Measurements of expansion of LaNi5 compacted powder during hydrogen absorption/desorption cycles and their influences on the reactor wall. Int. J. Hydrogen Energy 2019, 44, 13647–13654. [Google Scholar] [CrossRef]
  2. Nasrallah, S.B.; Jemni, A. Heat and mass transfer models in metal-hydrogen reactor. Int. J. Hydrogen Energy 1997, 22, 67–76. [Google Scholar] [CrossRef]
  3. Jemni, A.; Nasrallah, S.B.; Lamloumi, J. Experimental and theoretical study of ametal–hydrogen reactor. Int. J. Hydrogen Energy 1999, 24, 631–644. [Google Scholar] [CrossRef]
  4. Askri, F.; Salah, M.B.; Jemni, A.; Nasrallah, S.B. Optimization of hydrogen storage in metal-hydride tanks. Int. J. Hydrogen Energy 2009, 34, 897–905. [Google Scholar] [CrossRef]
  5. Jemni, A.; Nasrallah, S.B. Study of two-dimensional heat and mass transfer during absorption in a metal-hydrogen reactor. Int. J. Hydrogen Energy 1995, 20, 43–52. [Google Scholar] [CrossRef]
  6. Gkanas, E.I.; Grant, D.M.; Khzouz, M.; Stuart, A.D.; Manickam, K.; Walker, G.S. Efficient hydrogen storage in up-scale metal hydride tanks as possible metal hydride compression agents equipped with aluminium extended surfaces. Int. J. Hydrogen Energy 2016, 41, 10795–10810. [Google Scholar] [CrossRef]
  7. Mohan, G.; Maiya, M.P.; Murthy, S.S. Performance simulation of metal hydride hydrogen storage device with embedded filters and heat exchanger tubes—Science Direct. Int. J. Hydrogen Energy 2007, 32, 4978–4987. [Google Scholar] [CrossRef]
  8. Nam, J.; Ko, J.; Ju, H. Three-dimensional modeling and simulation of hydrogen absorption in metal hydride hydrogen storage vessels. Appl. Energy 2012, 89, 164–175. [Google Scholar] [CrossRef]
  9. Chippar, P.; Lewis, S.D.; Rai, S.; Sircar, A. Numerical investigation of hydrogen absorption in a stackable metal hydride reactor utilizing compartmentalization. Int. J. Hydrogen Energy 2018, 43, 8007–8017. [Google Scholar] [CrossRef]
  10. Chandra, S.; Sharma, P.; Muthukumar, P.; Tatiparti, S.S.V. Modeling and numerical simulation of a 5kg LaNi 5 -based hydrogen storage reactor with internal conical fins. Int. J. Hydrogen Energy 2020, 45, 8794–8809. [Google Scholar] [CrossRef]
  11. Mghari, H.E.; Huot, J.; Xiao, J. Analysis of hydrogen storage performance of metal hydride reactor with phase change materials. Int. J. Hydrogen Energy 2019, 44, 28893–28908. [Google Scholar] [CrossRef]
  12. Chibani, A.; Merouani, S.; Bougriou, C.; Hamadi, L. Heat and mass transfer during the storage of hydrogen in LaNi5 -based metal hydride: 2D simulation results for a large scale, multi-pipes fixed-bed reactor. Int. J. Heat Mass Transf. 2020, 147, 118939. [Google Scholar] [CrossRef]
  13. Lewis, S.D.; Chippar, P. Numerical investigation of hydrogen absorption in a metal hydride reactor with embedded embossed plate heat exchanger. Energy 2020, 194, 116942. [Google Scholar] [CrossRef]
  14. Gwak, G.; Kim, M.; Oh, K.; Kyoung, S.; Ferekh, S.; Ju, H. Analyzing effects of volumetric expansion of uranium during hydrogen absorption. Int. J. Hydrogen Energy 2017, 42, 3723–3730. [Google Scholar] [CrossRef]
  15. Elhamshri, F.; Kayfeci, M.; Matik, U.; Alous, S. Thermoflui dynamic modelling of hydrogen absorption in metal hydride beds by using multiphysics software. Int. J. Hydrogen Energy 2020, 45, 34956–34971. [Google Scholar] [CrossRef]
  16. Gwak, G.; Yun, S.; Ju, H. Multi-dimensional modeling and large-scale simulation of hydrogen absorption/desorption phenomena in metal hydride vessels (MHVs). Fusion Eng. Des. 2018, 130, 107–113. [Google Scholar] [CrossRef]
  17. Freni, A.; Cipiti, F.; Cacciola, G. Finite element-based simulation of a metal hydride-based hydrogen storage tank. Int. J. Hydrogen Energy 2009, 34, 8574–8582. [Google Scholar] [CrossRef]
  18. Gopal, M.R.; Murthy, S.S. Studies on heat and mass transfer in metal hydride beds. Int. J. Hydrogen Energy 1995, 20, 911–917. [Google Scholar] [CrossRef]
  19. Muthukumar, P.; Madhavakrishna, U.; Dewan, A. Parametric studies on a metal hydride based hydrogen storage device. Int. J. Hydrogen Energy 2007, 32, 4988–4997. [Google Scholar] [CrossRef]
  20. Brown, T.M.; Brouwer, J.; Samuelsen, G.S.; Holcomb, F.H.; King, J. Accurate simplified dynamic model of a metal hydride tank. Int. J. Hydrogen Energy 2008, 33, 5596–5605. [Google Scholar] [CrossRef] [Green Version]
  21. Muthukumar, P.; Ramana, S.V. Numerical simulation of coupled heat and mass transfer in metal hydride-based hydrogen storage reactor. J. Alloy. Compd. 2009, 472, 466–472. [Google Scholar] [CrossRef]
  22. Mellouli, S.; Askri, F.; Dhaou, H.; Jemni, A.; Nasrallah, S.B. Numerical simulation of heat and mass transfer in metal hydride hydrogen storage tanks for fuel cell vehicles. Int. J. Hydrogen Energy 2010, 35, 1693–1705. [Google Scholar] [CrossRef]
  23. Askri, F.; Jemni, A.; Nasrallah, S.B. Dynamic behavior of metal–hydrogen reactor during hydriding process. Int. J. Hydrogen Energy 2004, 29, 635–647. [Google Scholar] [CrossRef]
  24. Dhaou, H.; Askri, F.; Salah, M.B.; Jemni, A.; Nasrallah, S.B.; Lamloumi, J. Measurement and modelling of kinetics of hydrogen sorption by LaNi and two related pseudobinary compounds. Int. J. Hydrogen Energy 2007, 32, 576–587. [Google Scholar] [CrossRef]
Figure 1. Equilibrium pressure for the hydrogen absorption reaction.
Energies 15 02673 g001
Figure 2. A calculation principle diagram.
Energies 15 02673 g002
Figure 3. Comparison of calculated and measured results. (a) Temperature measuring points; (b) Simulation and experimental comparison.
Energies 15 02673 g003
Figure 4. A hydrogen storage tank grid model with cooling bath.
Energies 15 02673 g004
Figure 5. Temperature and hydrogen storage capacity distribution at different times inside the reaction tank, subjected to a cooling water flow rate of 0.005 m/s. (a) Temperature distribution cloud chart; (b) Hydrogen storage capacity distribution cloud chart.
Energies 15 02673 g005
Figure 6. Temperature and hydrogen storage capacity distribution at different times of the reaction tank subjected to a cooling water flow rate of 0.01 m/s. (a) Temperature distribution cloud chart; (b) Hydrogen storage capacity distribution cloud chart.
Energies 15 02673 g006
Figure 7. Time-varying curves of average temperature and hydrogen storage percentage by weight in the reaction zone subjected to different cooling water flow rates. (a) Average temperature; (b) Percentage by weight.
Energies 15 02673 g007
Figure 8. Temperature and hydrogen storage capacity distribution at different times of the reaction tank subjected to an oil coolant flow rate of 0.005 m/s. (a) Temperature distribution cloud chart; (b) Hydrogen storage capacity distribution cloud chart.
Energies 15 02673 g008
Figure 9. Temperature and hydrogen storage capacity distribution at different times of the reaction tank subjected to an oil coolant flow rate of 0.01 m/s. (a) Temperature distribution cloud chart; (b) Hydrogen storage capacity distribution cloud chart.
Energies 15 02673 g009
Figure 10. Time-varying curves of average temperature and hydrogen storage percentage by weight in the reaction zone subjected to different oil coolant flow rates. (a) Average temperature; (b) Percentage by weight.
Energies 15 02673 g010
Figure 11. A temperature distribution cloud chart at different times of the reaction tank subjected to different cooling media of air, water, and oil. (a) Air as the cooling medium; (b) Water as the cooling medium; (c) Oil as the cooling medium.
Energies 15 02673 g011
Figure 12. A hydrogen storage capacity distribution cloud chart at different times of the reaction tank selecting air, water, and oil as the cooling media. (a) Air as the cooling medium; (b) Water as the cooling medium; (c) Oil as the cooling medium.
Energies 15 02673 g012
Figure 13. Time-varying curves of average temperature and the percentage by weight of hydrogen storage capacity in the reaction zone with different cooling media.
Energies 15 02673 g013
Table 1. This is a table. Tables should be placed in the main text near to the first time they are cited [3,8,23].
ParameterUnitValue
Initial temperature, T 0 °C20
Reference temperature, T e °C30
Pressure intensity at the inlet, P i n bar10
Reference pressure intensity, P r e f bar10
Hydrogen absorption speed constant, C a s 1 59.187
Activation energy, E a J mol 1 21,179.6
Hydrogen heat capacity, C p H J ( mol K ) 1 1489
Heat capacity of hydrogen storage alloy, C p M J ( mol K ) 1 419
Heat conductivity coefficient of hydrogen, k g W ( m K ) 1 0.167
Heat conductivity coefficient of alloy, k s W ( m K ) 1 3.18
Porosity of hydrogen storage alloy, ε --0.63
Permeability of the pore area, K m 2 10 8
Cooling temperature, T s °C20
Alloy temperature, ρ M kg m 3 5300
Saturated alloy density, ρ s a t kg m 3 5369
a0--−0.34863
a1--10.1059
a2--−14.2442
a3--10.3535
a4--−4.20646
a5--0.962371
a6--−0.115468
a7--0.00563776
Publisher’s Note: MDPI stays neutral with regard to jurisdictional claims in published maps and institutional affiliations.

