Article

Simulation Research on a Cogeneration System of Low-Concentration Photovoltaic/Thermal Coupled with Air-Source Heat Pump

1
Tianjin Electric Power Science & Research Institute, Tianjin 300384, China
2
School of Energy, Power and Mechanical Engineering, North China Electric Power University, Beijing 102206, China
3
State Grid Tianjin Electric Power Company, Tianjin 300232, China
*
Author to whom correspondence should be addressed.
Energies 2022, 15(3), 1238; https://doi.org/10.3390/en15031238
Submission received: 6 December 2021 / Revised: 27 January 2022 / Accepted: 27 January 2022 / Published: 8 February 2022
(This article belongs to the Special Issue Smart Photovoltaic Energy Systems for a Sustainable Future Ⅱ)

Abstract

:
In this paper, a low-concentration photovoltaic/thermal (LCPV/T) coupled with air-source heat pump (AHP) system is proposed which fully utilizes the heat generated by LCPV/T and improves the performance of the AHP. The system is built and investigated in the Transient System Simulation Program (TRNSYS) and an experimental room model is established to verify the feasibility of the system. The performance of the system is researched from the perspective of energy and exergy, and the system performance with LCPV/T and without LCPV/T is compared. Finally, the influence of the variation of key parameters of the system is studied. The results indicated that on the coldest day, the electrical efficiency of LCPV/T reached 10% which was equal to the electrical exergy efficiency. The maximum thermal efficiency was 31.88% while thermal exergy efficiency was 2.7%. The maximum coefficient of performance (COP) of AHP was 3.3, and the thermal exergy efficiency was 47%. The indoor temperature was maintained at about 20 °C in the heating season. When LCPV/T was adopted, the COP and thermal exergy efficiency of the AHP was generally higher than those without LCPV/T. In conclusion, the utilization of LCPV/T has a positive impact on the performance of the AHP.

1. Introduction

With the fast development of technology, the energy demand of society is increasing greatly. In 2019, the global primary energy consumption reached 581.51 EJ, of which oil, coal and natural gas accounted for 191.89 EJ, 157.64 EJ and 140.54 EJ, respectively [1]. Although the global primary energy demand is still increasing, with the world’s attention on carbon emission the development of renewable energy has also been very rapid in recent years. In 2019, the global installed capacity of renewable energy was 2,536,853 MW. Solar energy is representative of renewable energy, with most of the energy on Earth coming from solar energy, and the global installed capacity of solar power was about 586,434 MW in 2019, which was increased by about 20% compared to that in 2018. Therefore, with the rapid development of solar technology, the utilization of solar energy-based renewable energy has been paid more attention [2].
Within the world’s largest sources of energy consumption, space heating and cooling of buildings account for 1/4 of the total energy consumption [3,4]. In the context of promoting the utilization of renewable energy and the development of a distributed energy system, the solar system is being widely applied to space-heating systems. Solar technology is mainly divided into photovoltaic (PV), solar collector and photovoltaic/thermal (PV/T). Frattolillo et al. [5] focused on integrating the solar collector on buildings by replacing traditional roofing or facade materials to achieve a domestic hot water supply and meet the heating demand, and the feasibility of the system was proved. However, both a PV and solar collector only utilize a wavelength range of solar irradiation to produce a single product, which means the limited comprehensive utilization efficiency of solar energy from two devices. PV/T which was proposed by Kern et al. [6]. integrates PV and a solar collector. First, part of the wavelength range of solar irradiation is absorbed by a PV cell in PV/T to generate electricity while the remaining infrared wavelength irradiation is transformed into heat. Thus, the medium in the cooling channel below the PV cell absorbs the heat from the cell [7,8].
PV cells have the ability to convert solar irradiation into electricity. However, the high cost of photovoltaic cells restricts the application of a PV system. Using a concentrator and simultaneous exploitation of heat and electrical power are two effective measures to reduce the cost [9]. Furthermore, combining a concentrator and PV/T can improve the received solar irradiation of a PV cell and quality of heat generated by PV/T [10]. Solar concentrator technology is divided into low concentration (2–10 times concentration), medium concentration (10–100 times concentration) and high concentration (100–2000 times concentration), besides, a low concentration system has the potential to reduce the cost of producing electricity compared to conventional PV [11,12]. There are five solar concentrators: linear Fresnel reflector [13] compound parabolic concentrator (CPC) [14], parabolic trough collector [15], solar power tower [16] and parabolic dish systems [17]. Reza et al. [18] analyzed the performance of concentration photovoltaic/thermal (CPV/T) with different configurations. The result showed that for parabolic trough CPV/T, the thermal efficiency was 70% and the electrical efficiency was 25%. Chen et al. [19] proposed a novel low-concentrating photovoltaic/thermal system (LCPV/T) and its electrical efficiency reached three times that of flat-plate PV/T, and the solar irradiation fluctuation had little effect on the electrical efficiency.
The cooling medium of PV/T which is widely used is water and air. PVT/WATER systems are more efficient than a PVT/AIR system due to the high thermophysical properties of water compared to those of air, which generally is low. However, a PVT/AIR system is utilized in many practical applications due to low construction (minimal use of material) and operating costs among other factors [20]. Besides, PV/T with water has the risk of frost cracking while PV/T with air has better applicability in the cold region.
An air source heat pump is an environmentally friendly, efficient and energy-saving system. However, an air source heat pump is greatly affected by environmental and climatic conditions. With the decrease of ambient temperature, the coefficient of performance (COP) of an air source heat pump declines, and the heating capacity is also limited [21]. In order to improve the performance of air source heat pumps in a cold region, many researchers have designed the framework of the heat pump. Saleh et al. [22] studied the properties effect of different refrigerants on the vapor compression refrigeration cycle and provided a method for the selection of refrigerant. Ibrahim [21] et al. set up a dynamic model of an air source heat pump water heater to research the impact of environmental factors on an air source heat pump water heater. In addition, solar energy technology and an air source heat pump coupling system are also widely researched. Cai et al. [23] proposed a solar–air dual source heat pump, which combined a solar evaporator with an air source heat pump. Comparison between different heat source configurations was made, and the best working conditions of each system were determined. The result showed that COP of the heat pump in all configurations was in the range of 4.33 to 4.58. Liu et al. [24] designed a composite heat exchanger which integrated a fin-tube and tube heat exchanger and designed a solar–air composite heat pump system to study the performance under different operation modes. The result showed that the dual heat-source mode increased 62% in heat capacity and 59% in COP compared to the single air-source heat pump mode.
In conclusion, the above measures and arrangements have effectively improved the performance of the air source heat pump in cold regions. However, the optimal design of a heat pump has strict technical requirements and the frost problem has not yet been completely overcome. So far, it remains still difficult to operate air source heat pumps in high efficiency in cold regions. Based on the conventional air-source heat pump system, this paper proposes a system of coupling PV/T with an air-source heat pump. By combining PV/T and an air-source heat pump, PV/T used air as a cooling medium to solve the frost cracking problem of PV/T in winter when water was used as a cooling medium. Furthermore, the air heated by PV/T can improve the performance of an air-source heat pump.
In this paper, a low-concentration photovoltaic/thermal (LCPV/T) coupled with an air source heat pump system (AHP) is investigated. The contributions of this work include: (1) the novel LCPV/T-AHP system is proposed for realizing comprehensive utilization of solar energy and improving the performance of an air-source heat pump during the heating season. (2) The building model is established to evaluate the feasibility of the system. (3) The energetic and exergetic performance of the system is investigated. (4) A comparison between the LCPV/T-AHP system and the AHP only system is made from the perspective of energy and exergy. (5) The impacts of key parameters on system performance in variable conditions are researched. In summary, this study provides a new idea for the coupling and application of PV/T technology and an air-source heat pump in building heating.

2. System Layout

In this paper, a low-concentration photovoltaic/thermal (LCPV/T) coupled with air-source heat pump (AHP) system is proposed. The system provided space heating and power for an experimental room in Beijing during the heating season (1 January to 31 March and 1 October to 31 December). The system consisted of LCPV/T module, AHP, storage water tank, water pump and fan. To be specific, the LCPV/T was made up of compound parabolic concentrator (CPC), PV/T and a dual-axis tracking system. The schematic cross-sectional view of the PV/T is shown in Figure 1. The PV/T was composed of a PV cell and air flow channel which was arranged below the PV cell to absorb the heat generated by the PV cell. For improving the radiation intensity received by the PV cell, a CPC is adopted which is shown in Figure 2. The lines GB and IF in the figure indicate the CPC structure [25]. For the LCPV/T, electric energy was stored in the battery or consumed directly while thermal energy was used for the heat source of the AHP.
The schematic diagram of the system is shown in Figure 3. It should be noted that only the main components are shown in this figure. There are mainly two types of working medium in the system: water and air, which are also shown in different colors in the system diagram. As shown in the figure, the blue line represents water, the red line represents as air, and the orange line indicates electricity. Considering the freezing cracking problem of the cooling channel when water is adopted, the PV cell is cooled down by air in winter. First, air is pumped into cooling channel of LCPV/T by fan. After being heated by the LCPV/T, the air is used as the heat source of the AHP and is discharged into the environment after heat exchange. Due to the air heated by LCPV/T, the performance of the AHP is also promoted [21]. As for the load side of AHP, water is heated by the AHP and pumped into the capillary network. After heat exchange in the capillary network, water flows back to the AHP to complete a cycle.

3. Simulation Model

3.1. System Model

The system was built and simulated in Transient System Simulation Program (TRNSYS) software. TRNSYS’s main feature is modular analysis. It involves simulation and calculation of a heating, ventilation and air-conditioning (HVAC) system and low-energy consumption buildings. In addition to the main component library, TRNSYS also has other component libraries to assist the system operation and analysis, such as control module, calculation and data optimization.
The system is divided into three parts: experimental room, LCPV/T and AHP. The building part is the key part to determine the parameters of other two parts. In this model, an experimental room is built by TRNbuild in TRNSYS, which includes the parameters of building direction, total area, the heat transfer coefficient and area of building envelope, etc. In order to make the system operate under practical working conditions, “Typical Meteorological Year” (TMY) module is adopted for providing meteorological data of a typical year. The experimental room is located in Beijing, and the area of the experimental room is 42.3 m2. A capillary network is arranged inside the wall of the house, and the fluid flows into the capillary network to heat the house. The specific parameters of the house are shown in Table 1. It should be noticed that the building envelope parameters are set up based on the residential building design standard of China in cold region which is shown in [26].
Table 2 shows the corresponding models of the main components in the system in the TRNSYS component library. The experimental room uses Type 56 in TRNSYS and the cold and hot water tanks in the system adopt Type 4. The LCPV/T is represented by Type 560 in TRNSYS system. The AHP adopts Type 668 which is the type of air-water heat pump. Other important components (not listed in Table 2) are also used in the system, such as equation, weather data, controller and data output component. The time step of dynamic simulation was set to 1 h.
The system provides space heating from 1 January to 31 March (0–2160 h) and 1 October to 31 December (6550–8760 h) in Beijing. The dimension parameter of the LCPV/T is shown in Table 3. In this table, absorptance of the PV cell is the ratio of the radiation effectively absorbed by the PV cell to the radiation on the PV cell. Table 4 shows the parameter of the AHP which is adopted in the system. The main parameter of AHP is designed based on [27]. Rated heating capacity is the heating production by the AHP in a designed condition, and rated heating power is the electricity consumption of the AHP for heating in designed condition. The rated heating capacity and rated heating power are 4000 W and 1000 W, respectively. The system operates at a fixed flow rate throughout the year, in other words, two parts of flow rate of both heat source and load side of the AHP remain constant. The flow rate of heat source, i.e., the flow rate of air is 1000 kg/h, and the flow rate of the load side which is water is 500 kg/h. The flow rate selection considers the heating load of the experimental room and the operation temperature of components in the system.

3.2. Control Strategy

In this study, a control strategy is set up to make sure that the indoor temperature of the experimental room can reach the set temperature with the effect of the LCPV/T-AHP system. In order to ensure that the system operates with minimum power consumption while heating load is met, AHP is controlled by the indoor temperature of the experimental room. Besides, indoor temperature indicates whether the system meets the heating demand in the heating season. The system monitors indoor temperature t i n d o o r and introduces indoor set temperature of t i n d o o r , s e t (21 °C) to control the operation of the AHP. To prevent the AHP from frequently starts and stops, the upper dead band temperature difference and lower dead band temperature difference are set to 2 °C. When the indoor temperature is below 19 °C, the controller controls the AHP to start running to heat the room. When the indoor temperature is higher than 23 °C, the experimental room does not need to continue heating, so the controller turns off the AHP.

3.3. Mathematical Models

Based on the energy conservation equation, the mathematics model for the LCPV/T-AHP system is established. For the purpose of simplifying the calculation model, the following assumptions are proposed: (1) the heat loss caused by transportation in the pipe is ignored. (2) The state of the system in each timestep is steady, which is determined by the characteristic of TRNSYS. (3) The power consumption of the pump and fan in the system is neglected, only the operation of the LCPV/T and AHP are discussed [29].
In the mathematical model of the system, the first law of thermodynamics and the second law of thermodynamics are used to evaluate the performance of components. First, the system is analyzed by the first law of thermodynamics. In the mathematical model of the LCPV/T, the power, electrical efficiency and thermal efficiency of the LCPV/T are calculated. The generated power of the PV cell P ˙ P V (W) is expressed as follows [30]:
P ˙ P V = U m × I m
where U m (V) is the voltage corresponding to maximum power of the PV cell, I m (A) is the current corresponding to maximum power of the PV cell.
The thermal power of the LCPV/T Q ˙ t h (W) is expressed as follows:
Q ˙ t h = C p , a m ˙ a i r t P V T , o u t t P V T , i n
where C p , a (J/(kg × K)) is the specific heat capacity of air, m ˙ a i r (kg/s) is the mass flow rate of air, t P V T , o u t (°C) is the outlet temperature of the LCPV/T, t P V T , i n (°C) is the inlet temperature of the LCPV/T.
The electrical efficiency of the LCPV/T η e (%) is expressed as follows:
η e = P ˙ P V C G A p × 100 %
where C is the concentration ratio of the LCPV/T; G (W/m2) is the radiation intensity, A p (m2) is the area of the PV cell.
The thermal efficiency of the LCPV/T η t h (%) is expressed as follows:
η t h = Q ˙ t h C G A p = C p , a m ˙ a i r t P V T , o u t t P V T , i n C G A p × 100 %
The overall efficiency of the LCPV/T η o v e r a l l (%) is expressed as follows [31]:
η o v e r a l l = η e + η t h
Since air can be approximated as ideal gas, the entropy change of air is expressed as follows:
Δ S ˙ = m ˙ a i r ( C p l n ( T o u t T i n ) R g l n ( p o u t p i n ) )
where Δ S ˙ (W/K) is the entropy change, R g (J/(kg × K)) is the ideal gas constant.
The main performance parameter of the AHP is COP. In this system, auxiliary heat is not used in all components. C O P is expressed as follows:
C O P = Q ˙ 1 W ˙ H P
where Q ˙ 1 (W) is the heat absorbed by the load side of AHP, W ˙ H P (W) is the electric power consumed by the AHP.
Q ˙ 1 mainly depends on the temperature at the load side of the AHP. Q ˙ 1 is expressed as follows:
Q ˙ 1 = C p , w m ˙ w a t e r t 1 , o u t t 1 , i n
where t 1 , o u t (°C) is the outlet temperature of the load side of the AHP, t 1 , i n (°C) is the inlet temperature of the load side of the AHP.
When calculating the power consumption, the power consumption of auxiliary heat is set as 0. W ˙ H P is expressed as follows:
W ˙ H P = W ˙ c o m + W ˙ b l + W ˙ c
where W ˙ c o m (W) is the consumed power of the compressor of the AHP, W ˙ b l (W) is the consumed power of the blower of the AHP, and W ˙ c (W) is the consumed power of the controller of the AHP.
The first law of thermodynamics only reflects the quantity of energy produced by the system, in which the LCPV/T produces high-quality electricity and low-quality thermal energy, it is necessary to adopt the second law of thermodynamics to analyze the quality of energy product of each component. The equation of the LCPV/T in steady state is composed of three parts: input exergy, output exergy and exergy loss:
E ˙ x i n E ˙ x o u t = E ˙ x d , L
E ˙ x o u t = E ˙ x P V T = ( E ˙ x t h + E ˙ x P V )
where E ˙ x i n (W) is the input exergy rate of the LCPV/T, that is, the solar exergy rate of the LCPV/T, E ˙ x o u t (W) is the output exergy rate of the LCPV/T, E ˙ x d , L (W) is the exergy loss of the LCPV/T in the process of exergy conversion, E ˙ x P V T (W) is the product exergy of the LCPV/T, E ˙ x t h (W) is the thermal exergy generated by the LCPV/T, E ˙ x P V (W) is the electrical exergy of the LCPV/T.
Radiation can be transformed through different processes while work is the process of energy transfer. Therefore, the exergy can be defined by work and the actual energy conversion efficiency of heat radiation into work can be defined as the ratio of the work to the energy of radiation. In an ideal process, the maximum work is obtained from the radiation, and the ratio ψ represents the maximum conversion efficiency [32]:
ψ = η e n , m a x = W m a x e = 1 + 1 3 T 0 T s u n 4 4 3 T 0 T s u n
where ψ is relative potential of the maximum energy available from radiation, η e n , m a x (%) is the maximum conversion efficiency, W m a x (J) is the maximum work obtained from radiation energy, e (J) is the radiation energy, T 0 (K) is the dead state temperature which is equal to the ambient temperature, T s u n (K) is the sun temperature.
The input exergy rate of the LCPV/T is calculated as follows [33]:
E ˙ x i n = E ˙ x s o l a r , i n = E ˙ n s o l a r , i n 1 + 1 3 T 0 T s u n 4 4 3 T 0 T s u n
E ˙ x s o l a r , i n = A P C G
where E ˙ x s o l a r , i n (W) in the solar exergy rate received by the LCPV/T, E ˙ n s o l a r , i n (W) is the solar energy received by the LCPV/T.
The thermal exergy rate generated by the LCPV/T is as follows [34]:
E ˙ x t h = Q ˙ t h ( 1 T 0 t P V T , o u t + 273.15 )
The electrical exergy rate generated by the LCPV/T is as follows:
E ˙ x P V = η e A P G C 1 + 1 3 T 0 T s u n 4 4 3 T 0 T s u n
In a word, the electrical exergy efficiency, thermal exergy efficiency and overall exergy efficiency are calculated as follows:
η e x , P V = E ˙ x P V E ˙ x i n × 100 %
η e x , t h = E ˙ x t h E ˙ x i n × 100 %
η e x , P V T = η e x , P V + η e x , t h
where η e x , P V (%) is the electrical exergy efficiency of the LCPV/T, η e x , t h (%) is the thermal exergy efficiency of the LCPV/T, η e x , P V T (%) is the overall exergy efficiency of the LCPV/T
For the AHP, the exergy efficiency is the key parameter to evaluate the quality of product. The definition exergy efficiency of the AHP is the ratio of the demand exergy rate to supplied exergy rate, the exergy efficiency is expressed as follows [35]:
η e x = E ˙ x w a n t e d E ˙ x H P × 100 %
E ˙ x w a n t e d = ( 1 T 0 t ¯ 1 + 273.15 ) Q ˙ 1
t ¯ 1 = t 1 , o u t + t 1 , i n 2
where E ˙ x w a n t e d (W) is the wanted exergy rate, in this model, the wanted exergy rate of the AHP is the exergy rate difference between the outlet and inlet of load side. t ¯ 1 (°C) is the average temperature of load side of the AHP, E ˙ x H P (W) is the consumption exergy of the AHP which is equal to the power consumption of the AHP.

4. Result and Discussion

In this chapter, the simulation performance of the LCPV/T-AHP system was researched. The system operated in heating season (1 January to 31 March and 1 October to 31 December). Based on the composition of the system, the feasibility of the system was proved according to the indoor temperature. In addition, the energetic and exergetic performance of the LCPV/T and AHP were discussed. Furthermore, by changing the key parameters, the variable condition research was studied.
Figure 4 shows the inlet and outlet temperature of the LCPV/T on 15 January, which was the coldest day in this year. When the radiation was low, due to the effect of convective heat transfer, the outlet temperature was lower than inlet temperature. The beam radiation intensity reached maximum value at 13:00 which signified the maximum outlet temperature at 5.99 °C, corresponding to the temperature rise of 7.64 °C. Figure 5 showed the power and thermal performance of the LCPV/T on 15 January, the figure indicated that the electrical efficiency was stable at 10%. During the day, the electrical efficiency appeared a trend of decreasing first and then increasing, since the highest electrical efficiency was 10.7% at 9:00 while the lowest electrical efficiency was 10% at 13:00. Although the increase of radiation improved the electrical efficiency of the PV cell, the inlet temperature also increased with increasing of radiation, which caused the temperature of PV cell was higher than that with reference condition under the joint action of two factors. The thermal efficiency increased with the increase of solar radiation which reached 31.88% at 13:00 and the maximum overall efficiency of the LCPV/T was 41.88%.
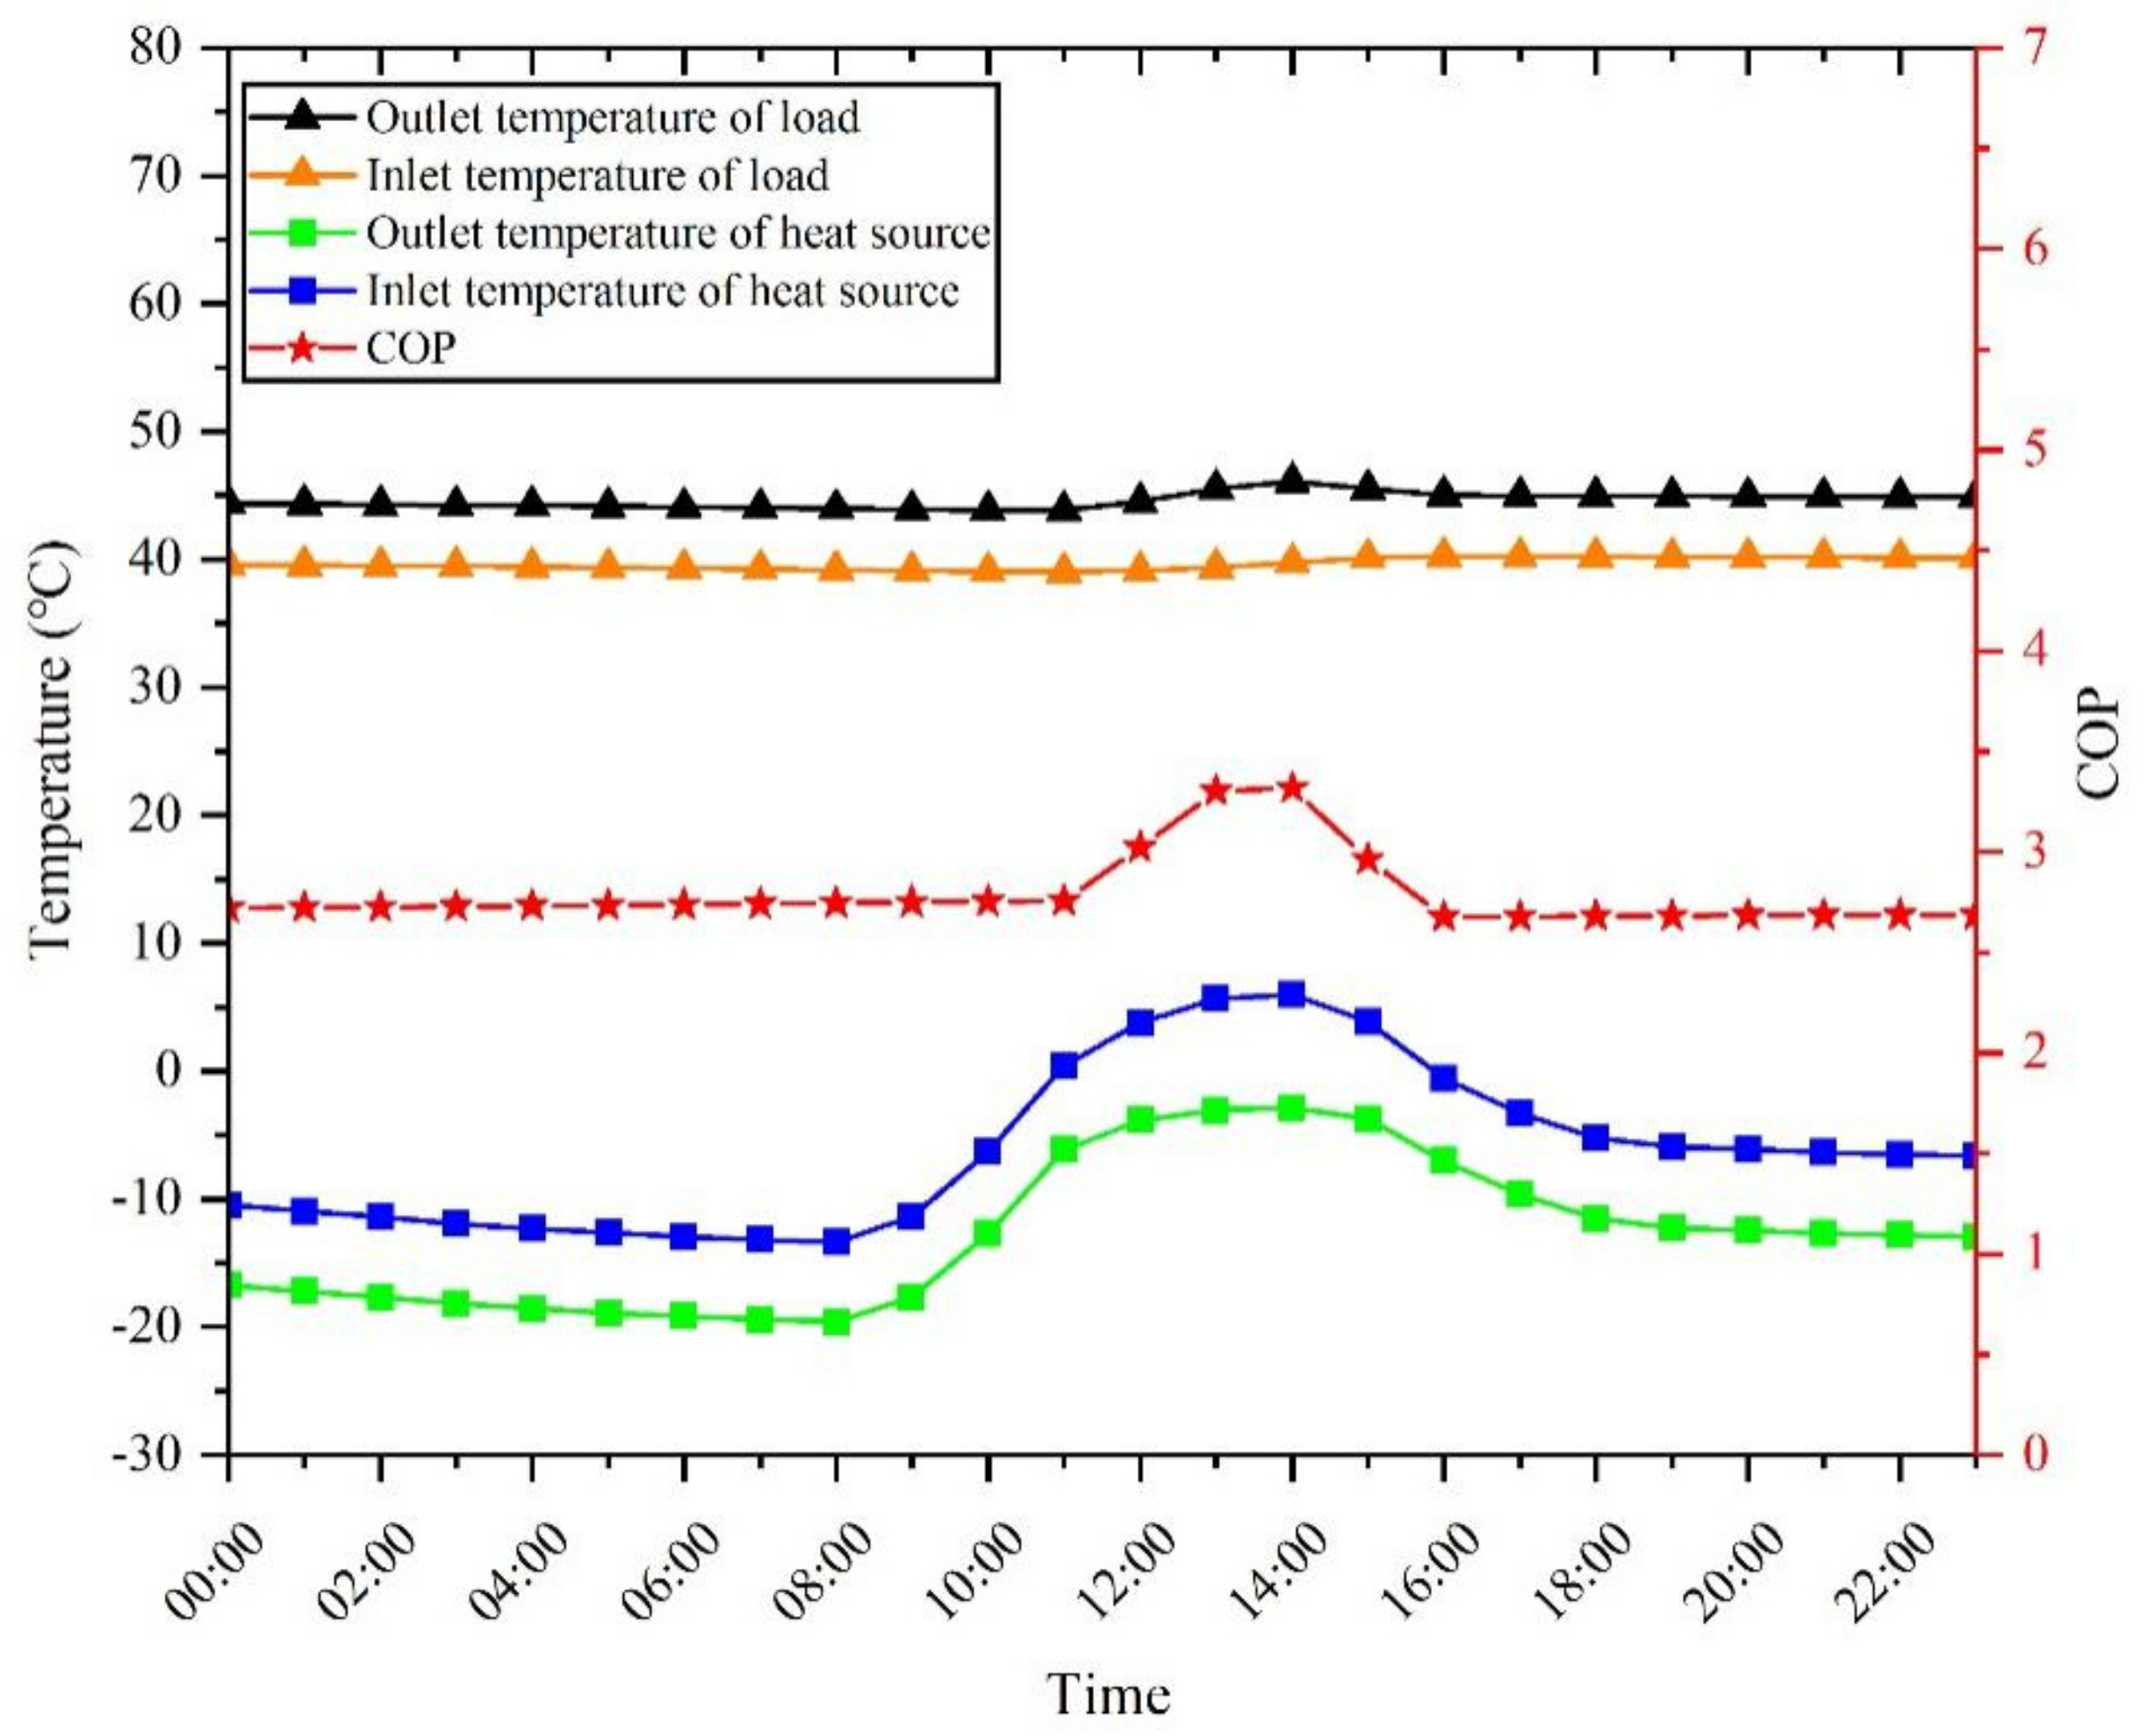
Figure 6 shows the operation performance of the AHP. To maintain indoor temperature at set temperature, the AHP kept operating all day. As is shown in this figure, the load side outlet temperature of the AHP remained stable at 44 °C while the inlet temperature was 40 °C corresponding to the temperature rise of 4 °C. The heat source inlet temperature of the AHP was equal to the outlet temperature of the LCPV/T. It can be seen that from the beginning of 11:00, the LCPV/T received radiation to heat the air. With the rising of outlet temperature of the LCPV/T, that was, the inlet temperature of the heat pump side, it had a positive effect on the COP of the AHP. When the heat source inlet temperature of AHP was from −10 °C to 5 °C, the COP of the AHP rose from 2.6 to 3.3. Then, with the decrease of heat source inlet temperature of the AHP, the COP changed back to 2.6.
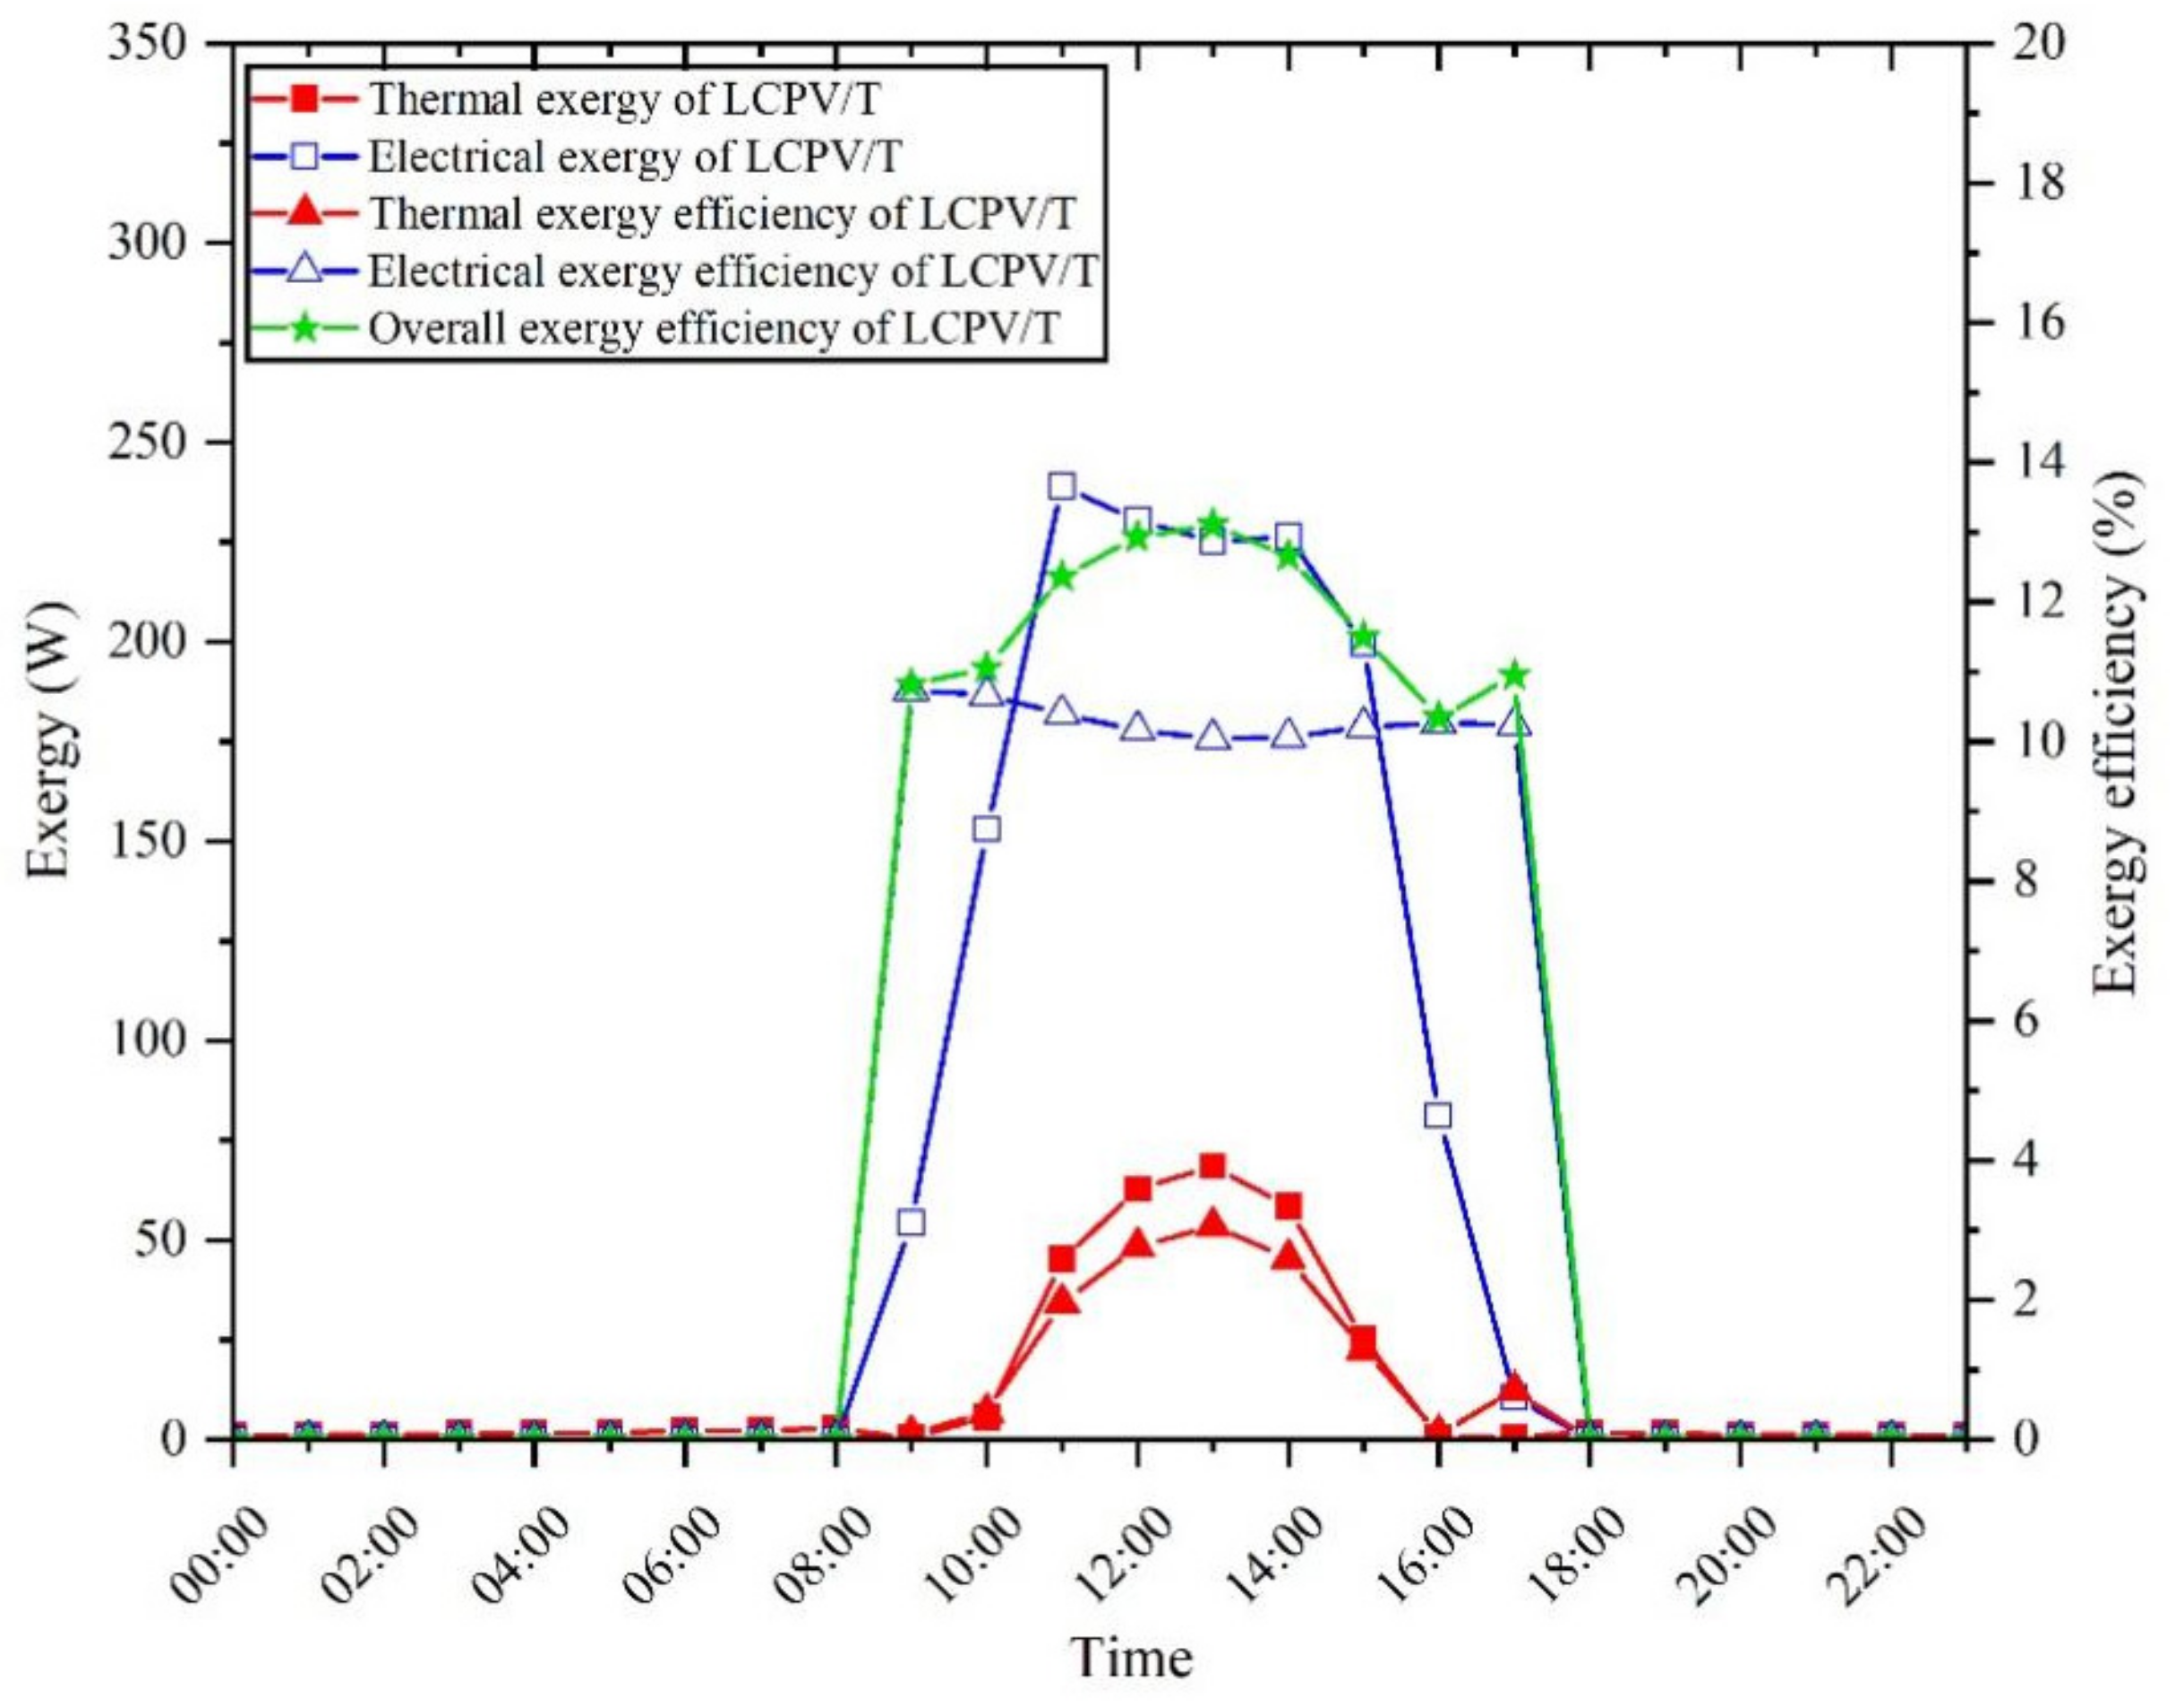
Figure 7 shows the exergy performance of the LCPV/T on 15 January, it was indicated that thermal exergy rate was far less than thermal capacity which thermal exergy was only 62 W while thermal capacity was 2281 W. The thermal energy produced by the LCPV/T was low grade energy which contributed to the low thermal exergy efficiency up to 2.7%. The electrical exergy efficiency was the same as that of electrical efficiency. The overall exergy efficiency of the LCPV/T was 13.1%. Therefore, in order to get more high-quality energy, the LCPV/T should operate on the premise of maximum electrical efficiency. 
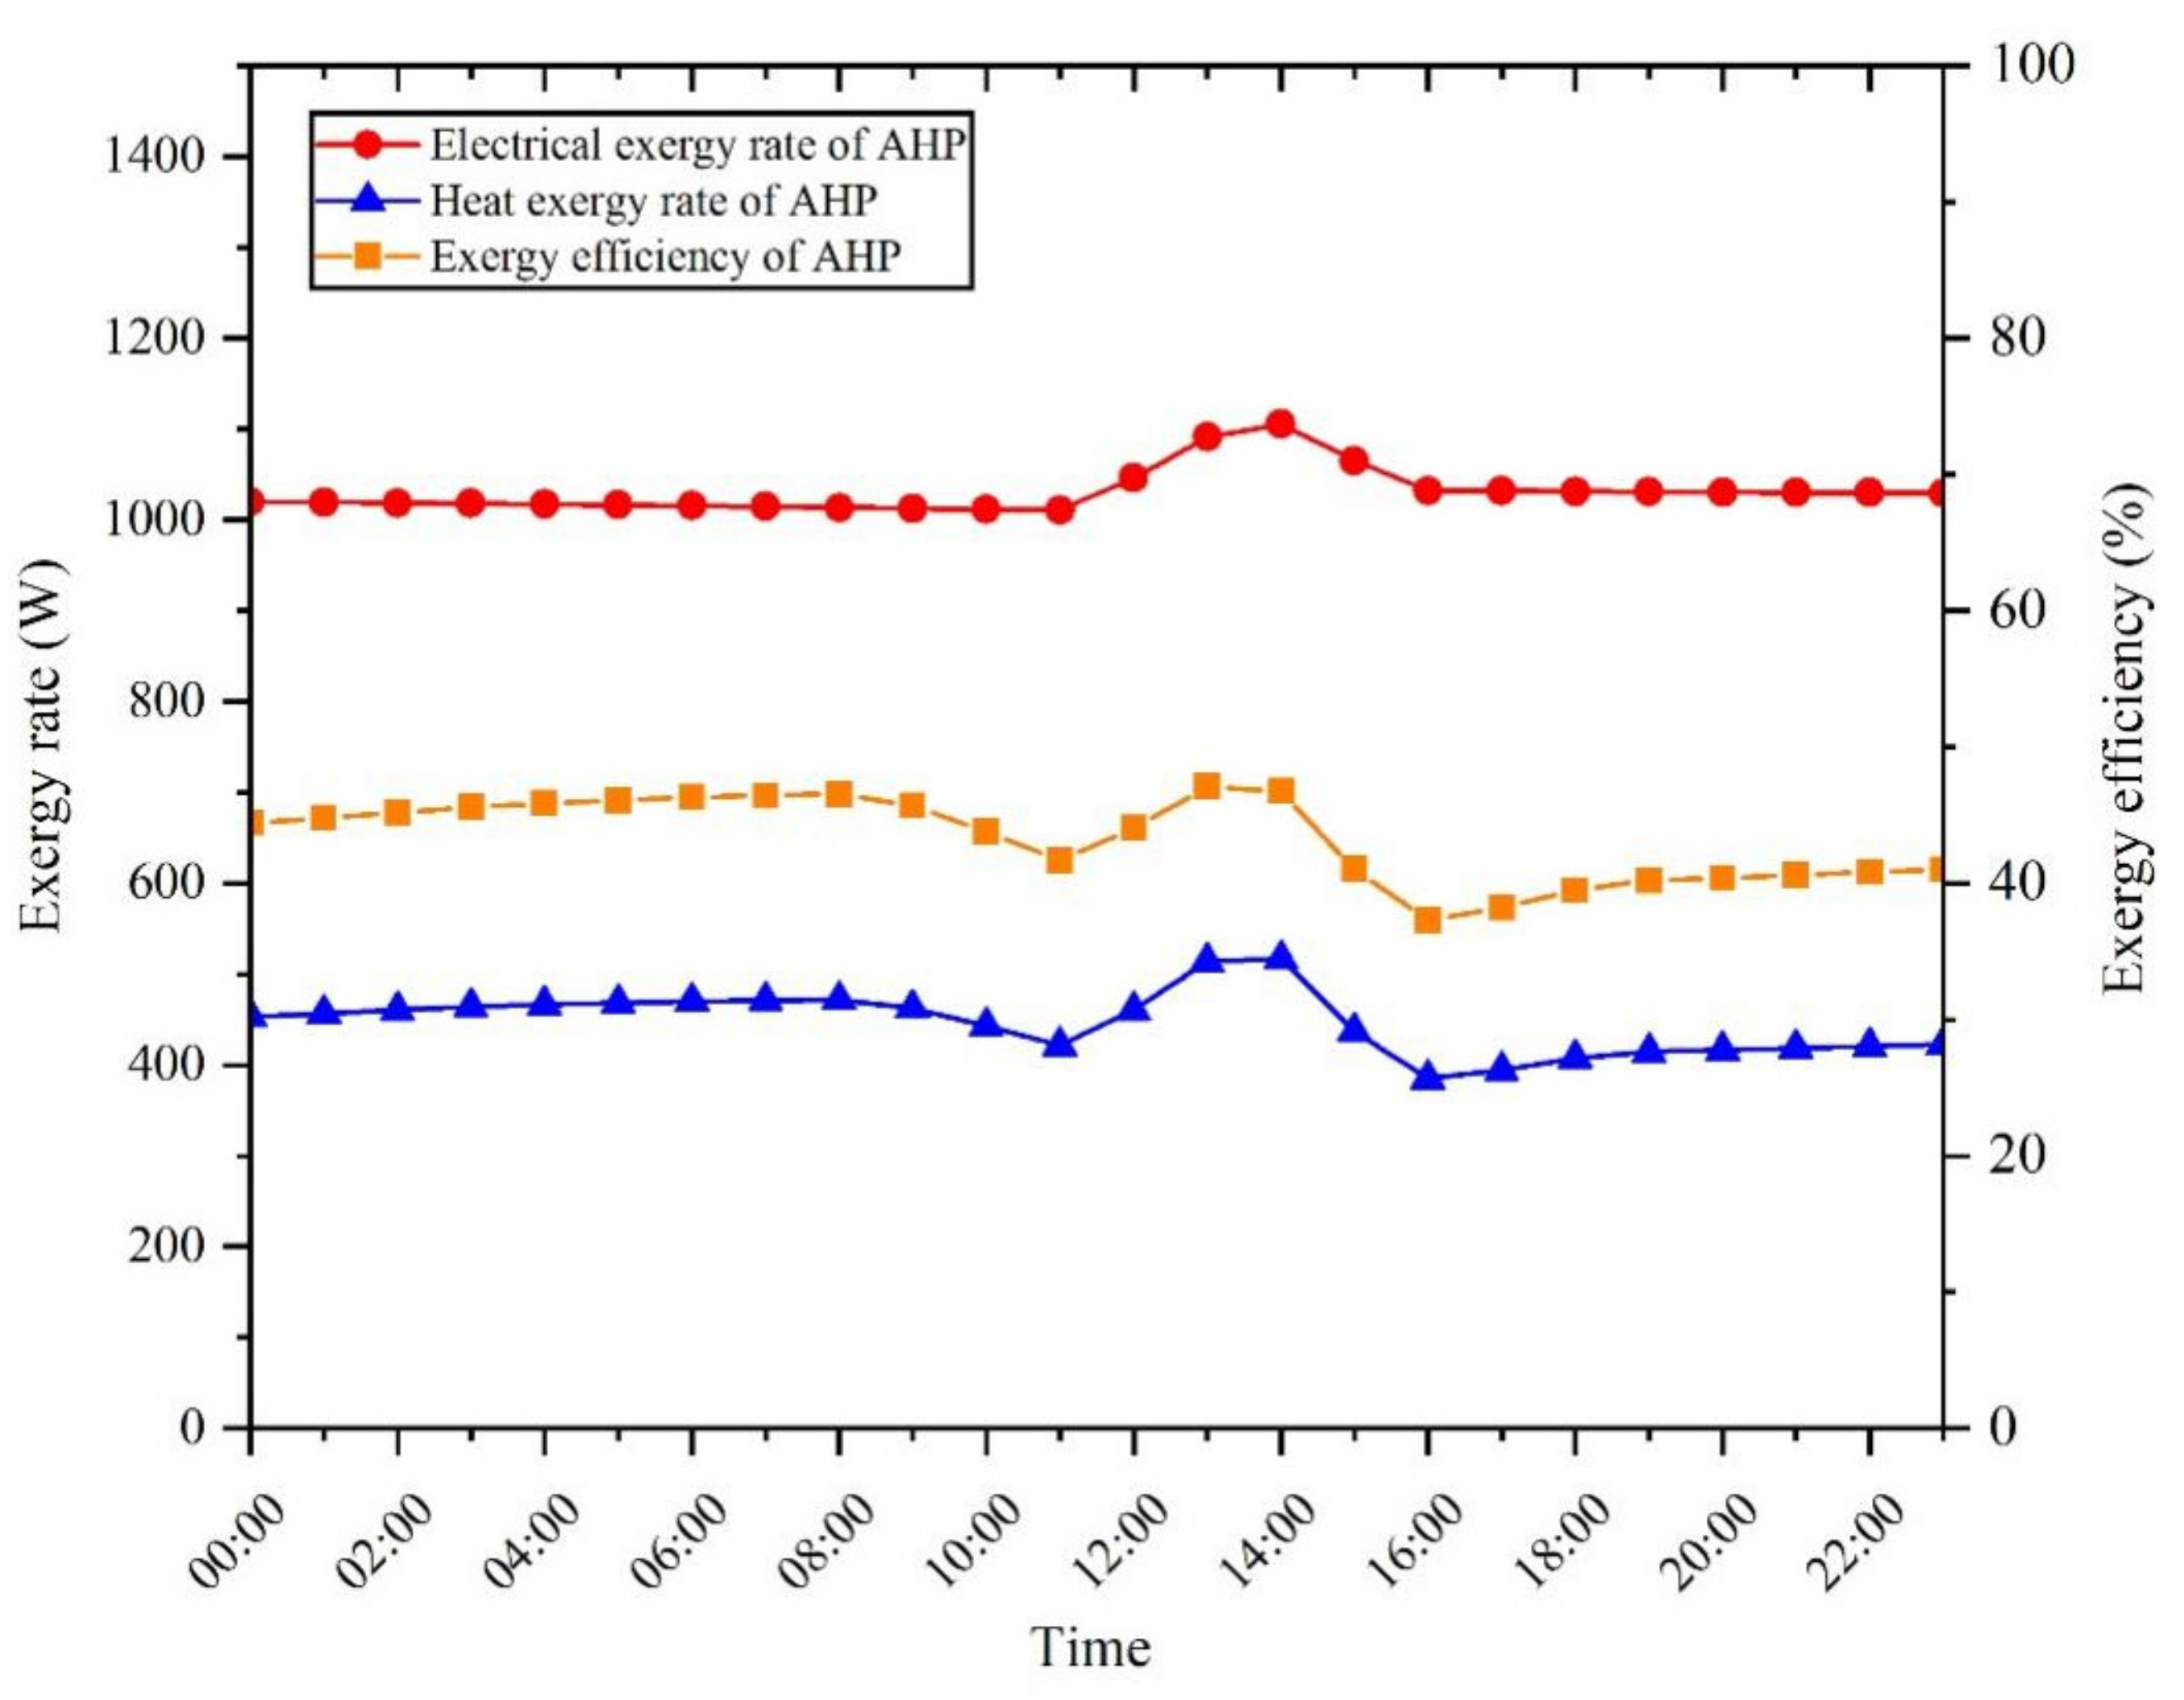
Figure 8 shows the electrical exergy rate, thermal exergy rate and exergy efficiency of the AHP on 15 January. The electrical exergy rate of the AHP was the same as power consumption of it. When the radiation reached max value, electrical exergy rate and thermal exergy rate increased simultaneously. The thermal exergy rate reached 500 W at noon and the thermal exergy efficiency also improved which was 47%. The weekly power consumption and generation of the LCPV/T-AHP was shown in Figure 9, the power consumption of pump and fan in the system was not considered. When the radiation value reaches the maximum value, the power consumption of the AHP was compensated by LCPV/T about half of power consumption.
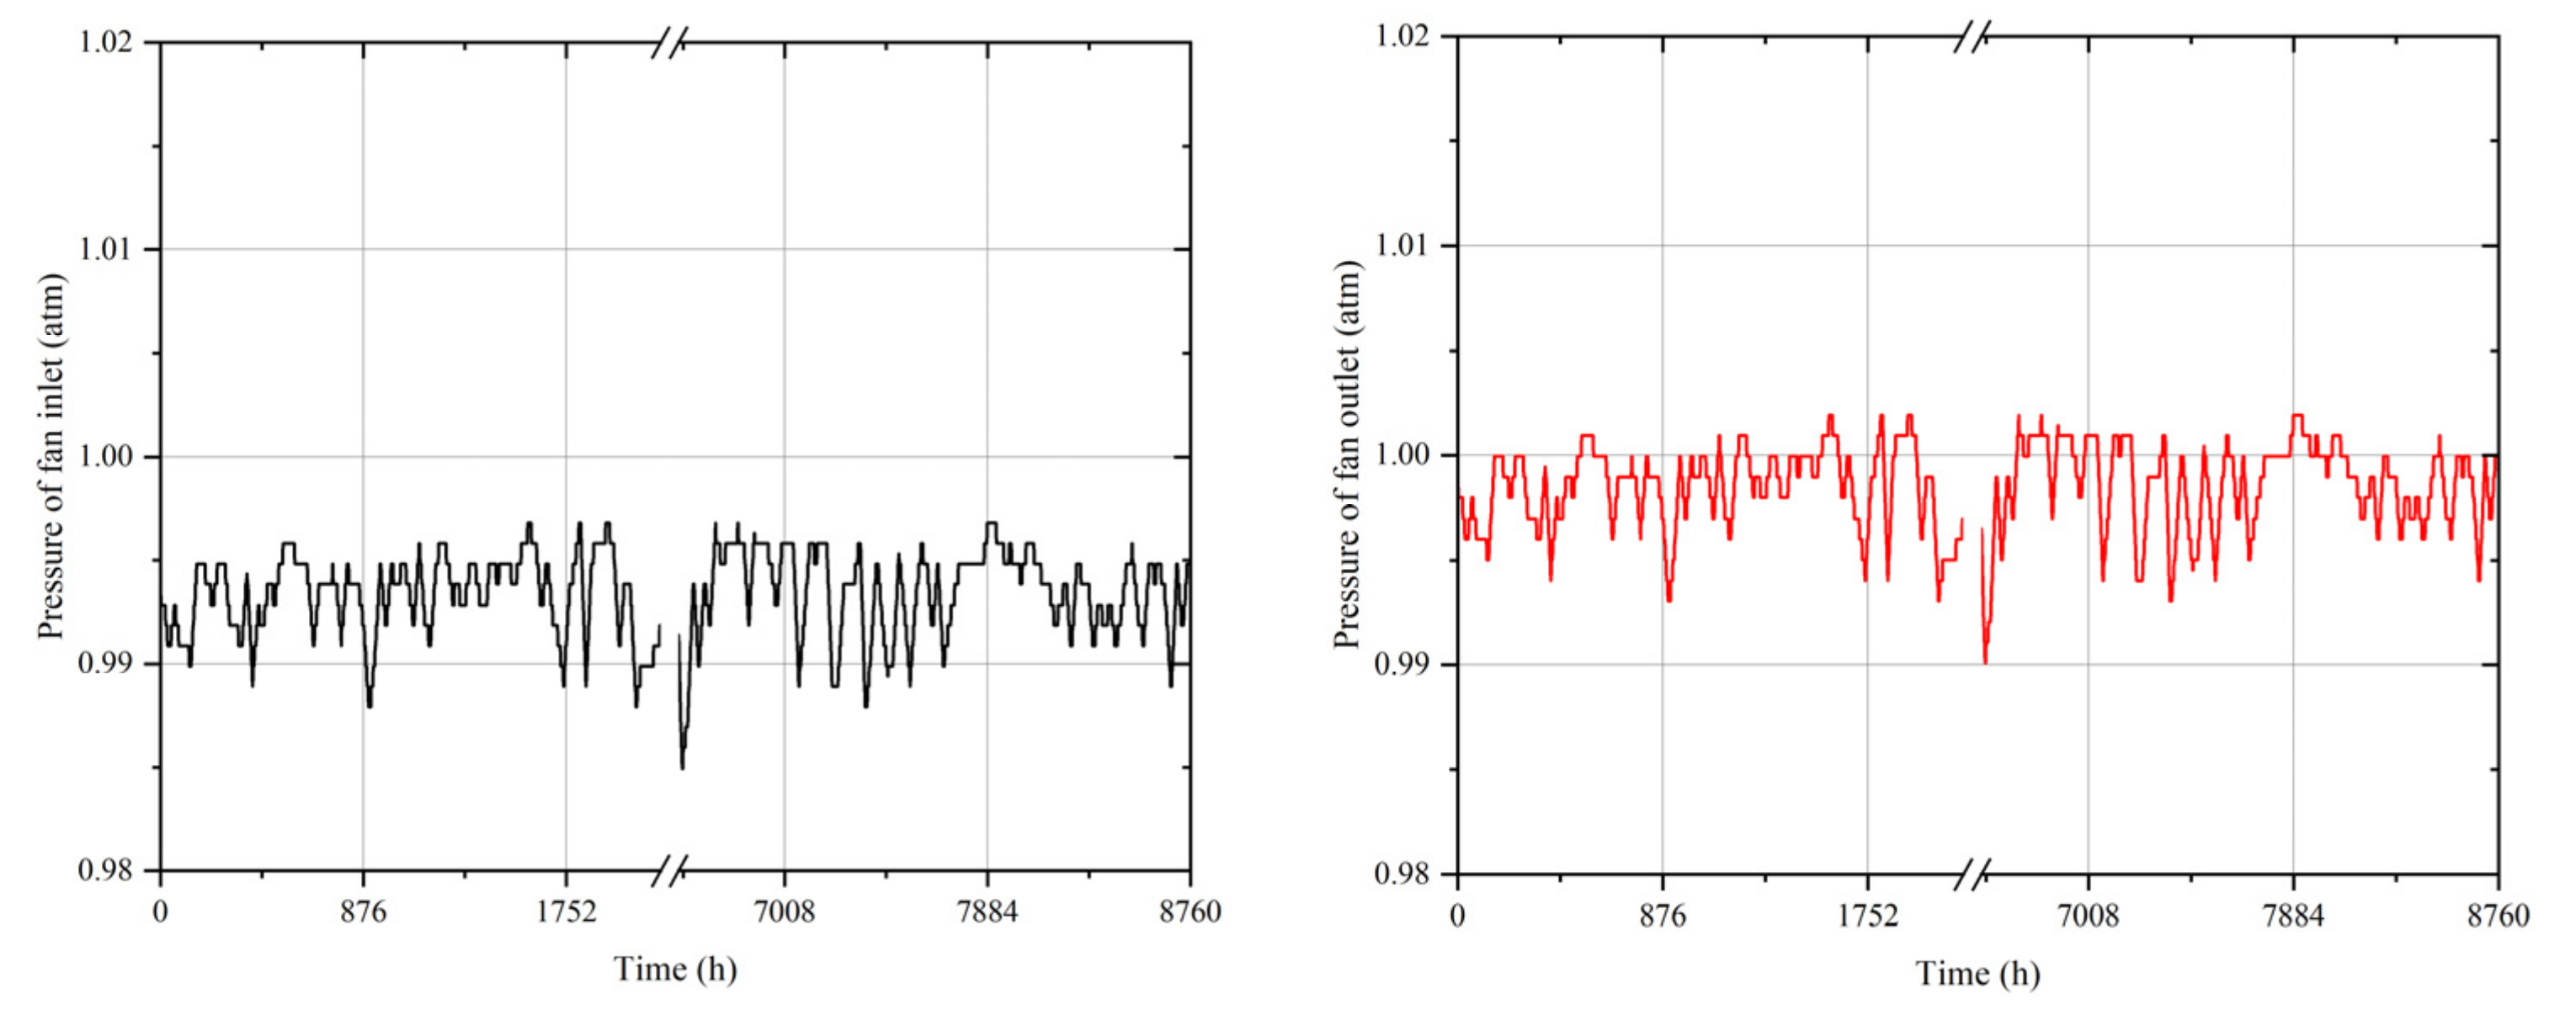
The pressure change of the fan is shown in 
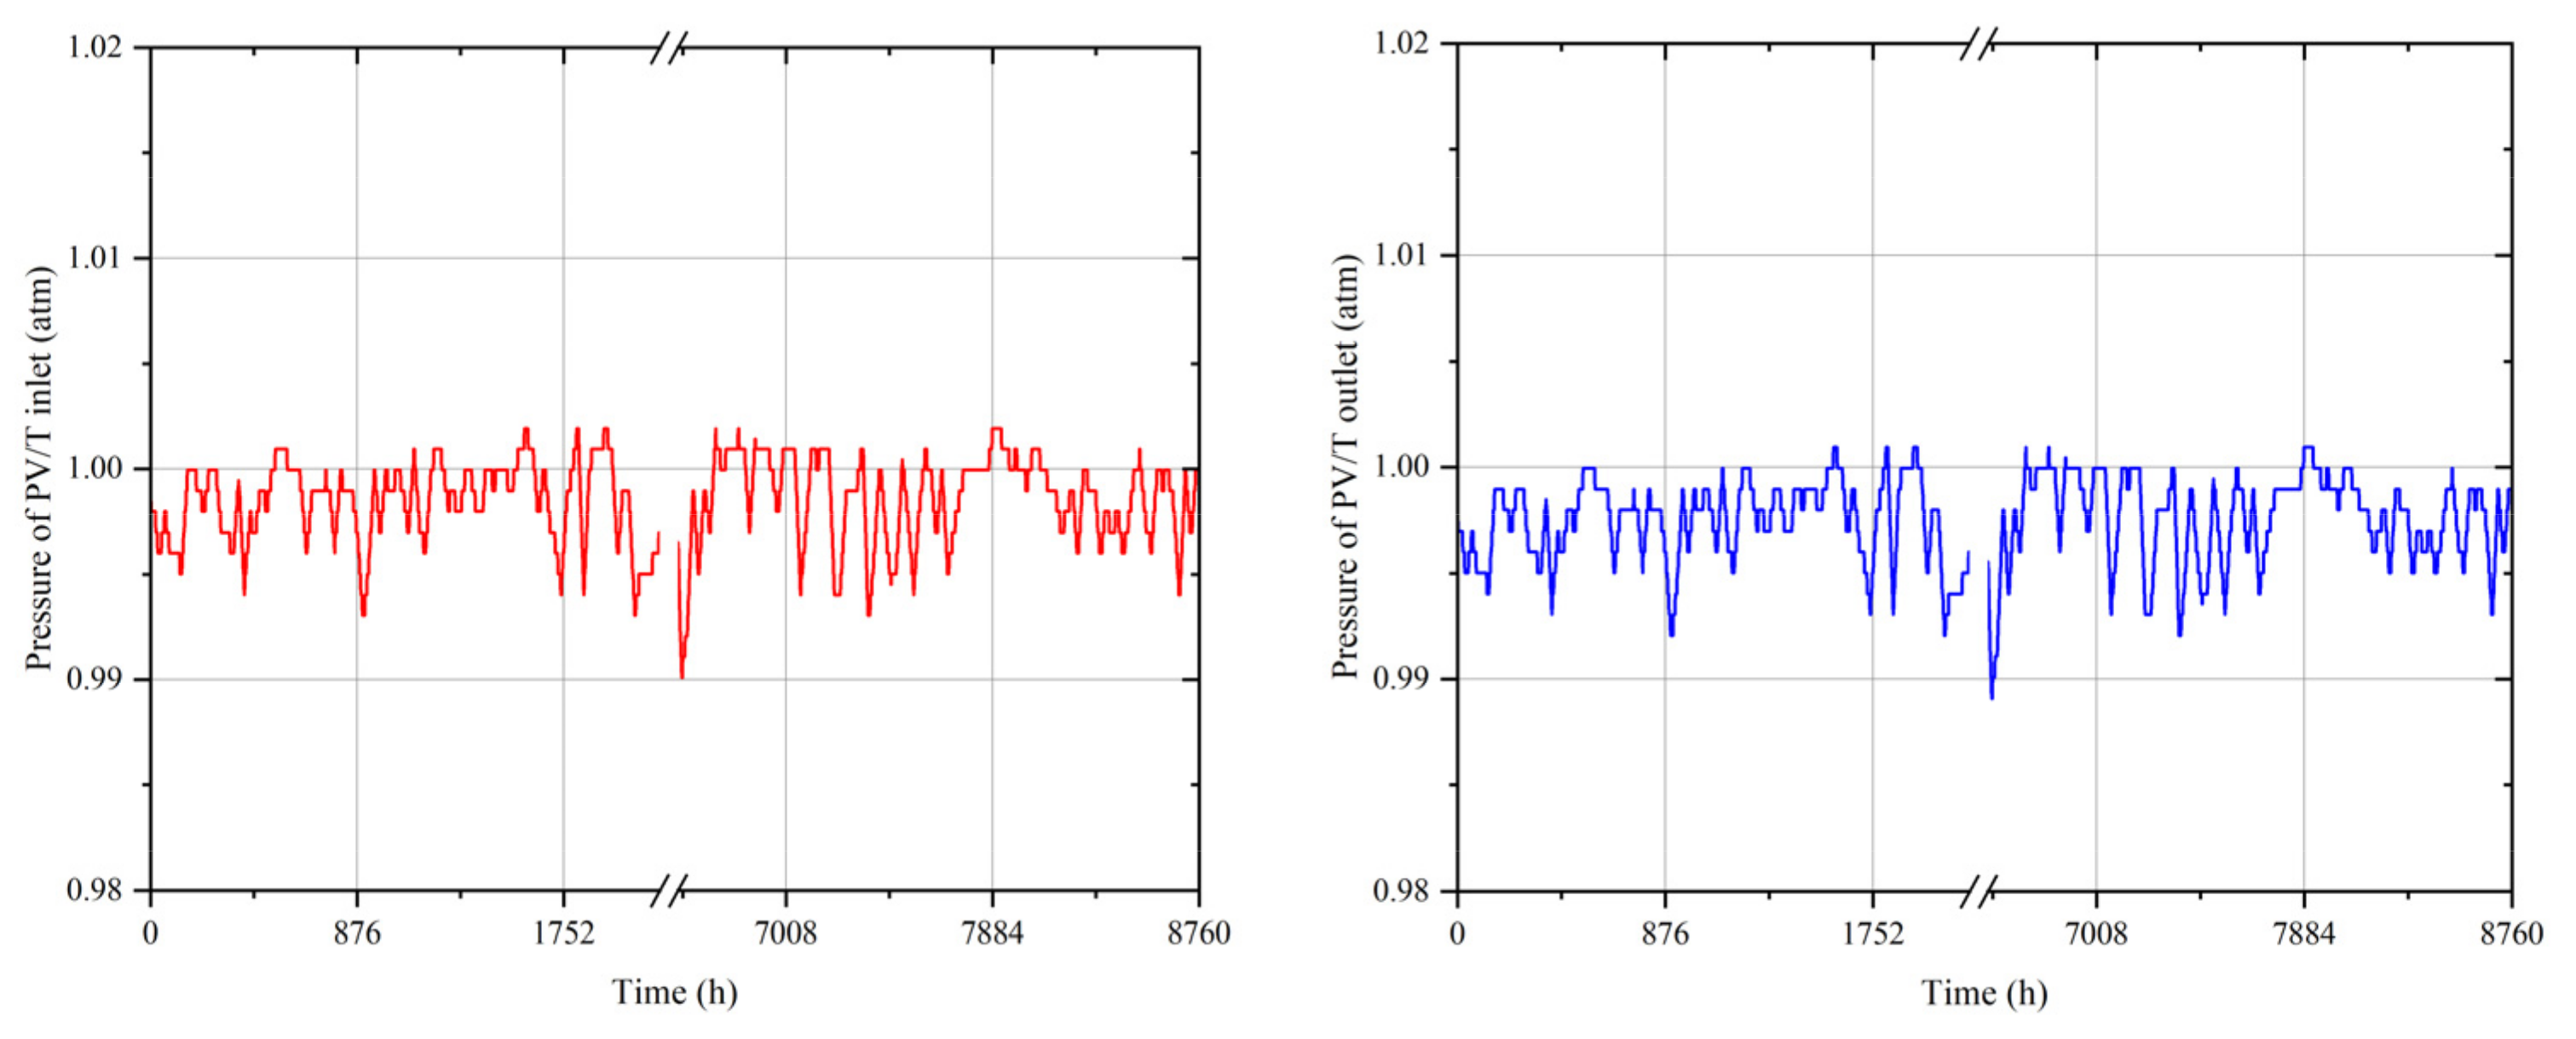
Figure 10. The outlet pressure of the fan was mainly influenced by the variation of inlet pressure, that was, the environmental pressure. 
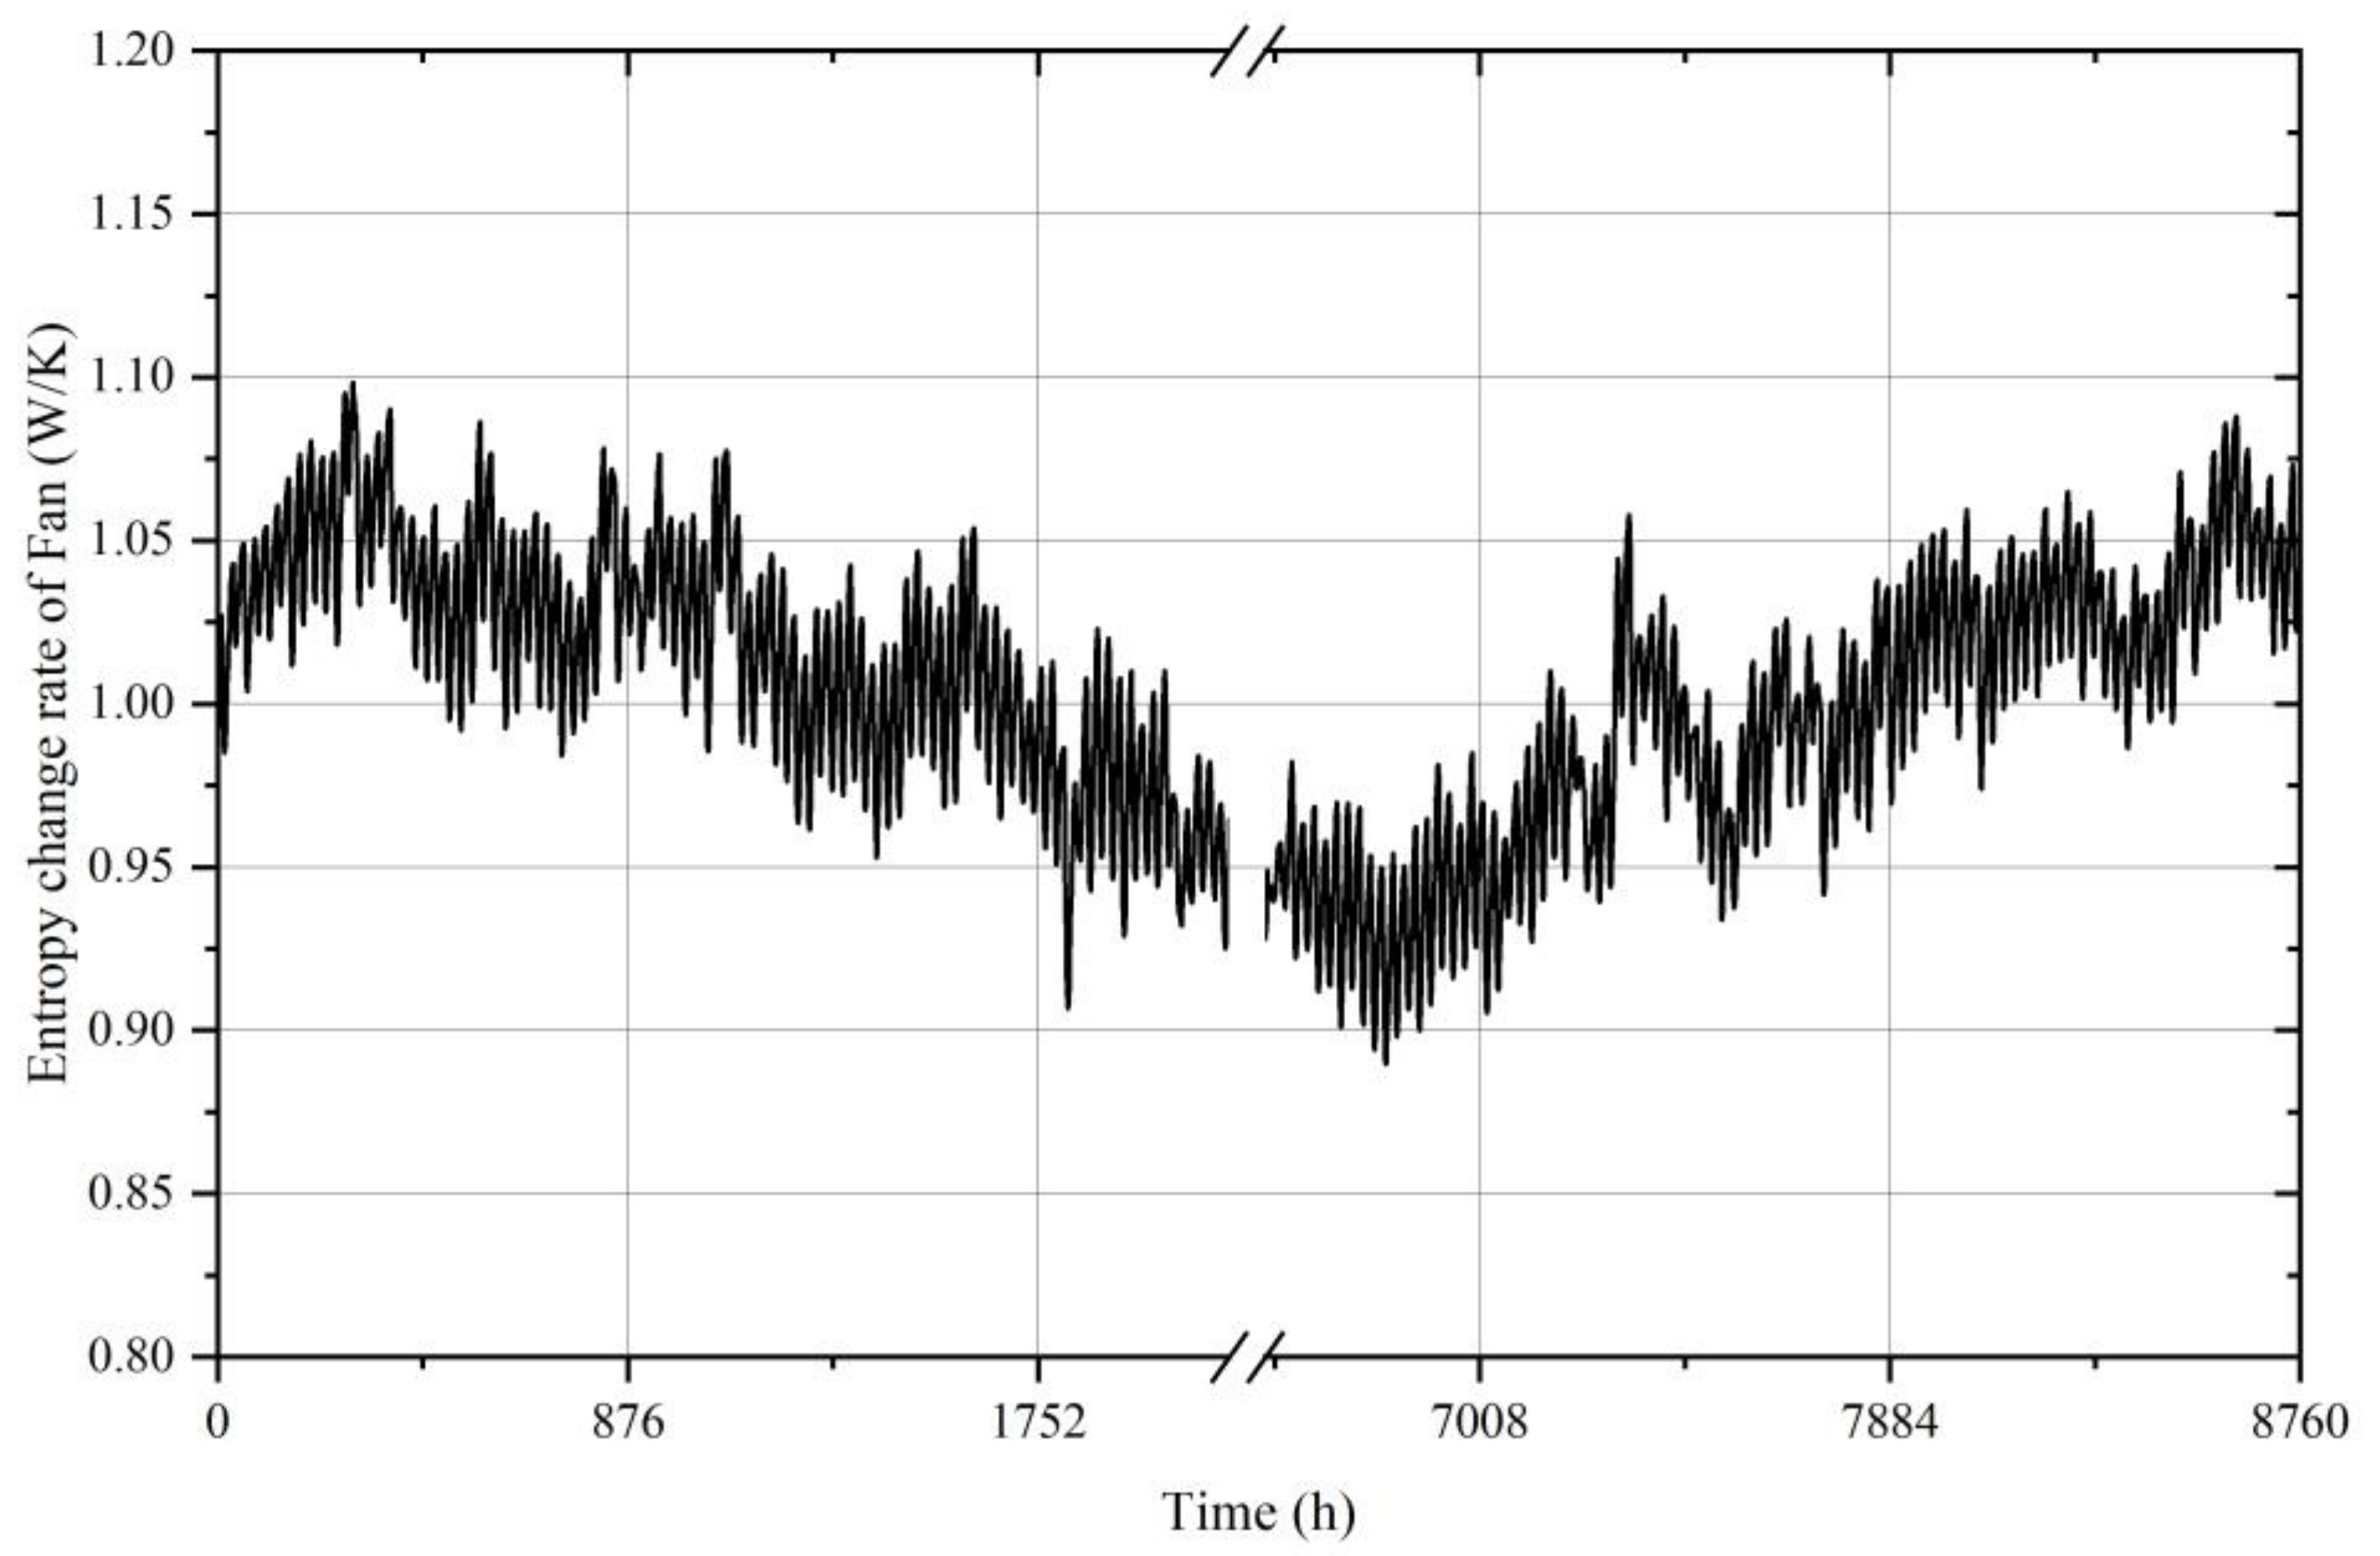
Figure 11 shows the variation of the air pressure change in the LCPV/T. According to this figure, the pressure drop of air in cooling channel was small which was about 100 Pa. Based on the pressure change in fan and the LCPV/T, the entropy change of the fan and LCPV/T can be obtained. As shown in Figure 12, the entropy change of fan was small and the entropy change was relatively large in winter. Figure 13 showed the entropy change of air in the LCPV/T. It can be seen that the entropy change was small in winter and enhanced with the increase of ambient temperature. The two factors influenced entropy change were l n ( T o u t T i n ) and l n ( p o u t p i n ) . With the increase of ambient temperature, l n ( T o u t T i n ) increased greatly while l n p o u t p i n changed slightly due to the low pressure drop. Thus entropy change was lower in winter.
The indoor temperature comparison between experimental room and reference room which was no space heating was shown in Figure 14. It can be seen from the indoor temperature variation trend that with the effect of the LCPV/T-AHP system, the indoor temperature was basically maintained within the set value to meet the indoor temperature requirements in winter. Thus, the system can meet the heating demand of the experimental room. Figure 15 shows the power consumption and power generation of the LCPV/T-AHP system in whole year.
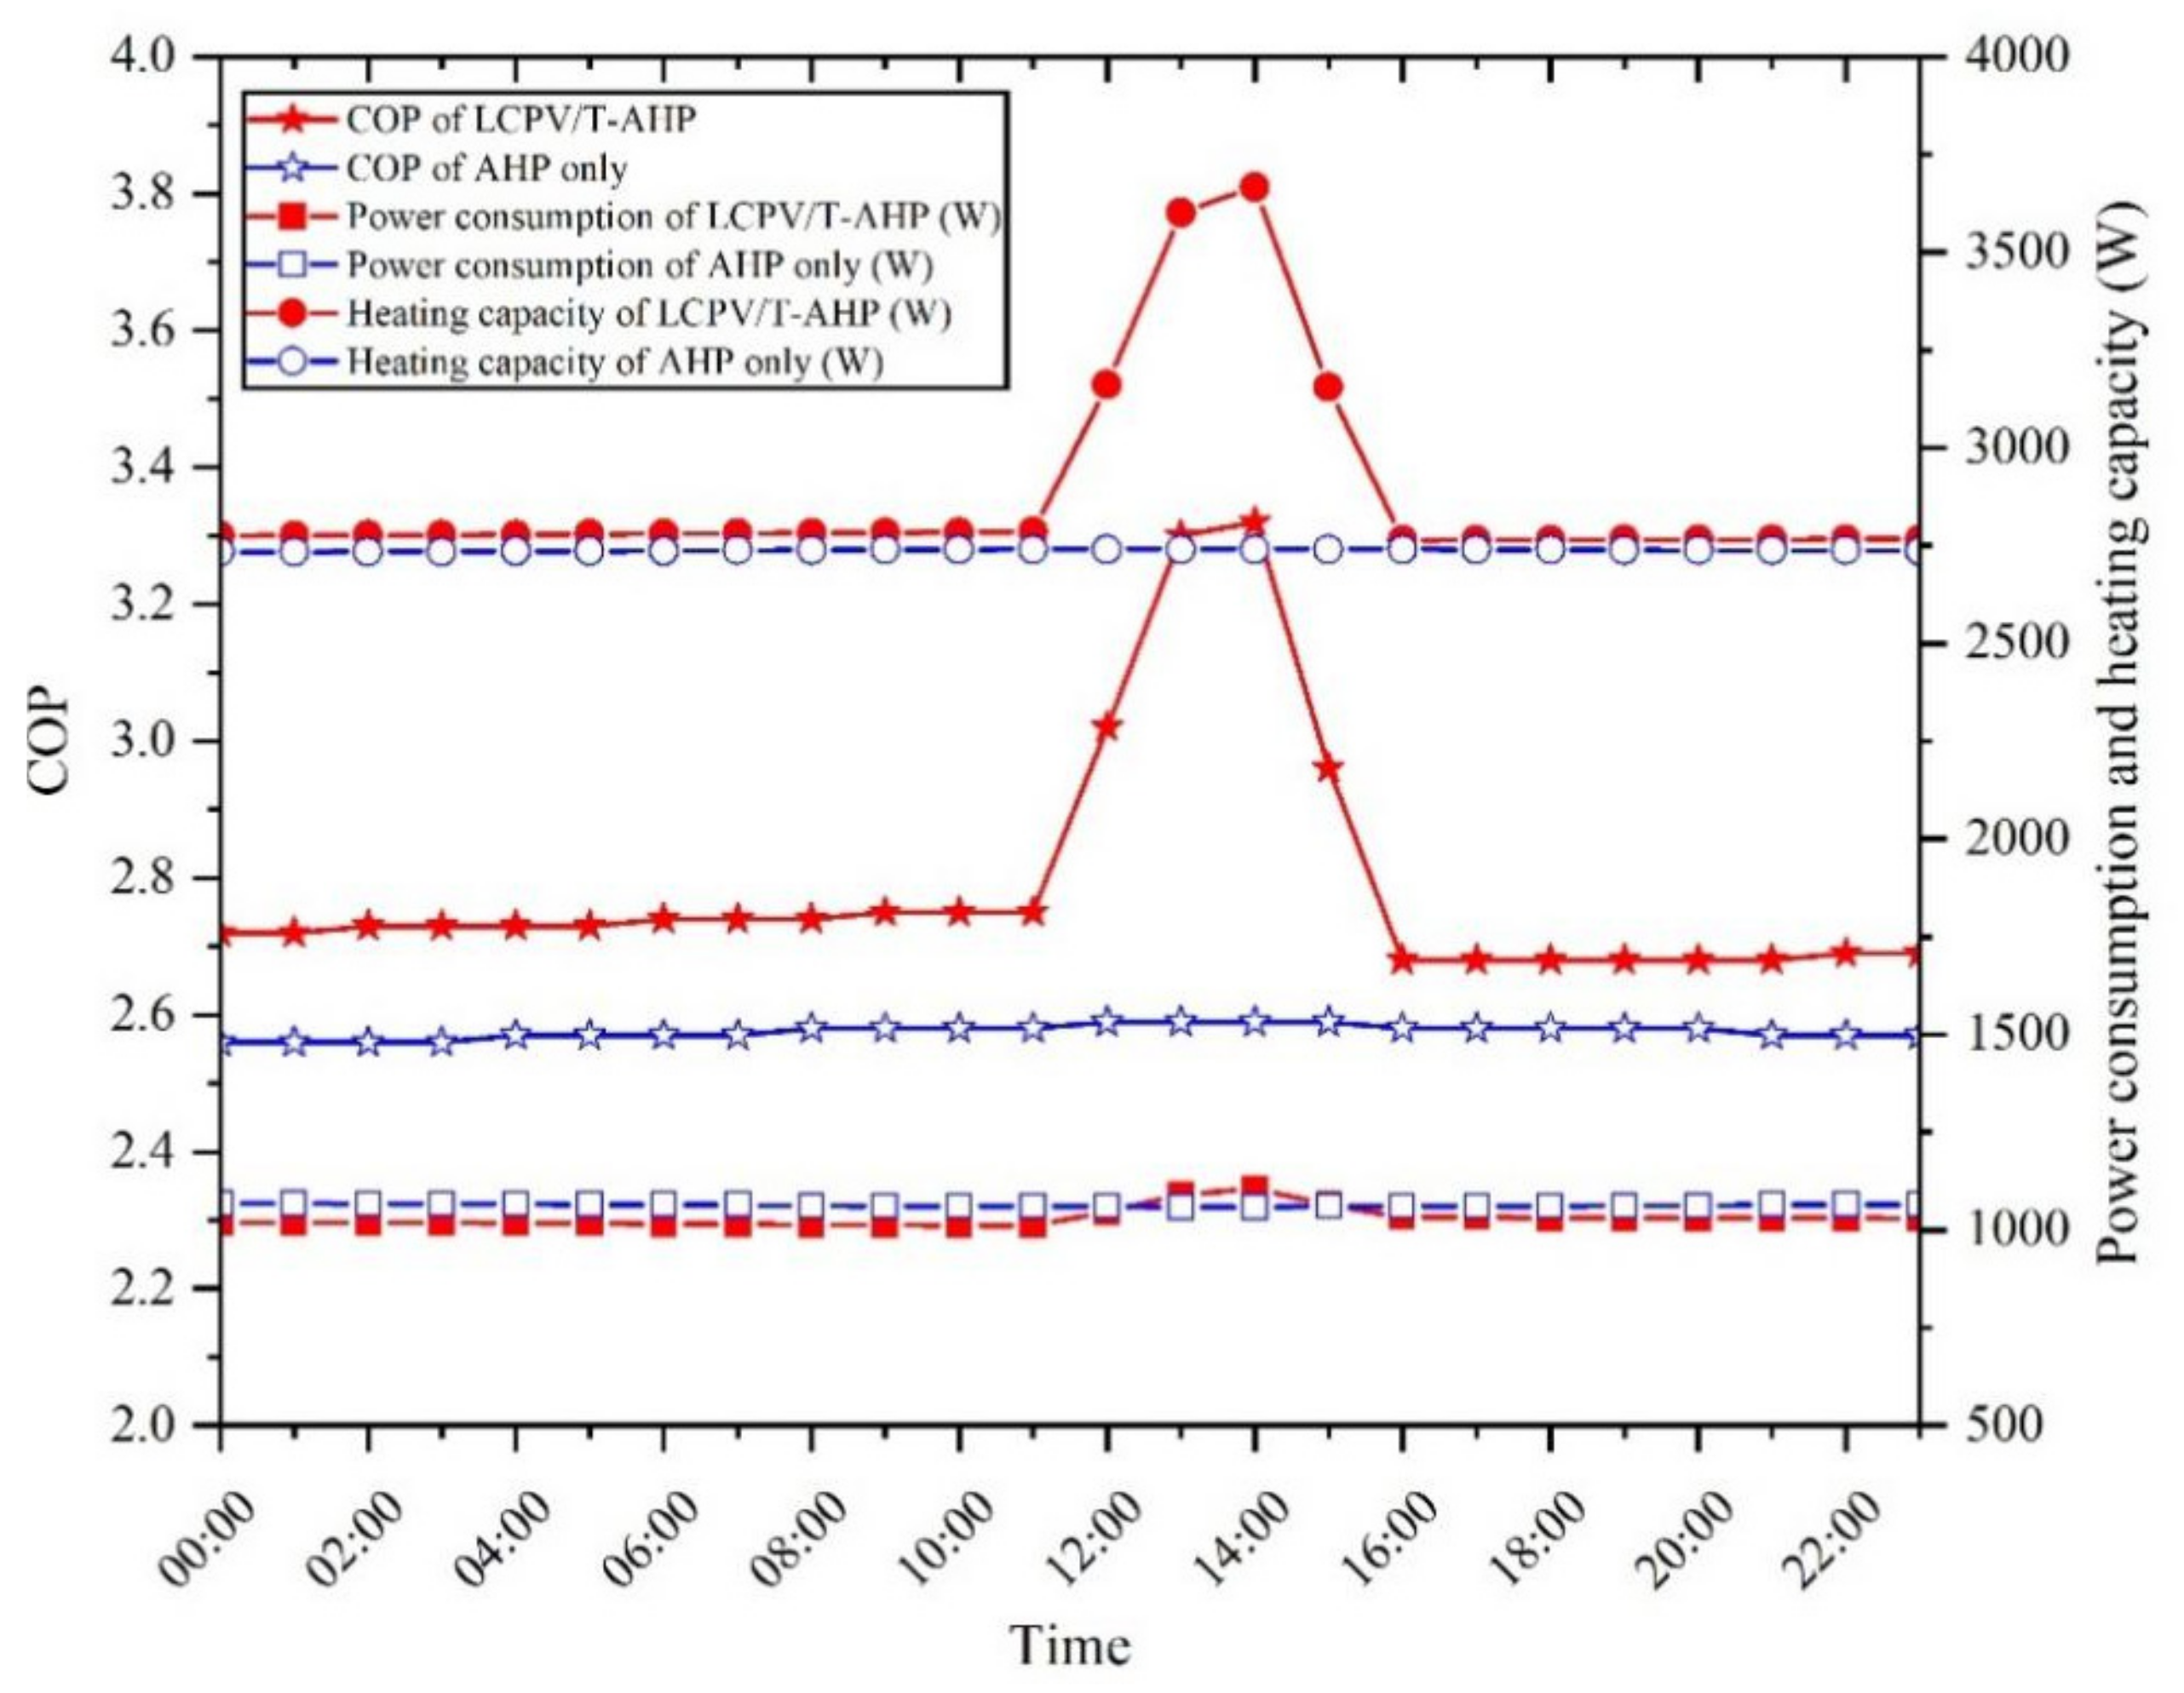
To verify the improvement of the LCPV/T-AHP system when the LCPV/T was adopted, the comparison between the LCPV/T-AHP coupled system and the AHP only system on 15 January was studied which is shown in Figure 16. Under the effect of LCPV/T, the COP of the AHP increased to a certain extent. When solar radiation was received by the LCPV/T, the COP of the AHP also raised with the increase of the LCPV/T outlet temperature, furthermore, the COP of the AHP with the LCPV/T was higher than that without the LCPV/T. The power consumption of the AHP with the LCPV/T was slightly lower than that of the AHP without the LCPV/T, and the heating capacity increased more when the outlet temperature of the LCPV/T was higher.
Figure 17 shows the comparison between the net power consumption of the LCPV/T-AHP system and the net power consumption of the AHP only system in heating season. In this study, the power consumption of the pump and fan was neglected, and the power consumption of the AHP was analyzed. It can be seen that because of the lower ambient temperature in January and December, the AHP was needed to operate longer to keep indoor temperature stable that the AHP power consumption was reached 720 kWh. With the increase of ambient temperature, the heat load gradually decreases, therefore, the operation time of the AHP and power consumption gradually reduced. The power generation of the LCPV/T compensated for part of power consumption, so the power consumption of the whole system was smaller than that of the AHP only. In March, the power generation of the LCPV/T can meet most of power consumption. Even in October, the system can generate excess power. However, it is worth mentioning that due to the change of radiation and sunlight time, the condition in winter was not conducive to the operation of the LCPV/T which was compared with that in spring or autumn. Therefore, the influence of the LCPV/T on the system in winter was smaller than that in spring, which was contrary to the variation trend of power consumption. The power generation trend of the LCPV/T cannot fully match the power consumption trend of the AHP in heating season.
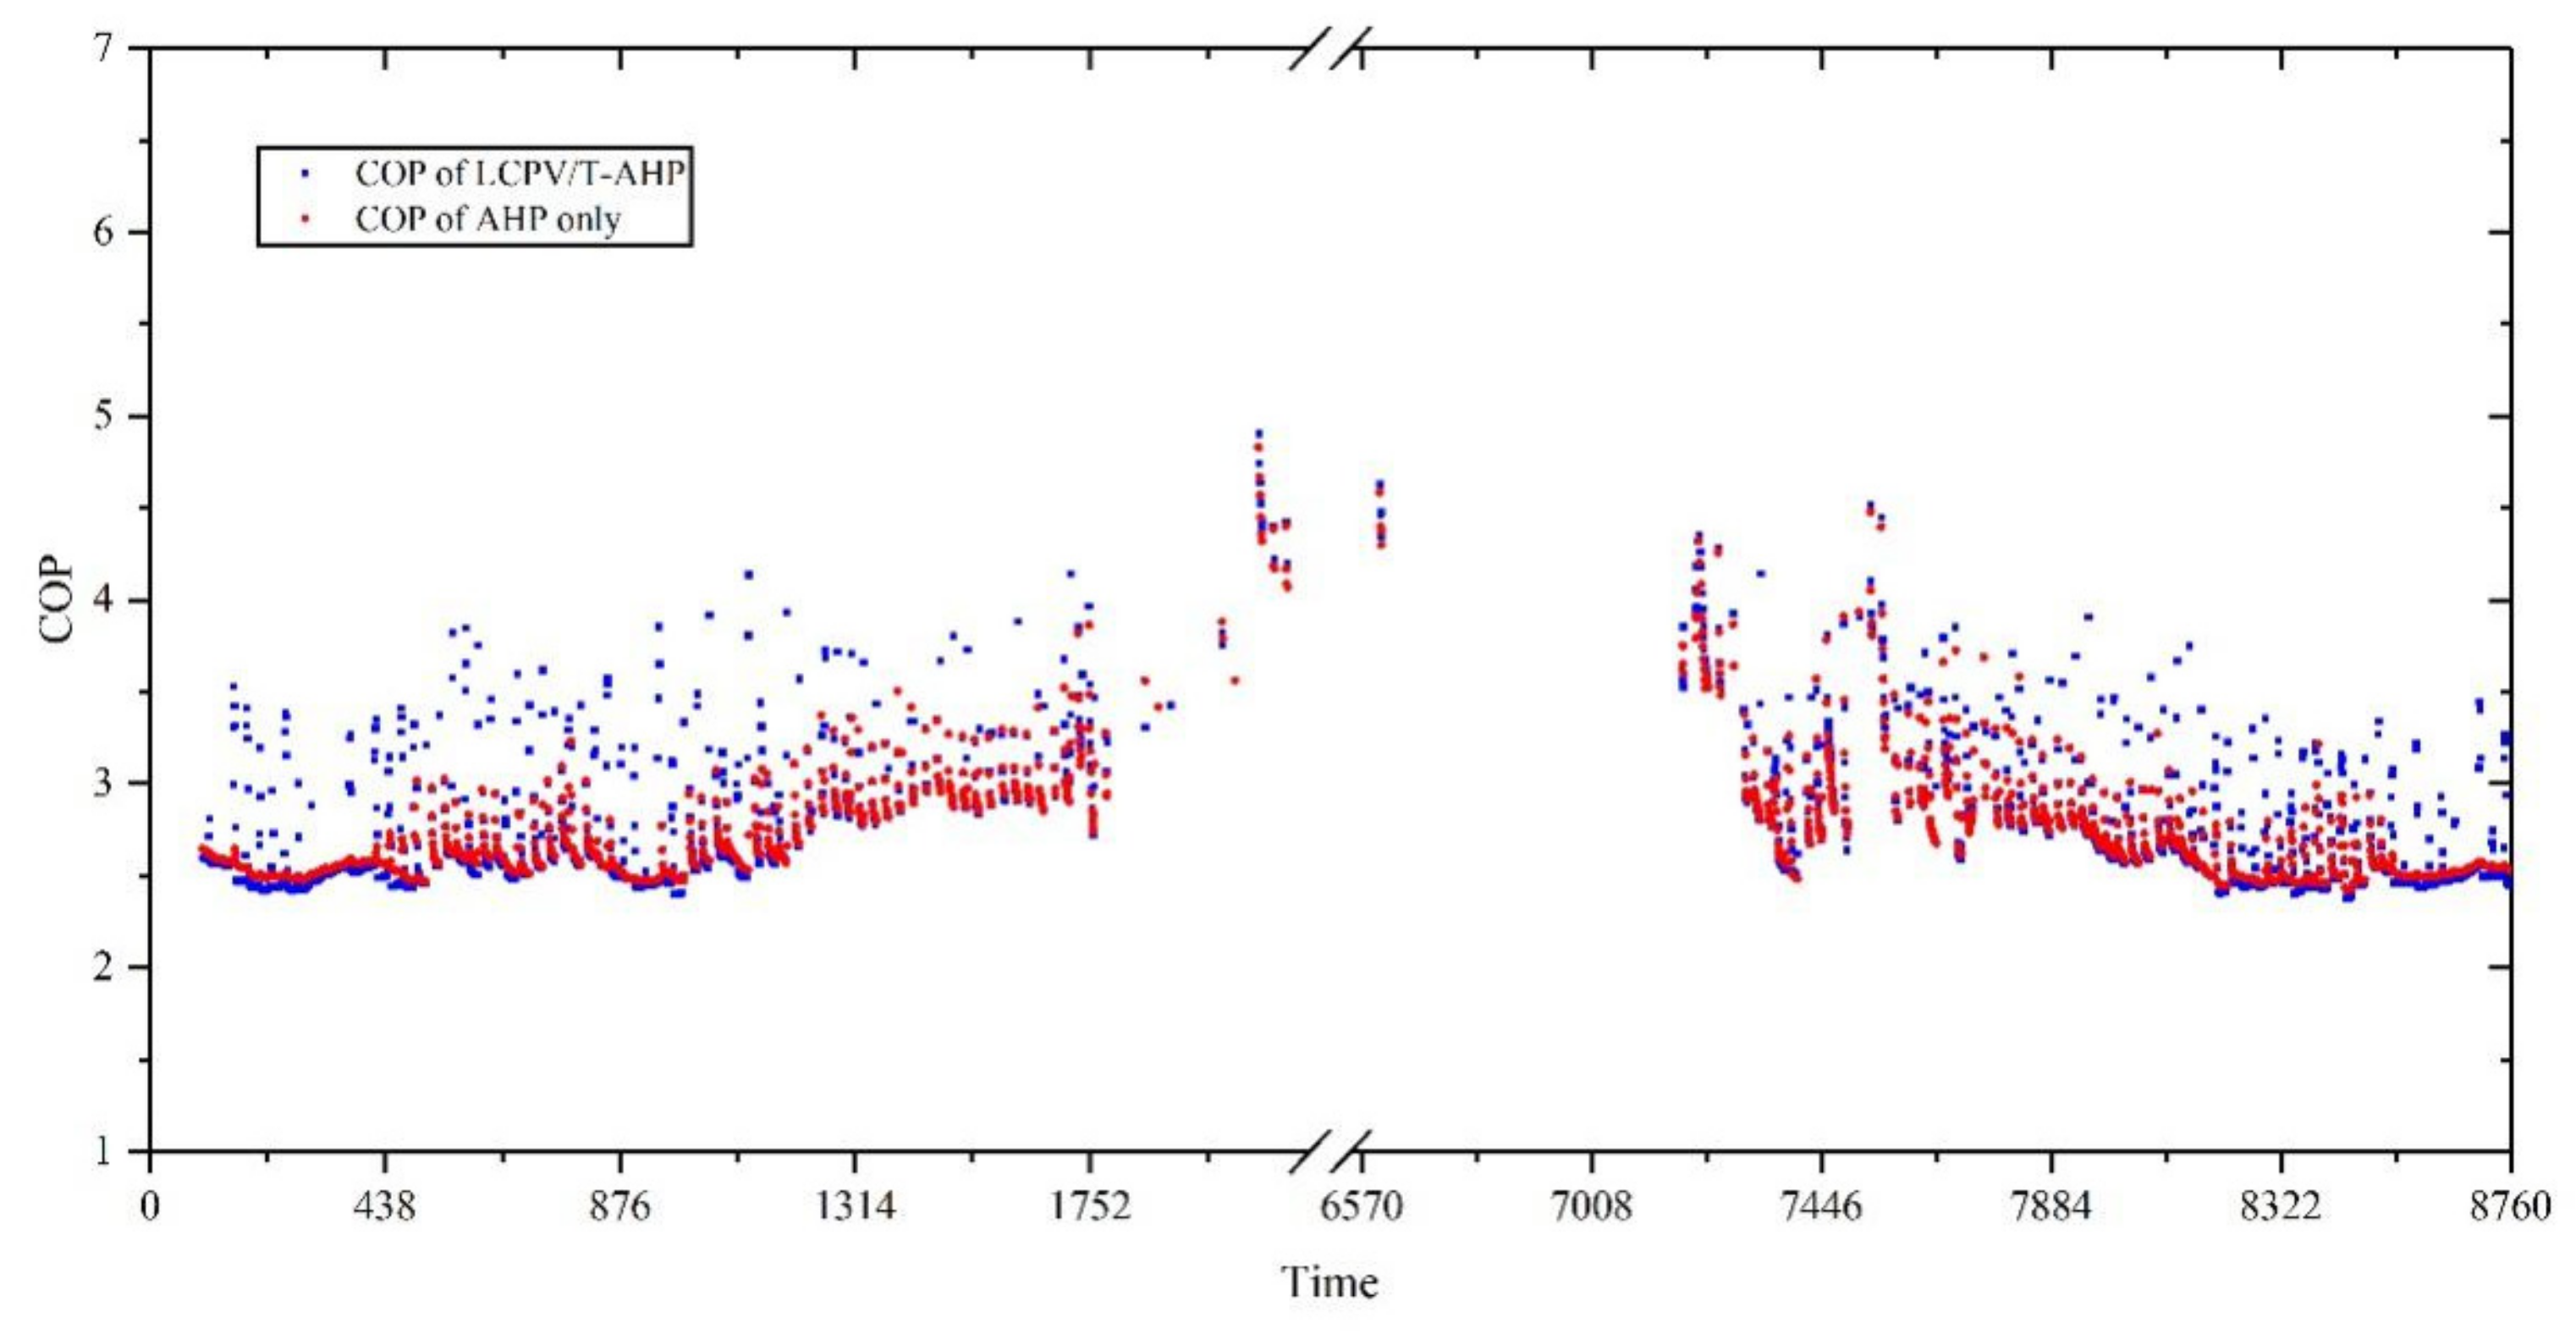
Figure 18 shows the COP comparison between the LCPV/T-AHP system and the AHP only system in heating season. It can be seen from the figure that the COP of the AHP only system changed relatively small and maintained within 2.5–3. In the LCPV/T-AHP system, air was heated by LCPV/T, therefore, the COP of the AHP in the LCPV/T-AHP system had higher COP with a maximum value of 4 compared to the AHP only system. In summary, the coupling of the LCPV/T and the AHP can effectively improve the performance of the AHP. 
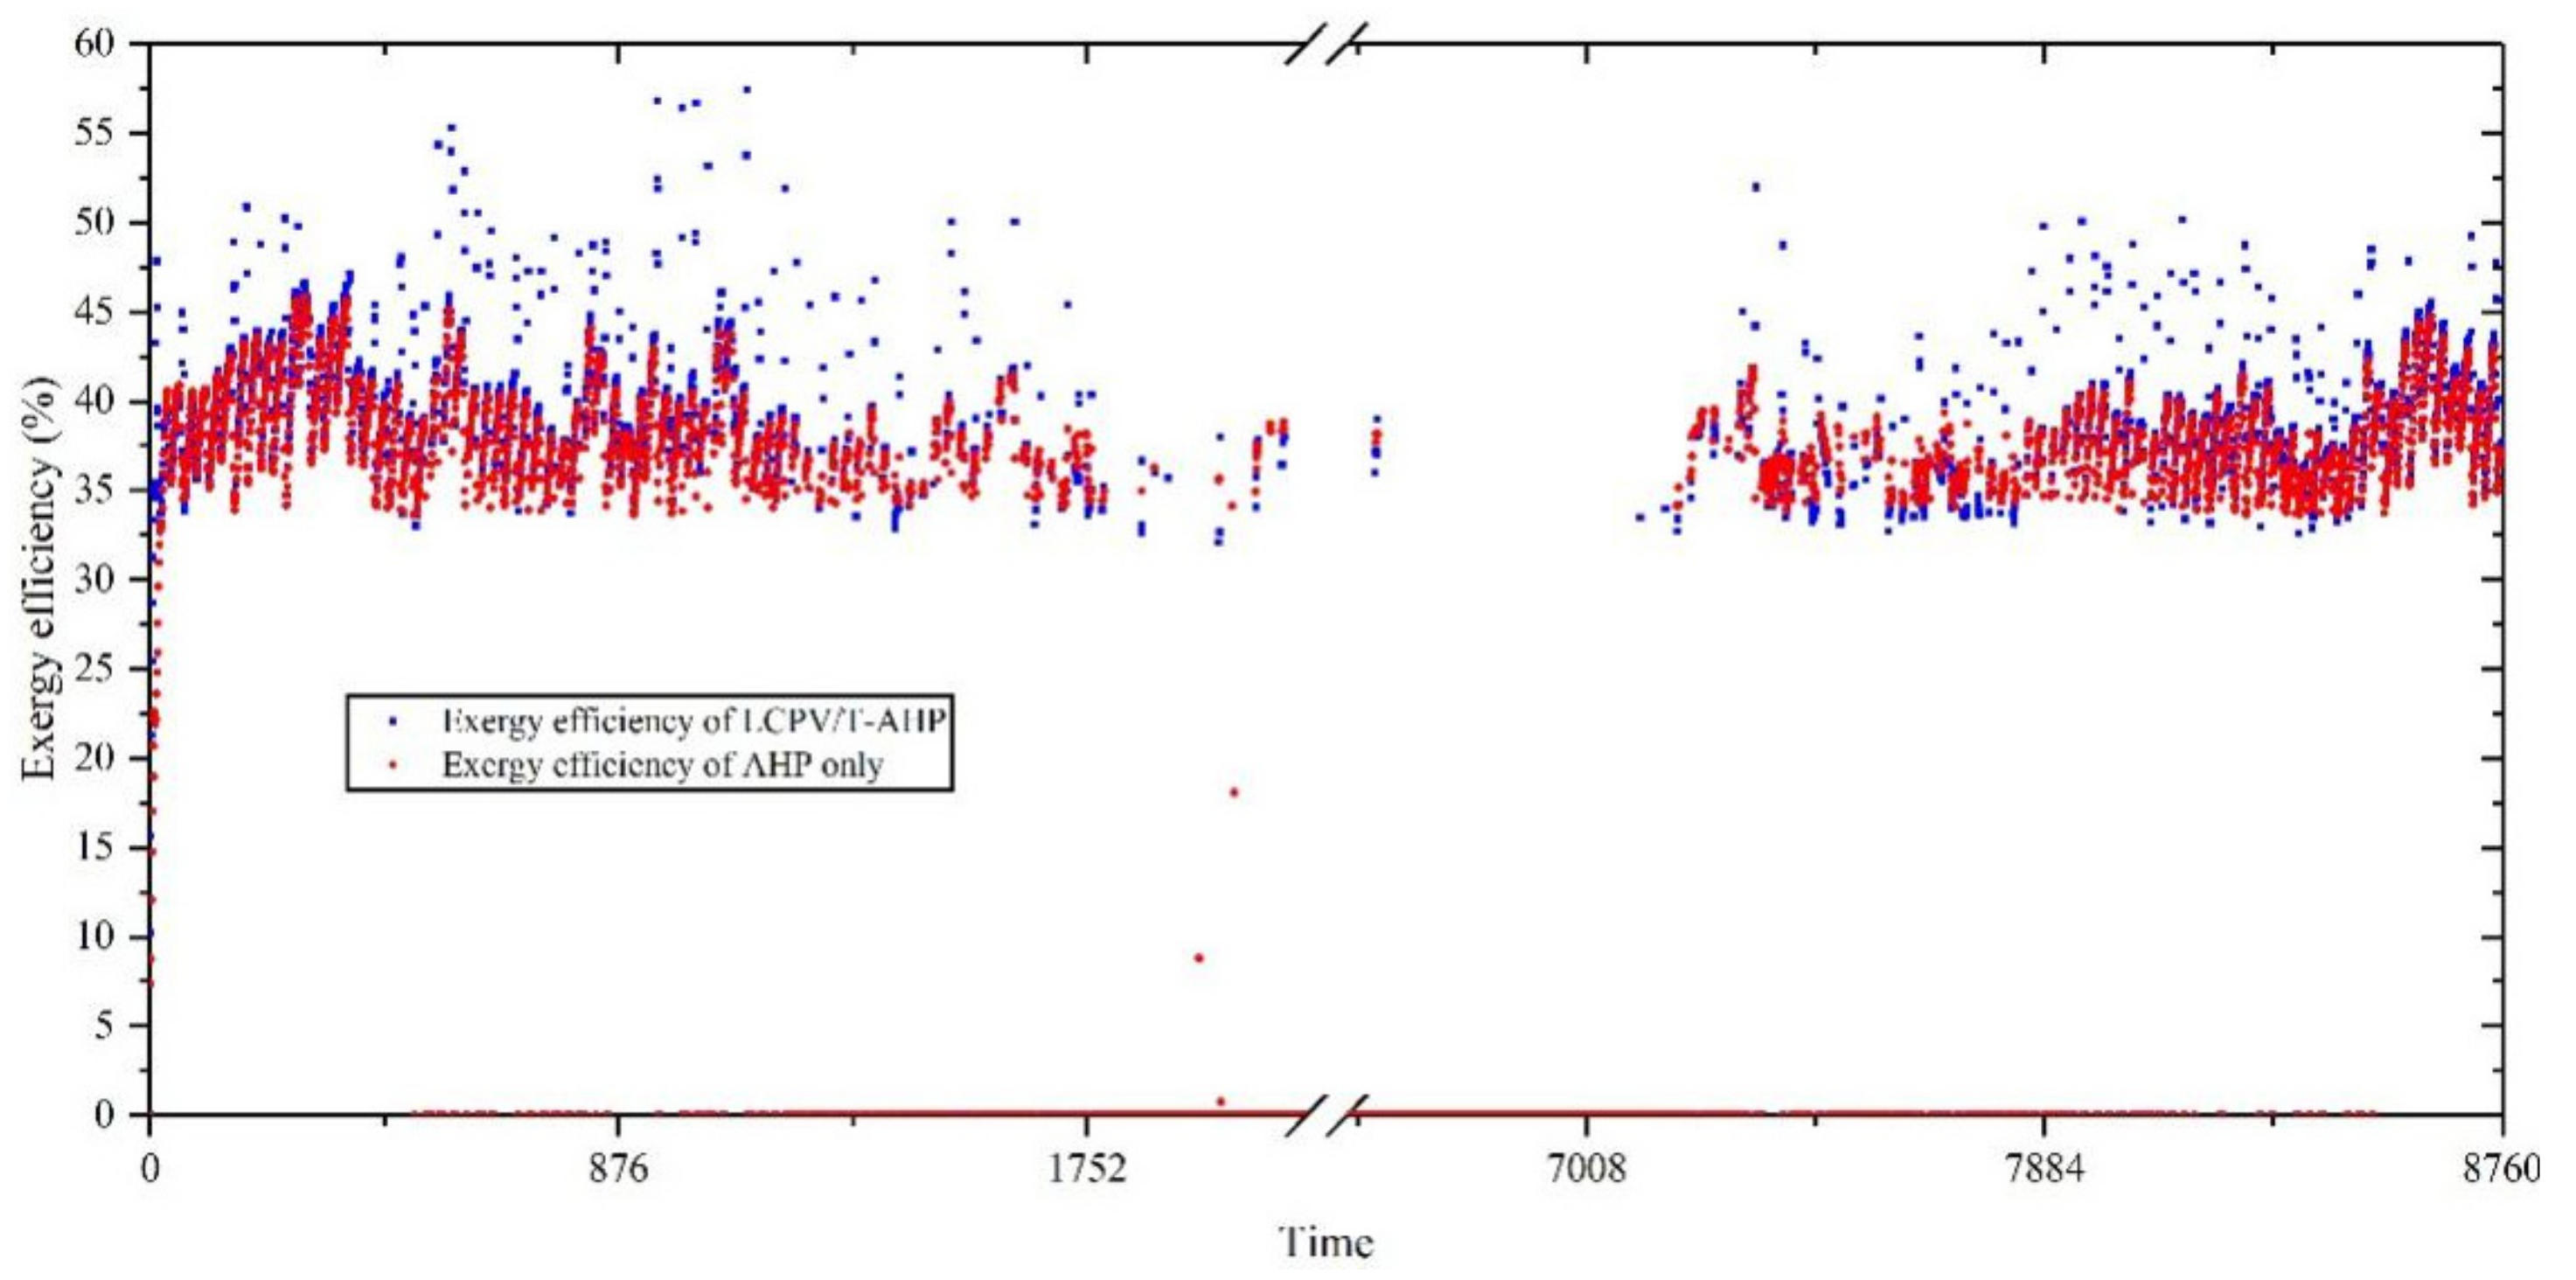
Figure 19 shows the AHP exergy efficiency comparison between the LCPV/T-AHP system and the AHP only system in the annual heating season. The variation trend of the COP of the two systems was similar. The exergy efficiency of the AHP only system showed a relatively stable variation trend in the annual heating season, and the exergy efficiency was maintained in the range of 35–45%. For the LCPV/T-AHP system, air heated by the LCPV/T was not only conducive to the promotion of heat pump COP, but also the increase of the inlet and outlet temperature of the heat pump side was conducive to improving the efficiency of the AHP. With the effect of LCPV/T, the maximum exergy efficiency of the AHP was raised to 55%.
Since the parameters of the experimental room remained unchanged, the rated parameter of the AHP remained the same. Thus, the main parameter that impacted the performance of the system was the area of the PV cell and the air flow rate of the LCPV/T. By changing the key parameter, the influence of different parameters on the system performance was studied. First, the influence of changing air flow rate on the system performance was studied. The flow rates were set at 500 kg/h, 1000 kg/h, 1500 kg/h and 2000 kg/h respectively. 
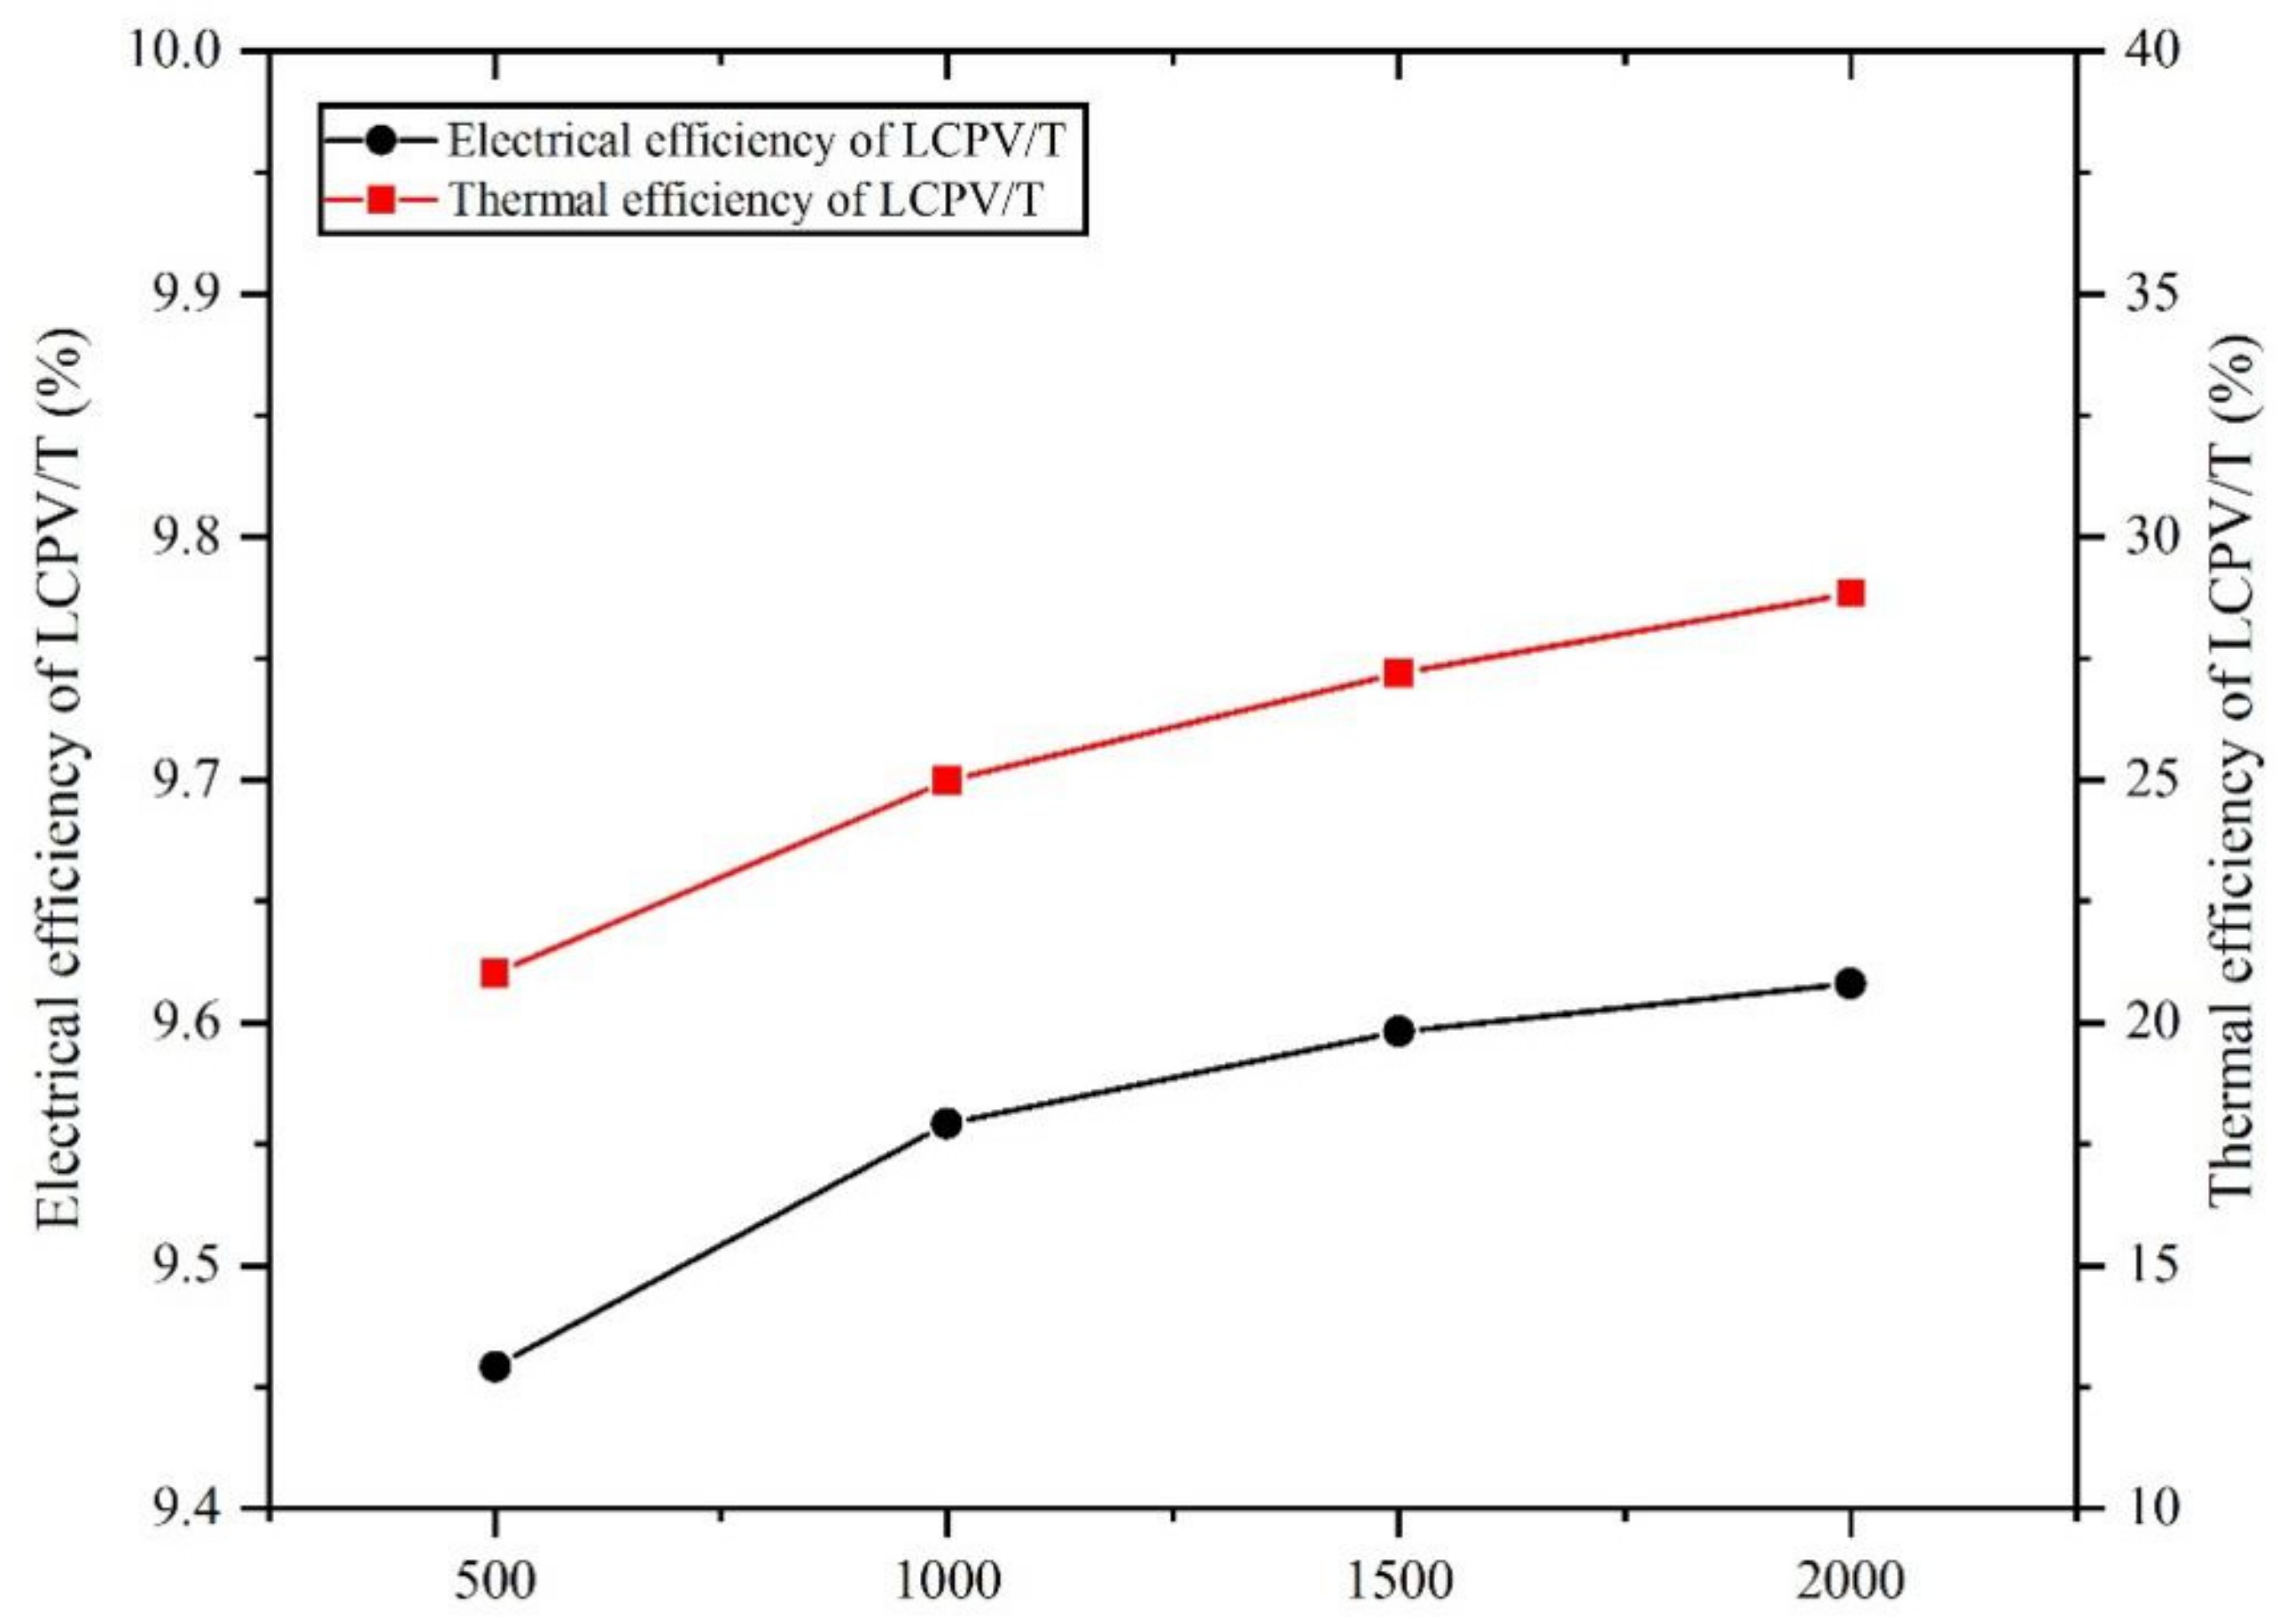
Figure 20 shows the variation of the electrical efficiency and thermal efficiency of the LCPV/T at different air flow rates. It can be concluded that with the increase of flow rate, the thermal efficiency and electrical efficiency of the LCPV/T raised. The important factor was that the increase of air flow rate augmented the heat transfer capability of working medium. For the LCPV/T, the good cooling effect effectively reduced the temperature rise of the PV cell, thereby improving the efficiency of the PV cell. The increase of flow rate was also in favor of absorbing more heat, so the thermal efficiency also improved. When the air flow rate was increased from 500 kg/h to 2000 kg/h, the electrical efficiency increased from 9.45% to 9.57%, and the thermal efficiency was increased from 21% to 29%. From the variation of curve slope, when the air flow rate was increased from 500 kg/h to 1000 kg/h, the improvement effect of electrical efficiency and thermal efficiency of the LCPV/T was more obvious than that at higher flow rate. Figure 21 revealed the variation of electrical exergy efficiency and thermal exergy efficiency of the LCPV/T under variable air flow rate. For the thermal exergy efficiency, it can be seen from the Equation (14) that the thermal exergy efficiency was mainly related to Q t h and t P V T , o u t . Since the radiation received by the LCPV/T determined the heat absorption of the LCPV/T only changed within limited range. Thus, the main factor affecting the thermal exergy efficiency of the LCPV/T was the air outlet temperature t P V T , o u t of the LCPV/T, with the increase of air flow rate, the decrease of t P V T , o u t led to the reduction of thermal efficiency.
Figure 22 shows the COP and exergy efficiency of the AHP under different air flow rate. The result showed that with the increase of air flow rate, the COP of the AHP gradually decreases from 2.82 of 500 kg/h to 2.73 of 2000 kg/h which was related to the decrease of inlet air temperature of the AHP. The exergy efficiency of the AHP decreases from 39.7% to 38.8% that was also related to the reduction of inlet air temperature of the AHP.
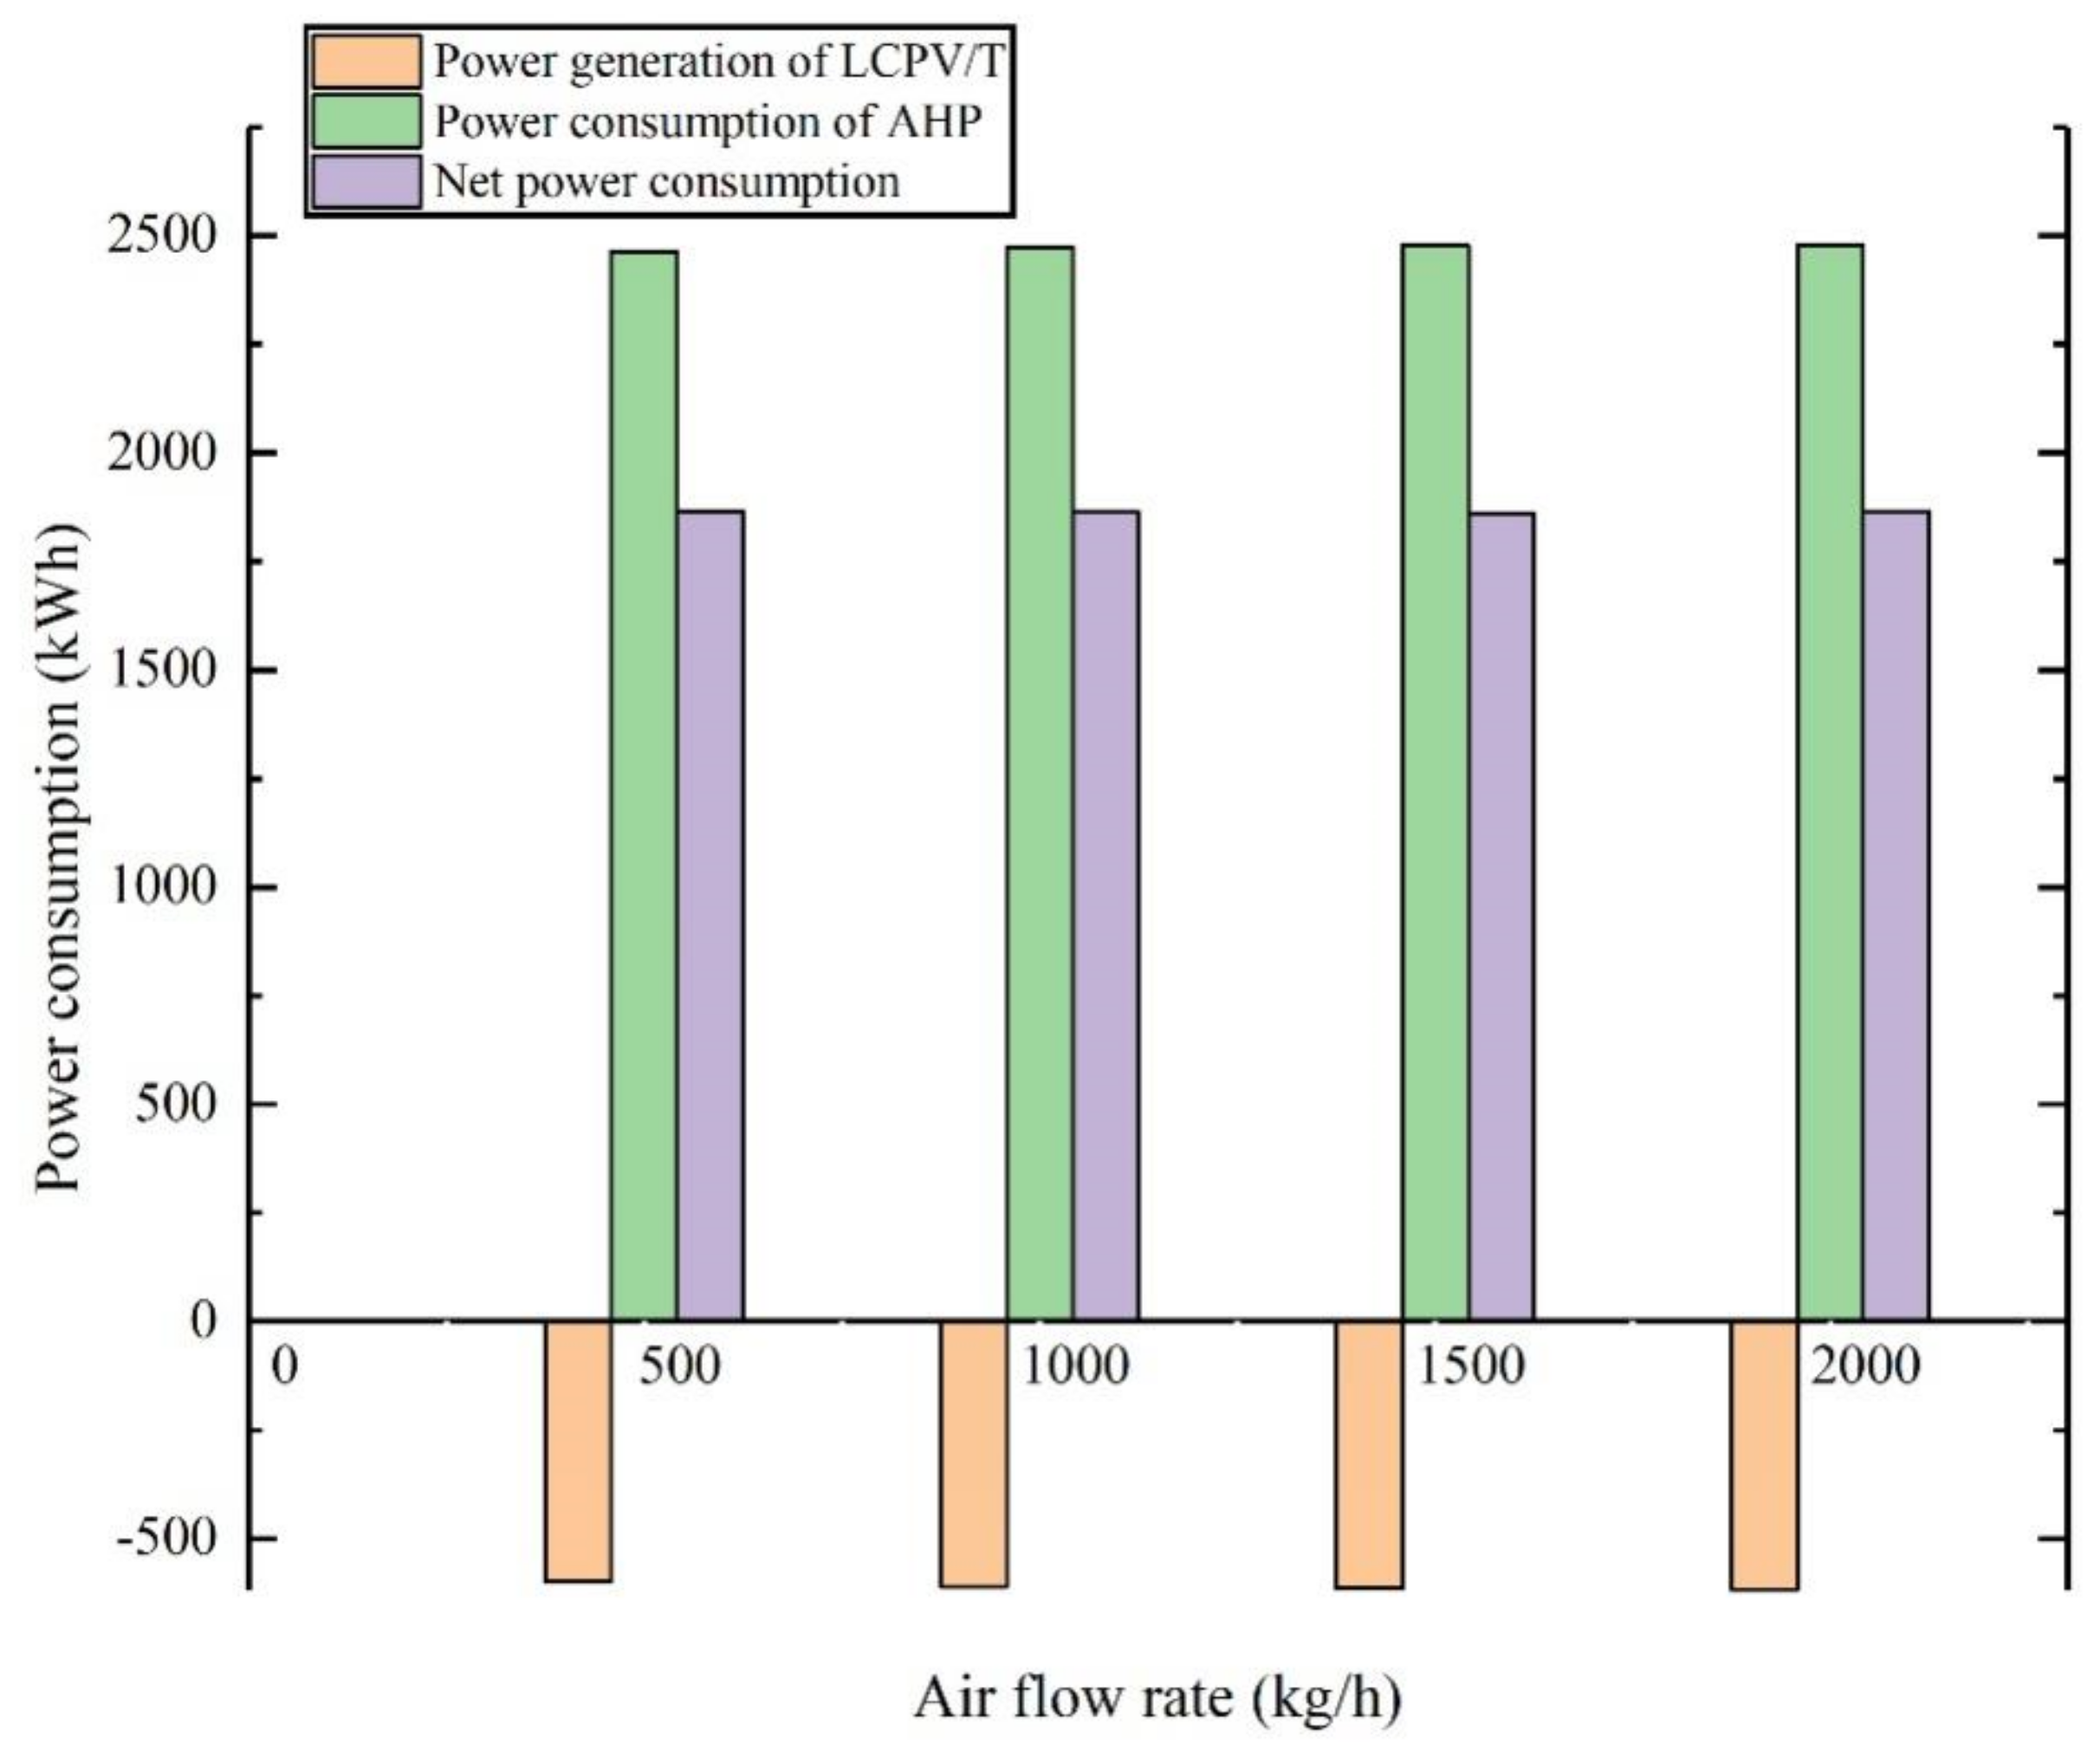
Figure 23 shows the power consumption of the AHP and the power production of LCPV/T in the system under different air flow rates. It was revealed that the increase of the flow rate caused the raise of power production of LCPV/T because of the efficient cooling of PV cell. On the other hand, the increased power consumption of the AHP was attributed to the decrease of the COP caused by the decrease of inlet air temperature of the AHP. In summary, the increase of the flow rate had little impact on the power consumption.
The above contents focused on the research of system performance under variable flow rate. The two main factors that influenced the system operation were flow rate and PV cell area. Next, the impact of the variable PV cell area on the system performance was evaluated.
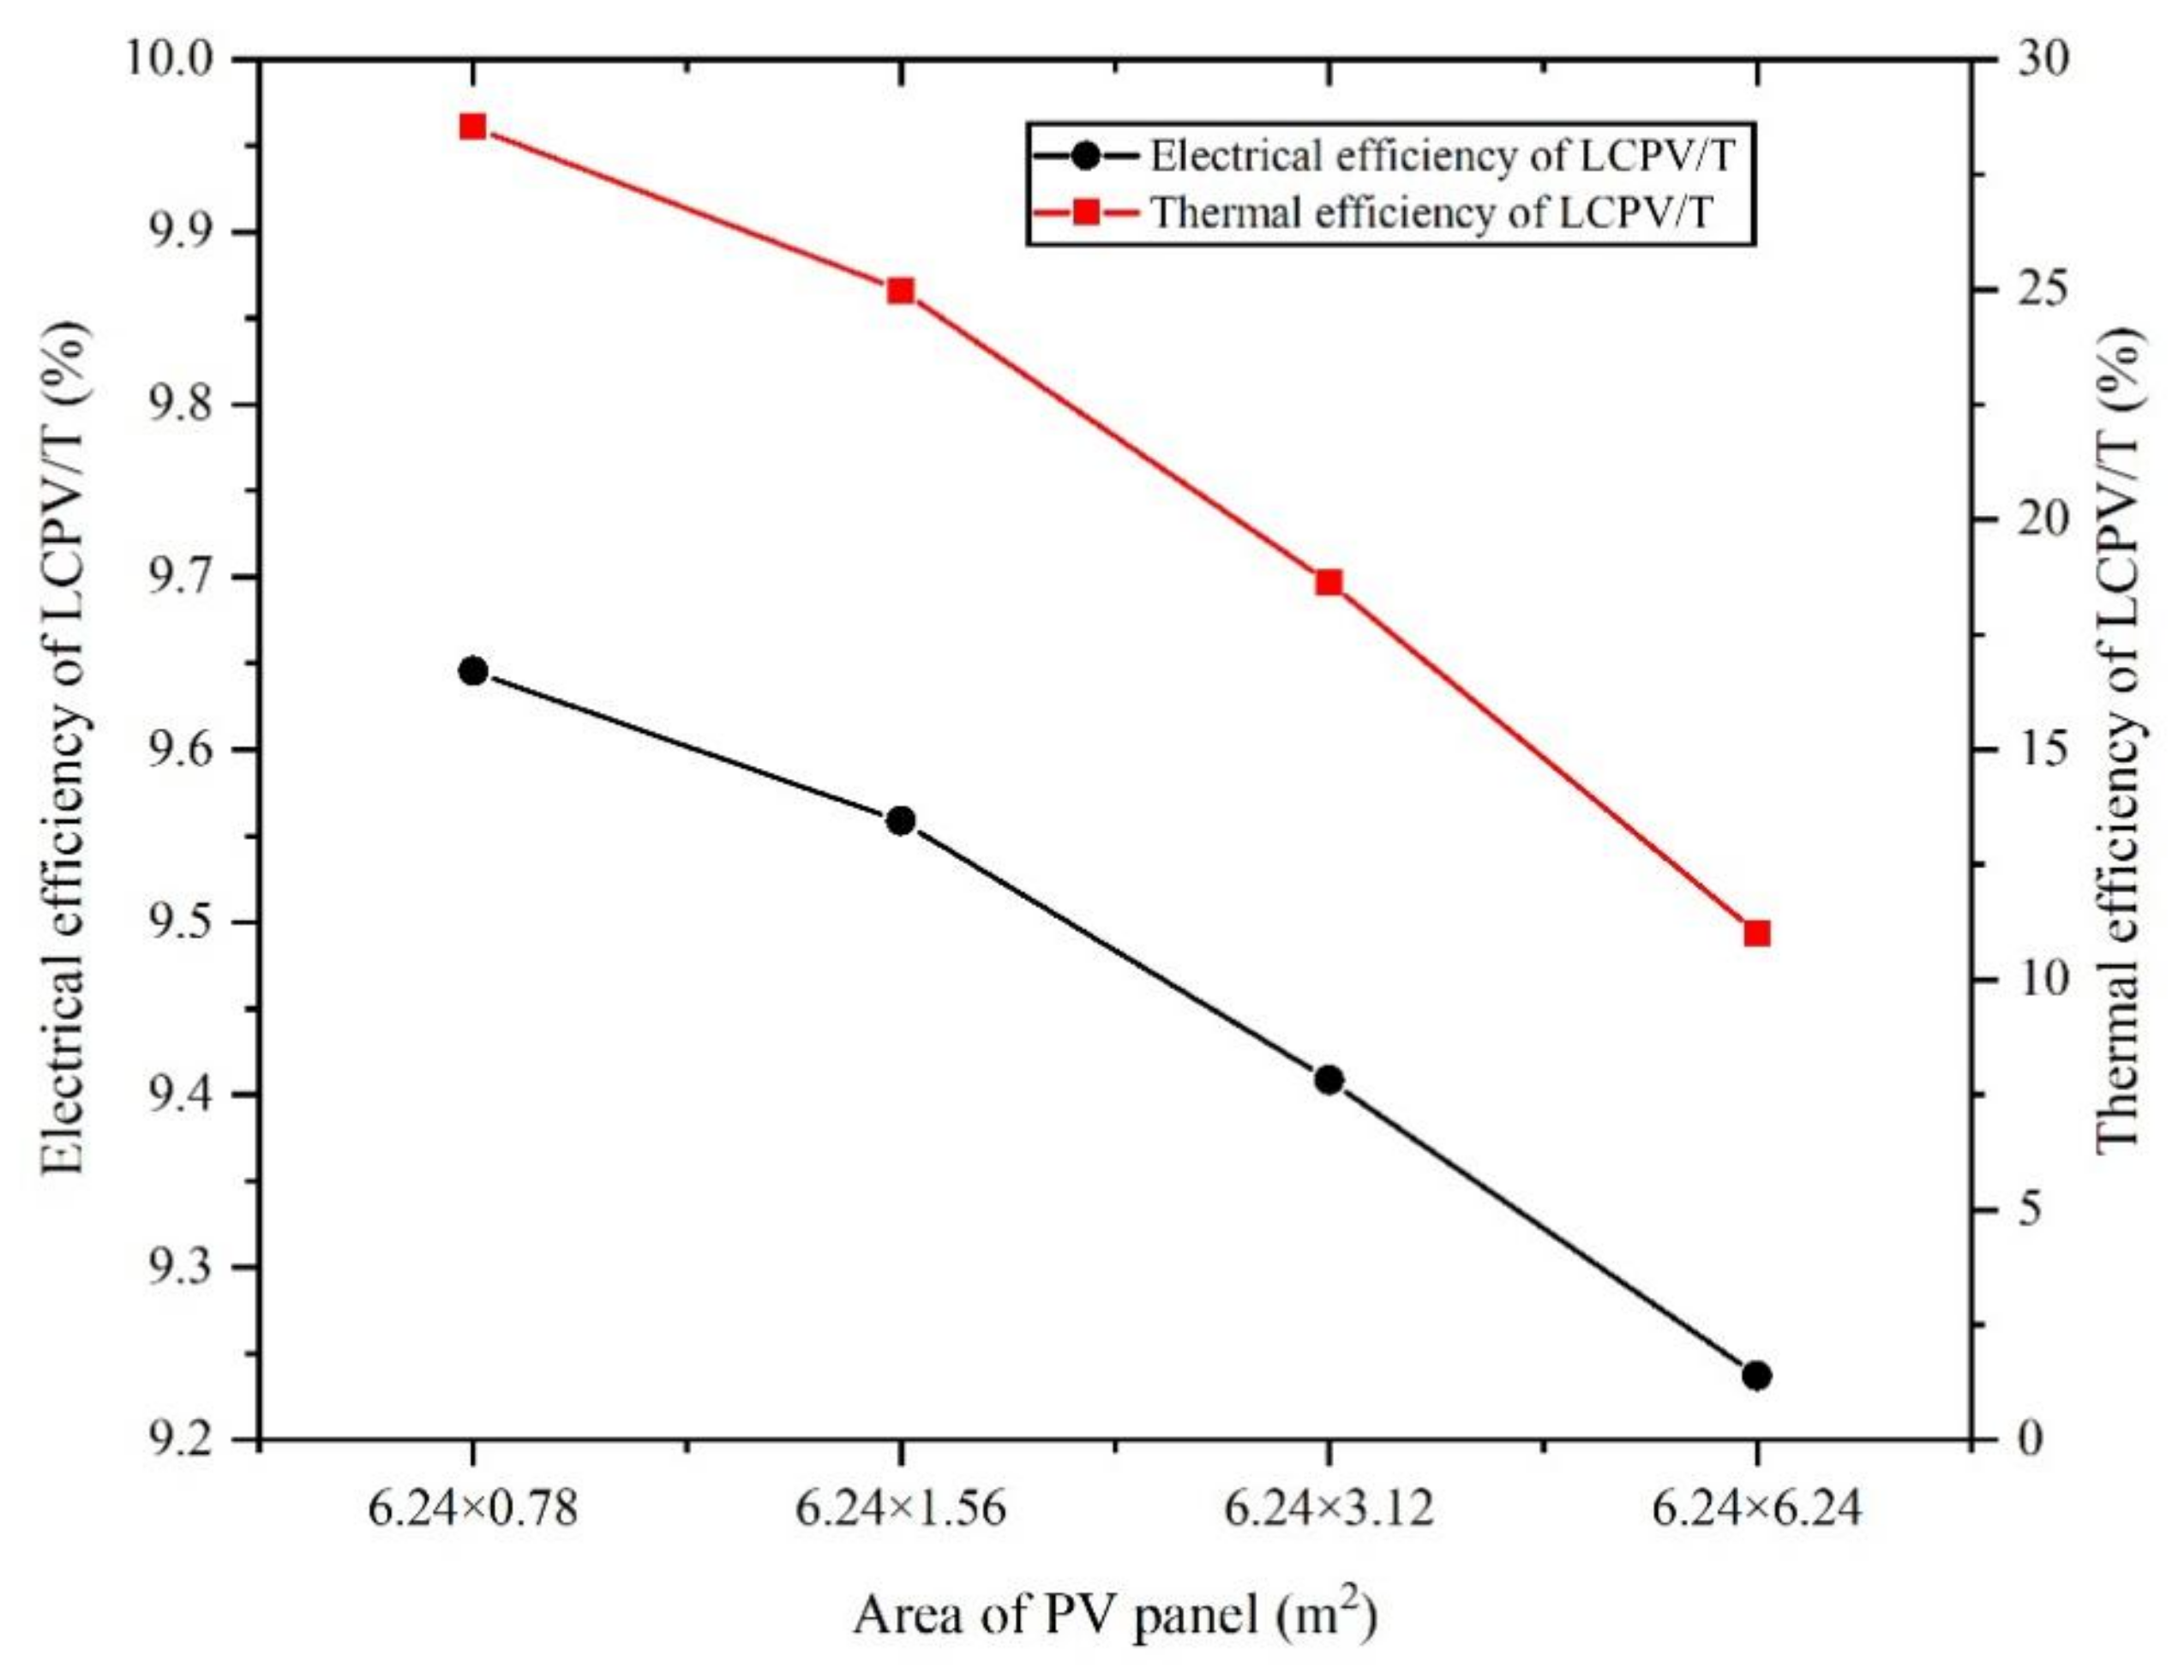
Figure 24 shows the variation of the electoral efficiency and thermal efficiency of the LCPV/T in different PV cell area. It should be mentioned that the change of the area of the PV cell was realized by changing the way of connection between each PV cell. The air flow rate was kept constant at 1000 kg/h, and the result showed that with the increase of PV cell area, due to the limited cooling effect of air, the surface temperature of the PV cell increased, resulting in the reduction of electrical efficiency which was reduced from 9.50% to 9.22%. Moreover, although the increase of the radiation receiving area of the PV cell enhanced heat production, the restriction of air flow rate could not take away all the heat production, and the thermal efficiency decreased apparently from 28% to 11%. 
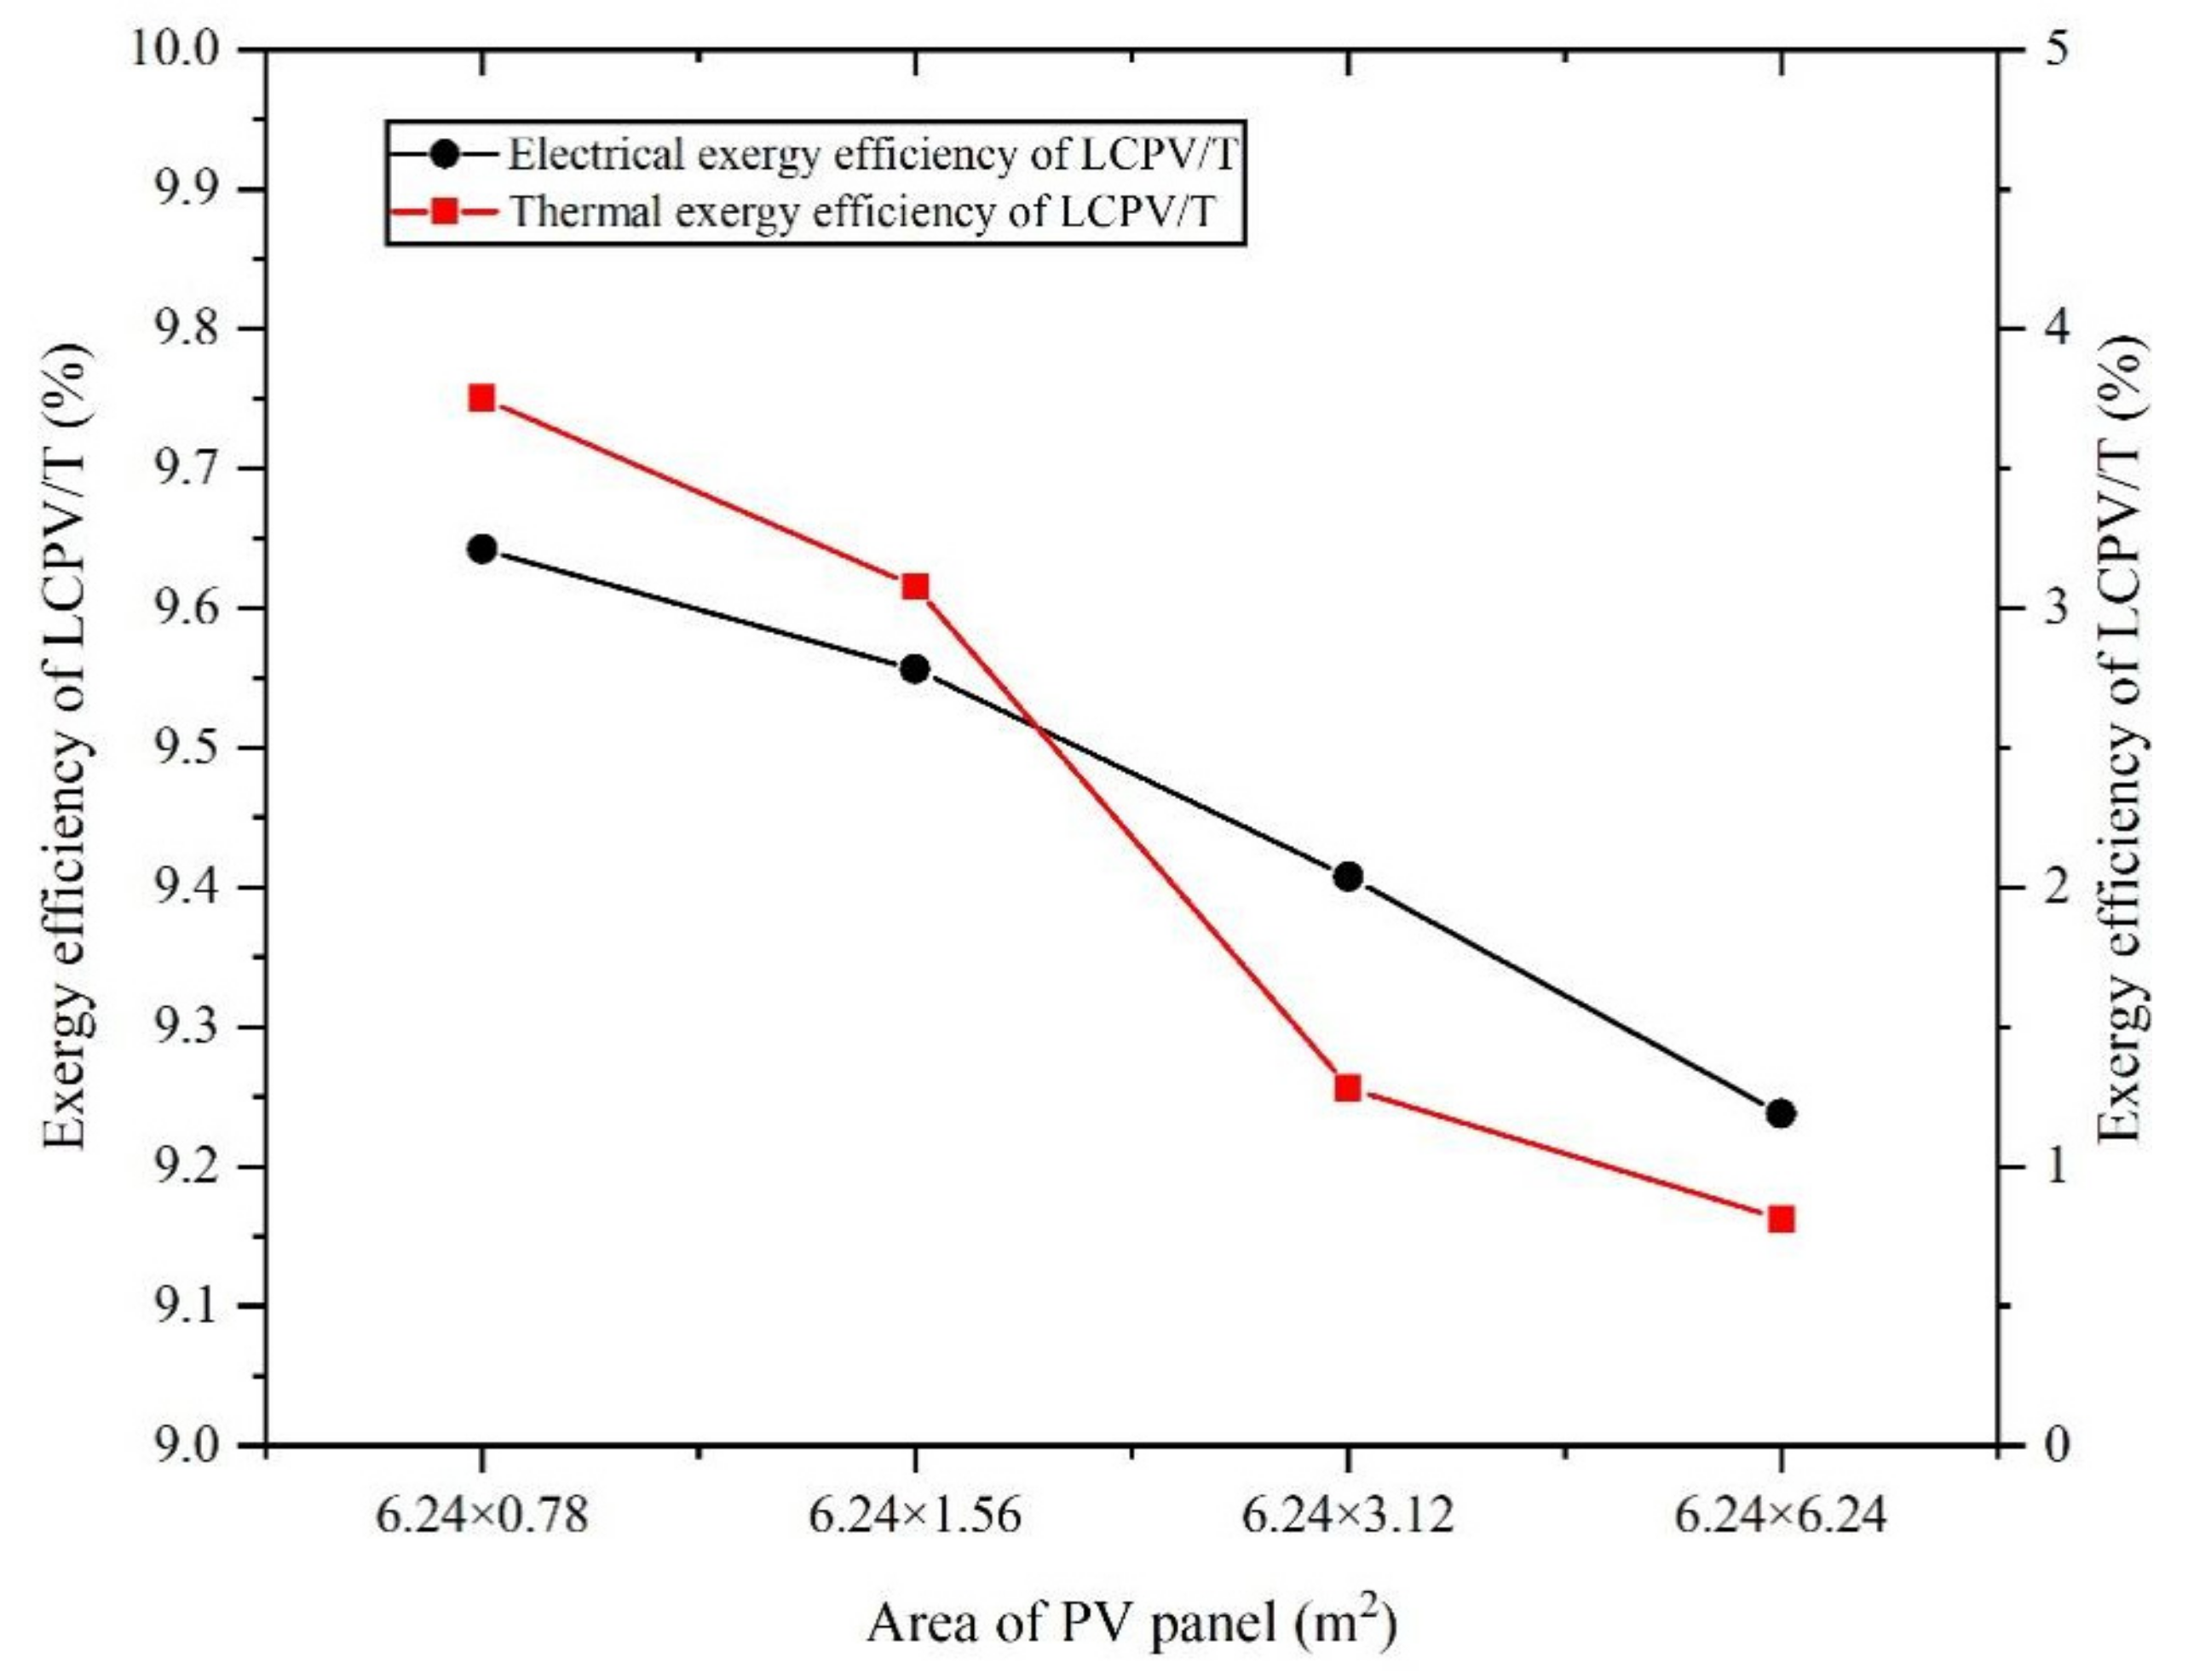
Figure 25 shows the variation of electrical exergy efficiency and thermal exergy efficiency of the LCPV/T under different PV cell areas. As mentioned above, the electrical efficiency was the same as the electrical exergy efficiency. With the increase of area, the electrical efficiency decreased while the electrical exergy efficiency also decreased. The reduction of thermal exergy efficiency was caused by the limited cooling capacity of air and the increased trend of heat absorption of air was slower than the increase trend of received solar exergy. Therefore, the thermal exergy efficiency decreased with the increase of the PV cell area from 4% to 1%. Figure 26 showed the variation of the COP and exergy efficiency of the AHP under different PV cell area. The increase of air temperature caused by the increase of the PV cell area was beneficial to the operation of the AHP while the COP and exergy efficiency of the AHP were improved to a certain extent. With the increase of the PV cell area, the COP increased from 2.76 to 2.79, and exergy efficiency increased from 38.6% to 39.9%.
Figure 27 shows the power generation of LCPV/T and consumption of the system under different PV cell area. First, the power consumption of the AHP did not change significantly with the increase of PV cell area, which corroborated the view that increasing the inlet air temperature of the AHP did not have an obvious effect on changing the power consumption of the AHP, which was only related to the indoor temperature of the experimental room, With the increase of the area of the PV cell, the power generation varied clearly, so it directly affected the overall power consumption of the system.
In the above research, the influence of changing air flow rate and PV cell area on the system was studied. The essence of changing two factors was to change the outlet temperature and the power generation of the LCPV/T. The cooling effect for a PV cell can be improved by raising the air flow rate which was more conducive to the operation of LCPV/T, instead, low air temperature had an adverse impact on the performance of the AHP. On the contrary, for the LCPV/T, although the PV cell area under limited air flow rate was not conducive to the operation of the PV cell, the improvement of air temperature helped to improve the efficiency of the AHP operation. In summary, whether changing air flow rate or PV cell area, improving the performance of one component always had a negative impact on another component.

5. Conclusions

In this paper, a LCPV/T-AHP cogeneration system was proposed. The LCPV/T was used to generate electrical power and thermal energy while the AHP was used for space heating of experimental room, by introducing heated air to improve the performance of the AHP in winter. The system took the environmental parameters of Beijing as the simulation data and used TRNSYS as the platform to build the system. The whole system operated in heating season (from 1 January to 31 March and 1 October to 31 December) for space heating. First, the energetic and exergetic performance of components in the LCPV/T-AHP system were analyzed in the coolest day. After that, the LCPV/T-AHP system was compared with the AHP only system to verify the feasibility of the LCPV/T-AHP system. Finally, by changing the key parameters in the system, the influence on the system performance was studied. The conclusions are as follows:
  • The coldest day in the heating season was chosen for investigating the performance of the system, the LCPV/T increased the air temperature from −3 °C to 5 °C, the maximum electrical power was 500 W with the electrical efficiency of 10%, and the thermal efficiency reached 32%. The electrical exergy efficiency of the LCPV/T was equal to electrical efficiency of the LCPV/T, while the thermal exergy efficiency was only 3%, which was related to the fact that the LCPV/T only produced low-grade heat energy. The outlet temperature of load side of the AHP reached 45 °C, with the temperature rise of 5 °C, the COP was 3.4 and the exergy efficiency reached 48%.
  • During the heating season, the space heating effect of the LCPV/T-AHP system can meet the demand of space heating and LCPV/T can compensate part of the AHP power consumption. Moreover, the LCPV/T had a positive impact on the AHP from the perspective of the first law and the second law of thermodynamics that the COP and exergy efficiency of the AHP were improved, but due to the control strategy, the LCPV/T did not have much impact on the power consumption of the AHP.
  • Increasing the flow rate of air was beneficial to cooling the PV cell and improving the efficiency of the LCPV/T. However, the reduction of air temperature had a negative effect on the AHP. With the certain flow rate of air, increasing the PV area increased the air temperature and PV cell temperature, which was not conducive to the operation of LCPV/T. Therefore, the efficiency of the LCPV/T was reduced, but the improvement of air temperature helped improve the efficiency of the AHP.
In this paper, a coupling system of a LCPV/T-AHP system based on conventional AHP technology is proposed. The comprehensive utilization efficiency of solar energy is enhanced by using the LCPV/T when compared with a solar collector. Furthermore, the LCPV/T is used to heat the air to improve the performance of the AHP. However, there are still many limitations in this research. For example, due to the components in the TRNSYS component library is used in the system and the fact that the mathematical models of the component cannot be viewed, there is a certain degree of error in the performance data. Besides, the system cannot guarantee the efficient operation of the AHP at night, and there is a lack of research on the heat storage. Therefore, in order to conduct deeper research on the system, in the following research work the component modeling of each part will be established first with the modification of experimental data, then the components in the component library replaced for analysis. In addition, considering the heat storage at night, the heat storage water tank should be added on the load side of the AHP to ensure that the AHP operates under the most favorable condition for the whole day.

Author Contributions

Conceptualization, K.X. Methodology, D.A.; Project administration, H.Z.; Supervision, K.X.; Validation, D.A.; Visualization, T.C. and G.W.; Writing—original draft, D.A.; Writing—review and editing, T.C. and G.W. All authors have read and agreed to the published version of the manuscript.

Funding

This research was funded by the science and technology project “Research on Key Technologies of Distributed Solar Cogeneration Integrated Energy System” of State Grid Tianjin Electric Power Company, KJ21-1-19.

Institutional Review Board Statement

Not applicable.

Informed Consent Statement

Not applicable.

Data Availability Statement

The data used to support the findings of this study are available from the corresponding author upon request.

Conflicts of Interest

The authors declare that they have no known competing financial interests or personal relationships that could have appeared to influence the work reported in this paper.

Abbreviations

AHPAir-source heat pump
COPCoefficient of Performance
CPCCompound parabolic concentrator
HVACHeating, Ventilation and Air Conditioning
LCPV/TLow concentration photovoltaic/thermal
PVPhotovoltaic
PV/TPhotovoltaic/thermal
TMYTypical Meteorological Year
TRNSYSTransient System Simulation Program

Symbols

A Area (m2)
C Concentration ratio
C p Specific heat capacity (J/(kg × K))
E ˙ n Energy rate (W)
E ˙ x Exergy rate (W)
G radiation intensity (W/m2)
I Current (A)
m ˙ Mass flow rate (kg/s)
P ˙ Electric power (W)
Q ˙ Thermal power (W)
R g Ideal gas constant (J/(kg×K))
Δ S ˙ Entropy change (W/K)
t Temperature (°C)
T Temperature (K)
U Voltage (V)
W ˙ Electric power consumption (W)
W Work (J)

Greek Letters

ψ Maximum conversion efficiency
η Efficiency (%)

Subscripts

a Air
b l Blower
c Controller
c o m Compressor
e Electric
e n Energy
e x Exergy
H P Heat pump
i n Inlet
m Maximum
o u t Outlet
t h Thermal
w Water
0 Dead state

References

  1. BP Statistical Review of World Energy globally consistent data on world energy markets and authoritative publications in the field of energy. BP Energy Outlook 2021, 70, 8–20.
  2. IRENA. Renewable Capacity Statistics 2020; International Renewable Energy Agency: Masdar, United Arab Emirates, 2020; ISBN 978-92-9260-239-0. [Google Scholar]
  3. Verma, V.; Murugesan, K. Optimization of solar assisted ground source heat pump system for space heating application by Taguchi method and utility concept. Energy Build. 2014, 82, 296–309. [Google Scholar] [CrossRef]
  4. Li, Z.; Chen, E.; Jing, Y.; Lv, S. Thermodynamic relationship of subcooling power and increase of cooling output in vapour compression chiller. Energy Convers. Manag. 2017, 149, 254–262. [Google Scholar] [CrossRef]
  5. Frattolillo, A.; Canale, L.; Ficco, G.; Mastino, C.C.; Dell’Isola, M. Potential for building Façade-integrated solar thermal collectors in a highly urbanized context. Energies 2020, 13, 5801. [Google Scholar] [CrossRef]
  6. Kern, E.C.; Russell, M.C. Hybrid Photovoltaic/Thermal Solar Energy System; Report No. COO-4577-1; Massachusetts Institute of Technology: Lexington, KY, USA, 1978. [Google Scholar] [CrossRef] [Green Version]
  7. Kumar, A.; Baredar, P.; Qureshi, U. Historical and recent development of photovoltaic thermal (PVT) technologies. Renew. Sustain. Energy Rev. 2015, 42, 1428–1436. [Google Scholar] [CrossRef]
  8. Erdil, E.; Ilkan, M.; Egelioglu, F. An experimental study on energy generation with a photovoltaic (PV)-solar thermal hybrid system. Energy 2008, 33, 1241–1245. [Google Scholar] [CrossRef]
  9. Suman, S.; Khan, M.K.; Pathak, M. Performance enhancement of solar collectors—A review. Renew. Sustain. Energy Rev. 2015, 49, 192–210. [Google Scholar] [CrossRef] [Green Version]
  10. Chow, T.T. A review on photovoltaic/thermal hybrid solar technology. Appl. Energy 2010, 87, 365–379. [Google Scholar] [CrossRef]
  11. Tripanagnostopoulos, Y.; Souliotis, M.; Tselepis, S.; Dimitriou, V.; Makris, T. Design and Performance Aspects for Low Concentration Photovoltaics. In Proceedings of the 20th European Photovoltaic Solar Energy Conference, Barcelona, Spain, 6–10 June 2005; p. 2311. [Google Scholar]
  12. Luque, A.L.; Viacheslav, A. Concentrator Photovoltaics; Springer: Berlin/Heidelberg, Germany, 2007. [Google Scholar]
  13. Mills, D.R.; Morrison, G.L. Compact linear fresnel reflector solar thermal powerplants. Sol. Energy 2000, 68, 263–283. [Google Scholar] [CrossRef]
  14. Proell, M.; Osgyan, P.; Karrer, H.; Brabec, C.J. Experimental efficiency of a low concentrating CPC PVT flat plate collector. Sol. Energy 2017, 147, 463–469. [Google Scholar] [CrossRef]
  15. Kasaeian, A.; Daviran, S.; Azarian, R.D.; Rashidi, A. Performance evaluation and nanofluid using capability study of a solar parabolic trough collector. Energy Convers. Manag. 2015, 89, 368–375. [Google Scholar] [CrossRef]
  16. Wang, K.; He, Y.L.; Xue, X.D.; Du, B.C. Multi-objective optimization of the aiming strategy for the solar power tower with a cavity receiver by using the non-dominated sorting genetic algorithm. Appl. Energy 2017, 205, 399–416. [Google Scholar] [CrossRef]
  17. Hafez, A.Z.; Soliman, A.; El-Metwally, K.A.; Ismail, I.M. Solar parabolic dish Stirling engine system design, simulation, and thermal analysis. Energy Convers. Manag. 2016, 126, 60–75. [Google Scholar] [CrossRef]
  18. Daneshazarian, R.; Cuce, E.; Cuce, P.M.; Sher, F. Concentrating photovoltaic thermal (CPVT) collectors and systems: Theory, performance assessment and applications. Renew. Sustain. Energy Rev. 2018, 81, 473–492. [Google Scholar] [CrossRef]
  19. Zhang, H.; Liang, K.; Chen, H.; Gao, D.; Guo, X. Thermal and electrical performance of low-concentrating PV/T and flat-plate PV/T systems: A comparative study. Energy 2019, 177, 66–76. [Google Scholar] [CrossRef]
  20. Amanlou, Y.; Tavakoli Hashjin, T.; Ghobadian, B.; Najafi, G. Air cooling low concentrated photovoltaic/thermal (LCPV/T) solar collector to approach uniform temperature distribution on the PV plate. Appl. Therm. Eng. 2018, 141, 413–421. [Google Scholar] [CrossRef]
  21. Ibrahim, O.; Fardoun, F.; Younes, R.; Louahlia-Gualous, H. Air source heat pump water heater: Dynamic modeling, optimal energy management and mini-tubes condensers. Energy 2014, 64, 1102–1116. [Google Scholar] [CrossRef]
  22. Saleh, B.; Aly, A.A.; Alsehli, M.; Elfasakhany, A.; Bassuoni, M.M. Performance analysis and working fluid selection for single and two stages vapor compression refrigeration cycles. Processes 2020, 8, 1017. [Google Scholar] [CrossRef]
  23. Cai, J.; Zhang, F.; Ji, J. Comparative analysis of solar-air dual source heat pump system with different heat source configurations. Renew. Energy 2020, 150, 191–203. [Google Scholar] [CrossRef]
  24. Liu, Y.; Ma, J.; Zhou, G.; Zhang, C.; Wan, W. Performance of a solar air composite heat source heat pump system. Renew. Energy 2016, 87, 1053–1058. [Google Scholar] [CrossRef]
  25. Zhang, H.; Chen, H.; Han, Y.; Liu, H.; Li, M. Experimental and simulation studies on a novel compound parabolic concentrator. Renew. Energy 2017, 113, 784–794. [Google Scholar] [CrossRef]
  26. Ministry of Construction of the People’s Republic of China. Design Standard for Energy Efficiency of Residential Buildings in Severe Cold and Cold Zones (JGJ 26-2010); Ministry of Construction: Beijing, China, 2010.
  27. Chargui, R.; Sammouda, H.; Farhat, A. Numerical simulation of a cooling tower coupled with heat pump system associated with single house using TRNSYS. Energy Convers. Manag. 2013, 75, 105–117. [Google Scholar] [CrossRef]
  28. Yang, L.; Heng, Z.; Haiping, C.; Han, Y.; Fei, Y. Simulating and experimental research on a low-concentrating PV/T triple-generation system. Energy Convers. Manag. 2019, 199, 111942. [Google Scholar] [CrossRef]
  29. Heng, Z.; Feipeng, C.; Yang, L.; Haiping, C.; Kai, L.; Boran, Y. The performance analysis of a LCPV/T assisted absorption refrigeration system. Renew. Energy 2019, 143, 1852–1864. [Google Scholar] [CrossRef]
  30. Heng, Z.; Haowen, L.; Haiping, C.; Xinxin, G.; Kai, L.; Pengbo, Y. Research on the Performance of Flat-Box Photovoltaic/Thermal Collector with Cooling Channels. J. Sol. Energy Eng. Trans. ASME 2018, 140, 021002. [Google Scholar] [CrossRef]
  31. Zhang, H.; Chen, H.; Liu, H.; Huang, J.; Guo, X.; Li, M. Design and performance study of a low concentration photovoltaic-thermal module. Int. J. Energy Res. 2018, 42, 2199–2212. [Google Scholar] [CrossRef]
  32. Petela, R. Exergy of undiluted thermal radiation. Sol. Energy 2003, 74, 469–488. [Google Scholar] [CrossRef]
  33. Tiwari, A.; Dubey, S.; Sandhu, G.S.; Sodha, M.S.; Anwar, S.I. Exergy analysis of integrated photovoltaic thermal solar water heater under constant flow rate and constant collection temperature modes. Appl. Energy 2009, 86, 2592–2597. [Google Scholar] [CrossRef]
  34. Agrawal, S.; Tiwari, G.N. Overall energy, exergy and carbon credit analysis by different type of hybrid photovoltaic thermal air collectors. Energy Convers. Manag. 2013, 65, 628–636. [Google Scholar] [CrossRef]
  35. Mehrpooya, M.; Ghorbani, B.; Hosseini, S.S. Thermodynamic and economic evaluation of a novel concentrated solar power system integrated with absorption refrigeration and desalination cycles. Energy Convers. Manag. 2018, 175, 337–356. [Google Scholar] [CrossRef]
Figure 1. Schematic cross-sectional view of PV/T.
Energies 15 01238 g001
Figure 2. Geometric schematic of CPC. Reprint with permission [25]. Copyright 2017, Elsevier.
Energies 15 01238 g002
Figure 3. Schematic diagram of the LCPV/T coupled with AHP system.
Energies 15 01238 g003
Figure 4. Inlet and outlet temperature of LCPV/T on 15 January.
Energies 15 01238 g004
Figure 5. Power and thermal performance of LCPV/T on 15 January.
Energies 15 01238 g005
Figure 6. Operation performance of AHP on 15 January.
Energies 15 01238 g006
Figure 7. Exergy performance of LCPV/T on 15 January.
Energies 15 01238 g007
Figure 8. Exergy performance of AHP on 15 January.
Energies 15 01238 g008
Figure 9. Weekly power generation and consumption of the system.
Energies 15 01238 g009
Figure 10. Pressure variation of fan in heating season.
Energies 15 01238 g010
Figure 11. Pressure variation of LCPV/T in heating season.
Energies 15 01238 g011
Figure 12. Entropy change of fan in heating season.
Energies 15 01238 g012
Figure 13. Entropy change of LCPV/T in heating season.
Energies 15 01238 g013
Figure 14. Indoor temperature comparison between experimental room and reference room.
Energies 15 01238 g014
Figure 15. Annual power generation and consumption of the LCPV/T-AHP system.
Energies 15 01238 g015
Figure 16. AHP performance comparison between the LCPV/T-AHP system and AHP only system on 15 January.
Energies 15 01238 g016
Figure 17. Power consumption comparison between the LCPV/T-AHP system and the AHP only system.
Energies 15 01238 g017
Figure 18. COP comparison between the LCPV/T-AHP system and the AHP only system.
Energies 15 01238 g018
Figure 19. AHP exergy efficiency comparison between the LCPV/T-AHP system and the AHP only system.
Energies 15 01238 g019
Figure 20. Electrical efficiency and thermal efficiency of LCPV/T under variable air flow rate.
Energies 15 01238 g020
Figure 21. Electrical exergy efficiency and thermal exergy efficiency of the LCPV/T under variable air flow rate.
Energies 15 01238 g021
Figure 22. COP and exergy efficiency of the LCPV/T under variable air flow rate.
Energies 15 01238 g022
Figure 23. Power consumption of the AHP and the power production of the LCPV/T under variable air flow rate.
Energies 15 01238 g023
Figure 24. Electrical efficiency and thermal efficiency of the LCPV/T under variable PV cell area.
Energies 15 01238 g024
Figure 25. Electrical exergy efficiency and thermal exergy efficiency of the LCPV/T under variable PV cell area.
Energies 15 01238 g025
Figure 26. Variation of COP and exergy efficiency of the AHP under different PV cell area.
Energies 15 01238 g026
Figure 27. Power generation of the LCPV/T and consumption of the AHP under different PV cell area.
Energies 15 01238 g027
Table 1. The parameters of rooms.
ParameterNumericalUnit
Volume of experimental room105.84
Area of experimental room42.3m2
Area of the windows4.5m2
Heat transfer coefficient of windows5.68W/(m2 × K)
Number of people3
Area of capillary network25.2m2
Heat transfer coefficient of wall0.339W/(m2 × K)
Heat transfer coefficient of floor0.313W/(m2 × K)
Heat transfer coefficient of roof0.233W/(m2 × K)
Thickness of wall0.355m
Thickness of floor0.425m
Thickness of roof0.4m
Infiltration rate0.2l/h
Ventilation rate0.6times/h
Table 2. TRNSYS models of system main components.
ComponentTRNSYS ModelsComponent Type
Experimental roomType 56Multi-zone building
Cold water tankType 4Storage tank
Hot water tankType 4Storage tank
LCPV/TType 560PV/T collector
AHPType 668Air-water heat pump
FanType112bFan
PumpType114Pump
Table 3. Dimension parameter of LCPV/T [28].
ParameterNumericalUnit
Length of flow channel6240mm
Width of flow channel1560mm
Height of flow channel5mm
Absorptance of PV cell1
Thickness of PV cell3mm
Thermal conductivity of PV cell148W/(m × K)
Concentration ratio of CPC4
Table 4. Parameter of AHP.
ParameterNumericalUnit
Rated heating capacity4000W
Rated heating power1000W
Rated COP4-
Flow rate of heat source1000kg/h
Fluid category of heat sourceAir-
Flow rate of load side500kg/h
Fluid category of load sideWater-
Publisher’s Note: MDPI stays neutral with regard to jurisdictional claims in published maps and institutional affiliations.

