Article

Heat Pump Installation in Public Buildings: Savings and Environmental Benefits in Underserved Rural Areas

1
Institute of Rural and Agricultural Development, Polish Academy of Sciences, 00-330 Warsaw, Poland
2
Department of Economics and Organisation of Enterprises, Institute of Economics and Finance, Warsaw University of Life Sciences, 02-787 Warsaw, Poland
3
Department of Agricultural and Applied Economics, University of Georgia, Griffin, GA 30223, USA
4
Faculty of Economic Sciences, John Paul II University of Applied Sciences in Biala Podlaska, 21-500 Biala Podlaska, Poland
5
Department of International Economic Relations and Project Management, Lesya Ukrainka Volyn National University, 43025 Lutsk, Ukraine
*
Author to whom correspondence should be addressed.
Energies 2022, 15(21), 7903; https://doi.org/10.3390/en15217903
Submission received: 29 August 2022 / Revised: 20 October 2022 / Accepted: 22 October 2022 / Published: 25 October 2022

Abstract

:
Heat pump technology offers a path towards reducing the use of fossil fuels to heat space, providing energy bill savings and reducing air pollution and GHG emissions. The choice of heating method is based on costs; hence, this study examines the gains from operating heat pump systems in public buildings as well as alternative systems using electricity, LPG, and heating oil. The study focuses on the Ruda-Huta municipality in Poland that, as is common in rural areas, lacks access to a district heating system or piped gas. The empirical analysis includes heat pump installations in eight municipal buildings. The study found that the use of ground source heat pumps proved competitive with existing heating systems in terms of payback time. Calculations for three heating energy source scenarios, i.e., electricity, LPG, and heating oil, used the Simple Pay Back Time (SPBT) and the Levelized Cost of Heat (LCOH) methods and the average prices of the three energy types for the period 2012–2021. The payback period calculations disregarded the EU subsidies for heating systems utilizing renewable energy sources (RES). The payback time for electric, LPG, and heating oil were, respectively, 6.7–7.8 years, 4.1–6.1 years, and 6.7–6.9 years. Much larger spreads favoring heat pumps were calculated using the LCOH, and the costs in the case of electric heating were nearly three times higher and doubled when using heating oil and LPG. The gains from investing in heat pump systems have been offset by the increase in electricity, LPH, and heating oil prices, which have been predicted to continue to increase in the foreseeable future supporting the use of heat pumps in rural areas lacking access to, for example, district heating systems. The switch to heat pumps reduced local air pollution by eliminating the burning of fossil fuels to heat space in public buildings.

1. Introduction

In the European Union (EU), about 50% of the final energy consumed is used for heating or cooling, and that share is forecast to remain unchanged [1,2,3]. Energy obtained from renewable sources offers the most effective way to decarbonize heating and cooling. Between 2004 and 2020, the share of renewable energy sources (RES) used for heating and cooling increased from 11.72% to 23.09% [3]. The agreement at the 21st Paris Climate Convention summit (COP21, December 2015) commits parties “to limit the temperature increase to 1.5 °C above preindustrial levels” [4]. While the Paris provisions allow choosing the path to achieve this goal, the importance of RES is already stated in the document’s introduction. To meet the Paris Agreement goals, the EU adopted the Clean Energy for all Europeans package, also called the “Winter package” [5]. The package is a long-term vision to reach a prosperous, modern, competitive, and climate-neutral economy in 2050 [6] by setting seven priorities and a legal framework for climate and energy policy until 2030. From the heating and cooling sector viewpoint, the most important are Directives 2018/844 [7], 2018/2002 [8], and 2018/2001 (RED II) [9].
The rationale for the adoption of the directives is energy efficiency [8]. The regulations established a target of at least 32.5% energy efficiency improvement in 2030, compared to 2007. Since buildings account for 40% of final energy consumption, each EU member-country developed strategies to reduce energy consumption of public and private buildings to almost zero. Achieving the goal required accelerating the pace of thermal upgrading and the use of smart energy management technologies.
Complementing the Winter Package is the EC statement, “Europe that protects: clean air for all” [10]. Residential, commercial, and institutional heating energy consumption was the principal source of coarse particulate matter (PM10) and fine particulate matter (PM2.5) in 2019 [11]. The emissions resulting in air pollution cause numerous chronic diseases and premature death.
Further GHG reduction targets are included in the Clean Planet for All strategy, including a long-term vision of net zero emissions in 2050. The strategy proposed a complete phase-out of coal use and significant reduction in oil and gas consumption [6]. Those declarations were confirmed in the European Green Deal [12] and “Fit for 55” [13], developed by the EC to implement the UN 2030 Agenda for Sustainable Development [14].
The above-mentioned documents raise the issue of energy poverty [15,16,17]. In 2018, 6.8% of the EU households were unable to fully pay their utility bills, including energy bills. Moreover, 7.3% of the EU population experienced ambient temperatures at home that were below the comfort limit [18]. The main reasons behind the underheated living space include a high share of heating expenses relative to household income, energy inefficient buildings, and heating equipment with low efficiency [19]. In 2021, energy poverty was exacerbated due to high energy costs [20]. Hence, the EC recommendations to member states are “to give Union consumers, including households and businesses, secure, sustainable, competitive and affordable energy” [18].
Research from both macroeconomic [21,22] and microeconomic [23,24,25] perspectives shows that fuel and energy prices are the main, although not exclusive, determinants of energy poverty. Energy poverty varies regionally, being especially common in rural areas of southern and eastern European countries [26]. In Poland, where dependence on coal continues (although weakening), energy poverty will intensify. Hence, frequently asked questions refer not only to technology but the cost of replacing conventional energy sources. Replacing fossil fuels as a heating energy source determines the rate of GHG emission reductions in rural areas.
The potential for decarbonizing heating systems lies in the use of heat pumps [27,28,29,30,31,32]. The rapidly growing share of renewable energy (RE) in gross electricity consumption supports such use. Between 2004 and 2020, the share of RE increased from 15.9% to 37.5%. During the same period, the share of RE in total energy consumption increased from 9.6% to 22.1% [33]. The heat pump is a key technology to achieve the EU’s goal for reliable, affordable, and sustainable heat supply [34,35,36]. “Powering a Climate-neutral Economy: An EU Strategy for Energy System Integration” [32] further supports the use of heat pump installation as it predicts the share of electricity in residential heating demand at 40% by 2030 and 50–70% by 2050.
The heat pump technology has gained popularity in Poland very recently and accounts for a small portion of heating energy supply. Technology cost is a major factor in space heating equipment installation decisions. Besides efficiency, heat pumps offer major environmental benefits of reducing GHG emissions helping to achieve RE and air quality policy goals in Poland. Hence the purpose of the study is to assess the economic efficiency of using heat pumps in Poland’s rural areas.

2. Background

2.1. Motivation for Heat Pump Use in Poland

“Energy Policy of Poland through 2040” stipulates that, “If in a given area there is no possibility of connection to the district heating network, heating needs should be covered by individual sources with the lowest possible emissions, especially: installations of non-combustible RES (including heat pumps), …” [37]. Poland’s rural areas have limited access to transmission infrastructure for district heating and gas networks. In 2017, sales through district heating systems to rural residents accounted for a 1.7% share and 23.3% of rural areas had access to piped gas [38]. The heat pump technology offers an alternative heating system for both detached and multi-family housing as well as for the service and manufacturing sectors.
Expanding the use of heat pump systems can significantly reduce air pollution by particulate matter (PM10 and PM2.5) and benzo(a)pyrene, which poses a serious threat to public health. Maximum average annual concentrations of particulate matter in Poland were almost double the permissible limit, placing the country among the worst in terms of air quality in the EU. As a result of the persistently high concentrations of particulate matter levels in the air, the EC sued Poland in the EU Court of Justice in 2015 for poor air quality. The EC found that the legislative and administrative measures used to reduce particulate matter emissions in Poland were insufficient. As of 1 December 2020, 31 infringement proceedings were pending against 18 member-states for exceeding concentration levels or insufficient monitoring of PM10, PM2.5, NO2 or SO2. Ten of these cases were referred to the Court of Justice of the European Union, of which five (including the case against Poland) resulted in rulings [39,40]. The latest Clean Air Outlook report shows that member-states will need to further increase efforts to meet their 2030 emission reduction obligations under the NEC Directive [41]. Compared to 2018 emission levels, Poland, Cyprus, the Czech Republic, Hungary, and Romania will have to halve their PM2.5 emission levels [39].

2.2. Heat Pump Installation in Poland

The growth in the use of heat pump technology accelerated in the late 20th and early 21st centuries, especially in North America and Europe [42]. The intensive development of low-temperature systems is driven by the already available small-scale installations, suitable for single-family houses, housing estates, summer homes, office buildings, churches, factories, etc. The heat pump segment in Europe has been rapidly growing in recent years. The number of heat pumps in operation in the EU in 2020 was 41.9 million, up more than 224% from 2012. Italy, France, and Spain have been the leaders in obtaining heat energy using heat pumps, accounting for 74.4% of all installations in 2020 (Euroobserver, 2022).
The primary factor in the popularity of heat pumps is the relatively low capital expenditure. The devices use the heat contained in atmospheric air and do not incur additional costs, as is the case with the installation of ground heat exchangers. For small capacity installations, the cost of making such intakes frequently exceeds the cost of purchasing heat pumps and becomes the main cost item of the entire investment. Countries of southern Europe, including Italy, France, Spain, and Portugal, accounted for the majority of the total installed heat pump capacity in 2020.
The share of heat pumps in the structure of energy consumption in the heating and cooling sector in 2020 in the EU27 was only 2.94%. The share varied substantially across countries, from near zero in Romania, Lithuania, and Hungary to 15.2% in Malta, and about 10% in Portugal, Sweden, Cyprus and Greece [Short Assessment of Renewable Energy Sources; see Table 1].
A more than twelvefold increase in the number of heat pump installations between 2011 and 2020 in Poland resulted in a more than fivefold increase of heat pump heat acquisition (Table 1). A key factor was the changing structure of installed equipment. While in 2011 the share of pumps using air as the lower heat source was 18%, by 2020 it was 75%. Nevertheless, the Polish heat pump sector differed from other EU countries in terms of type of equipment and was characterized by a much lower share of installations using distributed thermal energy stored in the ambient air for heating purposes.
The result of these changes was a 20% decrease in the value of seasonal energy efficiency coefficients. Heat pumps using distributed thermal energy stored in the ambient air have lower efficiency in Polish climatic conditions than devices using thermal energy stored in the ground or groundwater.

3. Materials and Methods

The objective of the study is the evaluation of ground heat pump savings in space heating, in relation to other heating energy sources, i.e., heating oil, LPG, and electricity. The study is motivated by earlier studies in heat pump use in Poland’s rural areas [43,44,45,46]. The geographic focus is on the Municipality of Ruda-Huta (Chełm County, Lublin Province, Poland), the only city out of 217 cities and municipalities in Lublin Province to use heat pumps for heating public buildings. The municipality of Ruda-Huta is located a short distance from the EU eastern border with Ukraine and Belarus. The municipality has some of the lowest revenues among local governments in Poland. According to the Ministry of Finance, in terms of the G-index (basic tax income per capita adopted for calculating the equalization subvention for 2022), the municipality was ranked 2430th out of 2477 local governments [47]. Hence, local government leaders explored the use of RES as a way to reduce energy expenditures and an effective method of implementing low-carbon management plans and reducing emissions [48]. The availability of EU funds for the development of RES use was an additional incentive to invest [49].
The facilities using heat pumps in Ruda Huta received substantial financial support from EU. The evaluation of heating costs and investment payback time involved two methods: Simple Pay Back Time (SPBT) and Levelized Cost of Heat (LCOH).
First, the SPBT method calculated the time period for the operating savings to offset the difference in capital expenditures. The applied formula is:
SPBT = Δ N Δ Q
where:
SPBT—payback time [years],
Δ N —investment expenditure [PLN],
Δ Q —annual savings [PLN/years].
The Levelized Cost of Heat (LCOH) method was used to assess heating costs [50,51]. Commonly, the LCOH method is used for estimating electricity generation costs [52,53]. The formula below is applied to estimate the average costs of generating 1 GJ of thermal energy for the entire period of operation of the tested heating systems:
LCOH = t = 1 n I t + F t + M t ( 1 + r ) t t = 1 n E t ( 1 + r ) t
where:
LCOH—Levelised Cost of Heat [PLN/GJ],
It—Investment expenditures in year t (amortization and cost of capital) [PLN],
Ft—fuel or energy costs in year t [PLN],
Mt—other costs in year t [PLN],
Et—energy generation in year t [GJ],
r—average discount rate [%],
n—lifetime of the heating system.
Both methods used actual data for the period ending 31 December 2021. Next, the operating time of the facility using a heat pump was projected using forecasting methods. The forecast was performed due to the destabilization of the energy market after the outbreak of war in Ukraine in the late February 2022.

Data

The data about expenditures on space heating include eight public buildings, including the school complex, the building housing the local government offices, and in the public library in Ruda Huta. All eight public buildings underwent thermal upgrades combined with the installation of heat pumps in expectations of lower energy bills for space heating and the reduction of emissions from burning fossil fuels. The implicit savings are identified by calculating the operation of heat pumps and the use of three alternative energy sources (electricity, LPG, and heating oil). Electricity prices were provided by the Ruda Huta Municipality Office, while LPG prices were collected from the “Bankier.pl” website [54]. The prices are average monthly prices from January 2013 to July 2022. Ekoterm heating oil prices were published by Lotos S.A. [55].

4. Results

4.1. The Municipality of Ruda Huta Efforts to Use RES

The efforts to utilize RE in Ruda Huta proved successful and the municipality received an honorable mention in the “Rural Municipalities” category for the promotion of eco-energy and pro-environmental solutions [56]. The honorable mention acknowledged the efforts in reducing air pollution and enhancing environmental quality by replacing the boilers (powered by coal) with a heat pump.

4.2. Technical Characteristics of Buildings Using Heat Pumps

The first project, implemented at the Ruda Huta School Complex in 2013, involved replacing an oil-powered boiler with ground heat pumps. The new equipment also supplied hot water. In the year following the change of the heating system, heating expenses were reduced by 55% [46]. Such favorable results gave the impetus for efforts to upgrade space and water heating systems in another 6 public buildings. The investment projects were implemented in the fall of 2014. In 2019, heat pumps were also installed in a new library building. The total installed capacity of heat pumps in public buildings in the Municipality of Ruda Huta as of 31 December 2021, was 0.449 MWth. In addition, each facility has been equipped with backup heat sources. The backup space and water heating energy source becomes the main source when average daily temperatures fall below −15 °C. Table 2 shows the technical parameters of the studied facilities.
Building sizes varied (Table 2), which affected pump capacity and cost of investment in the heat pump system. Heat pumps were from three different manufacturers, although six were from the same firm, which can reduce regular maintenance costs. The peak heat source varied and was almost evenly split across heating oil, LPG, and electricity. The reduction of local air pollution results primarily from the replacement of heating oil systems. One system used coal and LPG, one only LPG (Table 2), while three used electricity.

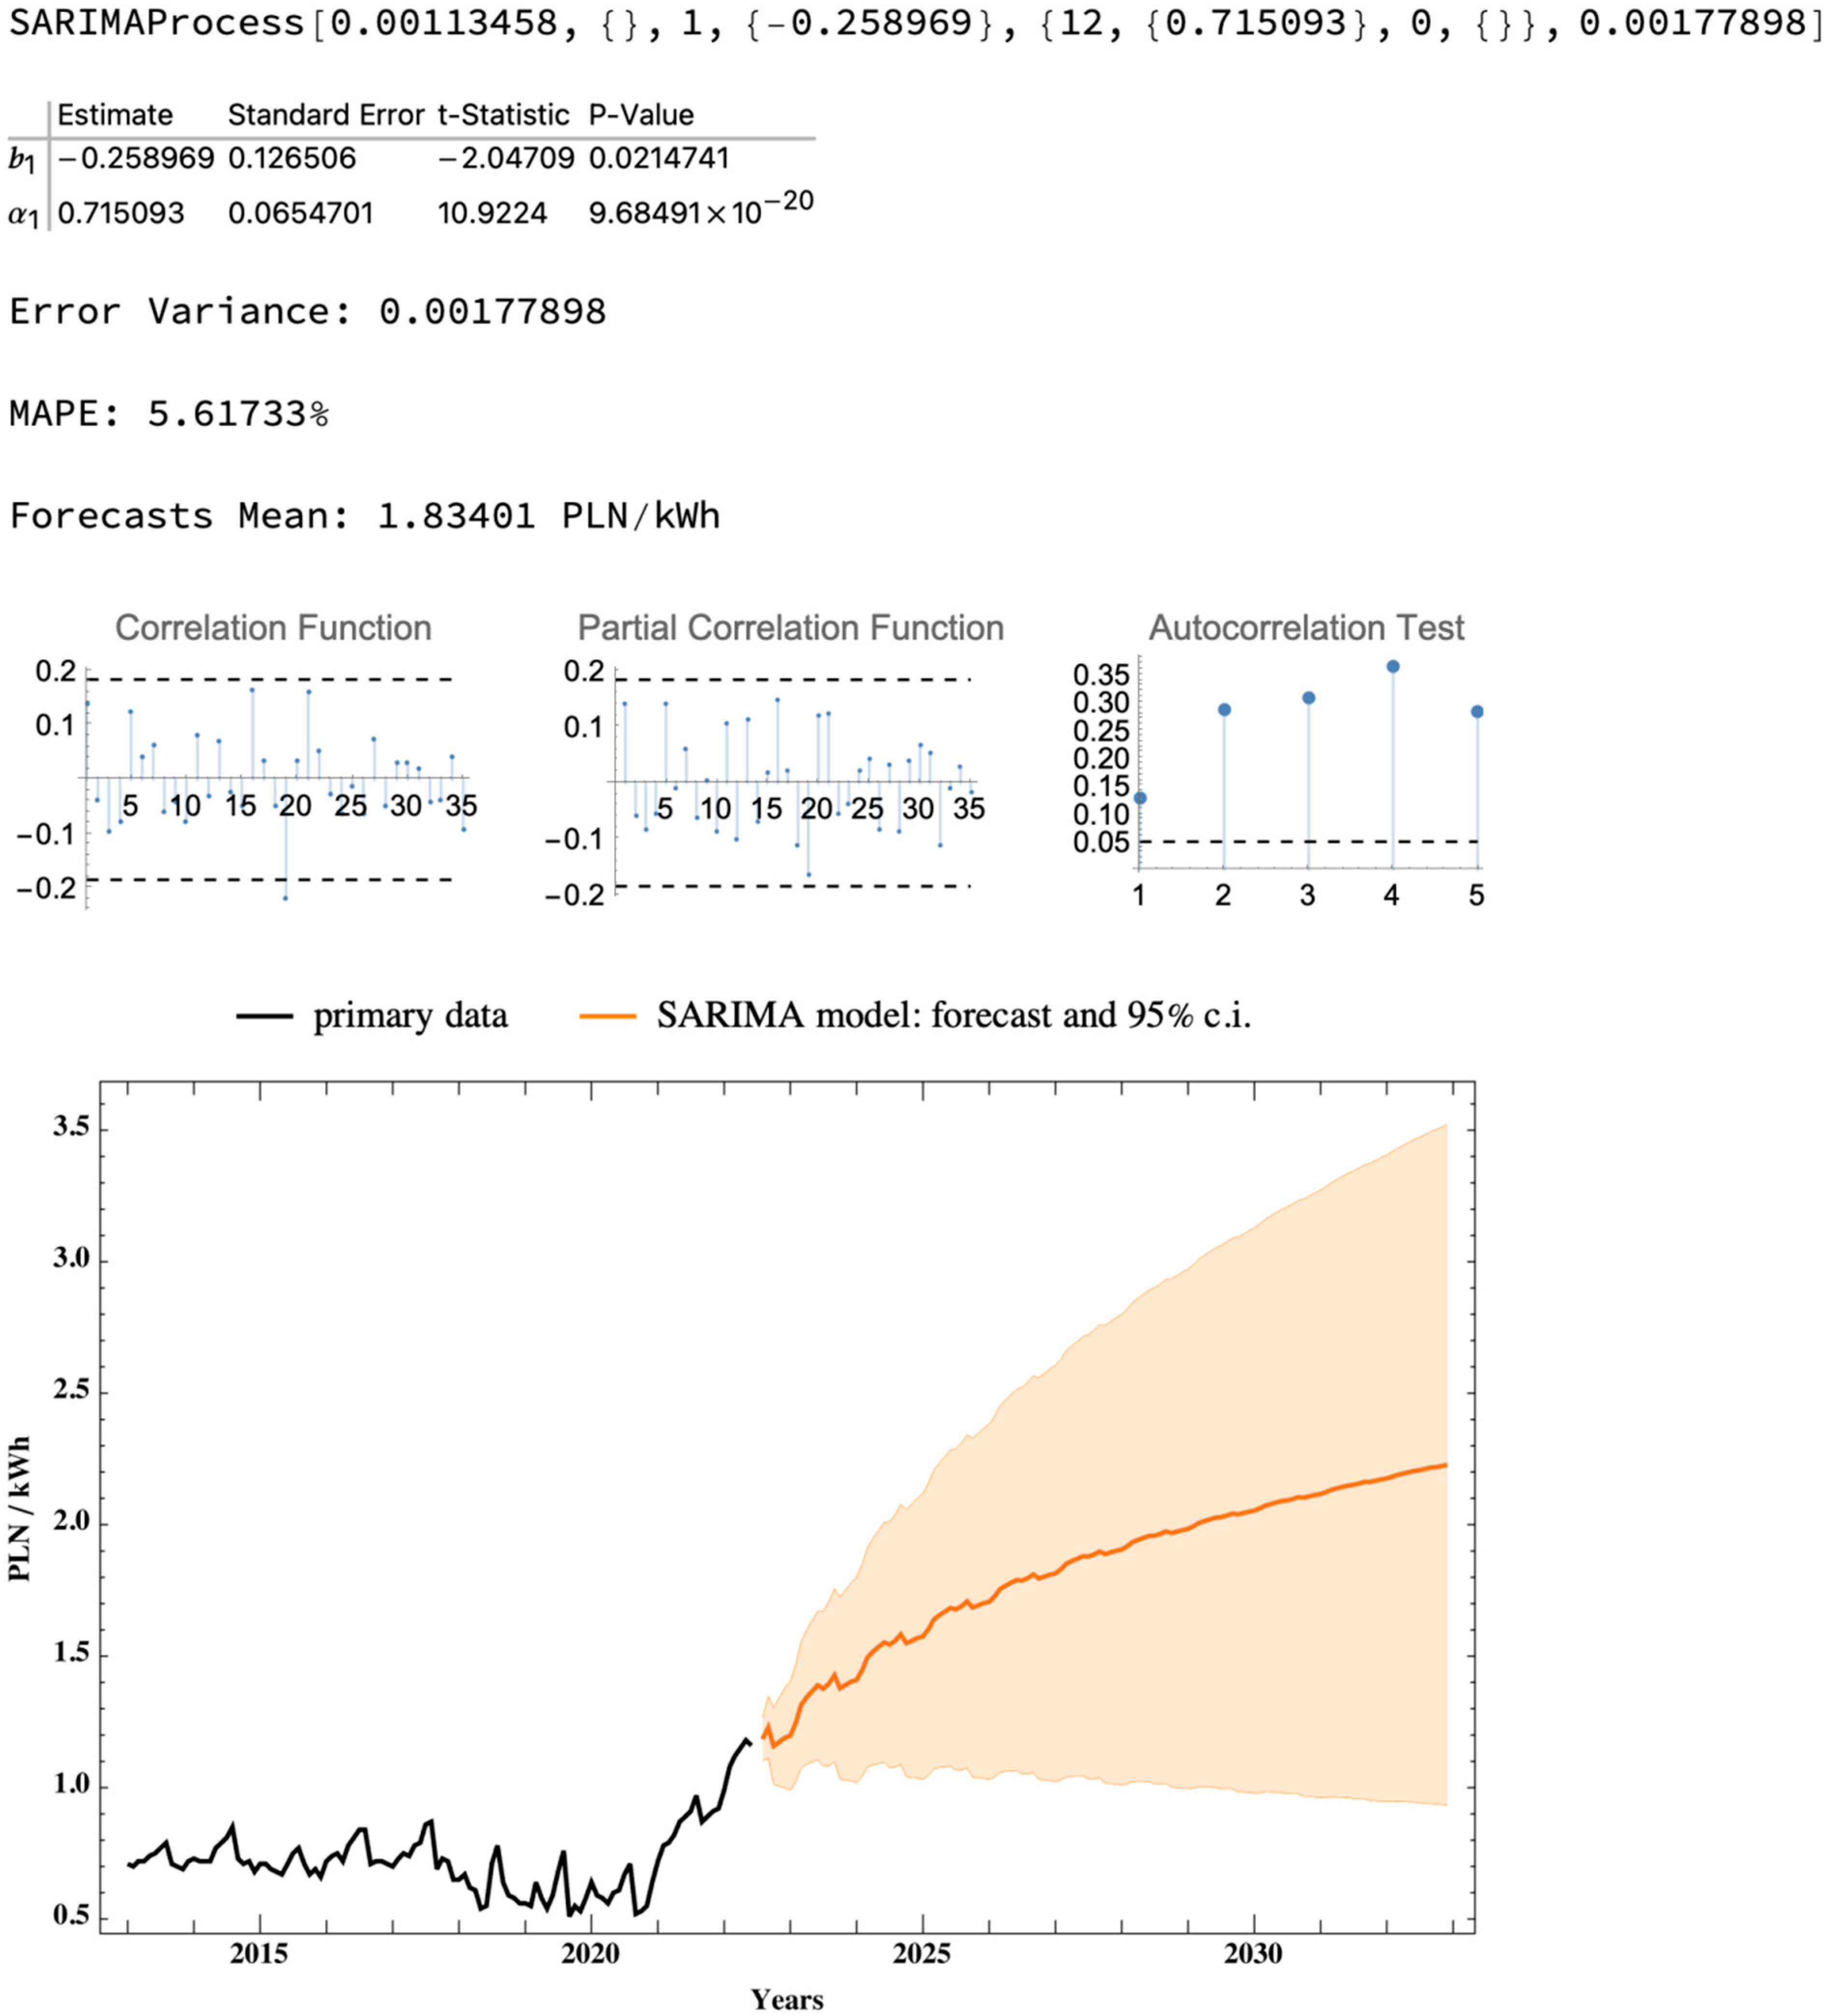
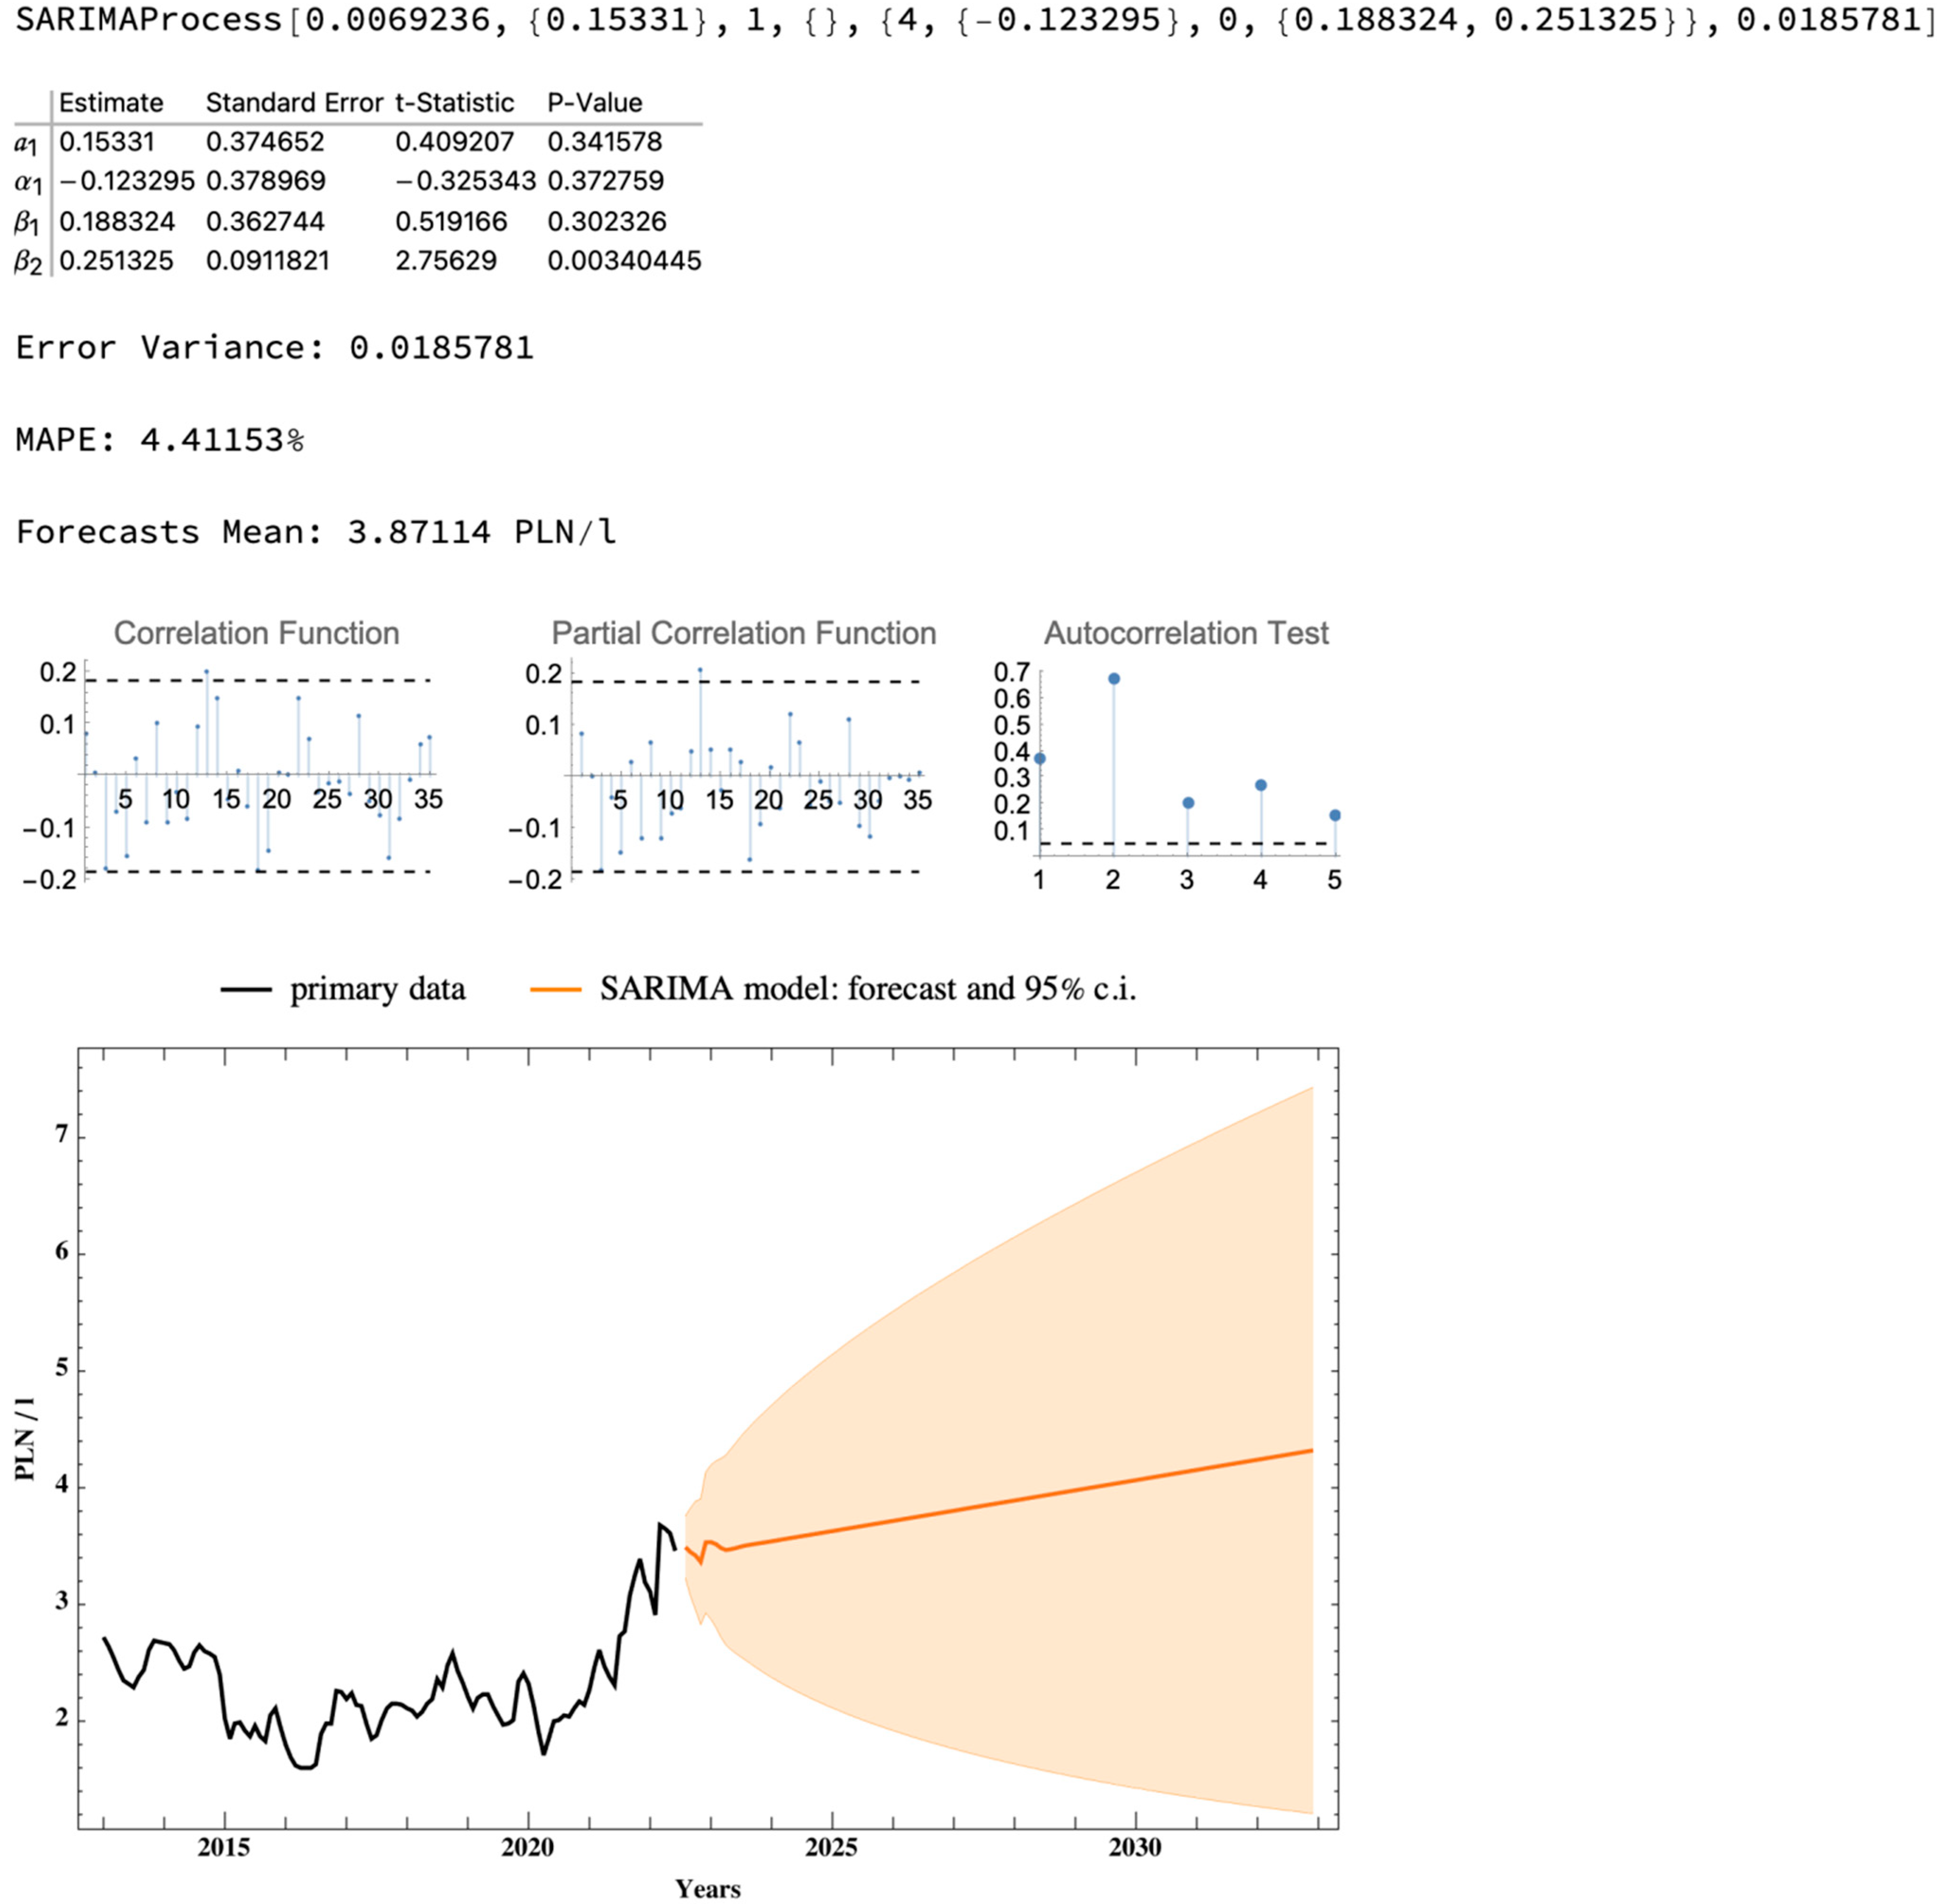
4.3. Reduction in Heating Energy Expenditure

To evaluate the economic efficiency of the investment, a comparison is made between the expenses incurred and the expected income. In the case of completed projects in Ruda-Huta, the gains are savings from changing heating systems. The main factor determining the cost of heating are the prices of fuels and energy. Energy prices displayed a very high variability during the period under consideration. The highest volatility characterized the Ekoterm oil prices, where the ratio of the maximum to the minimum price was 3.44. In the case of electricity and LPG, the ratios were 2.33 and 2.3, respectively. Table 3 summarizes the descriptive statistics of the prices of energy sources used in space heating in municipal buildings in Ruda-Huta. Prices are expressed in Polish zloty (PLN) and the means refer to the commercial units in which each energy type is sold. Prices of LPG and heating oil are quite similar, but the energy value (in BTU) of heating oil is marginally higher than that of LPG for the same unit (litre, for example). The higher BTU value of heating oil could explain the price difference with regard to LPG.
The SPBT and LCOH calculations were performed for three energy price scenarios:
  • average prices for the period 2013–2022,
  • maximum prices for the period 2013–2022,
  • forecasts of average prices in the period 2022–2032.
Average and maximum prices for the 2013–2022 period are included the descriptive statistics in Table 3. The average prices for the 2022–2032 period were determined using the Seasonal Autoregressive Integrated Moving Average (SARIMA) method, an effective technique for modelling and forecasting time series. The technique allows to include both autoregressive, moving average, seasonality, and non-stationarity effects in a single model [57,58,59]. SARIMA models have been used to forecast fuel and energy prices [60,61,62,63,64] and, therefore, this method was also applied in the current study. Prices of electricity, LPG, and heating oil rapidly ascended towards the end of the studied period. Initially prices increased at the beginning of 2021 and the price increase in 2022 has been attributed to the invasion of Russia in Ukraine and the resulting threat to the supply of fossil fuels, especially natural gas and oil.
All models used in forecasting three types of energy, with parameters p,d,q and P,D,Q assuming values from 0 to 3 and parameter S with values from 0 to 12 were tested. The criterion for selecting the best models was the value of Akaike Information Criterion (AIC). Next, the selected models were verified in terms of autocorrelation of residuals using the Autocorrelation Function (ACF), Partial ACF (PACF), and Ljung-Box tests. Finally, it was checked whether the selected model has significant parameters and generates acceptable long-term forecasts. Statistical characteristics of the selected SARIMA models are shown in Figure 1, Figure 2 and Figure 3 and Table 4 shows the average predicted prices. The price of electricity seems to more than double. In turn, the average predicted price of LPG is less than twice the sample average. The heating oil price increase is larger than the relative price increase of electricity price. Heating oil becomes the least attractive alternative and less use of it potentially reduces the local air pollution. The competitiveness of the three heating energy sources as compared to heat pump installations has been weakened since early 2021. However, heat pumps use electricity and the increased electricity prices reduce the energy bill savings following the heat pump installation.
Figure 1 shows the plotted actual sample observations and a sample forecast of electricity prices. The predicted prices continue to increase at a rather fast rate during the whole forecast period, i.e., through 2032. Currently, the Polish government has adopted a policy of tempering electricity price increase. The adopted solution temporarily caps the rate of increase to protect households and help the business sector to adjust to the new energy market realities.
The predicted LPG prices show a pattern different from electricity prices (Figure 2). LPG prices initially show a tendency to decline in the period beyond 2022. Indeed, the LPG prices have been affected by the re-orientation of natural gas imports by the EU from Russia. However, the forecast LPG prices resume their growth and continue to increase throughout the prediction period. The growth rate appears lower than in the case of electricity prices.
Since early 2021, Ekoterm heating oil prices increased more rapidly than electricity or LPG prices (Figure 3). However, the predicted prices appear to grow at a slower pace although faster than LPG prices. Ekoterm oil price growth was reflected in the average prices shown in Table 4. Heating oil is less likely to be used in space heating installations not only due to less competitive price, but primarily due to policies aiming at the air pollution reduction and the broad goals of the EU climate policy. Overall, the thermal modernization of public buildings in Ruda Huta was timely and provided important savings on the energy bills of the local government. However, the most recent increase in electricity prices offset the gains from installing heat pump systems for the purpose of space heating.
Table 5 summarizes the calculated SPBT and LCOH ratios for the scenarios of energy source prices in the municipal buildings in Ruda-Huta. The average payback time was calculated for each type of heating energy source for the building that used a specific energy type prior to its replacement by heat pumps. The payback period was typically the longest for the three buildings using electricity. However, buildings using heating oil had only marginally shorter payback times and only those heated with LPG had a markedly shorter payback period (Table 5). Currently, with the rapid ascent of prices of electricity, LPG, and heating oil, savings on energy bills can be expected to be substantial. Additionally, with the increased uncertainty regarding prices of fossil fuels, managing buildings operating heat pumps may be easier than for buildings using conventional sources of heating energy.
A postulated direction for decarbonizing heating in the EU is to increase the use of electricity, primarily to power heat pumps [27,28,29,30,31,32]. Heat pumps can cover 45% of the EU’s heating energy demand and reduce GHG emissions by 16% [30,65,66,67].
The increase in the share of heat pumps can meaningfully reduce the concentration of particulate matter (PM10 and PM2.5) and ana(a)pyrene in the air. In Poland, the average annual concentrations of particulate matter were almost twice the EU limit [68,69,70,71,72]. Heat pump use offers a viable way to meet Poland’s obligations to reduce particulate emissions under the NEC Directive by 2030 [41,73,74]. The use of heat pumps applies to regions lacking district heating and gas networks and where solid fuel prices are competitive [43,44,45,46,75,76,77,78,79,80].
In Poland, there is a lack of comprehensive, reliable, and verifiable studies on the economic gains of using heat pumps. Information is published in manufacturer advertising materials and by heating system installers, trade magazines, and websites dedicated to the RES utilization [81]. The trustworthiness of such information sources is limited, since they are often managed for commercial purposes [82,83]. The use of heat pumps in space heating by replacing the heating equipment using conventional energy carriers was characterized by significant savings in eight buildings subject to this study.

5. Conclusions

The choice of the heating method is driven by expected economic gains, which vary across the available technologies. The current study examined the effects of using heat pumps in the heating of eight municipal buildings in one of the poorest rural areas in Poland. The peripherally located area is without access to heat transmission infrastructure such as the district heating system and piped gas. Electricity, LPG, and Ekoterm heating oil were used as energy carriers to heat space in public buildings before the installation of heat pumps.
Two methods were selected to calculate the gains from replacing old heating systems with a heat pump system, namely the Simple Pay Back Time (SPBT) and Levelized Cost of Heat (LCOH). The calculations were carried out without taking subsidies into account, for three scenarios of fuel and the average energy prices between 2012 and 2021. The approach included the recent increase in energy prices since early 2021 followed by further increases after the invasion of Russia in Ukraine.
Heat pumps proved to compete in terms of energy expenditure on public building space heating as compared to the heating systems utilizing electricity, LPG, or heating oil. The payback period, excluding the EU subsidies, and using the average prices of electricity, LPH, and heating oil from 2012 to 2021 were, respectively: 6.7–7.8 years, 4.1–6.1 years, and 6.7–6.9 years. Much greater spreads in favor of ground heat pumps were obtained using LCOH. In relation to using electricity for space heating, the difference was about three times. The difference was nearly double between using heat pumps and heating oil and LPG. Once the EU subsidies were considered, the payback period for installations using electricity, LPH, and heating oil would more than doubled.

Author Contributions

Conceptualization, P.G. and W.J.F.; methodology, P.G., I.S. and A.M.K.; software, A.T. and A.S.; validation, P.G., W.J.F. and A.M.K.; formal analysis, P.G. and A.T.; investigation, P.G. and A.T.; resources, A.M.K. and A.S.; data duration, I.S. and A.T.; writing—original draft preparation, P.G. and A.T.; writing—review and editing—A.M.K. and A.S.; supervision, P.G. and W.J.F.; project administration, P.G., A.M.K. and A.T. All authors have read and agreed to the published version of the manuscript.

Funding

This research received no external funding.

Institutional Review Board Statement

Not applicable.

Informed Consent Statement

Not applicable.

Data Availability Statement

Not applicable.

Conflicts of Interest

The authors declare no conflict of interest.

References

  1. European Commission. Communication from the Commission to the European Parliament, the Council, the European Economic and Social Committee and the Committee of the Regions. An EU Strategy on Heating and Cooling; European Commission: Brussels, Belgium, 2016.
  2. Toleikyte, A.; Carlsson, J. Assessment of Heating and Cooling Related Chapters of the National Energy and Climate Plans (NECPs); JRC Technical Report; Publications Office of the European Union: Luxembourg, 2021. [Google Scholar] [CrossRef]
  3. SHARES 2020 Summary Results—Provisional. Available online: https://ec.europa.eu/eurostat/web/energy/data/shares (accessed on 10 November 2021).
  4. United Nations. Adoption of the Paris Agreement. Available online: https://unfccc.int/resource/docs/2015/cop21/eng/l09r01.pdf (accessed on 10 May 2021).
  5. European Commission. Clean Energy for All Europeans; Publications of the European Union: Luxembourg, 2019.
  6. European Commission. Communication from the Commission to the European Parliament, the European Council, the Council, the European Economic and Social Committee, the Committee of the Regions and the European Investment Bank. A Clean Planet for All. A European Strategic Long-Term Vision for a Prosperous, Modern, Competitive and Climate Neutral Economy; European Commission: Brussels, Belgium, 2018.
  7. European Union. Directive 2018/844 of the European Parliament and of the Council of 30 May 2018 amending Directive 2010/31/EU on the energy performance of buildings and Directive 2012/27/EU on energy efficiency. Off. J. Eur. Union 2018, L 156, 75–91. [Google Scholar]
  8. European Union. Directive 2018/2002 of the European Parliament and of the Council of 11 December 2018 amending Directive 2012/27/EU on energy efficiency. Off. J. Eur. Union 2018, L 328, 210–230. [Google Scholar]
  9. European Union. Directive 2018/2001 of the European Parliament and of the Council of 11 December 2018 on the Promotion of the Use of Energy from Renewable Sources (Recast). Off. J. Eur. Union 2018, L 328, 82–209. [Google Scholar]
  10. European Commission. Communication from the Commission to the European Parliament, the Council, the European Economic and Social Committee and the Committee of the Regions. A Europe that Protects: Clean Air for All; European Commission: Brussels, Belgium, 2018.
  11. European Environment Agency. Air Quality in Europe 2021; Report no. 15/2021; European Environment Agency: Copenhagen, Denmark, 2021. [CrossRef]
  12. European Commission. Communication from the Commission to the European Parliament, the Council, the European Economic and Social Committee and the Committee of the Regions. The European Green Deal; European Commission: Brussels, Belgium, 2019.
  13. European Commission. Communication from the Commission to the European Parliament, the Council, the European Economic and Social Committee and the Committee of the Regions. “Fit for 55”: Delivering the EU’s 2030 Climate Target on the Way to Climate Neutrality; European Commission: Brussels, Belgium, 2021.
  14. United Nations. Transforming Our World: The 2030 Agenda for Sustainable Development. Available online: https://www.un.org/ga/search/view_doc.asp?symbol=A/RES/70/1&Lang=E (accessed on 21 November 2021).
  15. Bouzarovski, S.; Thomson, H.; Cornelis, M. Confronting Energy Poverty in Europe: A Research and Policy Agenda. Energies 2021, 14, 858. [Google Scholar] [CrossRef]
  16. Tundys, B.; Bretyn, A.; Urbaniak, M. Energy Poverty and Sustainable Economic Development: An Exploration of Correlations and Interdependencies in European Countries. Energies 2021, 14, 7640. [Google Scholar] [CrossRef]
  17. Bouzarovski, S.; Thomson, H.; Cornelis, M.; Varo, A.; Guyet, R. Towards an Inclusive Energy Transition in the European Union: Confronting Energy Poverty Amidst a Global Crisis; Publications Office of the European Union: Luxembourg, 2020. [Google Scholar] [CrossRef]
  18. European Union. Commission recommendation 2020/1563 of 14 October 2020 on energy poverty. Off. J. Eur. Union 2020, L 357, 35–41. [Google Scholar]
  19. European Commission. Energy Poverty, EU Energy Poverty Observatory. Available online: https://energy.ec.europa.eu/topics/markets-and-consumers/energy-consumer-rights/energy-poverty_en (accessed on 10 January 2022).
  20. European Commission. EU Energy Prices. Available online: https://energy.ec.europa.eu/topics/markets-and-consumers/eu-energy-prices_en#energy-prices-2021 (accessed on 10 January 2022).
  21. Thomson, H.; Snell, C. Quantifying the prevalence of fuel poverty across the European Union. Energy Policy 2013, 52, 563–572. [Google Scholar] [CrossRef]
  22. Rodriguez-Alvarez, A.; Llorca, M.; Jamasb, T. Alleviating energy poverty in Europe: Front-runners and laggards. Energy Econ. 2021, 103, 105575. [Google Scholar] [CrossRef]
  23. Llorca, M.; Rodriguez-Alvarez, A.; Jamasb, T. Objective vs. subjective fuel poverty and self-assessed health. Energy Econ. 2020, 87, 104736. [Google Scholar] [CrossRef] [Green Version]
  24. Biernat-Jarka, A.; Trębska, P.; Jarka, S. The Role of Renewable Energy Sources in Alleviating Energy Poverty in Households in Poland. Energies 2021, 14, 2957. [Google Scholar] [CrossRef]
  25. Bouzarovski, S.; Herrero, S.T. The energy divide: Integrating energy transitions, regional inequalities and poverty trends in the European Union. Eur. Urban Reg. Stud. 2017, 24, 69–86. [Google Scholar] [CrossRef] [PubMed]
  26. Siksnelyte-Butkiene, I.; Streimikiene, D.; Lekavicius, V.; Balezentis, T. Energy poverty indicators: A systematic literature review and comprehensive analysis of integrity. Sustain. Cities Soc. 2021, 67, 102756. [Google Scholar] [CrossRef]
  27. European Union. Directive 2009/28/EU of the European Parliament and of the Council of 23 April 2009 on the promotion of the use of energy from renewable sources and amending and subsequently repealing Directives 2001/77/EC and 2003/30/EC (Text with EEA relevance). Off. J. Eur. Union 2009, L 140, 16–62. [Google Scholar]
  28. European Union. Directive 2009/125/EU of the European Parliament and of the Council of 21 October 2009 establishing a framework for the setting of ecodesign requirements for energy-related products (Text with EEA relevance). Off. J. Eur. Union 2009, L 285, 10–35. [Google Scholar]
  29. European Union. Directive 2010/31/EU of the European Parliament and of the Council of 19 May 2010 on the energy performance of buildings. Off. J. Eur. Union 2010, L 153, 13–35. [Google Scholar]
  30. Thomaßen, G.; Kavvadias, K.; Navarro, J.P.J. The decarbonisation of the EU heating sector through electrification: A parametric analysis. Energy Policy 2021, 148, 111929. [Google Scholar] [CrossRef]
  31. Abbasi, M.H.; Abdullah, B.; Ahmad, M.W.; Rostami, A.; Cullen, J. Heat transition in the European building sector: Overview of the heat decarbonisation practices through heat pump technology. Sustain. Energy Technol. Assess. 2021, 48, 101630. [Google Scholar] [CrossRef]
  32. Walker, I.S.; Less, B.D.; Casquero-Modrego, N. Carbon and energy cost impacts of electrification of space heating with heat pumps in the US. Energy Build. 2022, 259, 111910. [Google Scholar] [CrossRef]
  33. Decuypere, R.; Robaeyst, B.; Hudders, L.; Baccarne, B.; Van de Sompel, D. Transitioning to energy efficient housing: Drivers and barriers of intermediaries in heat pump technology. Energy Policy 2022, 161, 112709. [Google Scholar] [CrossRef]
  34. European Union. Regulation (EU) 2018/1999 of the European Parliament and of the Council of 11 December 2018 on the Governance of the Energy Union and Climate Action, amending Regulations (EC) No 663/2009 and (EC) No 715/2009 of the European Parliament and of the Council, Directives 94/22/EC, 98/70/EC, 2009/31/EC, 2009/73/EC, 2010/31/EU, 2012/27/EU and 2013/30/EU of the European Parliament and of the Council, Council Directives 2009/119/EC and (EU) 2015/652 and repealing Regulation (EU) No 525/2013 of the European Parliament and of the Council. Off. J. Eur. Union 2018, L 328, 1–77. [Google Scholar]
  35. European Commission. Communication from the Commission to the European Parliament, the Council, the European Economic and Social Committee and the Committee of the Regions. Powering a Climate-Neutral Economy: An EU Strategy for Energy System Integration; European Commission: Brussels, Belgium, 2020.
  36. Renewable Energy Statistics. Available online: https://ec.europa.eu/eurostat/statistics-explained/index.php?title=Renewable_energy_statistics#Share_of_renewable_energy_more_than_doubled_between_2004_and_2020 (accessed on 21 January 2022).
  37. Ministry of Climate and Environment. Energy Policy of Poland Until 2040; Ministry of Climate and Environment: Warsaw, Poland, 2021.
  38. Statistics Poland. Municipal Infrastructure in 2017; GUS: Warsaw, Poland, 2018.
  39. European Commission. Report from the Commission to the European Parliament, the Council, the European Economic and Social Committee and the Committee of the Regions. The Second Clean Air Outlook; European Commission: Brussels, Belgium, 2021.
  40. European Union. Judgment of the Court (Third Chamber) of 22 February 2018—European Commission v Republic of Poland. Off. J. Eur. Union 2018, L 134, 6. [Google Scholar]
  41. European Union. Directive 2016/2284/EU of the European Parliament and of the Council of 14 December 2016 on the reduction of national emissions of certain atmospheric pollutants, amending Directive 2003/35/EC and repealing Directive 2001/81/EC. Off. J. Eur. Union 2016, L 344, 1–31. [Google Scholar]
  42. Zogg, M. History of Heat Pumps. Swiss Contributions and International Milestones; Swiss Federal Office of Energy: Oberburg, Switzerland, 2008.
  43. Gradziuk, P.; Gradziuk, B. Renewable energy sources as a development opportunity for peripheral areas. Econ. Reg. Stud. 2020, 13, 184–198. [Google Scholar] [CrossRef]
  44. Gradziuk, B.; Gradziuk, P. Heat pumps versus biomass boilers: A comparative analysis of heating costs for public buildings. Ann. Pol. Assoc. Agric. Agribus. Econ. 2020, XXII, 77–85. [Google Scholar] [CrossRef]
  45. Siudek, A.; Klepacka, A.M.; Florkowski, W.J.; Gradziuk, P. Renewable Energy Utilization in Rural Residential Housing: Economic and Environmental Facets. Energies 2020, 13, 6637. [Google Scholar] [CrossRef]
  46. Gradziuk, P.; Gradziuk, B. Economic efficiency of applying a heat pump system in heating based on the example of the Ruda-Huta Commune experience. Ann. Pol. Assoc. Agric. Agribus. Econ. 2019, XXI, 88–96. [Google Scholar] [CrossRef]
  47. Ministerstwo Finansów. Wskaźnik Dochodów Podatkowych Poszczególnych Gmin na 2022 r. Available online: https://www.gov.pl/web/finanse/wskazniki-dochodow-podatkowych-gmin-powiatow-i-wojewodztw-na-2022-r (accessed on 31 March 2022).
  48. Gradziuk, P.; Gradziuk, B. Ranga odnawialnych źródeł energii w gminnych planach gospodarki niskoemisyjnej. Rocz. Nauk. SERiA 2016, XVIII, 67–72. [Google Scholar]
  49. Gradziuk, P.; Gradziuk, B. Próba oceny absorpcji środków z funduszy europejskich na rozwój wykorzystania odnawialnych źródeł energii w woj. lubelskim. Rocz. Nauk. Ekon. Rol. I Rozw. Obsz. Wiej. 2017, 104, 95–105. [Google Scholar] [CrossRef]
  50. Hansen, K. Decision-making based on energy costs: Comparing levelized cost of energy and energy system costs. Energy Strategy Rev. 2019, 24, 68–82. [Google Scholar] [CrossRef]
  51. National Energy Conservation Agency (KAPE), Institute for Structural Research. Clean Heat 2030. Strategy for Heating; Forum Energii. Analizy i Dialog: Warszawa, Poland, 2019.
  52. Fakhri, S.A.; Ahlgren, E.; Ekvall, T. Cost-efficiency of urban heating strategies—Modelling scale effects of low-energy building heat supply. Energy Strategy Rev. 2017, 18, 212–223. [Google Scholar] [CrossRef]
  53. Mikołajuk, H.; Duda, M.; Radović, U.; Skwierz, S.; Lewarski, M.; Kowal, I. Aktualizacja Analizy Porównawczej Kosztów Wytwarzania Energii Elektrycznej w Elektrowniach Jądrowych, Węglowych i Gazowych oraz Odnawialnych Źródłach Energii; Agencja Rynku Energii S.A.: Warsaw, Poland, 2016. [Google Scholar]
  54. LPG (Polska). Available online: https://www.bankier.pl/gospodarka/wskazniki-makroekonomiczne/lpg-pol (accessed on 3 August 2022).
  55. Olej Napędowy do Celów Opałowych LOTOS RED. Available online: https://www.lotos.pl/145/type,oil_rgterm/dla_biznesu/hurtowe_ceny_paliw/archiwum_cen_paliw (accessed on 3 August 2022).
  56. Związek Powiatów Polskich. Zwycięzcy Ogólnopolskiego Rankingu Gmin i Powiatów 2019. Available online: https://www.zpp.pl/artykul/1713-zwyciezcy-ogolnopolskiego-rankingu-gmin-i-powiatow-2019 (accessed on 31 March 2022).
  57. Dittmann, P. Modele szeregów czasowych. In Prognozowanie Gospodarcze. Metody i Zastosowania, 4th ed.; Cieślak, M., Ed.; WN PWN: Warsaw, Poland, 2005. [Google Scholar]
  58. Bisgaard, S.; Kulahci, M. Time Series Analysis and Forecasting by Example; Wiley: Hoboken, NJ, USA, 2011. [Google Scholar]
  59. Box, G.E.P.; Jenkins, G.M.; Reinsel, G.C. Time Series Analysis. Forecasting and Control; Wiley: Hoboken, NJ, USA, 2008. [Google Scholar]
  60. Abunofal, M.; Poshiya, N.; Qussous, R.; Weidlich, A. Comparative Analysis of Electricity Market Prices Based on Different Forecasting Methods. In Proceedings of the 2021 IEEE Madrid PowerTech, Madrid, Spain, 28 June–2 July 2021; pp. 1285–1290. [Google Scholar]
  61. Sobotka, A.; Sobotka, P.; Badyda, K. Koncepcja budowy modelu prognostycznego dla cen energii elektrycznej na rynku polskim. Rynek Energii 2019, 1, 25–32. [Google Scholar]
  62. Gabrielli, P.; Wüthrich, M.; Blume, S.; Sansavini, G. Data-driven modeling for long-term electricity price forecasting. Energy 2022, 244, 123107. [Google Scholar] [CrossRef]
  63. Manigandan, P.; Alam, M.S.; Alharthi, M.; Khan, U.; Alagirisamy, K.; Pachiyappan, D.; Rehman, A. Forecasting Natural Gas Production and Consumption in United States-Evidence from SARIMA and SARIMAX Models. Energies 2021, 14, 6021. [Google Scholar] [CrossRef]
  64. Zhao, Z.; Fu, C.; Wang, C.; Miller, C.J. Improvement to the Prediction of Fuel Cost Distributions Using ARIMA Model. In Proceedings of the 2018 IEEE Power & Energy Society General Meeting (PESGM), Portland, OR, USA, 5–10 August 2018; pp. 1–5. [Google Scholar]
  65. Gaur, A.S.; Fitiwi, D.Z.; Curtis, J. Heat pumps and our low-carbon future: A comprehensive review. Energy Res. Soc. Sci. 2021, 71, 101764. [Google Scholar] [CrossRef]
  66. Rosenow, J.; Rubczyński, A.; Kleinschmidt, P. Heat Electrification in Poland The path to Clean Heat. Forum Energii. Analizy i Dialog. 2021. Available online: https://www.forum-energii.eu/public/upload/articles/files/heat%20electrification_EN.pdf (accessed on 31 July 2022).
  67. Le Dû, M.; Dutil, Y.; Rousse, D.R.; Paradis, P.L.; Groulx, D. Economic and energy analysis of domestic ground source heat pump systems in four Canadian cities. J. Renew. Sustain. Energy 2015, 7, 053113. [Google Scholar] [CrossRef]
  68. Energy Consumption in Households. Available online: https://ec.europa.eu/eurostat/statistics-explained/index.php?title=Energy_consumption_in_households (accessed on 31 July 2022).
  69. Gawlik, L.; Mokrzycki, E. Changes in the Structure of Electricity Generation in Poland in View of the EU Climate Package. Energies 2019, 12, 3323. [Google Scholar] [CrossRef] [Green Version]
  70. Drożdż, W.; Mróz-Malik, O.; Kopiczko, M. The Future of the Polish Energy Mix in the Context of Social Expectations. Energies 2021, 14, 5341. [Google Scholar] [CrossRef]
  71. Statistisc Poland. Energy from Renewable Sources in 2020. Available online: https://stat.gov.pl/download/gfx/portalinformacyjny/en/defaultaktualnosci/3304/3/13/1/energy_from_renewable_sources_in_2020.pdf (accessed on 21 July 2022).
  72. Sewastianik, S.; Gajewski, A. An Environmental Assessment of Heat Pumps in Poland. Energies 2021, 14, 8104. [Google Scholar] [CrossRef]
  73. Kaczmarczyk, M.; Sowiżdżał, A.; Tomaszewska, B. Energetic and Environmental Aspects of Individual Heat Generation for Sustainable Development at a Local Scale—A Case Study from Poland. Energies 2020, 13, 454. [Google Scholar] [CrossRef]
  74. Adamczyk, J.; Piwowar, A.; Dzikuć, M. Air protection programmes in Poland in the context of the low emission. Environ. Sci. Pollut. Res. 2017, 24, 16316–16327. [Google Scholar] [CrossRef] [Green Version]
  75. Deetjen, T.A.; Walsh, L.; Vaishnav, P. US residential heat pumps: The private economic potential and its emissions, health, and grid impacts. Environ. Res. Lett. 2021, 16, 084024. [Google Scholar] [CrossRef]
  76. Kelly, J.A.; Fu, M.; Clinch, J.P. Residential home heating: The potential for air source heat pump technologies as an alternative to solid and liquid fuels. Energy Policy 2016, 98, 431–442. [Google Scholar] [CrossRef] [Green Version]
  77. Broin, E.Ó.; Kelly, J.A.; Santos, G.S.; Grythe, H.; Svendby, T.; Solberg, S.; Kelleher, L.; Clinch, J.P. Hitting the hotspots–Targeted deployment of air source heat pump technology to deliver clean air communities and climate progress: A case study of Ireland. Atmos. Environ. X 2022, 13, 100155. [Google Scholar] [CrossRef]
  78. Carella, A.; D’Orazio, A. The heat pumps for better urban air quality. Sustain. Cities Soc. 2021, 75, 103314. [Google Scholar] [CrossRef] [PubMed]
  79. Liu, H.; Mauzerall, D.L. Costs of clean heating in China: Evidence from rural households in the Beijing-Tianjin-Hebei region. Energy Econ. 2020, 90, 104844. [Google Scholar] [CrossRef]
  80. Mahmoud, M.; Ramadan, M.; Naher, S.; Pullen, K.R.; Olabi, A.-G. The impacts of different heating systems on the environment: A review. Sci. Total Environ. 2021, 766, 142625. [Google Scholar] [CrossRef]
  81. Księżopolski, K.; Drygas, M.; Pronińska, K.; Nurzyńska, I. The Economic Effects of New Patterns of Energy Efficiency and Heat Sources in Rural Single-Family Houses in Poland. Energies 2020, 13, 6358. [Google Scholar] [CrossRef]
  82. Kapuściński, J.; Rodzoch, A. Geotermia niskotemperaturowa w Polsce i na świecie. In Uwarunkowania Techniczne, Środowiskowe i Ekonomiczne; Ministerstwo Środowiska: Warszawa, Polska, 2010. [Google Scholar]
  83. Klepacka, A.M. Sustainable Development and Renewable Energy Sectors: Selected Indicators in European Union and Poland. Probl. World Agric. 2018, 18, 250–258. [Google Scholar] [CrossRef]
Figure 1. Results of the SARIMA model forecasting electricity prices.
Energies 15 07903 g001
Figure 2. Results of the SARIMA model forecasting LPG prices.
Energies 15 07903 g002
Figure 3. Results of the SARIMA model forecasting Ekoterm heating oil prices.
Energies 15 07903 g003
Table 1. Number of operating heat pumps in Poland in 2011–2020.
Specification2011201220132014201520162017201820192020
Aerothermal345054456699900721,98245,36161,731 81,636112,950167,075
Ground15,50020,62125,76331,03836,60541,99547,65553,48660,19665,818
Total18,95026,06632,46240,04558,58787,356109,386135,122173,146222,893
Output of ambient heat [TJ]2337285436274577556665707683895810,68112,481
Consumption of energy by heat pumps [TJ]872105713331823252129793508411248985720
Seasonal Coefficient of Performance2.682.702.722.512.212.202.192.182.182.18
Share of heat pumps in obtaining energy from RES (H&C) [%]1.11.31.62.22.52.83.22.43.03.5
Share of heat pumps in the H&C sector [%]0.150.180.230.310.380.420.480.520.650.78
Source: Based on Short Assessment of Renewable Energy Sources. Available online: http://ec.europa.eu/eurostat/web/energy/data/shares (accessed on 31 January 2022) and Energy Statistics in 2011–2013. Statistical information and elaborations—Central Statistical Office (GUS), Warszawa 2013–2014. Energy Statistics in 2019 and 2020. Statistical analyses—Statistics Poland (GUS), Warszawa 2021.
Table 2. Selected technical and economic parameters associated with each municipal building.
No.Building NameHeated
Surface
[m2]
Heat Source before
Modernization
Heat Pumps (HPS)Ground Heat Exchange
Vertical Collectors
Peak Heat Source (PHS)Investment Costs [PLN]
Type[kW]TypeNumber & Depth
[m]
Type[kW]HPSPHS
1.School Complex
in Ruda-Huta
3.600oilDanfoss DHP-R423 × 42HDPE 100/RC SDR 1728 × 100VITOPLEX 200 Typ SX2 (oil))90–560512,172104,328
2.Municipal building
in Ruda Huta
721coal (LPG)Alpha Innotec SWP 37137Aspol–FV Energeo8 × 100Buderus Logamax plus GB 162 (LPG)70166,05067,154
3.Municipal Health Centre
in Ruda Huta
1051oilAlpha Innotec SWP 58158Aspol–FV Energeo11 × 100Geminox 45 (oil)
Ferroli 105 (oil)
150252,150128,326
4.Communal Office
of Ruda-Huta
414oilAlpha Innotec SWP 29129Aspol–FV Energeo5 × 92ACV Prestige 75 Solo (LPG)75123,000127,615
5.Centre of Culture
and Recreation in Rudka
543electricityAlpha Innotec SWP 37137Aspol–FV Energeo7 × 100Electric heaters 18172,2007248
6.Culture Centre
in Ruda-Kolonia
317electricityAlpha Innotec SWC 170H17Aspol–FV Energeo4 × 85Electric heaters1592,2506122
7.Culture Centre in Żalin229electricityAlpha Innotec SWC 170H17Aspol–FV Energeo4 × 80Electric heaters1592,2506122
8.Library in Ruda Huta1609LPGBuderus WPS 64.2HT2 × 64HDPE 100/RC SDR 1720 × 92Buderus Logamax plus GB V2 (LPG)100201,685205,171
Source: own study based on the information obtained from the Ruda-Huta Municipal Office.
Table 3. Descriptive statistics of prices of three heating energy sources, January 2013–July 2022.
StatisticElectricityLPGOil Ekoterm
Mean0.73172.30692.9135
Standard error0.01310.04130.0696
Median0.72002.21002.8100
Mode0.72001.98002.3800
Standard dev.0.14040.44290.7465
Variance0.01970.19610.5572
Kurtosis2.21151.44317.4066
Skewness1.24731.12962.3971
Range0.68002.08004.3700
Maximum1.19003.68006.1600
Minimum0.51001.60001.7900
Count115115115
Geometric mean0.71962.26852.8397
Harmonic mean0.70852.23312.7797
Note: All prices in Polish zloty (PLN); electricity price per kWh; LPG price per liter; heating oil price per liter. Source: own calculations.
Table 4. Parameters of time series models examining prices of electricity, LPG and Ekoterm oil.
SpecificationElectricityLPGEkoterm Oil *
p—trend auto-regression (AR) order010
d—trend difference order111
q—trend Moving Average (MA) order101
P—seasonal auto-regressive order11-
D—seasonal difference order00-
Q—seasonal moving average order02-
m—the number of time steps for a single seasonal period124-
Residual variance0.00180.01860.0359
MAPE (%)5.624.414.62
Average forecast price (PLN)1.833.877.87
* The ARIMA model analyzing the series is without a seasonal component. Source: Own calculations.
Table 5. SPBT and LCOE dependence on heating systems and fuel prices.
No.Building NameSPBTLCOH
ElectricityOilLPGElectricityOilLPGHeat Pumps
MeanMax.ForecastMeanMax.ForecastMeanMax.ForecastMeanMax.ForecastMeanMax.ForecastMeanMax.ForecastMeanMax.Forecast
1.School Complex
in Ruda-Huta
---6.92.72.4------87.4182.4232.3---66.399.1144.7
2.Municipal building
in Ruda-Huta
------6.13.95.8------128.4200.4210.476.0108.8154.4
3.Municipal Health Centre
in Ruda-Huta
---6.72.52.3------99.8243.0276.4---71.4104.1149.7
4.Communal Office
of Ruda-Huta
------4.73.06.4------107.2165.4173.569.7102.5148.1
5.Centre of Culture
and Recreation in Rudka
7.84.83.1------201.5325.8498.8------72.3105.0150.5
6.Culture Centre
in Ruda-Kolonia
7.14.32.8------215.0346.1528.5------74.2107.0152.6
7.Culture Centre in Żalin6.74.12.7------213.3343.8525.4------72.1104.9150.6
8.Library in Ruda-Huta------4.12.78.2------94.9147.6154.964.196.9142.5
Source: own study.
Publisher’s Note: MDPI stays neutral with regard to jurisdictional claims in published maps and institutional affiliations.

