
Comprehensive Measurement of the Coordinated Development of China’s Economic Growth, Energy Consumption, and Environmental Conservation

Abstract
:1. Introduction
1.1. Background and Purpose
1.2. Literature Review
1.3. Contribution
2. Materials and Methods
2.1. Data Sources and Indicator System
2.2. Research Method
2.2.1. Coupling Coordination Degree Model
2.2.2. Spatial Autocorrelation
- (1)
- Global spatial autocorrelationGlobal spatial autocorrelation indicates whether the regional coordination degree between the components of the 3E system has a statistical agglomeration or dispersion in the whole region [41,42]:where I is the global Moran’s I index, n is the number of evaluation objects, is the average of the sample values of all the evaluation objects, and are the sample values of the evaluation object at i and j, respectively, and is the spatial weight matrix.A significance test for I was then conducted to further determine whether there is a spatial autocorrelation relationship:where Z is the test value of the global Moran’s I, E(I) is the expectation of I, and Var(I) is the variance of I.
- (2)
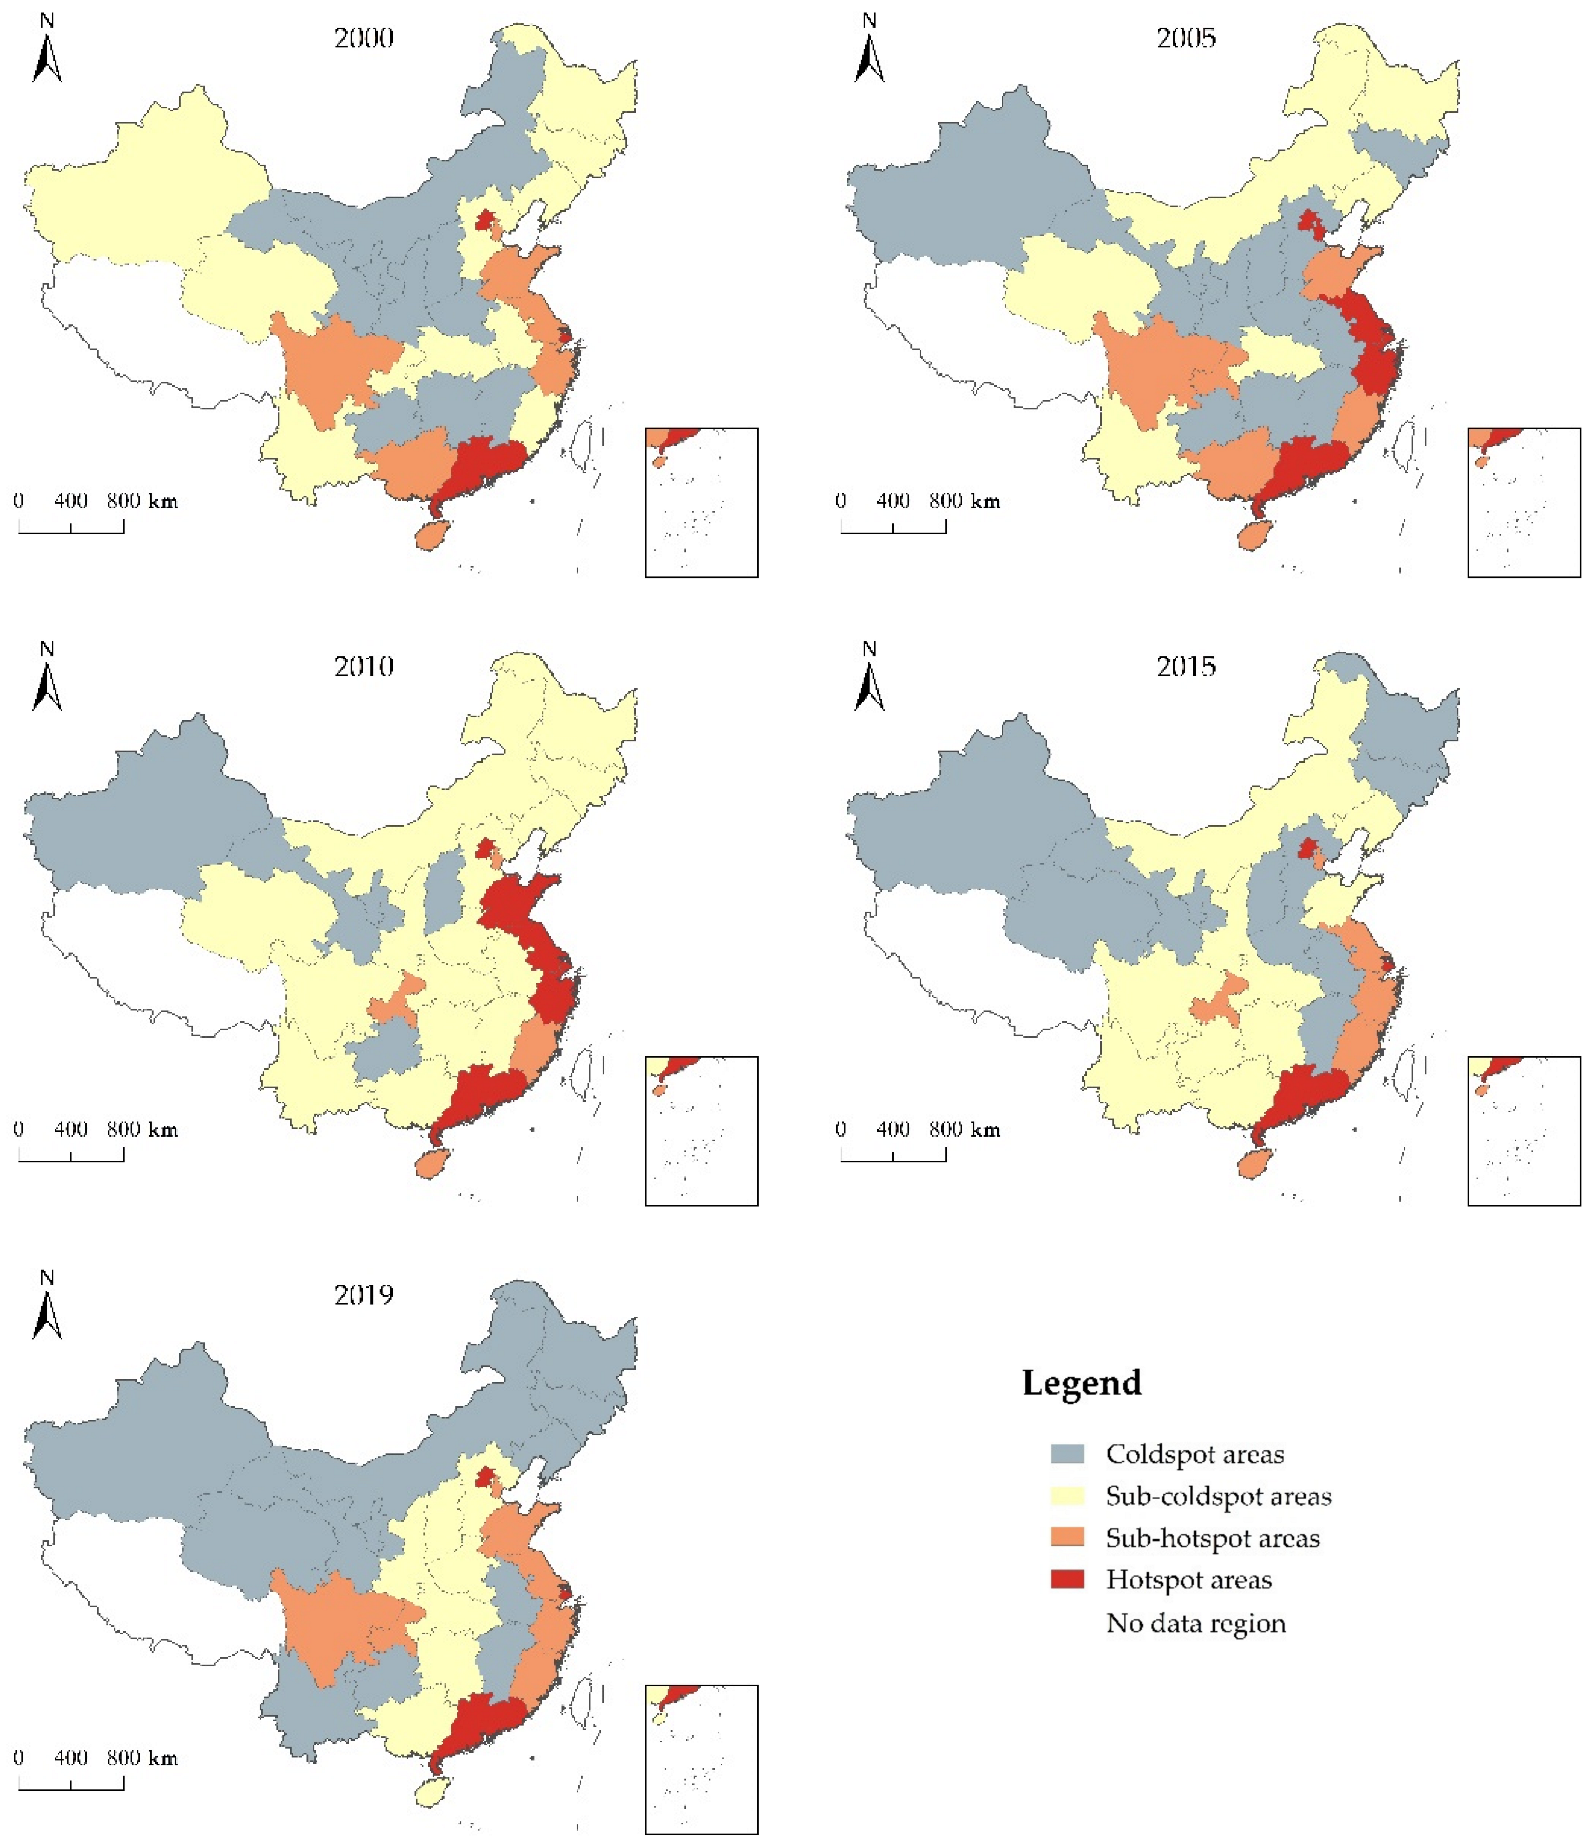
- Hotspot analysis (local Getis–Ord G* index)The hotspot analysis method was used to evaluate the dependence and heterogeneity of the regional coordination degree of the 3E system in local spaces, as well as to assess the local patterns of spatial autocorrelation [43]:where is the sample value of the j-th evaluation object, n is the number of evaluation objects, and is the spatial weight matrix. The value was significantly positive, which indicates that the values around the i region are relatively high and belong to a hotspot region; otherwise, the area is considered a “cold spot.” Table 3 summarizes the equations used in this study.
3. Results and Discussion
3.1. Measurement of Coupling and Coordinated Development
3.2. Spatial Pattern of Coupling and Coordinated Development
3.2.1. Global Spatial Autocorrelation
3.2.2. Local Spatial Autocorrelation
3.3. Discussion
4. Conclusions
Author Contributions
Funding
Institutional Review Board Statement
Informed Consent Statement
Data Availability Statement
Acknowledgments
Conflicts of Interest
References
- Wu, M.R.; Zhao, M. The Dynamic Relationship between Energy Consumption, Environmental Pollution and Economic Growth-Based on the Time Series Data of China from the Year 1990 to 2014. J. Tech. Econ. Manag. 2016, 37, 25–29. (In Chinese) [Google Scholar]
- Lu, C.Y.; Zhang, L.; Xue, B.; Yu, X.M.; Zhang, L.M.; Geng, Y. A Measurable and Compare Study on Sustainable Development of the Northeast China. J. Liaoning Univ. Nat. Sci. Edit. 2013, 40, 86–91. (In Chinese) [Google Scholar]
- Gao, F.; Zhao, X.Y.; Song, X.Y.; Wang, B.; Wang, P.; Wang, P.L.; Niu, Y.B.; Huang, C.L. Connotation and Evaluation Index System of Beautiful China for SDGs. Adv. Earth Sci. 2019, 34, 295–305. (In Chinese) [Google Scholar]
- Liao, C.B. Quantitative Assessment of Coordinated Growth Between Environment and Economy and Its Classification System—Take cities group in pearl river delta as example. Trop. Geogr. 1999, 20, 76–82. (In Chinese) [Google Scholar]
- Price, J.; Keppo, I. Modelling to generate alternatives: A technique to explore uncertainty in energy-environment-economy models. Appl. Energy 2017, 195, 356–369. [Google Scholar] [CrossRef] [Green Version]
- Hirschfield, J. The role of coastal water quality for tourism demand and regional economy—Coupling ecological and economic models. In Proceedings of the Littoral 2010: Adapting to Global Change at the Coast: Leadership, Innovation and Investment, London, UK, 21–23 September 2011; p. 15002. [Google Scholar]
- Fernández-Rodríguez, M.J.; Jiménez-Rodríguez, A.; Medialdea, M. Aquaculture in Vetala Palma (Doñana Natural Area, SW Spain): A successful coupling of ecological and socio-economic values. In Proceedings of the Wetlands Biodiversity and Services: Tools for Socio-Ecological Development (SWS-EPCN), Huesca, Spain, 14–18 September 2014. [Google Scholar]
- Lu, J.; Chang, H.; Guo, Z.Y. The Evolutionary Mechanism Analysis of Coupling Relationship among Energy, Economy and Environment in China. Chin. J. Popul. Sci. 2016, 30, 23–33, 126. (In Chinese) [Google Scholar]
- Wang, W.B.; Liu, Y. Financial Development, Energy Consumption and Economic Growth--An Empirical Analysis Based on System Coupling Model. Explor. Financ. Theory 2018, 34, 3–14. (In Chinese) [Google Scholar]
- Li, L.; Hong, X.F.; Wang, J.; Xie, C. Coupling and Coordinated Development of Economy-Energy-Environment System Based on PLS-ESDA. Soft Sci. 2018, 32, 44–48. (In Chinese) [Google Scholar]
- Yu, Y.; Chen, C. The Evolution Characteristics and Promotion Strategy of the Coupling Level on China’s Economy-Energy-Environment-science and technology Quaternionic Systems from Regional Perspective. Inq. Econ. Issues 2018, 39, 139–144, 157. (In Chinese) [Google Scholar]
- Murphy, J.; Gouldson, A. Environmental policy and industrial innovation: Integrating environment and economy through ecological modernisation. Geoforum 2000, 31, 33–44. [Google Scholar] [CrossRef]
- Terry, B.; Serban, S.S. Modeling Low Climate Stabilization with E3MG: Towards a ‘New Economics’ Approach to Simulating Energy-Environment-Economy System Dynamics. Energy J. 2010, 31, 137–164. [Google Scholar]
- Pomponi, F.; Moncaster, A. Circular economy for the built environment: A research framework. J. Clean. Prod. 2016, 143, 710–718. [Google Scholar] [CrossRef] [Green Version]
- Melbournethomas, J.; Johnson, C.R.; Perez, P.; Eustachem, J.; Fulton, E.A.; Cleland, D. Coupling Biophysical and Socioeconomic Models for Coral Reef Systems in Quintana Roo, Mexican Caribbean. Ecol. Soc. 2011, 16, 23. [Google Scholar]
- Liu, J.P.; Tian, Y.; Huang, K.; Yi, T. Spatial-temporal differentiation of the coupling coordinated development of regional energy-economy-ecology system: A case study of the Yangtze River Economic Belt. Ecol. Indic. 2021, 124, 107394. [Google Scholar] [CrossRef]
- Lin, X.Y.; Chen, C. Research on Coupled Model of the Marine Energy-Economic-Environment System. J. Coast. Res. 2020, 106, 89–92. [Google Scholar] [CrossRef]
- Jiang, Y.; Lei, Y.L.; Liu, J.; Li, L. Examination of the relationship between the exploitation of geothermal sources and regional economies: A Beijing case study. Water Environ. J. 2020, 34, 95–105. [Google Scholar] [CrossRef]
- Liang, K.L.; Zhao, K.J. An Empirical Study on the Relationship between Energy Consumption and Green Economic Development in China: Also on the Influence of Environmental Pollution. J. Shihezi Univ. Philos. Soc. Sci. 2018, 32, 58–64. (In Chinese) [Google Scholar]
- Wang, L.Y.; Chen, H.; Chen, S.Y.; Wang, Y.K. Dynamic Evolution and Empirical Analysis of Coordinated and Coupling Development of Energy-Economy-Environment-Society at Urban Level. J. Beijing Inst. Technol. Soc. Sci. Edit. 2022, 24, 51–64. (In Chinese) [Google Scholar]
- Biswas, J.; Ghosh, D. Socioeconomic constraints of a tropical oxbow lake ecosystem in Ganga river basin and strategies for sustainable development. J. Baoshan Univ. 2016, 2, 4–20. [Google Scholar]
- Keller, T.A. Technological and Economic Sustainability of Coupling Wastewater Algal Treatment and Biogas Production. Boletin Soc. Geol. Mex. 2014, 60, 159–171. [Google Scholar]
- Ding, S.X.; Tan, H.R.; Ge, L.Y.; Ren, H.J. Research on the Coupling of Economic Growth and Environmental Quality Based on Models in Qinghai Province. Ecol. Econ. 2017, 33, 150–154. (In Chinese) [Google Scholar]
- Chen, G.S.; Lu, L.J. Study On Urban Environment And Urban Competitiveness Empirical Of Hunan Province. Econ. Geogr. 2011, 31, 2051–2053. (In Chinese) [Google Scholar]
- Meng, Y. A Study on Coordinate Development of Economy-Energy-Environment(3E) System in Inner Mongolia. Master’s Thesis, Inner Mongolia University of Finance and Economics, Hohhot, China, 2015. (In Chinese). [Google Scholar]
- Lu, J.; Chang, H.; Zhao, S.P.; Xu, C.J. The Evolution of Coupling Relationship Among Energy, Economy and Environment in Shandong Province. Econ. Geogr. 2016, 36, 42–48. (In Chinese) [Google Scholar]
- Wang, Q. Study on coupling Development of Eco-environment and Economy in Hanjiang River Basin in Shaanxi Province. Master’s Thesis, Xi’an University of Technology, Xi’an, China, 2018. (In Chinese). [Google Scholar]
- Wang, Z.B.; Fang, C.L.; Cheng, S.W.; Wang, J. Evolution of coordination degree of eco-economic system and early-warning in the Yangtze River Delta. J. Geogr. Sci. 2013, 23, 147–162. [Google Scholar] [CrossRef]
- Liu, Y.B.; Liu, W.; Yan, Y.N.; Liu, C.Y. A perspective of ecological civilization: Research on the spatial coupling and coordination of the energy-economy-environment system in the Yangtze River Economic Belt. Environ. Monit. Assess. 2022, 194, 403. [Google Scholar] [CrossRef]
- Wang, J.Y.; Wang, S.J.; Li, S.; Feng, K.S. Coupling analysis of urbanization and energy-environment efficiency: Evidence from Guangdong province. Appl. Energy 2019, 254, 113650. [Google Scholar] [CrossRef]
- Amar, A.; Liu, Q.; Wang, H.W. Study on Coupling Coordinative Relationship Between Economic Growth and Ecological Environment of Keriya River Oasis in Xinjiang. Res. Soil Water Conserv. 2015, 22, 264–268. (In Chinese) [Google Scholar]
- Lu, C.; Li, W.; Pang, M.; Xue, B.; Miao, H. Quantifying the Economy-Environment Interactions in Tourism: Case of Gansu Province, China. Sustainability 2018, 10, 711. [Google Scholar] [CrossRef] [Green Version]
- Chen, X.P.; Guo, X.J.; Wang, G.K. The coupling evolution analysis of resource-environment-economic system in the poor areas of Gansu. J. Arid Land Resour. Environ. 2013, 27, 1–8. (In Chinese) [Google Scholar]
- Cheng, X.L.; Zhang, L.Q.; Cheng, H.F. Research on Coordinated Development about Tourism Economy and Ecological Environment in Medium and Small Cities: Chizhou as an Example. Geogr. Inf. Sci. 2013, 29, 102–106. (In Chinese) [Google Scholar]
- Lu, C.Y.; Wang, C.J.; Zhang, Z.L.; Lu, C.P. Coupling relationships of resource consumption, environmental pollution and economic growth in loess plateau region of eastern Gansu Province: A case study of Qingyang City. Chin. J. Ecol. 2015, 34, 2681–2690. (In Chinese) [Google Scholar]
- Jiang, Y. Evaluation of coordinated development between ecological environment and economy in mianyang city. Chin. J. Agric. Res. Reg. Plan. 2017, 38, 131–135. (In Chinese) [Google Scholar]
- Huo, Y. Study on Coupling and Coordinated Development of Ecological Environment-Energy Consumption-Regional Economic Growth in Greater Bay Area around Hangzhou Bay. Math. Probl. Eng. 2022, 2022, 7738240. [Google Scholar] [CrossRef]
- Zheng, B.F.; Zhao, J.Y.; You, D. Study on the coupling relationship between water environment and social economy in Ganjiang River basin. Desalination Water Treat. 2018, 122, 14–19. [Google Scholar] [CrossRef]
- Lu, J.; Chang, H.; Wang, Y.B. Dynamic evolution of provincial energy economy and environment coupling in China’s regions. Chin. Popul. Res. Environ. 2017, 27, 60–68. (In Chinese) [Google Scholar]
- Wang, S.J.; Kong, W.; Ren, L.; Zhi, D.D.; Dai, B.T. Research on misuses and modification of coupling coordination degree model in China. J. Nat. Res. 2021, 36, 793–810. (In Chinese) [Google Scholar] [CrossRef]
- Wang, L.S.; Zhang, F.; Fu, W.; Tan, Q.; Chen, J.C. Analysis of temporal and spatial differences and influencing factors of energy eco-efficiency in energy-rich area of the Yellow River Basin. Phys. Chem. Earth 2021, 121, 102976. [Google Scholar] [CrossRef]
- Lu, C.; Meng, P.; Zhao, X.; Jiang, L.; Zhang, Z.L.; Xue, B. Assessing the Economic-Environmental Efficiency of Energy Consumption and Spatial Patterns in China. Sustainability 2019, 11, 591. [Google Scholar] [CrossRef] [Green Version]
- Hua, X.Y.; Jin, X.R.; Lv, H.P.; Ye, Y.; Shao, Y. Spatial-temporal Pattern Evolution and Influencing Factors of High Quality Development Coupling Coordination: Case on Counties of Zhejiang Province. Sci. Geogr. Sinica 2021, 41, 223–231. (In Chinese) [Google Scholar]
- Rehman, S.A.U.; Cai, Y.P.; Mirjat, N.H.; Walasai, G.D.; Nafees, M. Energy-environment-economy nexus in Pakistan: Lessons from a PAK-TIMES model. Energy Policy 2019, 126, 200–211. [Google Scholar] [CrossRef]
- Luo, F.Z.; Zhang, N.N. Analyst on Spatio-temporal coupling coordination in China’s Inter-provincial energy use-Economic development-Environmental Protection System. Environ. Pollut. Control 2020, 42, 884–889. (In Chinese) [Google Scholar]


| Objective | Criteria | Indicator |
|---|---|---|
| Energy consumption | Overall size | Total energy production |
| Growth rate of energy production | ||
| Total energy consumption | ||
| Increasing rate of energy consumption | ||
| Structure | Proportion of coal in total energy consumption | |
| Proportion of crude oil in total energy consumption | ||
| Proportion of natural gas in total energy consumption | ||
| Proportion of wind power, nuclear power, and other power in energy consumption | ||
| Quality | Energy consumption per unit of gross domestic product (GDP) | |
| Elastic coefficient of energy consumption | ||
| Loss rate of energy processing and conversion | ||
| Energy consumption per capita | ||
| Economic growth | Overall size | GDP |
| Total import and export trade | ||
| Total retail sales of social consumer goods | ||
| Total investment in fixed assets | ||
| Structure | Proportion of added value of secondary industry in GDP | |
| Proportion of added value of tertiary industry in GDP | ||
| Proportion of social fixed asset investment in GDP | ||
| Quality | GDP per capita | |
| Resident consumption level | ||
| Total societal productivity | ||
| Contribution rate of total assets of industrial enterprises | ||
| Proportion of total local fiscal revenue in GDP | ||
| Ecological environment | Pollutant emissions | Sewage emissions |
| Waste gas emissions | ||
| Solid waste emissions | ||
| Pollution treatment | Compliance rate of sewage emissions | |
| Comprehensive utilization rate of solid waste | ||
| Capacity of waste gas treatment facilities | ||
| Output value of “three wastes” comprehensive utilization products | ||
| Proportion of environment governance investment in GDP | ||
| Ecological protection | Proportion of afforestation area in the area under jurisdiction | |
| Control rate of water and soil loss | ||
| Forest coverage | ||
| Proportion of natural reserve area in total area |
| Dysfunctional Recession | Coordinated Development | ||
|---|---|---|---|
| Coordination Degree | Type | Coordination Degree | Type |
| [0,0.1) | Extreme dysfunctional recession | [0.5,0.6) | Minor coordinated development |
| [0.1,0.2) | Severe dysfunctional recession | [0.6,0.7) | Primary coordinated development |
| [0.2,0.3) | Medium dysfunctional recession | [0.7,0.8) | Medium coordinated development |
| [0.3,0.4) | Slight dysfunctional recession | [0.8,0.9) | Well-coordinated development |
| [0.4,0.5) | Minor dysfunctional recession | [0.9,1] | Highly coordinated development |
| Equation Number | Description | Equation Number | Description |
|---|---|---|---|
| 1, 2 | Standardization of indicator values | 7, 8, 9 | Comprehensive index |
| 3 | Scale factor | 10, 11, 12 | Coordination degree |
| 4 | Information entropy | 13 | Global Moran’s I index |
| 5 | Redundancy of the information entropy | 14 | Significance test of Global Moran’s I |
| 6 | Indicator weight | 15 | Local Getis–Ord G* index |
| Province | 2000 | 2005 | 2010 | 2015 | 2019 | Average |
|---|---|---|---|---|---|---|
| Beijing | 0.623 | 0.620 | 0.664 | 0.658 | 0.750 | 0.663 |
| Tianjin | 0.581 | 0.588 | 0.594 | 0.600 | 0.597 | 0.592 |
| Hebei | 0.481 | 0.465 | 0.509 | 0.495 | 0.540 | 0.498 |
| Shanxi | 0.468 | 0.477 | 0.440 | 0.454 | 0.573 | 0.482 |
| Inner Mongolia | 0.434 | 0.488 | 0.529 | 0.545 | 0.525 | 0.504 |
| Liaoning | 0.493 | 0.515 | 0.518 | 0.528 | 0.516 | 0.514 |
| Jilin | 0.507 | 0.467 | 0.489 | 0.486 | 0.508 | 0.492 |
| Heilongjiang | 0.504 | 0.485 | 0.504 | 0.490 | 0.502 | 0.497 |
| Shanghai | 0.633 | 0.614 | 0.627 | 0.665 | 0.670 | 0.642 |
| Jiangsu | 0.573 | 0.591 | 0.622 | 0.624 | 0.640 | 0.610 |
| Zhejiang | 0.556 | 0.590 | 0.614 | 0.628 | 0.651 | 0.608 |
| Anhui | 0.481 | 0.462 | 0.490 | 0.513 | 0.518 | 0.493 |
| Fujian | 0.526 | 0.550 | 0.556 | 0.602 | 0.604 | 0.567 |
| Jiangxi | 0.448 | 0.462 | 0.492 | 0.514 | 0.529 | 0.489 |
| Shandong | 0.547 | 0.554 | 0.636 | 0.580 | 0.590 | 0.581 |
| Henan | 0.455 | 0.476 | 0.515 | 0.515 | 0.561 | 0.504 |
| Hubei | 0.488 | 0.484 | 0.523 | 0.559 | 0.580 | 0.527 |
| Hunan | 0.473 | 0.475 | 0.531 | 0.569 | 0.571 | 0.524 |
| Guangdong | 0.620 | 0.603 | 0.671 | 0.683 | 0.713 | 0.658 |
| Guangxi | 0.551 | 0.552 | 0.518 | 0.565 | 0.544 | 0.546 |
| Hainan | 0.553 | 0.533 | 0.545 | 0.618 | 0.568 | 0.564 |
| Chongqing | 0.517 | 0.533 | 0.577 | 0.598 | 0.606 | 0.566 |
| Sichuan | 0.561 | 0.549 | 0.517 | 0.560 | 0.592 | 0.556 |
| Guizhou | 0.442 | 0.443 | 0.456 | 0.533 | 0.512 | 0.477 |
| Yunnan | 0.502 | 0.506 | 0.506 | 0.538 | 0.525 | 0.515 |
| Shanxi | 0.472 | 0.466 | 0.532 | 0.553 | 0.568 | 0.518 |
| Gansu | 0.426 | 0.432 | 0.423 | 0.507 | 0.498 | 0.457 |
| Qinghai | 0.505 | 0.499 | 0.492 | 0.519 | 0.513 | 0.506 |
| Ningxia | 0.426 | 0.436 | 0.436 | 0.448 | 0.437 | 0.437 |
| Xinjiang | 0.491 | 0.471 | 0.444 | 0.492 | 0.480 | 0.476 |
| Average | 0.511 | 0.513 | 0.532 | 0.555 | 0.566 | 0.535 |
| Year | Moran’s I | Z | P |
|---|---|---|---|
| 2000 | 0.23700 | 3.61602 | 0.00029 |
| 2005 | 0.24969 | 3.79100 | 0.00015 |
| 2010 | 0.24446 | 3.70517 | 0.00021 |
| 2015 | 0.21186 | 3.27822 | 0.00104 |
| 2019 | 0.24091 | 3.66335 | 0.00024 |
Publisher’s Note: MDPI stays neutral with regard to jurisdictional claims in published maps and institutional affiliations. |
© 2022 by the authors. Licensee MDPI, Basel, Switzerland. This article is an open access article distributed under the terms and conditions of the Creative Commons Attribution (CC BY) license (https://creativecommons.org/licenses/by/4.0/).
Share and Cite
Lu, C.; Liu, X.; Zhang, T.; Huang, P.; Tang, X.; Wang, Y. Comprehensive Measurement of the Coordinated Development of China’s Economic Growth, Energy Consumption, and Environmental Conservation. Energies 2022, 15, 6149. https://doi.org/10.3390/en15176149
Lu C, Liu X, Zhang T, Huang P, Tang X, Wang Y. Comprehensive Measurement of the Coordinated Development of China’s Economic Growth, Energy Consumption, and Environmental Conservation. Energies. 2022; 15(17):6149. https://doi.org/10.3390/en15176149
Chicago/Turabian StyleLu, Chenyu, Xiaowan Liu, Tong Zhang, Ping Huang, Xianglong Tang, and Yueju Wang. 2022. "Comprehensive Measurement of the Coordinated Development of China’s Economic Growth, Energy Consumption, and Environmental Conservation" Energies 15, no. 17: 6149. https://doi.org/10.3390/en15176149
APA StyleLu, C., Liu, X., Zhang, T., Huang, P., Tang, X., & Wang, Y. (2022). Comprehensive Measurement of the Coordinated Development of China’s Economic Growth, Energy Consumption, and Environmental Conservation. Energies, 15(17), 6149. https://doi.org/10.3390/en15176149