Article

Environmental and Energy Conditions in Sustainable Regional Development

1
Faculty of Economics and Management, Opole University of Technology, 45-036 Opole, Poland
2
Faculty of Economics, University of Economics in Katowice, 40-287 Katowice, Poland
*
Author to whom correspondence should be addressed.
Energies 2022, 15(15), 5758; https://doi.org/10.3390/en15155758
Submission received: 27 June 2022 / Revised: 30 July 2022 / Accepted: 4 August 2022 / Published: 8 August 2022
(This article belongs to the Special Issue Sustainable Development, Energy Economics and Economic Analysis)

Abstract

:
Climate change is taking place on a global scale and it is substantially affected by human activity, including increasing greenhouse gas emissions. One of the thematic objectives of EU’s new financial objective is a more environmentally friendly low-emission Europe that promotes clean and fair energy transformation, green investments, and a circular economy, among others. The Polish economy is mainly based on energy production from conventional sources (fossil fuels). Considering that the demand for electricity in Poland is predicted to increase by as much as 50% until 2040, it is necessary to take action aimed at increasing the share of renewable energy sources. The subject of analysis is the Opolskie Voivodeship (a NUTS 2 type region), the capital of which features the biggest Polish coal power plant. In 2014–2019, it was expanded by two units with 1800 MW in total capacity, thereby indicating that investments in energy obtained from conventional sources are still implemented and to a large extent at that (the expansion has been the biggest infrastructural investment in Poland since 1989). The Opolskie region is characterised by substantial excess in acceptable environmental burden (dust pollution, among others). The aim of the paper is to evaluate the key environmental conditions for the Opolskie region’s development in terms of the assumptions of the domestic and EU energy policies. The Opolskie region’s developmental challenges in the environmental area were determined on the basis of selected indicator estimations up to 2030. The research hypothesis assumes that the environmental conditions for the Opolskie region’s development are unfavourable. The methodological part features an analysis of the cause and effect dependencies in the “environment” area, which enabled an assessment of the Opolskie Voivodeship’s current situation as well as an analysis of the dependencies relevant to the region’s development. This was followed by an estimation of selected indicators in the “environment” area until 2030, which allowed for an assessment of their probable levels and thereby a specification of the region’s development conditions. The estimation was conducted using the data available in public statistics, i.e., Statistics Poland’s data. The indicators estimated for 2030 were presented using three forecasting methods: (a) the monotonic trend, (b) the yearly average change rate, and (c) the logarithmic trend.

1. Introduction

It is true that global climate changes are substantially affected by human activity, mainly by increasing the emission of greenhouse gases into the atmosphere [1,2]. The atmosphere warming process is accelerating could lead to a deterioration in living conditions as well as global economic and social losses in the future [3].
Due to the fact that the world is undergoing increasing urbanisation and that the population is ageing, it is predicted that nearly 70% of people will be living in cities in 2050 [4]. The excessive dependency of the contemporary economy on non-renewable energy sources, i.e., the so-called carbon economy, works mainly for the needs of 56% of the global population concentrated in urban areas [5,6]. The current primary energy consumption in urban areas constitutes two thirds of the entire consumption according to the International Energy Agency, which corresponds to 71% of direct energy-related GHGs [7,8]. It is known however that the introduction of an alternative urban model, the objective of which would be to reduce resource consumption, could contribute to a 50% improvement in global efficiency [9].
The negative impact of the ecological footprint and a consumer lifestyle that translates into the quantity of wastes and pollutants constitute compelling reasons for taking radical steps for sustainable development. Sustainable development can be viewed as the satisfaction of current needs without endangering the ability of future generations to satisfy their needs [10].
The purpose of the paper is to evaluate the key environmental conditions for the region’s development in terms of the assumptions of the domestic and EU energy policies. The detailed analysis concerns the Opolskie Voivodeship (Poland, NUTS 2 type region). The region’s developmental challenges in the environmental area were determined on the basis of selected indicator estimations up to 2030. The research hypothesis assumes that the environmental conditions for the Opolskie region’s development are unfavourable considering the current challenges related to sustainable development, especially those related to a zero-emissions goal within the next few decades.
The power industry is one of the industries specific to the Opole region, as the biggest Polish power plant is located in this region. It is a coal power plant, the production of which is based mainly on traditional energy sources. This hypothesis is controversial for many stakeholders of the Opole region’s development. Despite the general awareness about coal shortages and the need to take action towards energy transition in EU states, the power plant based in the Opolskie Voivodeship was expanded with a high expenditure of financial resources. The impact of the investment’s shutdown planned in a longer term on the region’s development is however not up for discussion. Many strategic documents emphasise the environmental conditions for regional development; however, no real action is taken towards a zero-emission economy, which is substantially affected by the national policy.
The conducted research demonstrates the importance of environmental and energy factors that affect regional sustainable development. An analysis of the region’s strategic documents and expenditure of funds from the Opolskie Voivodeship Regional Operational Programme 2007–2013 and 2014–2020 demonstrates a substantial change in the approach towards designating developmental objectives to implement the concept of sustainable development in the Opolskie Voivodeship. Economy, transport, and natural environment are the fields in which a substantial increase in expenditure on activities with environmental objectives was noted. Unfortunately, many of the environmental and energy factors up to 2030 analysed in the paper have a tendency to face further negative effects. This may point to the fact that action is indeed taken, but it is apparently insufficient to achieve the objectives of sustainable development.

1.1. Literature Review

Regional development can be viewed as a systematic improvement in the competitiveness of entities and living standards of residents, and as an increase in regional economic potential that results in the given country’s social and economic growth [11,12].
The origins of the sustainable development concept can be traced back to 1713, when it referred to the sustainable development of forestry [13]. The sustainable development concept bloomed in the 1980s. Its authors are believed to be Pearce D.W., Barbier E.W., and Markandya A. [14]. However, the concept itself is slightly blurred and can be interpreted in many ways [15].
Sustainable development as a concept of development policy defines the process of changing the states of dynamic balance between regional social, economic, as well as environmental and spatial development [12]. The economy, energy, and the environment (3E) are inextricably linked [16]. Therefore, the relationship between economic development and climate change needs to be analysed [17].
The conducted research demonstrates that a sufficient level of sustainable development in the given country is affected by factors such as: greater emphasis on knowledge and economy [18], climate protection [19], or the use of smart systems in technology [20].
The United Nations specified 17 Sustainable Development Goals that are to be achieved by 2030 [21,22]. It is one of many sustainable development measures for both urban and rural areas. The signing of the Charter of European Cities toward Sustainability (Aalborg Charter) was important for urban sustainable development as it constituted an obligation to implement 21 initiatives [23]. Agenda 21 [24] introduced indicators which assessed sustainability around the world. In terms of urban areas, these measures are focused on urban strategies and policies of particular states and local governments [25]. However, there is no clear approach to measuring sustainable development in the urban environment [25,26].
“A policy framework for climate and energy in the period from 2020 to 2030” [27] was introduced in October 2014 to specify, among others, a reduction in CO2 emission by 40% compared to 1990, a 27% RES share in the total energy consumption, and a 32.5% energy efficiency increase [28]. It is also worth mentioning that the Paris Agreement goal of limiting global warming to 1.5 degrees Celsius [29]. This agreement also gave rise to viewing climatic hazards as a global issue, which was displayed during subsequent climate summits, including the last one in Glasgow in 2021. However, during the last summit—despite retaining the objective to limit the increase in temperature to 1.5 °C—it was not possible to make a clear decision to cease using coal but instead to gradually limit its use.
Unfortunately, the action taken does not effectively affect climate change because the global temperatures are increasing and extreme weather phenomena are becoming more common [30]. It is also becoming more common to state that the new scenarios of slow global temperature increases up to 2100 are out of date because the changes are taking place much more quickly than originally predicted [31]. This will have dramatic consequences for human [32] health and life, biodiversity, and the economy.
The percentage of global investments in renewable energy is decreasing and it might have increased in the last 2 years (during the COVID-19 pandemic), which presents a great concern for achieving the global SDGs [33].
The objectives mentioned above are some of the most ambitious agendas aimed at common objectives on an international stage. They are however subject to wide criticism, while the global COVID-19 pandemic and the geopolitical situation in Europe has extremely limited the feasibility and implementation of all objectives for the good of future generations [34,35].
The new EU financial perspective 2021–2027 is focusing on five main subject goals, the second of which is the CP2, a more environmentally friendly low-emission goal across Europe thanks to the promotion of a clean and fair energy industry transformation, green and blue investments, circular economy, climate change adaptation, as well as risk prevention and management.
Agriculture is also subject to a series of EU and member state policies aimed, among others, at adapting to the ongoing climate changes [36], reducing greenhouse gas emission, improving environmental protection, and supporting biodiversity [37]. The EU’s “Farm to Fork” and “Biodiversity” strategies specify a series of actions aimed at achieving environmental and health objectives, especially including objectives which lead to an increase in the scale of alternative agriculture in the EU.
Climate changes substantially affect agriculture as one of the more vulnerable sectors. Many authors highlight the need to identify which sub-national areas are the most vulnerable to climate change and require intervention and support [38,39].
The industrial sector operating in the global economy is extremely important for sustainable development [40]. It can be the driving force for various low-emission initiatives [41]. The most important aspect is to solve the issue of sustainable industrialisation [42] by reducing greenhouse gas emissions and becoming independent from fossil fuels. It is possible to use various tools for this purpose, e.g., green certificates [43], coal tax [44], or imposed standards.
The sustainable development concept implemented at the regional level should in parallel improve the exploitation of emerging opportunities and facilitate problem solving. In practical terms, this means ensuring a balance between economic growth and social needs in the broad sense, as well as preserving and improving the natural environment (including the landscape [45]), supported by good regional planning governance, i.e., [46,47]. A large number of authors emphasise the crucial importance of persistent but also innovation-prone governance systems for implementing a comprehensive approach towards the sustainable development of regions and their local structures [48,49,50,51,52]. In addition to shared typical development problems (i.e., poor infrastructure, weak human and social capital, low entrepreneurship, economic peripherality, weakness of the public sector and region’s institutionalisation), some specific features for the regions can be found, which determine the type and direction of the development policy response required. Sustainable regional development involves the integration of sustainable development principles into regional development practices, encompassing all instruments and potential interventions that promote sustainable development within regional socio-economic activities and initiatives, i.e., [53,54,55,56].
Various initiatives that radically reduce the pressure on the regional environment are also part of the concept of sustainable regional development, such as the notion of energy autarky [57,58]. Such solutions could be an interesting challenge for regions dominated by traditional energy production, as sustainable regional development based on the transformation of the energy subsystem is sought [59]. It is conceptualized as a situation in which the energy services used for sustaining local consumption, local production, and the export of goods and services are derived predominantly from locally renewable energy resources [60].

1.2. Poland

The Polish economy relies on energy production from conventional sources based on fossil fuels, which translates into high costs of production in terms of funds and the environment. However, there are studies that demonstrate the relation between the real GDP, renewable and non-renewable energy consumption, real gross fixed capital formation, and the labour force [61]. They are becoming a compelling point in favour of introducing a greater range of renewable energy to energy production. In Poland, the share of high-emission energy sources fluctuated in the last decade by around 80% [28], which is an important circumstance for implementing measures aimed at increasing the RES share.
We are currently witnessing a transformation in the Polish energy industry, resulting from market needs and directions specified by the EU policy on climate and energy. A good example is the “Mój Prąd” [My Power] programme which substantially increases the number of prosumers and micro-systems in Poland [62].
The demand for electricity in Poland is predicted to increase until 2040 by as much as 50% to 240 TWh [63]. In a relatively short time frame, i.e., until 2032, approximately 12 GW of Polish production capacity will be decommissioned and replaced with energy derived from other sources, including wind sources, among others [64]. The issue of emission reduction is one of the key problems of the Polish energy sector [65].
Despite increasing its performance, Polish agriculture is currently facing a certain “ceiling” in terms of the applied technologies, which limits further greenhouse gas emission reduction. The use of a system of incentives that can motivate various entities in the agricultural sector to invest in new technologies and implement more effective production practices favourable to the environment and greenhouse gas emission reduction is considered as one of the currently required measures [3].
On 14 February 2017, the Polish government adopted the new mid-term country development strategy: “Strategy for Sustainable Development” [66], and in September 2019 adopted the “National Strategy for Regional Development 2030” [67], which are the most important strategic documents for the country’s development and feature references to the need of implementing environmental and climate-related measures.
In January 2021, the Polish Government adopted the “Energy Policy of Poland until 2040”, which attempts to find a compromise between the Green Deal’s requirements and the expectations of the stakeholders related to conventional energy production. This document features estimations according to which the scale of energy investment expenditure can reach PLN 1600 billion in 2021–2040, while PLN 260 billion will be allocated until 2030 for domestic energy and climate transformation from EU and domestic funds. According to the government’s declarations, the share of coal in the energy mix will be reduced to 11% in 2040 despite the fact that the document itself specifies that the share of coal in electricity production will amount to 56%, while the RES share will be 23% in 2030 [68,69]. The energy policy in Poland is definitely leaning towards conventional energy sources by mainly strengthening the role of coal-based energy production [69].
The EU and national strategic documents emphasise the fact that the optimal use of the natural environment, among others, will be a challenge for all Polish regions starting from 2021. In this regard, an important aspect is the role of regional and local authorities, as they take care of improving energy security and preserving environmental values in their areas. The role of the local community also indicates that environmental awareness is increasing.

1.3. Opolskie Voivodeship

The Opolskie Voivodeship, which is the subject of the following analysis, is the smallest voivodeship in Poland (among 16 voivodeships) with a centrally located capital. In terms of national and European space, its location is appealing. The A4 motorway runs through it. A network of national roads provides good access to all district urban centres in the voivodeship. The road network is complemented with a dense railway network [70].
The region is rich thanks to the highest-value agricultural production space which favours high agricultural productivity. The voivodeship is also rich in mineral resources, e.g., limestone deposits [71].
The Opolskie Voivodeship is characterised by extremely unfavourable demographic phenomena, mainly due to the long-term constant external migration and adverse fertility rate. The population decline concerns all Polish regions but it is more clear, noticeable, and progressive in the Opolskie Voivodeship. Over the next several dozen years, the Opolskie Voivodeship will become the oldest region in Poland demographically [72]. The unfavourable demographic changes also affect the availability of labour resources. The share of people in the mobile and non-mobile age in the total working-age population in the Opolskie Voivodeship will amount to 26% and 35% in 2040 and 25.5% and 30% in 2050, respectively. This is an effect of the ageing society but also of the increasing number of older workers.
The negative demographic trends can be counteracted, among others, by opening the labour market for migrants (mainly from Ukraine) [73,74,75], supporting entrepreneurship and innovation [76,77,78,79,80], or attracting and maintaining students in the region [81,82].
It must be noted that the Opolskie Voivodeship experienced a student number decline in Opole’s (voivodeship capital’s) ranking of academic centres and suffered adverse medical care trends following the insufficient numbers of doctors and discrepancies between the medical personnel profile and the ageing processes [83].
The Opolskie Voivodeship’s environmental resources that stimulate economic and social development include, among others, energy potential, water resources, atmospheric air, climatic conditions, and biological diversity.
The environmental protection requirements constitute one of the development conditions, wherein global climate changes and the increasing pressure deriving from economic and social development emphasise the importance of regional policy in managing environmental resources. The Opolskie Voivodeship reports excessive values in the acceptable environmental load; therefore, a reduction in dust pollutants constitutes a key development condition.
One of the coal power plants constituting an important element of the country’s power grid is located in Opole. In 2014–2019, the power plant was expanded by units 5 and 6 with 1800 MW in total capacity. This has been the biggest infrastructural investment in Poland since 1989. The modernisation contributed to the satisfaction of 8% of Poland’s demand for energy and its cost amounted to approx. PLN 12 billion. Both units are powered by black coal and their annual coal consumption will amount to approx. 4 million tons of coal derived from the Upper Silesia region [84,85].
The Opolskie region has high energy potential for developing RES, especially wind power plants or photovoltaic systems. However, renewable energy sources satisfy only a small part of the voivodeship’s energy needs. A gradual increase in the share of RES energy in the energy economy through the development of electricity and heat generation using renewable sources, including RES, both in the industry and in the household sector, will be a key condition.
The impact of the environment on territorial development is obvious and proven [86]. Regions that are small and weak in terms of the available resources and potential should seek various opportunities to improve their economic and social situation [87,88]. Taking note of environmental factors can improve the region’s appeal in terms of investments or inhabitancy and can substantially contribute to an improvement in the region’s economic and social situation. This is exactly the case for the Opolskie region.

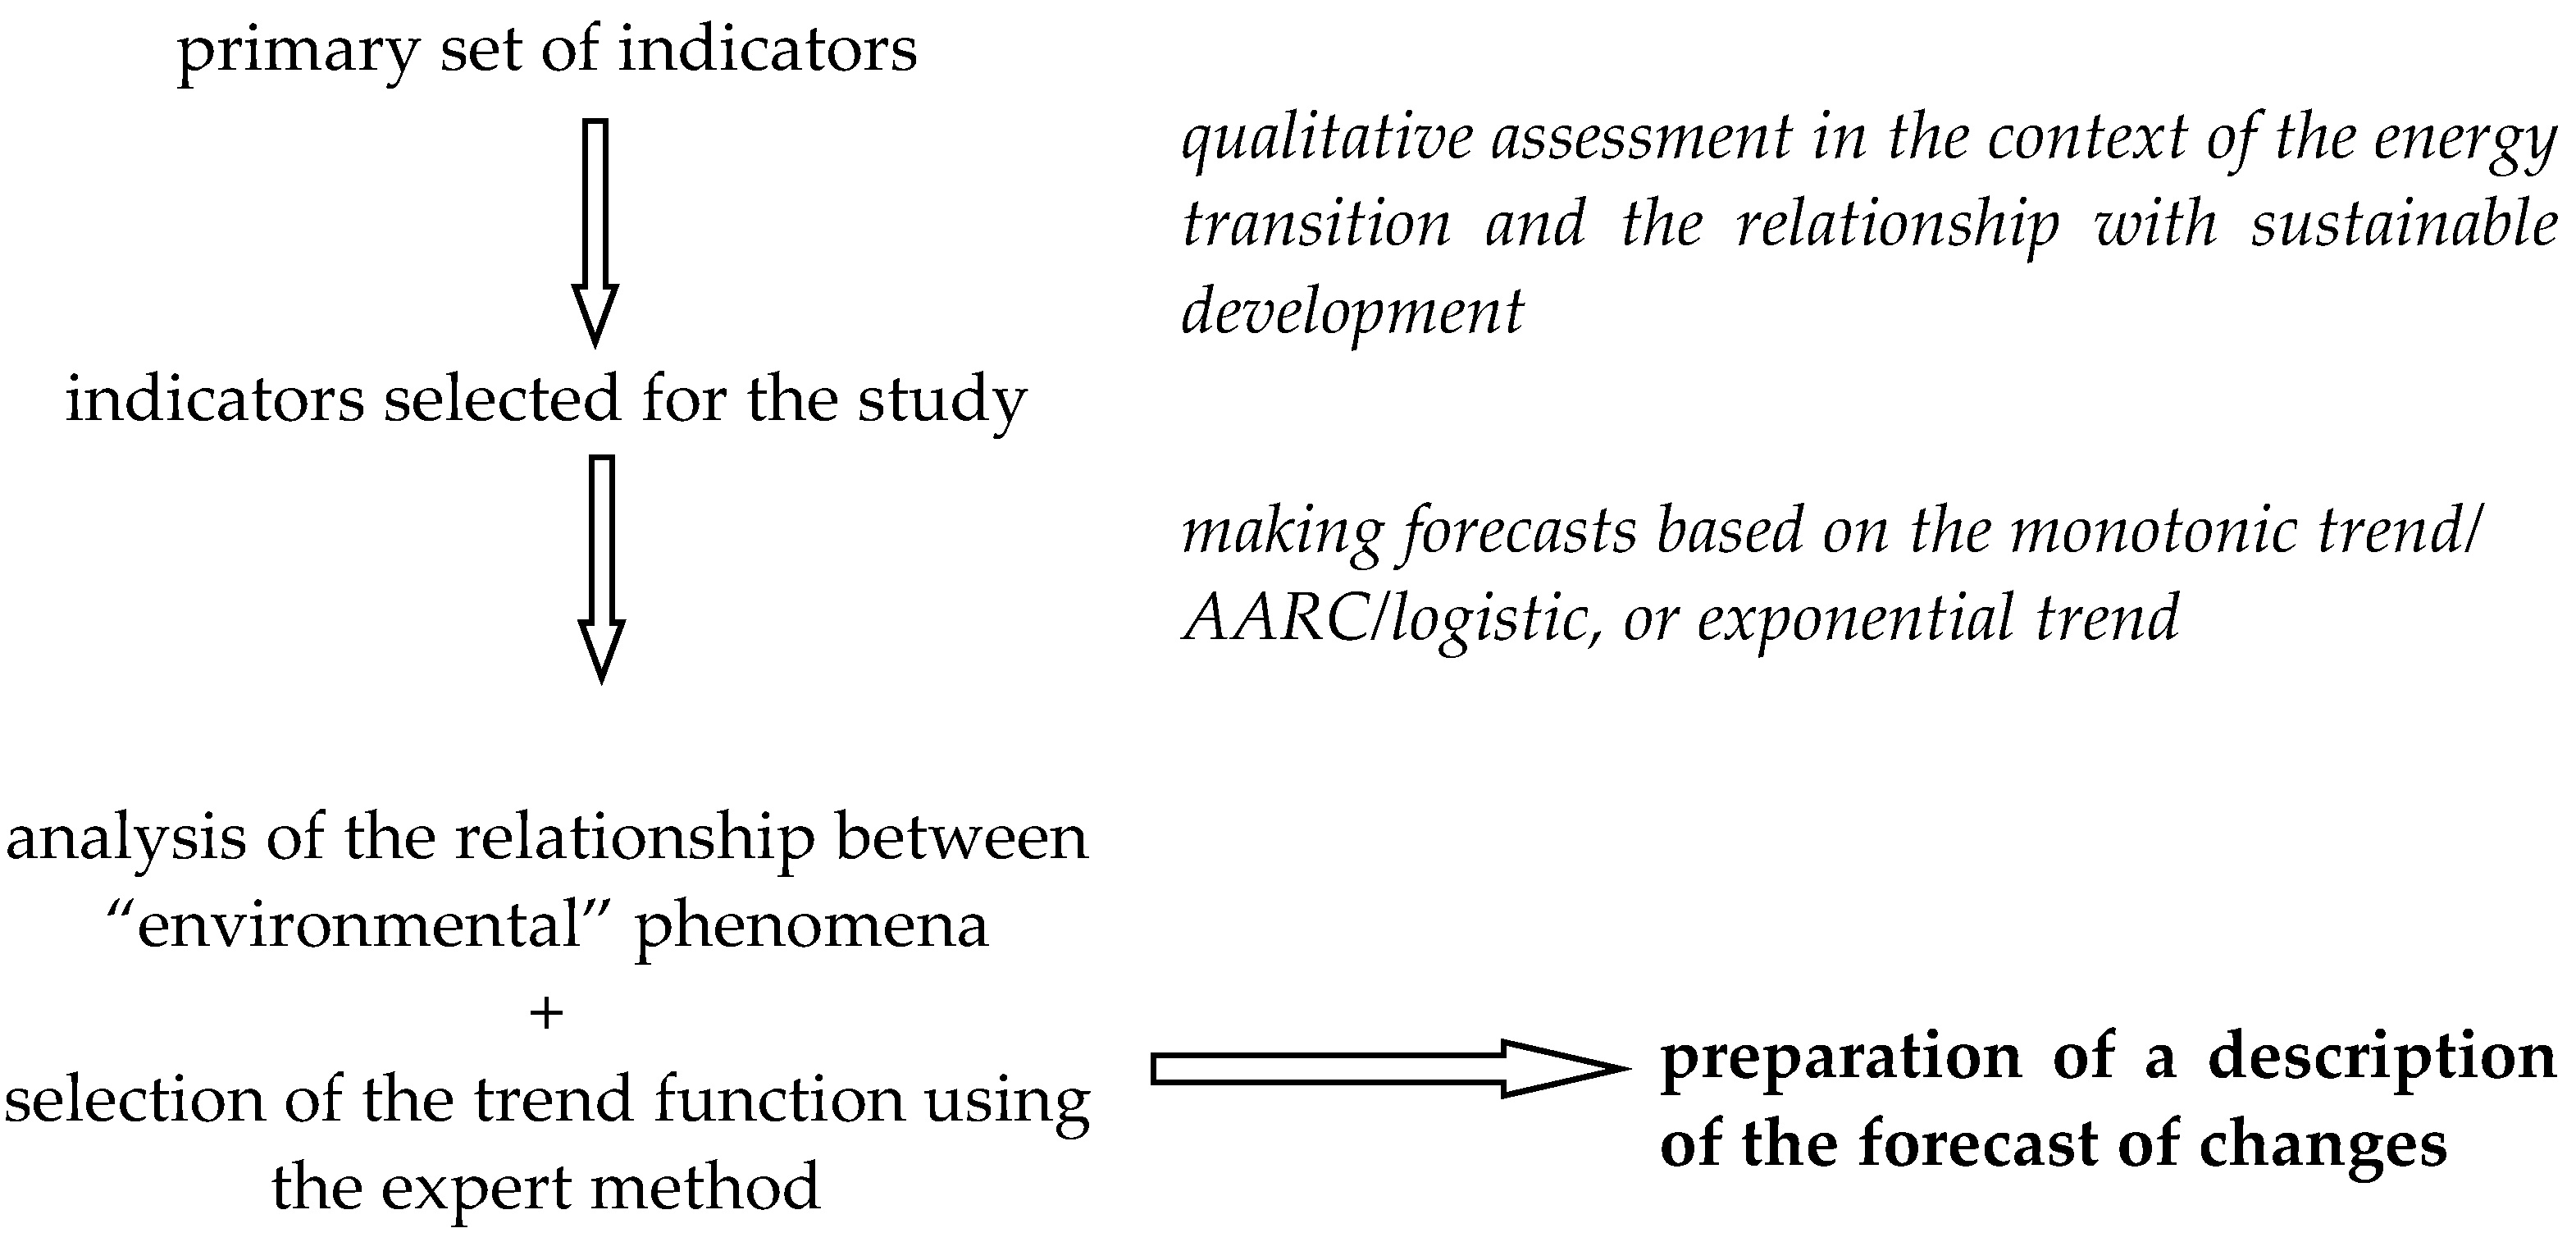
2. Materials and Methods

The purpose of the paper is to evaluate the key environmental conditions for the region’s development in terms of the assumptions of the domestic and EU energy policies. The detailed analysis concerns the Opolskie Voivodeship (Poland, NUTS 2 type region). The region’s developmental challenges in the environmental area were determined on the basis of selected indicator estimations by 2030. The research hypothesis assumes that the environmental conditions for the Opolskie region’s development are unfavourable considering the current challenges related to sustainable development, especially those related to striving for zero emissions within the next few decades.
The first stage of the study was to analyse compact publications as well as EU, national, and regional strategic documents. The literature analysis served as the basis for distinguishing the factors that affect the “environment” area in the Opolskie region’s development.
The methodological part features an analysis of the cause and effect dependencies in the “environment” areas, which allowed an assessment of the Opolskie Voivodeship’s current situation to be conducted, as well as an analysis of the dependencies relevant for the region’s development. Then, the values of selected indicators in the “environment” area until 2030 were estimated, which allowed an assessment of their probable levels to be formulated, thereby specifying the region’s development conditions.
The estimation was conducted using the data available in public statistics, i.e., Statistics Poland’s data.
The indicators were selected in the context of the possibility of using them to describe two important issues from the point of view of the research goals adopted in the paper, i.e., sustainable development and the conditions of energy transformation. Each time, the relationship of the indicator with these areas was analyzed by assessing the direction of impact (positive/neutral/negative) and its weight (decisive/medium/low). In addition, correlation relationships between the indicators acted as the basis for a reduction in variables. As a result, eighteen of the nearly eighty potential indicators were selected. The indicators were then ordered to define their place in the transformation–development matrix, obtaining their bundles. The indicators from the bundle were therefore characterized by a similar qualitative characteristic to the discussed dimensions of the matrix, although their impact strength differed. The latter was presented by changing the font, i.e., the weight of the relationship described as decisive was marked with bold, while the low weight was marked with italics. An unchanged font signified a medium weight. Each factors was assessed as a stimulant (S) or a de-stimulant (D) for development, with consideration of whether the given indicator was representative of the Opolskie Voivodeship’s energy transition conditions and regional sustainable development.
An estimation of the indicator values for 2030 is presented using three forecasting methods: (a) the monotonic trend, (b) the yearly average change rate, and (c) the logarithmic trend. The forecasting methods complement each other as each one is based on slightly different mathematic assumptions related to the prediction of specific future processes or events (short vs. long periods, linear functions vs. other approaches).
The monotonic trend has the following form:
y = ax + b,
y = ax + b (where a is the slope (S) and b is the interceptor (I)). The calculations were conducted using the Kendall operation’s Theil–Sen (TS) operation in the IDRISI Taiga program. x is the next period for which the function was designated [89].
The average annual rate of change (AARC) has the following form:
y = a + (a * b/100),
where a is data from the preceding period and b is calculated acc. to the formula for the medium-period change rate (MPCR), i.e.,
b = ((d/c^(1/e) − 1) * 100,
where c is data from the first year of analysis, d is data from the last year of analysis, and e is the number of periods between the first and last year of analysis minus 1.
The logarithmic trend has the following form:
y = a * ln(x) + b,
and the exponential trend is:
y = a * e^b * (x)
where a and b are the trend coefficients estimated in the Excel program, and x is the next period for which the function was designated.
The advantage of the monolithic trend analysis is the relatively short time period of available numerical data and the avoidance of a need to provide econometric modelling of the relations between the variables that clarify the analysed indicator with the simultaneous maintenance of good parameters of the forecasts made. The yearly average rate can be used for short periods to which the trend analysis cannot be applied. On the other hand, the logarithmic trend analysis allows forecasting based on linear functions to be deviated from (if it is required, i.e., it is more appropriate for the data).
The application of these three separate but complementary approaches in the indicator value estimation process allowed:
  • forecast accuracy and high precision to be maximised thanks to mutual verification;
  • issues in relation to insufficient data required for making forecasts to be overcome;
  • time restrictions for which numerical data are available to be overcome.
The identification and selection of the most probable change trends were carried out using the expert method.
The research procedure can be explained by the following graph (Figure 1).

3. Results

3.1. Analysis of the Cause and Effect Dependencies

The cause and effect dependencies analysis was a multi-faceted study. The first stage featured an analysis of the conclusions derived from the report titled “Opolskie Voivodeship—condition and developmental trends. Report for 2008–2016” 40 [83], while the second stage featured an expert’s identification of the phenomena affecting its development, not included in the report. As result of the steps taken, following factors in relation to the “environment” area were shown to be key for the development of the Opolskie Voivodeship.
1.
An increase in the quantity of municipal waste collected, including sorted waste collected.
2.
No air quality improvement in relation to the PM10 and PM2.5 dust content as well as benzo(a)pyrene content in PM10 dust, despite a drop in gas and dust pollutant emissions, particularly in relation to troublesome plants.
3.
A low share of people using green energy carriers despite an increasing share of RES in electricity consumption.
4.
A spatially differentiated increase in people using the sewage system (an increase was recorded only in four powiats).
5.
An increase in people using a water supply system.
6.
A low share of people using a gas supply system, despite a small increase, a low share of people connected to gas supply networks, and limited access to gas fuel in case of larger numbers of people living in the country.
7.
No radical improvement in the surface water purity. An increase in water consumption for national economy purposes, especially for agriculture.
8.
A decreased surface area of devastated and degraded land, as well as a decreased scale of agricultural and forest land excluded for non-agricultural and non-forest purposes.
9.
A slight increase in legally protected areas of special natural value.
10.
An increase in surface area subject to local spatial development plans.
11.
A decreased share of the urban population. A decreasing number of inhabitants in the region’s medium and large cities and a decreasing share in the regional network of urban centres.
12.
An increased density of public roads with improved and hardened pavements.
13.
A decreased density of utilised railway lines.
An analysis of the relationships between particular phenomena is presented in Table 1. In Table 2 digits 1 to 13 were used to designate phenomena according to the aforementioned numbering, and the numerical scale was used to designate the relationship strength between particular variables: 0 is no relationship; 1 is the presence of a relationship; and 2 is a strong relationship. The total score in column Y is the impact and strength of relationships between particular phenomena. On the other hand, the total score in column X is the strength of the conditioning of particular phenomena 1–13 and the number of factors affecting them.
The analysis of relations demonstrates that the Opolskie Voivodeship’s key issues in the “environment” area are the environmental strains on pollutant emission and air quality, waste production and management, sewage production, water intake, purity, and retention. Their most important causes and effects are illustrated using the “issue tree” graph (Figure 2).

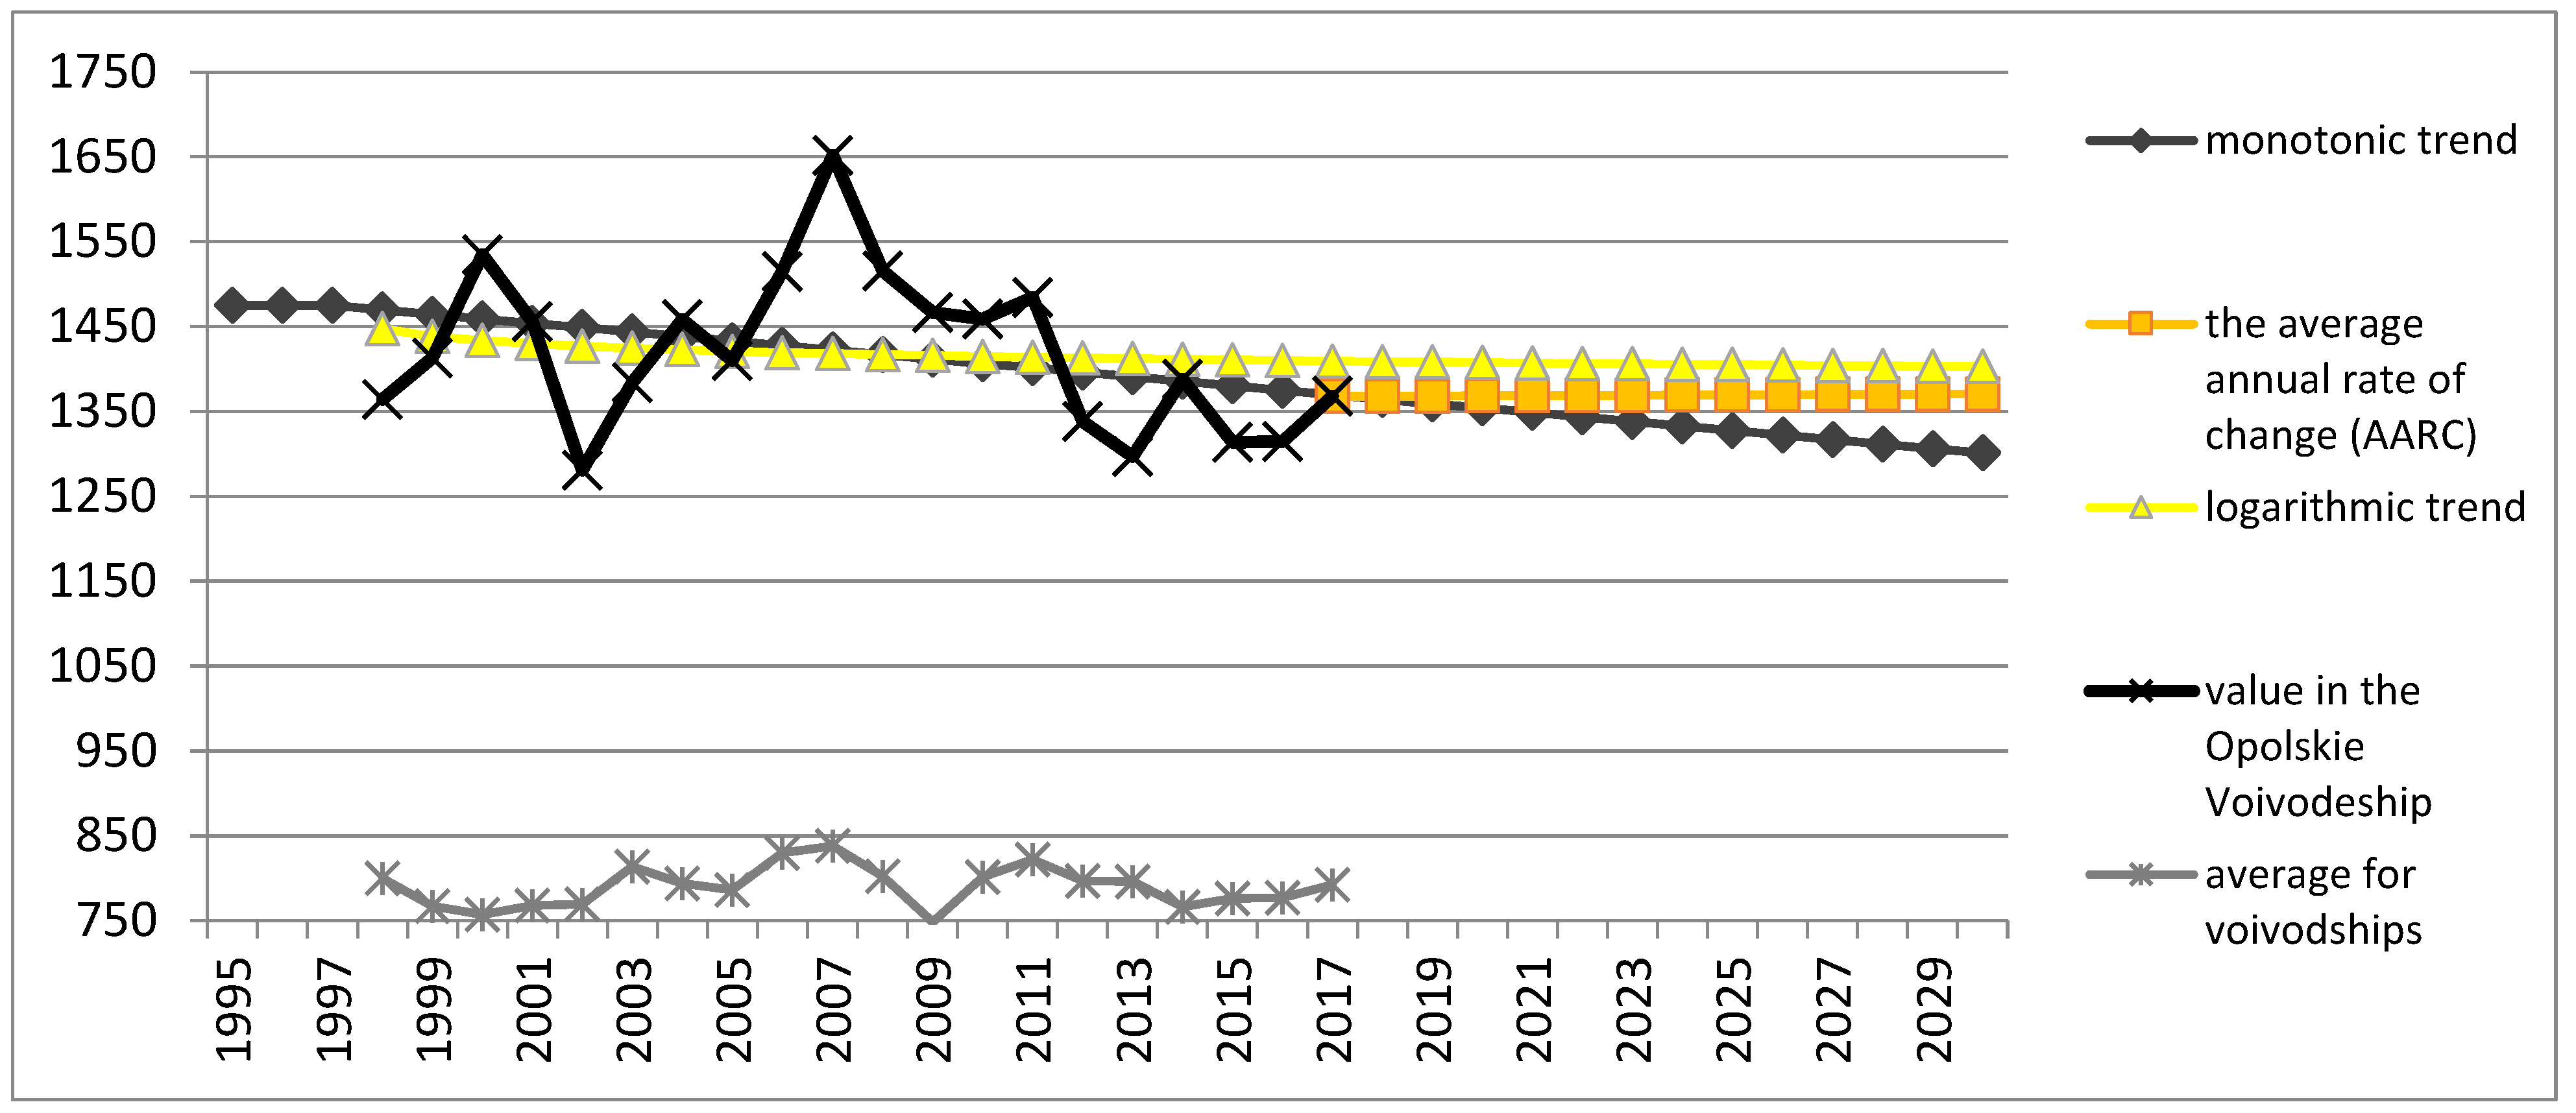
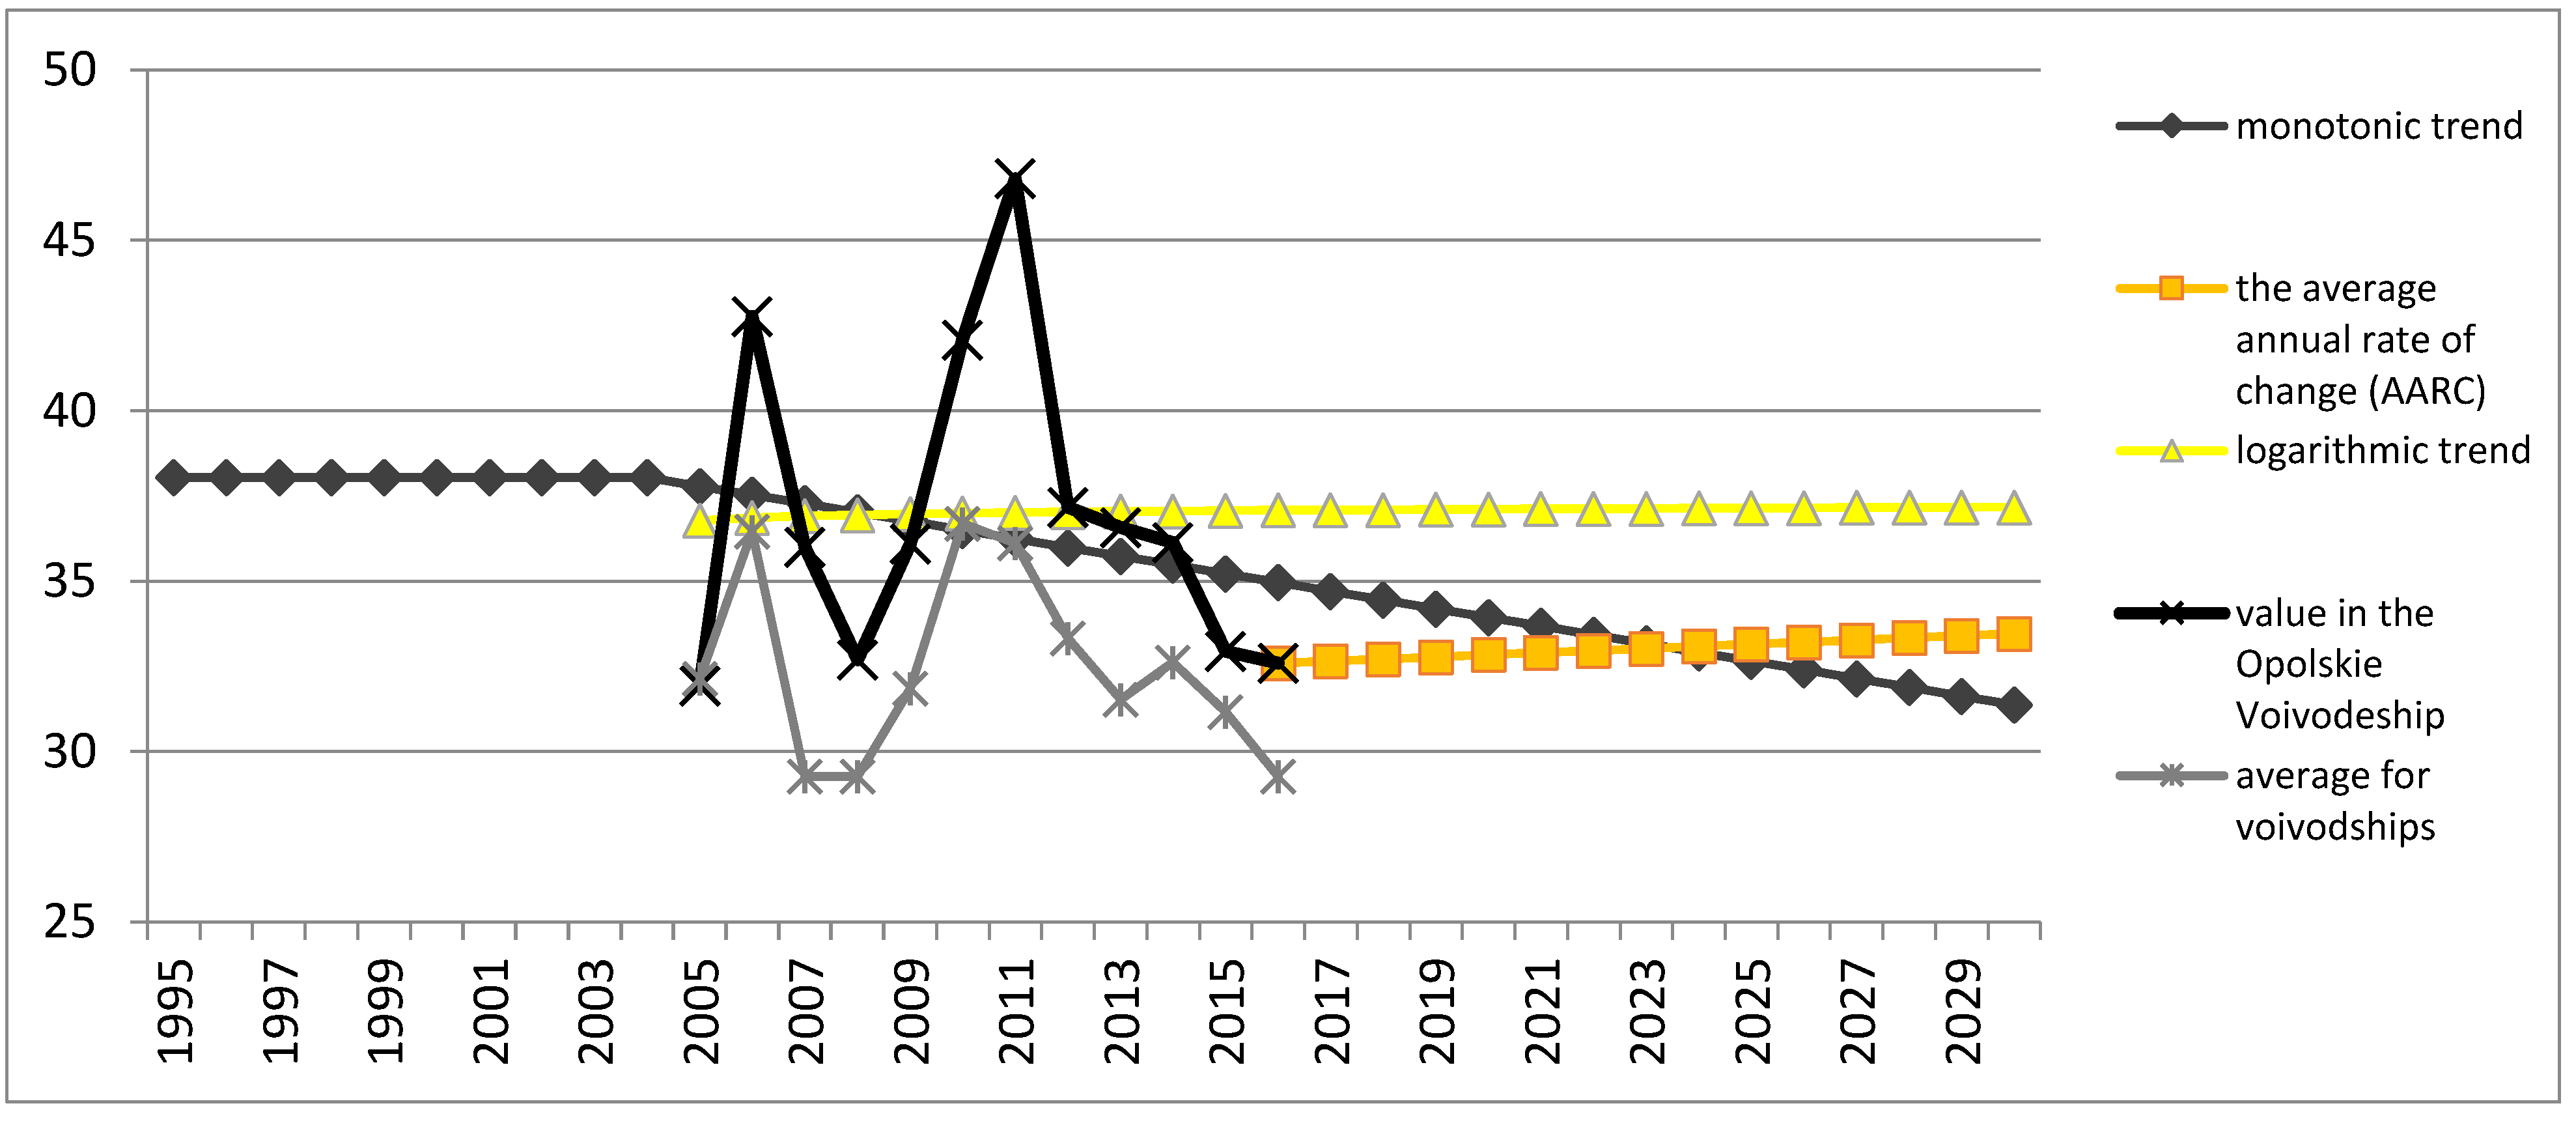
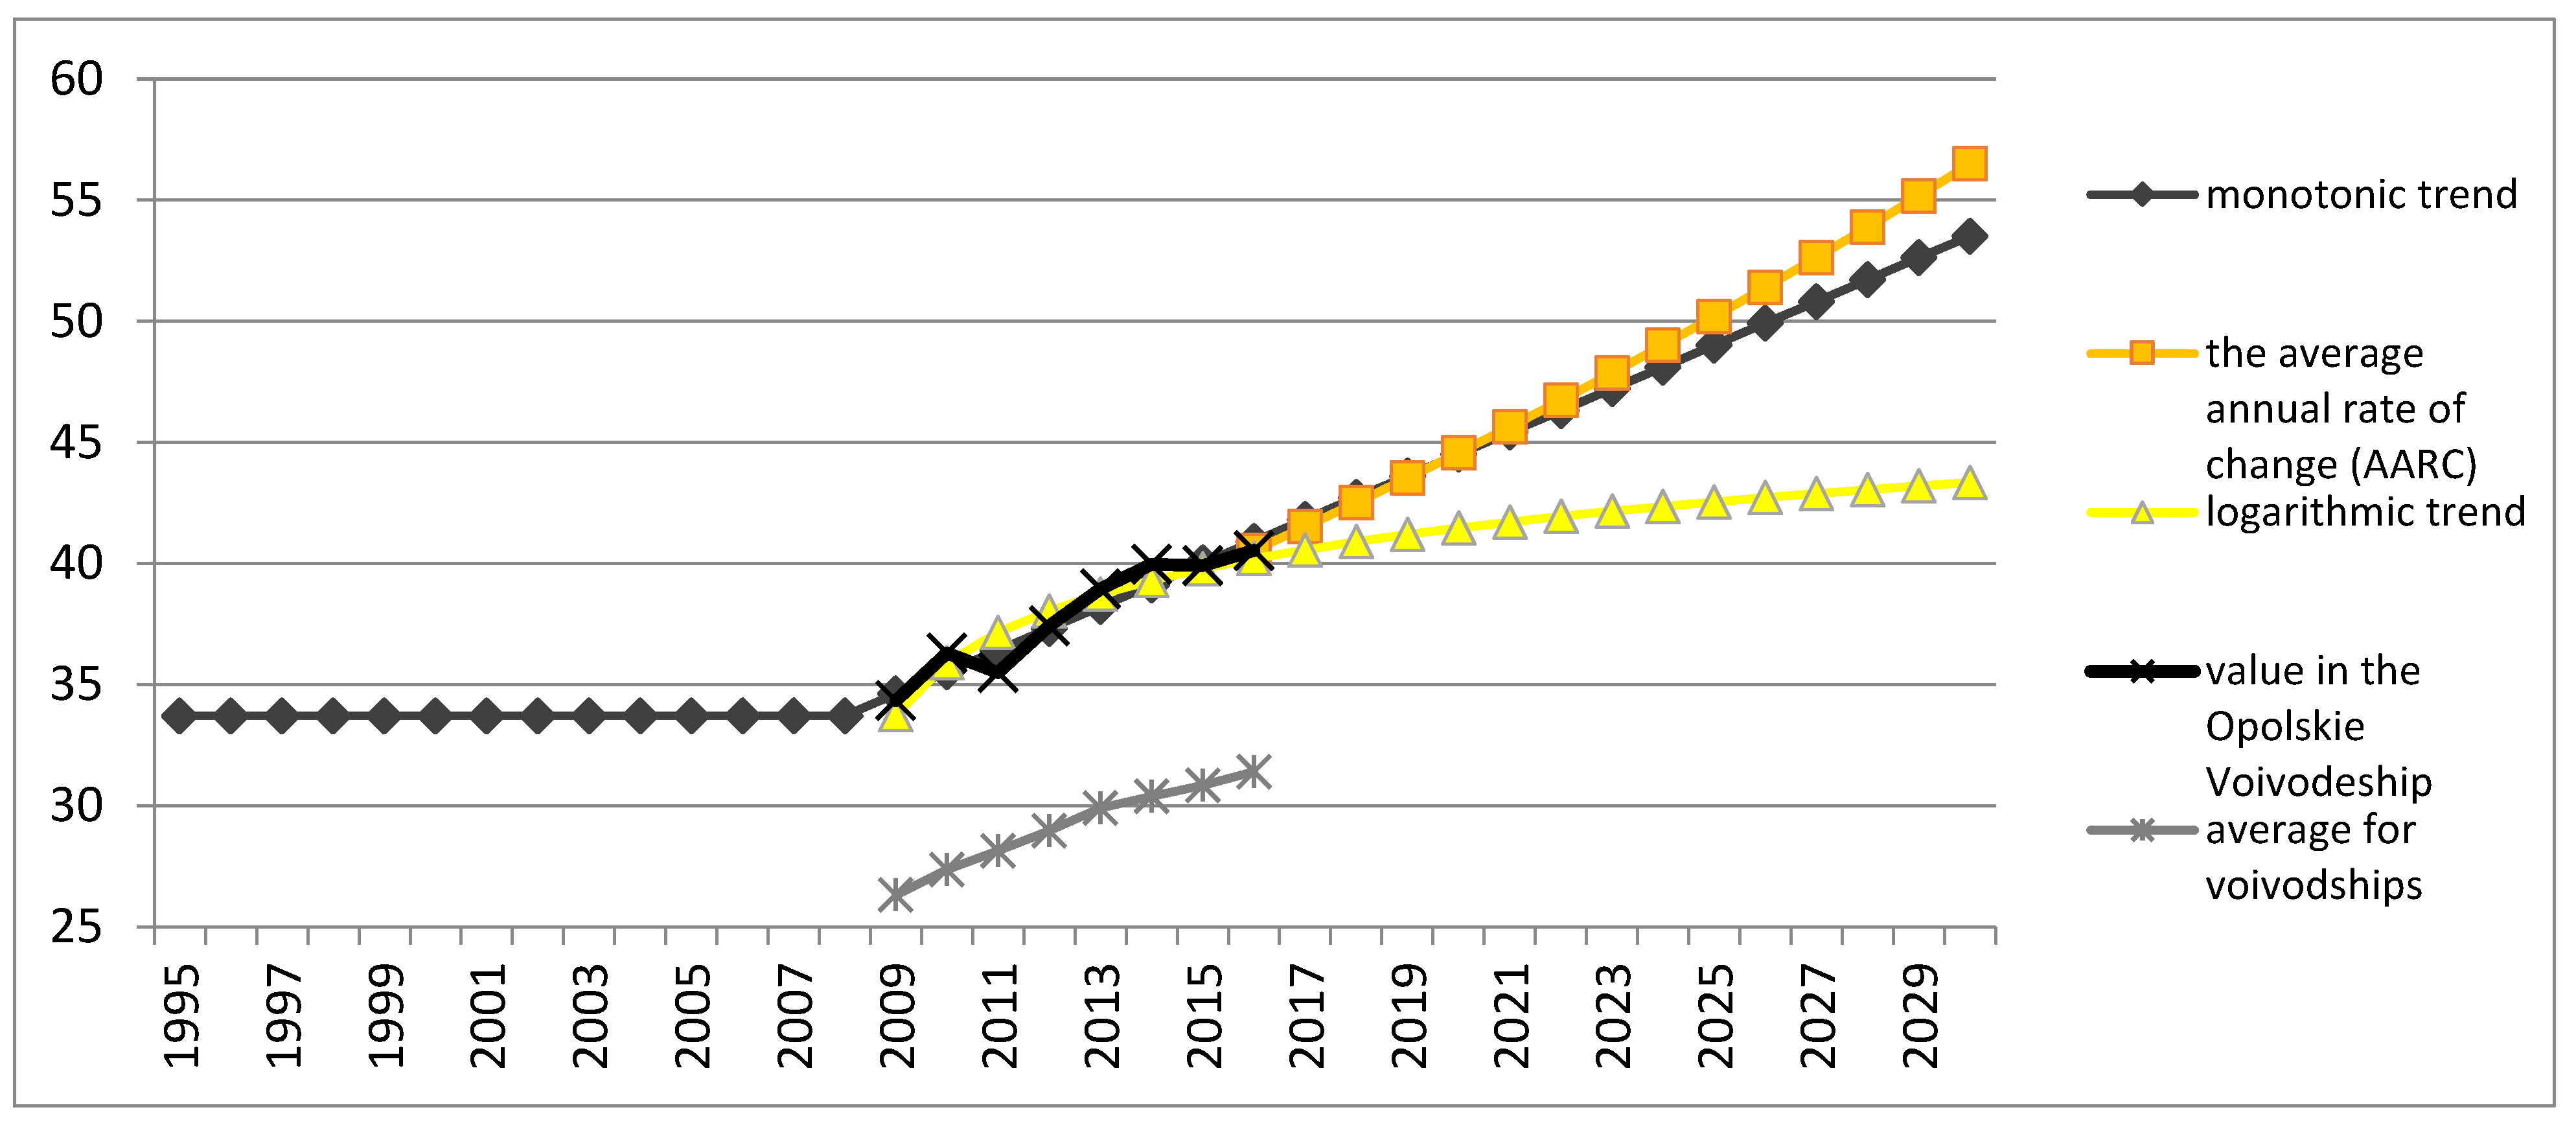
3.2. Forecasted Trends of Changes in the “Environment” Area Indicators

The identification of key issues and the related development conditions formed the basis of forecasting important indicators for the Opolskie Voivodeship’s development before 2030. As mentioned, an estimation of the indicator values for this time frame was conducted using three complementary forecasting methods—the monotonic trend, the yearly average change rate, and the logarithmic trend (Table 3 and Table 4).
In order to understand the logic of the results obtained, and to ensure that the paper does not grow too large, only the first of the presented indicators will be discussed, for example. The share of sorted municipal waste collected in relation to all municipal waste collected in % (y) can be described either by the form of a monotonic trend which is equal to:
y = 1.4020814 * x − 2.5274053,
where x is the number of the next period with data.
This means that from year to year, the rate of sorted municipal waste collected in relation to all municipal waste collected increases by approximately 1.4 percentage points.
Using the average annual rate of change, it can be said that the index value increases from year to year by over 28% (due to this form of indicator it will reach 94% in 2021 and 120% in 2022, whereas it was 27.21% in 2016)—such data clearly distort the use of this method of forecasting.
Similarly, using the logarithmic trend, it can be calculated that the function takes the form:
y = 13.17 * ln (x) + 7.4866
where, as in the case of the monotone trend, x denotes the number of the next period with data.
In this case, a forecast increase in the indicator is very similar to the real data, as indicated by the value of the R2 coefficient equal to 0.9167, which allows this function to be selected in order to extrapolate the data for 2018, for which the value according to the calculated data should be equal to 33.11% (and further, up to 2030, for which the value of the indicator should be 46.26%). In addition, the choice of a logarithmic function for forecasting reveals two more advantages over the previous methods. First, it abandons the assumption of a proportional increase in the indicator which is an unattainable phenomenon in the so-called real world. Secondly, it reduces the growth rate, which simulates the increasing problems with reaching the next levels at the rate of sorted municipal waste.
The following phenomena are key for the analysed area: no air quality improvement in relation to the PM10 and PM2.5 dust content as well as benzo(a)pyrene content in PM10 dust, despite a drop in the gas and dust pollutant emission. The share of people using green energy carriers is low despite an increasing share of RES in electricity consumption and the share of people using a gas system is also low despite a slight increase in the share of people connected to gas networks. It is possible to observe no improvement in the surface water purity and an increase in water consumption for national economy and population purposes.
There is an increase in environmental strains on pollutant emission and air quality, waste production and management, sewage production, water intake, purity, and retention. As mentioned, the reason for this situation is the low, although rising, share of people using green energy carriers. The RES usage degree in electricity consumption (%) in the Opolskie Voivodeship amounted to 7.10 in 2016 with a national average of 27.25, which means that the trend remains below the national average. In 2030, the indicator will reach 14.00 (Figure 3). On the other hand, in 2016, electricity production in relation to electricity consumption (%) amounted to 161.30, with a national average of 100.24, and will reach 119.92 in 2030.
Another determinant of the issue is the low share of people using the gas system (%), amounting to 41.90 in 2016 with a national average of 49.48, which also means that the trend remains below the national average. In 2030, the indicator will amount to 42.80. The impact of this factor is strengthened by further causes, i.e., the low share of people connected to gas networks and the limited availability of gas fuel with a rural population higher than the national average. A separate issue is the gas pollutant emission from particularly troublesome plants, including the CO2 emission per km2 of surface area (in tons per year per km2 of surface area), which amounted to 1368.00 in 2017 and was substantially higher than the national average of 792.56. In 2030, the indicator will reach 1403.15 if the current trend continues (Figure 4). On the other hand, dust pollutant emissions from particularly troublesome plants, including the CO2 emission per km2 of surface area (in tons per year per km2 of surface area), amounted to 11,606.00 in 2017 and was over twice as high as the national average of 5874.43. In 2030, the indicator will reach 45,267.76.
As a result of the impact of the aforementioned determinants, the lack of air quality improvement in relation to the PM10 content was maintained, i.e., the average daily PM10 pollution (in micrometres (one millionth of a metre) per cubic metre (µg/m3)) amounted to 32.60 in 2016 with a national average of 29.27, which means that the unfavourable trend was maintained. The forecasted value will amount to 31.37 in 2030 (Figure 5). Another aspect related to the key issue is the lack of any visible improvement in the surface water purity and an increase in the water consumption for national economy and population purposes per inhabitant (in hectometres per inhabitant). In 2017, the indicator amounted to 132.93 with a national average of 254.87. In 2030, the indicator will reach 160.44, thereby maintaining the unfavourable upward trend in water consumption in the region.
In terms of the highlighted key issues in the discussed area, it is necessary to note the importance of railway transport which is deemed as environmentally friendly as it relieves road transport. The Opolskie Voivodeship features a high utilised railway line density (in total) (in km per 100 km2 of surface area). In 2017, the indicator amounted to 8.20 km per 100 km2 of surface area with a national average of 6.58 km2 per 100 km2, thereby favouring a reduction in the railway transport’s environmental costs. In 2030, the indicator will reach 7.35 km per 100 km2 of the surface area. The share of buses running on alternative fuels in the total number of buses used in urban transport services is similarly important in road transport. In 2017, the indicator amounted to 23.33 with a national average of 18.01. In 2030, the indicator will reach 45.54 (Figure 6).
The region’s diverse natural resource should form the basis to clarify the new areas for legal protection. The voivodeship’s unfavourable situation in this scope does not change however and it is still ranked 11th in the country. In 2017, the share of legally protected areas of special natural value in the total surface area (%) amounted to 27.60 with a national average of 33.63. In 2030, the situation will be the same and the indicator will amount to 27.38.
The aspects of using environmental resources and spatial development are related to legal and organisational rules that are reflected in spatial developments plans which deem environmental protection as a public good. The share of surface areas subject to local spatial development plans in the total surface area (%) in the Opolskie Voivodeship amounted to 40.54 with a national average of 31.41 in 2016, making it one of the highest in the country. In 2030, the indicator will increase and reach 43.34 (Figure 7).
One of the features distinguishing the Opolskie region is the low degree of urbanisation which deviates from the national average. The share of people inhabiting cities with a population of up to 20 thousand (%) amounted to 20.93 with a national average of 14.66 in 2017. In 2030, the indicator will reach 20.95. In terms of the share of people inhabiting cities with a population from 20 thousand to 100 thousand, the indicator amounted to 18.90 with a national average of 18.67. In 2030, the indicator will amount to 18.06. In the case of the third category, i.e., the share of people inhabiting cities with a population of up to 100 thousand, the indicator amounted to 12.94 with a national average of 25.21 in 2017. In 2030, the indicator will reach 12.11.

4. Discussion and Conclusions

A reduction in excessive CO2 emissions and a resulting increase in the average global temperature are currently two of the most important global challenges. International efforts made to stop climate change following the Paris Agreement in 2015 have been very ambitious and have aimed to achieve carbon neutrality over the next few decades. It was assumed that all states will report their greenhouse gas emission objectives, which will then be revised and increased every few years. In the document titled European Green Deal, the EU aims to achieve climate neutrality by 2050 [90].
Various attempts at solving climate change issues have been taken on a macro scale. The Kyoto Protocol attempted to find economics-based methods of tackling climate change [91] with input from world-famous economists, such as Stern, who proposed three solution measures: pricing carbon, supporting innovation, and acting to remove barriers to energy efficiency [92]. Romer was another famous economist that encouraged new ideas and the adoption of a long-term solution. The general approach of all methods and measures is to maintain economic growth and the simultaneous achievement of sustainable development objectives. However, there are concerns that a further increase in the global population and targeting action to sustained economic growth cannot be achieved with limited natural resources [31]. It is necessary to take a series of coordinated activities at many levels and make changes in mentality, e.g., reduce consumption, use materials more effectively and reuse them [93], or combat intentional ageing of products by manufacturers [94], thereby having economic consequences.
The achievement of the United Nations’ objectives seems to be even more difficult today. A rather casual approach of reducing fossil fuel mining and basing the energy systems of some countries on non-renewable energy can help to explain this situation. However, proposed solutions seek to refocus the fossil fuel energy industry in a way that minimises the burden on the countries’ economies [95].
The effectiveness of climate neutrality intentions and the overall effectiveness of sustainable development implementation will however depend on specific actions taken at the regional level, i.e., the effectiveness of energy transformation in regions, the modernisation of local economies (especially those that are currently highly dependent on the mining sector), and the implementation of relevant innovative solutions. The diagnosis of environmental conditions for the development of one of EU’s regions (the Opolskie Voivodeship, Poland) conducted in the paper demonstrates that the plans to achieve zero emissions and fully implement sustainable development can be difficult to achieve in practice. Achieving these plans seems especially difficult in the Opolskie Voivodeship, a region in which a coal power plant is one of the key workplaces. The coal energy sector raises a lot of question marks in terms of implementing the sustainable development principles within the time limit.
At the time of the “Opole” Power Plant’s expansion, the traditional energy industry was known to be in decline due to resource shortages, among other reasons. The current dependence of power generation on traditional energy sources (black coal) has a broader context. This mainly includes political decisions instead of environmental decisions. It is worth emphasising that basing the domestic energy industry on traditional sources does not comply with the European trend of thinking about the energy transition.
As the authors of this elaboration, we are aware that the Opole region’s situation requires more in-depth research due to the circumstances deriving from the environmental context for the regional energy industry, and our study is a signal that such a change is necessary.
We should be thinking about the direction of our energy transition today and not in a few years. This forms the basis for quick decisions on the Opole region’s functioning without generating energy from a traditional power plant.
The Opolskie Voivodeship’s key issues in the environmental sector, creating a specific capital for economic and social activity, are the environmental strains on pollutant emission and air quality, waste production and management, sewage production, water intake, purity, and retention. The reason for this situation is the low share of RES usage in electricity consumption (in %). Despite taking some actions related to the use of green energy (e.g., the governmental “My Electricity” program”), amendments to domestic regulations concerning, among others, the financial settlement of photovoltaic systems, for example, became less appealing to prosumers as of 2022, thereby translating into less interest in such investments. It can however be assumed that this trend may be reversed due to the continuously increasing electricity and gas prices caused by the unstable global geopolitical situation.
Another unfavourable development condition is the low share of people using green energy sources, the low share of people using gas networks, increasing water consumption, and the lack of improvement in the quality of surface water in the region. Another unfavourable issue is the gas pollutant emissions from particularly troublesome plants along with CO2 emissions per km2 of the surface area. The share in legally protected areas of special natural value is lower than the national average.
The distinguishing key issue of the region is the low degree of urbanisation with a relatively dense network of small and medium cities. The weakness of the region’s urbanisation processes is favourable for the environment but impairs the region’s development potential.
Many of the environmental and energy factors analysed in the paper have a tendency to have intensified negative effects. This may point to the fact that action is indeed taken, but it is apparently insufficient to achieve the objectives of sustainable development.
Thus, it is possible to confirm the research hypothesis that the environmental conditions for the Opolskie region’s development are unfavourable considering the current challenges related to sustainable development, especially those related to striving for zero emissions within the next few decades.
This paper directly refers to these issues and estimations, showing that future numerical values are important from the point of view of progress monitoring. However, one should be aware that quantitative forecasting has significant limitations, as explored in the literature [95,96]. On the other hand, the literature provides a critical overview of potentially relevant data for researchers and provides insight into development trends [97]. In addition, “data freshness” is of less importance here (the study presents data for 2016 or 2017). Greater signification has trust in the presented source data and the standards for their collection [98]. Unfortunately, some of the data presented in the Polish Public Statistics are no longer collected, which makes it difficult to verify the correctness of the estimation of the indicator values.
The need to intensify environmental action is acknowledged in the developmental policy and is explored in the region’s strategic documents, funded by regional operational programmes. In the case of the Opolskie Voivodeship, it is the Opolskie Voivodeship Regional Operational Programme (OVROP). These funds are allocated to various objectives determined in the so-called priority axes. An analysis of the expenditure in the last two programme periods demonstrates that one of these objectives involved sustainable development and environmental protection activities. There is, however, a substantial change in the approach to the designation of developmental objectives—from a narrow approach to a multi-faceted approach, which is especially visible in the case of environmental protection activities. In 2007–2013, these actions were encompassed in a single priority axis, i.e., “Environmental Protection”, while in 2014–2020, the actions were split in several axes, i.e., “Low-emission Economy”, “Environmental, Cultural and Natural Heritage Protection”, and “Sustainable Transport for the Mobility of Residents”. This concerns the real implementation of the sustainable development concept in the Opolskie Voivodeship, because environmental issues became a fundamental part of activities in the fields of economy, transport, natural environmental, and cultural heritage. The substantial increase in relevant expenditure also testifies to the increasing significance of such activities. Moreover, 9.5% of all OVROP’s funds were allocated to environmental action encompassed in a single axis in the first programme period, while approx. 44% of funds were allocated to it as part of three priority axes in the next period. This means that sustainable development activities became one of the region’s priorities (see Table 5).
The Opole region’s strategic programmes assume taking action to limit CO2 emissions and wastes [101].
The field of CO2 emission reduction assumes the development of low-coal economy not based on fossil fuels; the implementation of anti-smog and air protection programmes; the development of modern and green solutions in public transport and smart mobility; the development of green technologies; and an improvement in the economy’s energy efficiency, e.g., energy modernisation, energy recovery, or smart energy management. In terms of the waste economy, it is necessary to support the development of a circular economy; effectively use resources, products, and wastes; and support activities aimed at limiting waste generation.
Other Polish regions also demonstrate greater interest in conducting economic and social activity with respect to environmental values. However, the current analyses on the assessment of sustainable development deriving from the relations between economic, social, and environmental domains demonstrate that particular areas vary substantially in this regard [67,102,103]. None of them are characterised by sustainable development in all three dimensions. Generally speaking, regions with strong economies have degraded environments, while regions with high-quality environments have poorly developed economies. Only the social development level is relatively high in both regions with strong economies and regions with high-quality environments. Moreover, the related disparities between the most and least developed regions have intensified in recent years. Industrial areas with adaptive difficulties (Śląskie Voivodeship), poorly developed regions located in Eastern Poland (Warmińsko-Mazurskie, Podlaskie, Lubelskie, Podkarpackie, Świętokrzyskie), rural areas endangered by permanent marginalisation, and medium-sized cities (including some urban areas) that lose their social and economic functions have their own unique issues regarding the intensification of positive changes in the environmental field in relation to social and economic development. A special focus on developmental issues, especially environmental issues, is present in the first of the aforementioned areas. The Śląskie Voivodeship is characterised by a gradual economic growth reduction, which is a result of making the regional economy dependent on traditional industrial sectors (e.g., coal mining), and features the highest air pollution in the country and a large number of areas that require reclamation activities. On the other hand, Western Poland regions are characterised by the lowest degree of competitiveness, a low level of entrepreneurship and innovation, as well as low labour efficiency. Furthermore, simultaneous great natural richness can favour the regions’ development (e.g., spending free time in clean air, favourable conditions for producing high-quality food, access to medicinal plants, etc.).

Author Contributions

Conceptualization, B.S., P.G., K.H., and B.K.; methodology, P.G. and B.S.; software, P.G.; validation, P.G.; formal analysis, B.S., P.G., and B.K.; investigation, K.H., P.G., and B.S.; resources, P.G., B.S., B.K., and K.H.; data curation, P.G.; writing—original draft preparation, B.S., B.K., and P.G.; writing—review and editing, K.H.; visualization, B.S. and P.G.; supervision, K.H.; project administration, B.K. and K.H.; funding acquisition, B.K. and K.H. All authors have read and agreed to the published version of the manuscript.

Funding

This research received no external funding. The APC was founded by: Opole University of Technology, Poland and University of Economics in Katowice, Poland.

Institutional Review Board Statement

Not applicable.

Informed Consent Statement

Not applicable.

Data Availability Statement

All information were included in the text.

Conflicts of Interest

The authors declare no conflict of interest.

References

  1. Betz, N.; Coley, J.D. Human Exceptionalist Thinking about Climate Change. Sustainability 2022, 14, 9519. [Google Scholar] [CrossRef]
  2. Mahmoud, S.H.; Gan, Y.T. Impact of anthropogenic climate change and human activities on environment and ecosystem services in arid regions. Sci. Total Environ. 2018, 633, 1329–1344. [Google Scholar] [CrossRef] [PubMed]
  3. Wąs, A.; Krupin, V.; Kobus, P.; Witajewski-Baltvilks, J.; Jeszke, R.; Szczepański, K. Towards Climate Neutrality in Poland by 2050: Assessment of Policy Implications in the Farm Sector. Energies 2021, 14, 7595. [Google Scholar] [CrossRef]
  4. United Nations; Department of Economic and Social Affairs; Population Division. World Urbanization Prospects: The 2018 Revision, Highlights; United Nations: New York, NY, USA, 2018. [Google Scholar]
  5. Mata-Lima, H.; Silva, F.; Alvino-Borba, A.; Almeida, J.A. Environmental Management in Organizations: Is ISO 14001 Implementation Growing Fast Enough to Improve Environmental Conditions in the Metropolitan Areas of Developing Countries? Environ. Qual. Manag. 2014, 24, 61–77. [Google Scholar] [CrossRef]
  6. Mata-Lima, H.; Silva, D.W.; Nardi, D.C.; Klering, S.A.; de Oliveira, T.C.F.; Morgado-Dias, F. Waste-to-Energy: An Opportunity to Increase Renewable Energy Share and Reduce Ecological Footprint in Small Island Developing States (SIDS). Energies 2021, 14, 7586. [Google Scholar] [CrossRef]
  7. International Energy Agency, IEA. Word Energy Outlook; International Energy Agency: Paris, France, 2008. [Google Scholar]
  8. UN News; UN-Habitat. Cities: A ‘Cause and Solution to’ Climate Change. Available online: https://news.un.org/en/story/2019/09/1046662 (accessed on 20 November 2021).
  9. UN Environment Programme; International Resource Panel. The Weight of Cities: Resource Requirements of Future Urbanization. Available online: https://www.resourcepanel.org/reports/weight-cities (accessed on 10 November 2021).
  10. Purvis, B.; Mao, Y.; Robinson, D. Three pillars of sustainability: In search of conceptual origins. Sustain. Sci. 2019, 14, 681–695. [Google Scholar] [CrossRef] [Green Version]
  11. Szlachta, J. Główne problemy polityki rozwoju regionalnego Polski na przełomie XX i XXI wieku [Main Issues of Poland’s Regional Development Policy at the turn of the 20th and 21st centuries]. In Strategiczne Wyzwania dla Polityki Rozwoju Regionalnego Polski; Broszkiewicz, R., Ed.; Friedrich-Ebert-Stiftung: Warsaw, Poland, 1996. [Google Scholar]
  12. Mach, Ł.; Bedrunka, K.; Dąbrowski, I.; Frącz, P. The Relationship between ROP Funds and Sustainable Development—A Case Study for Poland. Energies 2021, 14, 2677. [Google Scholar] [CrossRef]
  13. Mannan, S. (Ed.) Chapter 40—Sustainable Development. In Lees’ Loss Prevention in the Process Industries, 4th ed.; ButterworthHeinemann: Oxford, UK, 2012; pp. 2507–2521. [Google Scholar]
  14. Pearce, D.W.; Barbier, E.W.; Markandya, A. Sustainable Development; Earthscan: London, UK, 1990. [Google Scholar]
  15. Mensah, J. Sustainable Development: Meaning, History, Principles, Pillars, and Implications for Human Action: Literature Review. Cogent Soc. Sci. 2019, 5, 1653531. [Google Scholar] [CrossRef]
  16. Suo, C.; Li, Y.; Mei, H.; Lv, J.; Sun, J.; Nie, S. Towards sustainability for China’s energy system through developing an energyclimate-water nexus model. Renew. Sustain. Energy Rev. 2021, 135, 110394. [Google Scholar] [CrossRef]
  17. Copiello, S.; Grillenzoni, C. Economic development and climate change. Which is the cause and which the effect? Energy Rep. 2020, 6, 49. [Google Scholar] [CrossRef]
  18. Širá, E.; Vavrek, R.; Vozárová, I.K.; Kotulič, R. Knowledge Economy Indicators and Their Impact on the Sustainable Competitiveness of the EU Countries. Sustainability 2020, 12, 4172. [Google Scholar] [CrossRef]
  19. Pflugmann, F.; De Blasio, N. The Geopolitics of Renewable Hydrogen in Low-Carbon Energy Markets. Geopolit. Hist. Int. Relat. 2020, 12, 7. [Google Scholar]
  20. Harrower, K. Networked and Integrated Urban Technologies in Sustainable Smart Energy Systems. Geopolit. Hist. Int. Relat. 2020, 12, 45. [Google Scholar]
  21. United Nations. The Millennium Development Goals Report 2010; United Nations: New York, NY, USA, 2010. [Google Scholar]
  22. United Nations. Transforming our World: The 2030 Agenda for Sustainable Development, A/RES/70/1; United Nations: New York, NY, USA, 2015. [Google Scholar]
  23. Sustainable Development Goals. The Aalborg Charter. Available online: https://sustainablecities.eu/the-aalborg-charter/ (accessed on 10 November 2021).
  24. Sustainable Development Goals; Knowledge Platform. Agenda 21. Available online: https://sustainabledevelopment.un.org/outcomedocuments/agenda21 (accessed on 25 November 2021).
  25. Mercader-Moyano, P.; Estable-Reifs, A.M.; Pellicer, H. Toward the Renewal of the Sustainable Urban Indicators’ System after a Global Health Crisis. Practical Application in Granada, Spain. Energies 2021, 14, 6188. [Google Scholar] [CrossRef]
  26. Report by the Commission on the Measurement of Economic Performance and Social Progress. Available online: https://citeseerx.ist.psu.edu/viewdoc/download?doi=10.1.1.215.58&rep=rep1&type=pdf (accessed on 7 May 2021).
  27. European Commission Communication from the Commission to the European Parliament, the Council, the European Economic and Social Committee and the Committee of the Regions an EU-Wide Assessment of National Energy and Climate Plans Driving Forward the Green Transition and Promoting Economic Recovery through Integrated Energy and Climate Planning 2020. Available online: https://eur-lex.europa.eu/legal-content/EN/TXT/PDF/?uri=CELEX:52020DC0564&from=EN (accessed on 3 December 2021).
  28. Księżopolski, K.; Maśloch, G. Time Delay Approach to Renewable Energy in the Visegrad Group. Energies 2021, 14, 1928. [Google Scholar] [CrossRef]
  29. United Nations. Paris Agreement to the United Nations Framework Convention on Climate Change; T.I.A.S. No. 16-1104; United Nations: New York, NY, USA, 2015. [Google Scholar]
  30. IPCC. 2021: Summary for Policymakers. In Climate Change 2021: The Physical Science Basis. Contribution of Working Group I to the Sixth Assessment Report of the Intergovernmental Panel on Climate Change; Masson-Delmotte, V., Zhai, P., Pirani, A., Connors, S.L., Péan, C., Berger, S., Caud, N., Chen, Y., Goldfarb, L., Gomis, M.I., et al., Eds.; Cambridge University Press: Cambridge, UK, 2021; in press; Available online: https://www.ipcc.ch/report/ar6/wg1/downloads/report/IPCC_AR6_WGI_SPM.pdf (accessed on 25 July 2021).
  31. Margeta, K.; Glasnovic, Z.; Zabukovec Logar, N.; Tišma, S.; Farkaš, A. A Concept for Solving the Sustainability of Cities Worldwide. Energies 2022, 15, 616. [Google Scholar] [CrossRef]
  32. Mora, C.; Dousset, B.; Caldwell, I.R.; Powell, F.E.; Geronimo, R.C.; Bielecki, C.R.; Counsell, C.W.W.; Dietrich, B.S.; Johnston, E.T.; Louis, L.V.; et al. Global risk of deadly heat. Nat. Clim. Change 2017, 7, 501–506. Available online: https://www.nature.com/articles/nclimate3322#citeas (accessed on 25 July 2022). [CrossRef]
  33. Hoque, F.; Yasin, R.M.; Sopian, K. Revisiting Education for Sustainable Development: Methods to Inspire Secondary School Students toward Renewable Energy. Sustainability 2022, 14, 8296. [Google Scholar] [CrossRef]
  34. Clemente-Suárez, V.J.; Rodriguez-Besteiro, S.; Cabello-Eras, J.J.; Bustamante-Sanchez, A.; Navarro-Jiménez, E.; Donoso-Gonzalez, M.; Beltrán-Velasco, A.I.; Tornero-Aguilera, J.F. Sustainable Development Goals in the COVID-19 Pandemic: A Narrative Review. Sustainability 2022, 14, 7726. [Google Scholar] [CrossRef]
  35. Cernev, T.; Fenner, R. The importance of achieving foundational Sustainable Development Goals in reducing global risk. Futures 2020, 115, 102492. [Google Scholar] [CrossRef]
  36. Brussels, European Commission. Evaluation of the Impact of the Common Agricultural Policy on Climate Change and Greenhouse Gas Emissions. SWD (2021) 115 Final. 2021. Available online: https://ec.europa.eu/info/sites/default/files/food-farmingfisheries/key_policies/documents/ext-eval-soil-greenhouse-report_2020_en.pdf (accessed on 1 December 2021).
  37. Wolf, S.; Teitge, J.; Mielke, J.; Schütze, F.; Jaeger, C. The European Green Deal—more than climate neutrality. Intereconomics 2021, 56, 99–107. [Google Scholar] [CrossRef]
  38. Parker, L.; Bourgoin, C.; Martinez-Valle, A.; Läderach, P. Vulnerability of the agricultural sector to climate change: The development of a pan-tropical Climate Risk Vulnerability Assessment to inform sub-national decision making. PLoS ONE 2019, 14, e0213641. [Google Scholar] [CrossRef] [Green Version]
  39. Adams, R.M.; Hurd, B.H.; Lenhart, S.; Leary, N. Effects of global climate change on agriculture: An interpretative review. Clim. Res. 1998, 11, 19–30. [Google Scholar]
  40. Królczyk, G.; Król, A.; Kochan, O.; Su, J.; Kacprzyk, J. (Eds.) Sustainable Production: Novel Trends in Energy, Environmental and Materials Systems; Springer: Cham, Switzerland, 2020. [Google Scholar]
  41. Stoenoiu, C.E. Sustainable Development—A Path to a Better Future. Sustainability 2022, 14, 9192. [Google Scholar] [CrossRef]
  42. Fouquet, R.; Pearson, P.J. Past and prospective energy transitions: Insights from history. Energy Policy 2012, 50, 1–7. [Google Scholar] [CrossRef]
  43. Johnstone, N.; Haščič, I.; Popp, D. Renewable Energy Policies and Technological Innovation: Evidence Based on Patent Counts. Environ. Resour. Econ. 2010, 45, 133–155. [Google Scholar] [CrossRef]
  44. Elliott, J.; Foster, I.; Kortum, S.; Munson, T.; Cervantes, F.P.; Weisbach, D. Trade and Carbon Taxes. Am. Econ. Rev. 2010, 100, 465–469. [Google Scholar] [CrossRef] [Green Version]
  45. Solecka, I.; Bothmer, D.; Głogowski, A. Recognizing Landscapes for the Purpose of Sustainable Development—Experiences from Poland. Sustainability 2019, 11, 3429. [Google Scholar] [CrossRef] [Green Version]
  46. Giorgetta, S. The Right to a Healthy Environment, Human Rights and Sustainable Development. Int. Environ. Agreem. Politics Law Econ. 2002, 2, 171–192. [Google Scholar] [CrossRef]
  47. Raszkowski, A.; Bartniczak, B. Towards Sustainable Regional Development: Economy, Society, Environment, Good Governance Based on the Example of Polish Regions. Transform. Bus. Econ. 2018, 17, 225–245. [Google Scholar]
  48. Malik, K.; Ciesielska, M. Sustainability within the region: The role of institutional governance. Econ. Environ. Stud. 2011, 11, 167–187. [Google Scholar]
  49. Happaerts, S.; Bruyninckx, H.; Van den Brande, K. The State of Sustainable Development: Perspectives from the Subnational Level. In Sustainable Development and Subnational Governments; Bruyninckx, H., Happaerts, S., Van den Brande, K., Eds.; Palgrave Macmillan: London, UK, 2012. [Google Scholar] [CrossRef]
  50. Jovovic, R.; Draskovic, M.; Delibasic, M.; Jovovic, M. The concept of sustainable regional development—institutional aspects, policies and prospects. J. Int. Stud. 2017, 10, 255–266. [Google Scholar] [CrossRef] [PubMed] [Green Version]
  51. Talukdar, S. Pursuing Sustainability: A Case for Regional Approach. Community Change 2018, 2, 4. [Google Scholar] [CrossRef]
  52. Bedrunka, K. Concepts of the Sustainable Development of the Region. In Sustainable Production: Novel Trends in Energy, Environment and Material Systems. Studies in Systems, Decision and Control; Królczyk, G., Wzorek, M., Król, A., Kochan, O., Su, J., Kacprzyk, J., Eds.; Springer: Cham, Germany, 2020; Volume 198. [Google Scholar] [CrossRef]
  53. van den Bergh, J.C.J.M.; Verbruggen, H. Spatial sustainability, trade and indicators: An evaluation of the ‘ecological footprint’. Ecol. Econ. 1999, 29, 61–72. [Google Scholar] [CrossRef]
  54. Carroll, M.C.; Stanfield, J.R. Sustainable Regional Economic Development. J. Econ. Issues 2001, 35, 469–476. [Google Scholar] [CrossRef]
  55. Roberts, P. Evaluating regional sustainable development: Approaches, methods and the politics of analysis. J. Environ. Plan. Manag. 2006, 49, 515–532. [Google Scholar] [CrossRef]
  56. Lehner, F. Deliberative Governance for Sustainable Development: An Innovative Solution for Environment, Economy and Society, 1st ed.; Routledge: London, UK, 2022. [Google Scholar] [CrossRef]
  57. Ayres, R.U. On the life cycle metaphor: Where ecology and economics diverge. Ecol. Econ. 2004, 48, 425–438. [Google Scholar] [CrossRef]
  58. Müller, M.O.; Stämpfli, A.; Dold, U.; Hammer, T. Energy autarky: A conceptual framework for sustainable regional development. Energy Policy 2011, 39, 5800–5810. [Google Scholar] [CrossRef]
  59. Boguniewicz-Zabłocka, J.; Łukasiewicz, E.; Guida, D. Analysis of the Sustainable Use of Geothermal Waters and Future Development Possibilities—A Case Study from the Opole Region, Poland. Sustainability 2019, 11, 6730. [Google Scholar] [CrossRef] [Green Version]
  60. Pięta-Kanurska, M. Renewable Energy Production in Primary Energy in Poland—Comparative Analysis of Selected European Union Countries. In Proceedings of the 38th International Business Information Management Association (IBIMA), Seville, Spain, 23–24 November 2021; ISBN 978-0-9998551-7-1. [Google Scholar]
  61. Kahia, M.; Ben Aïssa, M.S.; Charfeddine, L. Impact of Renewable and Non-Renewable Energy Consumption on Economic Growth: New Evidence from the MENA Net Oil Exporting Countries (NOECs). Energy 2016, 116, 102–115. [Google Scholar] [CrossRef]
  62. Olczak, P.; Żelazna, A.; Matuszewska, D.; Olek, M. The “My Electricity” Program as One of the Ways to Reduce CO2 Emissions in Poland. Energies 2021, 14, 7679. [Google Scholar] [CrossRef]
  63. Berkenkamp, M.; Götz, P.; Heddrich, M.; Lenck, T. Integration of European Energy Market. Poland and Baltic Sea Region (European Energy Market Integration. Poland and the Baltic Sea Region); Advise2Energy: Frankfurt/Berlin, Germany, 2016. [Google Scholar]
  64. Energy Regulatory Office. Information on Investment Plans for New Generation Capacity in the Years 2018–2032; Energy Regulatory Office: Warsaw, Poland, 2019; p. 14. Available online: https://www.ure.gov.pl/pl/urzad/informacje-ogolne/publikacje/raport-plany-inwestycyj/8068,Raport-Plany-inwestycyjne-w-nowe-moce-wytworcze.html (accessed on 12 December 2021).
  65. Drożdż, W.; Mróz-Malik, O.; Kopiczko, M. The Future of the Polish Energy Mix in the Context of Social Expectations. Energies 2021, 14, 5341. [Google Scholar] [CrossRef]
  66. Sustainable Development Strategy 2020 (with a 2030 perspective), Warsaw. 2017. Available online: https://www.gov.pl/web/fundusze-regiony/informacje-o-strategii-na-rzecz-odpowiedzialnego-rozwoju (accessed on 10 December 2021).
  67. National Strategy for Regional Development 2030. Socially Sensitive and Territorially Sustainable Development, Warsaw, September. 2019. Available online: https://www.gov.pl/web/fundusze-regiony/krajowa-strategia-rozwoju-regionalnego (accessed on 10 December 2021).
  68. Ministerstwo Klimatu i Środowiska. 2021, Polityka Energetyczna Polski do 2040 r., Streszczenie. Available online: https://www.gov.pl/attachment/c5d4a303-2a45-4225-b84d-d6ad12f7c1c1 (accessed on 10 November 2021).
  69. Ruszkowski, P. Bełchatów 2030: Alternatywne Scenariusze Transformacji (Bełchatów 2030: The Alternative Scenarios of the Transformation). Energetyka Społeczeństwo Polityka 2021, 9. Available online: https://www.researchgate.net/publication/351162952_Belchatow_2030_alternatywne_scenariusze_transformacji (accessed on 16 December 2021). [CrossRef]
  70. Opolskie Voivodeship Growth Poles, Krakow-Warsaw, December 2016. Available online: https://www.opolskie.pl/wp-content/uploads/2017/02/Bieguny-wzrostu-wojew%C3%B3dztwa-opolskiego-raport.pdf (accessed on 10 December 2021).
  71. Opolskie—regional diagnosis, Opole, November 2020. Available online: https://bip.opolskie.pl/wp-content/uploads/2020/11/22.-Opolskie-diagnoza-regionalna.pdf (accessed on 10 December 2021).
  72. Heffner, K.; Klemens, B.; Solga, B. Challenges of Regional Development in the Context of Population Ageing. Analysis Based on the Example of Opolskie Voivodeship. Sustainability 2019, 11, 5207. [Google Scholar] [CrossRef] [Green Version]
  73. Kubiciel-Lodzińska, S. The influx of foreign workers in the context of the demographic transformations in Poland, The employers’ perspective (case study of Opole Voivodeship). In Proceedings of the 31st International Business Information Management Association Conference (IBIMA 2018); Innovation Management and Education Excellence through Vision 2020, Milan, Italy, 25–26 April 2018; pp. 231–243. [Google Scholar]
  74. Maj, J.; Kubiciel-Lodzińska, S. Entrepreneurial tendencies of migrants working in the care sector in Poland. Entrep. Bus. Econ. Rev. 2020, 8, 27–46. [Google Scholar] [CrossRef]
  75. Jończy, R.; Śleszyński, P.; Dolińska, A.; Ptak, M.; Rokitowska-Malcher, J.; Rokita-Poskart, D. Environmental and Economic Factors of Migration from Urban to Rural Areas: Evidence from Poland. Energies 2021, 14, 8467. [Google Scholar] [CrossRef]
  76. Zygmunt, J. Regional dimension of entrepreneurship in a developing economy an analysis of polish północno-zachodni region. In Proceedings of the 30th International Business Information Management Association Conference (IBIMA 2017); Vision 2020: Sustainable Economic development, Innovation Management, and Global Growth; Marid, Spain: 8–9 November 2017; pp. 1483–1491.
  77. Zygmunt, A. Do investments impact on firms’ innovation activities? Evidence from Poland and the Czech Republic. 32nd International Business Information Management Association Conference (IBIMA 2018); Vision 2020: Sustainable Economic Development and Application of Innovation Management from Regional expansion to Global Growth, Seville, Spain, 15–16 November 2018; pp. 6942–6948. [Google Scholar]
  78. Klemens, B.; Derlukiewicz, N.; Mempel-Śnieżyk, A. Boosting innovation and entrepreneurship in Polish economy. In Biblioteka Regionalisty; Wydawnictwo Uniwersytetu Ekonomicznego we Wrocławiu: Wrocław, Poland, 2017; pp. 55–65. [Google Scholar]
  79. Szewczuk-Stępień, M.; Klemens, B. Essence and role of co-operation in regional development. RIS3 case study. In Quality—Access to Success; SRAC: București, Romania, 2019; Volume 20, pp. 463–468. [Google Scholar]
  80. Derlukiewicz, N.; Mempel-Śnieżyk, A.; Pilewicz, T.; Godlewska, M. Bottom-Up Initiatives Undertaken by Local Governments to Support Entrepreneurship. Energies 2021, 14, 6328. [Google Scholar] [CrossRef]
  81. Rokita-Poskart, D.; Mach, Ł. Selected meso-economic consequences of the changing number of students in academic towns and cities (a case study of Poland). Sustainability 2019, 11, 1901. [Google Scholar] [CrossRef] [Green Version]
  82. Rokita-Poskart, D. What decides about the ability of the academic city to keep educational migrants?—Case of Opole academic Centre. In Proceedings of the 31st International Business Information Management Association Conference (IBIMA 2018); Innovation Management and Education Excellence through Vision 2020, Milan, Italy, 25–26 April 2018; pp. 6829–6839. [Google Scholar]
  83. Województwo opolskie—stan i trendy rozwojowe. Raport za okres 2008–2016, Urząd Marszałkowski Województwa Opolskiego, Opole. 2017. Available online: https://www.opolskie.pl/wp-content/uploads/2017/07/Raport-DRP-o-rozwoju-spo%C5%82-gosp-przestrz-OST.pdf (accessed on 15 December 2021).
  84. Stępiński, P. Zakończyła się rozbudowa Elektrowni Opole. Available online: https://biznesalert.pl/zakonczyla-sie-rozbudowa-elektrowni-opole-relacja/ (accessed on 15 December 2021).
  85. Available online: https://www.gorazdze.pl/pl/obiekty-referencyjne-rozbudowa-elektrowni-opole (accessed on 15 December 2021).
  86. Suchacek, J.; Walancik, M.; Wroblewski, L.; Urminsky, J.; Drastichova, M.; Sotkovsky, I. Management of Municipal Development of Euroregion Beskydy in Poland and Czechia. Pol. J. Manag. Stud. 2018, 18, 365–378. [Google Scholar] [CrossRef]
  87. Heffner, K. Small, Peripheral, Agricultural and Emigration Regions. In New Members—New Challenges for the European Regional Development Policy; Technical University of Kosice. Faculty of Economics, University of Economics in Bratislava; Faculty of National Economy in Cooperation with German Speaking Section of the European Regional Science Association: Novy Smokovec-Vysoke Tatry, Slovakia, 2005; pp. 132–137. [Google Scholar]
  88. Dembicka-Niemiec, A. Realization of Regional Operational Programme of the Opolskie Voivodeship. In Assumption and Activities in the Opole Agglomeration in the Context of Sustainable Development, Wyd; Uniwersytetu Ekonomicznego we Wrocławiu: Wrocław, Poland, 2019; Available online: http://dbc.wroc.pl/Content/74469/Dembicka-Niemiec_Realization_of_regional_operational_programme.pdf (accessed on 25 July 2022).
  89. Eastman, J.R. TerrSet Geospatial Monitoring and Modeling System—Tutorial; Clark Labs, Clark University: Worcester, MA, USA, 2016. [Google Scholar]
  90. Available online: https://ec.europa.eu/info/strategy/priorities-2019-2024/european-green-deal_en#documents (accessed on 26 July 2022).
  91. United Nations. Kyoto Protocol; United Nations: Tokyo, Japan, 1997; Available online: https://unfccc.int/kyoto-protocol-htmlversion (accessed on 26 July 2022).
  92. Stern, N. Stern Review on the Economics of Climate Change; Government of the United Kingdom: London, UK, 2006; Available online: http://mudancasclimaticas.cptec.inpe.br/~rmclima/pdfs/destaques/sternreview_report_complete.pdf (accessed on 26 July 2022).
  93. Taušová, M.; Čulková, K.; Tauš, P.; Domaracká, L.; Seňová, A. Evaluation of the Effective Material Use from the View of EU Environmental Policy Goals. Energies 2021, 14, 4759. [Google Scholar] [CrossRef]
  94. Niklewicz-Pijaczyńska, M.; Stańczyk, E.; Gardocka-Jałowiec, A.; Gródek-Szostak, Z.; Niemczyk, A.; Szalonka, K.; Homa, M. A Strategy for Planned Product Aging in View of Sustainable Development Challenges. Energies 2021, 14, 7793. [Google Scholar] [CrossRef]
  95. Paták, M.; Jeřábek, F. Possibilities and Limitations of Quantitative Methods in Short-Term Demand Forecasting in a Manufacturing Company. In Proceedings of the Carpathian Logistics Congress (CLC 2015), Olomouc, Czech, 4–6 November 2015; Available online: https://www.researchgate.net/publication/316622048_Possibilities_and_Limitations_of_Quantitative_Methods_in_Short-Term_Demand_Forecasting_in_a_Manufacturing_Company (accessed on 20 July 2022).
  96. Wang, S. Wanpracha Art Chaovalitwongse. “Evaluating and comparing forecasting models.” Wiley Encyclopedia of Operations Research and Management Science (2011). Available online: https://www.researchgate.net/profile/Shouyi-Wang/publication/313991989_Evaluating_and_Comparing_Forecasting_Models/links/5aa76e8da6fdcccdc46a9a1b/Evaluating-and-Comparing-Forecasting-Models.pdf (accessed on 20 July 2022).
  97. Fallah, S.N.; Deo, R.C.; Shojafar, M.; Conti, M.; Shamshirband, S. Computational intelligence approaches for energy load forecasting in smart energy management grids: State of the art, future challenges, and research directions. Energies 2018, 11, 596. [Google Scholar] [CrossRef] [Green Version]
  98. Würth, I.; Valldecabres, L.; Simon, E.; Möhrlen, C.; Uzunoğlu, B.; Gilbert, C.; Giebel, G.; Schlipf, D.; Kaifel, A. Minute-scale forecasting of wind power—results from the collaborative workshop of IEA Wind task 32 and 36. Energies 2019, 12, 712. [Google Scholar] [CrossRef] [Green Version]
  99. Periodical Report on the Implementation of the Opolskie Voivodeship Regional Operational Programme 2007–2013. Available online: https://docplayer.pl/5940131-Sprawozdanie-okresowe-z-realizacji-regionalnego-programu-operacyjnego-wojewodztwa-opolskiego-na-lata-2007-2013.html (accessed on 25 July 2022).
  100. Annual Report on the Implementation of the Opolskie Voivodeship Regional Operational Programme 2014–2020. Available online: https://rpo.opolskie.pl/wp-content/uploads/2022/05/Sprawozdanie-z-wdra%C5%BCania-RPO-WO-2014-2020-za-2021.pdf (accessed on 25 July 2022).
  101. Opolskie Voivodeship Development Strategy “Opolskie 2030”, Opole. 2021. Available online: https://www.opolskie.pl/wp-content/uploads/2021/10/Strategia-Opolskie-2030-uchwalona.pdf (accessed on 25 July 2022).
  102. Józefowicz, K.; Smolińska, K. Regionalne zróżnicowanie poziomu antropopresji na środowiskowe uwarunkowania rozwoju w Polsce. In Regional Diversification of the Degree of Anthropic Pressure on the Environmental Development Conditions in Poland, Regional Development and Regional Policy no.; UAM: Poznań, Poland, 2022; pp. 93–109. [Google Scholar] [CrossRef]
  103. lóska, R. Rozwój zrównoważony regionów w Polsce w ujęciu statystycznym, Regional Sustainable Development in Poland in Statistical Terms. Prog. Econ. Sci. 2017, 4, 159–177. [Google Scholar]
Figure 1. Logic of the research procedure. Source: Own elaboration.
Energies 15 05758 g001
Figure 2. The “environment” issue tree. Source: Own elaboration.
Energies 15 05758 g002
Figure 3. RES usage degree in electricity consumption (%). Source: own elaboration.
Energies 15 05758 g003
Figure 4. Gas pollutant emission from particularly troublesome plants, including CO2 emission per km2 of surface area (in tons per year per km2 of surface area). Source: own elaboration.
Energies 15 05758 g004
Figure 5. The average daily PM10 pollution. Source: own elaboration.
Energies 15 05758 g005
Figure 6. Share of buses running on alternative fuel in the total number of buses used in the urban transport services (%). Source: own elaboration.
Energies 15 05758 g006
Figure 7. Share of surface areas subject to local spatial development plans in the total surface area (%). Source: own elaboration.
Energies 15 05758 g007
Table 1. Logical connection of indicators to energy transformation and sustainable regional development in the Opolskie Voivodeship.
Sustainable Development:Indicators:
(S—stimulant, D—de-stimulant)
Positive Share of sorted municipal waste collected in relation to all municipal waste collected (%) (S)RES usage degree in electricity consumption (%) (S)
Population using the water supply system (%) (S)Population using the gas supply system (%) (S)
Population using the sewage system (%) (S)Share of people inhabiting cities with a population of up to 20.000 (%) (S)
Share of surface areas subject to local spatial development plans in the total surface area (%) (S)Utilised railway line density (total) (km per 100 km2 of surface area) (S)
Share of legally protected areas of special natural value in the total surface area (%) (S)Share of buses running on alternative fuel in the total number of buses used in the urban transport services (%) (S)
Density of public roads with improved pavements (km per 100 km2 of surface area) (S)
NeutralShare of people inhabiting cities with a population from 20.000 to 100.000 (%) (D)Share of people inhabiting cities with a population above 100.000 (%) (D)Electricity production in relation to electricity consumption (%) (S)
NegativeDust pollutant emissions from particularly troublesome plants (including the CO2 emission) per km2 of surface area (in tons per year per km2 of surface area) (D)Water consumption for national economy and population purposes per inhabitant (cubic hectometres per inhabitant) (D)
Gas pollutant emission from particularly troublesome plants (including the CO2 emission) per km2 of surface area (in tons per year per km2 of surface area) (D)
Daily average PM10 pollution (in micrometres (one millionth of a metre) per cubic metre (µg/m3)) (D)
Energy transformation ->NegativeNeutralPositive
Source: own elaboration.
Table 2. Analysis of the relations between the “environment” phenomena.
Phenomena12345678910111213Y
1X0000000000000
20X100100001003
301X00000010002
4000X0020010003
50001X010010003
602000X00010003
7000110X0000002
80000000X010001
900000000X10001
10000000000X0000
110000000001X001
1200000000010X01
13000000000000X0
X0312113008100X
Source: Own elaboration.
Table 3. Estimation coefficients and parameters.
Indicator Name/FeaturesSlope (S)Interceptor (I)The Average Annual Rate of Change (AARC)The Medium-Period Change Rate (MPCR)TrendR2
Share of sorted municipal waste collected in relation to all municipal waste collected (%)1.4020814−2.527405328.1454277734.87869942y = 13.17 ln(x) + 7.4866 0.9167
Dust pollutant emission from particularly troublesome plants (including the CO2 emission) per km2 of surface area (in tons per year per km2 of surface area)382.9500122358.899902313.5894770313183.1947y = 1240.6e0.109x 0.9694
Gas pollutant emission from particularly troublesome plants (including the CO2 emission) per km2 of surface area (in tons per year per km2 of surface area)−5.26923081475.2307130.0154130811368.210851y = −12.71 ln(x) + 1447.60.0121
Daily average PM10 pollution (in micrometres (one millionth of a metre) per cubic metre (µg/m3))−0.256585638.05030060.18807928132.66226404y = 0.1218 ln(x) + 36.785 0.0004
Electricity production in relation to electricity consumption (%)−5.2899995235.875−2.094713486157.9212271y = −24.31 ln(x) + 238.9 0.6464
RES usage degree in electricity consumption (%)0.50454550.88409095.180464698.177812993y = 2.2674 ln(x) + 0.2651 0.7112
Population using the water supply system (%)1.316666248.16667182.66478183374.32930205y = 0.178 ln(x) + 96.594 0.9777
Population using the sewage system (%)1.753845842.74615483.25699532671.97012574y = 6.7246 ln(x) + 63.9320.9515
Population using the gas supply system (%)0.060000641.05999370.19020741941.97969691y = 0.3569 ln(x) + 40.8890.6662
Water consumption for national economy and population purposes per inhabitant (cubic hectometres per inhabitant)0.5922572103.58156591.457253953134.8741587y = 5.8967 ln(x) + 100.90.2295
Share of legally protected areas of special natural value in the total surface area (%)0.009933527.05494120.06055132827.5897001y = 0.1289 ln(x) + 26.9570.4193
Share of surface areas subject to local spatial development plans in the total surface area (%)0.899748133.72377782.39852527341.51897709y = 3.10 1ln(x) + 33.76 0.8860
Share of people inhabiting cities with a population of up to 20.000 (%)−0.005863221.11909870.66081792121.07141607y = 0.8026 ln(x) + 19.2130.6598
Share of people inhabiting cities with a population from 20.000 to 100.000 (%)0.03541518.87416840.79867944818.75696099y = −0.958 ln(x) + 21.2570.7575
Share of people inhabiting cities with a population above 100.000 (%)−0.024159812.29369540.42092938112.99701121y = −0.036 ln(x) + 12.2340.0131
Utilised railway line density (total) (km per 100 km2 of surface area)−0.06833339.333333−0.8356901728.131473406y = −0.366 ln(x) + 9.50720.4235
Density of public roads with improved pavements (km per 100 km2 of surface area)0.414285977.82857510.67070222285.46942619y = 2.5603 ln(x) + 76.5210.8791
Share of buses running on alternative fuel in the total number of buses used in the urban transport services (%)10.1510563−7.1138515177.208772964.6986364y = 16.46 ln(x) − 0.08890.6031
Source: own elaboration.
Table 4. A summary of the estimated indicator value changes.
Indicator Name/FeaturesLast Indicator Value YearValue in the Previous Year for the Opolskie VoivodeshipAverage Value for Voivodeships
(Excluding Opolskie)
National AverageValue in the Previous Year for the Opolskie Voivodeship in Relation to the Average Value in the Previous YearForecasting Method20182030Most Probable
Change Trend
Share of sorted municipal waste collected in relation to all municipal waste collected (%)201627.218124.000124.2012aboveMT **19.905936.7309
AARC **44.6955876.3968
LT **33.114246.2649X
Dust pollutant emission from particularly troublesome plants (including the CO2 emission) per km2 of surface area (in tons per year per km2 of surface area) MT8400.850212,996.2503
201711,606.00005492.33335874.4375aboveAARC13,183.194760,824.4047
ET12,238.603045,267.7625X
Gas pollutant emission from particularly troublesome plants (including the CO2 emission) per km2 of surface area (in tons per year per km2 of surface area) MT1364.57691301.3461
20171368.0000754.2000792.5625aboveAARC1368.21091370.7436
LT1408.90411403.1594X
Daily average PM10 pollution (in micrometres (one millionth of a metre) per cubic metre (µg/m3)) MT34.458131.3791X
201632.600929.056729.2782aboveAARC32.723733.4699
LT37.106437.1818
Electricity production in relation to electricity consumption (%) MT151.235087.7550
2016161.300096.1733100.2438aboveAARC154.6132119.9279X
LT171.4984157.8941
RES usage degree in electricity consumption (%) MT7.947714.0023X
20167.100028.600027.2563belowAARC9.419251.3525
LT6.24897.6525
Population using the water supply system (%) MT94.950095.5500
201696.800091.946792.2500aboveAARC97.192099.5775
LT95.612996.0263X
Population using the sewage system (%) MT70.550086.3500
201672.400069.760069.9250aboveAARC76.3100104.6259
LT67.302571.5697X
Population using the gas supply system (%) MT42.080042.8000X
201641.900049.986749.4813belowAARC42.059543.0297
LT41.900242.0908
Water consumption for national economy and population purposes per inhabitant (cubic hectometres per inhabitant) MT113.0577120.1648
2017132.9369263.0066254.8772belowAARC134.8742160.4449X
LT116.3491119.6490
Share of legally protected areas of special natural value in the total surface area (%) MT27.283427.4026
201727.606434.033633.6319belowAARC27.589727.3899X
LT27.343127.4037
Share of surface areas subject to local spatial development plans in the total surface area (%) MT42.721353.5182
201640.546530.805031.4138aboveAARC42.514856.5021
LT40.900343.3453X
Share of people inhabiting cities with a population of up to 20.000 (%) MT21.025320.9549X
201720.933114.247614.6655aboveAARC21.071422.8044
LT21.438321.8874
Share of people inhabiting cities with a population from 20.000 to 100.000 (%) MT19.440819.8658
201718.908018.664618.6798aboveAARC18.757017.0362
LT18.600918.0647X
Share of people inhabiting cities with a population above 100.000 (%) MT11.907111.6172
201712.942526.031825.2137belowAARC12.997013.6689
LT12.134212.1140X
Utilised railway line density (total) (km per 100 km2 of surface area) MT8.17177.3517X
20178.20006.48006.5875aboveAARC8.13157.3525
LT8.47028.2748
Density of public roads with improved pavements (km per 100 km2 of surface area) MT84.871489.8429
201784.900091.960091.5188belowAARC85.469492.6079X
LT83.774985.1423
Share of buses running on alternative fuel in the total number of buses used in the urban transport services (%) MT33.4904155.3030
201723.339317.663218.0180aboveAARC64.698613,322,286.6
LT22.729545.5479X
** MT—monotonic trend; AARC—yearly average change rate; LT—logarithmic trend; ET—exponential trend. Source: own elaboration.
Table 5. Implementation of priority axes as part of the ROP 2007–2013 (status as of 2014) and ROP 2014–2020 (status as of 2021).
Priority AxisImplementation of Priority AxisShare of Total Expenditure (%)
Opolskie Voivodeship Regional Operational Programme 2007–2013
I. Improvement in the region’s economic attractiveness770 agreements worth PLN 1810.38 million50.0
II. Information society33 agreements worth PLN 148.59 million4.1
III. Transport118 agreements worth PLN 739.41 million20.4
IV. Environmental protection90 agreements worth PLN 739.41 million9.5
V. Science infrastructure and higher education124 agreements worth PLN 298.74 million8.2
VI. Mobilisation of urban and degraded areas44 agreements worth PLN 218.36 million6.1
VII. Technical aid14 agreements worth PLN 62.57 million1.7
Opolskie Voivodeship Regional Operational Programme 2014–2020
I. Innovations in the economy90 agreements worth EUR 95.7 million (PLN 440.22 million) *7.4
II. Competitive economy345 agreements worth EUR 126.4 million (PLN 581.44 million) *9.8
III. Low-emission economy140 agreements worth EUR 187.1 million (PLN 860.66 million) *14.5
IV. Hazard prevention6 agreements worth EUR 23.4 million (PLN 107.64 million) *1.8
V. Environmental, cultural, and natural heritage protection229 agreements worth EUR 127.9 million (PLN 588.34 million) *9.9
VI. Sustainable transport for the mobility of residents67 agreements worth EUR 252.7 million (PLN 1162.42 million) *19.6
VII. Competitive labour market174 agreements worth EUR 91 million (PLN 418.6 million) *7.1
VIII. Social integration240 agreements worth EUR 98.4 million (PLN 452.64 million) *7.6
IX. High-quality education238 agreements worth EUR 75.5 million (PLN 347.3 million) *5.8
X. Investments in social infrastructure163 agreements worth EUR 170.3 million (PLN 783.38 million) *13.2
XI. Technical aid24 agreements worth EUR 43 million (PLN 197.8 million) *3.3
* amounts expressed in EUR converted into PLN at the exchange rate of XII 2021. Source: Own elaboration based on: [99,100].
Publisher’s Note: MDPI stays neutral with regard to jurisdictional claims in published maps and institutional affiliations.

