1. Introduction
With the increase of distributed renewable energy and DC load in the low voltage (LV) distribution system, applying LVDC in nearly zero energy buildings (NZEB) can simplify the converter equipment and reduce power loss. However, the energy efficiency improvement for different buildings brought by DC power distribution is different. For energy efficiency evaluations in traditional LVAC buildings, IEC released a systematic approach to continually assess energy efficiency [
1]. In China, a national standard was issued in February 2015 [
2], which stipulates the calculation and evaluation of energy efficiency for medium and low voltage power distribution networks of 10 (20) kV and below.
Energy consumption of various types of buildings, such as education, office and commercial buildings, is analyzed in [
3], which pointed out the importance of energy efficiency improvement in building zero-carbonization, lacking a specific modeling method. In order to figure out the adaptive structure and configuration of NZEB, an accurate energy evaluation index has to be researched. Four different architectures were proposed for rural areas in [
4], which lacked a specific definition and calculation method of efficiency. Early research about DC energy efficiency primarily focused on the data center scenario [
5,
6]. Related analysis shows that 380 V DC datacenters are more efficient than AC systems no matter with or without PV integration. In recent years, some scholars paid attention to energy efficiency of DC distribution systems [
7,
8]. Los Alamos National Laboratory issued a report about the estimation of technical and economic benefits for DC microgrids where energy efficiency is an important factor for the comprehensive analysis [
7]. The results show that the DC has a 2–3% advantage in efficiency compared to AC when the load and generation are well-matched. However, the above work is only a preliminary analysis and many factors such as load variation and detailed converter efficiency were not considered. Gelani et al. [
8] proposed a DC distribution model considering detailed efficiency model of DC/DC converters, but the comparison between AC and DC systems related to energy efficiency was not analyzed.
To analyze the energy savings potential by using DC form with renewable energy in residential buildings [
9,
10,
11], Vossos V et al. [
9] established a simulation model to compare energy efficiency between AC and DC distribution systems in buildings with photovoltaics (PV). The results showed that the DC system savings could reach 5–14% of total electricity load for houses. However, the research lacked the specific calculation of different branches, which mainly focused on statistical analysis. Glasgo B et al. [
10] performed a Monte Carlo simulation to assess energy savings by using DC distribution, which showed that the DC homes’ baseline energy consumption and emissions could be reduced by 7–16% with the DC conversion of air conditioning condensing units. However, the mentioned research ignored the correlation of the power correction of converter transmission. Gelani H et al. [
11] proposed a system efficiency model for AC and DC distribution networks, which revealed that the DC distribution system presents a better efficiency compared to the AC distribution network by 2.3%. However, this study lacked the correlation analysis and sensitivity analysis of other influencing factors. The power transmission and transaction price between AC and DC hybrid systems are modeled and analyzed in [
12], but there is no analysis of system energy efficiency and suggestions on PV and energy storage configuration capacity of different scale systems.
However, the above research is mainly focused on the small-scale distribution system in residential buildings. Those conclusions cannot be applied to commercial buildings, which integrated lots of PV and DC loads. Some extended work for energy efficiency evaluation of commercial buildings was proposed subsequently. Gerber D L et al. [
13] proposed a simulation-based efficiency comparison of AC and DC power distribution networks in commercial buildings, which indicated that an office building using a DC system had an expected baseline of 12–18% savings without the correction of converters. The early method of efficiency or energy-savings analysis for the DC power distribution system mainly considered the average load level of systems, where generation and load profiles, as well as the efficiency variation of converters in different load conditions were not considered [
7]. Then considering that the energy efficiency of converter changes with the change of power flow, the time-based simulation considering the generation and load profiles was proposed [
8,
9,
10,
11,
12,
13], the connection between converter efficiency and power flow was applied to reflect the effect of changing load on system efficiency.
On the other hand, though the adoption of a low-voltage DC system can simplify the system structure, improve the system efficiency, reduce the cost of electricity for users, and expand the application of DC appliances [
14]. The main constraints of DC development include high renovation costs, uneven distribution of income, and difficulty in promotion. The redistribution of DC income lacks a comprehensive evaluation method. Nikolaos analyzed the constructional interventions in the conversion of NZEB, which did not consider the cost apportionments of the constructional interventions [
15]. Therefore, it is necessary to carry out an economic evaluation of multi-stakeholders. The challenges and interactions between users, tech-providers, policymakers, and constructors were analyzed in [
16], which described the framework of the interaction of different stakeholders in building zero-carbonization but lacks a clear way of revenue distribution. Reference [
17] considered the respective interests and needs of DG operators, distribution companies and users, and proposed a coordinated planning method for an active distribution network (ADN) under the participation of multi-stakeholders, which realized the optimal allocation of resources in the distribution network. Reference [
18] considered the interests of load service entities and load aggregators and proposed a dynamic pricing strategy for active distribution networks that considered demand response by using two-level optimization. Although the above research considered the different interest demands of multi-stakeholders in ADN, it did not analyze the game relationship of coexistence of cooperation and competition. Literature [
19,
20] introduced game theory into microgrid energy management, considering the competitive and cooperative relationship between microgrid operators and load aggregators, respectively proposed non-cooperative game and Steinberg game models in the microgrid. However, the income of load aggregators was not considered in their research, and the lack of bargaining power of aggregators limited their market participation ability, and it is difficult to release the enthusiasm of demand response.
To sum it up, the above research did not consider an accurate power flow calculation in each simulation, which might affect the power loss results. In terms of benefit distribution, how to reasonably distribute the interests of various subjects still needs further research. This paper considers the difference in LVAC and LVDC topology, establishes a system-level energy efficiency evaluation model based on time series simulation considering power flow calculation; and proposes an economic evaluation method that can accurately reflect the income of multi-stakeholders. The main contributions of this paper are as follows:
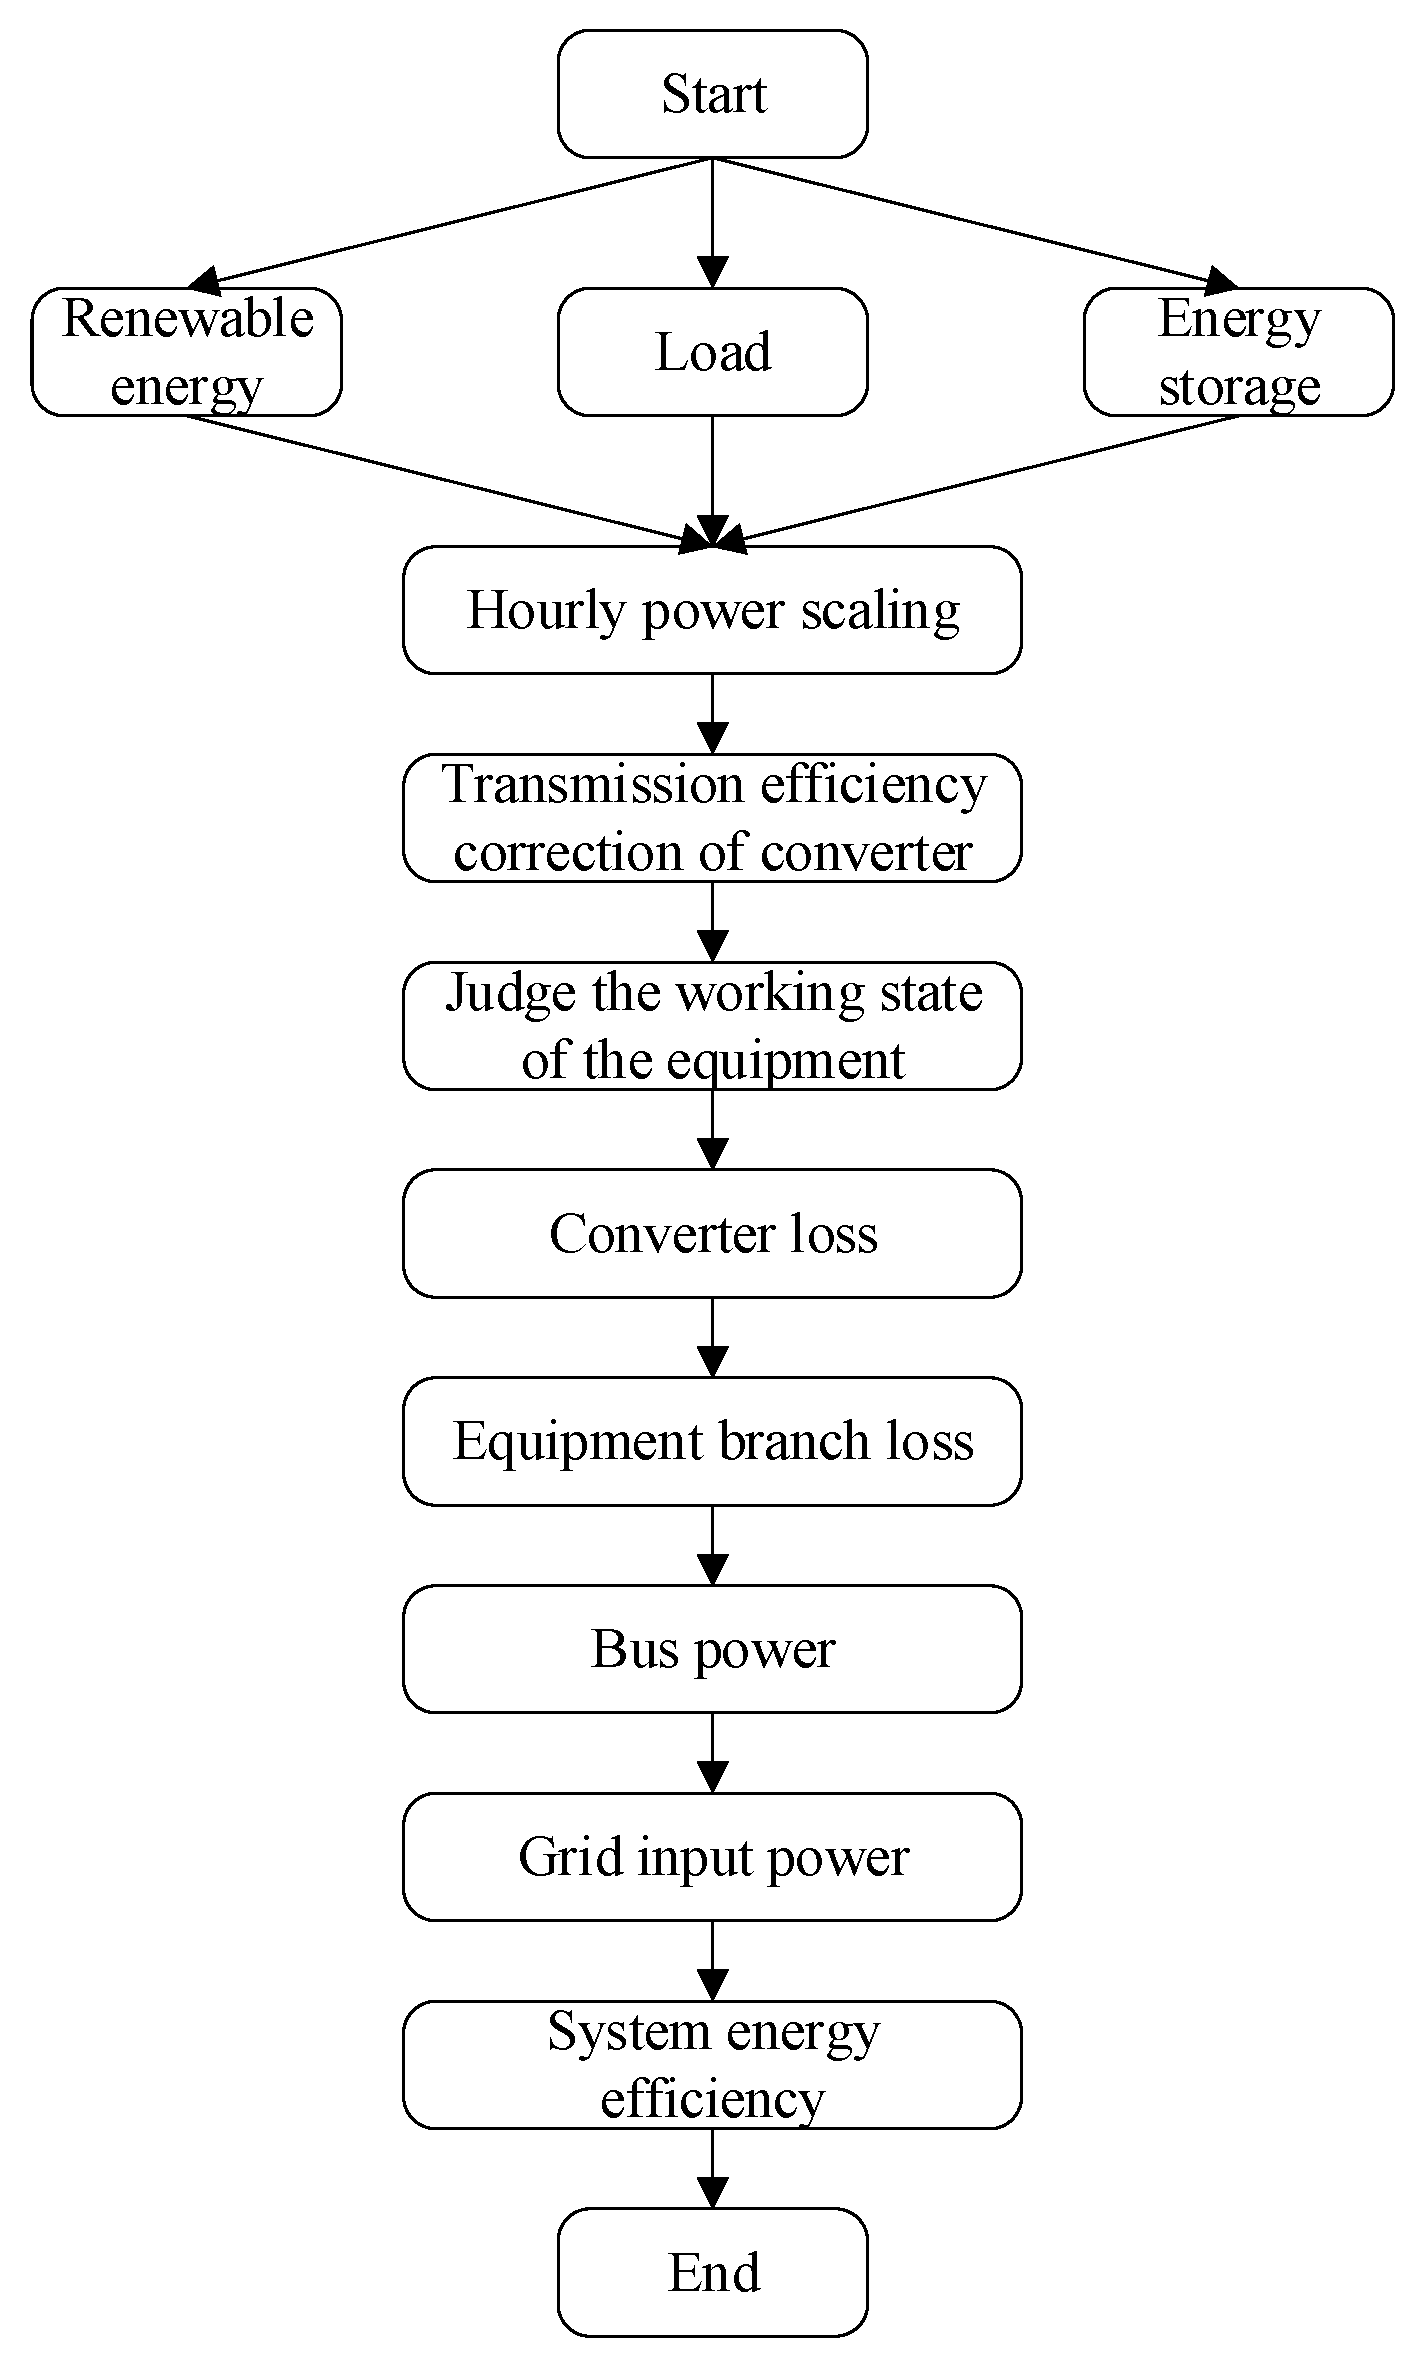
In this paper, a time sequential simulation is proposed based on energy efficiency model with accurate load flow calculation for LVAC and LVDC networks, where the piecewise linear fitting is applied to model the function between converter efficiency and its power flow.
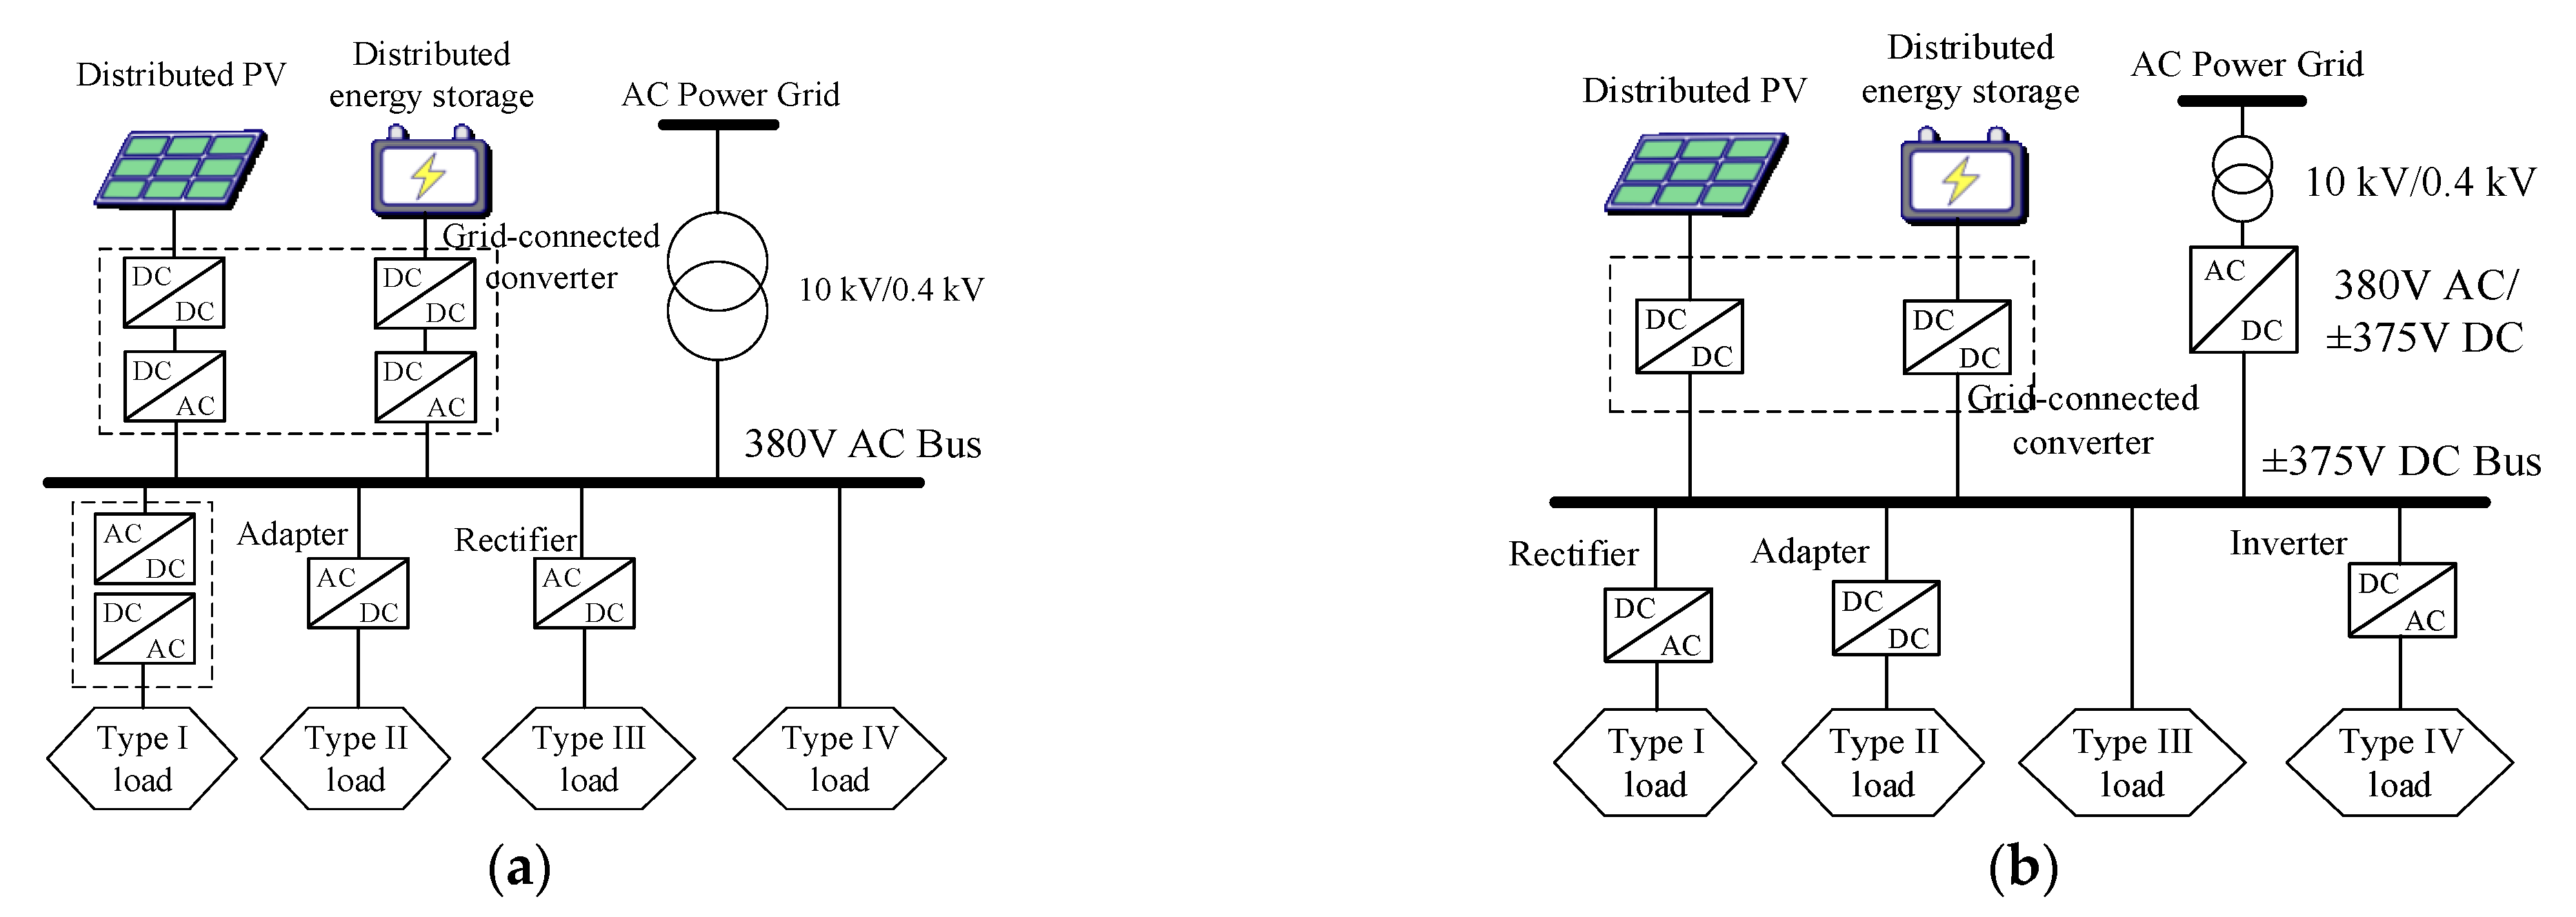
According to the current load type, the benchmark comparison models of LVAC and LVDC distribution power systems are established. Then a comprehensive and fair system energy efficiency evaluation indicator is defined considering temporal characteristics.
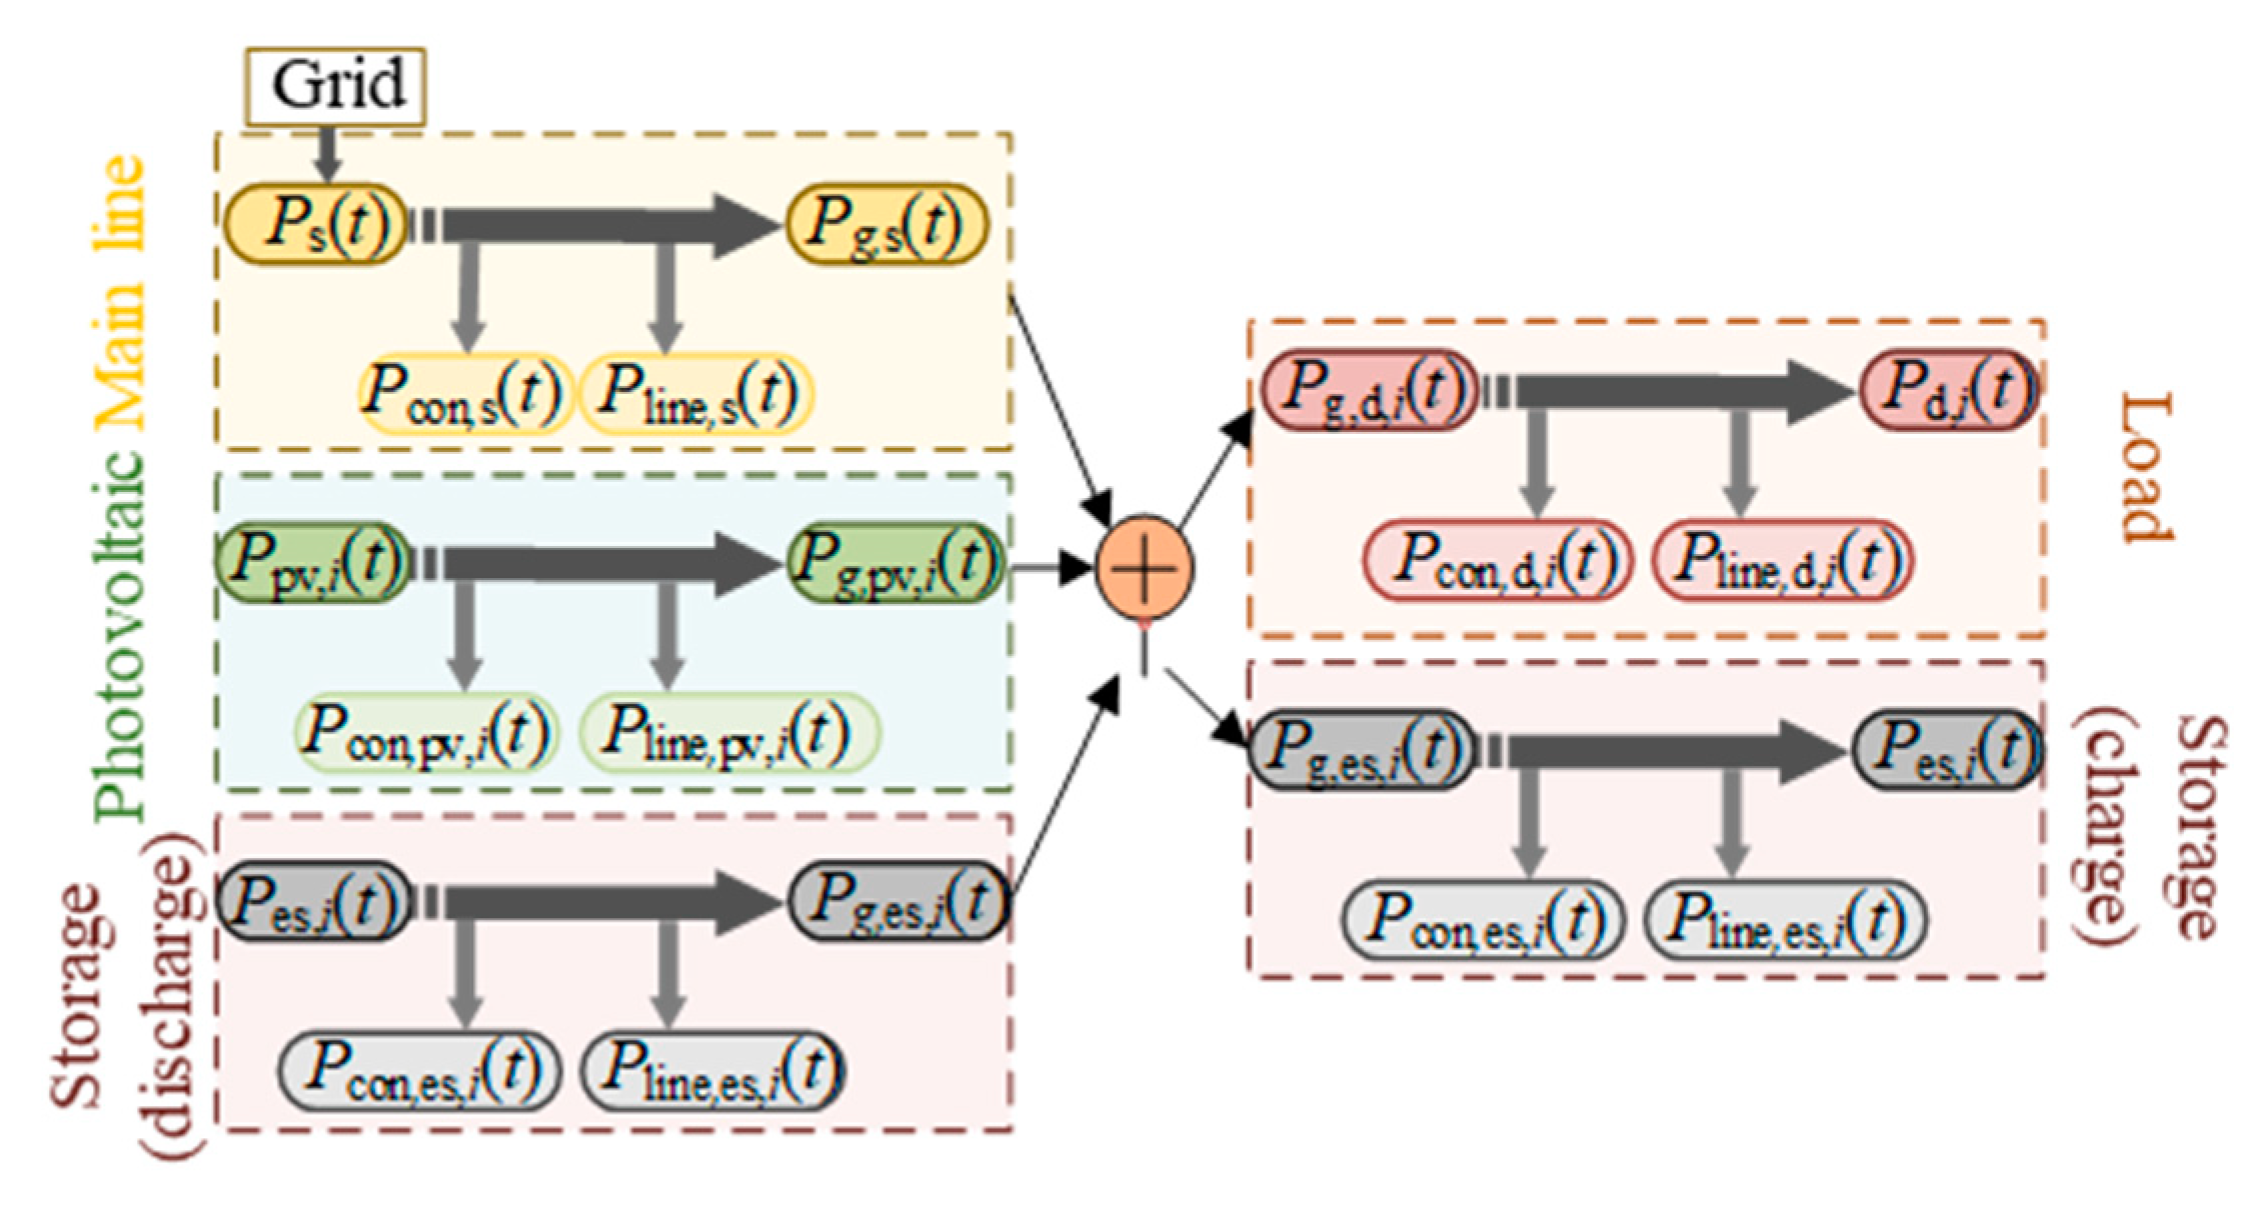
The phasor diagram method is employed to obtain the power flow results for LVAC and LVDC systems, based on which the accurate power loss calculation equations are derived for each branch including converters and power lines.
An income distribution method is proposed to adjust the interests of multi-stakeholders, which paves a way for the liberation and promotion of DC distribution.
The efficiency data of converters under different conditions are all from actual experiment results or provided by manufacturers of household appliances applied in numerical case studies.
The rest of this paper is as follows.
Section 2 introduced the typical structure and energy efficiency definition of the LVAC (LVDC) system and gave an accurate trend calculation method and a contrast of the converter and line loss. And a multi-dimensional investment-earning assessment theory was conducted in the LVDC power distribution system.
Section 3 provided a typical case study and deep analysis of efficiency influence factors in 15 different scenarios.
Section 4 concluded this paper and gave some suggestions for future work.
3. Results and Discussion
3.1. Introduction of the Test System
With the development of VSD technology, there are little type IV load used in current industry. So only type I–III load considered in the case studies. All the end use load and corresponding rated power are shown in
Table 3.
The actual installed capacity of PV and distributed energy storage (DES) are 150 kW and 50 kW/100 kWh, respectively. The detailed annual profiles for each type of load and PV are obtained from the actual project operation data. The operation mode of DES is generated according to the time-of-use electricity price in Shenzhen, as shown in
Table 4.
The length of wirings for each load and the resistance for DC and AC systems are shown in
Table 5. The power factor of the AC load and the AC wirings are both set as 0.98.
3.2. Efficiency Comparison of AC and DC Networks in Benchmark Scenario
According to the hourly simulation calculation results, the annual energy efficiency indicators of the AC and DC distribution networks are calculated, as shown in
Table 6. It indicates that from the perspective of annual average results, there is about 6% energy savings in DC system compared with the AC system.
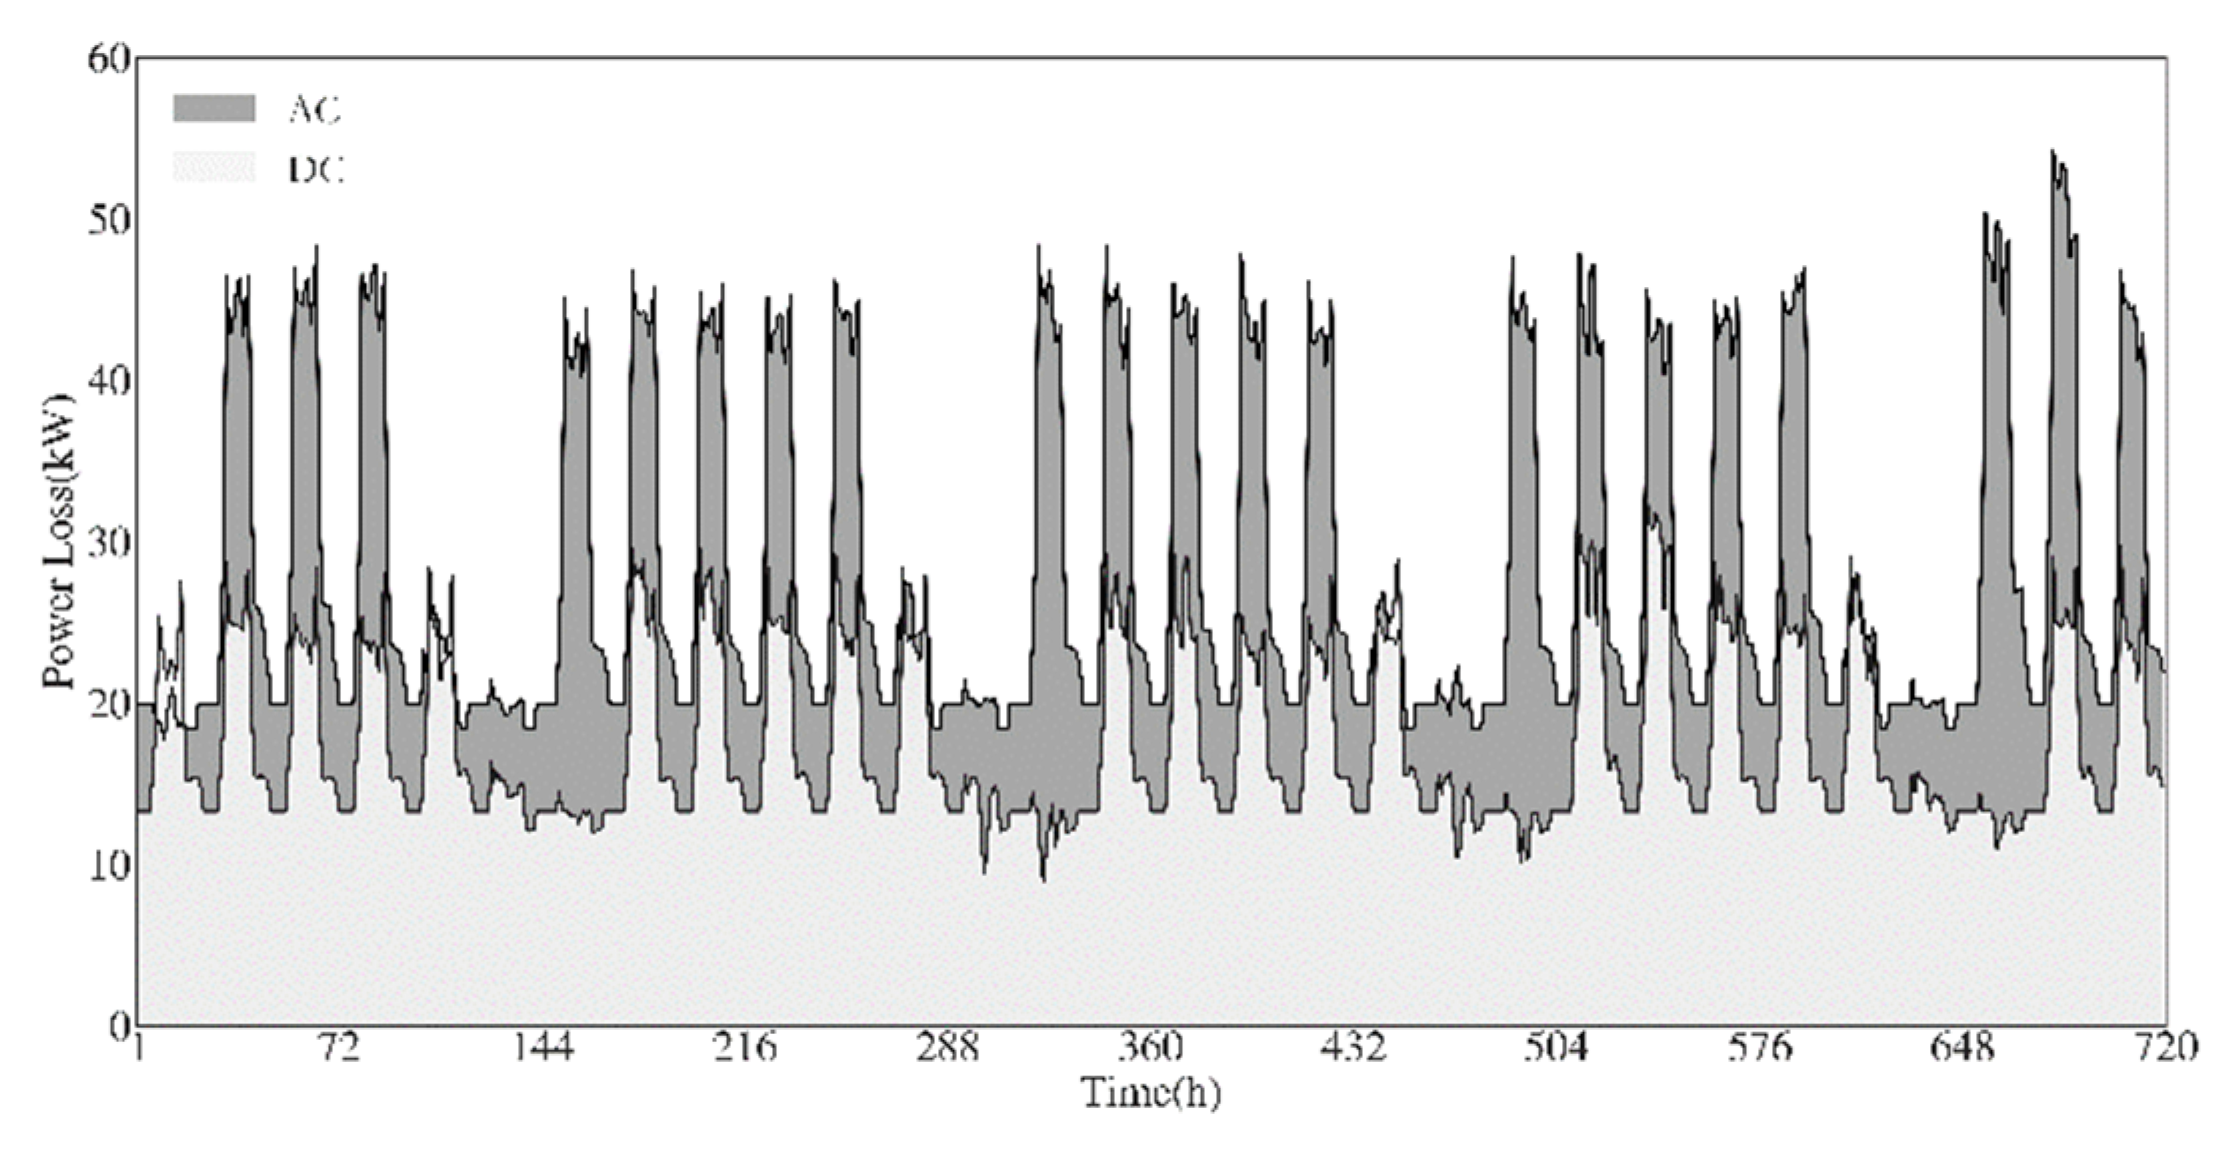
In order to study the temporal characteristics of power loss, the hourly power loss data for DC and AC systems in a month are selected and plotted in
Figure 6. Obviously, the power loss of an AC system is higher than that of DC all the while. For the two systems, the power loss profiles show periodicity. The energy efficiency curves on working days and weekends are quite different. In summary, power loss has a strong positive correlation with load demand.
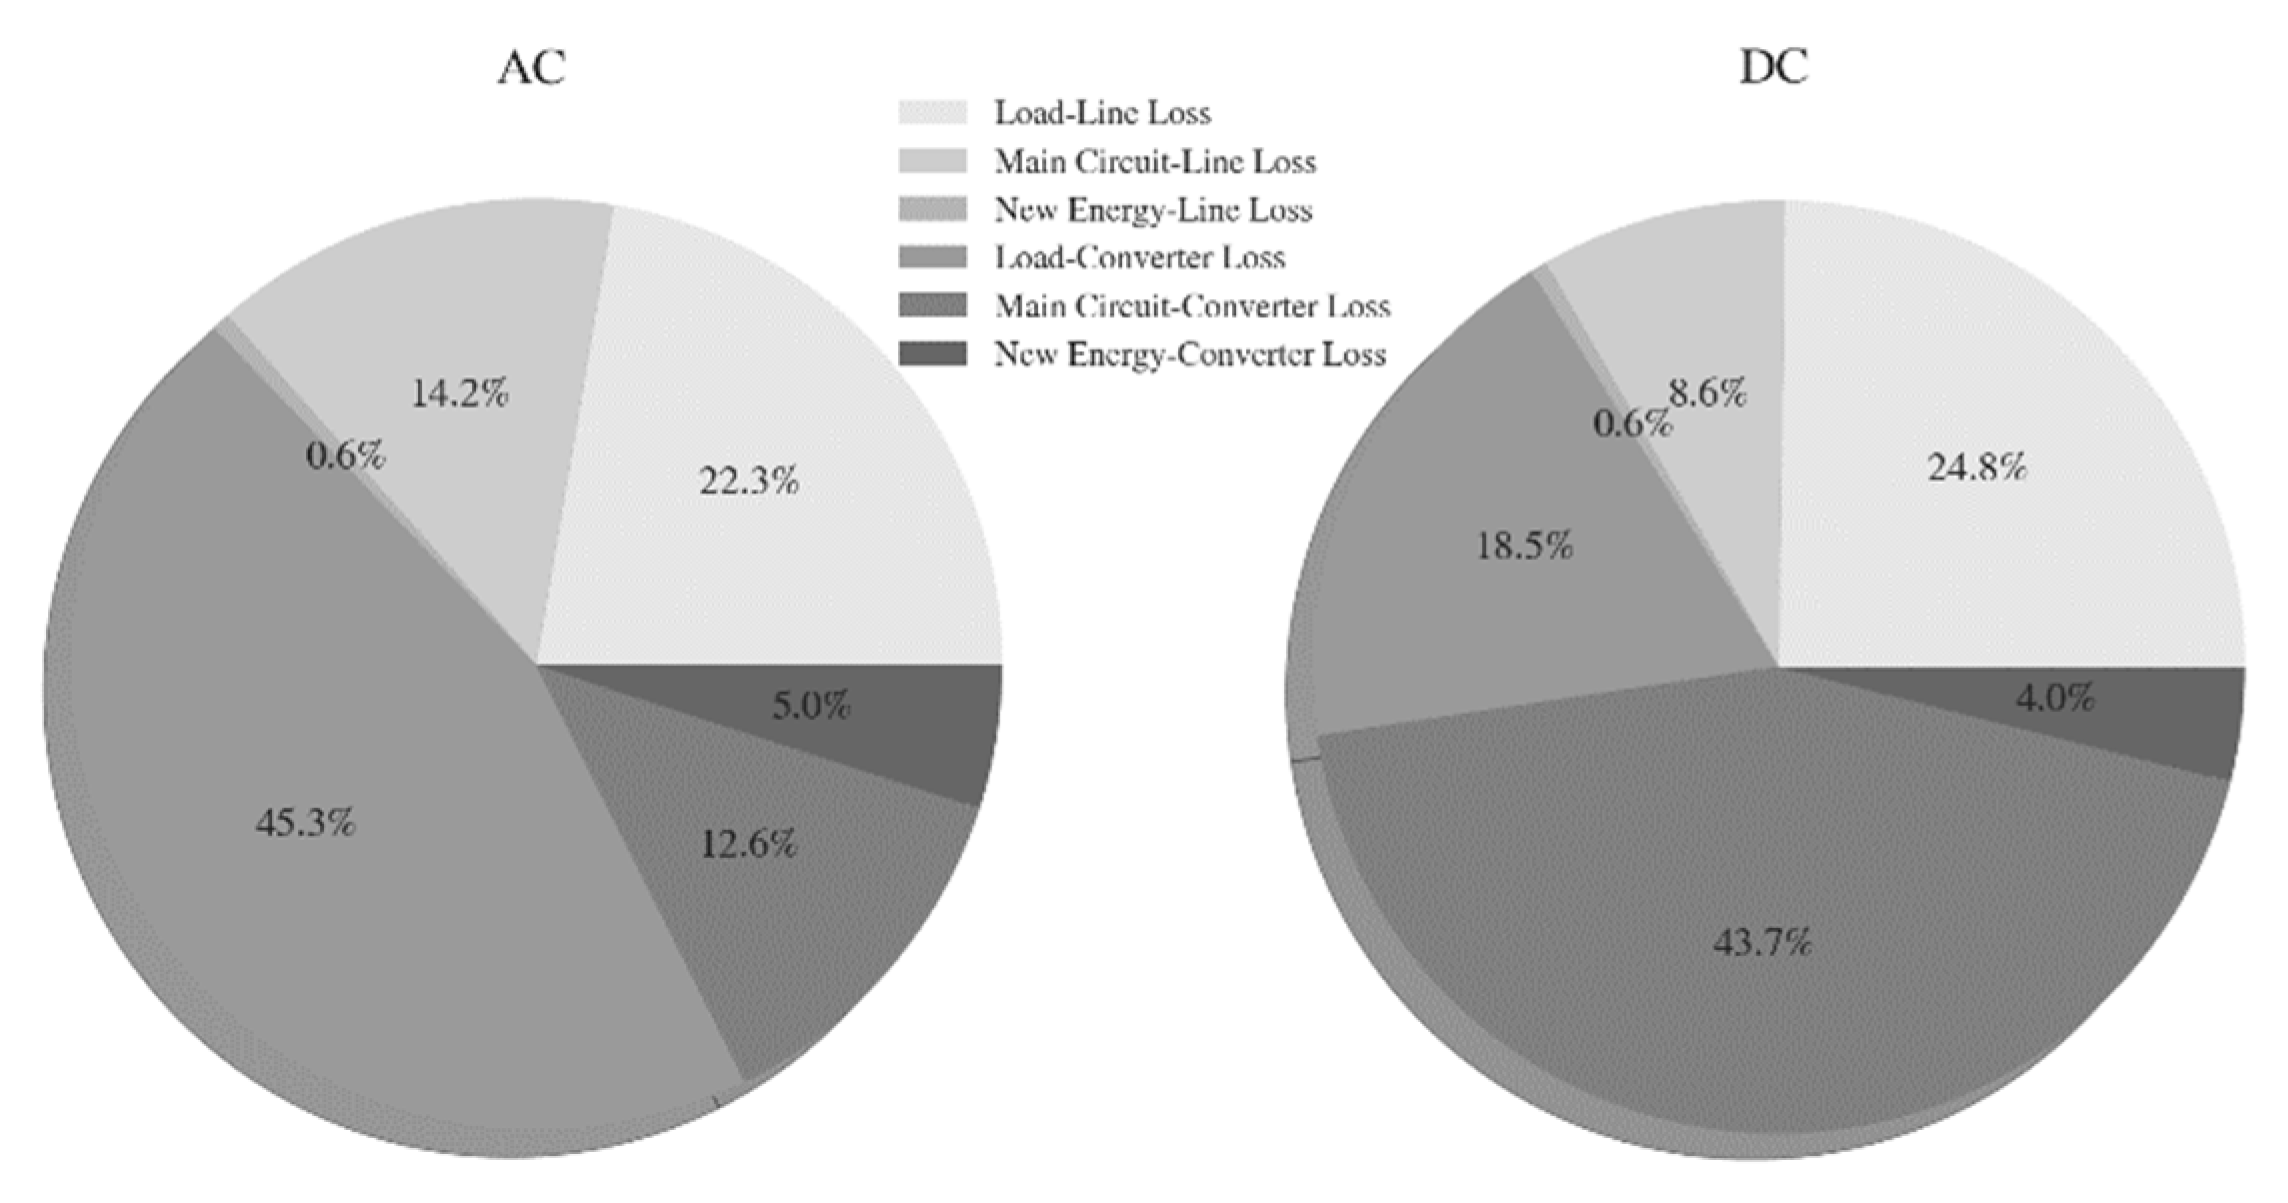
According to the energy efficiency evaluation method, the system power loss is divided into three parts: load branch, DG branch and grid tie branch. In each part, the power loss includes line loss and converter loss. As a result, there are, in total, 6 types of power loss in the system. The power energy loss is classified and counted according to the above types and plotted in
Figure 7 in the bar graph. It shows a huge difference in the power loss components of the AC and DC systems. In the AC system, the branch converter loss is highest in the total loss components, followed by the branch line loss. While in the DC system, the branch loss reduces significantly due to the energy efficiency promotion of load side converters in the DC system. However, the energy loss in grid tie branches increases with the introduction of AC/DC converters.
3.3. Efficiency Comparison of AC and DC Networks with DG and DES
According to the above analysis, the main energy loss in the LVDC system is the grid tie branch converter loss due to the introduction of the AC/DC converter. With the integration of renewable energy such as DG and DES, the power flow, as well as the energy loss in grid tie branch, would reduce correspondingly. In this section, the efficiency trend is explored with the increase in the capacity of DG and DES. Furthermore, energy efficiency savings resulting from applying the DC system are studied.
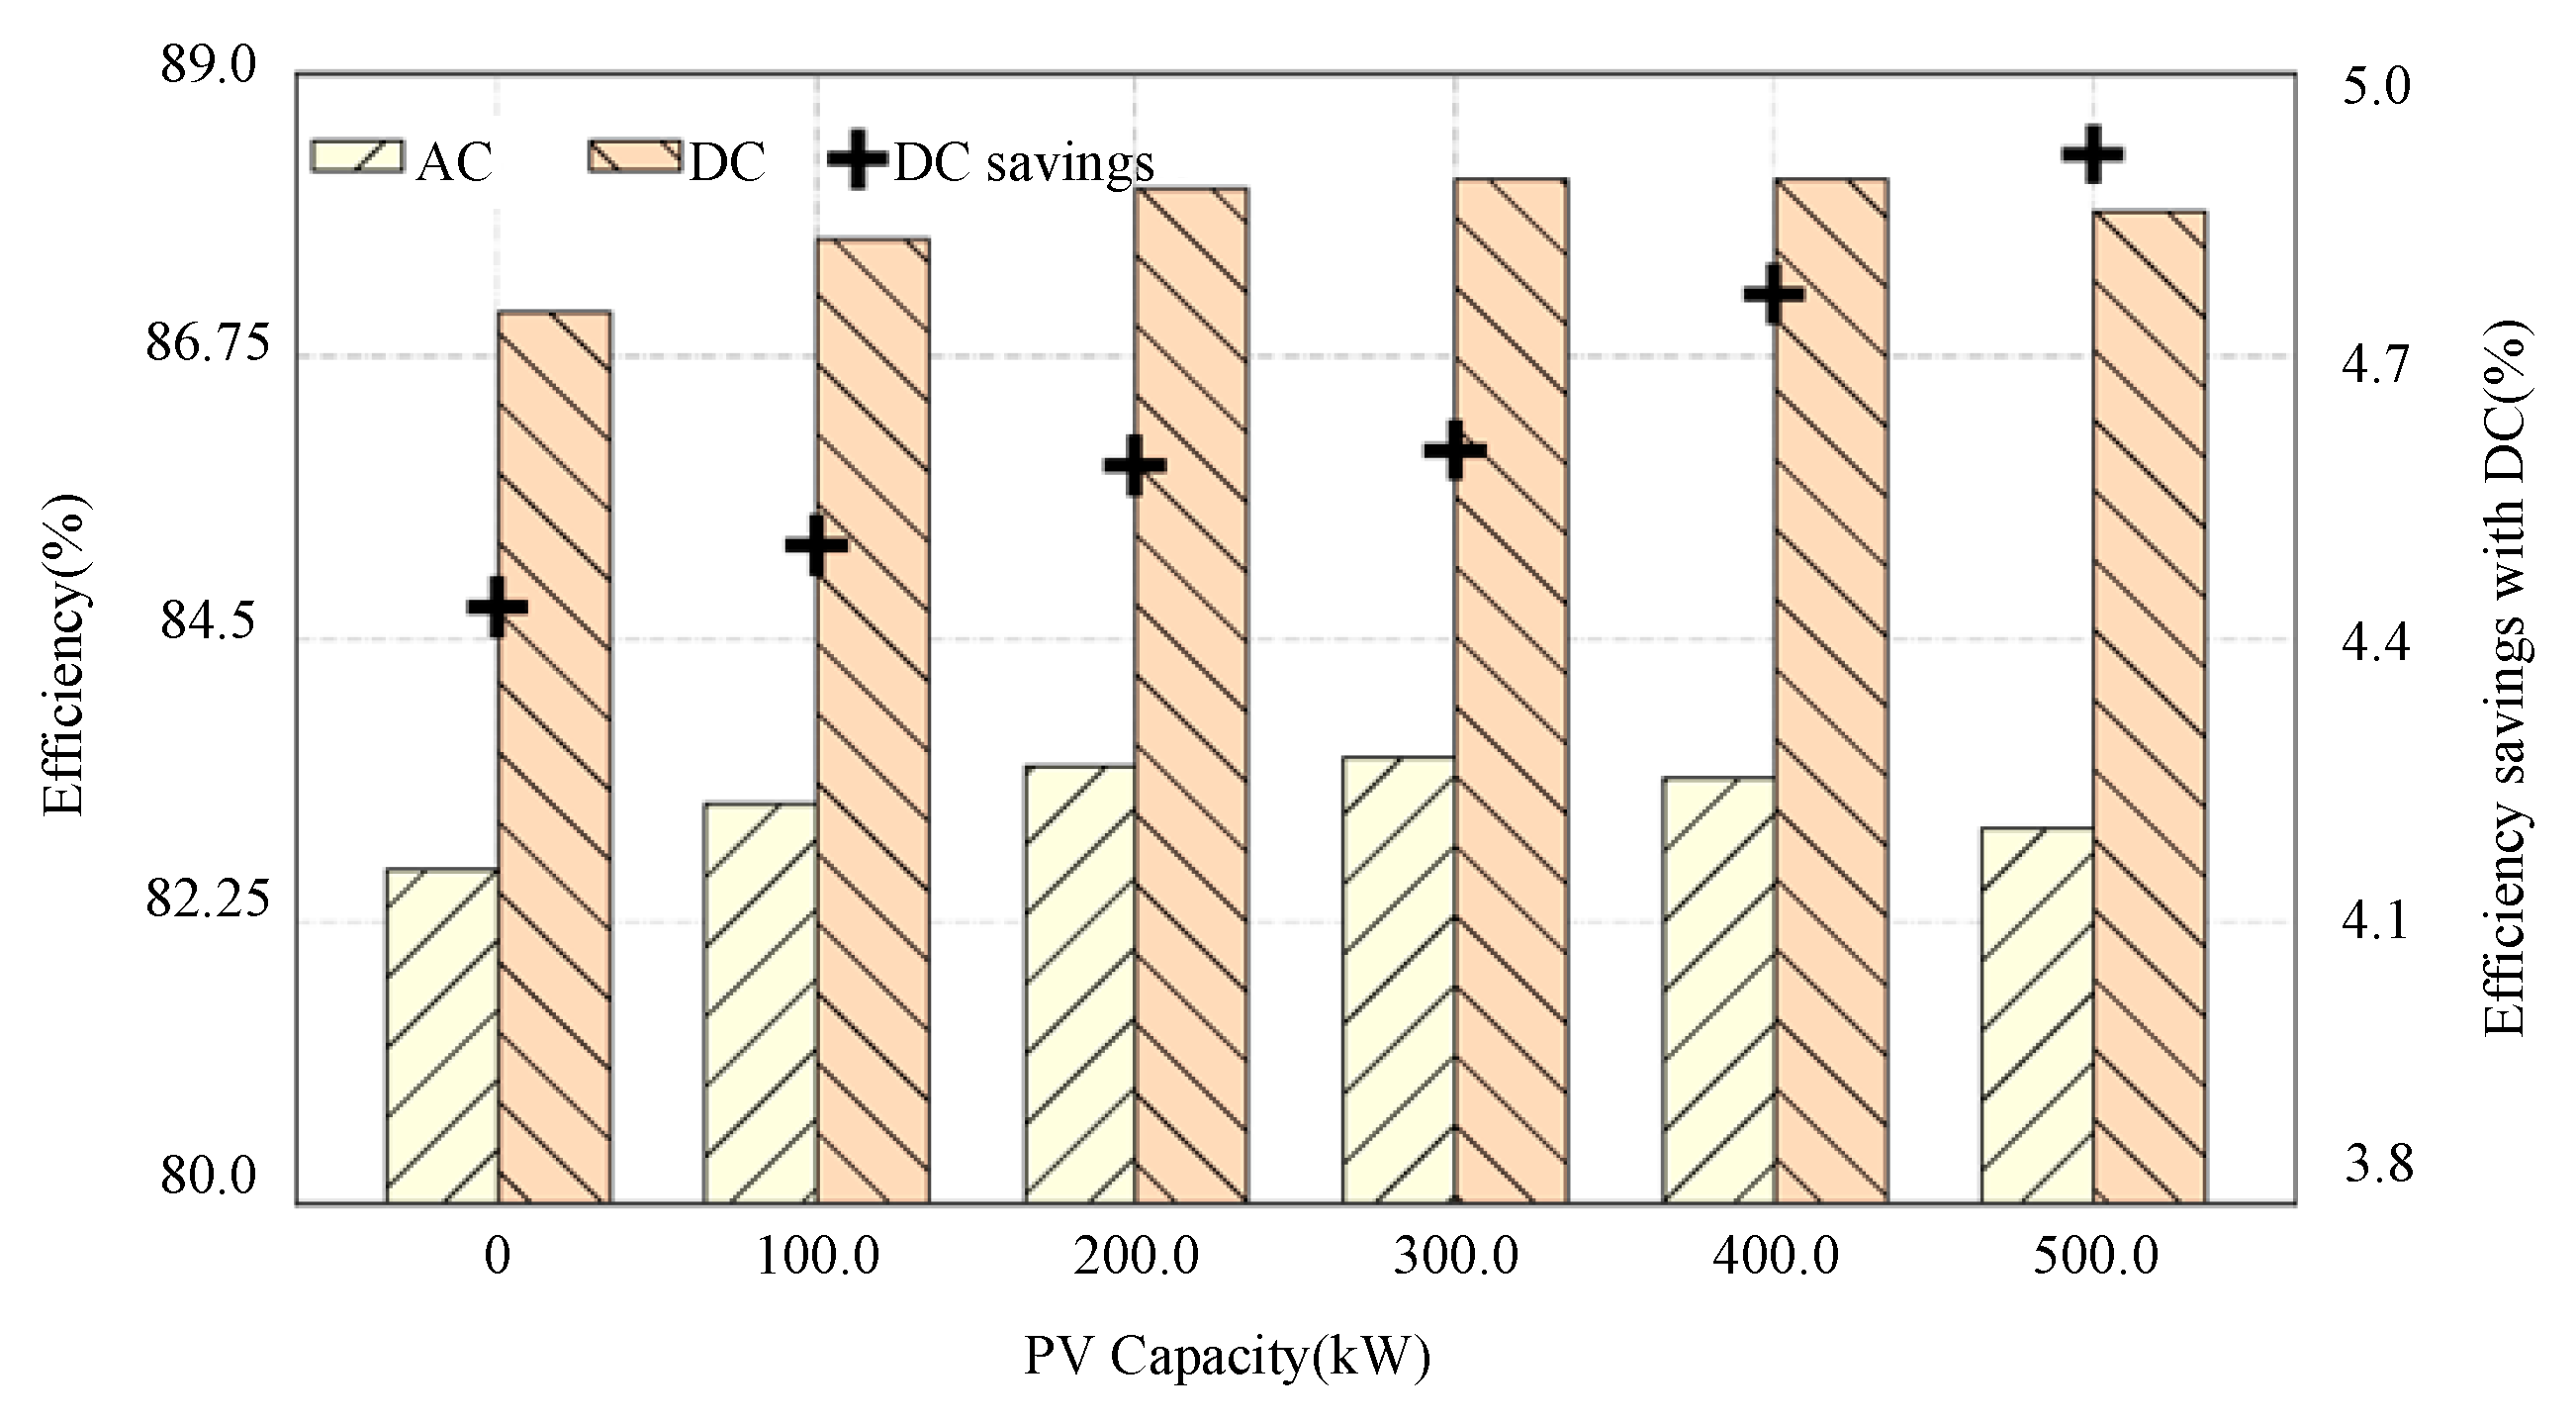
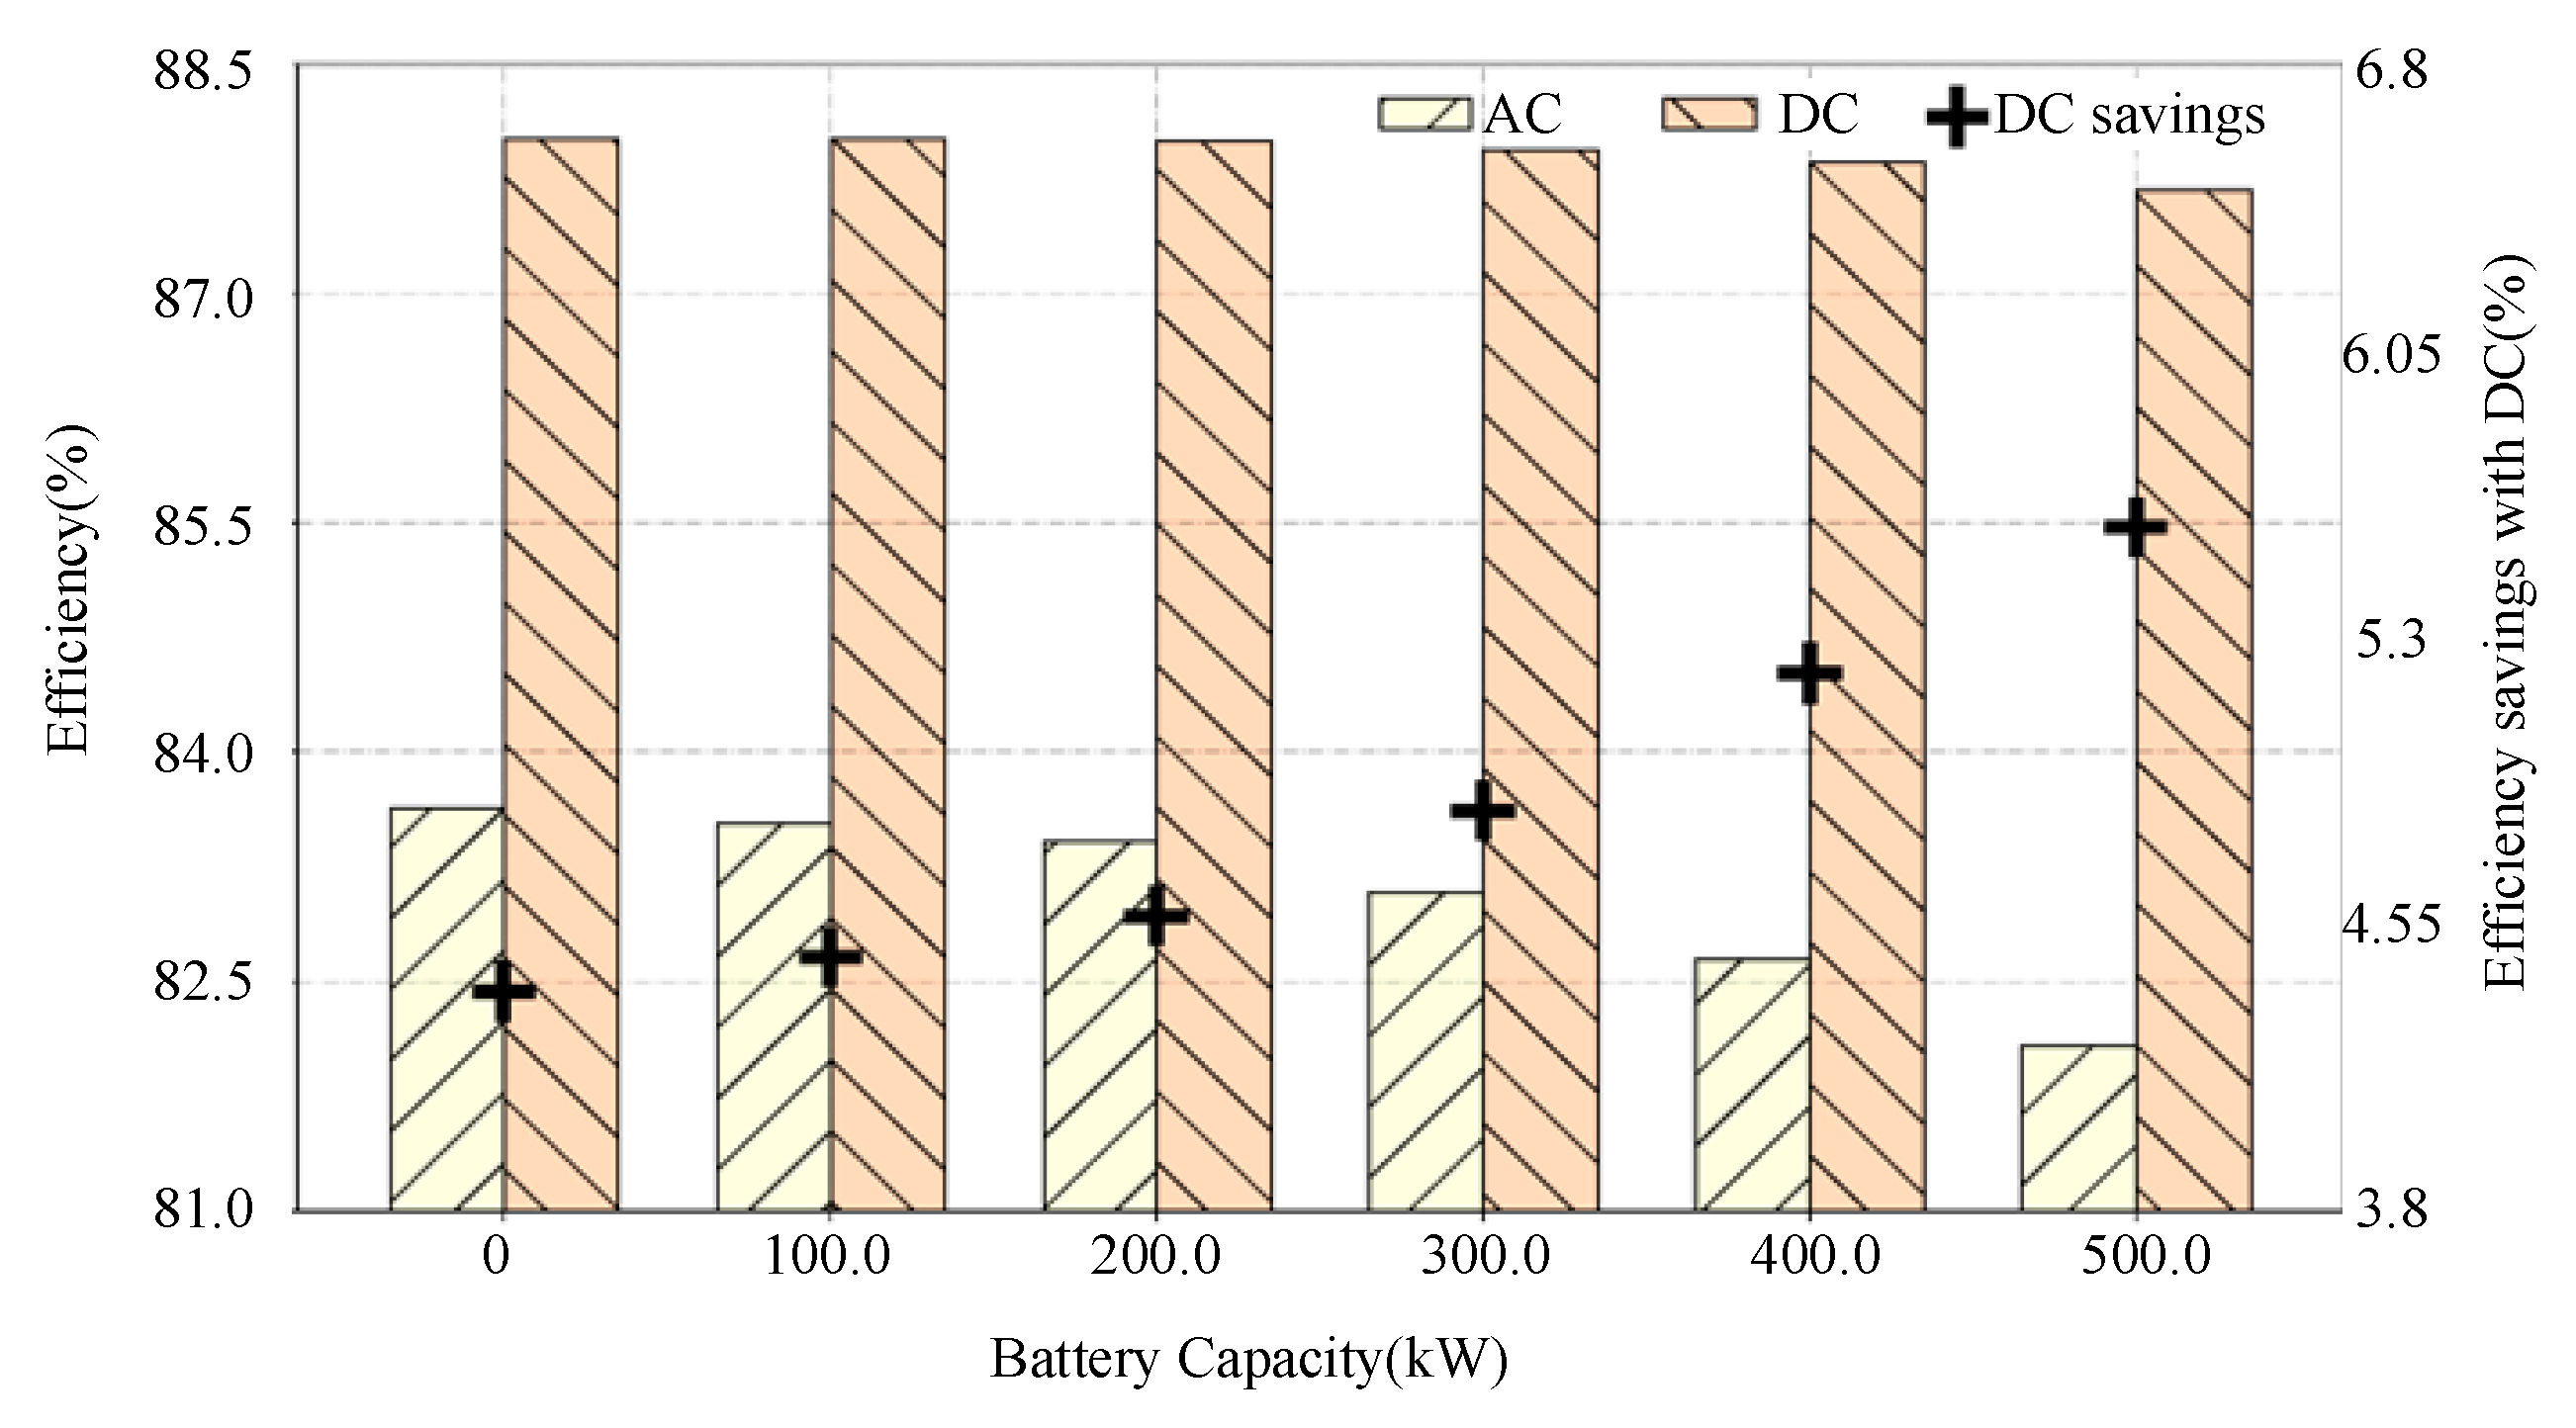
Figure 8 shows the relation between efficiency and its savings with the installed capacity of distributed PV, where the installed capacity of PV is set from 0 to 500 kW. It indicates that with the increase of PV capacity, the efficiency of AC and DC systems both increases first and then decreases slowly. To analyze the variation trend in detail, the grid tie branch energy loss reduces with the increase of PV capacity, while the PV branch energy loss increases. For the simplification, denoting the increasing PV branch energy loss as Δ
E+ and the decreasing grid tie branch energy loss as Δ
E−. When the PV capacity is low, Δ
E+ is bigger than Δ
E− so that the total efficiency increases. However, when the capacity exceeds some threshold value, Δ
E+ would be lower than Δ
E− and the efficiency decreases.
Figure 9 indicates that the efficiency decreases with the increase of DES capacity, which presents a different trend from
Figure 8. The reason is that the additional energy loss brought by DES is bigger than the decreased grid tie branch loss. Furthermore, the energy savings tendency shown in
Figure 8 is the same as in
Figure 9. It shows that with the increase of DG or DES, the efficiency savings by the DC system increases, which indicates that the DC system has more advantage in energy efficiency, especially with high penetration of DG.
3.4. Energy Efficiency Analysis in Typical Scenarios in Tests
Based on the energy efficiency calculation of typical scenarios of NZEB, the topology structure of DC current with the highest energy efficiency improvement compared with the AC distribution network is analyzed. In order to develop the research results to more normal scenes with different photovoltaic and load, deep research on the power supply topologies is necessary to analyze. Since air conditioners are the main energy consumption [
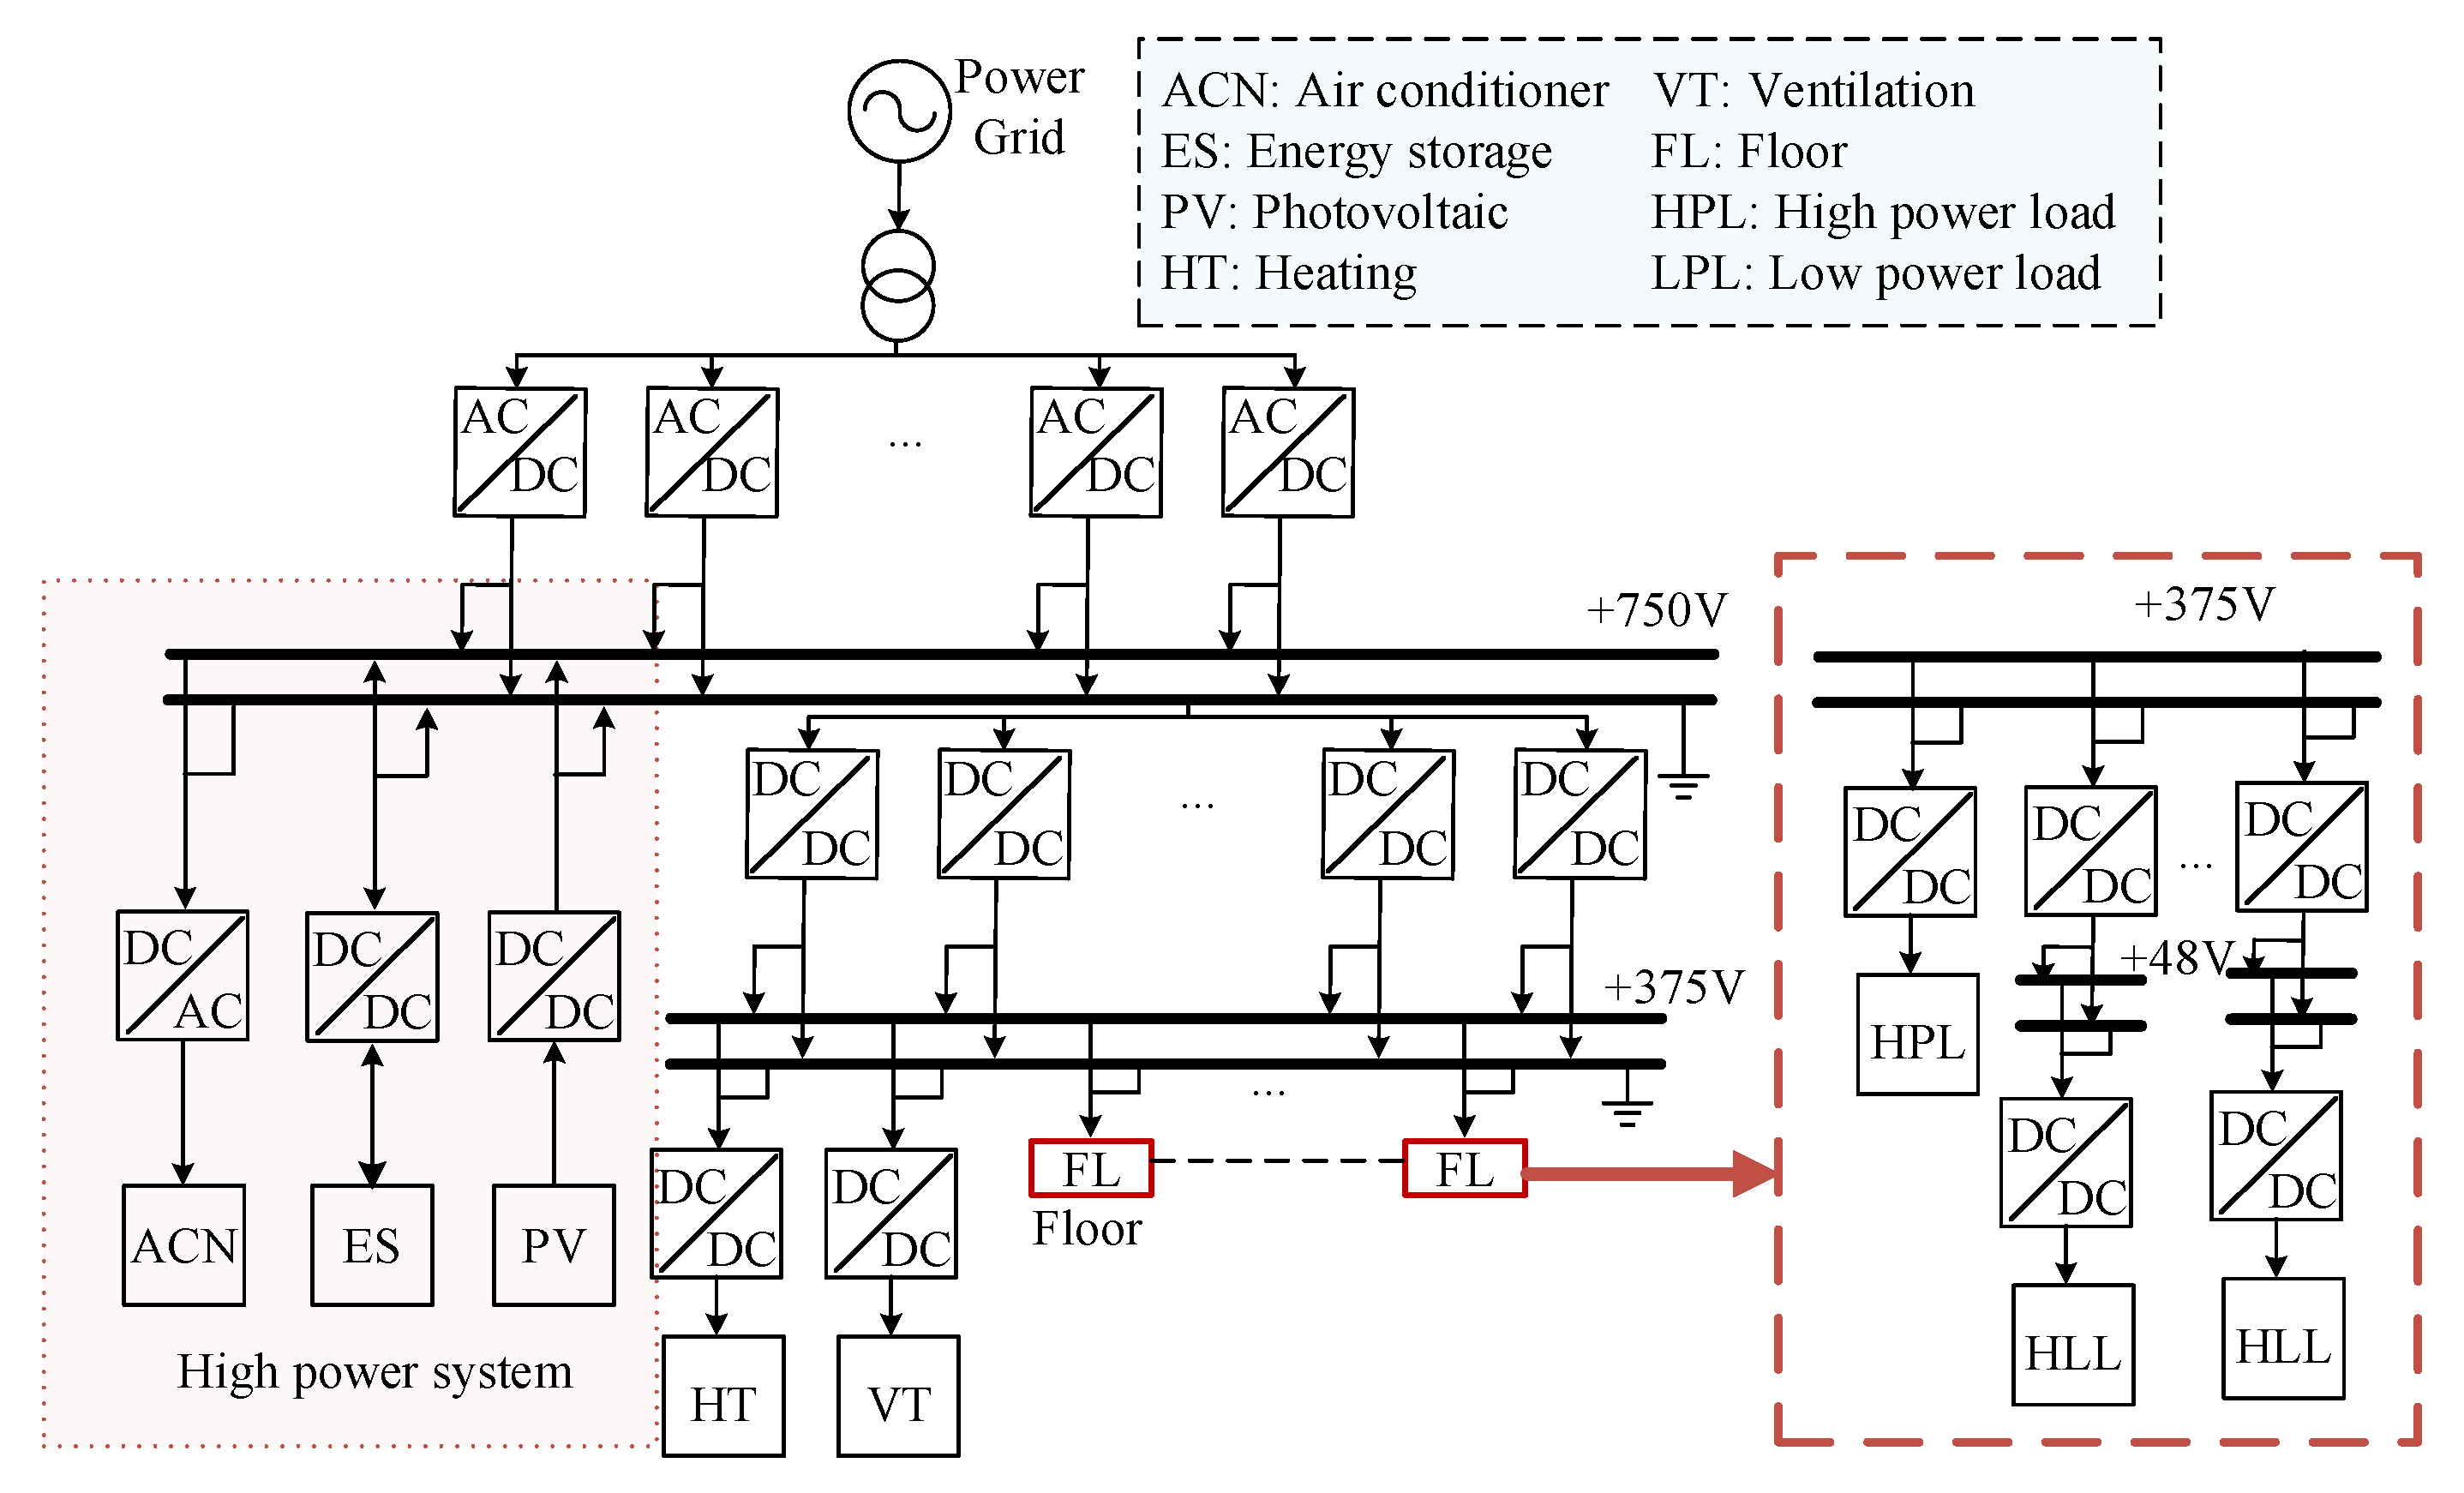
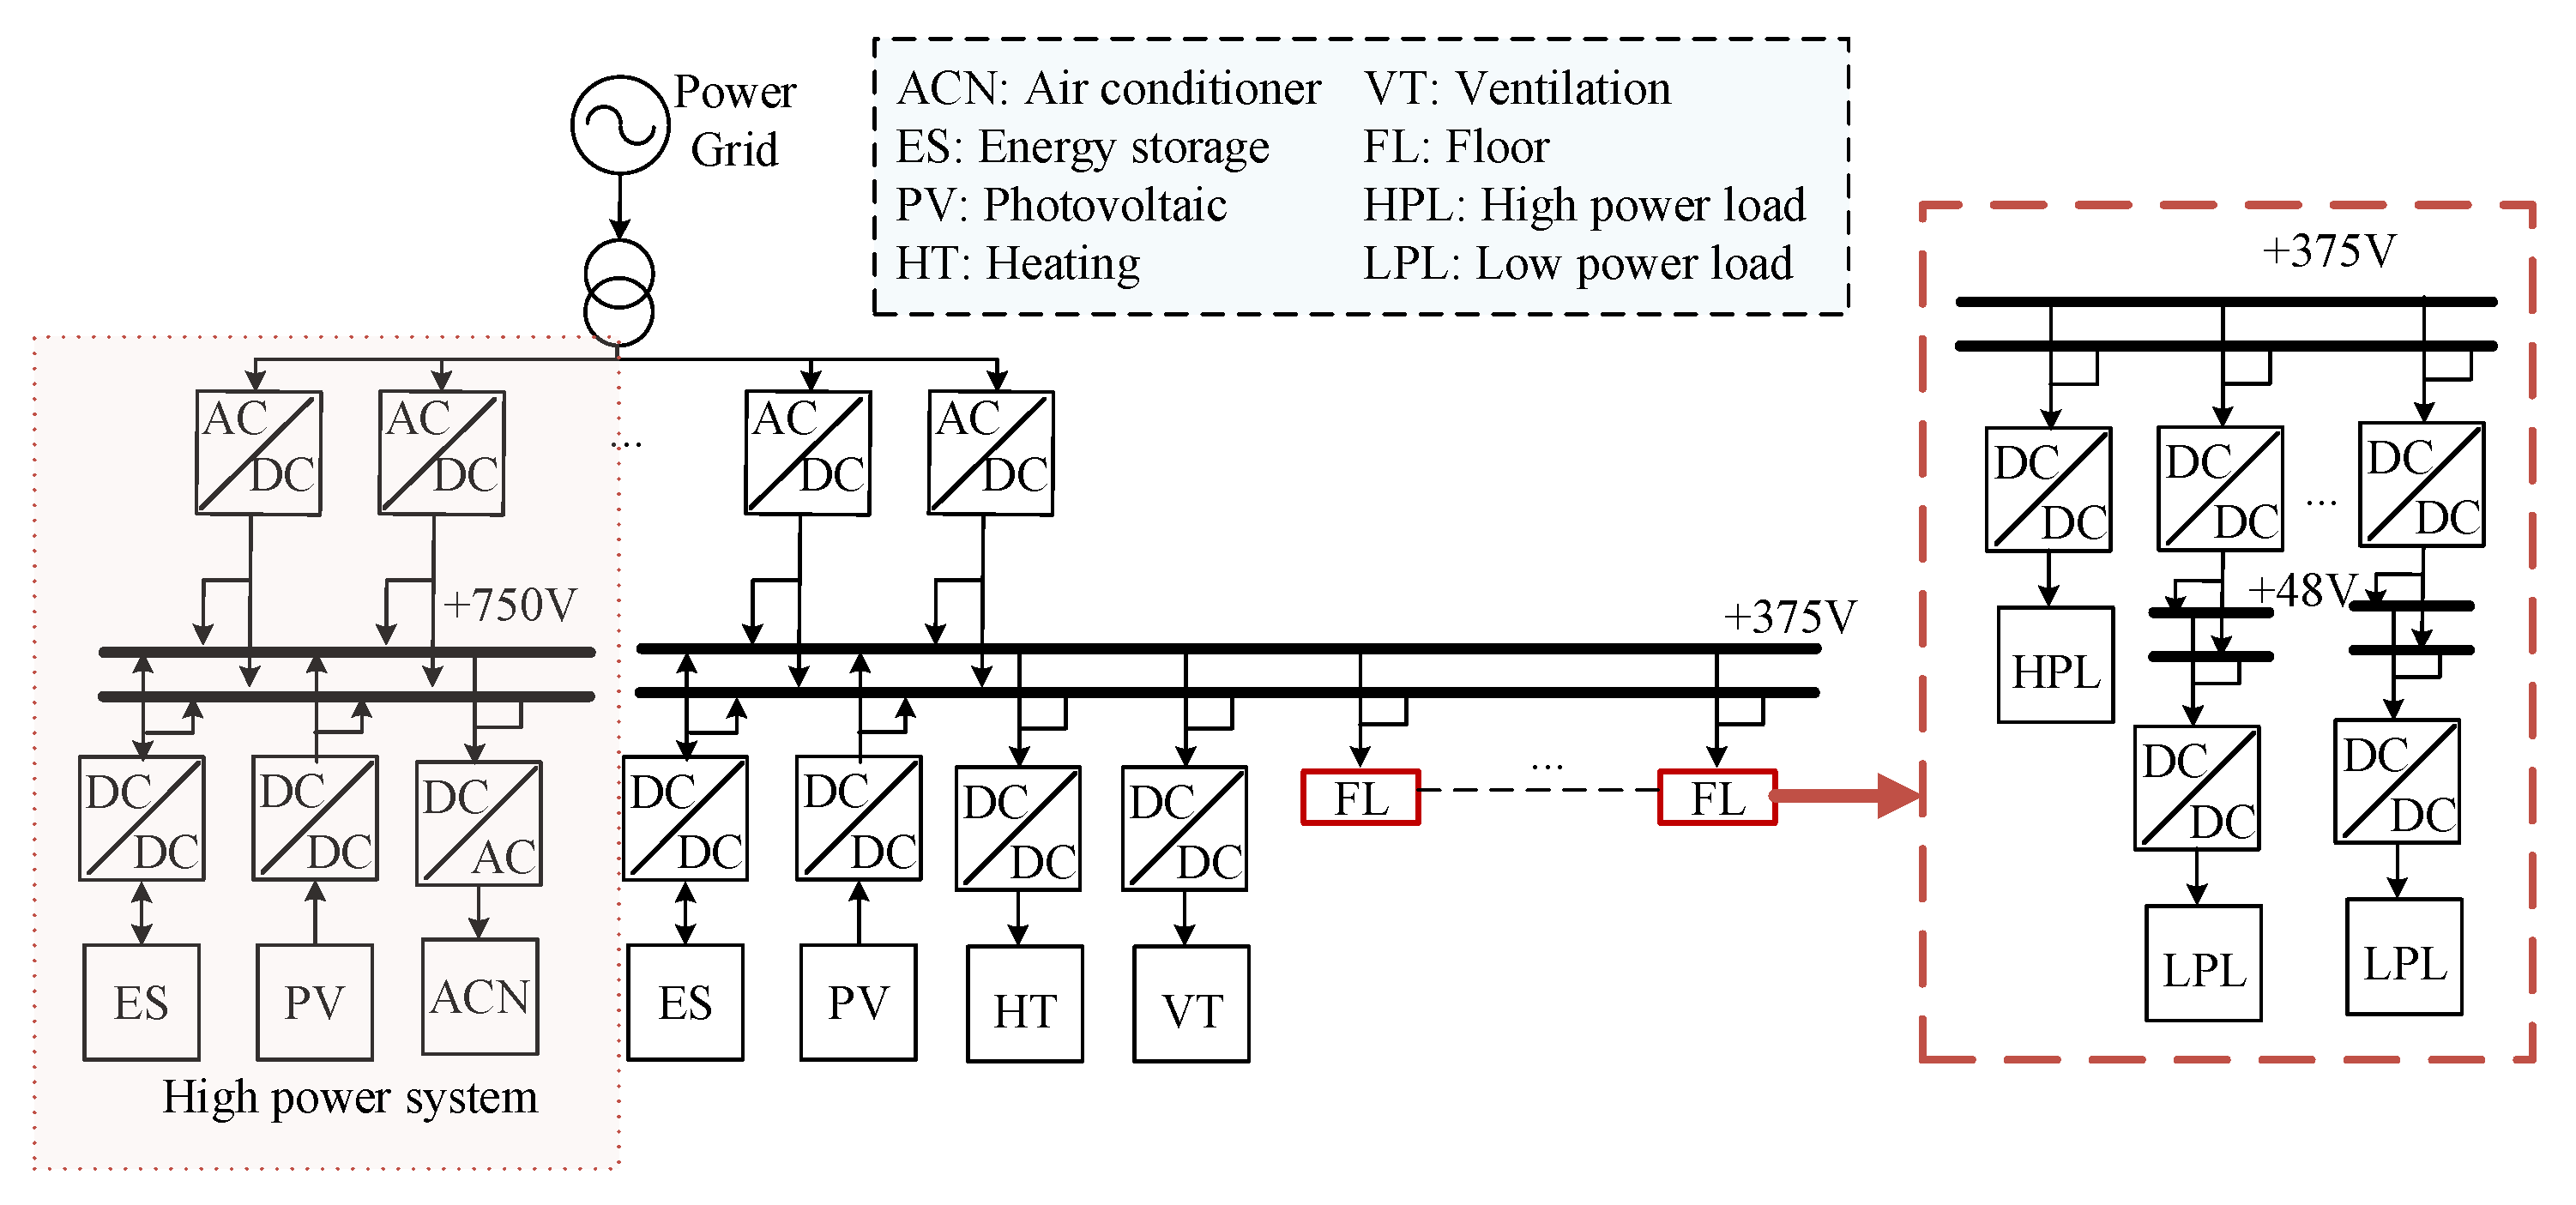
22], two typical topologies, centralized and separate supply topologies, are proposed to optimize the energy supply for air conditioners, as shown in
Figure 10 and
Figure 11. In centralized topology, the photovoltaic and energy storage are directly addressed to the 750 V bus, which can transfer the redundant energy for the floor load through the transformer from 750 V to 375 V. On the other hand, in a separate supply topology, the air conditioner and floors are set separately with 750 V bus and 375 V bus. The floor could get energy from the grid through one set of transformers rather than two in a centralized topology. Therefore, the choice of topology depends on the building’s energy characteristics and resource endowments.
Taking the electricity consumption of office, hotel, commercial, educational and residential buildings in Beijing, Shenzhen and Shanghai as examples, the energy efficiency of different NEZB power distribution systems is calculated through the energy efficiency calculation model as shown in
Appendix A Table A1,
Table A2,
Table A3,
Table A4 and
Table A5, where
Ploss,l and
Ploss,C mean the total loss of lines and converters, respectively,
ηPV means the proportion of PV output,
ηa means the average energy efficiency, Δ
ηa,max means the maximum energy efficiency difference in the relative building and region. From the results in
Appendix A Table A1,
Table A2,
Table A3,
Table A4 and
Table A5, it can be seen that in office buildings, the line losses varied from 62.2 MWh~97.4 MWh, while the transformer losses varied from 193.3 MWh~361 MWh, which is about three times the line losses. The DC advantages were relatively obvious in Beijing—1.15%, which showed a positive correlation with photovoltaic percentage. The DC advantage increased in the hotel buildings by as high as 3.22% in Beijing, which also showed a positive correlation with the photovoltaic. In business buildings, there was more space to arrange the photovoltaics, which accounts for about half of the energy demand in Beijing, where DC’s separate topology saved 3.27% energy. However, since the use of renewable energy needs to pass through more converters and longer transmission lines, the average energy efficiency was about 81%. Through the average efficiency was not as high as in the lower photovoltaic scene which ignored the synchronization and transportation waste of power generation, the utilization of renewable energy had increased. In educational buildings, there are no obvious differences in DC advantages among different regions, whose power consumption is similar to the office buildings. The main difference is that there are no central air conditioners in educational buildings and residential buildings so that there is no need to build a DC separate supply topology. With an average 27% photovoltaic generation, the advantages of DC over AC system were as high as 3.34% in 375 V. Lastly, in the residential buildings, since the air conditioners were arranged in 375 V/240 V, there was no need to set a separate bus with high voltage. The DC advantage was about 5% higher than the AC system in all three tested regions, which verified DC topology had a higher efficiency no matter in which building or in any region.
To sum it up, in the DC distribution network system of NZEB, the 375 V separate topology DC distribution network has the highest energy efficiency, followed by the 375 V centralized DC distribution network. The reason is that the transmission loss generated by 375 V is lower, and the separate topology structure can reduce the loss of the high-power load branch converters. The analysis of this example will select the 375 V separate topology to improve the energy efficiency compared to the AC system.
The NZEB energy efficiency analysis is a draught from 15 different scenarios across the office, hotel, commercial, educational, and residential buildings in Beijing, Shenzhen, and Shanghai. The 15 scenarios were measured over a period of one year and the results were aggregated. Through the energy efficiency calculation method, the energy efficiency improvement of the DC distribution network system in 15 different scenarios is listed in
Table 7. The scenario indicators and energy efficiency improvement results are shown in
Table 7, where
PD means the total load,
ηhp means the proportion of high-power devices,
SES means the energy storage capacity. Through the advantage of the DC system over the AC system had been verified by the 15 scenarios, the influence factors of efficiency improvement are not clear, and need to be studied further.
3.5. Comparison of AC and DC Energy Efficiency in Typical Scenarios and Analysis of Impact Indicators
According to
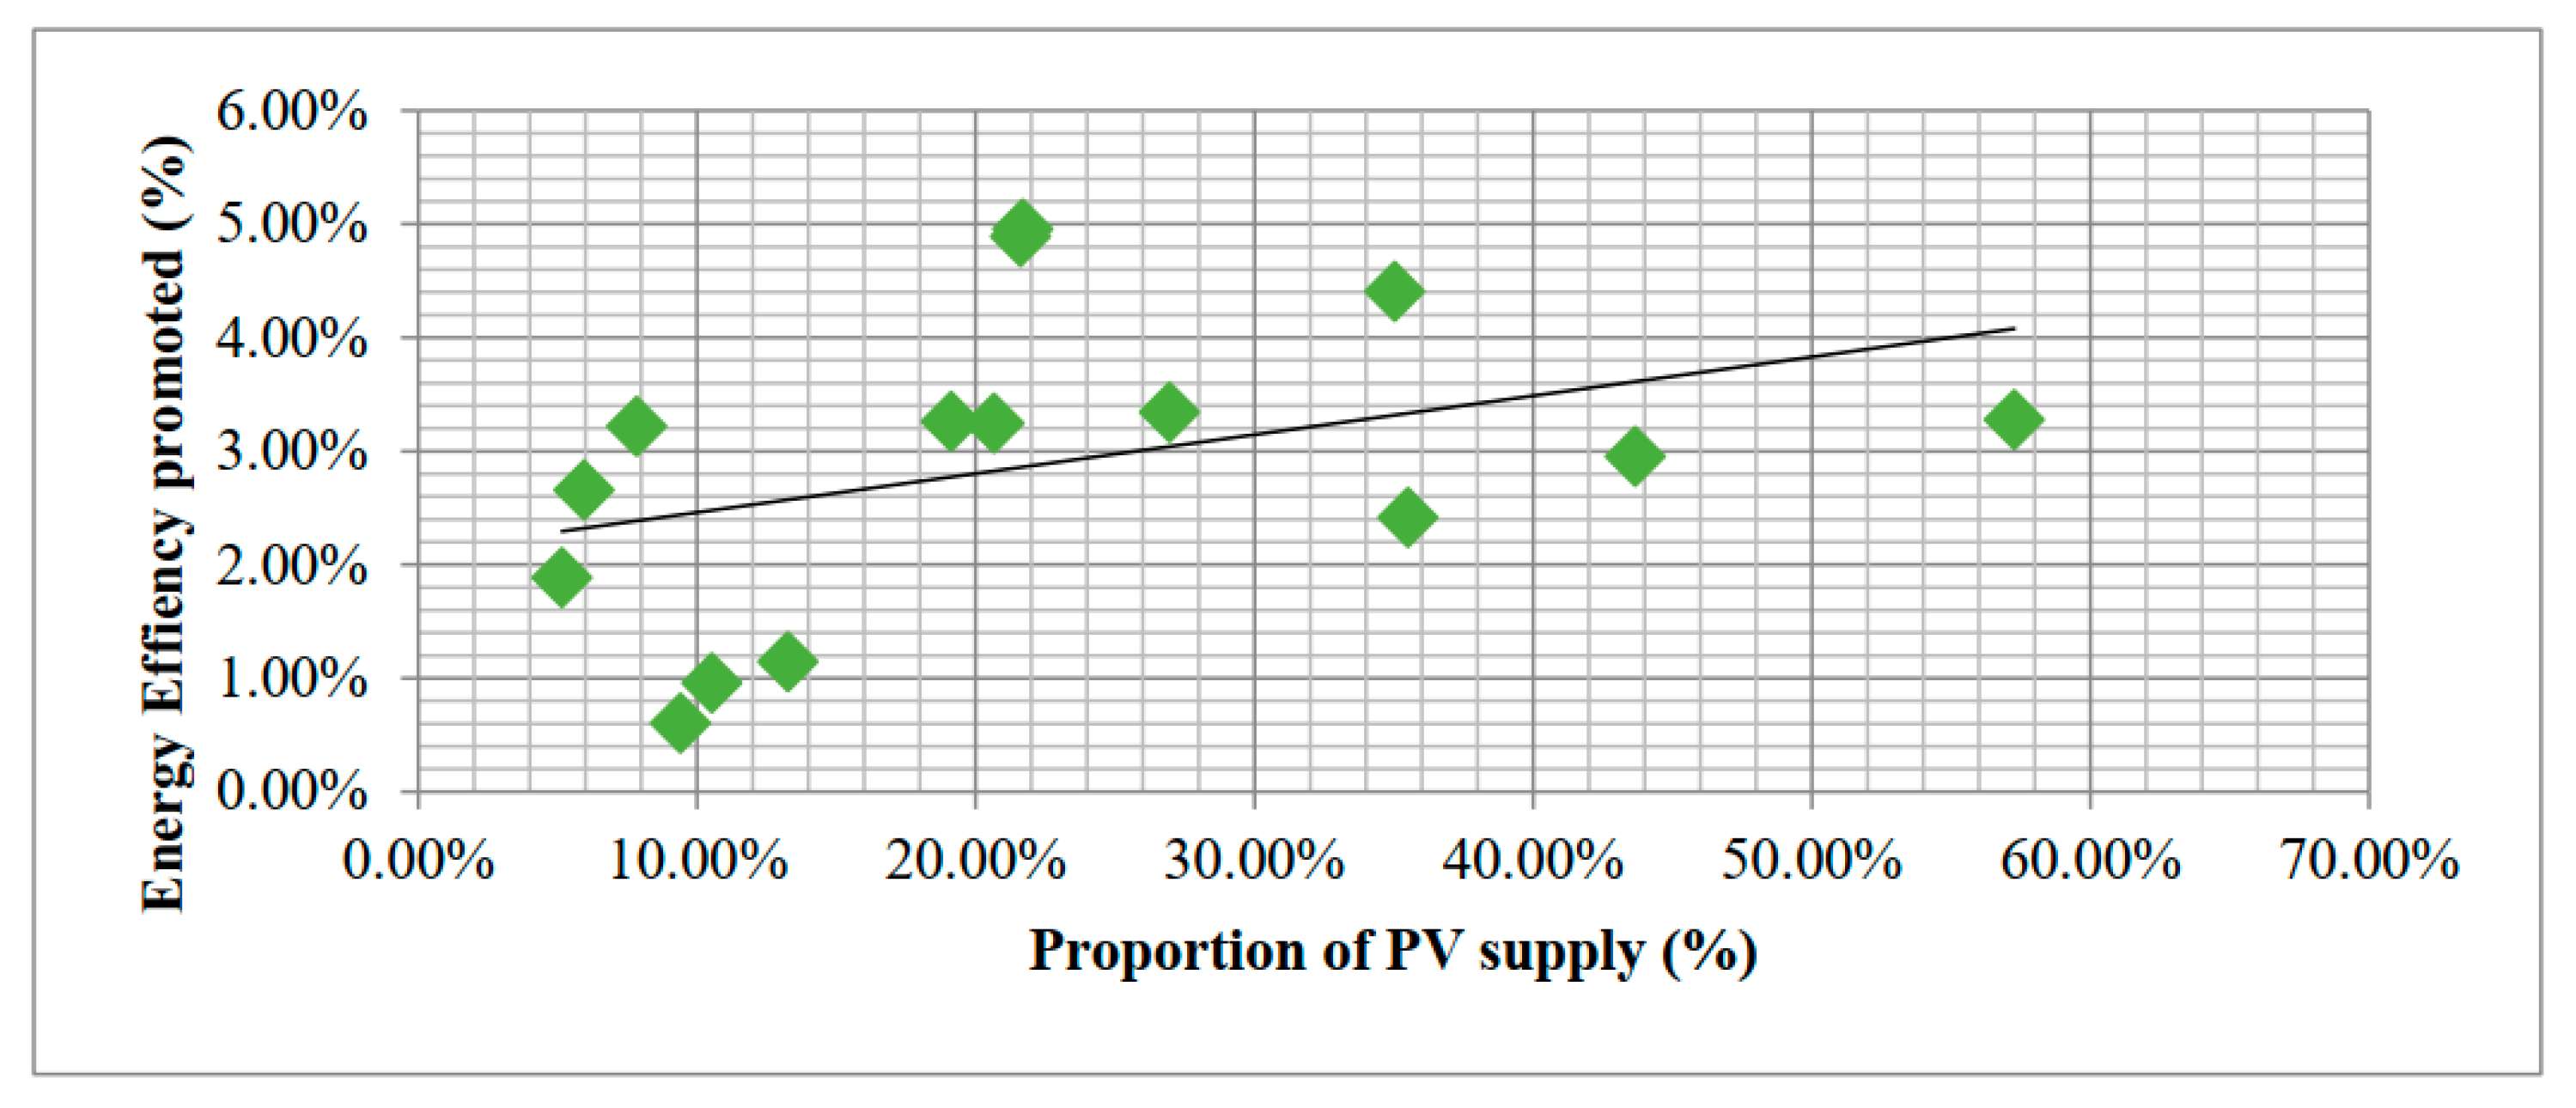
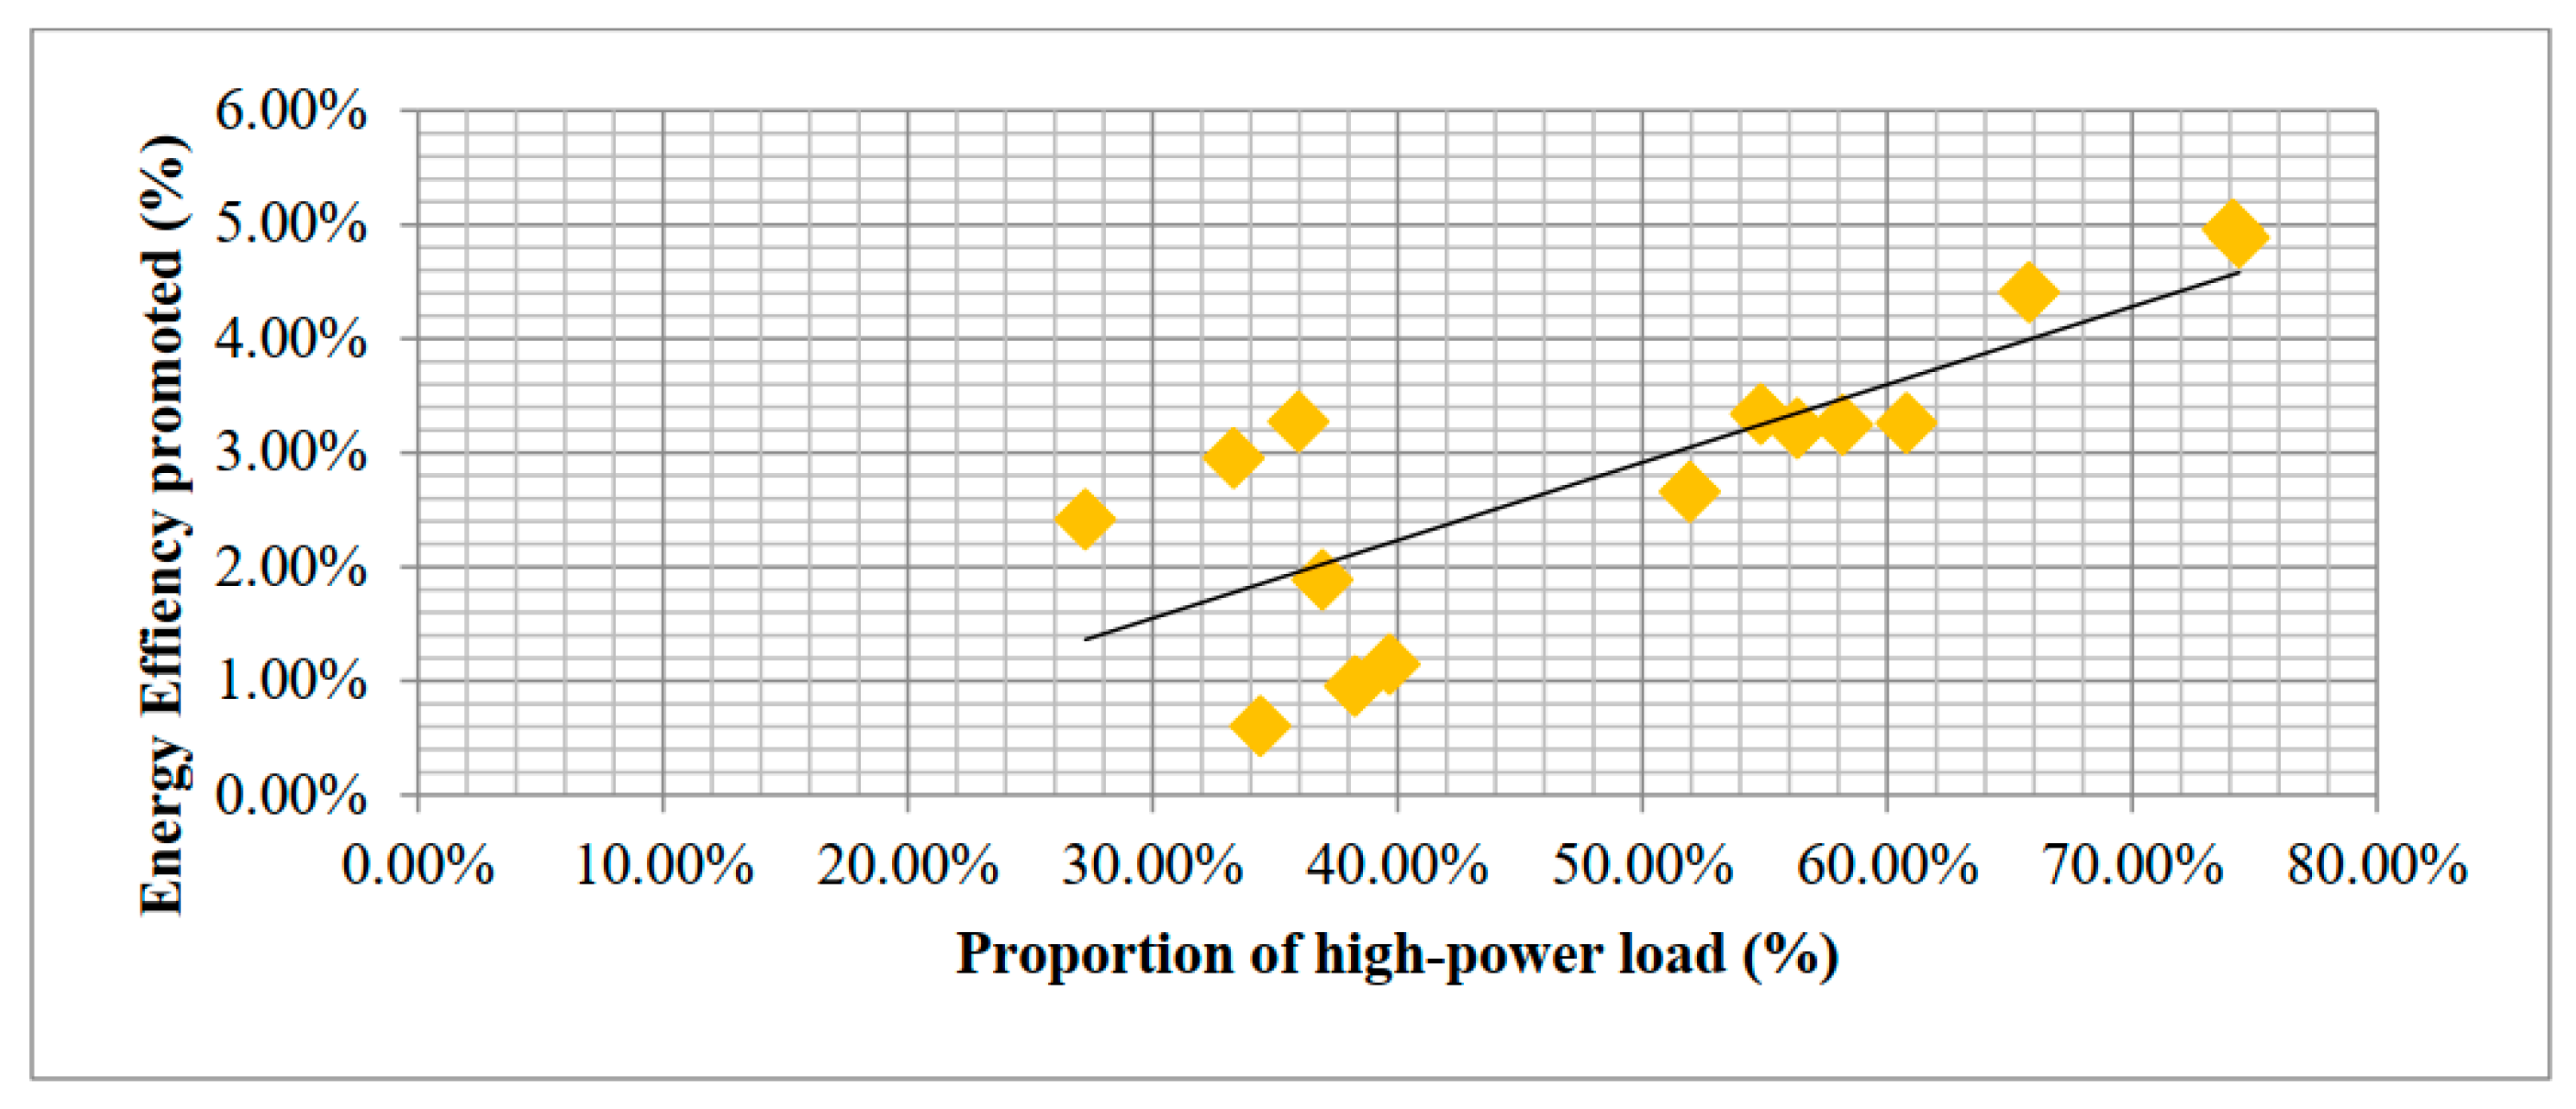
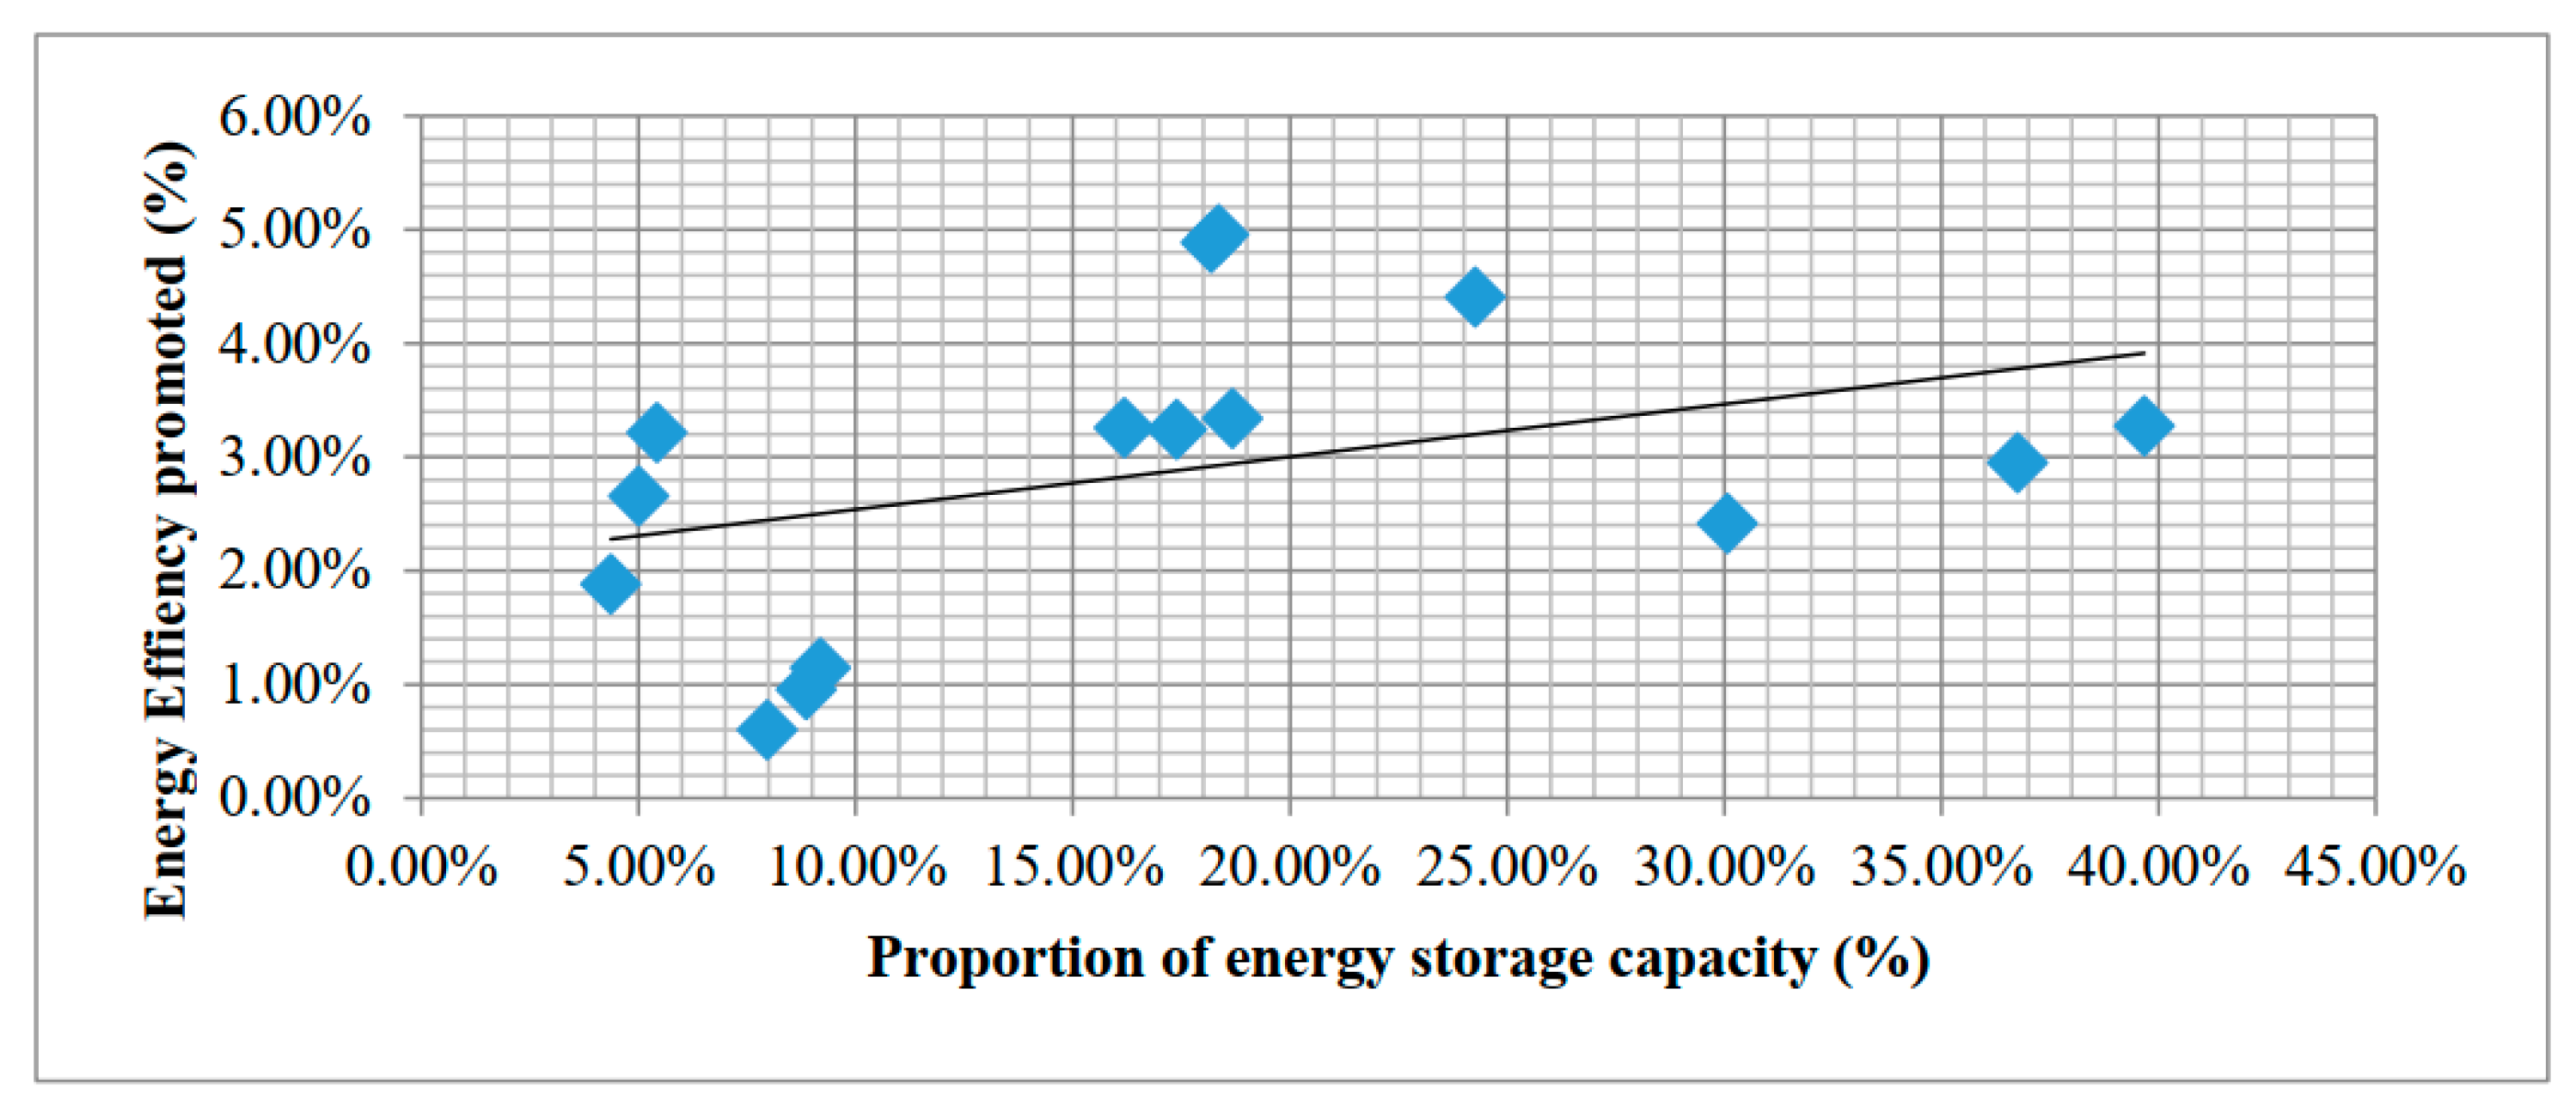
Table 7, the energy efficiency improvement in different regions can be further compared with the preliminary judgment influencing factors. By comparing the relationship diagram, it is more intuitive to reflect the impact of the three factors of the proportion of photovoltaic output, the proportion of high-power devices and the proportion of energy storage capacity on the energy efficiency improvement of the DC system of NZEB, which are shown in
Figure 12,
Figure 13 and
Figure 14, where the green squares, yellow squares and blue squares represent the energy efficiency promoted in 15 scenarios with different proportion of PV supply, high-power load, and energy storage capacity.
From the photovoltaic power supply ratio and AC/DC energy efficiency improvement scatter plot in
Figure 12, the regression equation of the sample data shows an increasing trend, but the sample points are far from the regression line and the variance is large. From the high-power load ratio and AC/DC energy efficiency improvement scatter diagram in
Figure 13, it can be seen that the regression equation of the sample data is increasing, and each sample point is close to the regression line, with a small variance and high confidence. From the energy storage capacity ratio and AC/DC energy efficiency improvement scatter plot in
Figure 14, it can be seen that the variance of the sample data is large, which may be due to the small number of samples and the large errors caused by other influencing factors at each point. Therefore, although the ratio of energy storage capacity to total load has a certain positive correlation, its correlation remains to be verified.
From the above analysis, it can be seen that NZEB dc distribution system energy efficiency improvement and photovoltaic power generation ratio, and high-power appliances ratio, energy storage capacity ratio have a certain relationship. However, the extent of relevance remains to be verified. Through SPSS correlation analysis, the influence of three factors on energy efficiency is compared. Through bivariate analysis, the correlation between various influencing factors and energy efficiency gains is identified, as shown in
Table 8.
According to Pearson’s correlation theorem, if the coefficient is greater than 0.8, the correlation is high; if the coefficient is between 0.5 and 0.8, the correlation is moderate; if the coefficient is between 0.3 and 0.5, the correlation is low; and if the coefficient is less than 0.3, the correlation is small. Therefore, it can be seen that the coefficient of the proportion of high-power load and the improvement of AC and DC energy efficiency is 0.794, which is highly correlated; the coefficient of the proportion of photovoltaic and the improvement of energy efficiency is 0.391, which is a low correlation; the coefficient of energy storage ratio and energy efficiency improvement is 0.394, which is also a low correlation. Pearson-related parameters for all three effects were greater than 0.3, suggesting that all three are associated with improved energy efficiency in the system.
3.6. Sensitivity Analysis of Influencing Factors in Typical Scenarios
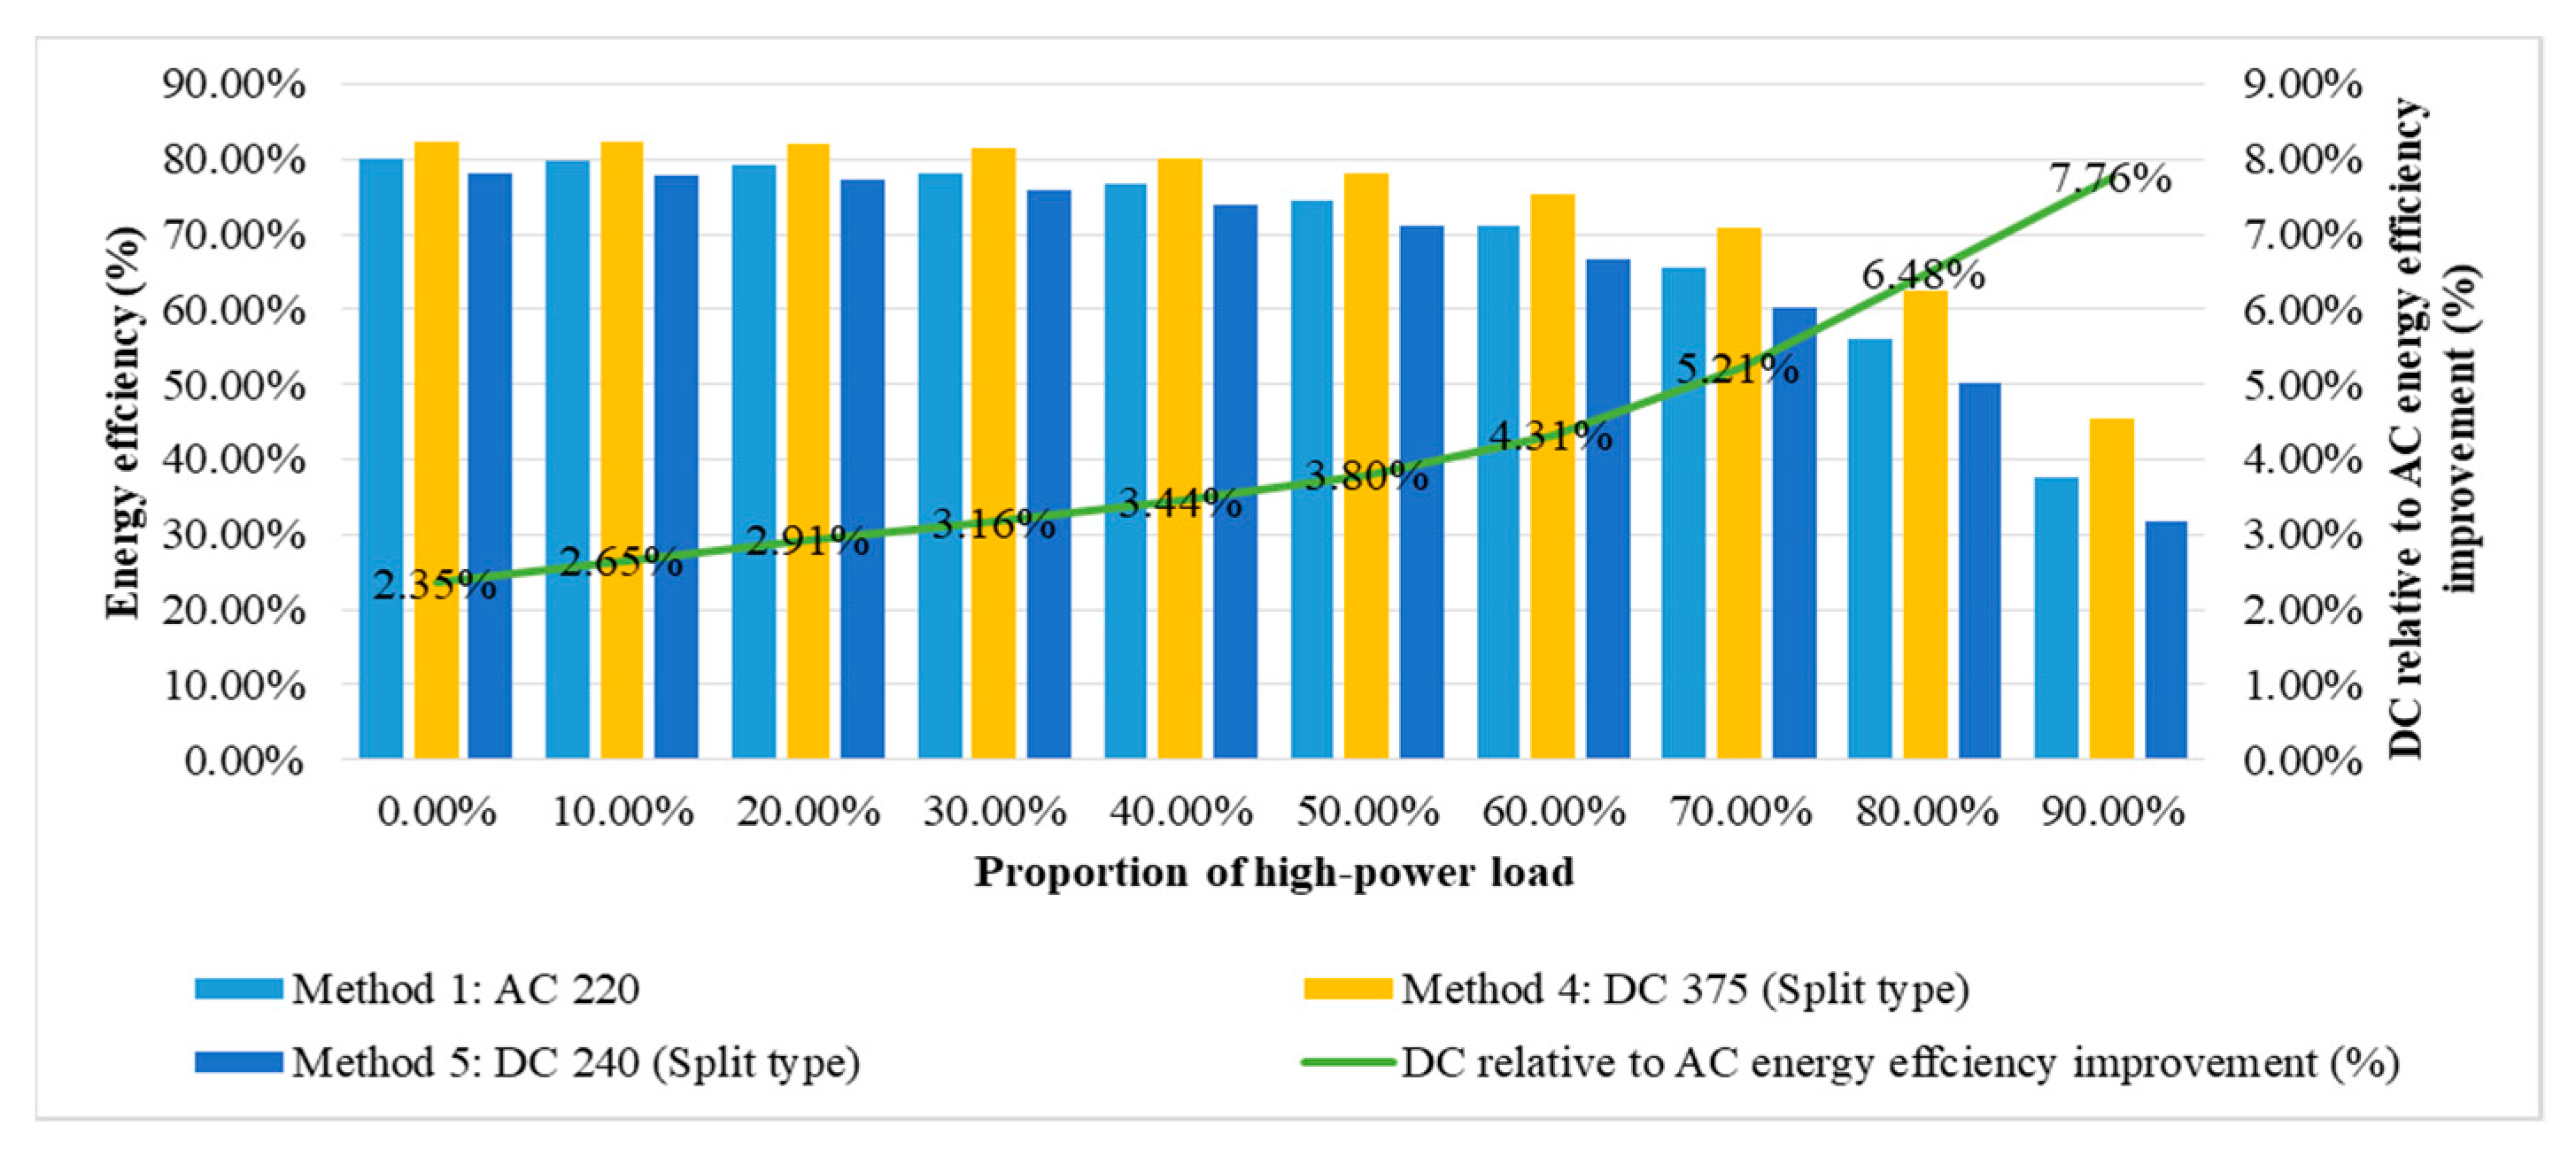
Firstly, the relationship between high power load ratio and DC–AC energy efficiency is verified and the relationship is discussed. In the case of commercial housing in Beijing, the proportion of high-power load in the sample was 35.96%. Consider tweaking the system’s high-power load power from 0 to 16 times, which means adjusting load ratio from 0% to 90%. The relationship between the increase of energy efficiency of DC system relative to AC system and the ratio of high-power load is calculated by simulation, as shown in
Figure 15.
From
Figure 15 to change the proportion of high-power load, it can be seen that as the proportion of high-power load increases, the energy efficiency of both the DC and AC systems shows a downward trend. However, there has been a significant improvement in the energy efficiency of the DC system, from 2.35% to 7.76%. The main reason is that the converter of the branch of the high-power device has low efficiency, and the transmission loss is greater than that of the low-power load and other branches so that the energy efficiency of the building is reduced.
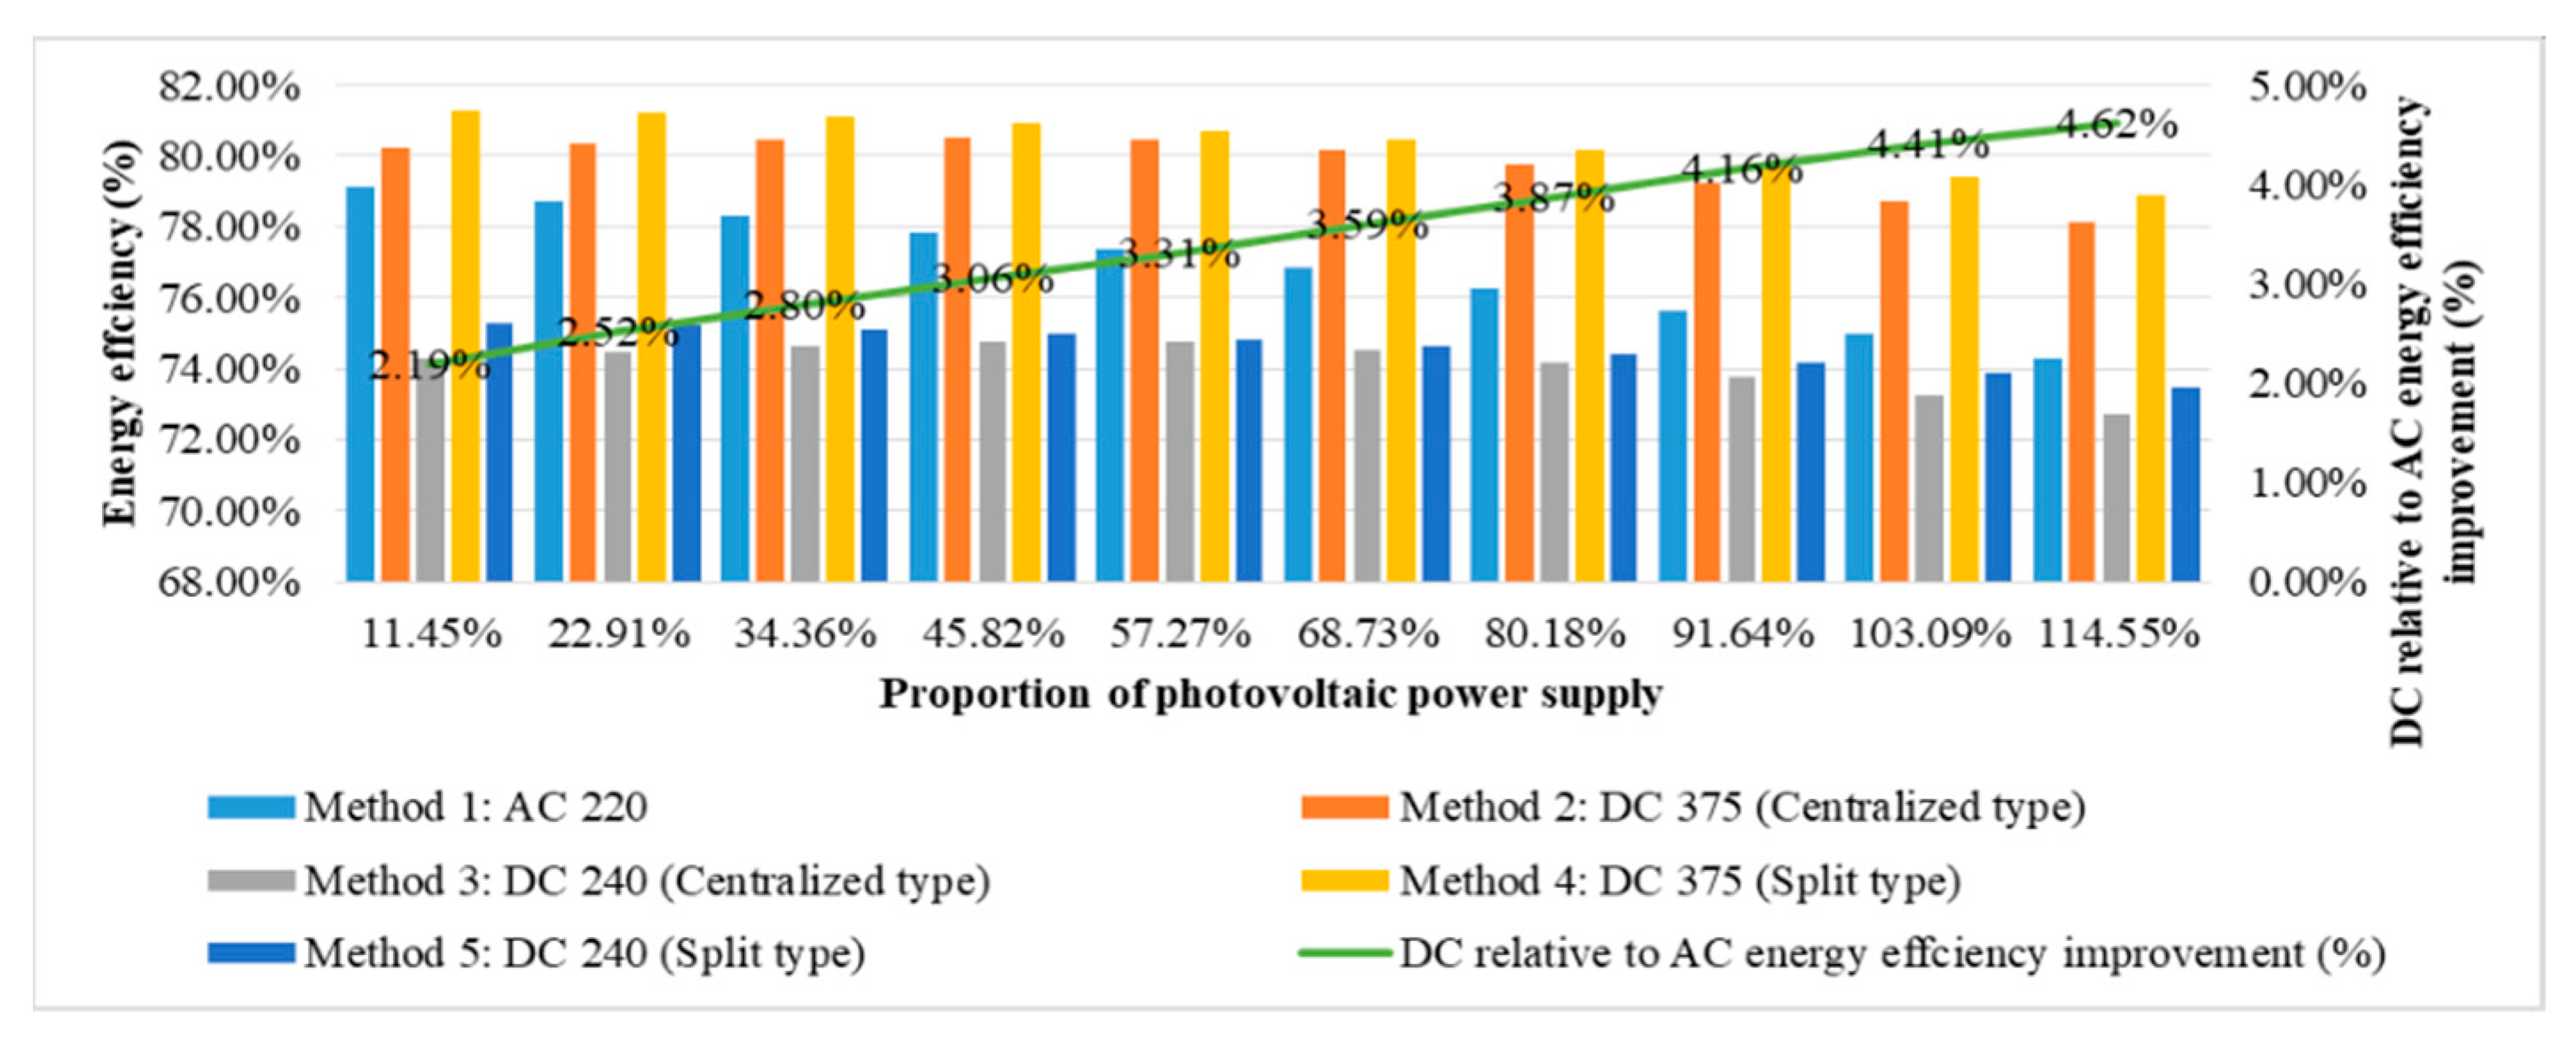
At the same time, the relationship between the ratio of photovoltaic (PV) power supply and the improvement of DC–AC energy efficiency was verified and discussed in a sample of commercial buildings in Beijing. With the control variable, the proportion of photovoltaic power supply in the sample simply changes, as shown in
Figure 16.
Taking Beijing commercial buildings as an example, the relationship between energy storage ratio and energy efficiency of DC–AC was discussed. By controlling variables, only the ratio of sample energy storage capacity needs to be changed, as shown in
Figure 17.
As can be seen from the change in the ratio of energy storage capacity in
Figure 17, the energy efficiency of AC/DC systems is increasing with the increase in the ratio of energy storage capacity. This may be due to the fact that in this sample, energy storage branching is more efficient in power generation and charging states than in photovoltaics and electricity grids. An increase in the ratio of storage capacity can increase the efficiency of AC from 3.31% to 3.41%. Therefore, the DC system is more suitable for accessing energy storage modules such as compatible batteries.
3.7. Impact Assessment of DC Retrofit on Multi-Stakeholder Benefits
The multi-dimensional economic evaluation model of the investment efficiency of the DC distribution system selects 15 scenarios, such as office, education, hotel, residential and commercial in Beijing, Shanghai and Shenzhen as typical cases for evaluation analysis, which can better represent the light and climate conditions in north China, central China and south China. Under the requirements of complete photovoltaic consumption and increased load rate, there are some differences in the configured ratio of the photovoltaic and storage conditions in each regional scenario. Power consumption directly determines the type of load and the difference in power consumption. Among them, the office, hotel, and commercial scenarios have a large number of people, various load types, and large power demand. They belong to high-power power consumption scenarios, at the same time, they are managed by professional operation and maintenance personnel. From the point of view of efficiency and cable cost, some high-power loads tend to use a high-voltage power supply, whereas in educational and residential scenarios, small loads account for a large proportion of low-power scenarios. Older adults, children and others with little awareness of safety are more inclined to use electricity safely, so voltage levels above moderate risk are not considered.
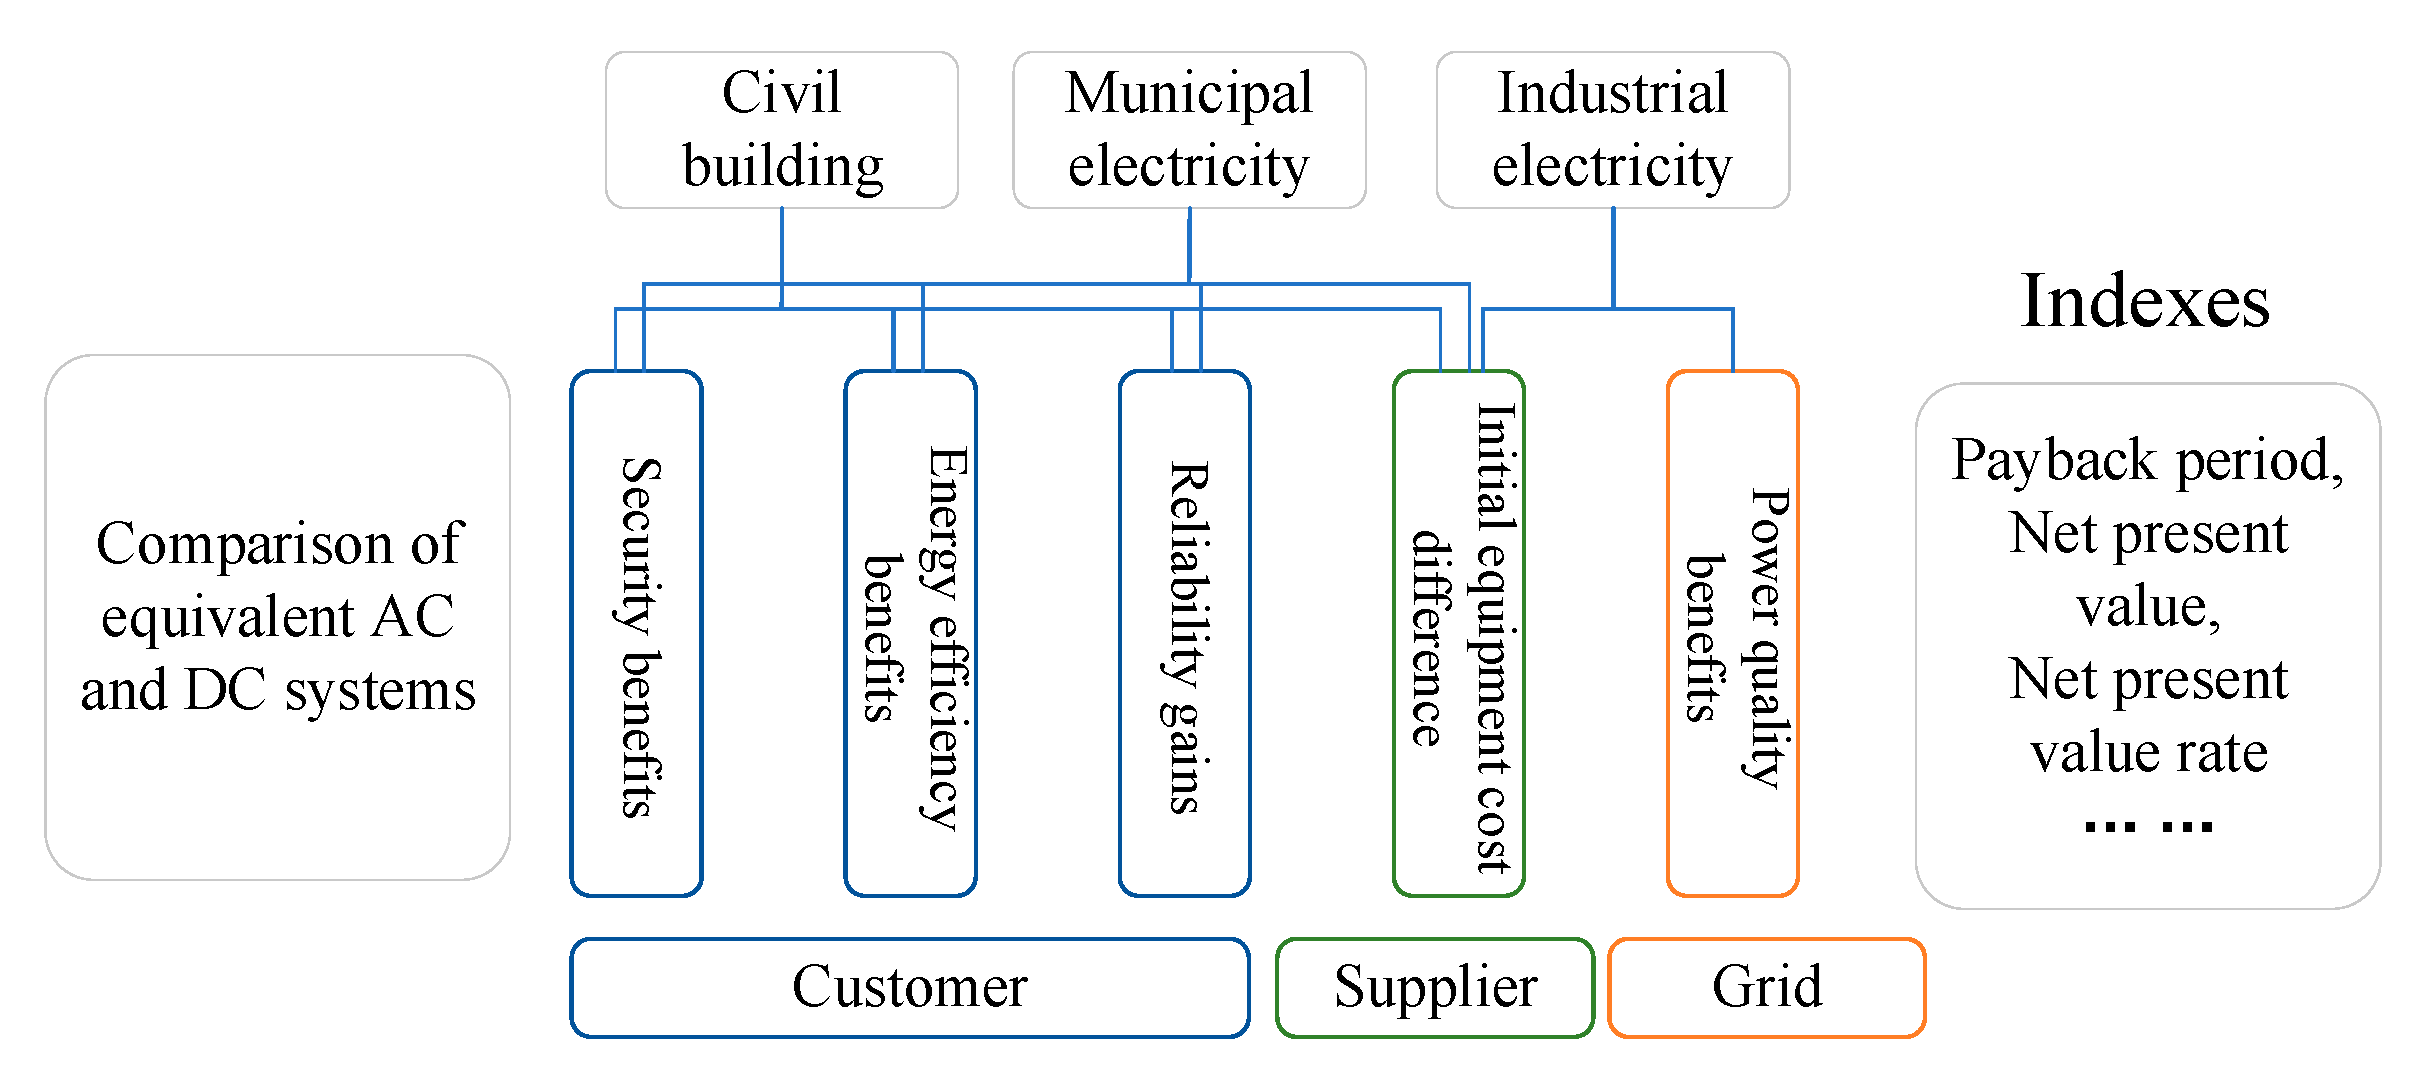
On the basis of the above analysis, the office buildings were set as examples to evaluate and analyze the impact of DC transformation on multi-stakeholder interests. The three stakeholders involved in the project are device makers, power grids and users. For civil buildings, the efficiency, safety and reliability benefits of DC transmission can be divided into user benefits and equipment investment costs. The difference can be attributed to revenue from device makers, which the power grid itself does not generate much. According to the theoretical study of income evaluation in Chapter 3, the income of various stakeholders in different regions can be obtained under office scenarios, as shown in
Table 9.
As can be seen from
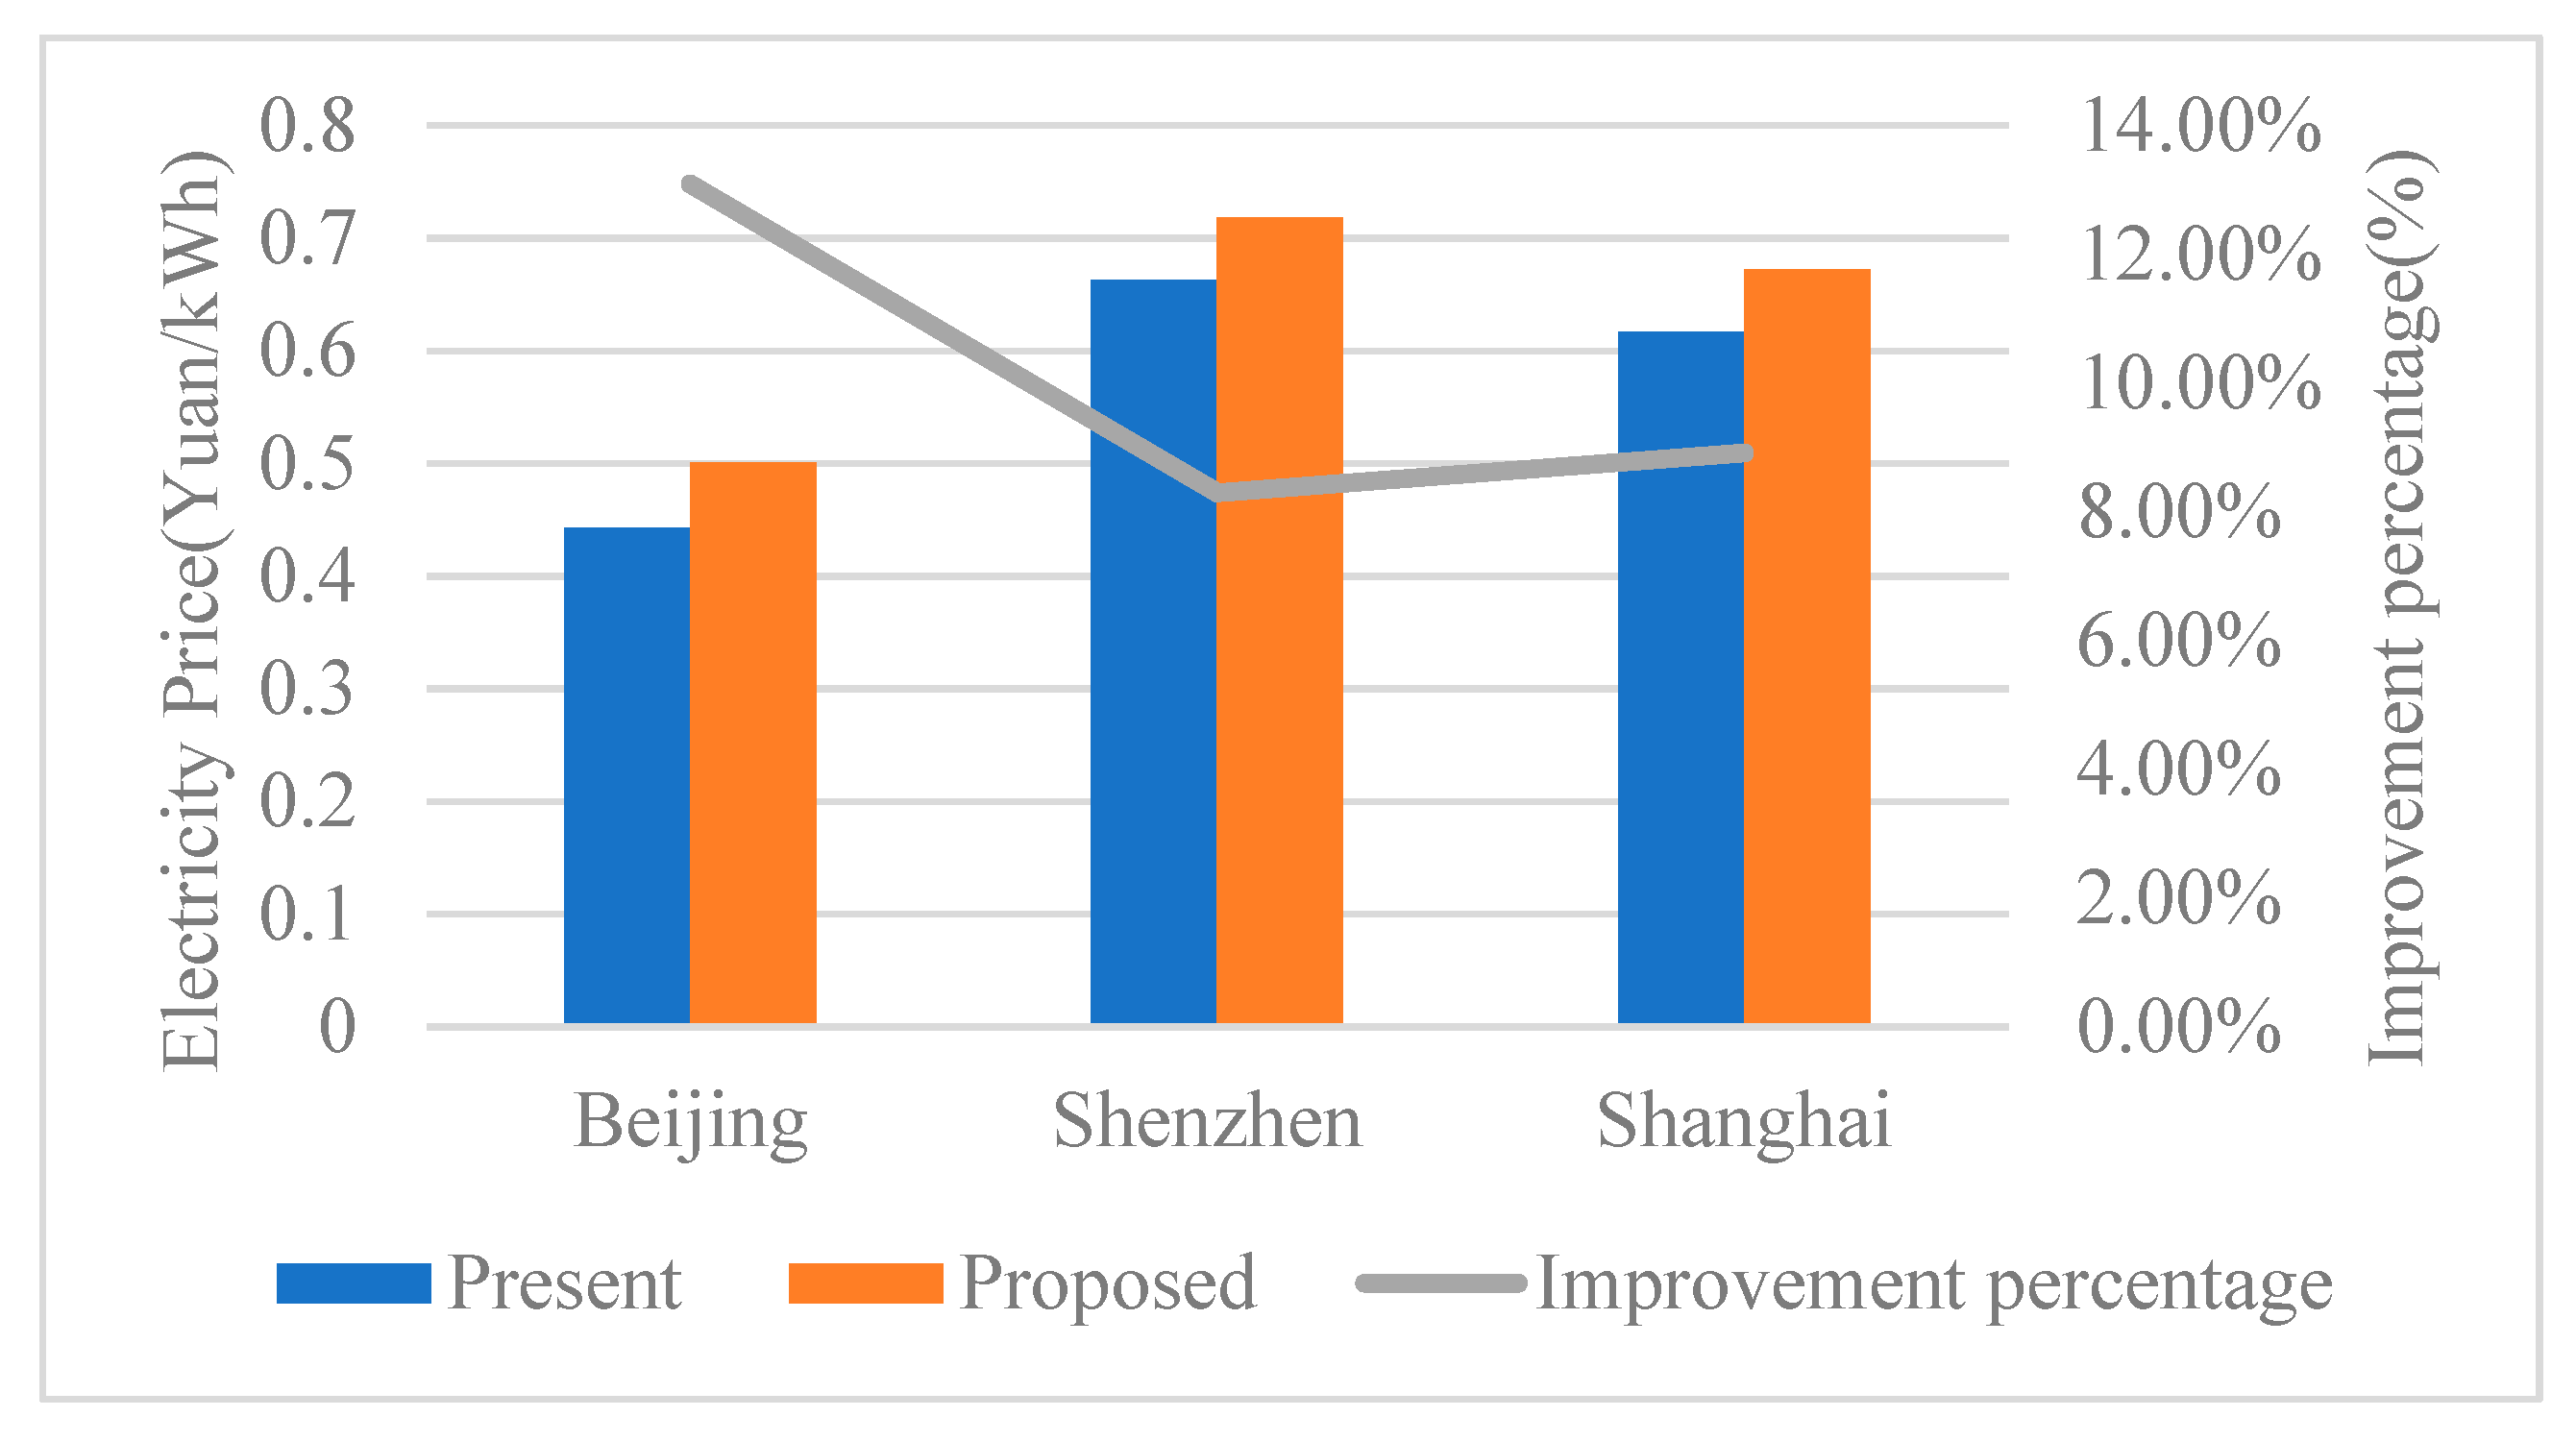
Table 9, in the process of DC transformation, the power grid has no profit, the user’s profit is relatively small, and the equipment manufacturer’s profit is the highest. However, when there are multiple stakeholders, only the benefits of each stakeholder and approaching the average can be more conducive to the promotion of DC transformation. Therefore, the total benefit should be redistributed. For device makers, the way to reduce revenue is to reduce device prices. For power grids, the way to increase revenue is to raise electricity prices. When electricity prices increase, the corresponding efficiency and reliability benefitting consumers will also increase. Taking the office building scene as an example, the calculation is carried out according to the maximum load utilization hours of 1500 h. The results of this analysis are as follows:
- (1)
Beijing: Beijing area at a rate of 0.443 yuan per kilowatt-hour. In order to achieve an equitable distribution of the interests of the three stakeholders-customers, power grids and equipment manufacturers-the interest per stakeholder should be 0.087 yuan/W. Electricity prices are estimated to rise to 0.501 yuan/kWh, an increase of 13.1%. At the same time, equipment manufacturers should reduce the price of equipment by 0.113 yuan/W.
- (2)
Shenzhen: Shenzhen’s electricity price is calculated at 0.663 yuan/kWh. In order to achieve an equitable distribution of the interests of the three stakeholders-customers, power grids and equipment manufacturers-the interest per stakeholder should be 0.082 yuan/W. Measured at [
21], the definitive electricity price was raised to 0.718 yuan/kWh, up 8.2%. At the same time, equipment manufacturers should reduce the price of equipment by 0.108 yuan/W.
- (3)
Shanghai: The electricity price in Shanghai is calculated as 0.617 yuan/kWh. In order to achieve an equitable distribution of the benefits of the three stakeholders of users, power grids and device makers, the benefits of each stakeholder should be set at 0.083 yuan/W. After the calculation in [
21], it is concluded that the electricity price should be raised to 0.672 yuan/kWh, with an increase of 8.9%. At the same time, device makers should reduce the price of equipment by 0.097 yuan/W, as shown in
Figure 18.
4. Conclusions
A time-sequential power flow simulation-based energy efficiency calculation method was proposed to compare the efficiency level between LVAC and LVDC systems, which was a key element for the planning and operation of low voltage systems in NZEB. Firstly, the typical structure of LVAC (LVDC) systems and the efficiency definition were proposed as the research foundation of this paper. Then, the energy efficiency evaluation method was formulated based on the time sequential simulation. The phasor diagram method was employed to obtain the power flow results for LVAC and LVDC systems, based on which the accurate power loss calculation equations were derived for each branch including converters and power lines. Moreover, 15 typical scenarios were taken as examples to analyze the energy efficiency in different buildings and different regions based on the actual experiment results or provided by manufacturers of household appliances. Lastly, the revenue adjustment advice of the energy saving brought by the DC distribution system was calculated based on the multi-stakeholder income adjustment method. The specific conclusions are listed as the following:
- (1)
There were about 6% annual energy savings in LVDC compared with LVAC. With the increase of the DG or DES integration, the efficiency savings by LVDC increased, which indicated that the DC system had more advantage in energy efficiency, especially with high penetration of DG.
- (2)
The 375 V separate topology DC distribution network has the highest energy efficiency with less transformation process and line transmission loss, followed by the 375 V centralized DC distribution network.
- (3)
Through SPSS correlation analysis, the preliminary judgment result was confirmed, which indicated that there was a certain correlation between the improvement of AC and DC energy efficiency and photovoltaic, energy storage and high-power loads. Specifically, the advantage of DC distribution showed a high correlation with the high-power load’s ratio.
- (4)
According to the multi-stakeholder income adjustment, the electricity price should be raised, while the device makers should reduce the device price to balance the revenue of device makers, power grids and users.
Although this work contributes to the development of DC conversion of NZEB based on accurate efficiency evaluation, application in different regions, and the revenue distribution of multiple stakeholders. However, a higher efficiency could be achieved through the comprehensive utilization of multiple kinds of energy, such as heat, cold and gas. Further work will incorporate the proposed model into the planning and operation of the LVDC system, such as the energy efficiency-oriented optimal allocation method and optimal operation strategy for DG and DES. Moreover, the coordinated operation of an integrated energy system could be further studied to save more energy. On the other hand, the cost of the system should further include the loss cost of the poor power quality.


 ,
, 
