
Optimal Preventive Maintenance Planning for Electric Power Distribution Systems Using Failure Rates and Game Theory


Abstract
:1. Introduction
2. Risk Assessment
2.1. Causes of Power Interruptions
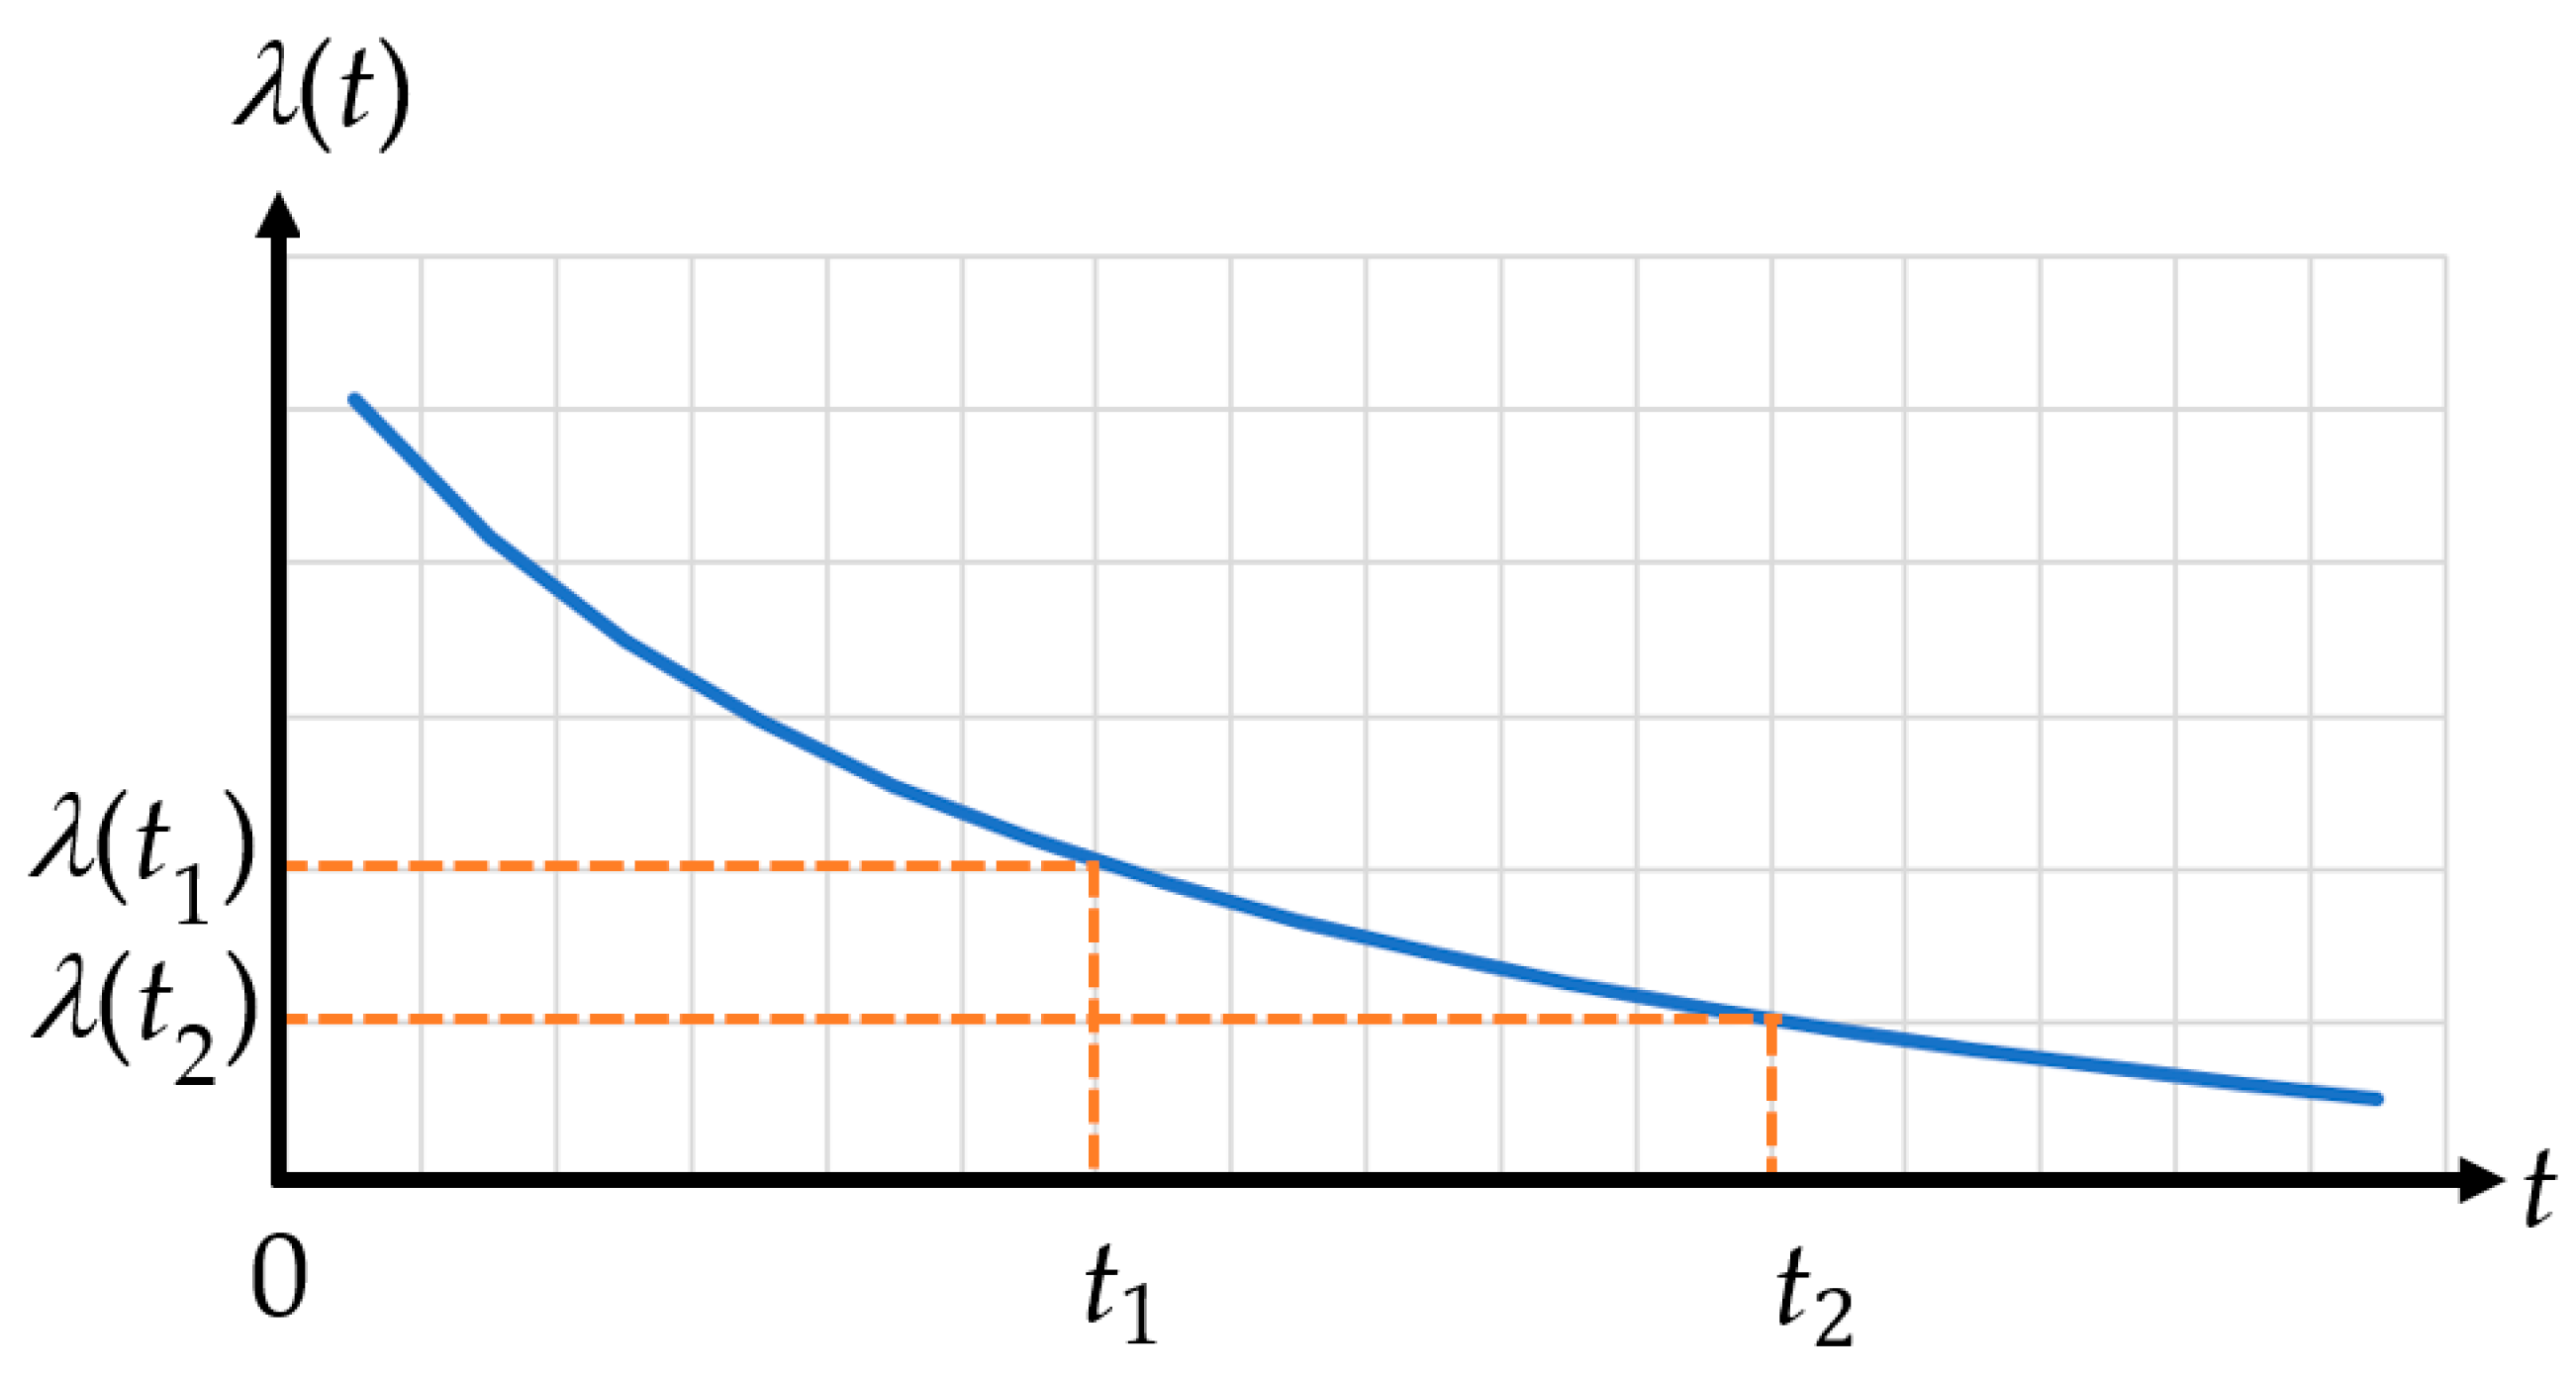
2.2. Feeder Failure Rates
2.3. Evaluation of Customer Interruption Costs
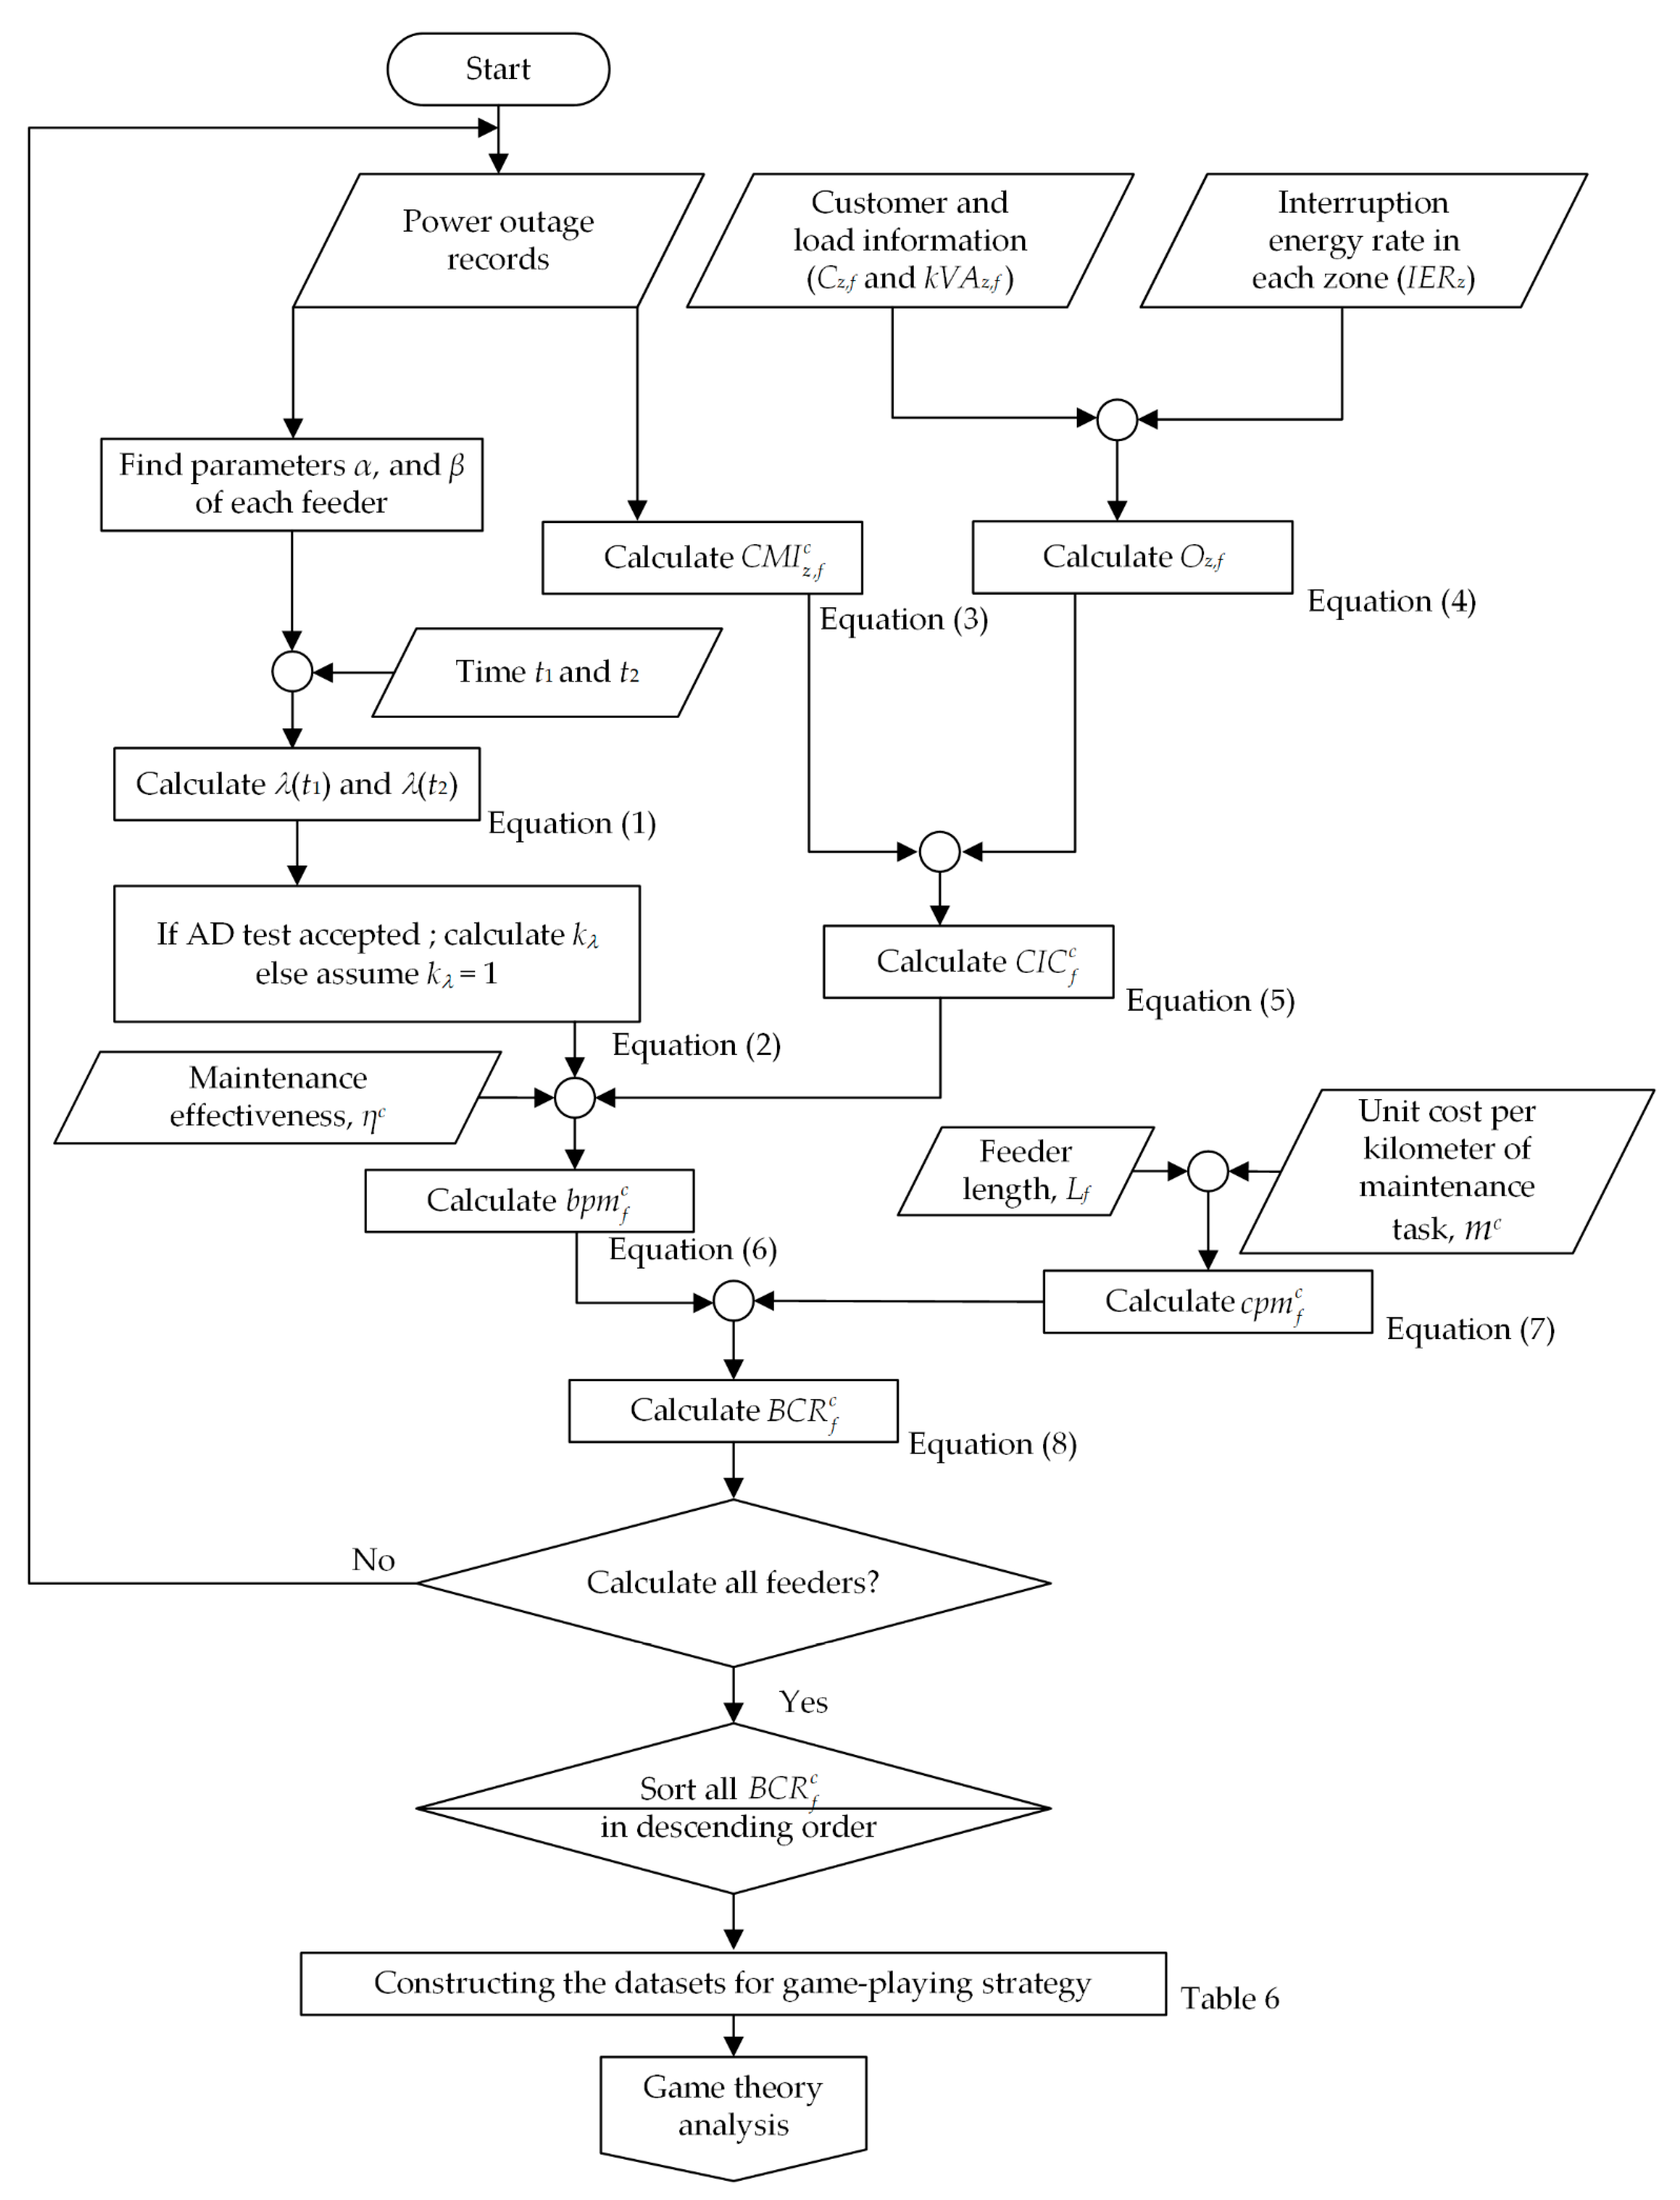
- is the customer-minutes of interruption in zone z of feeder f due to cause c;
- is the number of customers in zone z affected by incident i due to cause c;
- is the interruption duration of incident i due to cause c (minutes);
- is the number of interruptions due to cause c.
- is the outage rate of customers in zone z of feeder f;
- is the installed kVA in zone z of feeder f;
- PF is the power factor;
- UF is the utilization factor;
- is the number of customers in zone z of feeder f;
- is the interruption energy rate of customers in zone z (THB/kWh) as presented in Table 4 (Exchange rate: THB 1 = USD 0.028).
3. Benefit–Cost Evaluation of Preventive Maintenance Tasks
3.1. Benefits of Preventive Maintenance Tasks
3.2. Costs of Preventive Maintenance
3.3. Benefit/Cost Analysis of Maintenance Tasks
4. Cooperative Game Theory
- is the function value for player 1 in scenario ;
- is the function value for player 2 in scenario ;
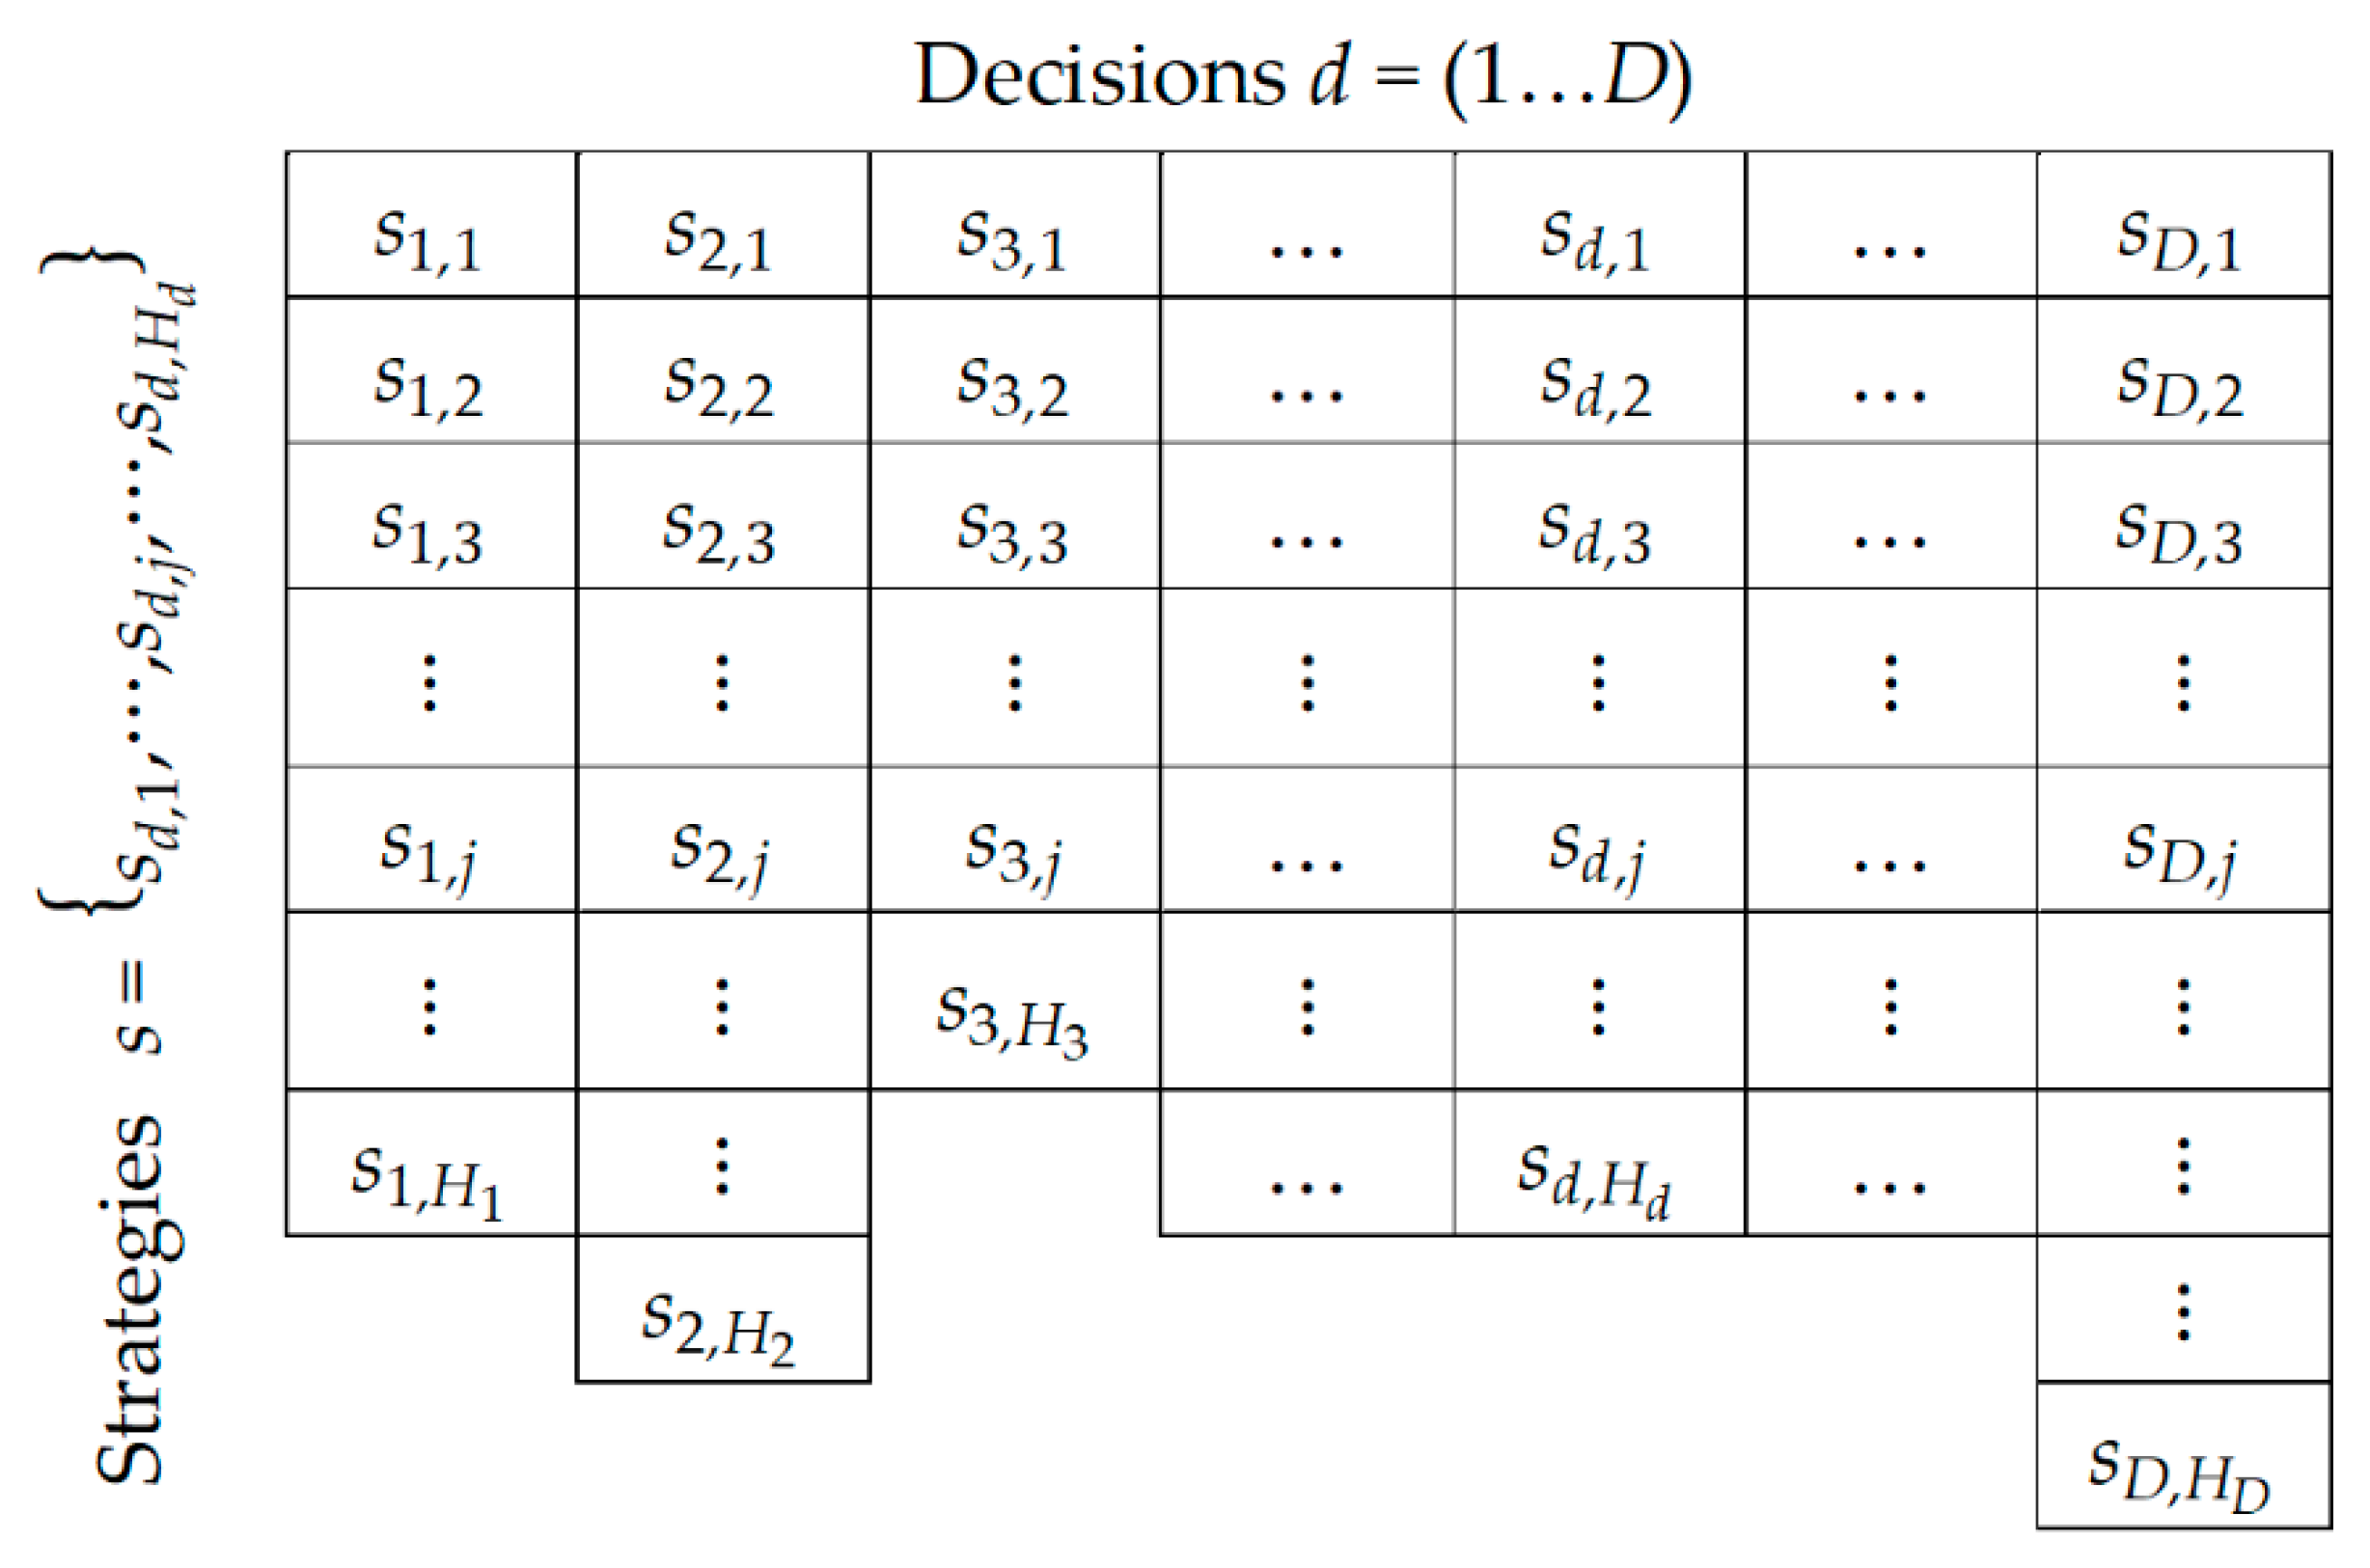
- is a set of strategies played by service regions r = (1…R);
- R is the number of service regions;
- is the regional benefit of preventive maintenance tasks in strategy ;
- is the regional cost of preventive maintenance tasks in strategy .
- is the function value of player 1 in the best scenario ;
- is the function value of player 2 in the best scenario ;
- is the collection of the best strategies for all individual service regions;
- R is the number of service regions;
- is the regional benefit of preventive maintenance tasks in strategy ;
- is the regional cost of preventive maintenance tasks in strategy .
5. Results and Discussions
6. Conclusions
Author Contributions
Funding
Institutional Review Board Statement
Informed Consent Statement
Data Availability Statement
Conflicts of Interest
References
- Xu, L.; Chow, M.; Timmis, J.; Taylor, L.S. Power Distribution Outage Cause Identification With Imbalanced Data Using Artificial Immune Recognition System (AIRS) Algorithm. IEEE Trans. Power Syst. 2007, 22, 198–204. [Google Scholar] [CrossRef] [Green Version]
- Zhang, X.; Gockenbach, E. Component Reliability Modeling of Distribution Systems Based on the Evaluation of Failure Statistics. IEEE Trans. Dielectr. Electr. Insul. 2007, 14, 1183–1191. [Google Scholar] [CrossRef]
- Hyland, M.; Hofmann, A.; Doyle, T.; Lee, J.Y. Evaluation of Data Submitted in APPA’s 2018 Distribution System Reliability & Operations Survey; DOKUMEN: Richmond, VA, USA, 2019. [Google Scholar]
- Teera-achariyakul, N.; Rerkpreedapong, D. A Method of Cost-effective Preventive Maintenance Planning for Power Distribution Systems using Cooperative Game Theory. In Proceedings of the 2019 IEEE PES GTD Grand International Conference and Exposition Asia (GTD Asia), Bangkok, Thailand, 19–23 March 2019; pp. 23–28. [Google Scholar]
- Duangta, N.; Teera-achariyakul, N.; Rerkpreedapong, D. Prioritization of Maintenance Tasks on Electrical Distribution Systems Using RCM method and Criticality Factors. In Proceedings of the 14th GMSARN International Conference on Smart Energy, Enviroment, and Development for sustainable GMS, Luang Prabang, Laos, 27–29 November 2019. [Google Scholar]
- Teera-achariyakul, N.; Rerkpreedapong, D. Optimal Allocation of Maintenance Resources and Reliability Benchmarking of Electric Power Utilities. In Proceedings of the 8th GMSARN International Conference 2013 on Green Growth in GMS: Energy, Environment and Social Issues, Mandalay, Myanmar, 18–20 December 2013. [Google Scholar]
- Dehghanian, P.; Fotuhi-Firuzabad, M.; Bagheri-Shouraki, S.; Kazemi, A.A.R. Critical Component Identification in Reliability Centered Asset Management of Power Distribution Systems Via Fuzzy AHP. IEEE Syst. J. 2012, 6, 593–602. [Google Scholar] [CrossRef]
- Walliyamethee, N.; Hongesombut, K. Maintenance Scheduling of Distribution Reclosers Using RCM Techniques. In Proceedings of the 2019 IEEE PES Asia-Pacific Power and Energy Engineering Conference (APPEEC), Macao, China, 1–4 December 2019; pp. 1–5. [Google Scholar]
- Chaengakson, K.; Rerkpreedapong, D.; Hongesombut, K. Reliability Improvement Opportunity for 115-kV Overhead Transmission Lines Using RCM Method. In Proceedings of the 2019 IEEE PES GTD Grand International Conference and Exposition Asia (GTD Asia), Bangkok, Thailand, 19–23 March 2019; pp. 808–812. [Google Scholar]
- Vilayphonh, O.; Premrudeepreechacharn, S.; Ngamsanroaj, K. Reliability Centered Maintenance for Electrical Distribution System of Phontong Substation in Vientiane Capital. In Proceedings of the 2017 6th International Youth Conference on Energy (IYCE), Budapest, Hungary, 21–24 June 2017; pp. 1–6. [Google Scholar]
- Lazecký, D.; Král, V.; Rusek, S.; Goňo, R. Software Solution Design for Application of Reliability Centered Maintenance in Preventive Maintenance Plan. In Proceedings of the 2017 18th International Scientific Conference on Electric Power Engineering (EPE), Kouty nad Desnou, Czech Republic, 17–19 May 2017; pp. 1–4. [Google Scholar]
- Özcan, E.; Yumuşak, R.; Eren, T. Risk Based Maintenance in the Hydroelectric Power Plants. Energies 2019, 12, 1502. [Google Scholar] [CrossRef] [Green Version]
- Sadeghian, O.; Mohammadpour Shotorbani, A.; Mohammadi-Ivatloo, B.; Sadiq, R.; Hewage, K. Risk-averse maintenance scheduling of generation units in combined heat and power systems with demand response. Reliab. Eng. Syst. Saf. 2021, 216, 107960. [Google Scholar] [CrossRef]
- Yeddanapudi, S.R.K.; Li, Y.; McCalley, J.D.; Chowdhury, A.A.; Jewell, W.T. Risk-Based Allocation of Distribution System Maintenance Resources. IEEE Trans. Power Syst. 2008, 23, 287–295. [Google Scholar] [CrossRef]
- Salman, A.M.; Li, Y.; Bastidas-Arteaga, E. Maintenance optimization for power distribution systems subjected to hurricane hazard, timber decay and climate change. Reliab. Eng. Syst. Saf. 2017, 168, 136–149. [Google Scholar] [CrossRef] [Green Version]
- Yang, H.; Zhang, Z.; Yin, X.; Han, J.; Wang, Y.; Chen, G. A Novel Short-Term Maintenance Strategy for Power Transmission and Transformation Equipment Based on Risk-Cost-Analysis. Energies 2017, 10, 1865. [Google Scholar] [CrossRef] [Green Version]
- Aravinthan, V.; Jewell, W. Optimized Maintenance Scheduling for Budget-Constrained Distribution Utility. IEEE Trans. Smart Grid 2013, 4, 2328–2338. [Google Scholar] [CrossRef]
- Moradkhani, A.; Haghifam, M.R.; Mohammadzadeh, M. Failure rate modelling of electric distribution overhead lines considering preventive maintenance. IET Gener. Transm. Distrib. 2014, 8, 1028–1038. [Google Scholar] [CrossRef]
- Peng, W.; Billinton, R. Reliability cost/worth assessment of distribution systems incorporating time-varying weather conditions and restoration resources. IEEE Trans. Power Deliv. 2002, 17, 260–265. [Google Scholar] [CrossRef]
- Bowles, J.B. Commentary-caution: Constant failure-rate models may be hazardous to your design. IEEE Trans. Reliab. 2002, 51, 375–377. [Google Scholar] [CrossRef]
- Chu, C.M.; Moon, J.F.; Lee, H.T.; Kim, J.C. Extraction of Time-varying Failure Rates on power distribution system equipment considering failure modes and regional effects. Int. J. Electr. Power Energy Syst. 2010, 32, 721–727. [Google Scholar] [CrossRef]
- Phoothong, N.; Vanittanakom, P.; Teera-achariyakul, N.; Rerkpreedapong, D. Optimal Preventive Maintenance Budget Setting for Electric Power Distribution Utilities. In Proceedings of the 2008 5th International Conference on Electrical Engineering/Electronics, Computer, Telecommunications and Information Technology, Krabi, Thailand, 14–17 May 2008; pp. 957–960. [Google Scholar]
- Singh, I.; Popova, E.; Kee, E. Optimal Preventive Maintenance Policy Under a Budget Constraint. Int. Conf. Nucl. Eng. Proc. 2008, 48140, 13–18. [Google Scholar] [CrossRef] [Green Version]
- Enjavimadar, M.; Rastegar, M. Optimal reliability-centered maintenance strategy based on the failure modes and effect analysis in power distribution systems. Electr. Power Syst. Res. 2022, 203, 107647. [Google Scholar] [CrossRef]
- Dao, C.D.; Zuo, M.J. Optimal selective maintenance for multi-state systems in variable loading conditions. Reliab. Eng. Syst. Saf. 2017, 166, 171–180. [Google Scholar] [CrossRef]
- Jeromin, I.; Balzer, G. Game Theoretical Approach for Maintenance Planning of Large Networks. In Proceedings of the 2011 IEEE Trondheim PowerTech, Trondheim, Norway, 19–23 June 2011; pp. 1–5. [Google Scholar]
- Navon, A.; Ben Yosef, G.; Machlev, R.; Shapira, S.; Roy Chowdhury, N.; Belikov, J.; Orda, A.; Levron, Y. Applications of Game Theory to Design and Operation of Modern Power Systems: A Comprehensive Review. Energies 2020, 13, 3982. [Google Scholar] [CrossRef]
- Tan, X.H.; Lie, T.T. Allocation of Transmission Loss Cost Using Cooperative Game Theory in the Context of Open Transmission Access. In Proceedings of the 2001 IEEE Power Engineering Society Winter Meeting, Conference Proceedings (Cat. No.01CH37194), Columbus, OH, USA, 28 January–1 February 2001; Volume 1213, pp. 1215–1219. [Google Scholar]
- Shih-Chieh, H.; Hsin-Min, W. Allocation of Transmission Losses Based on Cooperative Game Theory and Current Injection Models. In Proceedings of the 2002 IEEE International Conference on Industrial Technology, IEEE ICIT ’02., Bangkok, Thailand, 11–14 December 2002; Volume 852, pp. 850–853. [Google Scholar]
- Heng, S.; Noohawm, O.; Rerkpreedapong, D. SPP Loss Allocation by Cooperative Games. In Proceedings of the GMSARN International Journal (ISSN: 19059094), Mandalay, Myanmar, 18–20 December 2013; pp. 13–18. [Google Scholar]
- Zhaoyang, H.; Lin, C.; Deqiang, G.; Chattopadhyay, D. Allocation of unit start-up costs using Cooperative game theory. IEEE Trans. Power Syst. 2006, 21, 653–662. [Google Scholar] [CrossRef]
- Han, L.; Morstyn, T.; McCulloch, M. Constructing Prosumer Coalitions for Energy Cost Savings Using Cooperative Game Theory. In Proceedings of the 2018 Power Systems Computation Conference (PSCC), Dublin, Ireland, 11–15 June 2018; pp. 1–7. [Google Scholar]
- Pourahmadi, F.; Fotuhi-Firuzabad, M.; Dehghanian, P. Application of Game Theory in Reliability-Centered Maintenance of Electric Power Systems. IEEE Trans. Ind. Appl. 2017, 53, 936–946. [Google Scholar] [CrossRef]
- Li, R.; Ma, H.; Wang, F.; Wang, Y.; Liu, Y.; Li, Z. Game Optimization Theory and Application in Distribution System Expansion Planning, Including Distributed Generation. Energies 2013, 6, 1101–1124. [Google Scholar] [CrossRef]
- PEA Thailand. PEA Annual Report 2019; Provincial Electricity Authority (PEA): Bangkok, Thailand, 2019. [Google Scholar]
- PEA Thailand. PEA Interruptions Database JF.3 Year 2004–2019; Provincial Electricity Authority (PEA): Bangkok, Thailand, 2019. [Google Scholar]
- Zuo, X.; Yu, X.; Yue, Y.; Yin, F.; Zhu, C. Reliability Study of Parameter Uncertainty Based on Time-Varying Failure Rates with an Application to Subsea Oil and Gas Production Emergency Shutdown Systems. Processes 2021, 9, 2214. [Google Scholar] [CrossRef]
- Robert, R. Reliability Analysis for Asset Management of Electric Power Grids; IEEE Press: Hoboken, NJ, USA, 2019; 528p. [Google Scholar]
- IEEE Std. 1366-2012; IEEE Guide for Electric Power Distribution Reliability Indices. (Revision of IEEE Std. 1366-2003); IEEE Press: Hoboken, NJ, USA, 2012; pp. 1–43. [CrossRef]
- Final Report on Reliability Target Setting Methodology Study; Kasetsart University: Bangkok, Thailand, 2013.
- PEA Strategic Plan 2014–2023; Provincial Electricity Authority (PEA): Bangkok, Thailand, 2016.
- Orths, A.; Schmitt, A.; Styczynski, Z.A.; Verstege, J. Multi-criteria optimization methods for planning and operation of electrical energy systems. Electr. Eng. 2001, 83, 251–258. [Google Scholar] [CrossRef]


| Rank | Cause of Interruptions | Customer-Minutes of Interruption | % |
|---|---|---|---|
| 1 | Equipment failure | 499,322,372 | 33.34 |
| 2 | Tree contact | 463,909,708 | 30.97 |
| 3 | Animal contact | 299,530,449 | 20.00 |
| 4 | Environment | 91,440,132 | 6.10 |
| 5 | Vehicle | 53,221,537 | 3.55 |
| 6 | Foreign object | 31,161,096 | 2.08 |
| 7 | Others | 21,693,792 | 1.45 |
| 8 | Human | 20,407,668 | 1.36 |
| 9 | Natural disaster | 16,073,329 | 1.07 |
| 10 | Overload | 1,069,261 | 0.07 |
| Total | 1,497,829,344 | 100.00 |
| Service Region | Number of Feeders | Accepted A.D. Test | Rejected A.D. Test | No Event |
|---|---|---|---|---|
| 1 | 258 | 214 | 18 | 26 |
| 2 | 257 | 226 | 8 | 23 |
| 3 | 198 | 177 | 12 | 9 |
| 4 | 257 | 189 | 29 | 39 |
| 5 | 253 | 213 | 32 | 8 |
| 6 | 250 | 200 | 21 | 29 |
| 7 | 533 | 388 | 61 | 84 |
| 8 | 454 | 275 | 76 | 103 |
| 9 | 389 | 258 | 56 | 75 |
| 10 | 221 | 156 | 52 | 13 |
| 11 | 286 | 203 | 58 | 25 |
| 12 | 202 | 155 | 35 | 12 |
| Total | 3558 | 2654 | 458 | 446 |
| Service Region | kλ < 1 | kλ > 1 | kλ ≈ 1 | Total |
|---|---|---|---|---|
| 1 | 63 | 103 | 48 | 214 |
| 2 | 13 | 196 | 17 | 226 |
| 3 | 29 | 137 | 11 | 177 |
| 4 | 58 | 101 | 30 | 189 |
| 5 | 21 | 155 | 37 | 213 |
| 6 | 50 | 124 | 26 | 200 |
| 7 | 163 | 133 | 92 | 388 |
| 8 | 98 | 123 | 54 | 275 |
| 9 | 59 | 170 | 29 | 258 |
| 10 | 77 | 56 | 23 | 156 |
| 11 | 53 | 115 | 35 | 203 |
| 12 | 36 | 96 | 23 | 155 |
| Total | 720 | 1509 | 425 | 2654 |
| Service Region | Zones | ||||
|---|---|---|---|---|---|
| Industrial | Metropolitan | Urban | Suburban | Rural | |
| 1 | 125.12 | 65.52 | 72.65 | 103.07 | 94.25 |
| 2 | 154.54 | 80.92 | 89.74 | 127.30 | 116.40 |
| 3 | * | 71.56 | 79.35 | 112.57 | 102.93 |
| 4 | * | 48.26 | 53.52 | 75.92 | 69.42 |
| 5 | * | 45.25 | 50.17 | 71.18 | 65.09 |
| 6 | 121.42 | 63.58 | 70.50 | 100.02 | 91.45 |
| 7 | 79.83 | 41.80 | 46.35 | 65.76 | 60.13 |
| 8 | 77.64 | 40.66 | 45.08 | 63.96 | 58.48 |
| 9 | 104.34 | 54.63 | 60.59 | 85.95 | 78.59 |
| 10 | 110.61 | 57.92 | 64.23 | 91.12 | 83.32 |
| 11 | * | 44.80 | 49.68 | 70.47 | 64.44 |
| 12 | 105.16 | 55.07 | 61.07 | 86.63 | 79.21 |
| Service Region | Patrol and Condition-Based Maintenance | Tree Trimming | Installing Animal Guards | Total |
|---|---|---|---|---|
| 1 | 200 | 204 | 201 | 605 |
| 2 | 213 | 222 | 220 | 655 |
| 3 | 169 | 176 | 168 | 513 |
| 4 | 126 | 107 | 109 | 342 |
| 5 | 224 | 246 | 230 | 700 |
| 6 | 137 | 132 | 140 | 409 |
| 7 | 311 | 303 | 311 | 925 |
| 8 | 294 | 302 | 293 | 889 |
| 9 | 263 | 249 | 260 | 772 |
| 10 | 184 | 182 | 182 | 548 |
| 11 | 237 | 221 | 243 | 701 |
| 12 | 176 | 176 | 176 | 528 |
| Total | 2534 | 2520 | 2533 | 7587 |
| BCR Ranking | bpm | cpm | Strategy No. | BPM | CPM |
|---|---|---|---|---|---|
| 1 | 1 | ||||
| 2 | 2 | ||||
| 3 | 3 | ||||
| j | j | ||||
| H |
| Match | Scenario | Service Regions | Utility Values of Players | Global Utilities | |||||||||
|---|---|---|---|---|---|---|---|---|---|---|---|---|---|
| 1 | 2 | … | r | … | R | … | … | ||||||
| Base | … | … | 0.5 | 0.5 | 0.5 | 0.5 | 0.5 | 0.5 | |||||
| 1 | … | … | … | … | |||||||||
| 2 | … | … | … | … | |||||||||
| … | … | … | … | ||||||||||
| … | … | … | … | ||||||||||
| … | … | … | … | ||||||||||
| … | … | … | … | ||||||||||
| … | … | … | … | ||||||||||
| … | … | … | … | ||||||||||
| … | … | … | … | ||||||||||
| … | … | … | … | ||||||||||
| … | … | … | … | ||||||||||
| … | … | … | … | ||||||||||
| … | … | … | … | ||||||||||
| … | … | … | … | ||||||||||
| … | … | … | … | ||||||||||
| . | |||||||||||||
| … | … | … | … | ||||||||||
| Best | … | … | … | … | |||||||||
| Approach | Best Strategies by Service Region | Utility Values | Global Utility | ||||||||||||
|---|---|---|---|---|---|---|---|---|---|---|---|---|---|---|---|
| 1 | 2 | 3 | 4 | 5 | 6 | 7 | 8 | 9 | 10 | 11 | 12 | ||||
| BCR prioritization | |||||||||||||||
| CPM ≤ 100 MB | 0.522597 | 0.497490 | 0.510044 | ||||||||||||
| CPM ≤ 200 MB | 0.526493 | 0.495001 | 0.510747 | ||||||||||||
| CPM ≤ 300 MB | 0.528242 | 0.492503 | 0.510372 | ||||||||||||
| Proposed method | |||||||||||||||
| Best scenario | 0.526543 | 0.494954 | 0.510748 | ||||||||||||
| Service Region | Budget ≤ 100 MB | Budget ≤ 200 MB | Budget ≤ 300 MB | Best Scenario | ||||||||
|---|---|---|---|---|---|---|---|---|---|---|---|---|
| 1 | 120.77 | 17.10 | 310 | 131.78 | 23.91 | 383 | 141.11 | 37.21 | 461 | 131.78 | 23.91 | 384 |
| 2 | 1.20 | 0.17 | 50 | 1.86 | 0.64 | 72 | 3.85 | 3.61 | 116 | 1.86 | 0.64 | 72 |
| 3 | 28.77 | 4.04 | 117 | 42.93 | 13.54 | 181 | 51.61 | 25.85 | 264 | 42.93 | 13.54 | 182 |
| 4 | 18.35 | 3.24 | 102 | 33.63 | 13.15 | 172 | 38.90 | 21.51 | 229 | 33.64 | 13.16 | 173 |
| 5 | 23.09 | 4.21 | 131 | 42.43 | 16.51 | 213 | 53.80 | 33.01 | 328 | 42.77 | 16.85 | 219 |
| 6 | 46.37 | 5.28 | 158 | 55.06 | 11.13 | 203 | 61.64 | 20.15 | 264 | 55.29 | 11.36 | 206 |
| 7 | 0.59 | 0.11 | 62 | 0.98 | 0.35 | 126 | 1.48 | 1.02 | 203 | 1.01 | 0.38 | 131 |
| 8 | 233.08 | 17.60 | 526 | 247.09 | 26.42 | 621 | 251.87 | 33.58 | 699 | 247.29 | 26.63 | 626 |
| 9 | 84.01 | 6.22 | 325 | 93.64 | 12.60 | 411 | 97.11 | 17.34 | 492 | 93.67 | 12.62 | 414 |
| 10 | 131.32 | 20.00 | 234 | 171.59 | 44.35 | 358 | 180.34 | 56.64 | 430 | 172.11 | 44.86 | 363 |
| 11 | 44.31 | 5.68 | 250 | 49.07 | 8.85 | 323 | 52.46 | 13.57 | 413 | 49.38 | 9.15 | 327 |
| 12 | 171.68 | 16.34 | 220 | 190.74 | 28.52 | 301 | 196.70 | 36.41 | 363 | 190.98 | 28.75 | 307 |
| Total | 903.54 | 99.99 | 2485 | 1060.80 | 199.97 | 3364 | 1130.87 | 299.90 | 4262 | 1062.71 | 201.85 | 3404 |
Publisher’s Note: MDPI stays neutral with regard to jurisdictional claims in published maps and institutional affiliations. |
© 2022 by the authors. Licensee MDPI, Basel, Switzerland. This article is an open access article distributed under the terms and conditions of the Creative Commons Attribution (CC BY) license (https://creativecommons.org/licenses/by/4.0/).
Share and Cite
Teera-achariyakul, N.; Rerkpreedapong, D. Optimal Preventive Maintenance Planning for Electric Power Distribution Systems Using Failure Rates and Game Theory. Energies 2022, 15, 5172. https://doi.org/10.3390/en15145172
Teera-achariyakul N, Rerkpreedapong D. Optimal Preventive Maintenance Planning for Electric Power Distribution Systems Using Failure Rates and Game Theory. Energies. 2022; 15(14):5172. https://doi.org/10.3390/en15145172
Chicago/Turabian StyleTeera-achariyakul, Noppada, and Dulpichet Rerkpreedapong. 2022. "Optimal Preventive Maintenance Planning for Electric Power Distribution Systems Using Failure Rates and Game Theory" Energies 15, no. 14: 5172. https://doi.org/10.3390/en15145172
APA StyleTeera-achariyakul, N., & Rerkpreedapong, D. (2022). Optimal Preventive Maintenance Planning for Electric Power Distribution Systems Using Failure Rates and Game Theory. Energies, 15(14), 5172. https://doi.org/10.3390/en15145172