Article

Assessment of Hydropower Potential in Wastewater Systems and Application in a Lowland Country, Lithuania

Department of Water Engineering, Vytautas Magnus University, 10 Universiteto Str., Akademija, 53361 Kaunas, Lithuania
*
Author to whom correspondence should be addressed.
Energies 2022, 15(14), 5173; https://doi.org/10.3390/en15145173
Submission received: 22 June 2022 / Revised: 13 July 2022 / Accepted: 14 July 2022 / Published: 17 July 2022
(This article belongs to the Special Issue Hydropower in the East European Region: Challenges and Opportunities)

Abstract

:
This paper focuses on possible power generation by micro-hydro turbines integrated into lowland wastewater systems, which convert the potential energy of effluents in pipes into electric power. While other European countries have widely invested in this technology, Lithuania and other Baltic countries are still behind with their potential development rate. A search for potential micro-hydro sites was carried out, and a methodology for assessing water resources for an ungauged wastewater network is proposed herein. Particularities of wastewater flow patterns are briefly reviewed, and turbine operational constraints are analyzed. The hydro turbines available on the market to be installed in wastewater systems that meet lowland conditions are discussed. Available tools on the hydropower market to conduct a preliminary assessment of potential sites for urban water networks are considered. Multicriteria analysis is performed to select optimal projects by assessing the relevant economic, technical, and environmental criteria in water networks. The outcomes of this study can be used for unlocking the hydropower potential of wastewater systems in low-lying areas.

1. Introduction

Urban water management is known to be very energy-intensive. Therefore, engineers and researchers worldwide are looking for ways to recover the energy residing in water networks supplying drinking water or collecting sewage water and their treatment plants [1,2,3,4]. The untapped potential of small (1–10 MW), mini (100 kW–1 MW), and micro (5–100 kW) hydropower systems in engineered water conduits has largely remained unexplored, and this alternative energy source is receiving more attention from regulators in a number of countries.
The EU Horizon Europe Framework Program launched a call for the “development of hydropower equipment for hidden hydropower”, dealing with hydropower generation in water infrastructure and focusing on low-head schemes [5]. For example, this area of research certainly encompasses gravity-fed municipality wastewater networks or excessive pressure installations (e.g., pressure-reducing valves or break pressure tanks) in drinking water networks.
Unlike conventional hydropower systems operating in rivers, hidden or in-conduit hydropower systems have a minimal environmental impact as these systems are fully integrated into existing infrastructure [6]. These hydropower systems specifically harness the excess energy of water being used for a purpose other than energy generation.
The EU is fostering the exploration of the potential of micro to small hydropower energy recovery in municipal water systems. A project investigated the technical and economic feasibility of energy recovery from the municipal water networks through the installation of micro-hydro (MHP) turbines and established a GIS (geographic information system) database [7]. A recently completed project developed an institutional, social, and technological environment to increase resource efficiency in water networks by installing micro-hydropower technology [8]. An ongoing project has established a geodatabase of untapped potential energy recovery locations at existing hydro installations in selected European cities and countries [9,10]. Considering their outcomes, public water systems and publicly owned treatment works, including wastewater facilities, could benefit from installing an in-conduit hydropower system.
A comprehensive overview of innovations in in-conduit hydropower technologies and their applications was given in [11,12]. Real case studies with a brief technical description of small hydro turbines integrated into water infrastructure, including drinking water and wastewater networks, were presented in [6]. Assessments of hydropower potential, including the technical and economic viability of installing turbines in water and wastewater infrastructure, have been conducted in a number of countries [1,2,13,14,15,16,17].
The literature analysis showed that, in contrast to wastewater systems, there are significantly more available studies on energy recovery in raw or potable water distribution systems. Moreover, for the latter, hydropower potential can be relatively quickly assessed. Yet, there are significantly more studies on energy recovery from wastewater treatment plants (WWTPs) than from wastewater collection networks (upstream of WWTPs). Most studies have dealt with the installation of hydro turbines at the outfalls of WWTPs (downstream), where the water has already been treated. However, challenges appear upstream of WWTPs where raw wastewater quality and clogging of turbine runners can compromise normal operation. Experience from sewage pumps can be beneficial in addressing this hot topic.
Assessment of wastewater resources for hydropower generation is a crucial task. It is essential to know the amount of wastewater, as well as its flow rate and distribution over time. Flow rate frequency analysis must be performed to construct the flow duration curve (FDC), which is a key element for estimating hydropower energy [18,19]. The hydrological aspects of wastewater are not discussed here in detail. However, there are apparent differences between runoff formation in water networks (anthropogenic pattern) and natural streams or rivers. Sewage accounting is most accurately conducted at water treatment plants. However, not all WWTPs have flow meters installed. A big issue is accounting for wastewater flow in the collection network, i.e., upstream of the WWTP. A methodology is needed for the construction of the FDC for ungauged sites. In Switzerland, typical FDCs have been proposed for WWTPs [2].
The impact of variation in sewage flow due to storm events and changes in water demands on the optimal design of turbines was investigated [15]. Flow in WWTPs varies with daily water demand patterns, by season and year, and is subject to stormwater events depending on geographical location. Storm events are a random process; therefore, there is a need to examine wastewater networks and how their flow responds to these events at a particular site. Moreover, the effect of storm events is mostly considered at WWTPs, not in the wastewater network. Therefore, there is no firm response regarding the opportunities to account for hydropower generation from stormwater.
A wastewater treatment outlet is generally appropriate for installing turbines due to the sufficient and constant water flow. The parameters required for selecting hydro turbines, such as head and flow, are monitored continuously as part of the WWTP process. Therefore, the turbine’s performance can be relatively easy to monitor [12]. However, there might be a pitfall for low- or ultralow-head plants if the so-called tailwater effect is not considered. At most sites, depending on the receiving water body (e.g., river), during a flood period, the tailwater level at the outfall rises more than the level upstream of the intake and causes a reduction in the head. However, these cases are rarely reflected in the literature.
A comprehensive overview of turbines applicable to in-conduit and hidden hydro, especially highlighting recent advances in turbine technology, was given in [11,20,21]. Innovative technological solutions that improve conventional turbines with robust designs, better efficiency, and possibly lower cost were proposed [12]. At the same time, although newer or emerging technologies offer innovative approaches to in-conduit hydro generation, they are not always the most cost-effective choice [22]. The equipment cost comparison is complicated due to various sites and turbines. Yet, even if construction and installation costs are cheaper for modular systems, their hydromechanical and electric operating costs can be more expensive than those of conventional turbines [12,23].
Because conventional hydro turbine technologies are not always competitive in the market, low-cost generators (e.g., pumps as turbines (PaTs)) are suggested. They are standard pumps utilized as turbines by reversing the flow direction across them. Research on PaTs and their application to small and micro-hydropower has been going on for about 100 years and is still relevant today [24,25,26,27]. PaTs are usually used at sites with higher heads; the experience of low-head application is seldom covered in the literature.
The availability of water pumps and their attractive cost for conventional hydro turbines make them a perfect technology for exploiting the untapped in-conduit hydro potential that can be technically feasible but not financially viable. However, PaTs have the shortcoming of a relatively low efficiency, which can be further reduced with high flow fluctuations, as in the case of the Francis turbine. Table 1 shows some major differences between PaT systems and conventional turbines.
The lack of in-depth studies dedicated to the impact of wastewater quality on hydro turbines, particularly the risk of clogging them in sewage networks upstream of WWTPs, can be a severe problem. In contrast, in the field of pumps, this critical issue is being addressed [30,31]. There is no significant difference between the operating modes of these hydraulic machines. Therefore, the experience in pumps can be straightforwardly applied to turbines. This is true, bearing in mind that the number of PaTs installed in water networks is increasing.
Tools to support water and wastewater utilities in assessing the technical and economic feasibility of installing hydropower facilities are of utmost importance. Because most in-conduit or hidden hydro systems are relatively small in capacity and, therefore, necessitate a relatively expensive feasibility analysis, assessment tools need to be as user-friendly and cost-effective as possible. Existing tools do not meet these requirements for small developers [32]. A few engineering design tools have been proposed to evaluate conduit projects, though they have not yet been applied to broader assessments. However, some exceptions can be attributed to the US-developed tools [12,33]. These tools operate in readily available spreadsheet software and can be accessed for free.
The literature review revealed no specific tool at the European level for even preliminary assessments for hydropower recovery in water networks. However, a slight exception can be made for a tool intended for water suppliers to perform the basic design of a site [34]. Some reviewed publications mentioned using standard Microsoft Excel calculations to complete a preliminary evaluation of water network sites; however, they are not openly available to hydropower designers.
There are several available assessment methods or tools for conventional small hydropower projects [35,36]. For example, a clean energy management software system, RETScreen Expert, is widely used [37,38]. It is the most comprehensive tool, allowing designers to model and analyze any renewable energy project to complete its pre- or feasibility analysis.
Water and energy management requires considering a variety of often conflicting factors. Multicriteria/multi-attribute analysis (MCA) is often a core part of this challenge. Many publications used MCA in the siting of RES facilities, including conventional hydropower generation sites [39,40,41]. However, there are not many publications on the application of MCA in hidden hydro networks, particularly municipal water networks. A turbine was selected at the outfall of WWTPs by assessing economic, technical, and environmental factors [23].
Researchers and practitioners largely use some five to seven MCA methods [42]. The paired comparison and outranking methods are popular in explicitly evaluating multiple conflicting decision-making criteria. The most known outranking method is ELECTRE [43,44]. To facilitate MCA practical application, software is needed. Several programs related to MCA exist on the market, categorized as free, semicommercial, and commercial [45].
Lowland or low-lying areas of a country represent challenges for installing hydro turbines in urban water networks compared with regions with a steep topography surrounded by mountains. The accuracy and completeness of the hydraulic data are crucial, especially when evaluating low- and ultralow-head sites. Ultralow head is defined for sites with a hydraulic head of less than 2–3 m [18,46]. Some authors even offered a feasibility threshold for such plants operating in urban areas: a minimum head of 4.5 m with a flow of 0.05 m3/s [16].
According to our survey, no operating hydropower turbines were detected in the water supply or sewage collection network in the Baltic states, including Lithuania. The main cause of this is a lack of awareness of such technology. Moreover, the renewable energy (RE) law of the Republic of Lithuania does not consider such technology; consequently, there is no kind of incentive. In contrast, some countries have implemented government-funded financial incentives for RE generation from gravity-fed systems, thus encouraging water companies to implement MHP schemes [13].
Despite the good practices reviewed above in a number of countries, a challenge remains during the planning phase of hydropower development, as the lack of access to available WSW data limits the quantification of water power potential, and thus the identification of potential sites. The lack of methodologies dedicated to quantifying hydropower parameters using limited data is prevalent. In an effort to address this problem, a methodology was proposed to quantify potential and identify in-conduit hydropower sites in the wastewater systems of lowland countries. This study is the first attempt to encourage water utilities and private owners to unlock the hydropower potential in their service areas. The overall aim was to evaluate the hydropower potential in urban networks in low-lying areas and propose methodologies for its practical use.
The specific objectives of this study were as follows:
  • To review the available best practices of energy recovery in wastewater systems and identify methodology on the basis of local conditions;
  • To search for the potential sites for the installation of hydro turbines and to evaluate wastewater resources for harnessing hydropower;
  • To review and propose tools to facilitate preliminary and/or feasibility analysis of hydro schemes and to review turbines and their installation layouts in wastewater systems;
  • To show best practice in performing multicriteria analysis for the selection of optimal sites.

2. Materials and Methods
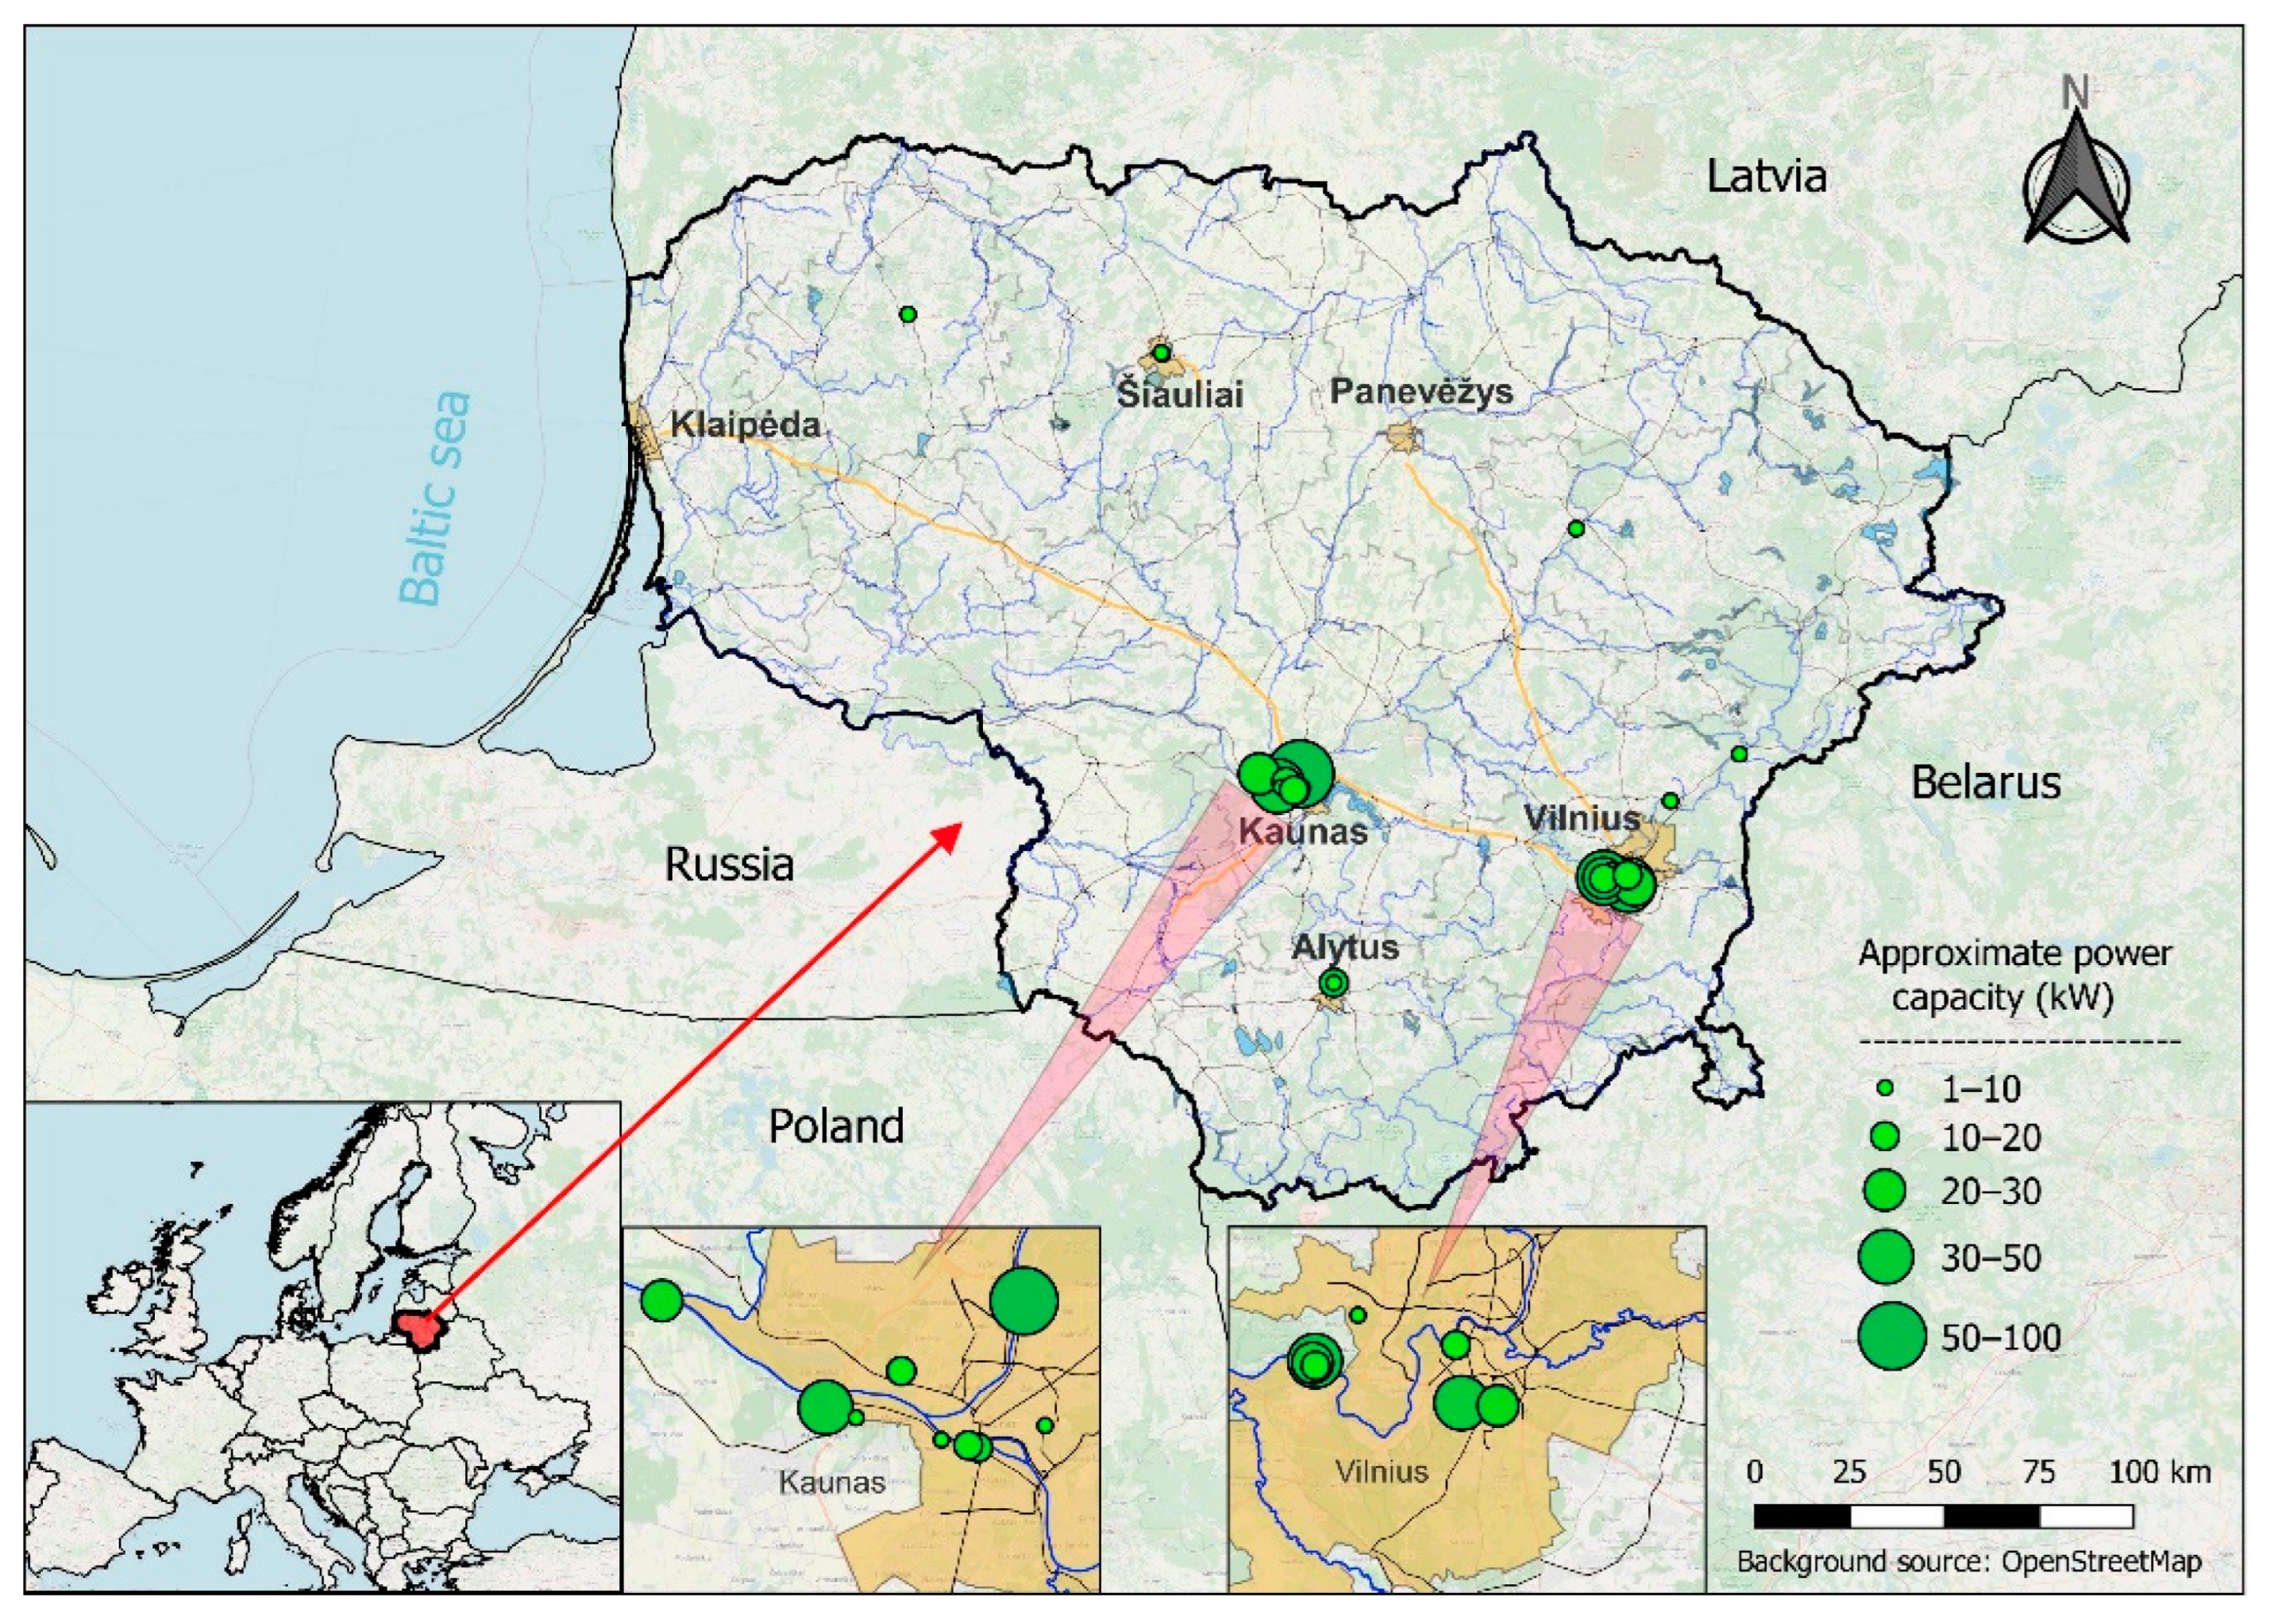
2.1. Study Area

Lithuania is a low-lying country; therefore, the country’s SHPs operating in run-of-the-river mode mostly feature a low or medium head (up to 15 m). The same picture is valid for the remaining Baltic countries [47]. Due to the country’s topographic conditions, mostly sewage (wastewater) networks with free gravitational flow are attractive for harvesting water energy. Drinking water is extracted from a deep aquifer, and its distribution systems are artificially pressurized and can seldom be used for energy recovery.
The study area was the urban water network with potential micro-hydro sites deployed in Lithuania. More than 20 potential sites for installing hydropower turbines were identified (Figure 1 and Figure 2). Most of them were located in the sewage network, while only one site was spotted in the drinking water distribution network with a pressure-reducing valve [48]. Their preliminary power capacity was estimated as less than 100 kW. These potential sites with preliminary key characteristics, including those operating in other countries, are freely available [9].
Two large cities, Vilnius and Kaunas, including the town of Alytus, stretch around the largest rivers, the Nemunas and the Neris. The search for suitable sites for hydropower plants showed that the most significant potential exists in sewage networks, where their collectors (mains) descend into deep river valleys. It worth highlighting that 58 WWTPs are operating in the country. However, most of them exhibited no significant elevation drop (at outlets or inside water treatment installations).
This study examined the opportunities of MHP energy recovery at three WWTPs, four wastewater collectors (upstream of WWTPs), and one site in the drinking water network (Table 2). The latter represents a separate case and is not detailed in this study.
There are two layouts for installing a hydro turbine in sewage networks: upstream and downstream of the operating WWTP (Figure 3).
In the first case, untreated wastewater passes through the turbine, adversely affecting its operation. The hydro turbine should be more corrosion-resistant, and the intake must be provided with a trash rack. The second case, where the turbine is behind the wastewater treatment plant, is much more acceptable—the hydro unit encounters treated wastewater.
There are fundamental differences between installing turbines in WWTPs and installing them in their outlets or sewage collection networks. This is not only related to the quality of the wastewater (treated or untreated sewage). It is not always technically possible to create pressure in the collector of the sewage network due to existing side branches connected to the main (collector). Simple energy-dissipating devices are also installed in the high-slope gravity sewer mains to reduce the flow velocity. In this case, it is difficult to build up pressure in the collector; it is necessary to reconstruct the pipeline in order to make it work as a penstock. As a result, due to the additional civil engineering work, the MHP project can hardly be considered economically viable. Moreover, the quality of the pipe material, current technical state, and duration of service can also pose a problem. Consequently, converting gravity-fed pipelines into a high-pressure hydraulic regime (penstock) can be challenging.
The layouts of water network systems, their engineering drawings, and spatial information (GIS data) available from water companies were analyzed. In contrast, the assessment of the head did not present any difficulty.

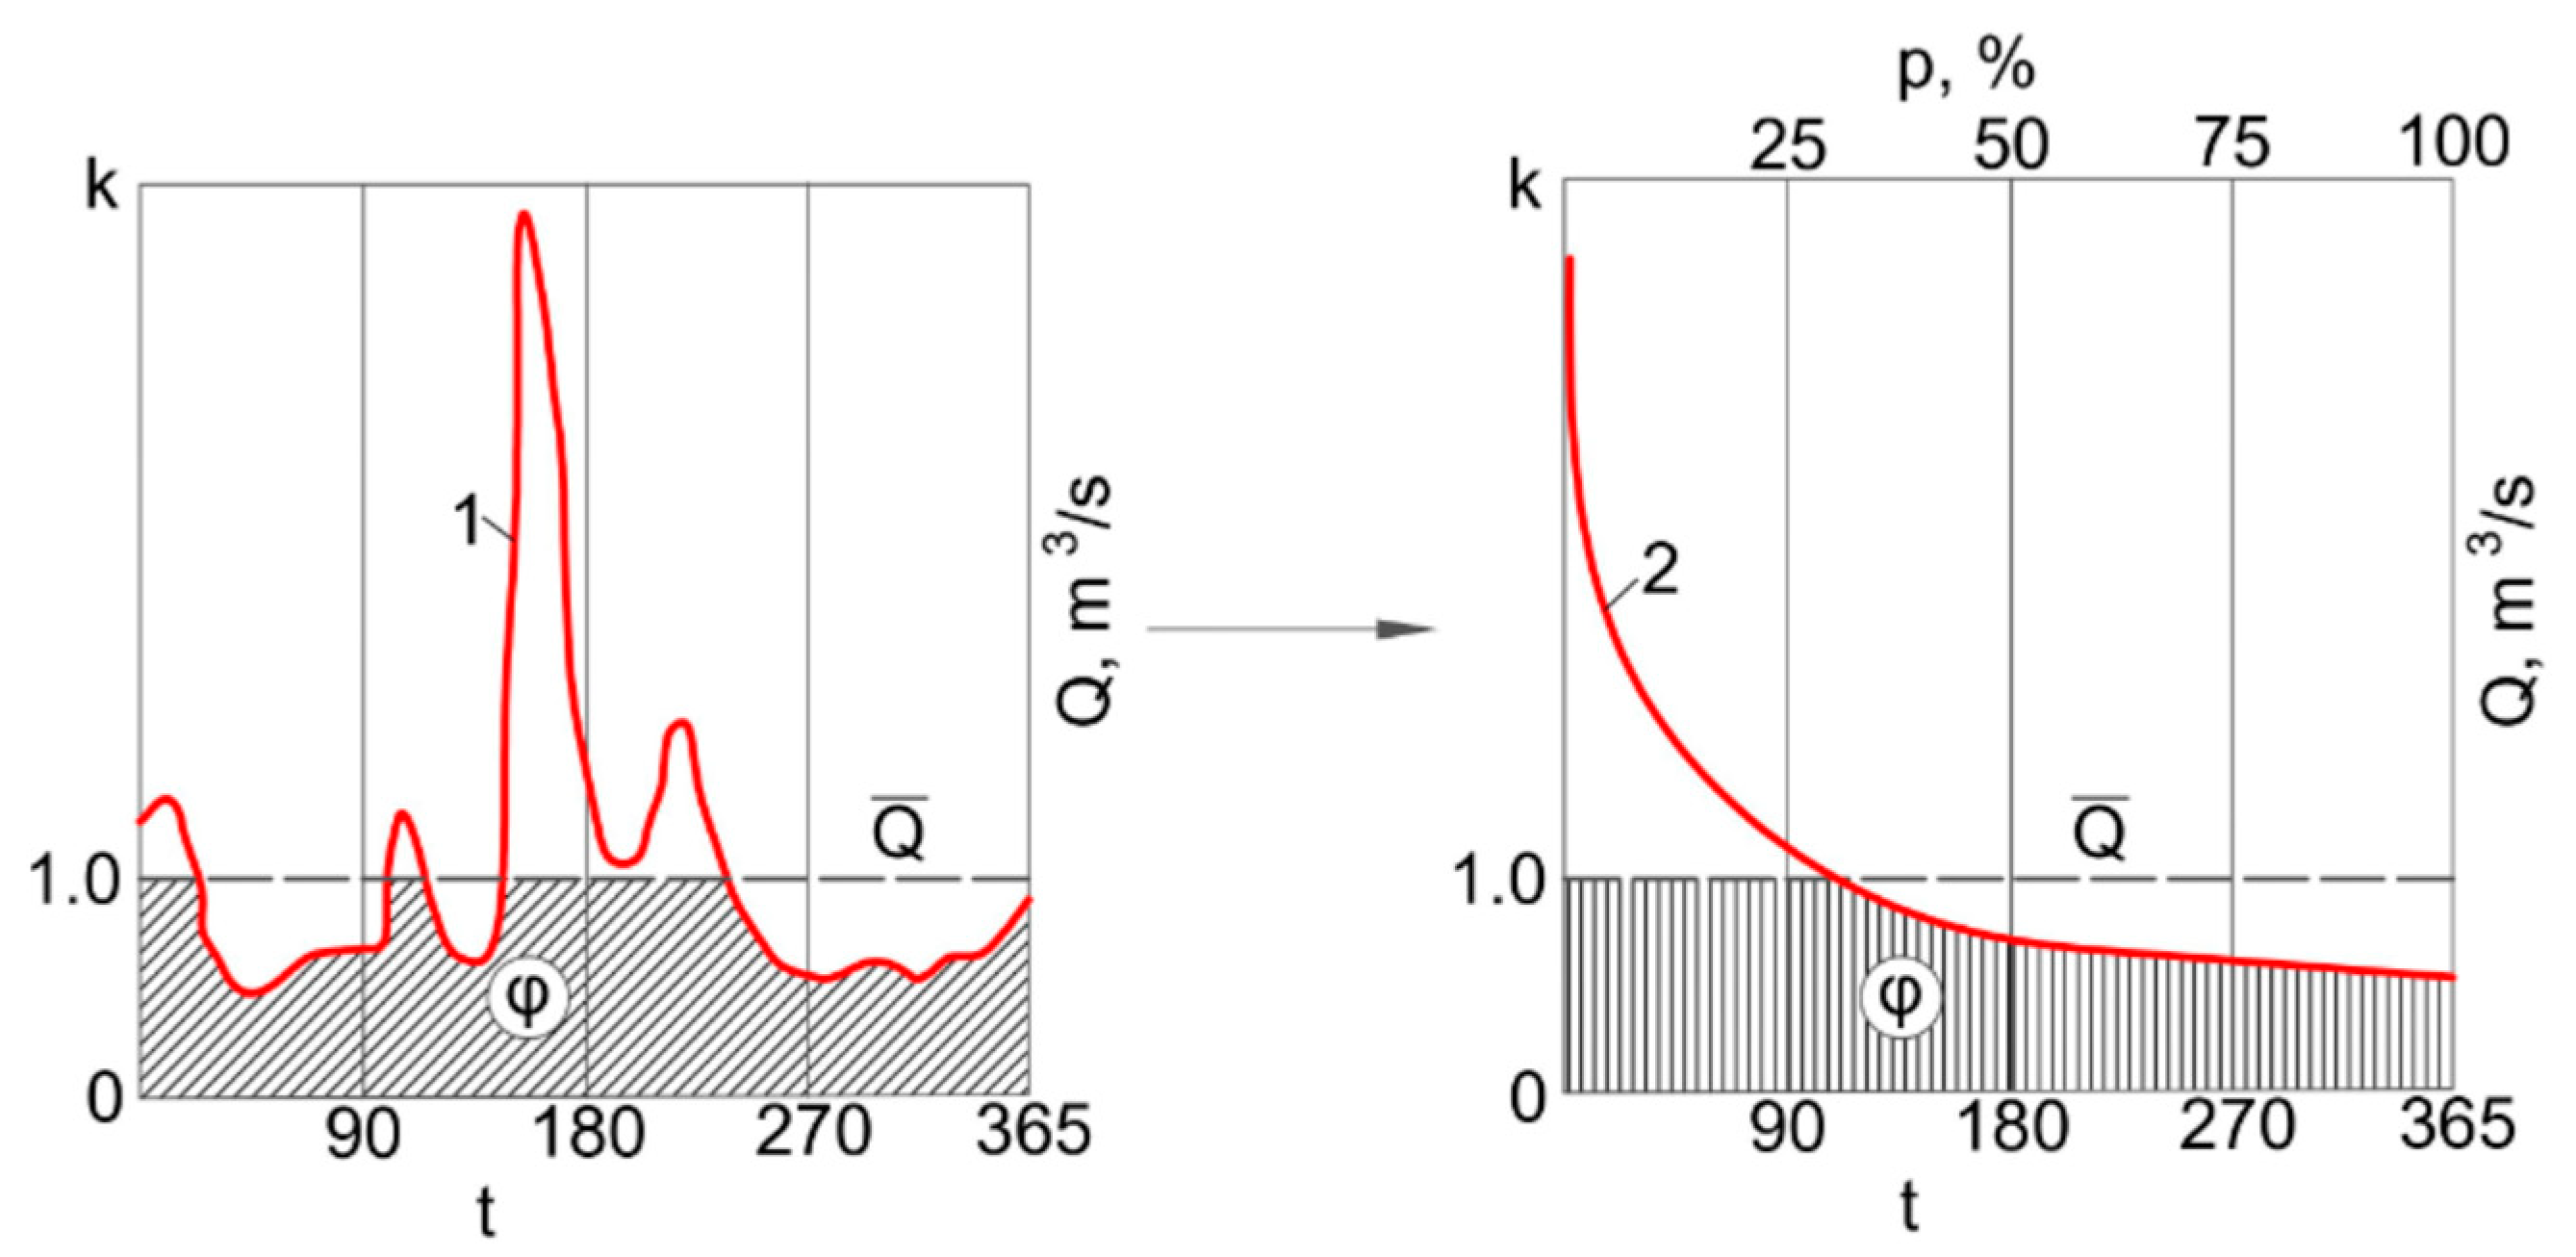
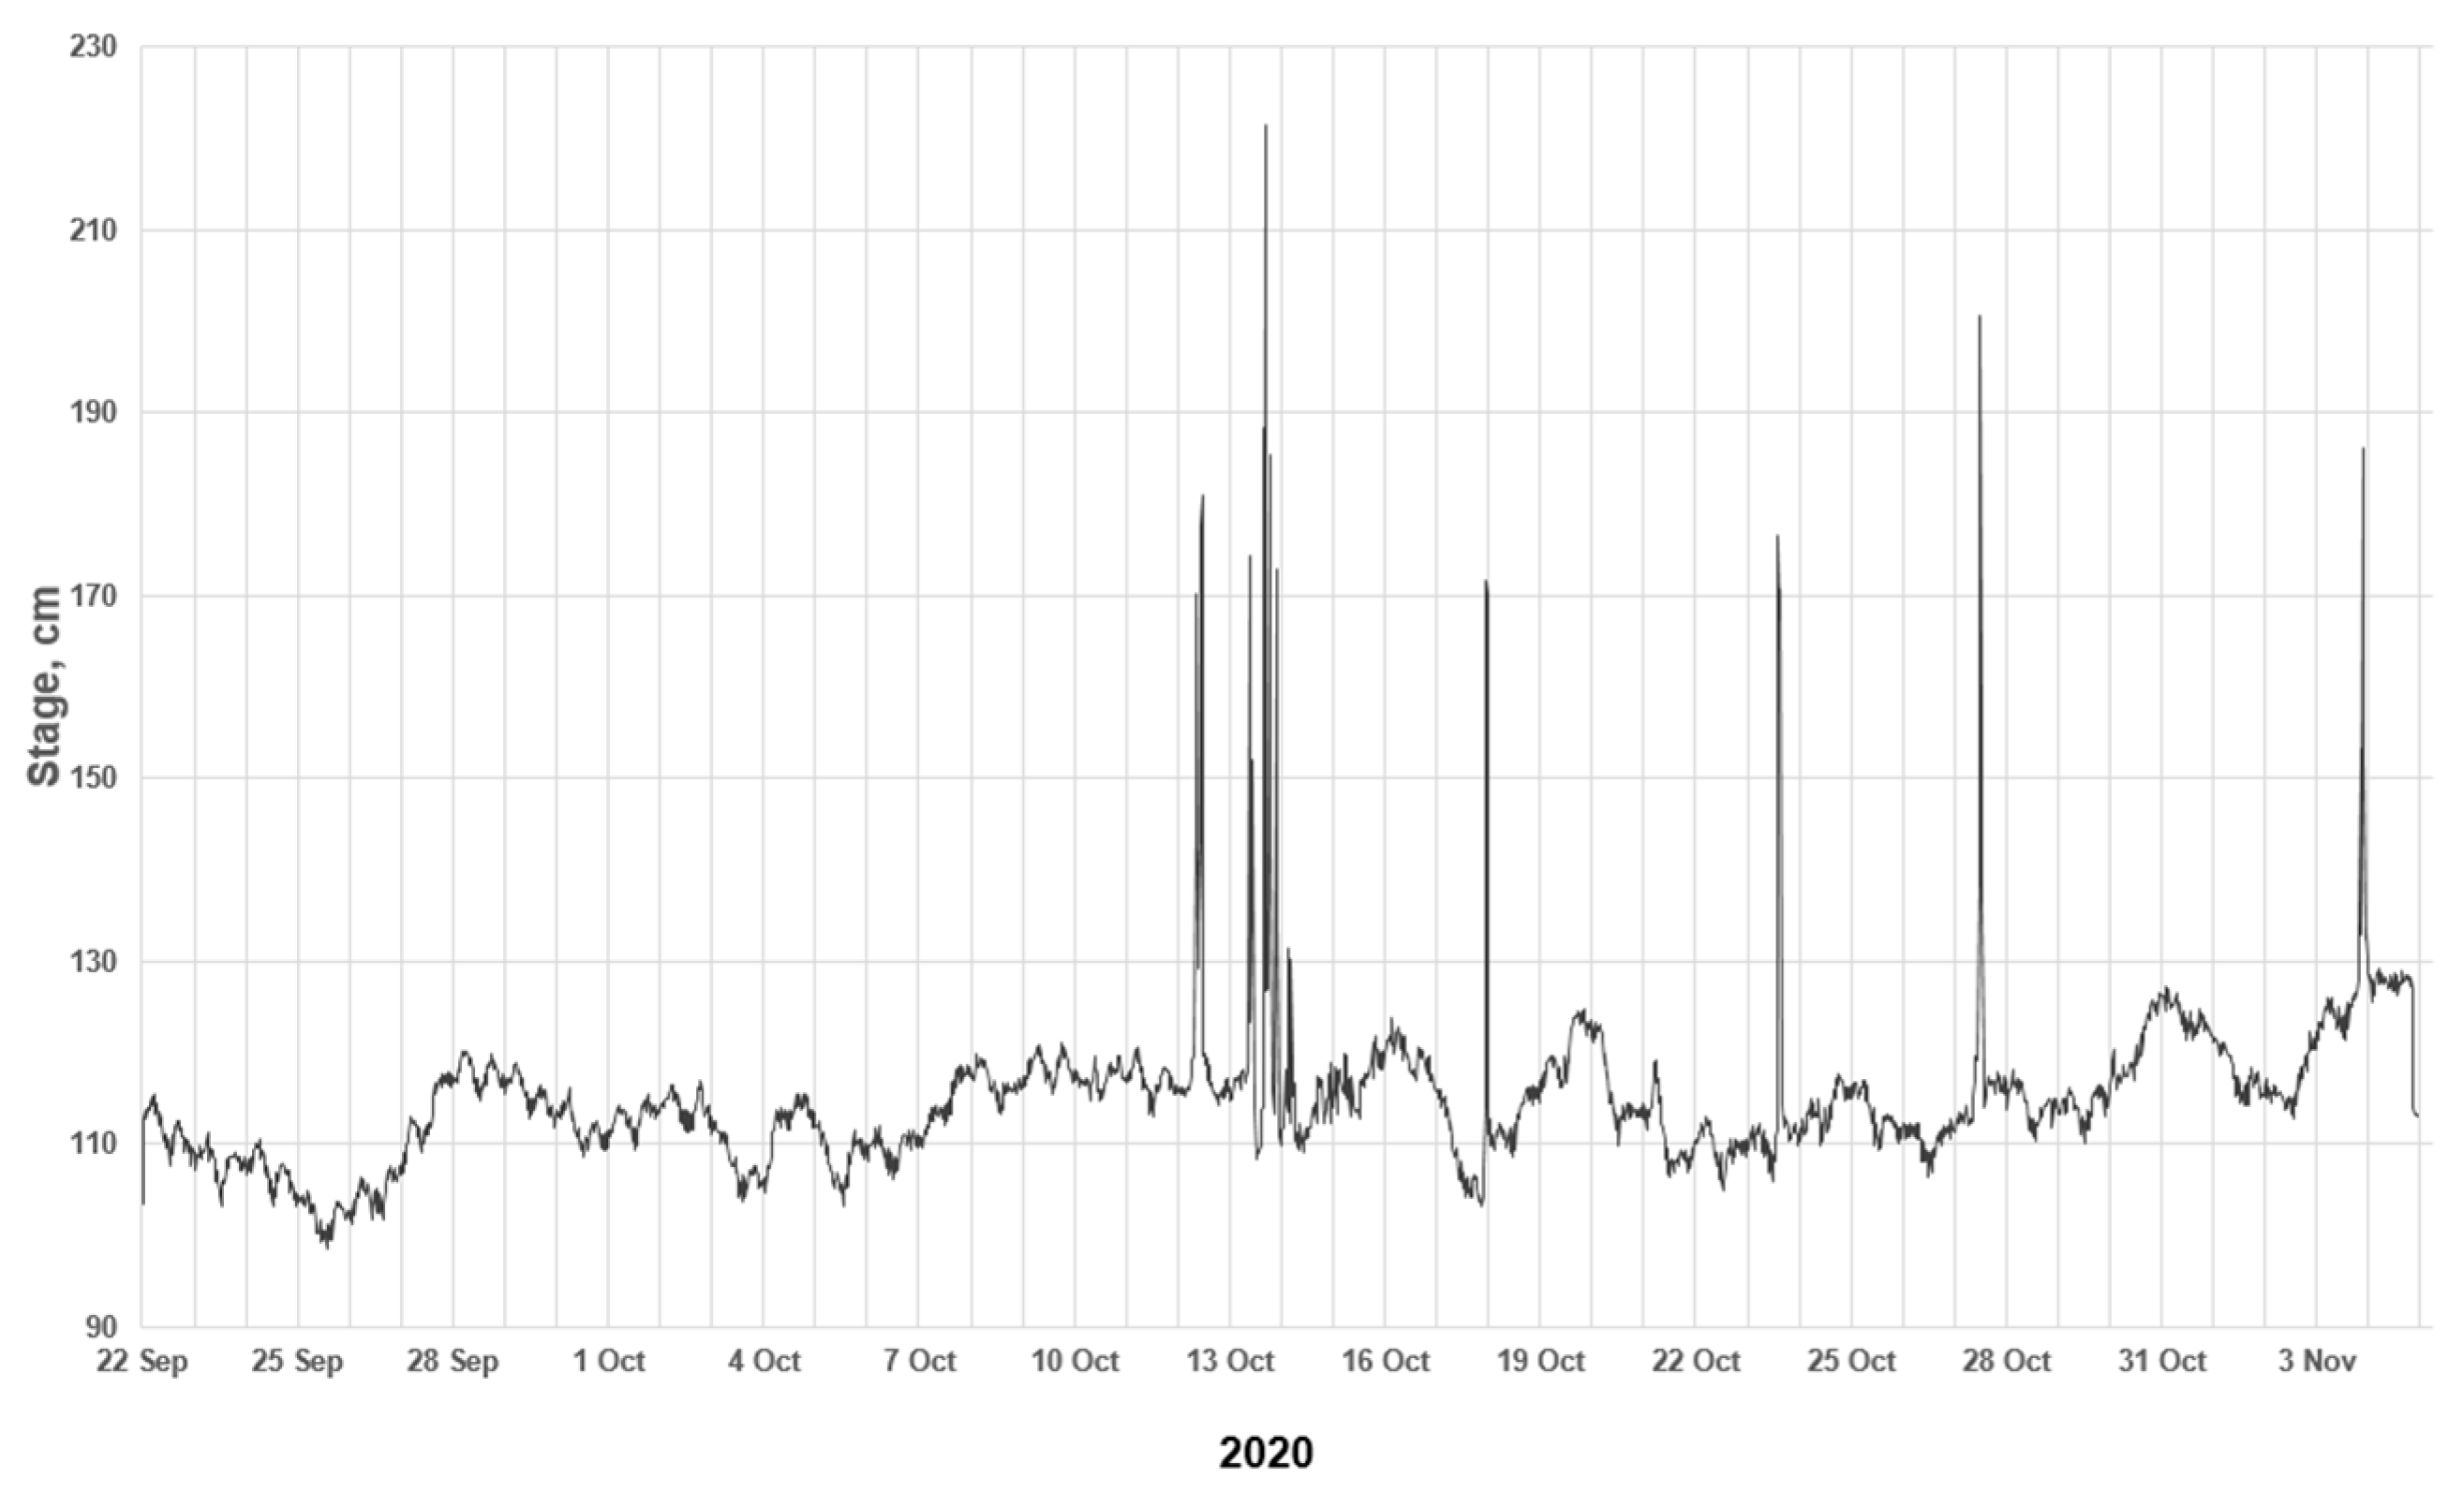
2.2. Water Resources

A big challenge was to evaluate available water resources for power generation at individual sites. Over time, reliable trends in wastewater patterns are difficult to predict in Lithuania. For instance, in the town of Alytus (population of some 50,000), the amount of wastewater treated in the last 10 years decreased twofold. The same situation can be seen in other cities in the country. This was due to demographic conditions and the technological transformation of the water use in industry. Only in the last 5 years has the volume of wastewater treated by WWTPs stabilized.
Sewage volume data were obtained in various temporal formats (months, days, hours, and even minutes) from WWTPs and water utility companies. Additionally, measurements of wastewater-level fluctuations at the outlets of WWTPs and key structures of the collection network (upstream of the WWTP) were conducted to reveal the pattern of wastewater flow. Spot measurements (from 1 to 3 months) using data loggers at a 30 min interval were also performed. The recordings obtained were transformed into volumetric discharge values.
In hydrological analysis, as a common rule, the length of flow records to construct a reliable flow duration curve (FDC) must be at least 15 years [18,49]. The FDC is a graph that shows the percentage of time that flow in a waterway is likely to equal or exceed some specified value (Figure 4). Mean daily flows used for FDC construction represent the most accurate results for designing purposes. An FDC based on mean monthly flows can only be used for a preliminary study.
To compare the FDCs developed for each site, their normalization was performed according to the mean daily flow Q ¯ [50]. The parameter Φ describing the shape of the dimensionless FDC was used (Figure 4). The area under the curve represents the volume of the flow.
To construct the dimensionless FDC, the ratio k was defined using the following formula:
k i = Q i Q ¯ ,
where k i is the normalized flow, Q ¯ is the mean daily flow (m3/s), and Q i is the daily flow at time t i .
Q ¯ = i = 1 n Q i n
where n = 365 days. When Q i = Q ¯ , k = 1.
The Φ is the mean flow area (dashed area below the FDC) with respect to the whole FDC area (defined below the red curve).
Φ = 0 1 t k I
It is evident that, for a steep curve, the Φ value is low, whereas for a flat curve, the Φ value is much higher. The latter is always desirable for any hydro scheme, as it indicates a relatively stable flow regime.
To account for a tailwater effect at the site of the treated wastewater outlet, daily water level records were used to construct the head-duration curve for the outlet of the WWTPs. For example, for site K-3, the recorded statistics of the Nemunas river at the Lampedziai gauging station (2014–2019) were considered.

2.3. Assessment Tools

As mentioned, methodologies or tools available to carry out hydro projects (preliminary designs or feasibility studies) are abundant. On the basis of previous experience, only the most suitable tools for water supply and WWTP infrastructure were reviewed. When reviewing tools designated for assessing the feasibility of installing hydro units in urban water networks, the differences in the interpretation of the terms software, computer package, and Excel®-based workbook were ignored.
The following tools were tested: (1) RETScreen Expert [37,38], (2) In-Conduit Hydropower Project Screening Tool [33], and (3) Business Case Assessment Tool [12]. RETScreen Expert was identified as the most comprehensive tool for assessing the feasibility of eight potential sites.

2.4. Multicriteria Analysis (MCA) Methods

The multicriteria analysis of siting potential micro-hydro facilities in urban water networks was carried out using the software HYPSE [51]. The analysis considered a classical outranking technique, ELECTRE [43,44]. The data employed are shown in Table 3.
It is beyond the scope of this paper to summarize all available MCA methodologies. The crux of MCA is the construction of a two-dimensional impact matrix, including alternatives or scenarios (e.g., projects or actions) and their criteria according to which the alternatives must be evaluated (Table 3). Collected field data and data generated by RETScreen Expert software were used as the input for this matrix. For the criteria, their properties were chosen to represent the prospective sites as objectively as possible, taking into account MCA experience [52]. A more detailed description of the criteria is given in Table 4. To rank these hydropower sites, 17 criteria were identified, grouped into three identical groups: technical (TEC), economic (ECO), and environmental (ENV) factors.
The solution to any MCA using concordance analysis must be implemented through successive steps. Since most of the criteria had different units, it was necessary to perform their normalization. The min–max normalization was used, after which a pairwise comparison of the criterion scores (from 0 to 1) was carried out.
The approach of concordance analysis involves a pairwise comparison of all projects (alternatives or scenarios) in the matrix in each criterion. From each comparison between two projects i and k, we obtain concordance and discordance indices (Cik and Dik, respectively) [51].
The concordance matrix and resulting dominance index (ci) consider positive aspects of alternatives. The discordance matrix reflects the negative aspects of projects, which evaluates the differences of two alternative projects. Four discordance dominance indices are commonly used: (1) simple discordance index (di,SD), (2) weighted discordance index (di,WD), (3) aggregate discordance index (di,AD), and (4) weighted aggregate discordance index (di,AWD). When they are low, i.e., have a negative value, there is a greater dominance of project i. Thus, the projects can be ranked in decreasing order. The global synthetic index (GSi) integrates the information on each project’s positive and negative aspects. Its score must meet the condition ∑GSi = 0, and the best option should favor those projects with GSi > 0. The decision-maker most commonly chooses the project or alternative with the highest average ranking.

3. Results and Discussion

3.1. The Search for Potential Sites

Unlocking available SHP potential in the water network requires a framework that allows potential developers to locate this potential. There are obviously known sites in drinking water networks with excess head or pressure. For pipe network engineering, layouts and drawings are available; thus, their identification is not difficult. The same is true for WWTPs at inlets and outlets. However, the problem stems from the wastewater collection network placed in the areas upstream of WWTPs.
A number of authors have used spatial information (GIS data) to identify potential hydro sites in water distribution systems and compiled geodatabases [2,9,13,53]. Many countries offer spatial databases, i.e., high-resolution digital terrain or elevation models (DEMs). Global terrain data from Google Earth or other platforms, along with the Shuttle Radar Topography Mission (SRTM) DEMs from the United States Geological Survey [54], can also be used but with caution, i.e., only for the initial assessment of SHP locations and not for flat terrains or low-lying countries and regions with a low vertical resolution in topography. The SRTM DEM with a spatial resolution of 30 m has a reported accuracy of ±16 m [55], which is acceptable. However, the vertical accuracy crucial for determining elevation has also been reported to be <9 m for flat terrain and 4.3 m for mountainous regions. Such accuracy would exceed any project design standard.
As the analysis of prospective sites in wastewater networks in Lithuania has shown, gross head (a drop in elevation) or location coordinates can be determined from the GIS spatial data portal freely available in the country. However, the accuracy of this assessment will be low for ultralow- or even low-head schemes because the vertical resolution of the DEM would be insufficient.
Spatial regression analysis performed to assess the correlation between the hydropower recovery potential of the sites in water networks and the geographical data showed that there was no significant correlation between the population and terrain variability [56]. In other words, the potential of a hydro site is too site-specific for variables to explain the variation in potential.
Water utilities also operate their own georeferenced database from which wastewater network physical features can be identified. Unfortunately, these GIS databases rarely provide flow data. Flow rates of a particular wastewater collection service area can be roughly evaluated according to the population or number of residential areas connected according to the water use. However, it is hard to estimate the generated effluent volumes of industrial facilities.
Various GIS tools have been proposed to search for traditional hydropower sites or their potential [35,57]. Unfortunately, as our study has shown, no automatic site search using GIS tools is possible due to the technical complexity of sewage pipeline systems.

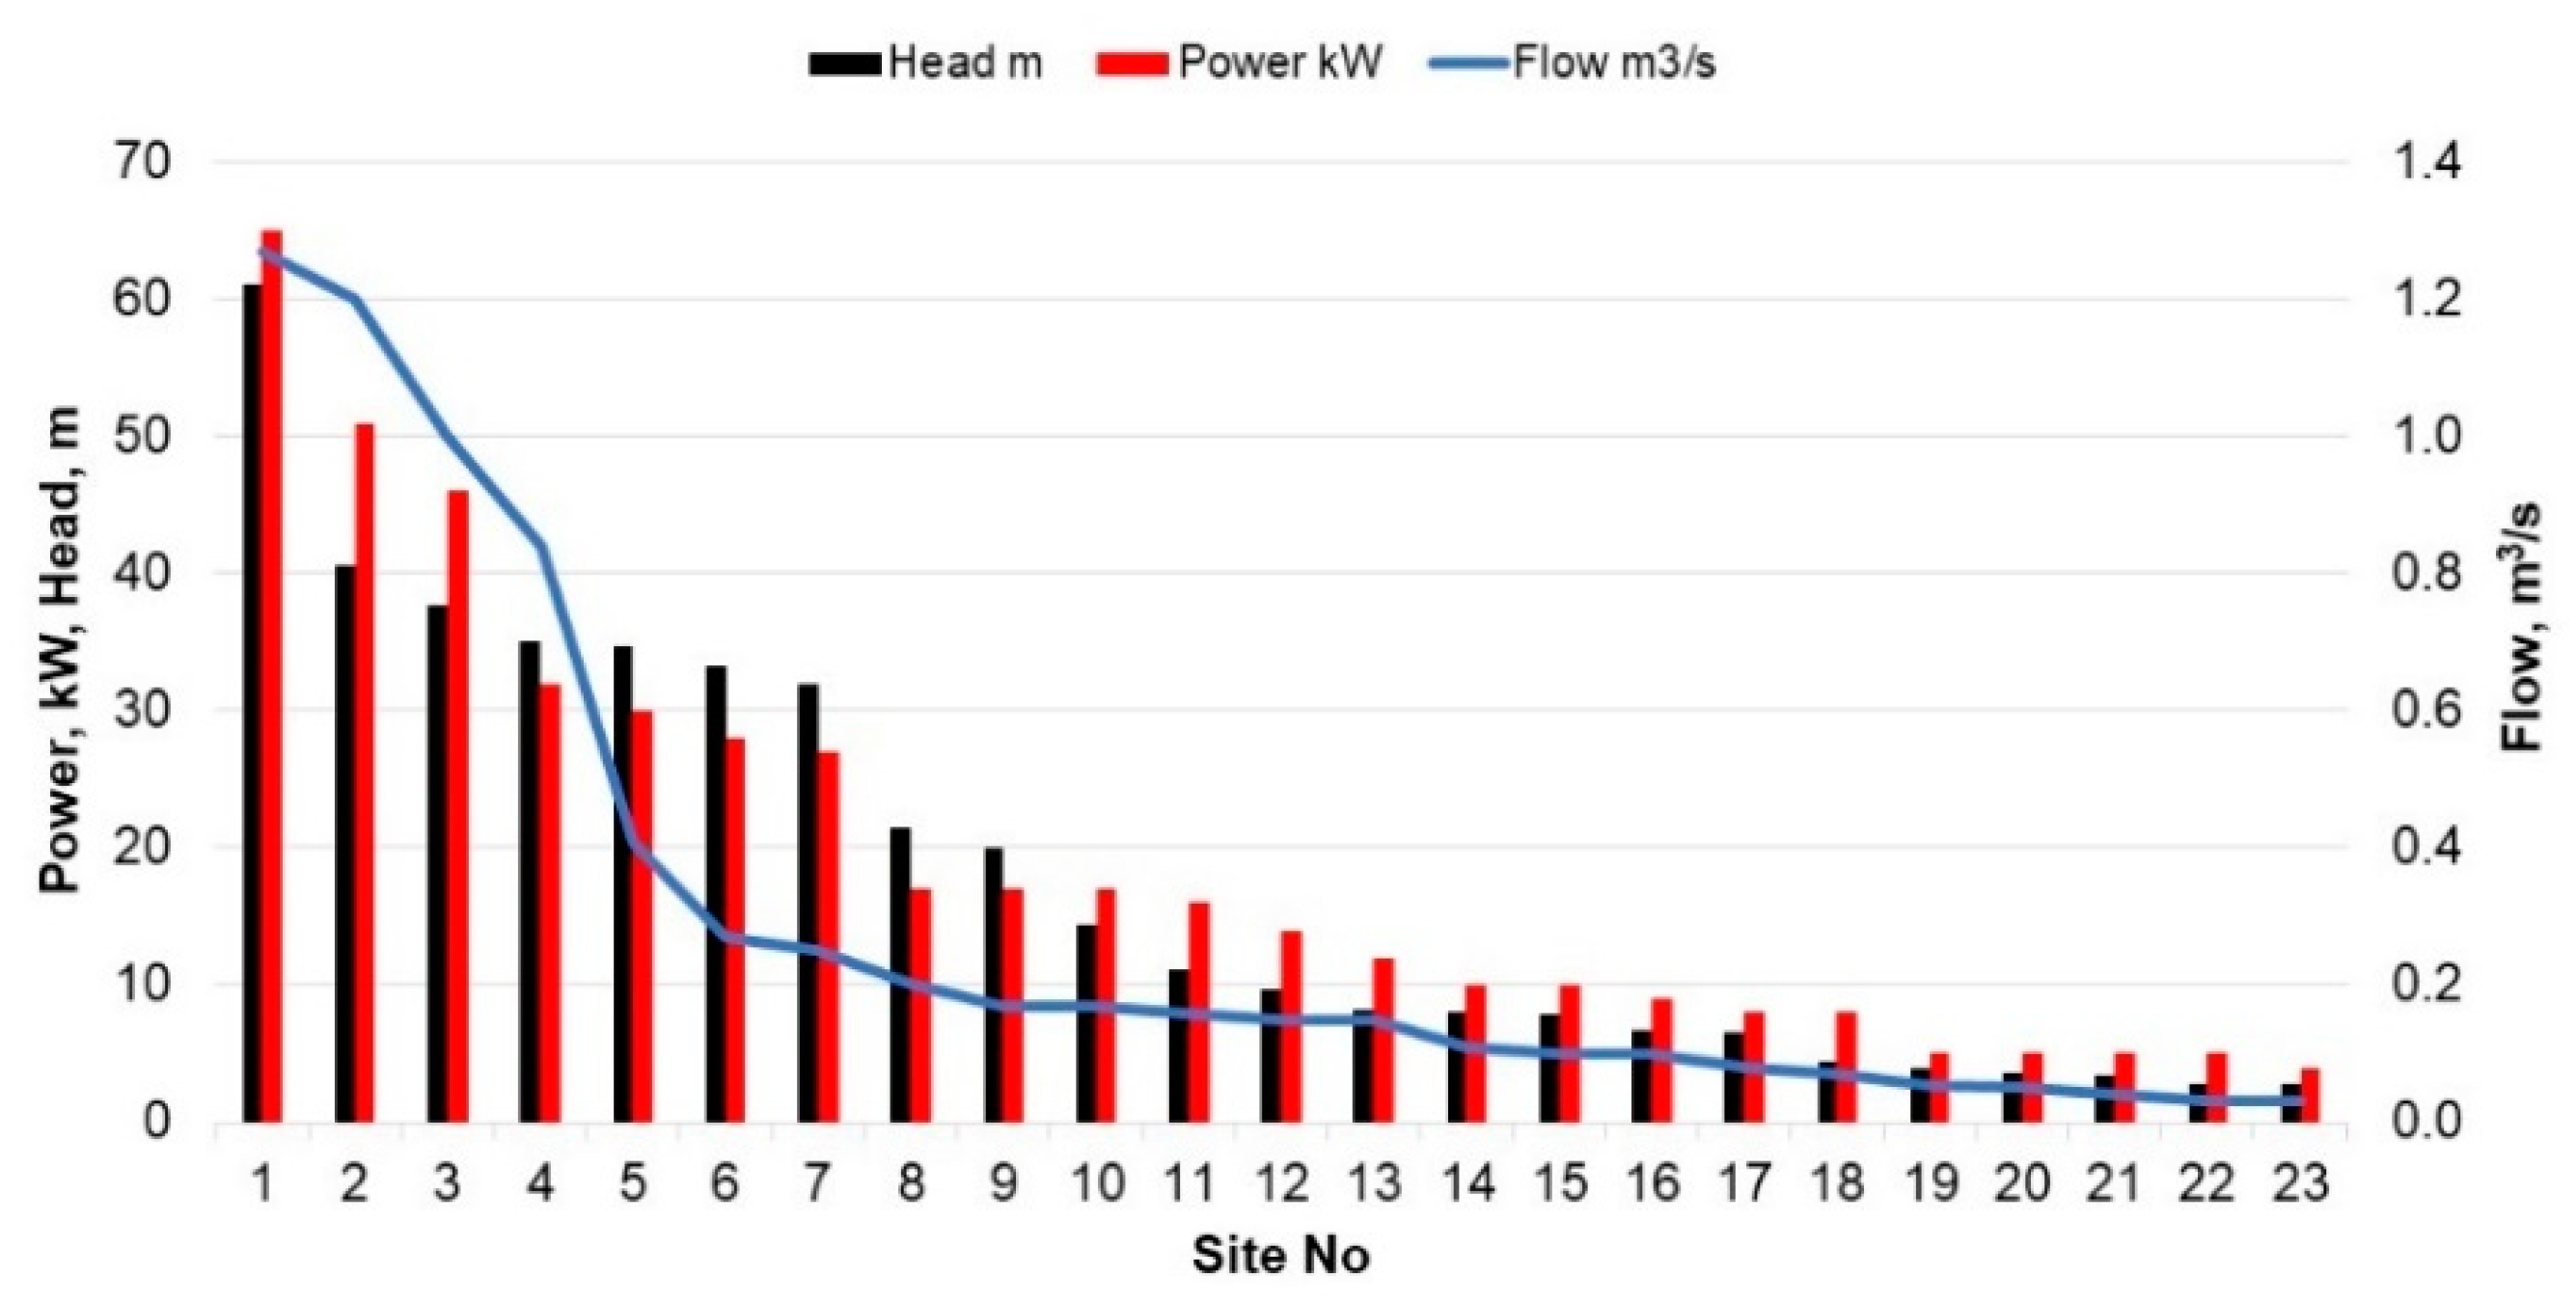
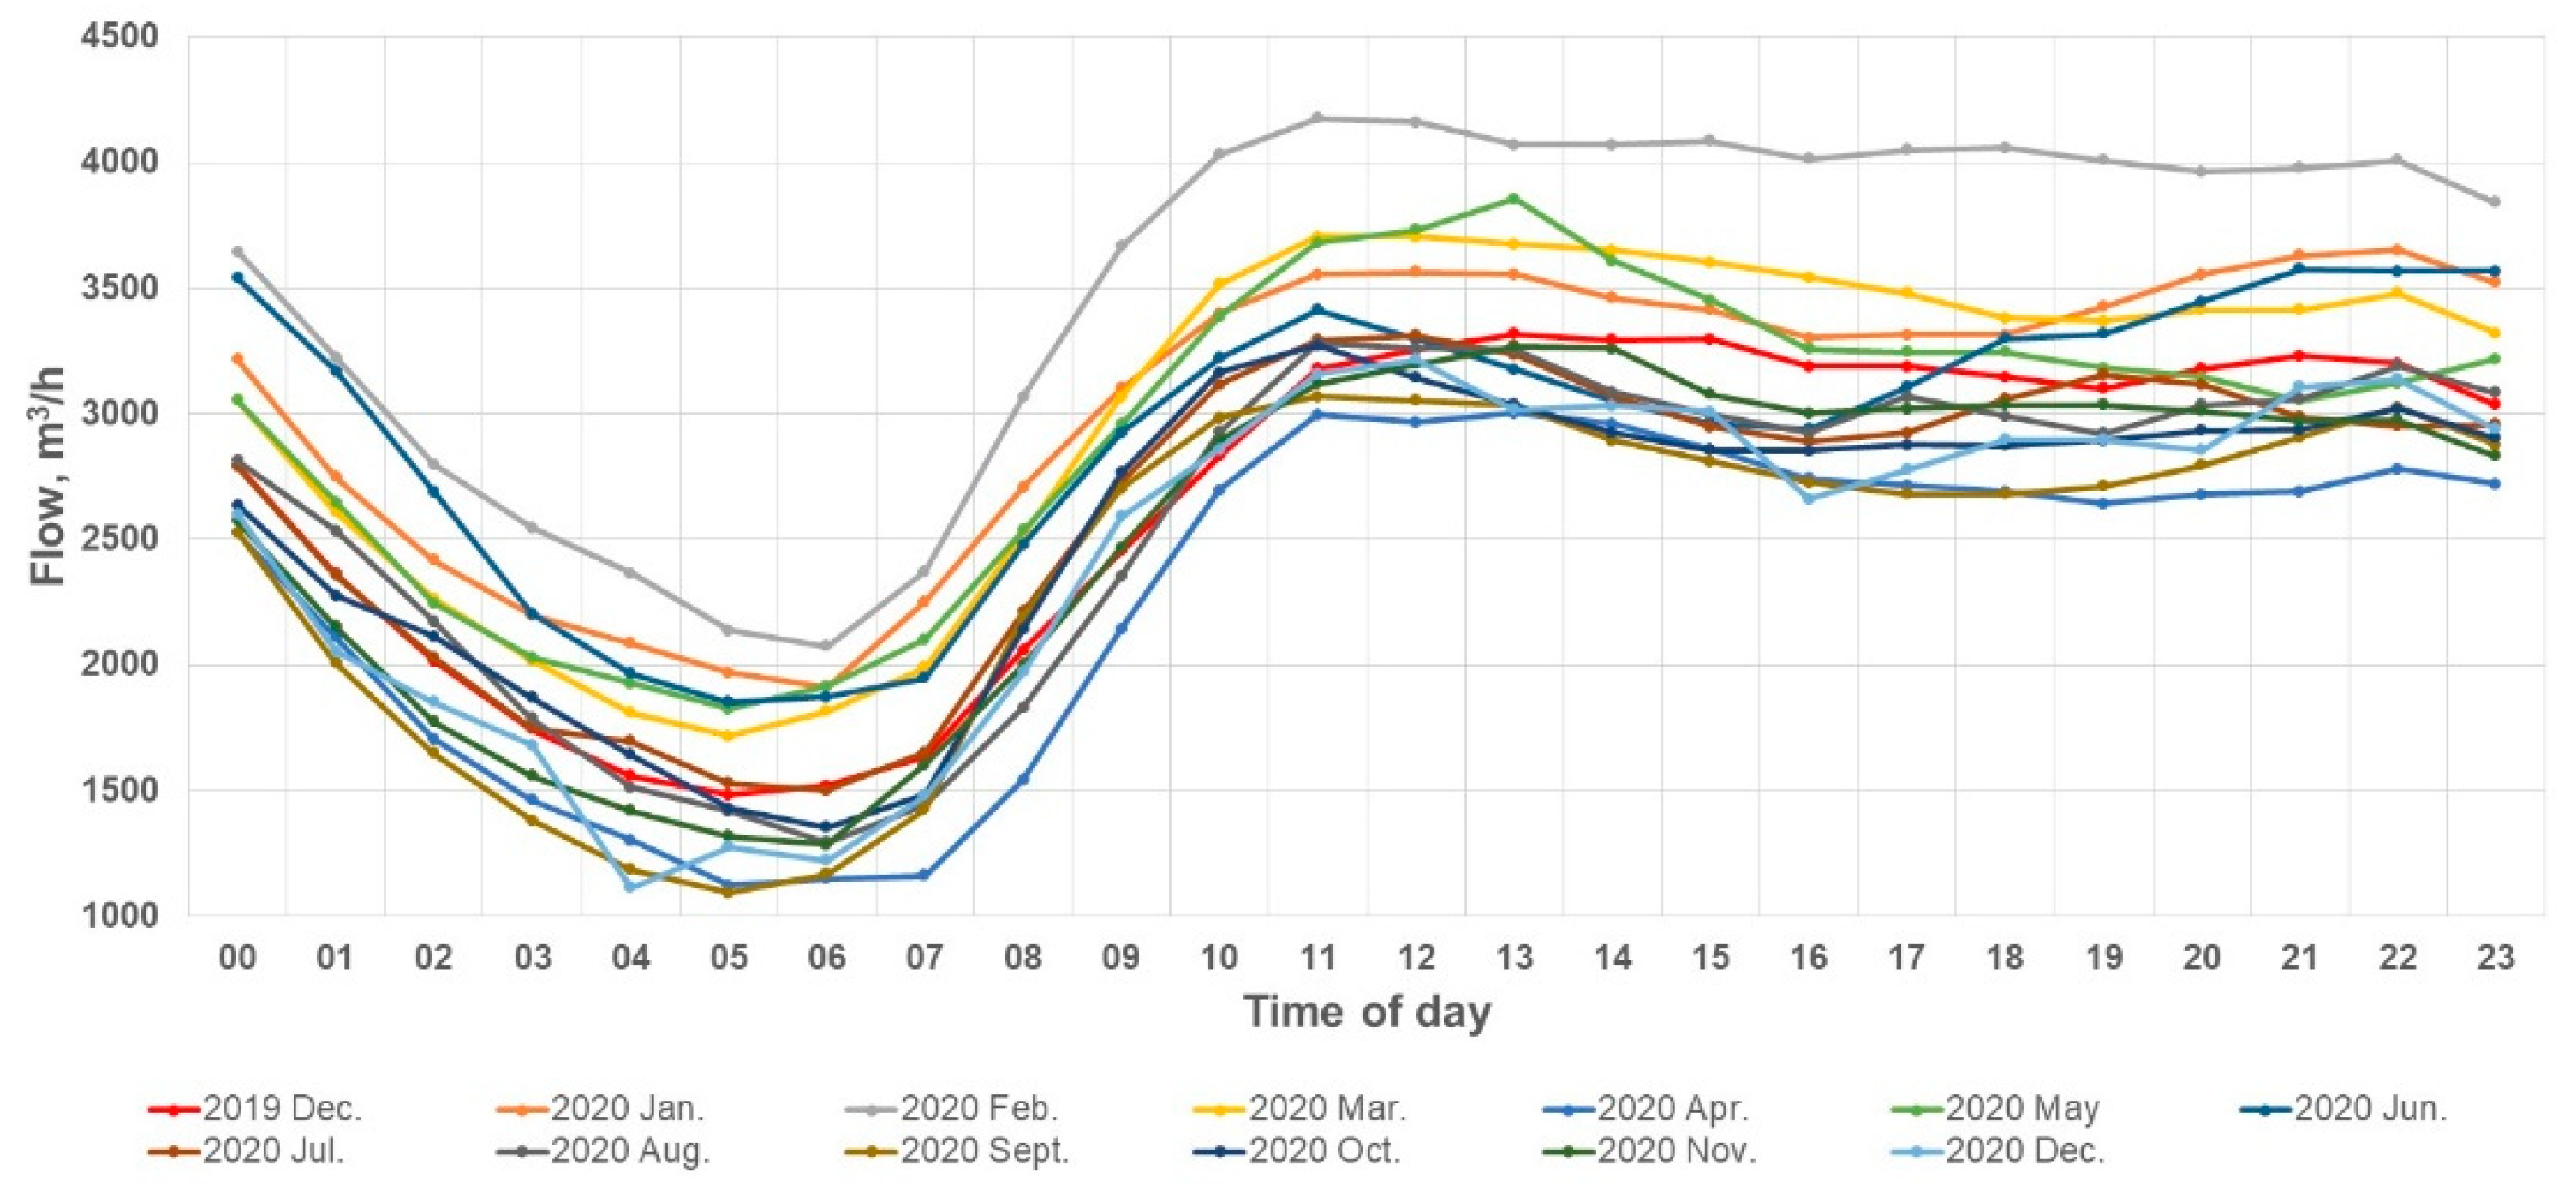
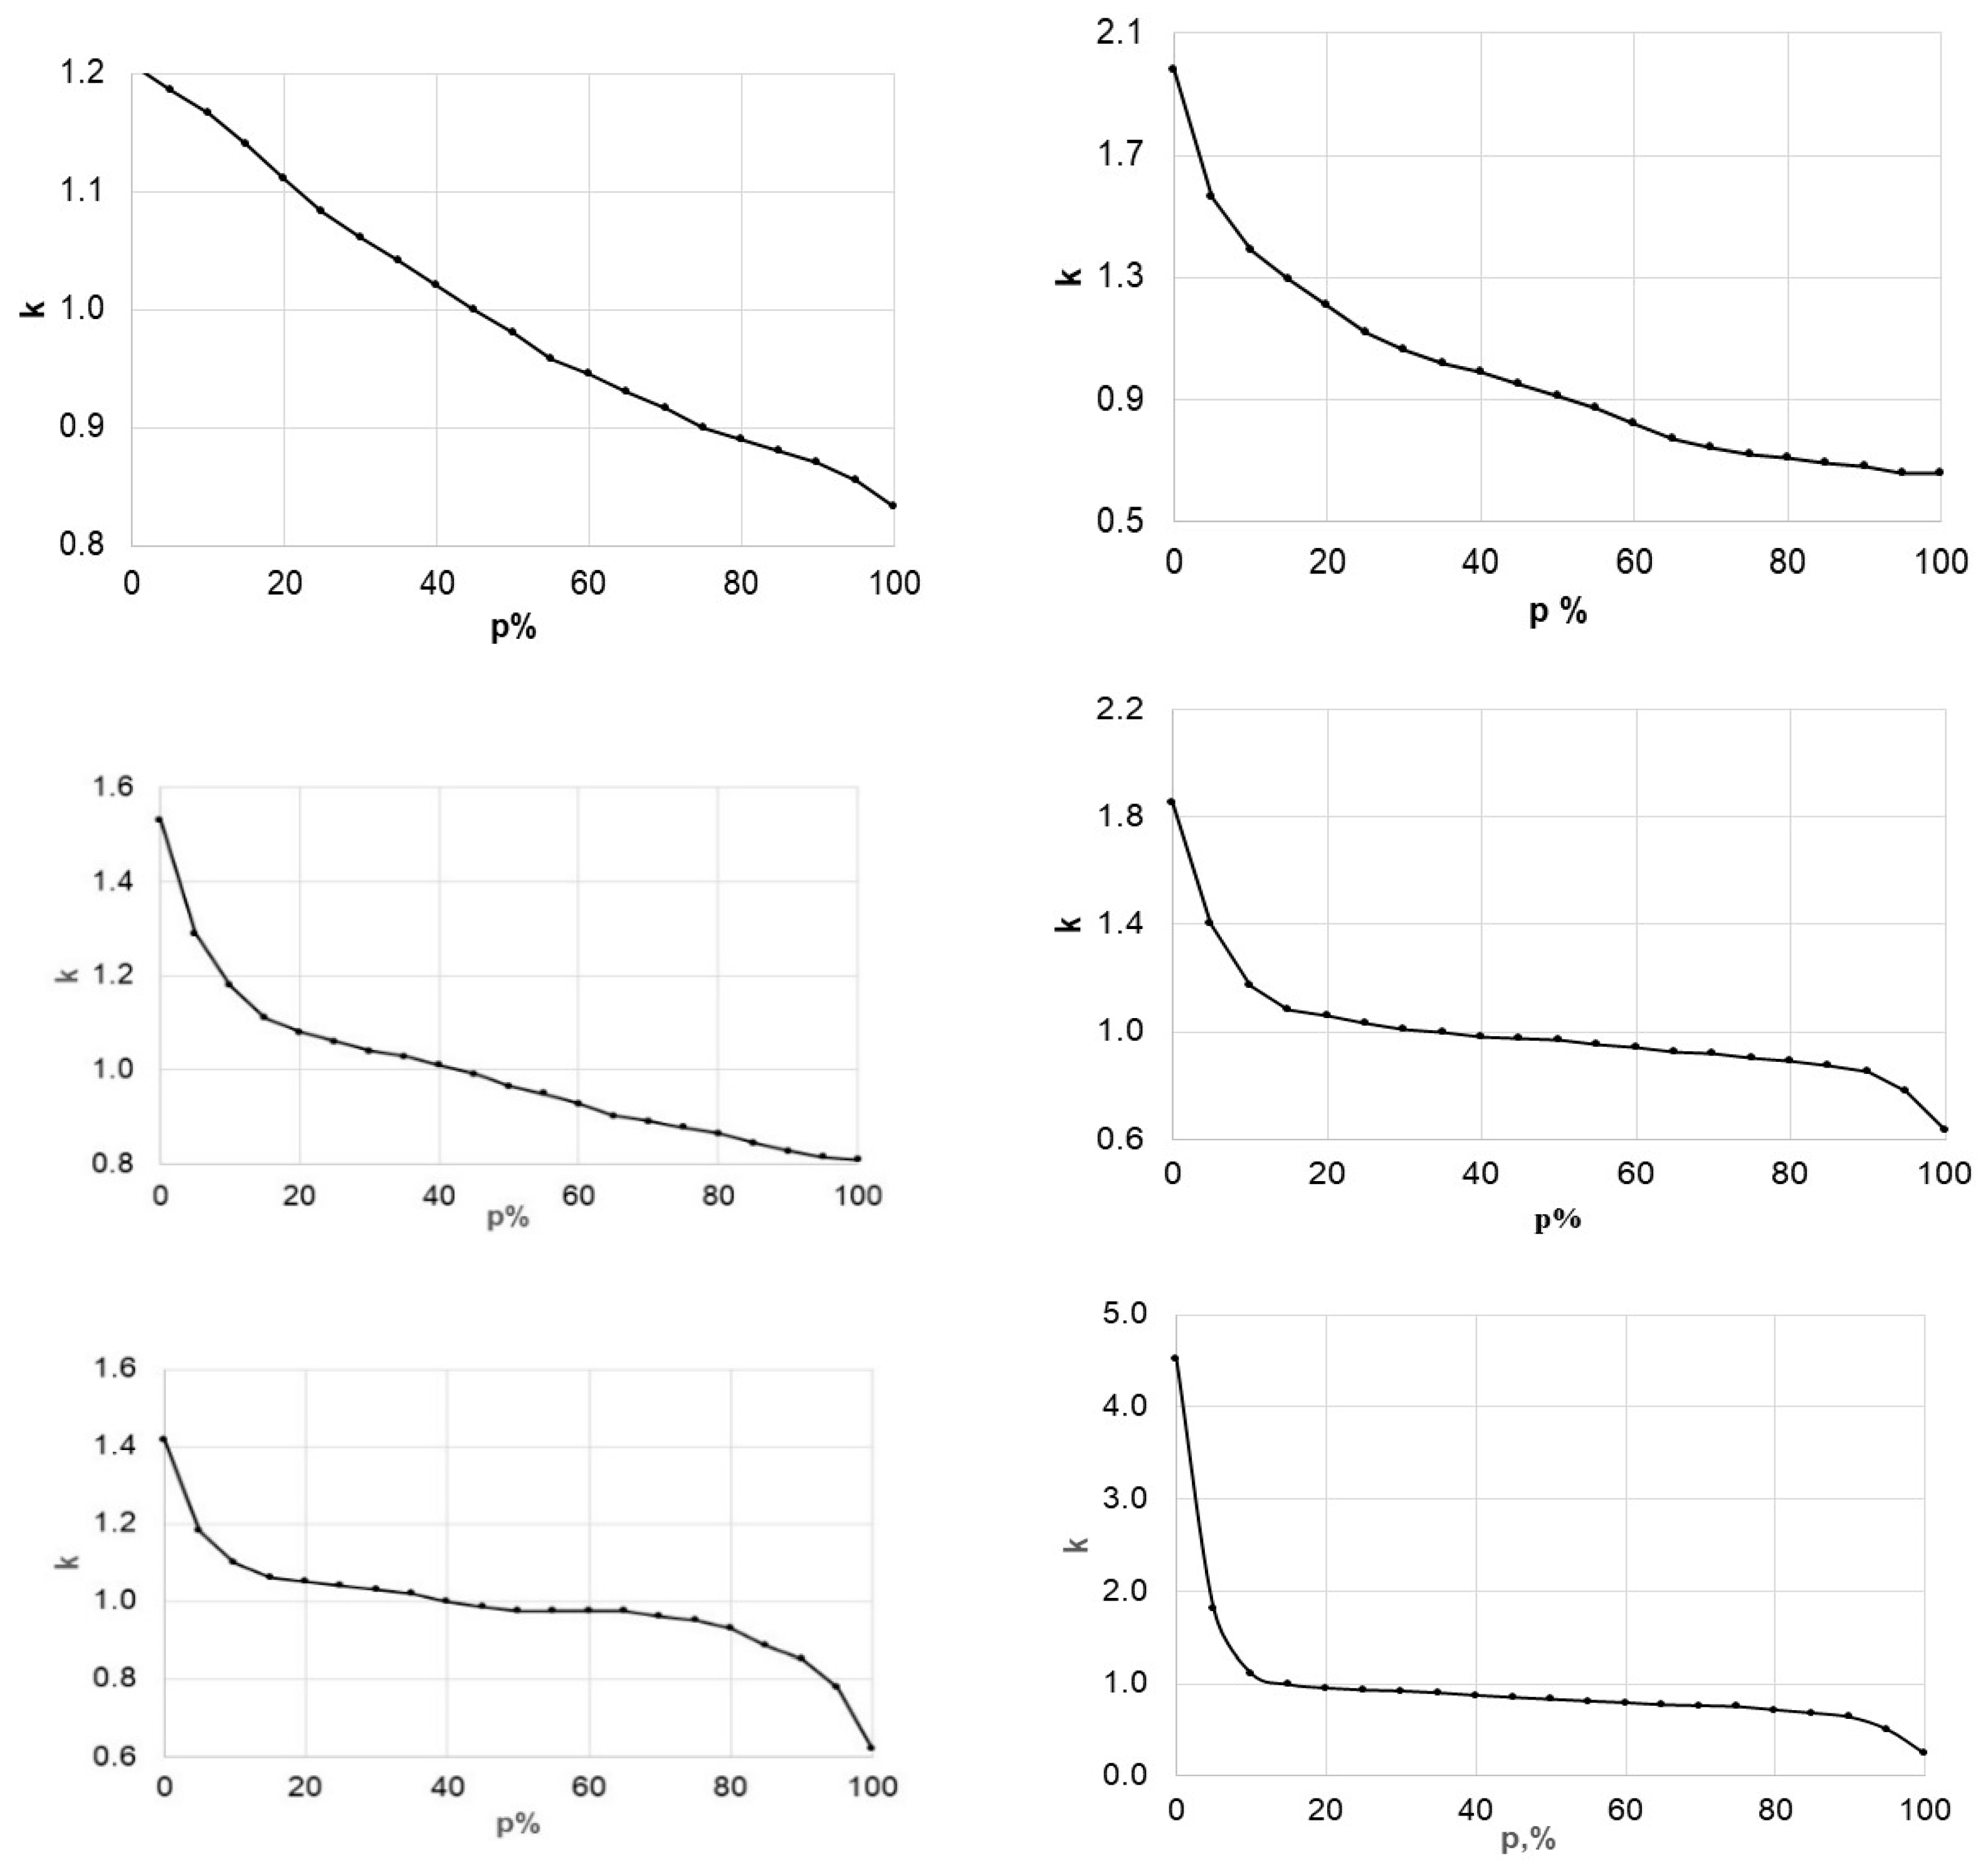
3.2. Wastewater Resources

As mentioned earlier, one of the main tasks is the assessment of wastewater resources streaming from the municipal network. In most cases, the wastewater volumes in the network are calculated from the data of the pumping stations or their electricity consumed. However, as the analysis of collected flow records and on-site measurements revealed, the reliability of such an evaluation is not high. When on-site wastewater flow data are unavailable, estimates can be derived from water use records or other relevant information. One of the key elements for energy estimation is the average annual wastewater flow rate, followed by the distribution of daily flow rates over time. The latter is usually expressed as the FDC, as discussed below.
The analysis of the mean annual wastewater flow at the outlets of the 56 collected WWTPs operating in the country showed that it correlates quite well with the population equivalent (PE) and wastewater collection (service) network area (A, km2) (Figure 5). Two separate cases were tested: (1) all 58 WWTPs and (2) WWTPs operating in smaller municipalities, excluding large cities (PE below 100,000).
A summary of the regression analysis (ANOVA) is given in Table 5; the significance level was set to p < 0.05. The previous figures and Table 5 show that satisfactory correlation results were obtained. Approximate values of mean annual flow for ungauged sites could be determined. However, the flow of each site was too site-specific for variables such as the population equivalent and collection network service area to accurately explain the variation in the wastewater flow rate.
Some studies examined the variation in wastewater flow due to heavy rain events in WWTPs to optimize turbine selection [15]. However, few such studies were conducted on the sewage network to install turbines. The wastewater flow hydrograph accounting for stormwater events at the intake of a possible location for installing a turbine is shown in Figure 6. A standard engineering and operation practice is that sewage flows must be separated from stormwater flows in the urban area. However, during flash floods, some rainwater unavoidably infiltrates the sewage system.
As can be seen, the relatively even wastewater flow was severely disrupted during short rains. As a result, short but very high spikes can be seen in the hydrograph. They exceeded 5–6 times the normal range of wastewater fluctuations. No turbine could accept these instantaneous sewage peaks without compromising performance. At first, installing a buffer tank for storing rainwater in the network would be hardly rational considering civil engineering costs. Of course, rainwater volumes would be higher in systems with a more significant wastewater system service area. However, the nature of the spikes would be similar but more delayed and smoothed (due to the longer surface water concentration time). A more detailed analysis of rainwater runoff frequencies could support this hypothesis.
Typically treated water fluctuations over 24 h at the outfall of the WWTP are shown for each month in Figure 7.
Flow in wastewater treatment plants varies with daily water demand patterns, varies by season and year, and is subject to heavy rain events. However, these hydrographs do not exhibit spikes in comparison to Figure 6; the rainwater concentration–time curve is flattened due to the enormous wastewater service area.
Normalized (dimensionless) FDCs for potential sites were constructed (Figure 8). Each 5% interval on the curve is equivalent to five percent of 8760 h (number of hours per year). Despite being in a dimensionless form (normalized to the mean annual flow), they varied widely. The parameter Φ was used to compare them, as shown in Table 3.
The proposed methodology allowed establishing a flow duration curve for an ungauged site using only three values: the highest flow, the mean flow, and the lowest flow, taking into account the parameter Φ.
A wastewater treatment outfall with a sufficient drop in elevation is generally suitable for an MHP installation due to the high and constant volume of flow. However, when installing turbine units, care must be taken to consider water-level fluctuations of the receiving water body in the outfall of WWTPs. This is especially relevant for low-head power plants, which were not sufficiently quantified in previous studies. The drop in head over time is significant, resulting in decreased power generation during a period with abundant water in a stream (Figure 9). The design head should be derived from the head duration curve at 30% of the exceedance level [58,59].

3.3. Hydromechanical Equipment

As mentioned above, the selection field for classical turbines is relatively narrow in a flat terrain where elevations are relatively low. This can be explained by the low flow rates and small size of turbine units, which increases the unit price of turbines (EUR/kW) compared to the larger capacity of hydro turbines. Only reaction-type turbines can be used at low-head schemes, e.g., propeller, Kaplan, seldom crossflow, and Francis.
It is also worth mentioning here the Archimedes screw, a gravity turbine that became popular several decades ago for low- or even ultralow-head schemes [46,60,61]. Despite the significant advantages of Archimedes screw turbines (low head, tolerance to water quality, and tolerance to debris or clogging), their applicability in urban areas is restricted. In municipal sewage networks, this kind of turbine is not likely to be accepted by the city’s residents due to bulky and heavy construction that causes visual pollution and incurs operational noise. These turbines can thus only be installed within the WWTP, within its sewage treatment outlets, or at a remote location away from residential areas.
The development of compact and modular turbines is a recent trend in turbine technology, e.g., a generator unit using a propeller turbine in an axial flow design [62,63,64,65,66]. A submersible turbine and a generator are combined in one unit; therefore, the need for the use of a powerhouse is eliminated and installation costs are reduced.
The commercially available modular units suitable for in-conduit hydropower are listed in Table 6. Unlike Kaplan turbines, their runner vanes are not adjustable. HYDROMATRIX units operate under significant flow rates and cannot be used for wastewater networks located in medium-size urban areas (population between 200 and 500 thousand) because of the insufficient generation of effluent volumes (maximum flow of some 1.5 m3/s). The same can be said for the StreamDiver turbine.
Turbine costs comprise approximately half of the conventional hydropower project development costs [18]. Lower-end unit costs start from 1100–2800 EUR/kW [64]. Financial analysis has consistently shown that SHP projects in general and in-conduit projects in particular suffer from the rapid increase in development cost at lower head and capacity, resulting in a feasibility issue for low-head facilities. Significant opportunities to lower development costs through specific research and development are proposed [32]. To offset this drawback of conventional turbines, low-cost generators, e.g., pumps as turbines (PaTs), have been suggested.
The use of PaTs for energy recovery has been demonstrated to be cost-effective, as low as 12% of the cost of conventional small turbines [14,67,68]. As expected, a smaller-capacity PaT attracts a higher unit cost. For instance, at 3 kW, the unit cost varied from 500 to 1000 EUR/kW, whereas at 20 kW it was in the range of 200–500 EUR/kW.
Centrifugal pumps and reverse-mode PaTs are radial or mixed-flow types, similar to conventional Francis turbines. In contrast to an axial propeller (or Kaplan) turbine, both units are much more sensitive to clogging issues when operating in effluents charged with suspended particles. Moreover, another limitation of PaT and Francis turbines is their inability to operate effectively outside design flow.
The so-called bypass configuration is a classical layout for installing a turbine in a sewage pipeline system (Figure 10). The unit is usually operating in parallel with the existing pipeline.

3.4. Tools for the Assessment of Technical and Economic Feasibility of Installing In-Conduit Hydropower Systems

The main technical features of the following tools are presented in Table 7: (1) RETScreen Expert; (2) In-Conduit Hydropower Project Screening Tool for water supply and wastewater treatment facilities (ICHPST); and (3) California’s In-Conduit Hydropower Implementation Guidebook Business Case Assessment Tool (BCAT).
There were no significant differences between ICHPST and BCAT. However, their imperial units may not be convenient for those who use the metric system, despite their evident applicability to the municipal water.
ICHPST (Alden) was developed to complete a preliminary evaluation of a potential hydropower facility. It provides estimates of power, energy, cost, and financial viability based on user inputs. It can be applied to water going into a water supply system or being discharged from a wastewater treatment facility.
BCAT enables users to complete a preliminary evaluation of hydropower potential at urban water facilities. Considering the specific system and location (pressure, head, and flow), a user can estimate power generation potential and obtain estimates of power, energy, cost, and financial viability. BCAT considers pressure requirements downstream of the hydropower scheme. This is not the case with RETScreen (pressure is discharged to the atmosphere).
RETScreen software, a conventional hydropower project tool, requires a great deal of engineering preparation before it can be used to assess hydropower schemes in municipal water distribution systems. Its technical level is much higher than the above-reviewed screening tools; it can be easily adapted to complete feasibility studies and preliminary design of in-conduit hydro schemes.

3.5. Wastewater Quality and Possible Effects on Turbine Operation

Screening of solid-laden media is the first operation at wastewater treatment plants and wastewater collection systems. Screening removes objects such as rags, paper, plastics, and metals to prevent damage and clogging downstream equipment and piping [69]. It is evident that turbines should be designed explicitly for raw wastewater and operate without clogging or fouling caused by material in the fluid under any operating conditions within the range of service specified. For hydropower schemes using untreated wastewater, a trash rack chamber must be installed at the intake [2]. The trash rack chamber’s operational cost was identified to range from 0.03 to 0.08 USD/kWh.
Clogging or “ragging” taking place when pumping raw wastewater, as analyzed in a number of studies [30,31]. The causes of hydro turbine clogging are the same as those for pumps, i.e., the suspended solids transported by the sewage.
Wastewater flow quality issues are often mentioned for siting turbines, but no quantitative estimates are provided. Specially designed turbines can adequately handle wastewater sand particles or their chemical components. The actual cause of clogging is not solid, but fibrous material contained in the sewage. When long, stringy solids or fibers are present in the flow, problems can occur, particularly for axial (propellor) and radial flow machines, when these materials are caught on the rotating parts [70,71].
No studies have been performed in Lithuania on the impact of wastewater quality on the operation of hydraulic machines and their clogging. Water utilities have observed an ongoing reduction in water usage. However, the volume of waste in the sewage does not seem to be decreasing. As a result, the proportion of solids in the flow is gradually increasing, which is an issue for many water utilities. Standardized qualitative wastewater monitoring is carried out at WWTPs but not inside the sewage network. However, the main focus is on the chemical parameters of the effluent entering and exiting the WWTP. The total suspended sediments (TSS) are only occasionally recorded. Available data from water companies show that the average concentrations of TSS in the raw effluent can reach 500 mg/L. After treatment, they decrease at least 25-fold, down to 20 mg/L [72].
Large solids, rags, and other fibrous materials from wastewater can be a severe issue for operating turbines if not monitored. Spot measurements conducted upstream of Kaunas WWTP showed that manual cleaning of the K2 grating (rack gap = 5 cm, mean flow = 0.18 m3/s) is performed twice a week, and approximately 2–5 kg of fibrous dry matter is collected. Approximately 500 kg of dry material can be accumulated per year. This harsh environment can be considered when installing turbines in such locations.

3.6. Multicriteria Analysis for Selecting Potential Sites

In total, 17 criteria were used for the multicriteria analysis (Table 3). Twelve criteria were to be maximized, while five were to be minimized. Their grouping was as follows: (1) technical-related (TEC; layout, turbine type, design flow, gross head, etc.), (2) economic-related (ECO; investment costs, electricity generated, simple payback, etc.), and (3) environmental-related (ENV; GHG reduction and use of electricity). These groups are only a suggestion, as the user can subjectively assign a criterion to the group of their choice, e.g., economic criteria, such as “electricity generated”, can also be considered as belonging to the group of technical-related factors. Moreover, the weighing system is a subjective element of the information [52].
A global summary of the results of this ranking based on the software HYPSE [51] is provided in Table 8. The indices expressed by the numerical values are briefly explained in the methodology.
Two scenarios, as presented in Table 8, were considered:
A. “Basic scenario”: The criterion weights were equal (5.88%); however, the weights of the groups were different (ECO—29.42%, TEC—58.81%, ENV—11.77%).
B. “High economic (ECO) scenario”: a priority by a factor of 1.7 was assigned to the ECO-related group (49.39%). As a result, the individual criteria weights within each group were 9.88% and 4.22% for the ECO and TEC/ENV groups, respectively
In the case of similar criteria weights (basic scenario), the sites in Vilnius (V1, V3, and V2) were the top ranked (highest values of the index GSi). When a greater weight was assigned to economy-related criteria (high economic scenario x), the top ranked site appeared in Kaunas (K1).
The concordance dominance index ci considers the positive aspects of the alternatives. For all x scenarios, site V3 was at the top (c6 = 1.060 and 1.722). The negative aspects of the alternatives are represented in four discordance dominance indices (di.SD, di.WD, di.AD, and di.AWD), which determine the relative discrepancy in the effects of the two alternatives. A low value of these indices (i.e., a negative value) implies a stronger dominance of alternative i. As a result, these indices slightly changed the site ranking, but the overall judgment remained similar.

4. Conclusions

  • While the potential of energy recovery from wastewater systems using micro-hydro plants (MHPs) is an appropriate solution to improve the energy efficiency of the municipal water sector, it has seen no exploitation due to a number of technical and nontechnical issues in low-lying countries. Nontechnical problems include a lack of awareness about the scale of the existing resources available in water networks.
  • The potential in lowland areas in terms of power capacity resulting from mostly low-head sites cannot be compared to that of elevated topography. In addition, for flat terrain, the selection field for turbines is relatively narrow; moreover, the low flow rates and small size of turbine units increase the unit price of turbines.
  • A methodology was developed to quantify the potential and identify conduit hydropower sites in a lowland country’s wastewater systems, including resource assessment, suitable tools to make a preliminary assessment of potential sites, and choice of turbines and their operating parameters in a harsh environment. The lack of in-depth studies on wastewater quality’s impact on hydro turbines, particularly the risk of clogging them in sewage networks upstream of WWTPs, can be a severe problem.
  • A conventional multicriteria analysis can help select the most appropriate site for constructing MHPs in urban water areas to achieve energy recovery. There are plenty of multicriteria tools available on the market for solving any real-world issue. However, at least preliminary site assessments and design procedures must be accessible beforehand for this analysis.

Author Contributions

Conceptualization, P.P. and L.J.; methodology, P.P.; validation, P.P. and L.J.; formal analysis, L.J.; investigation, P.P.; data curation, L.J.; writing—original draft preparation, P.P.; writing—review and editing, P.P.; visualization, L.J.; supervision, P.P. All authors have read and agreed to the published version of the manuscript.

Funding

This research was partially funded by the EU project LIFE NEXUS (LIFE17 ENV/ES/000252). The APC was funded by this project.

Institutional Review Board Statement

Not applicable.

Informed Consent Statement

Not applicable.

Data Availability Statement

Not applicable.

Acknowledgments

This paper is based on the findings of the EU partially-funded project LIFE NEXUS, “Boosting the sustainability of the urban water cycle: energy harvest in water industry using micro-hydropower technology” (LIFE17 ENV/ES/000252). The authors are grateful to Algirdas Radzevičius of Vytautas Magnus University and the water companies of Kaunas, Vilnius, and Alytus for their contributions to this project.

Conflicts of Interest

The authors declare no conflict of interest.

Abbreviation

WWTPWaste water treatment plant
MHP/SHP/HPMicro, small hydropower plant or hydropower
WSWWater supply and wastewater distribution network/system
CHIn-conduit or hidden hydro
FDCFlow duration curve
PPower, kW
QFlow, m3/s
HHead, m
ACatchment area, km2
PaTPump as turbine
MCAMulticriteria analysis

References

  1. Beltran, H.; Vidal, R.; Basiero, L.; Santos, J.M.; Basiero, J.A.; Belenguer, E. Micro hydro installation analysis in a wastewater treatment plant. Renew. Energy Power Qual. J. 2014, 12, 15–20. [Google Scholar] [CrossRef]
  2. Bousquet, C.; Samora, I.; Manso, P.; Rossi, L.; Heller, P.; Schleiss, A.J. Assessment of hydropower potential in wastewater systems and application to Switzerland. Renew. Energy 2017, 113, 64–73. [Google Scholar] [CrossRef]
  3. Llácer-Iglesias, R.; Pérez, J.; Satorre-Aznar, J.; López-Jiménez, P.; Pérez-Sánchez, M. Energy recovery in wastewater treatment systems through hydraulic micro-machinery. Case study. J. Appl. Res. Technol. Eng. 2020, 1, 15. [Google Scholar] [CrossRef]
  4. Diaz-Elsayed, N.; Rezaei, N.; Ndiaye, A.; Zhang, Q. Trends in the environmental and economic sustainability of wastewater-based resource recovery: A review. J. Clean. Prod. 2020, 265, 121598. [Google Scholar] [CrossRef]
  5. Funding & Tender Opportunities. Available online: https://ec.europa.eu/info/funding-tenders/opportunities/portal/screen/opportunities/topic-details/horizon-cl5-2021-d3-03-11 (accessed on 1 June 2022).
  6. Choulot, A.; Denis, V.; Punys, P. Integration of Small Hydro Turbines into Existing Water Infrastructures. In Hydropower—Practice and Application; InTech: Rijeka, Croatia, 2012. [Google Scholar]
  7. Energy Recovery in Water Services. Available online: http://hydro-bpt.bangor.ac.uk/ (accessed on 1 June 2022).
  8. WP4 Report on Micro Hydropower Resource Assessment in the Atlantic Area. Interreg. Available online: https://www.redawn.eu/sites/default/files/MHP%20Resource%20Assessment%20in%20AA_WP4_TCD_0.pdf (accessed on 1 June 2022).
  9. European Inventory of Micro-Hydroenergy Recovery Potential in Water Industry. Available online: https://www.lifenexus.eu/en/results/eu-inventory/ (accessed on 1 June 2022).
  10. Lopez-Fernandez, R.M.; Gonzalez, V.I.S.; Punys, P.; Radzevičius, A.; Steller, J.; Jagielska, A. Web-based Atlas of Micro-hydro Inventory in Urban Water Networks. In Proceedings of the Hydroforum 2019: 9th Polish Hydropower Conference, Gdansk, Poland, 9–10 October 2019. [Google Scholar]
  11. Sari, M.A.; Badruzzaman, M.; Cherchi, C.; Swindle, M.; Ajami, N.; Jacangelo, J.G. Recent innovations and trends in in-conduit hydropower technologies and their applications in water distribution systems. J. Environ. Manag. 2018, 228, 416–428. [Google Scholar] [CrossRef] [PubMed]
  12. California Energy Commission. California’s In-Conduit Hydropower Implementation Guidebook: A Compendium of Resources, Best Practices, and Tools: Final Project Report; Stantec Consulting Services Inc.: Edmonton, AB, Canada, 2020.
  13. Gallagher, J.; Harris, I.M.; Packwood, A.J.; McNabola, A.; Williams, A.P. A strategic assessment of micro-hydropower in the UK and Irish water industry: Identifying technical and economic constraints. Renew. Energy 2015, 81, 808–815. [Google Scholar] [CrossRef]
  14. Power, C.; McNabola, A.; Coughlan, P. Development of an evaluation method for hydropower energy recovery in wastewater treatment plants: Case studies in Ireland and the UK. Sustain. Energy Technol. Assess. 2014, 7, 166–177. [Google Scholar] [CrossRef]
  15. Power, C.; Coughlan, P.; McNabola, A. Microhydropower Energy Recovery at Wastewater-Treatment Plants: Turbine Selection and Optimization. J. Energy Eng. 2017, 143, 4016036. [Google Scholar] [CrossRef]
  16. Munaaim, M.A.C.; Razali, N.; Ayob, A.; Hamidin, N.; Mydin, M.A.O. Potential of Micro Hydroelectric Generator Embedded at 30,000 PE Effluent Discharge of Sewerage Treatment Plant. E3S Web Conf. 2018, 34, 2037. [Google Scholar] [CrossRef]
  17. García, A.M.; Díaz, J.A.R.; Morillo, J.G.; McNabola, A. Energy Recovery Potential in Industrial and Municipal Wastewater Networks Using Micro-Hydropower in Spain. Water 2021, 13, 691. [Google Scholar] [CrossRef]
  18. ESHA. Guide on How to Develop a Small Hydropower Plant, 2nd ed.; ESHA: Brussels, Belgium, 2004. [Google Scholar]
  19. Leyland, B. Small Hydroelectric Engineering Practice; CRC Press, Taylor & Francis Group: Boca Raton, FL, USA, 2014. [Google Scholar]
  20. Casini, M. Harvesting energy from in-pipe hydro systems at urban and building scale. Int. J. Smart Grid Clean Energy 2015, 4, 316–327. [Google Scholar] [CrossRef] [Green Version]
  21. Ball, I.; Hendricks, D.; Jawaid, T.S.; Rutz, D.; Steller, J. (Eds.) Small Hydropower Technologies—European State-of-the-Art Innovations. Hyposo; WIP Renewable Energies: Munich, Germany, 2020. [Google Scholar]
  22. Can New York Supply Water While Generating Clean Energy? Inspiration and Recommendation for Renewable Energy Recovery through Conduit Hydropower. Available online: https://www.hydro.org/wp-content/uploads/2021/09/Grimm-Full-Report-NY-Conduits-1.pdf (accessed on 1 June 2022).
  23. Ak, M.; Kentel, E.; Kucukali, S. A fuzzy logic tool to evaluate low-head hydropower technologies at the outlet of wastewater treatment plants. Renew. Sustain. Energy Rev. 2017, 68, 727–737. [Google Scholar] [CrossRef]
  24. Williams, A.A. Pumps as turbines for low cost micro hydro power. Renew. Energy 1996, 9, 1227–1234. [Google Scholar] [CrossRef]
  25. Steller, J.; Adamkowski, A.; Stankiewicz, Z.; Lojek, A.; Rduch, J.; Zarzycki, M. Pumps as Turbines for Hydraulic Energy Recovery and Small Hydropower Purposes in Poland. In Proceedings of the Hidroenergia 2008, Bled, Slovenia, 12–13 June 2008; p. 10. [Google Scholar]
  26. de Marchis, M.; Milici, B.; Volpe, R.; Messineo, A. Energy Saving in Water Distribution Network through Pump as Turbine Generators: Economic and Environmental Analysis. Energies 2016, 9, 877. [Google Scholar] [CrossRef] [Green Version]
  27. Carravetta, A.; Houreh, S.D.; Ramos, H.M. Pumps as Turbines: Fundamentals and Applications; Springer International Publishing: Cham, Switzerland, 2018. [Google Scholar]
  28. KSB PaT. Pump as Turbine. In Proceedings of the Water Efficiency Conference, Aveiro, Portugal, 5–7 September 2018. [Google Scholar]
  29. Pumps. Energy Efficient in Forward and Reverse Mode Pumps as Turbines. 2020. Available online: https://www.andritz.com/resource/blob/238812/7e4b07ae7a0061f002e482fc7b12955b/pumps-as-turbines-en-data.pdf (accessed on 1 June 2022).
  30. Isono, M.; Nohmi, M.; Uchida, H.; Kawai, M.; Kudo, H.; Kawahara, T.; Miyagawa, K.; Saito, S. An experimental study on pump clogging. IOP Conf. Ser. Earth Environ. Sci. 2014, 22, 012009. [Google Scholar] [CrossRef]
  31. Thamsen, P.U. Cutting clogging in wastewater. World Pumps 2009, 2009, 22–25. [Google Scholar] [CrossRef]
  32. U.S. Department of Energy. Pumped Storage and Potential Hydropower from Conduits. Report to Congress; U.S. Department of Energy: Washington, DC, USA, 2015.
  33. ALDEN. In-Conduit Hydropower Project Screening Tool for Water Supply and Wastewater Treatment Facilities. User Manual and Instructions; ALDEN Research Laboratory, Inc.: Holden, MA, USA, 2014. [Google Scholar]
  34. Voltz, T.J.; Grischek, T. Microturbines at Drinking Water Tanks Fed by Gravity Pipelines: A Method and Excel Tool for Maximizing Annual Energy Generation Based on Historical Tank Outflow Data. Water 2019, 11, 1403. [Google Scholar] [CrossRef] [Green Version]
  35. Punys, P.; Dumbrauskas, A.; Kvaraciejus, A.; Vyciene, G. Tools for Small Hydropower Plant Resource Planning and Development: A Review of Technology and Applications. Energies 2011, 4, 1258–1277. [Google Scholar] [CrossRef] [Green Version]
  36. Zhang, Q.F.; Uria-Martinez, R.; Saulsbury, B. Technical and Economic Feasibility Assessment of Small Hydropower Development in the Deschutes River Basin; National Technical Information Service: Fairfax, VA, USA, 2013.
  37. Natural Resources Canada. Small hydro project analysis chapter. In RETScreen® International. Clean Energy Project Analysis: RETScreen® Engineering & Cases Textbook; Natural Resources Canada: Ottawa, ON, Canada, 2004. [Google Scholar]
  38. RETScreen. Available online: https://www.nrcan.gc.ca/energy/software-tools/7465 (accessed on 1 June 2022).
  39. Catrinu-Renström, M.D.; Barton, D.N.; Bakken, T.H.; Marttunen, M.; Mochet, A.M.; May, R.; Hanssen, F. Multi-Criteria Analysis Applied to Environmental Impacts of Hydropower and Water Resources Regulation Projects; SINTEF Energy Research: Trondheim, Norway, 2013. [Google Scholar]
  40. Williamson, S.J.; Stark, B.H.; Booker, J.D. Low head pico hydro turbine selection using a multi-criteria analysis. Renew. Energy 2014, 61, 43–50. [Google Scholar] [CrossRef]
  41. Vassoney, E.; Mochet, A.M.; Comoglio, C. Use of multicriteria analysis (MCA) for sustainable hydropower planning and management. J. Environ. Manag. 2017, 196, 48–55. [Google Scholar] [CrossRef]
  42. Marttunen, M.; Lienert, J.; Belton, V. Structuring problems for Multi-criteria decision analysis in practice: A literature review of method combinations. Eur. J. Oper. Res. 2017, 263, 1–17. [Google Scholar] [CrossRef] [Green Version]
  43. Roy, B. The outranking approach and the foundations of ELECTRE methods. Theory Decis. 1991, 31, 49–73. [Google Scholar] [CrossRef]
  44. Figueira, J.R.; Greco, S.; Roy, B.; Słowiński, R. An Overview of ELECTRE Methods and their Recent Extensions. J. Multi-Criteria Decis. Anal. 2013, 20, 61–85. [Google Scholar] [CrossRef]
  45. Software Related to MCDM. Available online: https://www.mcdmsociety.org/content/software-related-mcdm-0 (accessed on 1 June 2022).
  46. Zhou, D.; Deng, Z.D. Ultra-low-head hydroelectric technology: A review. Renew. Sustain. Energy Rev. 2017, 78, 23–30. [Google Scholar] [CrossRef]
  47. Kasiulis, E.; Punys, P.; Kvaraciejus, A.; Dumbrauskas, A.; Jurevičius, L. Small Hydropower in the Baltic States—Current Status and Potential for Future Development. Energies 2020, 13, 6731. [Google Scholar] [CrossRef]
  48. Radzevičius, A.; Punys, P. In-conduit hydropower possibilities in municipality water networks in a lowland country. In Proceedings of the Polish Hydropower Conference HYDROFORUM 2021, Gdansk, Poland, 13–15 October 2021; IMP PAN: Gdansk, Poland, 2021. [Google Scholar]
  49. Shaw, E.M.; Beven, K.J.; Chappell, N.A.; Lamb, R. Hydrology in Practice, 4th ed.; CRC Press, Taylor & Francis Group: New York, NY, USA, 2010. [Google Scholar]
  50. Poška, A.; Punys, P. Inžinerinė Hidrologija (Engineering Hydrology, in Lith.); LŽŪU leidybinis centras: Kaunas, Lithuania, 1996; p. 539. [Google Scholar]
  51. Mazzetto, F.; Papetti, L.; Pelikan, B. Small Hydroelectric Plants. Guide to the Environmental Approach and Impact Assessment; Studio Frosio, European Commission (DGTREN, FP5, ENERGIE): Brescia, Italy, 2000; p. 110. [Google Scholar]
  52. Figueira, J.; Greco, S.; Ehrogott, M. Multiple Criteria Decision Analysis. State of the Art Surveys; Greco, S., Ehrgott, M., Figueira, J.R., Eds.; Springer: New York, NY, USA, 2016. [Google Scholar]
  53. Bekker, A.; van Dijk, M.; Niebuhr, C.M.; Bhagwan, J.N. Development of a tool to identify hydropower potential at pressure reducing stations in South African water distribution systems. In Proceedings of the HYDRO 2020, Online, 26–28 October 2020. [Google Scholar]
  54. United States Geological Survey. EarthExplorer. Available online: https://earthexplorer.usgs.gov/ (accessed on 1 June 2022).
  55. Uuemaa, E.; Ahi, S.; Montibeller, B.; Muru, M.; Kmoch, A. Vertical Accuracy of Freely Available Global Digital Elevation Models (ASTER, AW3D30, MERIT, TanDEM-X, SRTM, and NASADEM). Remote Sens. 2020, 12, 3482. [Google Scholar] [CrossRef]
  56. Mitrovic, D.; Díaz, J.A.R.; Morillo, J.G.; Coughlan, P.; Gallagher, J.; McNabola, A. Hydropower energy recovery in water pipe networks: Spatial regression analysis using GIS, assessing the correlation between energy recovery potential and geographical data. In Proceedings of the Water Efficiency Conference, Aveiro, Portugal, 5–7 September 2018; pp. 127–136. [Google Scholar]
  57. Tian, Y.; Zhang, F.; Yuan, Z.; Che, Z.; Zafetti, N. Assessment power generation potential of small hydropower plants using GIS software. Energy Rep. 2020, 6, 1393–1404. [Google Scholar] [CrossRef]
  58. Bureau of Reclamation. Hydropower Resource Assessment at Existing Reclamation Facilities; Bureau of Reclamation: Washington, DC, USA, 2011.
  59. Hydroelectric Design Center. Hydropower Resource Assessment at Non-Powered Usace Sites; Hydroelectric Design Center: Nashville, TN, USA, 2013. [Google Scholar]
  60. Lashofer, A.; Hawle, W.; Pelikan, B. Innovative Approaches to Global Challenges. In State of Technology and Design Guidelines for the Archimedes Screw Turbine, Proceedings of the Conference HYDRO 2012, Bilbao, Spain, 29–31 October 2012; Aqua-Media International Ltd.: London, UK, 2012. [Google Scholar]
  61. YoosefDoost, A.; Lubitz, W.D. Archimedes Screw Turbines: A Sustainable Development Solution for Green and Renewable Energy Generation—A Review of Potential and Design Procedures. Sustainability 2020, 12, 7352. [Google Scholar] [CrossRef]
  62. The Amjet Turbine Systems. ATS-63 Low Head Hydro Turbine/Generator. White Paper. 2015. Available online: http://amjethydro.com/downloads/Whitepaper4-2-15.pdf (accessed on 1 June 2022).
  63. Gruber, R. The VOITH StreamDiver: Versatile, environmentally friendly, robust and affordable solutions for the low-head segment. Zek Hydro 2021, 25–29. Available online: https://issuu.com/zekmagazin/docs/zek_international_2021 (accessed on 1 June 2022).
  64. Low Head Hydroelectric Turbines. Available online: https://www.turbiwatt.com/en/choisir-sa-turbine-2.html (accessed on 1 June 2022).
  65. HYDROMATRIX: Innovative Hydropower Solutions. Fact Sheet. 2014. Available online: https://www.andritz.com/resource/blob/31692/f484084e0869b431e2362b1e82bef5b2/hy-hydromatrix-en-data.pdf (accessed on 1 June 2022).
  66. Flygt Submersible Turbines. Available online: https://www.xylem.com/en-us/products--services/hydro-turbines2/hydro-turbines/ (accessed on 1 June 2022).
  67. Tracey, L.; Paul, C.; Aonghus, M. Pump-As-Turbine: Characterization as an Energy Recovery Device for the Water Distribution Network. J. Hydraul. Eng. 2017, 143, 04017020. [Google Scholar] [CrossRef]
  68. Novara, D.; Carravetta, A.; McNabola, A.; Ramos, H.M. Cost Model for Pumps as Turbines in Run-of-River and In-Pipe Microhydropower Applications. J. Water Resour. Plan. Manag. 2019, 145, 04019012. [Google Scholar] [CrossRef]
  69. Qasim, S.R. Wastewater Treatment Plants: Planning, Design, and Operation, 2nd ed.; Routledge: Oxford, UK, 2017. [Google Scholar]
  70. Anyi, M.; Kirke, B. Evaluation of small axial flow hydrokinetic turbines for remote communities. Energy Sustain. Dev. 2010, 14, 110–116. [Google Scholar] [CrossRef]
  71. Nishi, Y.; Kobori, T.; Kobayashi, Y.; Inagaki, T.; Kikuchi, N. Study on Foreign Body Passage in an Ultra-Small Axial Flow Hydraulic Turbine. Int. J. Fluid Mach. Syst. 2020, 13, 68–78. [Google Scholar] [CrossRef]
  72. Sewage Handling Data (Nuotekų Tvarkymo Apskaitos Duomenys). Available online: https://vanduo.old.gamta.lt/cms/index?rubricId=6c0feeaa-4d89-4a23-9339-19ab0de0adf1 (accessed on 1 June 2022).
Figure 1. Energy recovery potential in the municipal water infrastructure of Lithuania.
Energies 15 05173 g001
Figure 2. Key data of potential sites in urban water network (mostly wastewater) for installing hydro turbines.
Energies 15 05173 g002
Figure 3. Turbine positions upstream and downstream of the wastewater treatment plant [6].
Energies 15 05173 g003
Figure 4. Hypothetical hydrograph (1) and flow duration curve (FDC) (2). Q—flow, m3/s; k—normalized flow; t—time, days; p—percentage time, %; Q ¯ —mean flow, m3/s; Φ—parameter.
Energies 15 05173 g004
Figure 5. Relationship of mean annual wastewater flow with population equivalent (PE) and collection network service area (A, km2). Top—all 58 WWTPs; bottom—small WWTPs (large cities not included).
Energies 15 05173 g005
Figure 6. Wastewater hydrograph (22 September to 5 November 2020) perturbated by storm events at Akademija–Marvele (A = 1.5 km2, PE = 2400).
Energies 15 05173 g006
Figure 7. Treated water daily fluctuations for different months at the outfall of the Kaunas WWTP (December 2019–December 2020).
Energies 15 05173 g007
Figure 8. Normalized FDCs (from left to right): Kaunas 1, Kaunas 2, Kaunas WWTP, Vilnius WWTP, Vilnius PRV, and Alytus WWTP; k—normalized flow; p—percentage of time equaled or exceeded.
Energies 15 05173 g008
Figure 9. Head duration curve at the outlet of Kaunas WWTP (Kacergine); p—percentage of time equaled or exceeded. The receiving body is the Nemunas river.
Energies 15 05173 g009
Figure 10. Turbine installation layout of wastewater pipeline (main) upstream of WWTP (simplified bypass scheme): 1—trash rack, 2—turbine, 3—regulating valve.
Energies 15 05173 g010
Table 1. Major differences between turbines and PaTs.
TurbinePaT
AdvantagesWell-documented, accurate designCost-efficient
Best efficiency Widely available
Wide range of controlStandardized, simple design product, short delivery, and low maintenance and repair costs
DisadvantagesExpensive Not as well-documented as turbines, limited availability of turbine operation curves 1
Limited local suppliers Lower efficiency 1
Complex design may be requiredNo variable guide vanes for varying flow
1 Some large turbines or pump producers offer PaTs with high efficiencies (up to 87%), along with their operating ranges and guaranteed hydraulic characteristic data from prototype tests [28,29].
Table 2. Potential sites for installing hydropower turbines in urban water networks of Vilnius, Kaunas, and Alytus.
#NameID LabelPopulation Equivalent (PE)Service Area (km2)Location 1Head (m)Flow (m3/s)Outlet
1.Kaunas (Jonavos street)K1104,30025.3U/S35.00.3Sewage network
2.Kaunas (Raudondvario Street)K236,80016.4U/S27.40.18Sewage network
3.Kaunas (Pypliai)K3305,500137.0D/S4.01.2The Nemunas River
4.Vilnius (WWTP-1)V1569,500356.0D/S21.5Outlet collector
5.Vilnius (WWTP-2)V2569,500356.02.91.5The Neris River
6.Vilnius (Prusu Street)V335,00018.2-61.10.11Network
7.Alytus (WWTP-1)A149,90039.4D/S15.00.11Outlet collector
8.Alytus (WWTP-2)A249,90039.4100.11The Nemunas River
1 Site location relative to WWTP (upstream—U/S or downstream—D/S); see Figure 3.
Table 3. Data employed for multicriteria analysis for installation of hydropower turbines (the basic scenario, equal weights for all criteria).
#CriterionUnit of MeasureDirectionWeight (%)Group and WeightAlternatives (Projects)
K1K2K3V1V2V3A1A2
1.LayoutScore: [1, 2]Max5.88TEC58.8111222222
2.Turbine typeScore: [1, 3]Max5.88TEC22333222
3.Design flowm3/sMax5.88TEC0.360.141.001.801.800.170.170.17
4.Gross headmMax5.88TEC3527422.95315.510
5.SubstationScore: [0, 1]Max5.88TEC00011011
6.Transmission linekmMin5.88TEC0.050.050.10.050.050.0500.4
7.Power capacitykWMax5.88TEC9829282034732013
8.Capacity factor%Max5.88TEC4340766564733938
9.Tailwater effect%Min5.89TEC00250200025
10.FDC typeParameterMax5.89TEC0.470.420.560.60.60.570.620.62
11.Total initial costsk€Min5.88Econ29.42101.161.776.350.880.947.318.714.0
12.Electricity generatedMWhMax5.88Econ3671021851111893316943
13.Simple paybackyrMin5.89Econ4.315.55.57.35.81.64.46.7
14.O&M costsk€Min5.88Econ13.56.24.64.24.93.82.62.6
15.Electricity revenuek€Max5.89Econ36.710.218.511.118.933.16.94.3
16.GHG reductiontCO2/MWhMax5.88ENV11.779928503051891912
17.Use of electricityScore [1, 2]Max5.89ENV11122122
Total (%)100 100
Table 4. Description of the criteria used for MCA (with reference to Table 3).
Name Brief Description
TEC
  • Layout type: The facility can be installed downstream of or inside the WWTP, or upstream of the WWTP in the effluent network.
  • Turbine type: PaT, Archimedean screw, and conventional submerged (in-conduit) turbines.
  • Design flow: Typically taken as 30% of FDC.
  • Gross head: Drop in elevation at the site.
  • Substation: Cost depends mainly on the voltage and the installed capacity of the power plant.
  • Transmission line: Cost depends on the line’s type, length, voltage, and location, as well as the installed capacity of the power plant being developed.
  • Power capacity: Calculated hydro system power capacity or maximum power output of the site.
  • Capacity factor: Ratio of the average power produced by SHP over one year to its rated power capacity.
  • Tailwater effect: During high flows, a reduction in the gross head can be significant for low-head sites.
  • FDC type: The shape of the FDC indicates the distribution of daily mean flow over a sufficiently long period; initially steeply sloped curve results from an uneven flow; FDCs that have a very flat slope indicate slight variation in the flow pattern.
1. Priority should be assigned to the hydro turbine downstream of the WWTP (clean water); turbine placement upstream will require extra O&M costs (trash rack cleaning).
2. It is recommended to avoid Archimedean screw turbines because of their excessive superstructure and visual pollution, especially in urban areas.
3,4,7,8. Design flow, gross head power capacity, and capacity factor must be as high as possible.
5. Presence of any substation nearby hydro installation.
6. Distance to the electric distribution grid or the point of use of power must be as short as possible.
7,8. Must be maximized.
9. Range of water-level fluctuations in receiving water body should be minimal, i.e., to avoid any reduction in the available gross head during times of high flows in the outlet.
10. A flat-sloped FDC resulting in a high j value is desirable for any hydro scheme.
ECO
11.
Total initial costs: Total incremental investment that must be made to bring the proposed case facility online before it begins to generate savings and revenue.
12.
Electricity generated.
13.
Simple payback: The length of time that it takes for a proposed facility to regain its own initial cost.
14.
O&M: Operation and maintenance costs.
15.
Electricity revenue: Calculated by multiplying the electricity supplied to the grid (or used on-site) by the electricity export rate.
11,13,14. Total initial costs, payback period, and O&M costs must be as low as possible.
12,15. The amount of electricity generated and the revenue must be maximized; priority should be assigned to local use of electricity generation for wastewater treatment, not to the grid.
ENV
16.
GHG reduction: The proposed facility’s greenhouse gas emission reduction (mitigation) potential.
17.
Use of electricity: It can be on-site or delivered to the distribution grid.
16. GHG reduction is to be maximized.
17. The best way is to use the produced power directly on-site at the plants.
Table 5. Summary of regression analysis.
#R-SquaredObservationsStandard ErrorInterceptX-VariableFSignificance Ft-Statp-Value
1.0.88560.0230.00320.0032378.2ca. 019.45ca. 0
2.0.97560.035−0.00422 × 10−61673.8ca. 040.91ca. 0
3.0.62520.0180.0700.001379.5ca. 08.91ca. 0
4.0.79520.0130.00541.51 × 10−6192.0ca. 013.85ca. 0
Table 6. Main features of modular turbines currently available on the market and suitable for in-conduit hydropower in a low-head segment.
Turbine TypeNet Head (m)Flow (m3/s)Power (kW)Comments Reference
1.Amjet ATS1.5–12.80.2–26.03–2500A range of series is available 1[62]
2.StreamDiver2.0–8.02.0–12.050–1450There are at least 7 modules[63]
3.Turbiwatt1.2–8.00.1–3.63–120Three (3) available modules/series[64]
4.Flygt2.5–20.00.7–10.040–850Six (6) available modules/series[66]
5.Hydromatrix2.0–25.05.0–13.0200–2200Very large flow[65]
1 Depending on unit version/series.
Table 7. Review of small hydropower assessment software intended for the assessment of in-conduit hydropower at individual sites.
YearDeveloperOperating SystemApplicable
Countries
ApplicationAccessibilityFeatures
Units EnergyHydrologyHydraulicsTurbinesCostingEconomicGHGDesign Level
RETScreen [38]1998Canada SoftwareInternationalConventional HP Open 1SIxFDCxPaT not includedxxxFeasibility and preliminary design
ICHPST [33]2013Alden, USMS ExcelUSA WSWOpenI 2xFDC-Mostly all types, including PaTxxxScreening
BCAT [12]2019Stantec, USMS ExcelUSAWSWOpenI 2xDesign flow-Mostly all types, including PaTxxxScreening
1 Only in viewer mode. 2 Imperial. x—Feature included.
Table 8. Summary of rankings with the final ranking global synthetic index (GSi): 1 = best position; 8 = worst position.
AlternativesIndex
ci
Concordance Dominance Index
di.SD
Simple Discordance Index
di.WD
Weighted Discordance
Index
di.AD
Aggregate
Discordance Index
di.AWD
Weighted Aggregate Discordance
Index
GSi
Global Synthetic Index
A. Basic scenario: Criteria weights are equal, and group weights are different (ECO—29.42%, TEC—58.81%, ENV—11.77%)
a K160.00150.10850.09960.73260.7306−0.728
b K28−1.53070.30170.29981.93181.9298−3.460
c K350.05940.04−0.0074−0.4444−0.44450.503
d V120.7641−1.7681−1.7581−1.5141−1.51112.275
e V240.35360.12760.1333−0.8553−0.85331.206
f V311.0602−0.4092−0.4172−1.1862−1.18622.246
g A130.5293−0.0863−0.0815−0.1485−0.14740.676
h A27−1.23681.72781.72971.48471.4827−2.718
B. High economic scenario: Criteria weights are not equal, and group weights are different (ECO—49.39%, TEC—42.18%, ENV—8.43%)
a K121.07650.1081−1.72060.7323−0.34521.421
b K27−1.60670.30182.37181.93181.2768−2.882
c K350.09840.060.6334−0.4445−0.12050.219
d V140.1511−1.76850.1981−1.5142−0.43940.591
e V230.42360.12770.8123−0.8554−0.28730.710
f V311.7222−0.4092−1.5602−1.1861−1.03912.761
g A16−0.0733−0.0863−0.7735−0.14860.0726−0.145
h A28−1.79281.72740.03971.48470.8827−2.674
Publisher’s Note: MDPI stays neutral with regard to jurisdictional claims in published maps and institutional affiliations.

