1. Introduction
The continuous increase of global GHG emissions leads to the frequent occurrence of extreme climate. One of the most striking problems is global warming. If GHG emissions continue to rise, the global temperature will increase by 1.5 °C in 2052 [
1]. The continuous increase of carbon emissions mainly comes from daily human activities. As an indispensable part of human life and economic development, buildings significantly affect China’s carbon emissions. At present, as far as the carbon emissions of various industries in China are concerned, the building carbon emissions have always been high, 40% of the total is construction carbon emissions, and even have a definite upward trend [
2]. Therefore, China’s low-carbon development is closely related to the building industry’s low-carbon. Due to the continuous promotion of urbanization and the improvement of economic level, people’s requirement for commercial buildings and houses increases. At the same time, the completed area of houses will gradually increase. Therefore, CO
2 emissions will still maintain a rapid growth trend in the future. After 2050, with the continuous improvement of building energy conservation and emission reduction policies and the promotion of carbon reduction technology, building carbon emission reduction will contribute the most to carbon emission reduction in all industries [
3,
4]. Therefore, to realize the beautiful expectation of national green ecology, we must strive to solve and promote the green ecology of the construction industry.
Currently, the main methods used in the research on the calculation of building carbon emission at home and abroad are the life cycle method, input-output method, emission coefficient method, etc. Foreign scholars usually adopt life-cycle methods and input-output methods. Hui Ya et al. [
5] established the carbon emission calculation model by dividing the carbon dioxide emission in the construction process into the production of building materials, recycling, and treatment of building materials and other parts through the life cycle method. Acquaye and Duffy et al. [
6] calculated Ireland’s building’s CO
2 emissions through the input-output method. In 2005, the total carbon emissions were 13.81 million tons of CO
2, of which the direct GHG emissions were 2.37 million tons of CO
2, and the indirect GHG emissions were 11.44 million tons of CO
2. Christodoulakis et al. [
7] constructed the energy consumption model of Greece to study Greece’s future energy demand and calculated Greece’s carbon emission through the input-output method. Bach et al. [
8] used input-output models to simulate the impact of fiscal reform on Germany’s carbon dioxide emissions. Chen Sha et al. [
9] divide the construction industry into three stages through the life cycle method: preparation stage, construction stage, and use phase, and calculate the carbon dioxide emissions in different stages, respectively. Zhang Zhihui et al. [
10] divided the total amount of buildings GHG in different periods into direct GHG and indirect GHG through the life cycle method. Liu et al. [
11] divided greenhouse gas emissions into direct, indirect, and other greenhouse gases, and calculated these three types of greenhouse gases according to the emission coefficient method. Based on the IPCC emission coefficient method, Ji Jianyue et al. [
12] identified coal, natural gas, electric power, and petroleum as carbon dioxide emission sources and calculated the building carbon emission. The scholars’ above studies on carbon dioxide cover the calculation model of carbon emissions, but the different selection of influencing factors often lead to significant differences in the calculation results.
The research on carbon dioxide emission prediction is relatively limited, and the research methods differ at home and abroad. Wakivams et al. [
13] estimated the CO
2 emission caused by the power consumption of the construction industry in Japan through the time series method. They found that by 2030, the carbon dioxide emissions from construction electricity will reach 55.4 million tons. Chen Qiao et al. [
14] improved the IPAT model and predicted the CO
2 emissions from 2010 to 2050 based on China’s CO
2 emissions data in previous years. The prediction certificate that China can reach the expected carbon peak before the specified period.
In addition, Hu Zhen et al. [
15] established the Xi’an household carbon emission model based on BP neural network model, and the results show that the model has good prediction performance, which is better than the multiple linear regression model. Zhang et al. [
16] used BP neural network model to predict future coal consumption and carbon emissions, and the average error of training samples was 0.0066. Ding et al. [
17] used the grey prediction model to predict the development trend of private hospitals in China. The results showed that the model’s accuracy was more than 95%, and the prediction effect was good. BP neural network and grey model show good prediction ability in many fields, which is suitable for medium and long-term prediction. Unlike the multiple linear regression model, BP neural network and grey model can deal well with the relationship between influencing factors and reduce the error.
As there are many influencing factors of building carbon emissions, different influencing factors will have different impacts on future prediction results. In addition, according to the carbon emission method of IPCC Guidelines (IPCC, 2006), carbon emissions are determined by activity level data and emission factors together, and different calculation models lead to different carbon emission factors used in energy conversion. As a result of the above two factors, scholars’ predictions of future carbon emissions for China and provinces differ significantly.
In summary, to ensure the correctness of carbon emission prediction data, the key lies in selecting influencing factors of a building’s CO2 emission. Considering the linear and nonlinear relationship between building’s CO2 emissions and some influencing factors and the long prediction cycle of this paper, the use of traditional prediction methods will lead to significant differences in prediction results. Therefore, the grey prediction model is combined with BP neural network to predict building’s CO2 emissions. Reasonable prediction of construction carbon emissions has far-reaching practical significance for reducing construction industry emissions. It can also provide a theoretical basis for subsequent scholars’ research.
2. Principles of Research Methods
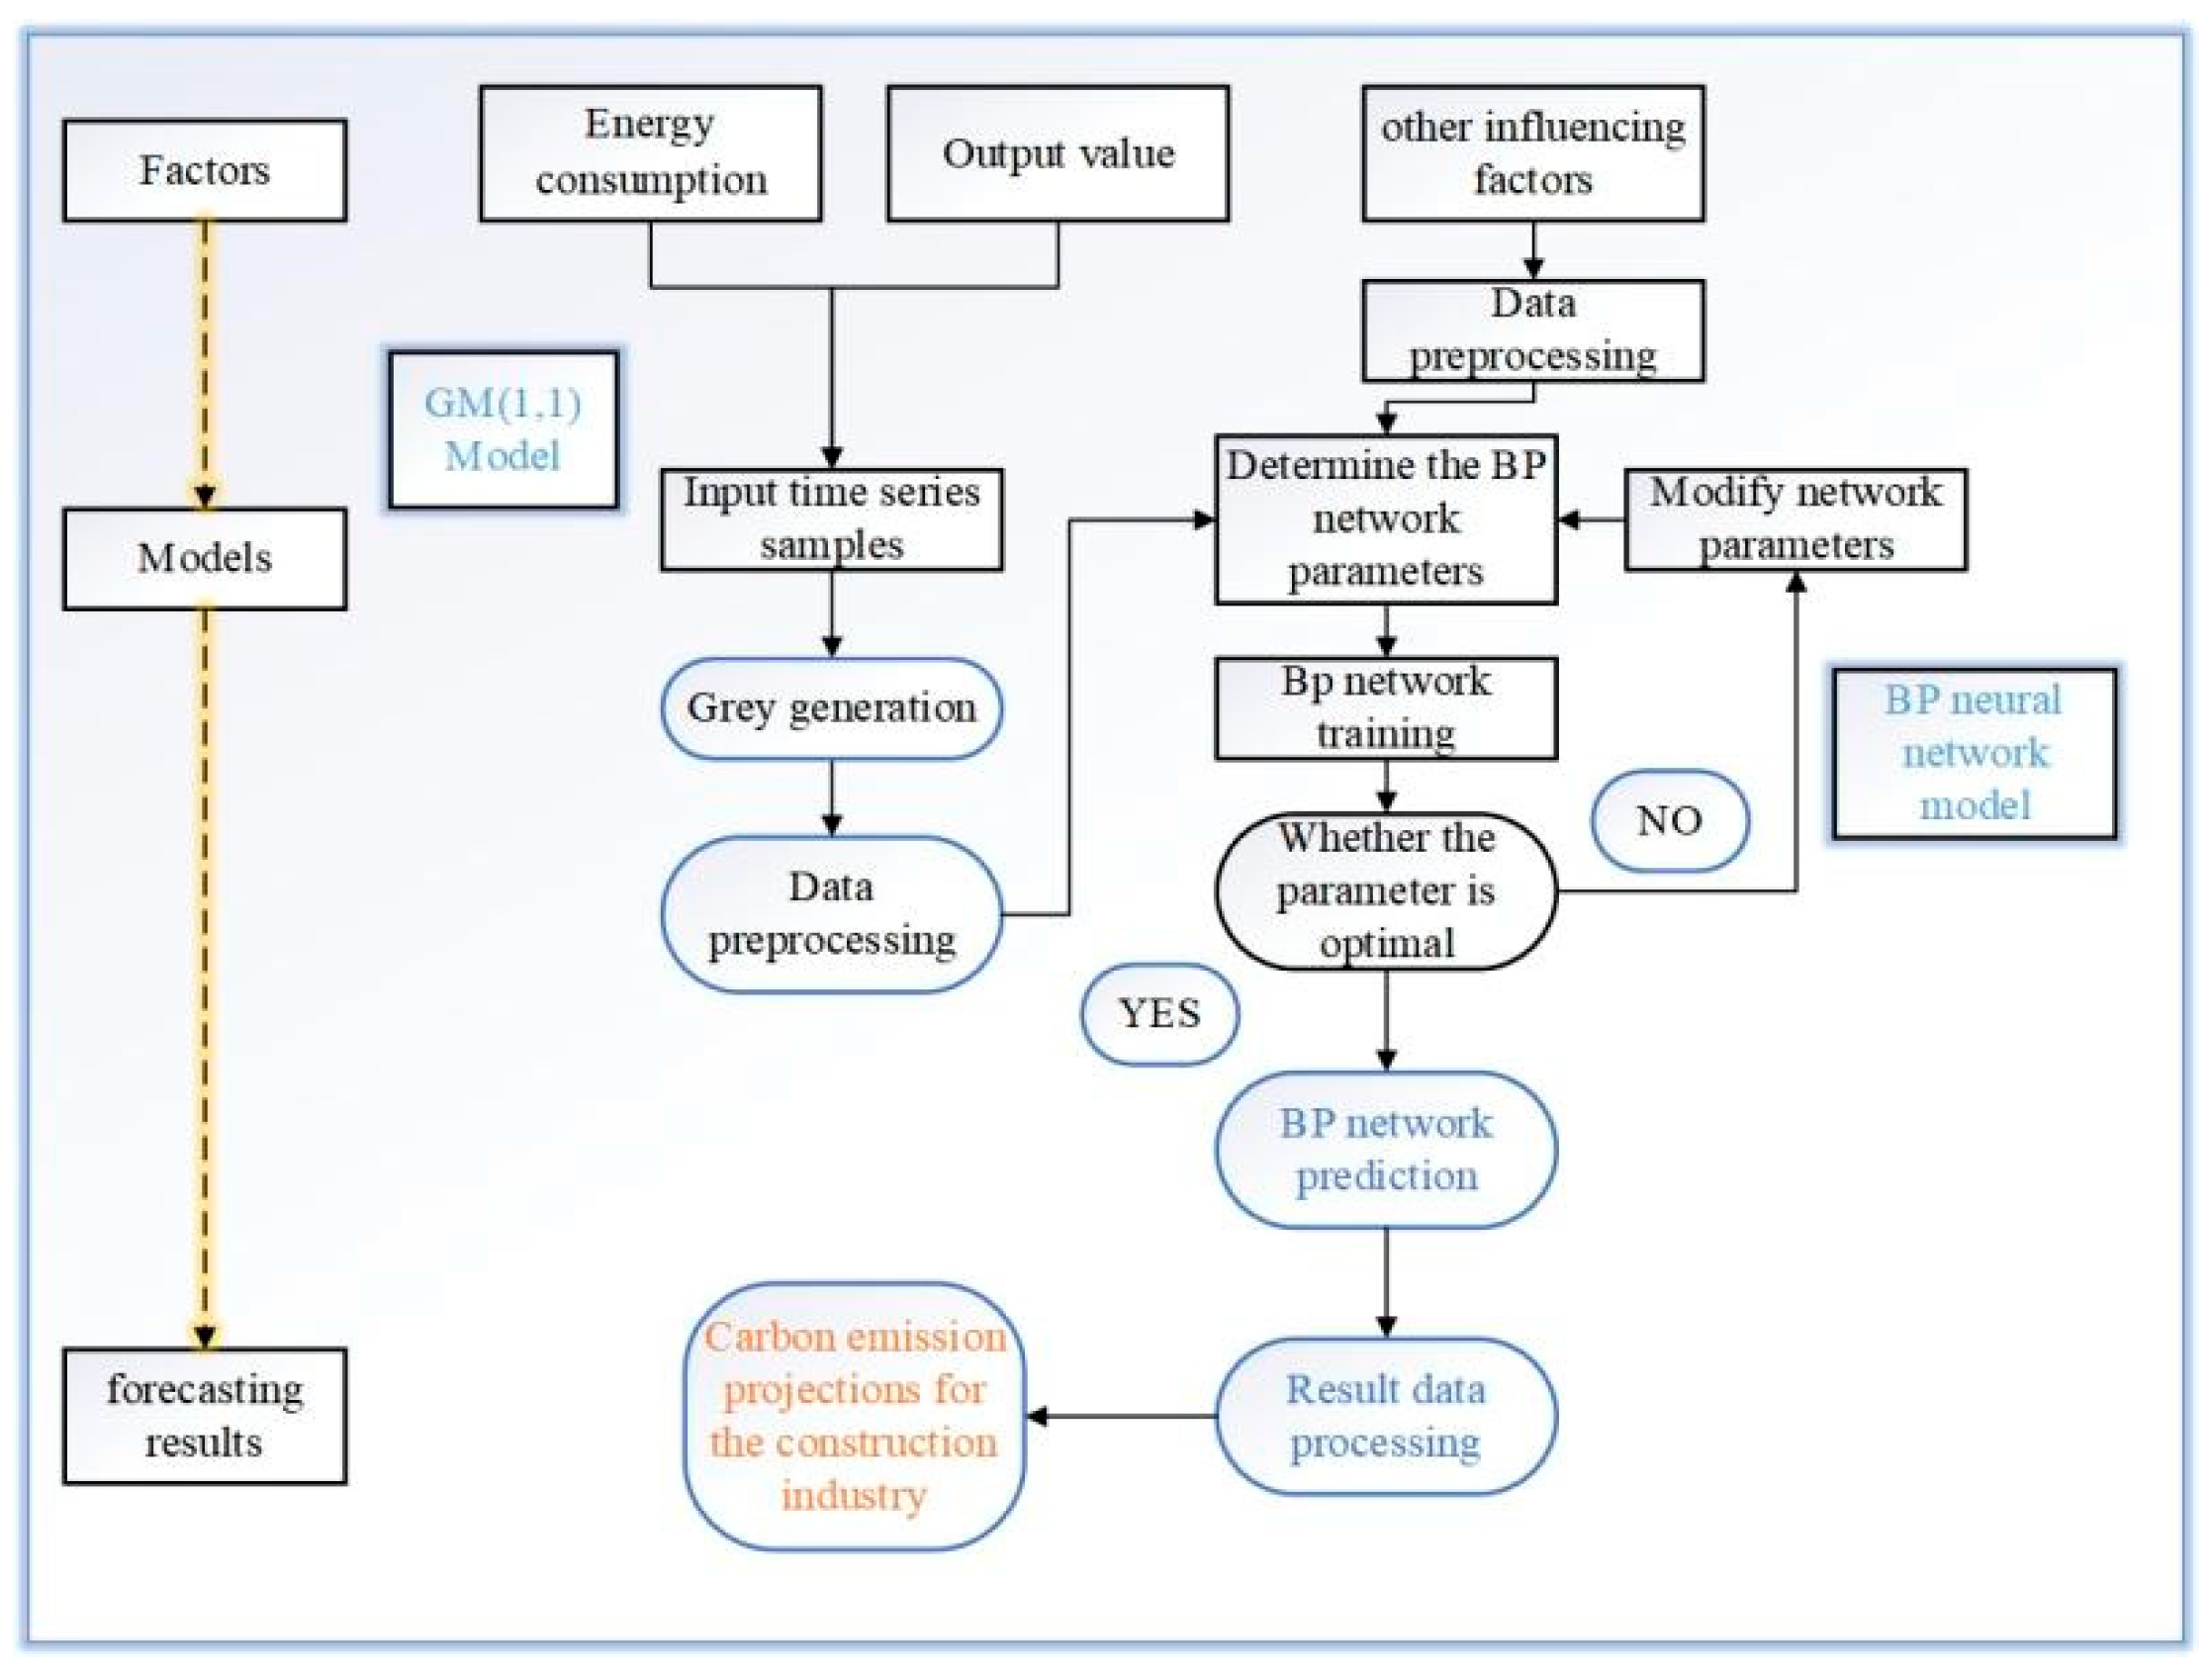
The research method proposed in this paper focuses on the good combination of grey prediction model and BP neural network model to obtain an accurate carbon emission prediction model. First, determine the influencing factors of carbon emissions from the construction industry. Secondly, through the gray prediction model to preprocess the data of the factors, combined with the scenario analysis method to get the future prediction value of the influencing factors. Then, the processed data is introduced into the BP neural network model for many times of network training. Repeat the above steps to generate an accurate carbon emission prediction model, as shown in
Figure 1. Advantages of the combination of the two methods: the grey model can make up for the defect of BP neural network model that the prediction accuracy is not high under the condition of small samples, and can give better play to the advantages of the two methods and improve the prediction accuracy of the model.
2.1. BP Model
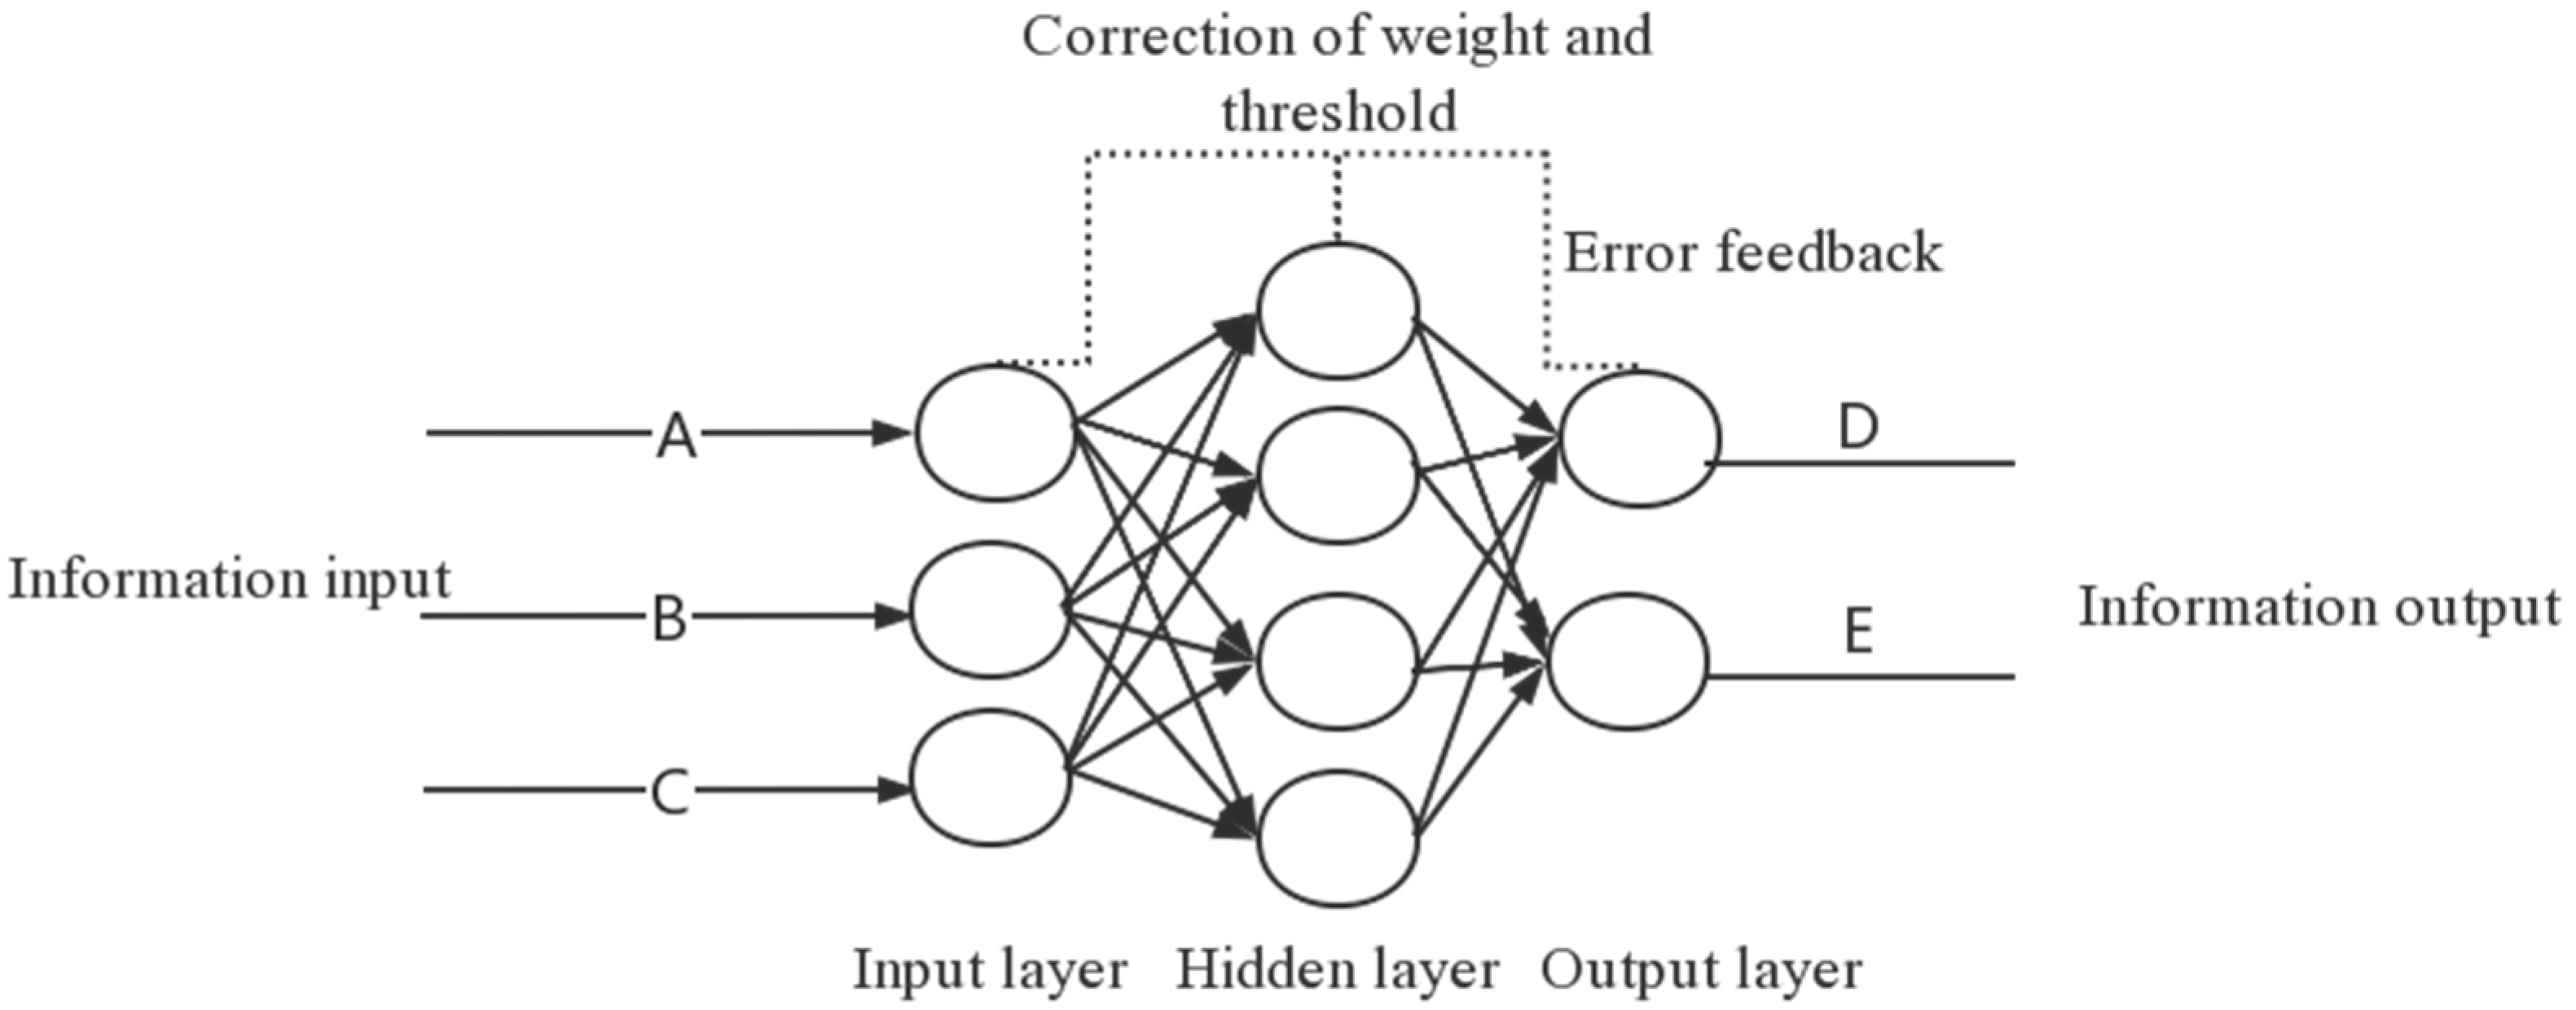
BP neural network is a multilayer feedforward neural network trained according to the error backpropagation algorithm. Generally, the BP neural network model is composed of the input, hidden, and output layers.
Figure 2 shows its structure diagram. The key lies in the forward propagation of the signal and the backpropagation of error to continuously adjust the weighting vector and threshold to minimize the error.
This paper constructs the prediction model of building carbon emission in China through the BP neural network. The basic steps of model construction are as follows:
- (1)
Normalize the index data to make it within the [−1, 1] interval to eliminate the dimensional difference between the data. Its function form is as follows:
- (2)
The historical data from 1995 to 2019 were divided into training sets and test sets.
- (3)
Construct BP neural network model, apply training samples to train the model, and correct the model parameters through continuous training to finally obtain a BP neural network CO2 emission prediction model for the construction industry that meets the desired error. The learning rate represents the information accumulation of the BP neural network over time. The learning rate determines the magnitude of each parameter update. When it takes an enormous value, it will lead to large fluctuations in the late stage of model training leading to failure to converge; when its value is small, although it can make the model simulation results more accurate, it will increase the training time. Learning rate is between in (0, 1), usually we take the value was 0.5.
- (4)
The increase of the number of hidden layers in the model will enhance the data processing ability of the model, but too many hidden layers will lead to too slow convergence speed of the model. Therefore, it is particularly important to reasonably arrange hidden layers’ numbers in-network structure design and select the number of neurons with the best performance. Thus, the model selects one layer as the number of hidden layers. In addition, at present, we can only calculate the approximate range of the number of neurons in the hidden layer according to the empirical formula and then verify the model’s performance through training to determine the specific number. The empirical formula is as follows:
where
is the number of hidden layer cells,
and
are the number of input layer and hidden layer cells, respectively, and
is a constant between 1–10.
- (5)
After the training process of the prediction model, the test samples are used for prediction, and the prediction value of the model is obtained by inverse normalization. The model’s prediction performance is verified by comparing it with the actual value.
2.2. GM (1,1) Model
Grey prediction is the prediction based on grey system, which can better mine the change law of the original data sequence. Among the grey prediction models, GM (1,1) model is the most widely used. It is suitable for many fields and has the characteristics of fewer samples and high prediction accuracy. It is a modern prediction method that can realize medium and long-term predictions. The advantage of the GM (1,1) model is that it can predict uncertainly and yet to occur events based on the existing actual data and few data samples and predict the future results of events through a simple operation. This paper will use the grey prediction model to predict per capita building area and total energy consumption. The prediction principle of the GM (1,1) model is that a group of new data sequences with apparent trends is generated by accumulating a specific data sequence, and the model is established according to the growing trend of the new data sequence to predict, and then the cumulative method is used for the reverse calculation to restore the original data sequence, and then the prediction results are obtained. The modeling process is as follows:
- (1)
The original data sequence with variable
:
By accumulating
, get a new sequence of numbers as follows:
- (2)
Generate the adjacent mean equal weight column of
- (3)
Establish the general form of grey prediction model.
Among them, and
are unsolvable coefficients, which are called development coefficient and grey action respectively.
- (4)
Average the accumulated generated data to generate
and constant term vector
:
- (5)
The least square method is used to solve grey parameter ,
- (6)
The grey parameter is brought into
and solved,
- (7)
Thus, the predicted value can be obtained:
4. Carbon Emission Control Targets of Construction Industry
This chapter introduces the upper limit of energy consumption in the construction industry to establish carbon emission control objectives on this basis. In addition, according to the characteristics of carbon emission coefficient changing with energy structure, the changing trend of the carbon emission coefficient in the future is scientifically and reasonably predicted. The expected maximum carbon emission represents the responsibility and potential of the construction industry for emission reduction, which is conducive to the government to formulate energy conservation and emission reduction policies.
4.1. Energy Consumption of Construction Industry
Based on the study of Bi Chao [
39], this paper forecasts China’s primary energy consumption from 2020 to 2060 based on relevant policy analysis. With the increase of clean energy use, the energy structure is bound to change, and the carbon emission factor will also change. In specific terms, as shown in
Table 6, China’s primary energy consumption is 4.260 billion tce in 2020, with an average annual growth rate of 1.8%. As the primary energy consumption continues to grow, the growth rate of energy consumption gradually decreases to 1.70%, 1.60%, 1.50%, 0.80%, and 0.60%. CO
2 emissions from energy activities will grow from 8.370 billion t in 2020 to 9.350 billion t in 2030 and gradually decline after 2030 to reach 9.060 billion t in 2060.
Table 6 shows that when the upper limit is 25%, the energy consumption of construction industry will increase from 1065 million tons in 2020 to 1663 million tons in 2060.
4.2. Carbon Emission Factor of Construction Industry
Energy consumption and carbon emission coefficient are the keys to measuring carbon emissions, and the carbon emission coefficient is closely related to the energy structure. Therefore, it is required to analyze the prospective development tendency of China’s building carbon emission coefficient based on building energy structure. Yang et al. [
22] Defined the formula for determining the future carbon emission coefficient. Based on this study, Equations (16) and (17) present the measurement method of carbon emission factors in construction industry.
where
i refers to major energy types (details in
Table 7),
is the proportion of energy
in total energy consumed in the building sector,
is the proportion of energy
i in country energy consumption, and
is the proportion of resources used by the building sector, of which
is a carbon emission factor for the conversion of each kind of energy into coal equivalent. Due to the energy structure optimization, the share of energy will change, so the carbon emission factor will also change. Considering the implementation of relevant emission reduction regulations, the share of clean energy will gradually expand with the popularization of clean energy. At the same time, China is undergoing a service-oriented economic transformation, and its reliance on energy sources such as coal is decreasing. Considering the above factors, in
Table 7, the scenario I following the historical trend is established.
In addition to scenario I, two other scenarios have been established, corresponding to stricter policies. In scenario II and scenario III, the oil and gas share trend remains basically unchanged. While the proportion of Clean energy consumption in scenario II rise to 31%, 36%, 36%, 38%, 41%, 42%, and the proportion of coal gradually decreases to 50%, 45%, 45%, 43%, 41%, 40%. The share of Clean energy in scenario III rise to 33%, 38%, 38%, 40%, 43%, 44%, and the share of coal decreases to 48%, 43%, 43%, 41%, 39%, 38%. Based on the changes in energy structure in these three scenarios, it can calculate the carbon emission factor by using Equations (16) and (17).
We can transform the upper limit of energy consumption into a carbon emission control target by combining the carbon emission factors in
Table 8.
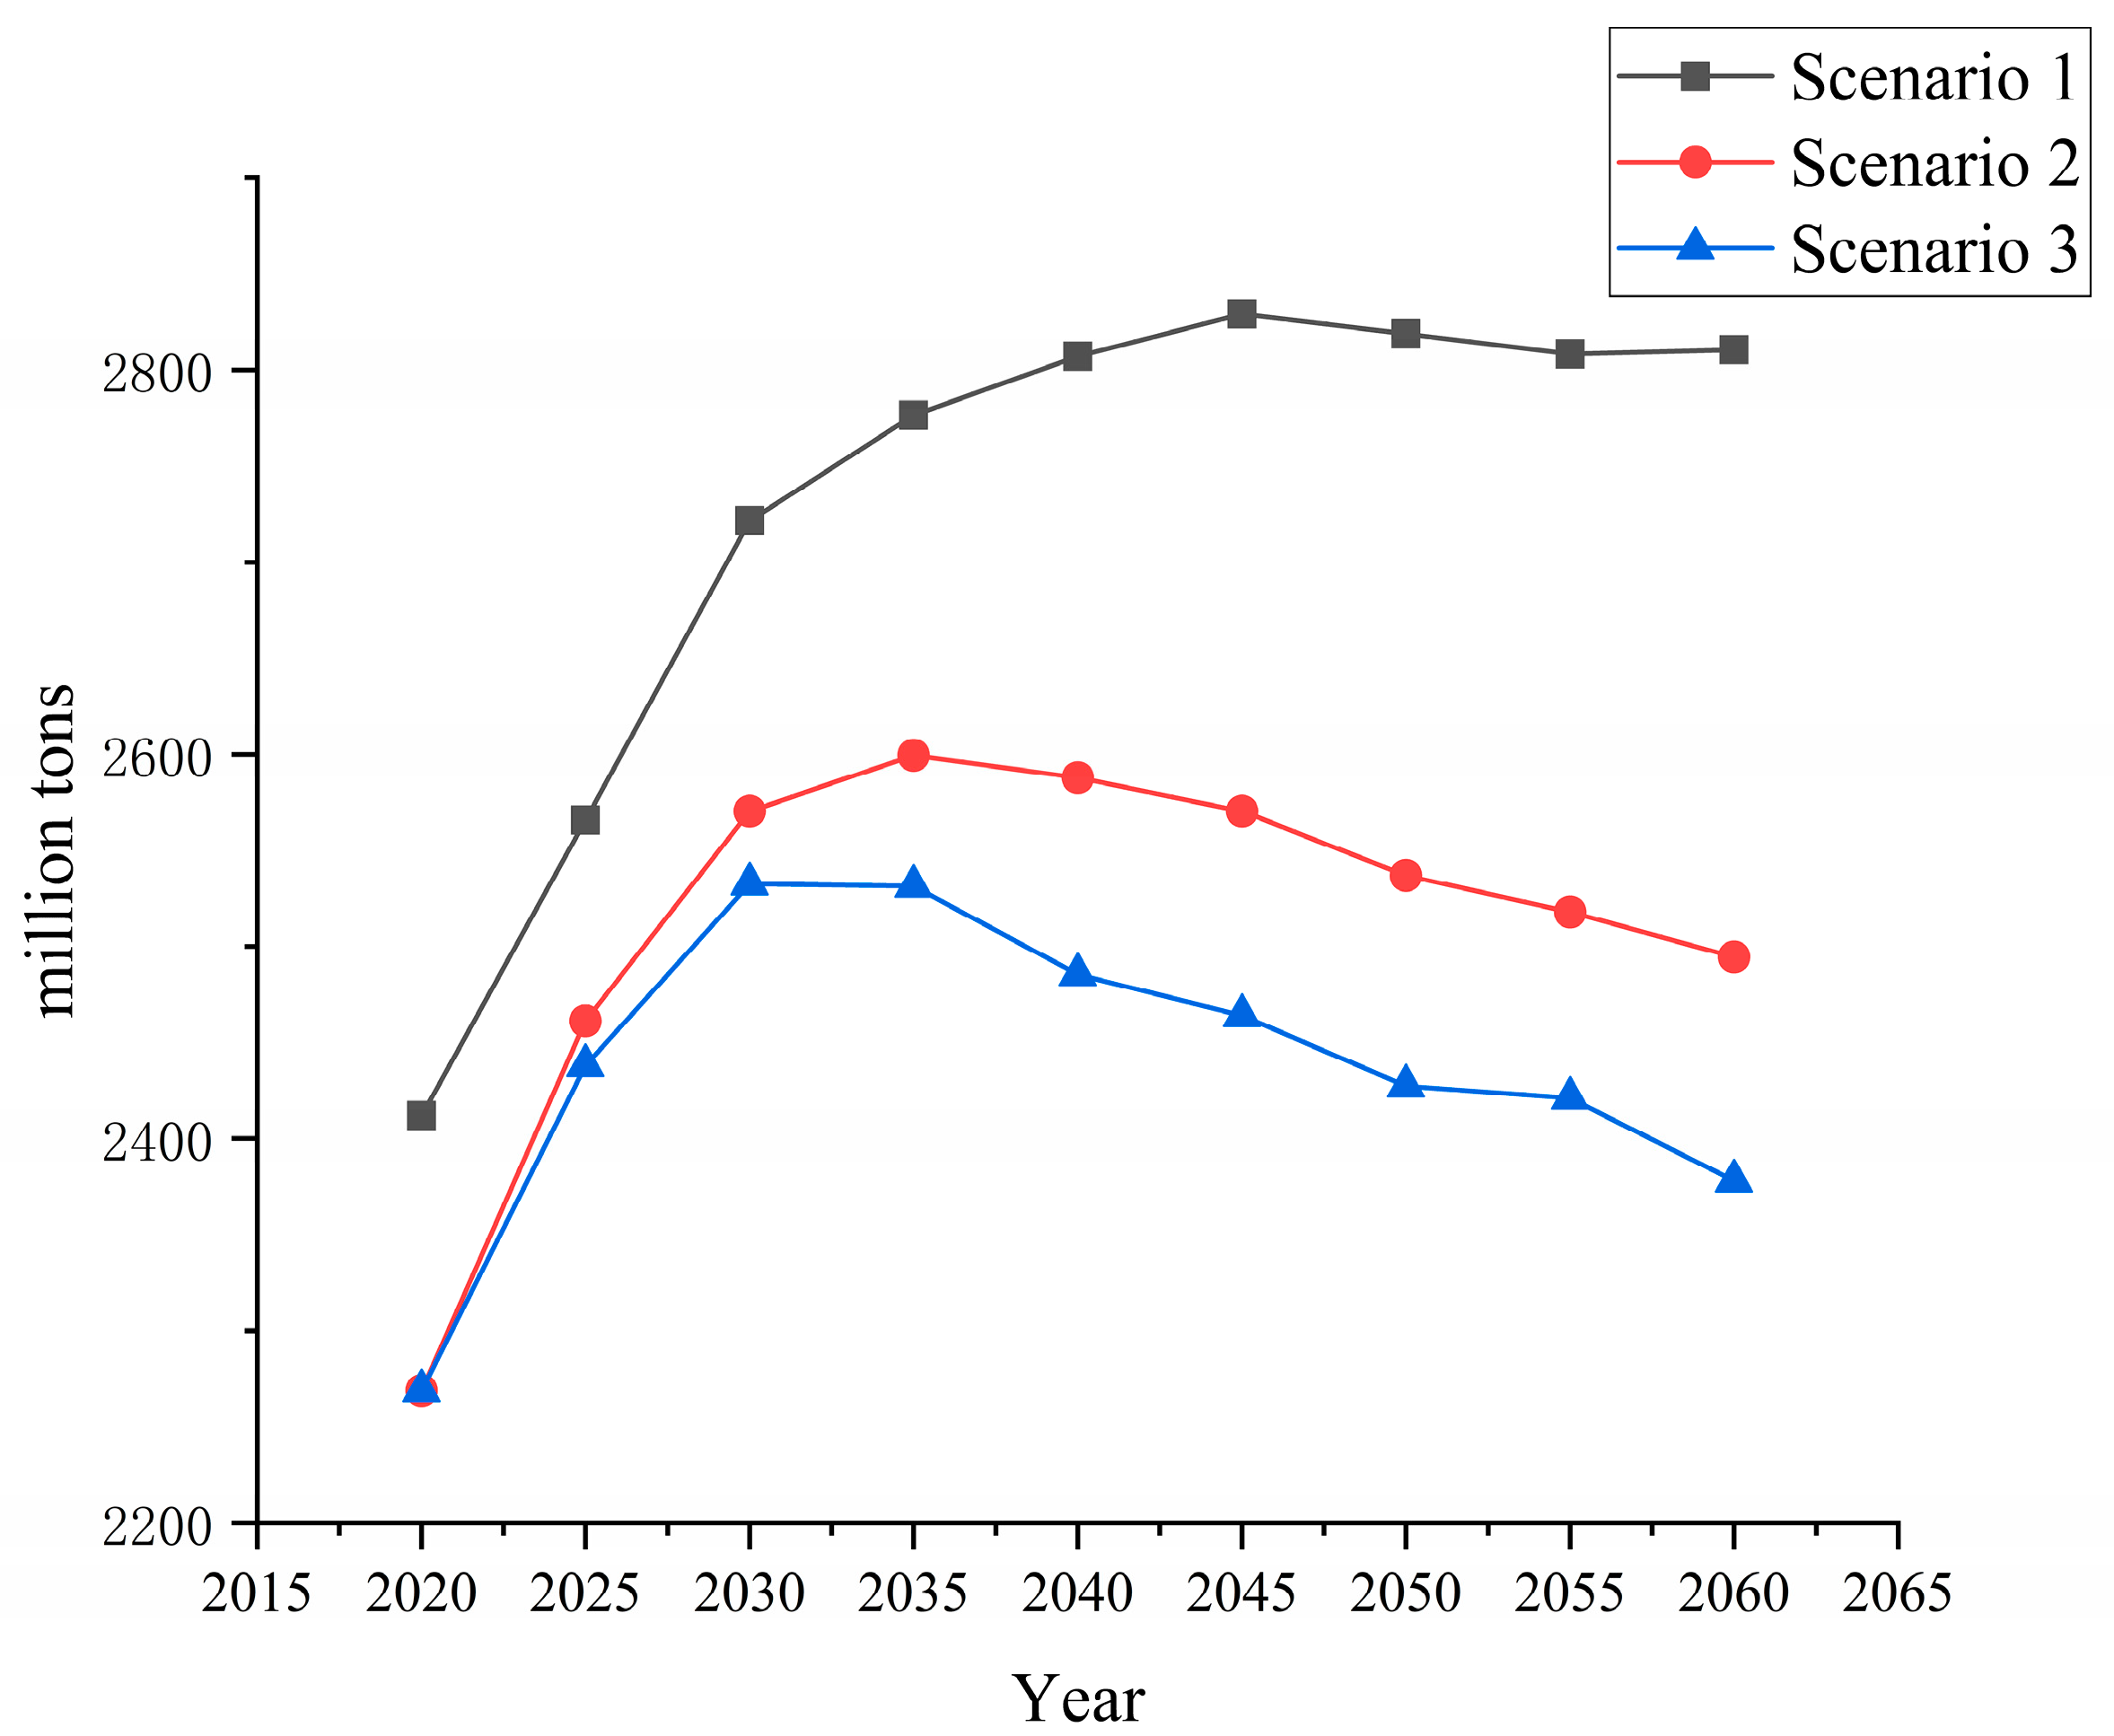
Figure 5 shows that under Scenario I, carbon emissions of construction industry will keep increasing, and will be at a rapid growth stage during 2020–2030, and then slow down after 2030, reaching a peak in 2045. Under Scenario II and Scenario III, carbon emissions will peak in 2035 and 2030, respectively. It is clear that among the three scenarios, only in Scenario III the carbon emissions will peak in 2030, which is in line with the goal of China’s carbon peaking strategy. Therefore, we choose the carbon emission control target of Scenario III as the CO
2 emission cap in the building sector. The construction industry’s carbon emissions target is 2438 million t by 2025 and 2533 million t by 2030. 2531 million t in 2035, 2485 million t in 2040, 2464 million t in 2045, 2427 million t in 2050, 2421 million t in 2055, and 2378 million t in 2060, as shown in
Figure 5.
5. Construction Carbon Emissions Projection
5.1. Influence Factor
Using the STIRPAT model, the population, GDP, energy consumption and construction output value were selected as the influencing factors, and the CO
2 emissions of China’s buildings were fitted separately using the RidgeRegression method. Therefore, the STRIRPAT model of building carbon emission influence factor established in this study is shown in Equation (18):
where
is the amount of carbon emission,
is population,
is GDP,
is energy consumption,
is the output value of construction industry,
is model coefficient,
,
,
and
respectively represent elastic coefficients of population, GDP, energy consumption, and construction output, respectively, and
is a random error term. We fit the model with the Ridge Regression, and
Table 9 shows the results.
The of the regression model is 0.997, which indicates that the regression model was well-fitted. According to the fitting results of influencing factors, population, GDP, energy consumption, and the construction output are in direct proportion to the change of building carbon emission, that is, with the increase of the change value of influencing factors, carbon emission increases. When the change value of influencing factors decreases, carbon emission decreases. The contribution of the population to CO2 emissions is more significant than other influencing factors due to the fact that as the number of people increases, the demand for buildings also increases. The surge in architecture demand is accompanied by a rise in energy consumption, which results in more carbon emissions.
In addition to demographic factors, the influence of GDP on building carbon emissions has been considerable. When GDP increases by 1%, construction carbon emissions will increase by 1.027%. When the economic level improves, carbon emissions will also increase. From the perspective of energy structure, China currently maintains a primary energy consumption structure dominated by coal and oil. When reducing the consumption of primary energy and increasing the proportion of non-fossil energy, the generation of carbon emissions can be curbed to a certain extent. The impact of construction output is also positive since the rise of construction output marks the growth of more construction works, corresponding to the increase in building area. Therefore, the corresponding carbon emission will also increase.
5.1.1. Total Population
In general, population growth contributes to the rise of carbon emissions from buildings in two ways. One is that a larger population leads to an increased demand for residential buildings and public buildings. The other is that population growth accompanied by changes in land-use patterns will somewhat reduce the area of green forests. The National Population Development Plan states the expected future development goals for China’s population: the total national population is expected to amount to 1.42 billion in 2020 and maintain a steady level of growth to reach 1.45 billion in 2030 [
40]. An Yag pointed out that although the adoption of the “comprehensive two-child” policy will stimulate population growth to some extent [
41], China’s total population will not see the expected explosive growth but will gradually decrease after reaching a population peak of 1.452 billion in 2030, at a moderate rate, and will remain at 1.378 billion in 2050. This data is in line with that expected in the National Population Development Plan. The China Statistical Yearbook states that the population of China is 1.395 billion and 1.400 billion people in 2018 and 2019. Therefore, this paper sets two scenarios for population growth in
Table 10. Scenario A sets a net increase of 8 million people per year from 2020 to 2060, while Scenario B sets a population peak of 1.452 billion people in 2030 and decreases at a rate of 1.3% after that.
5.1.2. GDP
As urbanization accelerates and the economic structure transforms, economic growth will change according to policies. Therefore, this paper combines the 14th Five-Year Plan and objective reality to simulate and forecast the possible economic growth in the future and sets the following three GDP growth scenarios:
- (1)
Baseline scenario developed in accordance with historical trends. Focus on economic development, in accordance with the current energy saving and emission reduction efforts, increase technology investment, and launch corresponding emission reduction policies, but not to meet the needs of emission reduction.
- (2)
According to the “supply-side structural reform”, set a faster growth scenario. The government improves the industrial structure, promoting clean energy and transforming energy consumption structure; reform the mode of economic development activities; citizens’ awareness of saving energy and reducing emissions has been dramatically enhanced, creating a trinity of economy, energy, and environment for harmonic development.
- (3)
Slower growth scenarios. Slow improvement in industrial structure and promotion of industrial upgrading; continued increase in the share of non-fossil energy; lack of awareness of emission reduction.
Referring to Li Ping’s study on China’s economic growth forecast for 2016–2030 [
42], this paper assumes that under the baseline scenario (Scenario 1), the average annual GDP growth rates are 5.6% and 4.9% for the 2021–2025 and 2026–2030 periods, respectively; 2030–2040, 2040–2050, and 2050–2060 are 4.9%, 4.6%, and 4.6%, respectively. In the slower growth scenario (Scenario 2), the average annual GDP growth for the five periods is 5.2%, 4.5%, 4.5%, 4.3%, and 4.3%, respectively. In the faster growth scenario (Scenario 3), China maintains a faster growth rate of 6.0%, 6.0%, 6.0%, 5.8%, and 5.8% per year on average in five periods as the industrial structure is transformed and upgraded.
5.1.3. Total Building Energy Consumption and Total Output
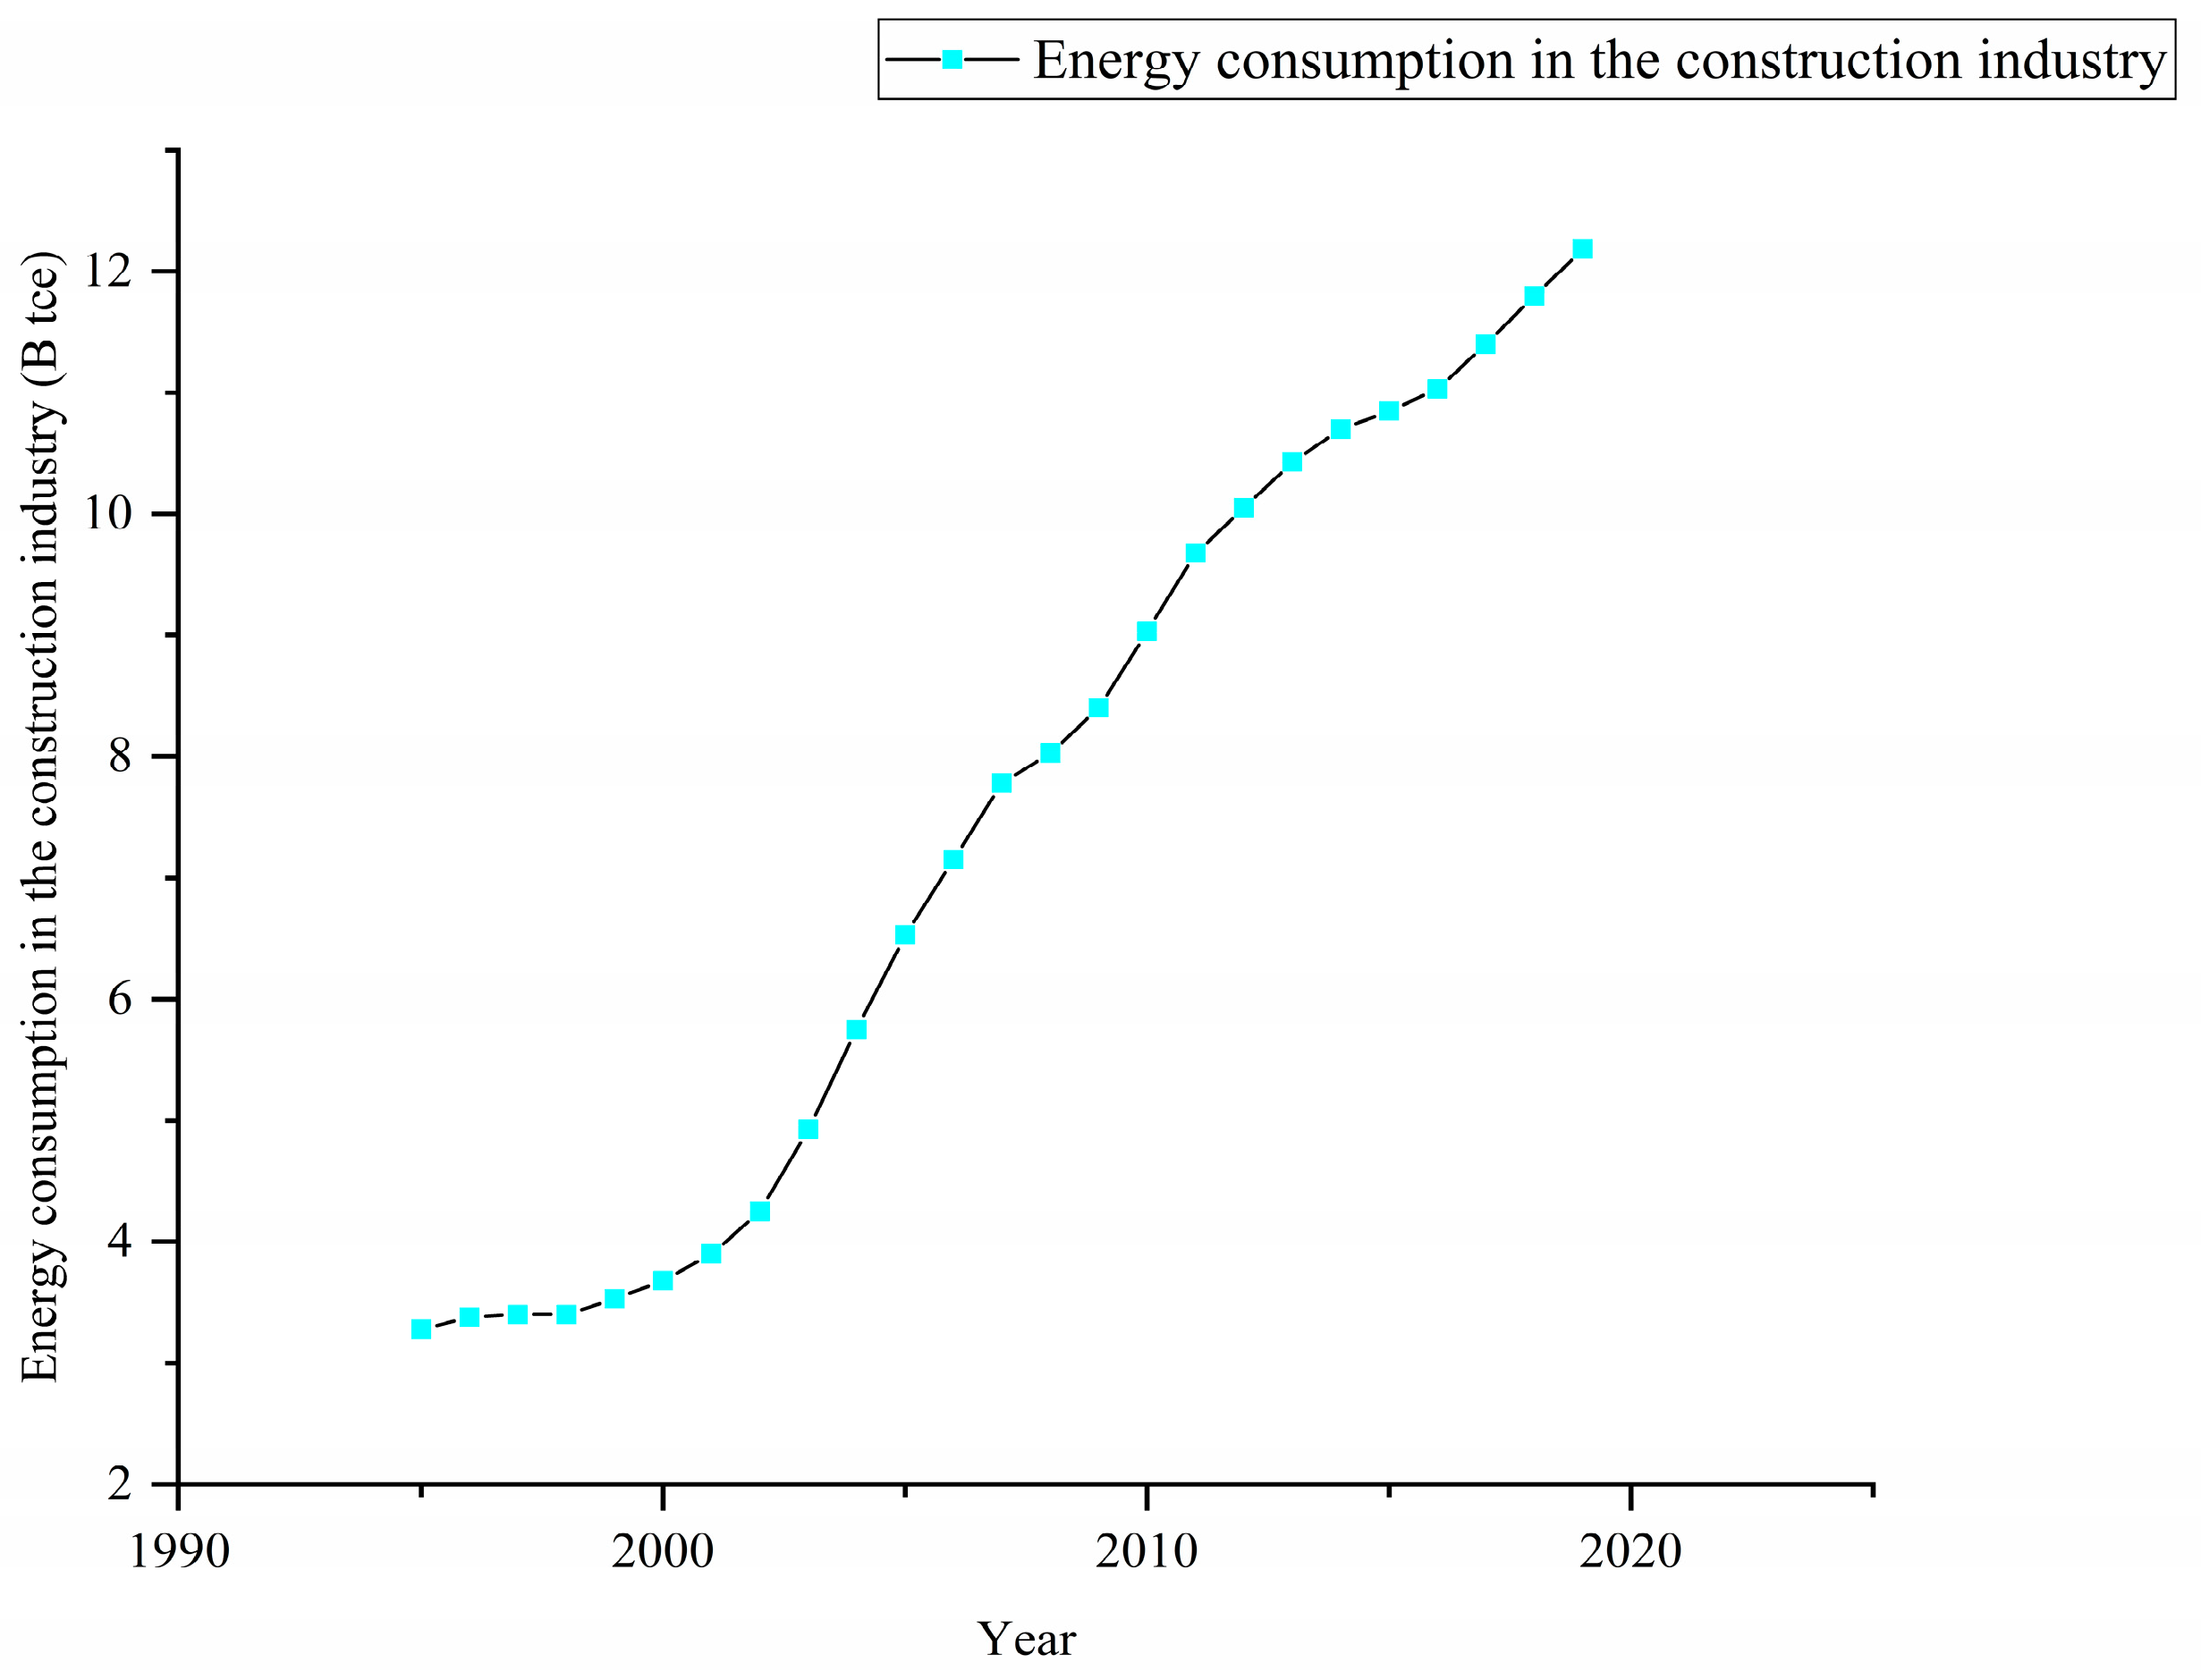
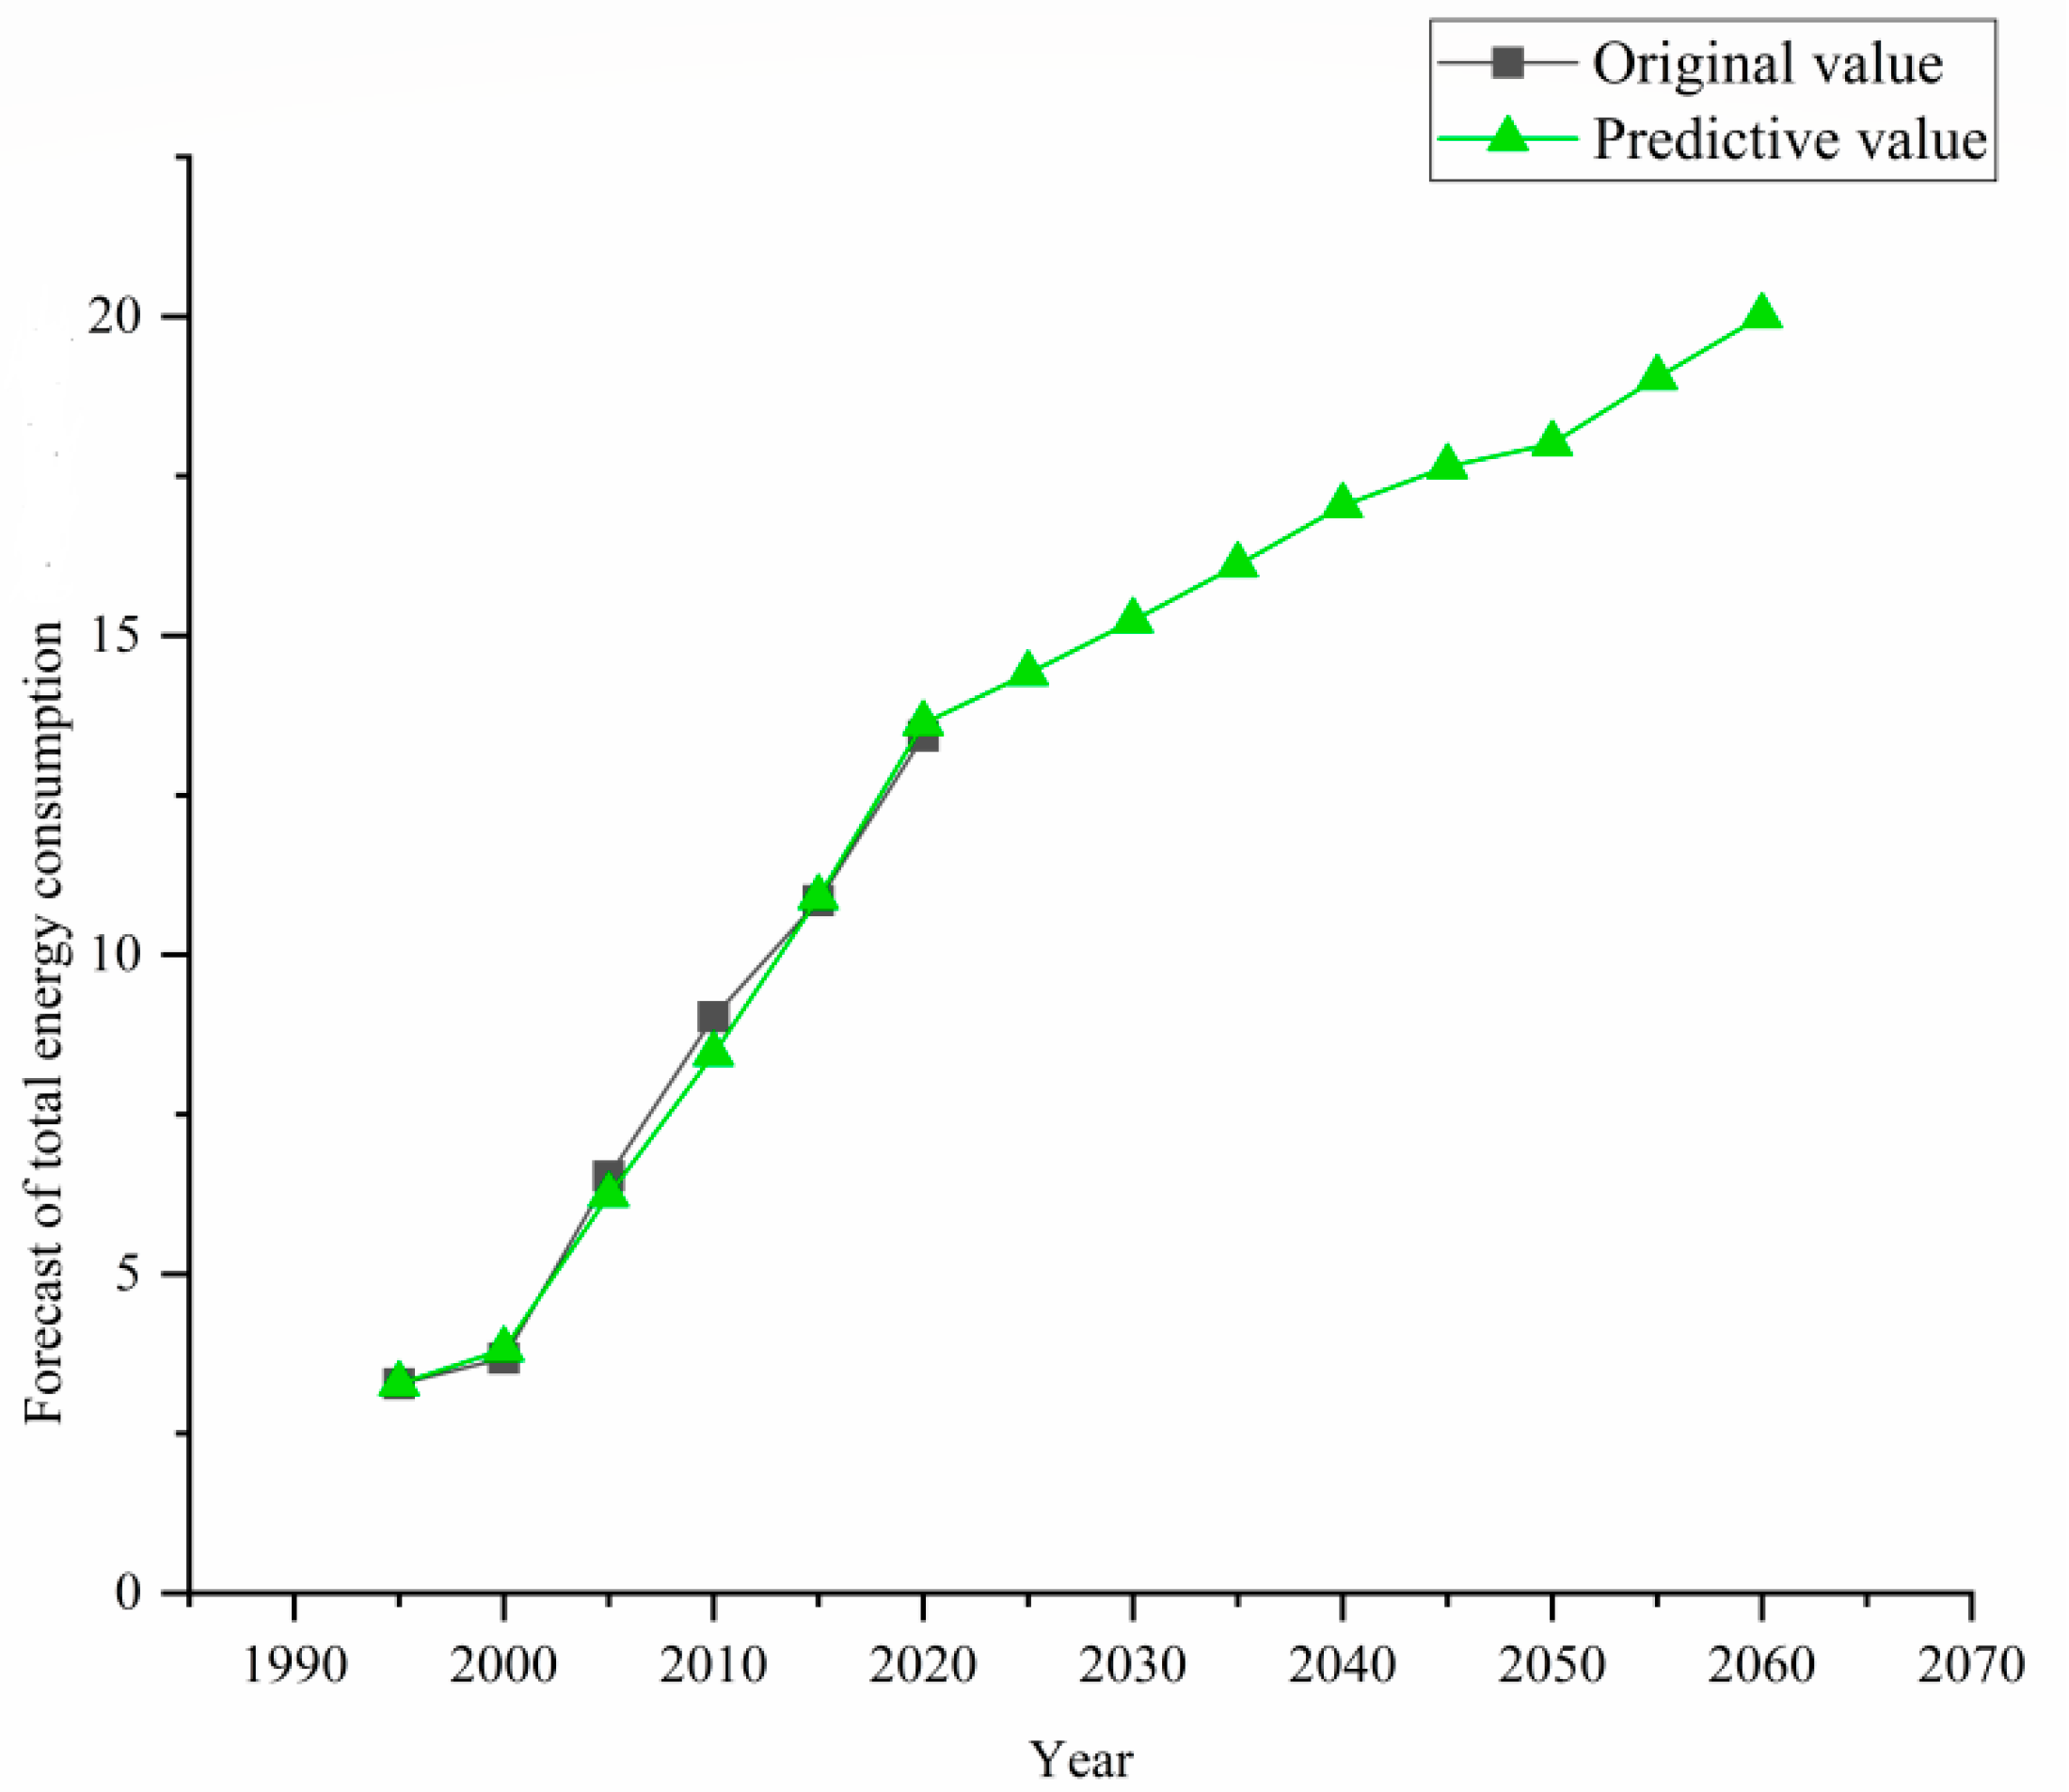
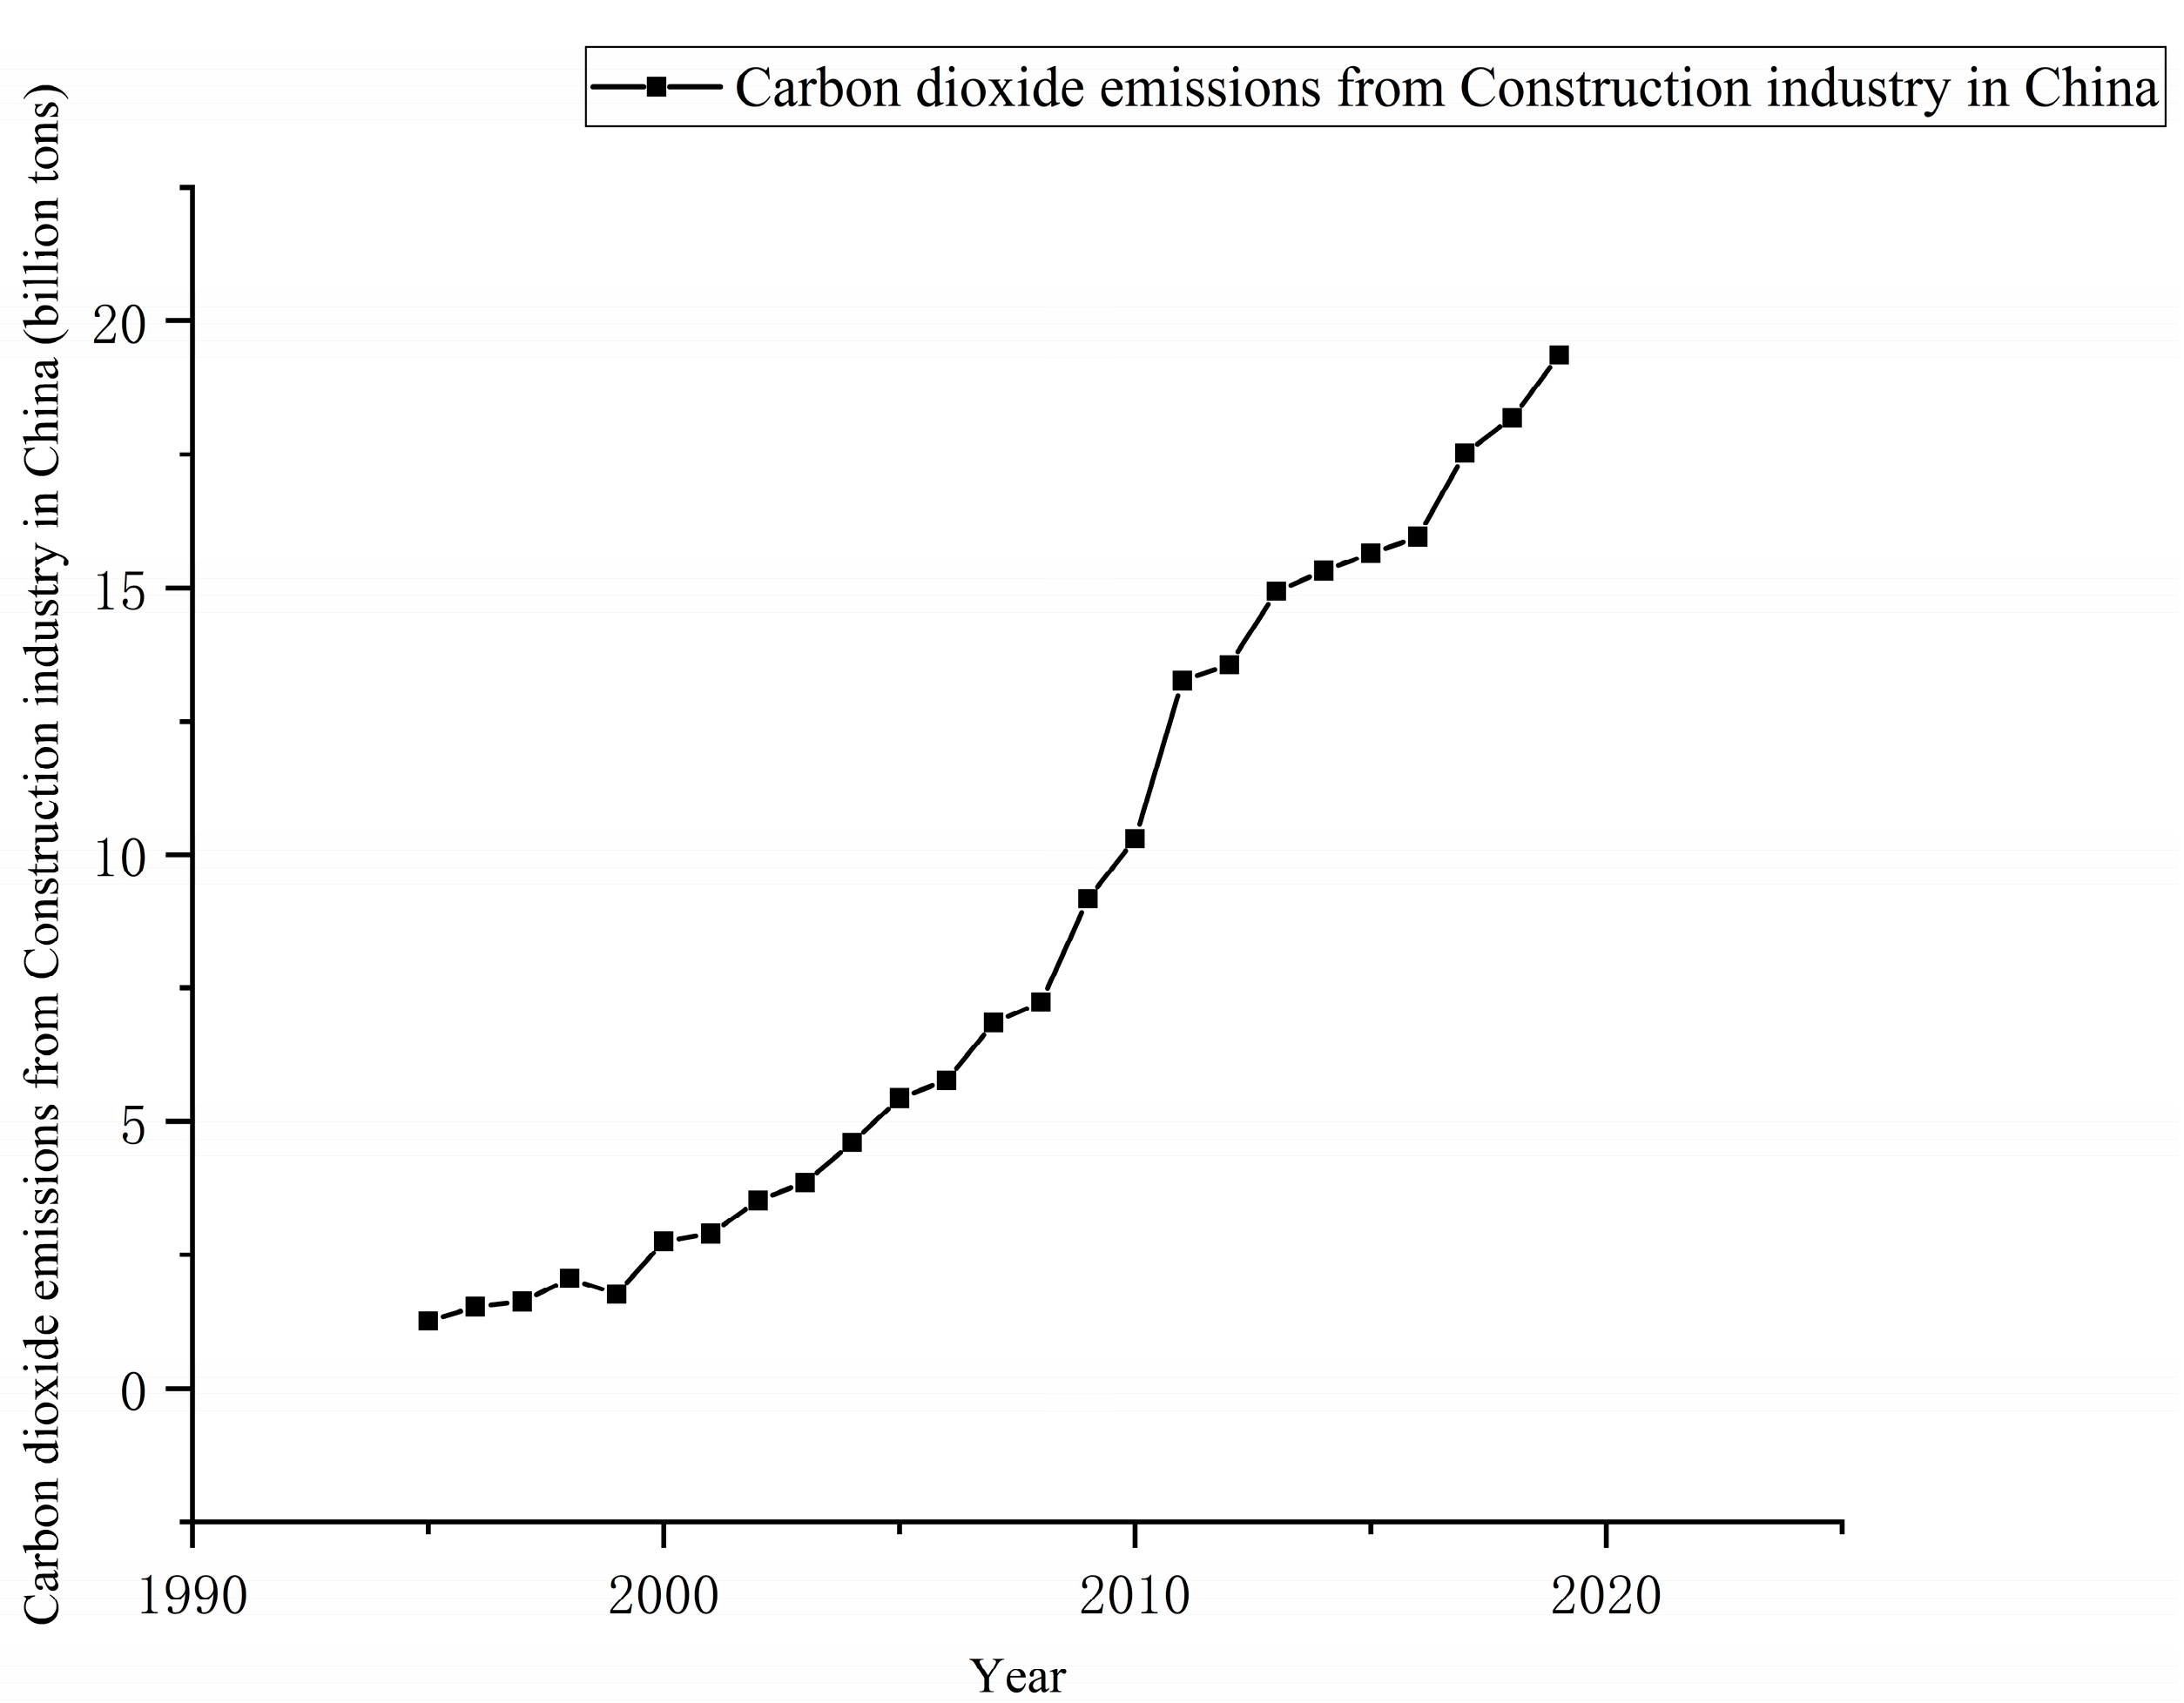
Taking the historical data of total building energy consumption in China from 1995 to 2019 as the object, the model is established. The error analysis is carried out using the original and accumulated data to predict the data up to 2060.
Table 11 shows that the relative error between the actual and predicted values in the prediction of building energy consumption is minor, thus illustrating that the model has the good predictive capability and can predict future energy consumption.
Figure 6 shows the energy consumption prediction results.
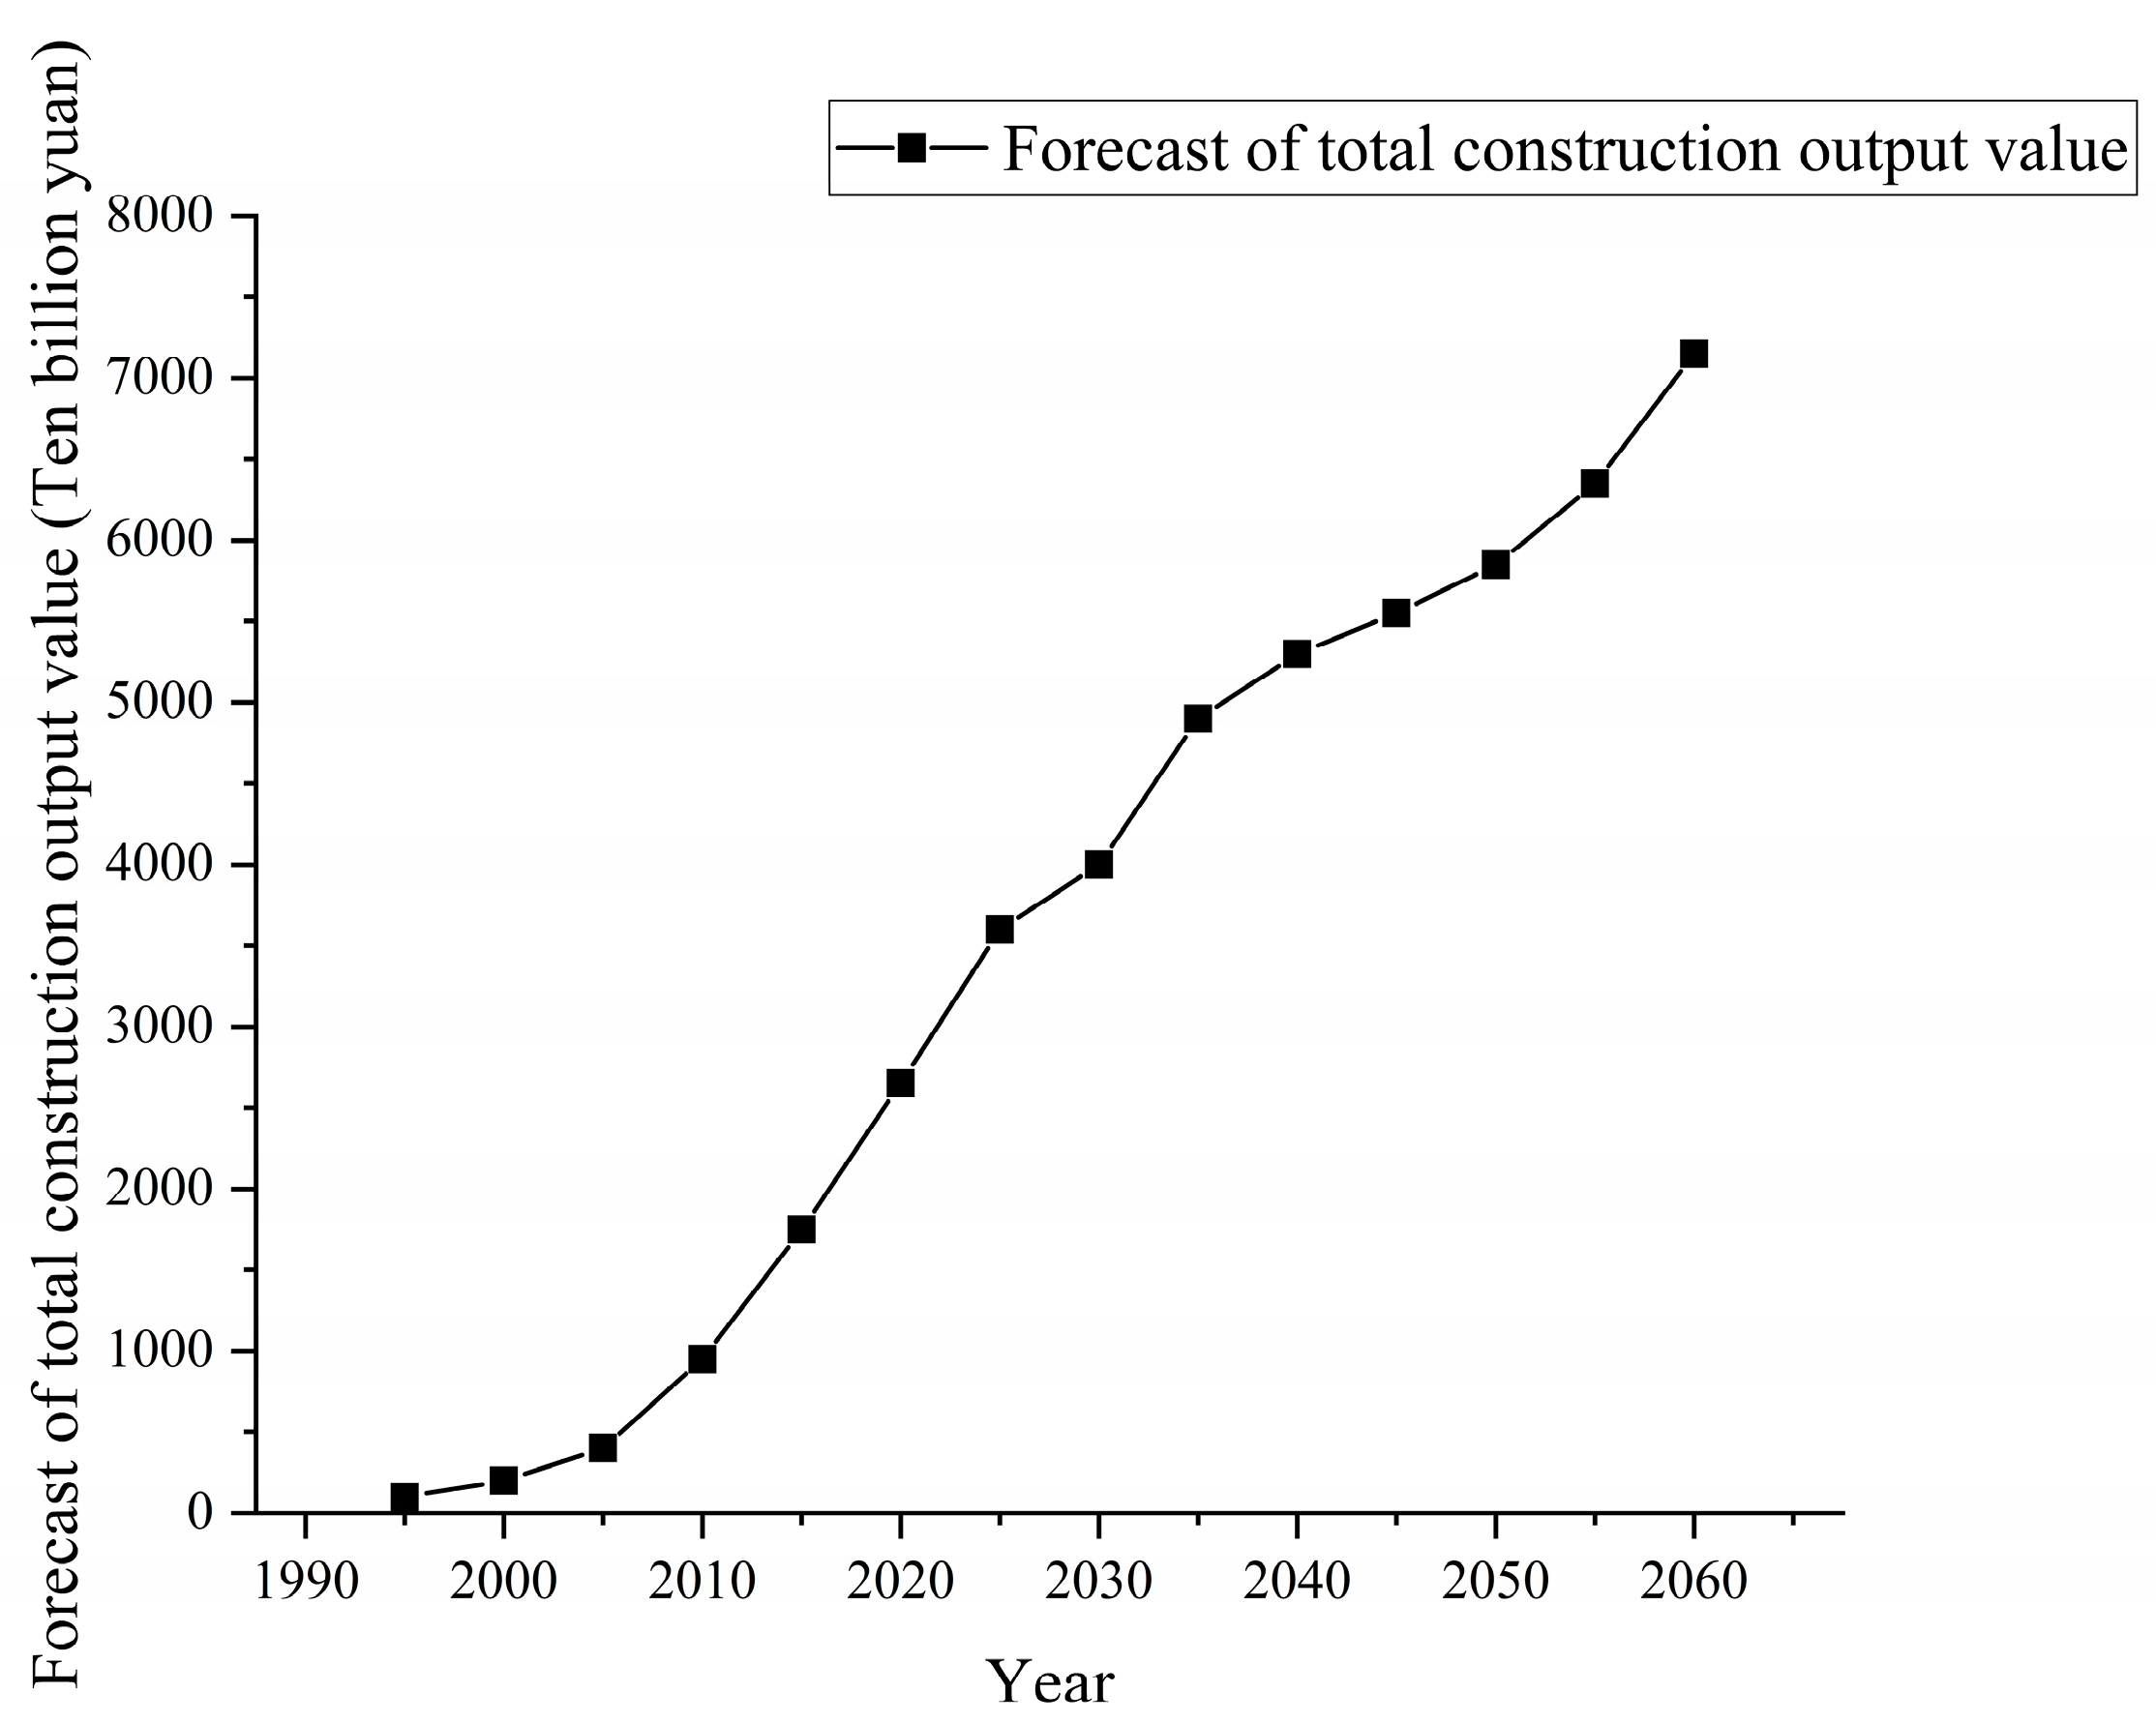
In summary, the overall national total building energy consumption shows a continuous growth trend. Building energy consumption is rapidly growing during the 2000–2030 period, with building energy consumption expected to increase sharply to 1.576 billion tce in 2030. The growth rate of building energy consumption decreases after 2030, and building energy consumption grows to 2.001 billion tce in 2060, increasing 1.27 times compared with 2030. The growth of building energy consumption has slowed in recent decades as China has vigorously promoted energy efficiency in buildings. Building energy consumption is a consumer energy consumption closely related to people’s lives. Reducing building energy consumption needs to be relevant to real life, implementing building energy efficiency standards, and fundamentally optimizing and adjusting the energy structure; From the perspective of consciousness, enhancing the people’s awareness of energy conservation. Similarly, the GM (1,1) model has good predictive power for forecasting the total construction output value. We use the historical data of China’s total construction output value from 1995 to 2019 as input values to analyze the trend of China’s total construction output value.
Figure 7 shows that the entire building sector output value has been growing at a steady rate for the following reasons: macroscopically, it is due to the fact that the new urbanization will change the construction layout of cities and build to realize the urbanization of population characterized by metropolitan areas; microscopically, the new urbanization will cause the more rural population to flock to cities and towns, leading to an increase in the demand for urban housing and public buildings. In addition, people’s demand for high-quality life is often accompanied by the improvement of urban infrastructure and the emergence of more buildings that can meet people’s living needs. Therefore, the entire building sector output value is gradually increasing.
5.2. Building Carbon Emissions Scenario Projections
This paper selects total population, GDP, total construction output, and construction energy consumption as the main factors affecting building carbon emissions. The data of these four main influencing factors will be used as the input vector of the CO2 prediction model for the construction industry, and the data are randomly selected as training samples and test samples, respectively. The prediction model is divided into two parts: the training and testing model.
5.2.1. Structural Design of Building Carbon Emission Prediction Model
When building a carbon emission neural network prediction model is established, the input layer corresponds to the number of input vectors of the prediction model. Hence, the input layer of the neural network model contains four neurons. Since the output of the prediction model is only the carbon dioxide emission in the building sector, the number of neurons in the output layer of the model is 1. The number of input layers is defined as four, and the number of output layers is 1. Calculated from Equation (2), the number of hidden layer units should be between 4 and 13. Secondly, after clarifying the relevant network parameters and activation function, combined with the number interval of hidden layer neurons obtained by empirical formula, the final number of hidden layer neurons is determined through model training.
The research data on the four influencing factors contain both historical data and future forecast data. The historical data are selected from the China Statistical Yearbook and China Construction Industry Statistical Yearbook from 1995 to 2019. The forecast data are divided into two major categories. One category is the data of population and GDP obtained by using scenario analysis for reasonable prediction considering historical trends and relevant implementation policies. The second category is the total construction output value and construction energy consumption obtained by using GM (1,1) model prediction. Based on the above research data, a neural network model of building carbon emission is established by the MATLAB R2020a platform for prediction analysis.
Table 12 shows the projected values of carbon emissions under different scenarios.
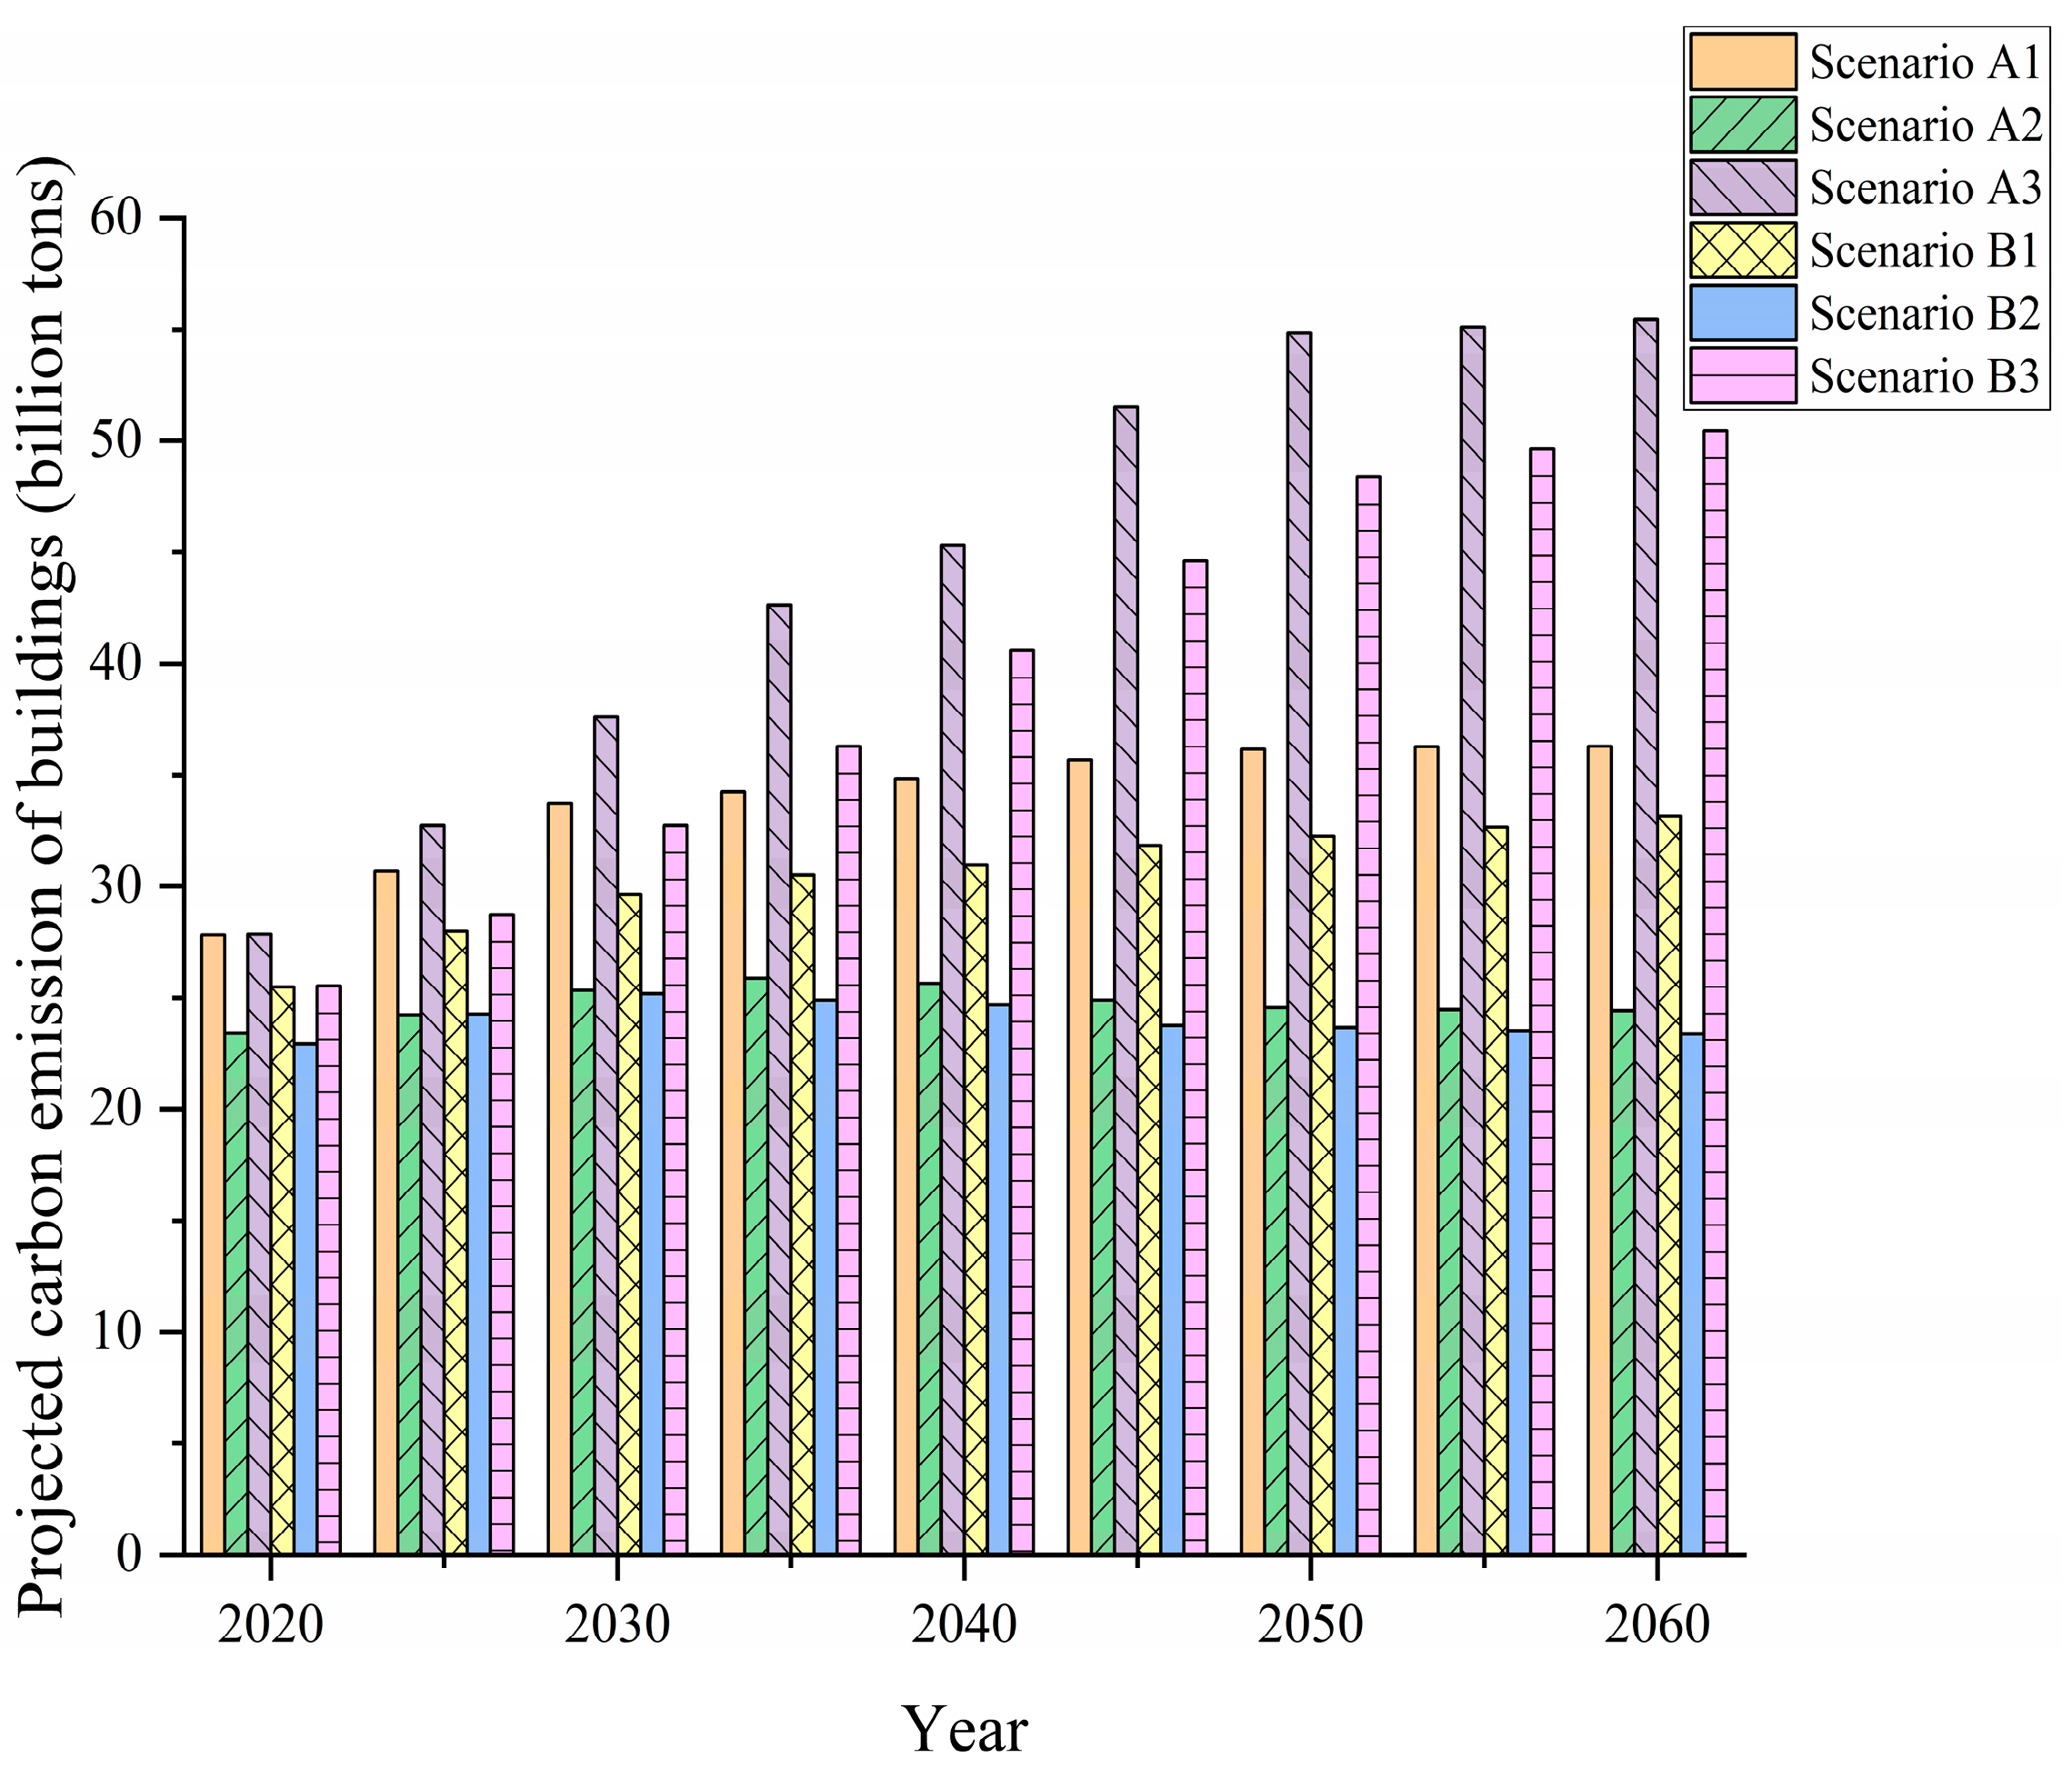
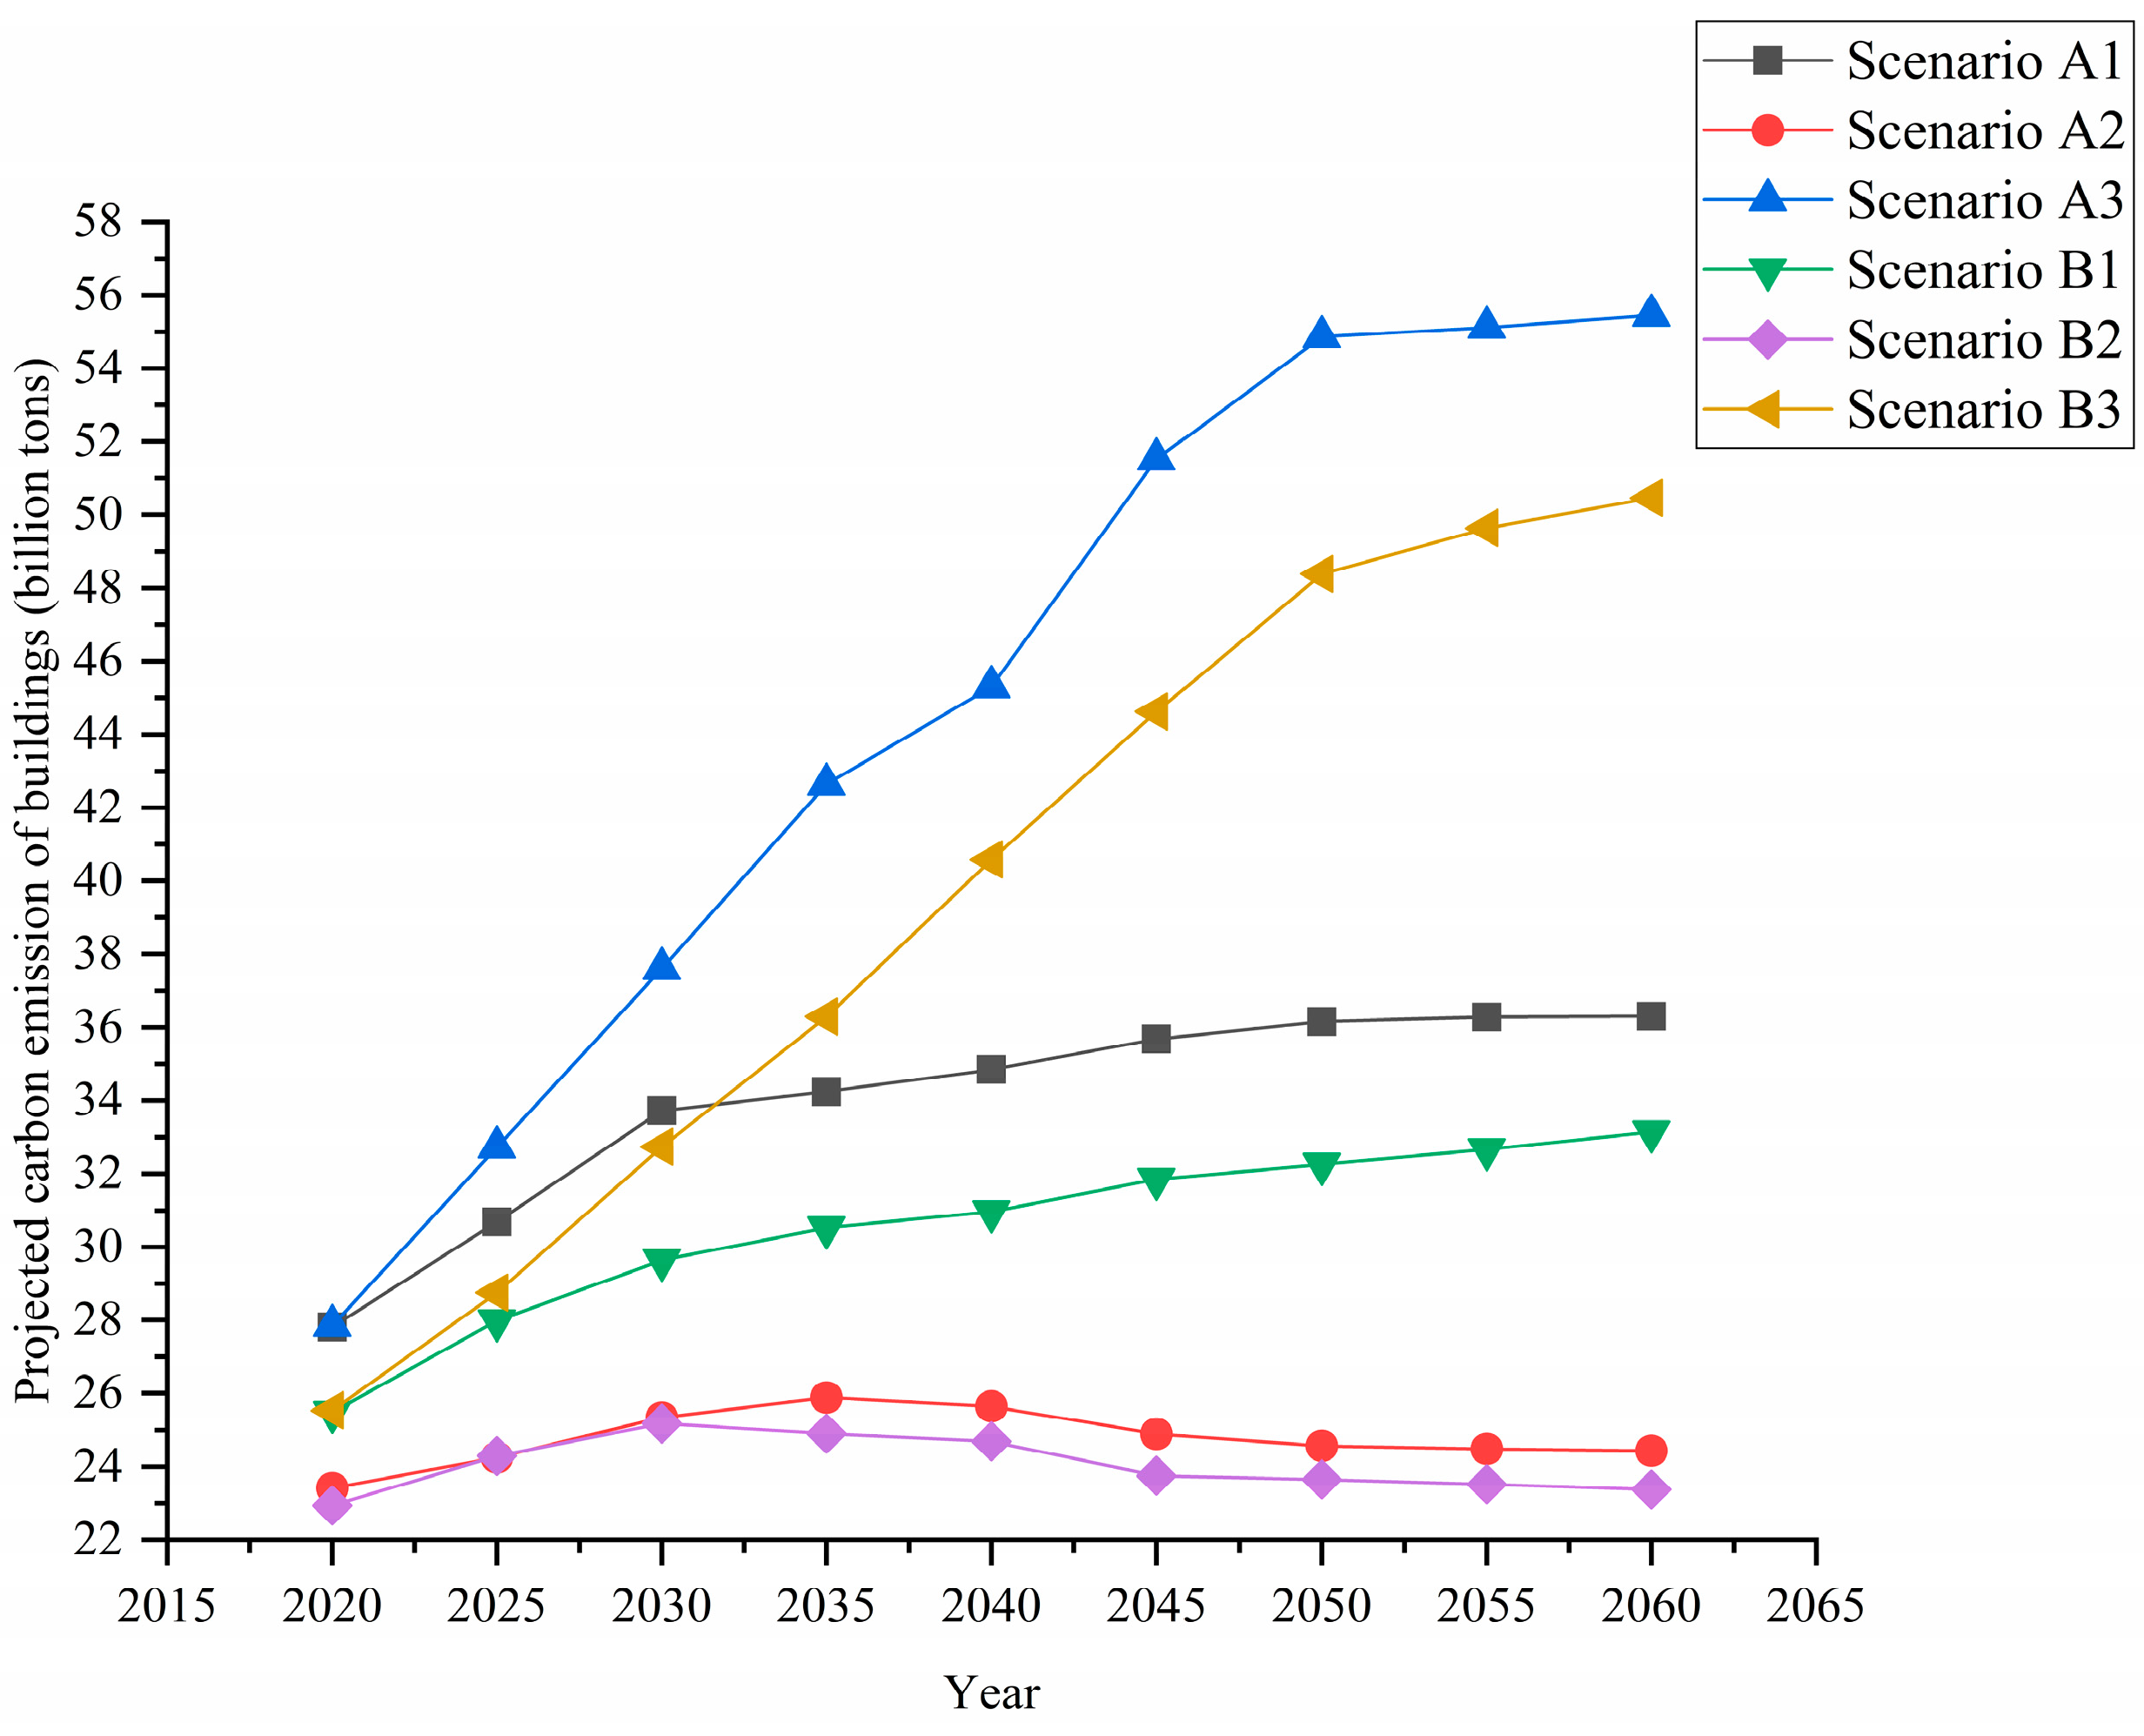
As shown in
Figure 8 and
Figure 9, the projections of carbon emissions from buildings have six types of components. Carbon emissions will keep rising sharply in scenarios A3 and B3 with the same economic growth scenario. Under the scenario A3, carbon emissions will keep rising, reaching 3.761 billion tons and 5.545 billion tons in 2030 and 2060, respectively, an increase of about 0.47 times in total. Under scenario B3, it will reach 3.274 billion tons and 5.006 billion tons in 2030 and 2060, respectively, and the total emission will represent a 0.53-fold increase. The growth trend of building carbon emissions in this scenario is similar to scenario A3. It shows that the increase in population scale contributes to the carbon emissions of buildings. Therefore, controlling population size is crucial to reducing carbon emissions. In A2 and B2 scenarios, due to improved energy structure and the promotion of clean fuels, the peak of building carbon emissions is significantly lower than in the other four scenarios. It will decline rapidly after reaching the peak, which shows that improving energy structure is an effective measure for energy saving and emission reduction.
5.2.2. Feasibility Analysis of “Carbon Peak”
Under the A1 and B1 scenarios, building carbon emissions have been growing at a low rate, unable to peak by 2030. In the A2 scenario, the peak carbon dioxide emissions will be reached by 2035, which is different from the carbon peak target, so the scenario is not in line with the carbon peak strategic objectives. Under the six scenarios, only the B2 scenario with positive economic growth and well-adjusted energy structure reaches the peak of carbon emissions in 2030. The value does not exceed the carbon emission control target. The carbon emissions gradually decrease after 2030, and the value of building carbon emissions has stabilized by the middle of this century. It fully shows that under the coordinated development of the economy, energy, and environment, we can achieve the strategic goal of reaching a carbon peak in 2030.
5.2.3. Feasibility Analysis of “Carbon Neutrality”
CO
2 emission reduction and carbon sink are two ways to achieve carbon neutrality. CO
2 emission reduction is a CO
2 capture and storage (CCUs) technology, while carbon sink is the self-recycling of CO
2 by the ecosystem, and photosynthesis is the most important way of carbon sink. According to relevant statistics, China’s carbon sink consumption from 2010–2016 was about 3.8–44 billion t. It is expected that China can recover 6 billion t of CO
2 by carbon sinks alone in 2060 [
43]. Under the B2 scenario, the construction carbon emissions reached 2.338 billion tons in 2060. The construction carbon emissions constitute over 25% of the national carbon emissions, so the 2060 carbon-neutral strategy target is achievable by adopting artificial emission reduction measures such as CCUS.


