1. Introduction
Society drives the development of new technologies for automation, processes, and systems in the most diverse sectors. Industries, cities, homes, and building installations are examples of environments with constant technological transformations. In this context, the digital paradigms of this millennium, such as Industry 4.0, Internet of things (IoT), smart grids, smart cities, and smart buildings, promote technological convergence processes by using digital integration solutions for monitoring and control of assets and inputs [
1]. In addition, through digital paradigms it is possible to optimize the assets present in these environments, promoting flexibility, scalability, dynamism, and efficiency, in addition to other socioeconomic benefits [
2].
The digital transition obtained from the implementation of these paradigms can occur abruptly or not [
3]. The implementation time and the cost of digital solutions for this are preponderant factors, because short-term transformations may require larger investments. Usually, these types of solutions promote the disposal or replacement of resources that could still be useful or with acquisition costs not fully amortized [
4]. In such cases, it is necessary to employ processes that steer the technological transition gradually through strategies based on leveraging legacy resources; otherwise, these processes would only be feasible for absolutely new solutions.
The electricity sector, indispensable for the realization of many social and economic practices, maintains much of its legacy structure from its conception [
5]. This involves performing manual processes to carry out maintenance and management of the legacy electrical systems in operation [
4]. Thus, specialized professionals are still needed in the field to perform these activities, which makes it difficult to record and access data in real time or which, occasionally, may lead to failures or field accidents. Thus, the implementation of digital paradigms provides the opportunity for the emergence of new techniques to automate electrical systems and enable energy management and efficiency. In this sense, IoT solutions can be employed in energy-efficiency strategies through the addition of real-time communication capabilities, distributed computing processing, and the control and sensing of objects through interconnection in data networks [
6,
7]. In smart grids and smart building models, in which the automation of electrical systems is widely applied, IoT solutions ensure safety, efficiency, and maximum system excellence in their operations [
8,
9,
10,
11]. However, despite the use of IoT in implementing new solutions for energy monitoring and control, there is a lack of strategies to integrate new solutions with legacy electrical systems.
The retrofit strategy, on the other hand, presents itself as a solution to this problem. Through retrofitting, it is possible to update and customize old or technologically outdated but still necessary systems, in order to preserve them and reduce costs in the addition of new functionalities in legacy systems [
12]. In addition, this strategy enables a gradual rather than an abrupt technological transition in legacy electrical systems, making the maximum use of pre-existing resources. Still, in order for retrofit to be used systemically in the upgrade and integration of legacy electrical systems with IoT solutions, it is necessary to use a reference model based on architectural definitions endowed with standardized logic layers, protocols, and interaction interfaces applied to the specificities of this particular context. However, the literature presents few works that employ retrofit techniques from reference models to standardize their implementations, especially in the electrical sector.
At [
5], the authors proposed a reference metamodel for smart grids, named SmartLVGrid. It enables the transition from a legacy passive low-voltage power distribution plant to the smart grid paradigm by using the retrofit strategy in conjunction with systems engineering concepts. SmartLVGrid is composed of protocol stacks that enable the integration of legacy structures with compatible middleware (hardware and firmware). In addition, these protocols specify how to realize the logical link (interoperability) of the developed middlewares with a supervision and control center.
Interoperability, scalability, flexibility, and system efficiency are some of the essential aspects to make energy management in the electricity sector viable, developed, and mature [
13]. However, the SmartLVGrid metamodel does not address methods or resources that advocate data analysis for real-time energy management, including virtualization and integration of legacy systems with IoT solutions and computational tools such as cloud computing, dashboards, and databases, for example. With data presented centrally in the cloud, it is possible to use virtual environments to manage energy consumption more effectively [
14]. From this, we proposed a new method for managing low-voltage legacy circuits based on the adaptation of the SmartLVGrid metamodel and the use of the retrofit strategy. This way, we were able to make the most of pre-existing resources, in addition to providing technological means to analyze energy efficiency by monitoring electrical parameters with interactive dashboards in cloud software applications. In this context, no studies were found in the literature that carried out investigations or practical implementations of strategies, including a reference model and the use of retrofit, as the authors in [
5] found, to perform energy management in the proposed way.
In this article, we present a strategy, which employs IoT solutions, retrofit of legacy electrical systems and cloud-resident applications, for real-time monitoring of legacy electrical parameters and energy management. As a proof of concept, the proposed strategy was used to insert energy-monitoring resources in building circuits of a low-voltage power distribution board. To implement remote monitoring, we developed embedded hardware platforms and, respectively, their firmware, in order to implement the middleware and interoperability layers of our adaptation of the SmartLVGrid metamodel, but adapted to meet the circuits of the switchboard in use. Throughout this article, the details of the software applications and platforms developed are described, at the physical and architectural levels, with the necessary information to make it possible to use the same methodology in the implementation of new solutions and guarantee the insertion of new functionalities, preserving as much as possible the legacy infrastructures. In this sense, we raise the following contributions related to this work.
- (1)
We introduce energy monitoring through the adaptation of the SmartLVGrid metamodel, use of IoT solutions, and the use of the retrofit strategy in a systemic way, enabling energy management and maximum preservation of legacy electric circuits.
- (2)
We develop hardware devices and their respective firmware, enabling the retrofit of the circuits of a distribution board, based on the premises of the reference model.
- (3)
We develop a software application for circuit virtualization, with dashboards, database and cloud computing resources, systematically integrated with the implementation of the metamodel adapted in this work.
- (4)
We present the resources for monitoring the electrical quantities of each legacy circuit of a low voltage building switchboard.
To present the proposal of this article, we divided the sections as follows. In
Section 2, we present a survey of the state of the art related to the theme. In
Section 3, we present a survey of the theoretical framework for the implementation of our proposal.
Section 4 presents our model proposal, based on the retrofit of legacy low-voltage circuits of a power distribution board. In
Section 5, we present the materials and methods used, making them compatible with the architecture exposed in the previous section. In
Section 6, we present the results obtained. In
Section 7, we present the conclusions, along with proposals for future work.
3. SmartLVGrid
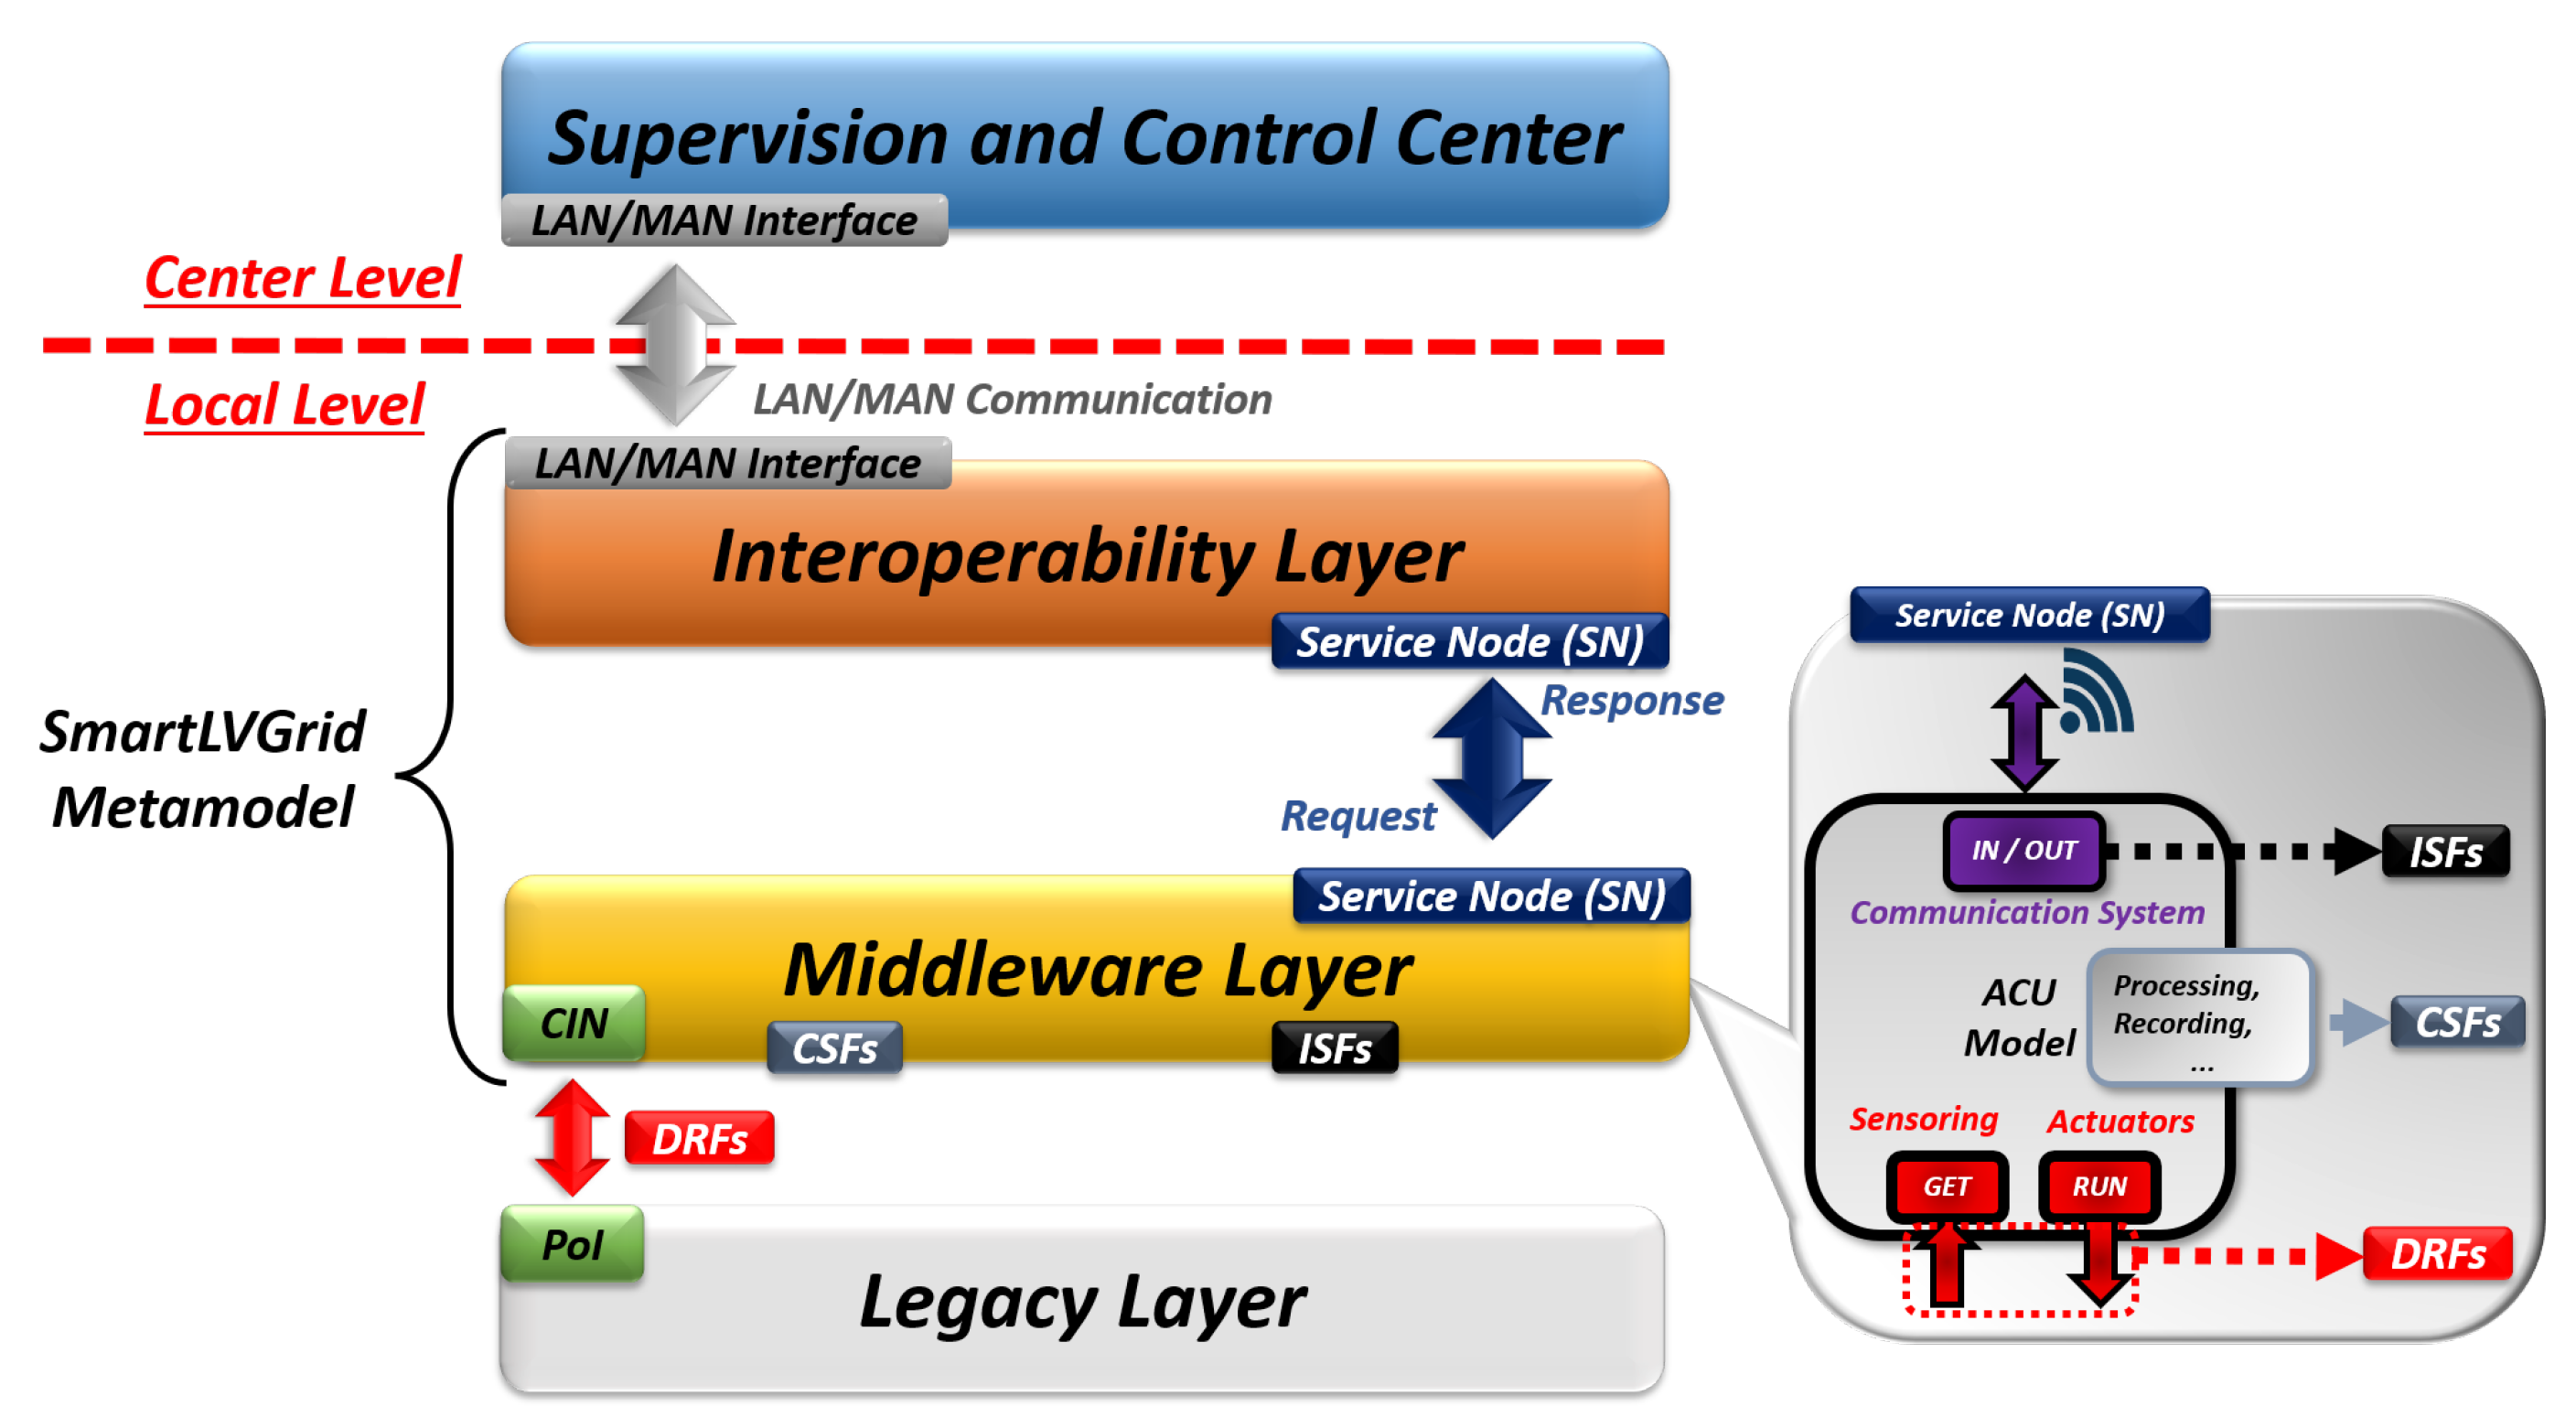
Smart low-voltage grids (SmartLVGrid) is a metamodel for modeling legacy low-voltage circuits in power distribution systems based on the smart grid paradigm. It consists of a protocol stack and uses a retrofit strategy to add control, monitoring, and communication capabilities to pre-existing systems. This model is structured both at the local level, close to the final consumer, and at the central level, in the supervisory centers of the energy utilities. The geographical separation of these levels requires the use of local area network interfaces (LANs) or metropolitan area network interfaces (MANs) to establish logical links between the legacy systems and the operation and command centers.
Figure 1 illustrates the protocol stack established in the SmartLVGrid model.
As per
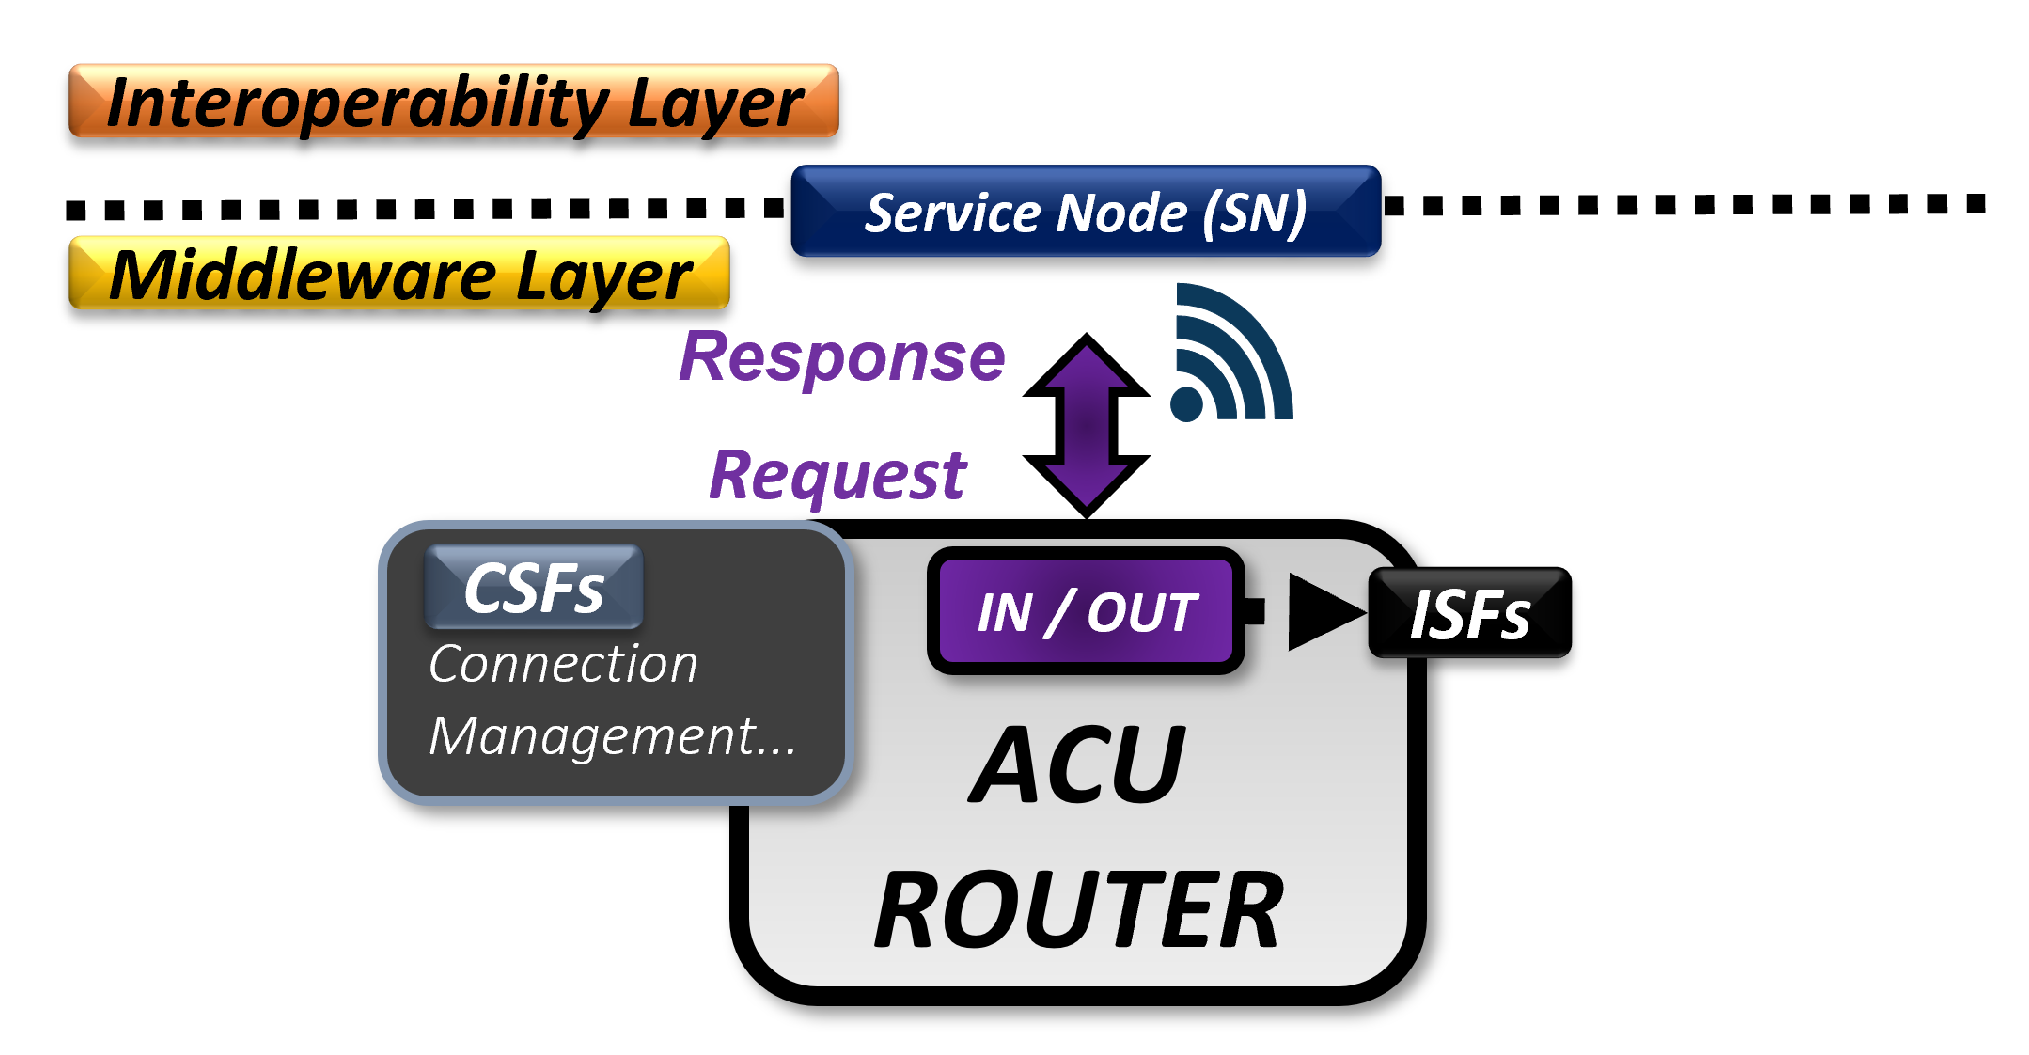
Figure 1, the SmartLVGrid metamodel is composed of the interoperability and middleware layers. According to the metamodel, the retrofit is performed under the legacy structure at interface points called points of interface (PoI). The middleware layer interfaces with the legacy layer through the coupling and interaction node (CIN), allowing the execution of microprocesses called domain retrofitting functions (DRFs), one of the classes of operational primitives (OPs) of the metamodel.
The OPs are processes previously performed by field operators in the legacy electrical system that are now executed through service nodes (SNs) and CIN nodes, logical units responsible for the interfaces between the interoperability/middleware and middleware/legacy layers, respectively. The computational support functions (CSFs) implement processing and storage services in the middleware layer, and the interdomain support functions (ISFs) perform the communication processes in the same layer.
3.1. A Middleware Layer
The middleware layer is at the lowest level of the stack of the metamodel. Physically, this layer is implemented by means of retrofit devices, composed of embedded hardware, sensors, and actuators compatible with the DRFs to be executed. This layer is also called automation and communication unit (ACU), and its representation is illustrated in
Figure 1. The representative model of the ACU consists of three ports: In/Out, Get, and Run. The communication processes and services of the ISFs are executed through the In/Out port. The Get port implements data collection by means of measurement and sensing DRFs. Finally, the Run port acts with control DRFs over the legacy layer. It should be noted that the ACU’s processing and data storage routines are implemented through CSFs, as well as other computational support functions.
3.2. The Interoperability Layer
The interoperability layer is responsible for guaranteeing a set of rules and hierarchies and represents the infrastructure to implement network communication with the ACUs, aiming to interact remotely with these devices and use their functionalities. This layer classifies each ACU according to its position in the SmartLVGrid metamodel hierarchy. ACUs that supervise and monitor other ACUs and optionally run DRFs are called coordinators. ACUs that run DRFs on top of the legacy layer and are supervised by coordinators are called operators. In cases of expansion of the operating power system, which implies more computational capacity for the coordinator ACU, the metamodel provides subcoordinators for each cluster of operator ACUs. In this way, the subcoordinators will be associated with a single ACU coordinator that will communicate with the supervision and control center to pass on information about the system. It is important to note that each ACU has its own processing unit, enabling the distributed processing of the system from the retrofit of each legacy asset.
The supervision and control center retains all control and monitoring of the system from the communication with all coordinators present in the power grid. Other functions are the administration of the consumer units, distribution busbars and transformer stations. It is up to the technical–administrative staff of the supervision center to delimit the DRFs and autonomous decision-making to be performed by the retrofit devices.
4. Methodology for Implementing the Proposed System
SmartLVGrid was initially designed to be used in conjunction with low-voltage consumer units and their interfaces with the legacy electrical system [
5]. However, in [
1], the authors presented a model based on the retrofit of a legacy building lighting circuit, showing the feasibility of adapting SmartLVGrid for smart buildings. In this sense, the present work contributes by extending the SmartLVGrid model and using the retrofit method for a new load profile: the legacy electrical circuits of a power distribution board. The term legacy, in this case, refers to the fact that, previously, the circuits did not have any element that provided the execution of interoperability, control, or remote monitoring functionalities.
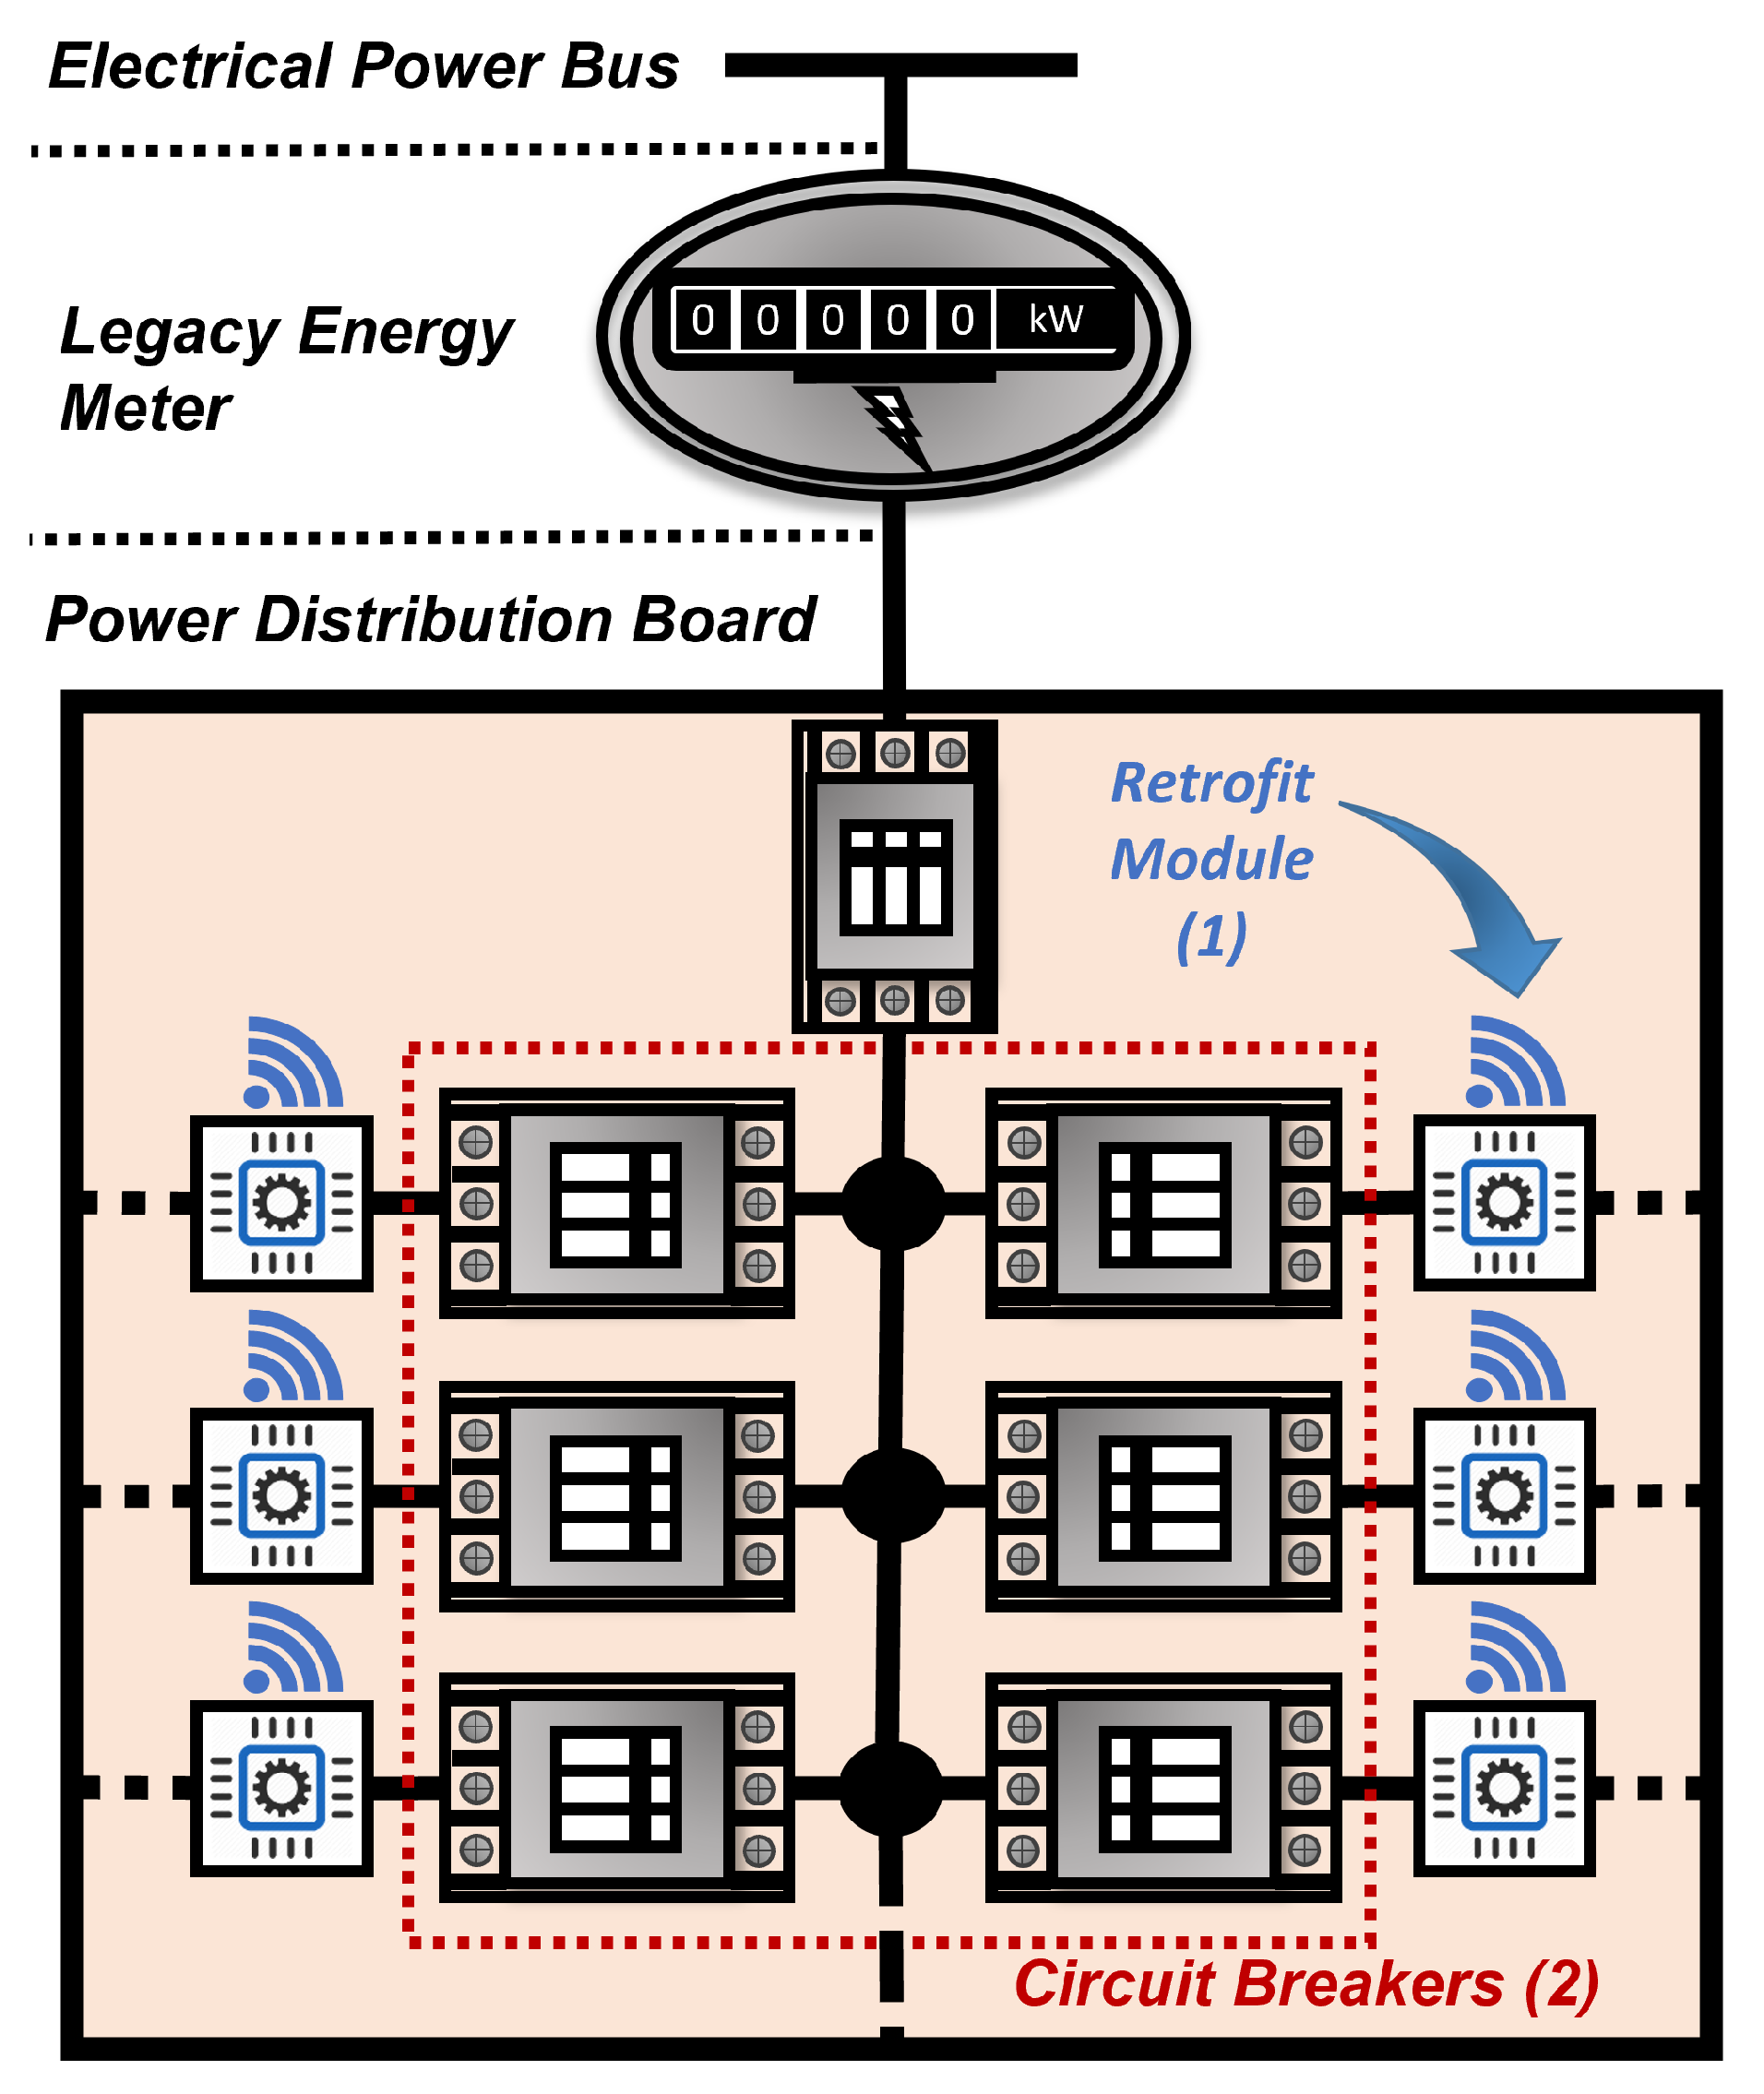
Figure 2 illustrates the retrofit strategy developed.
As illustrated, the strategy proposed in this work promotes the insertion of retrofit modules (1) consisting of specific hardware and firmware for network communication, processing, data storage, and for the acquisition of the electrical parameters of each circuit of the switchboard. It should be noted that the retrofit modules (1) are calibrated with a precision current and voltage source before being installed in the circuits. These modules (1) have been inserted next to the circuit breakers (2) of the power distribution board in order to
standardize the development and installation of retrofit modules;
reduce visual impacts by confining the solution within the switch cabinet;
standardize the development and installation of retrofit modules; and
preserve as much as possible the existing electrical installation
In this way, the disposal or removal of any element present in the circuit (cables, walls, socket points, circuit breakers, among others) was avoided. After retrofitting the circuits of the switchboard, it was possible to supervise them from a supervision and control center. In this work, the supervisory center is located in a cloud for accessing the monitored parameters from anywhere. In addition, the supervisory center was designed to provide energy management resources in real time, enabling the analysis of active demand consumed and other electrical quantities, such as voltages, currents, and power factor. It is noteworthy that the literature has not presented works with this approach, involving the extension and use of metamodels and retrofit techniques for this purpose. The tests of the proposal and the validation of the results were obtained from the integration of the retrofit modules with the supervisory center, through which it was possible to monitor, individually, each circuit and its respective electrical parameters and events.
The following section presents the modeling performed to extend the SmartLVGrid model and the conception of our proposal. Based on this modeling, it is possible to understand in more detail the hardware and software elements conceived for the development of our proposal and the adaptations made to the SmartLVGrid metamodel for the insertion of monitoring resources in the legacy building circuits of a distribution board.
4.1. SmartLVGrid Metamodel Adapted to the Proposed System
To insert a new load profile into the context of the SmartLVGrid metamodel, we extended the middleware and interoperability layers of this metamodel, creating the necessary interfaces to the switchboard circuits. These adaptations were made starting with the specifications of the operational primitives and the composition of the ACUs to be used. This also involves the methods for integrating the physical interfaces of the ACUs with the legacy switchboard circuits, detailed in the next section. In addition, the supervisory and control center was implemented by using cloud services with dashboards and databases, premises not explored by the original metamodel.
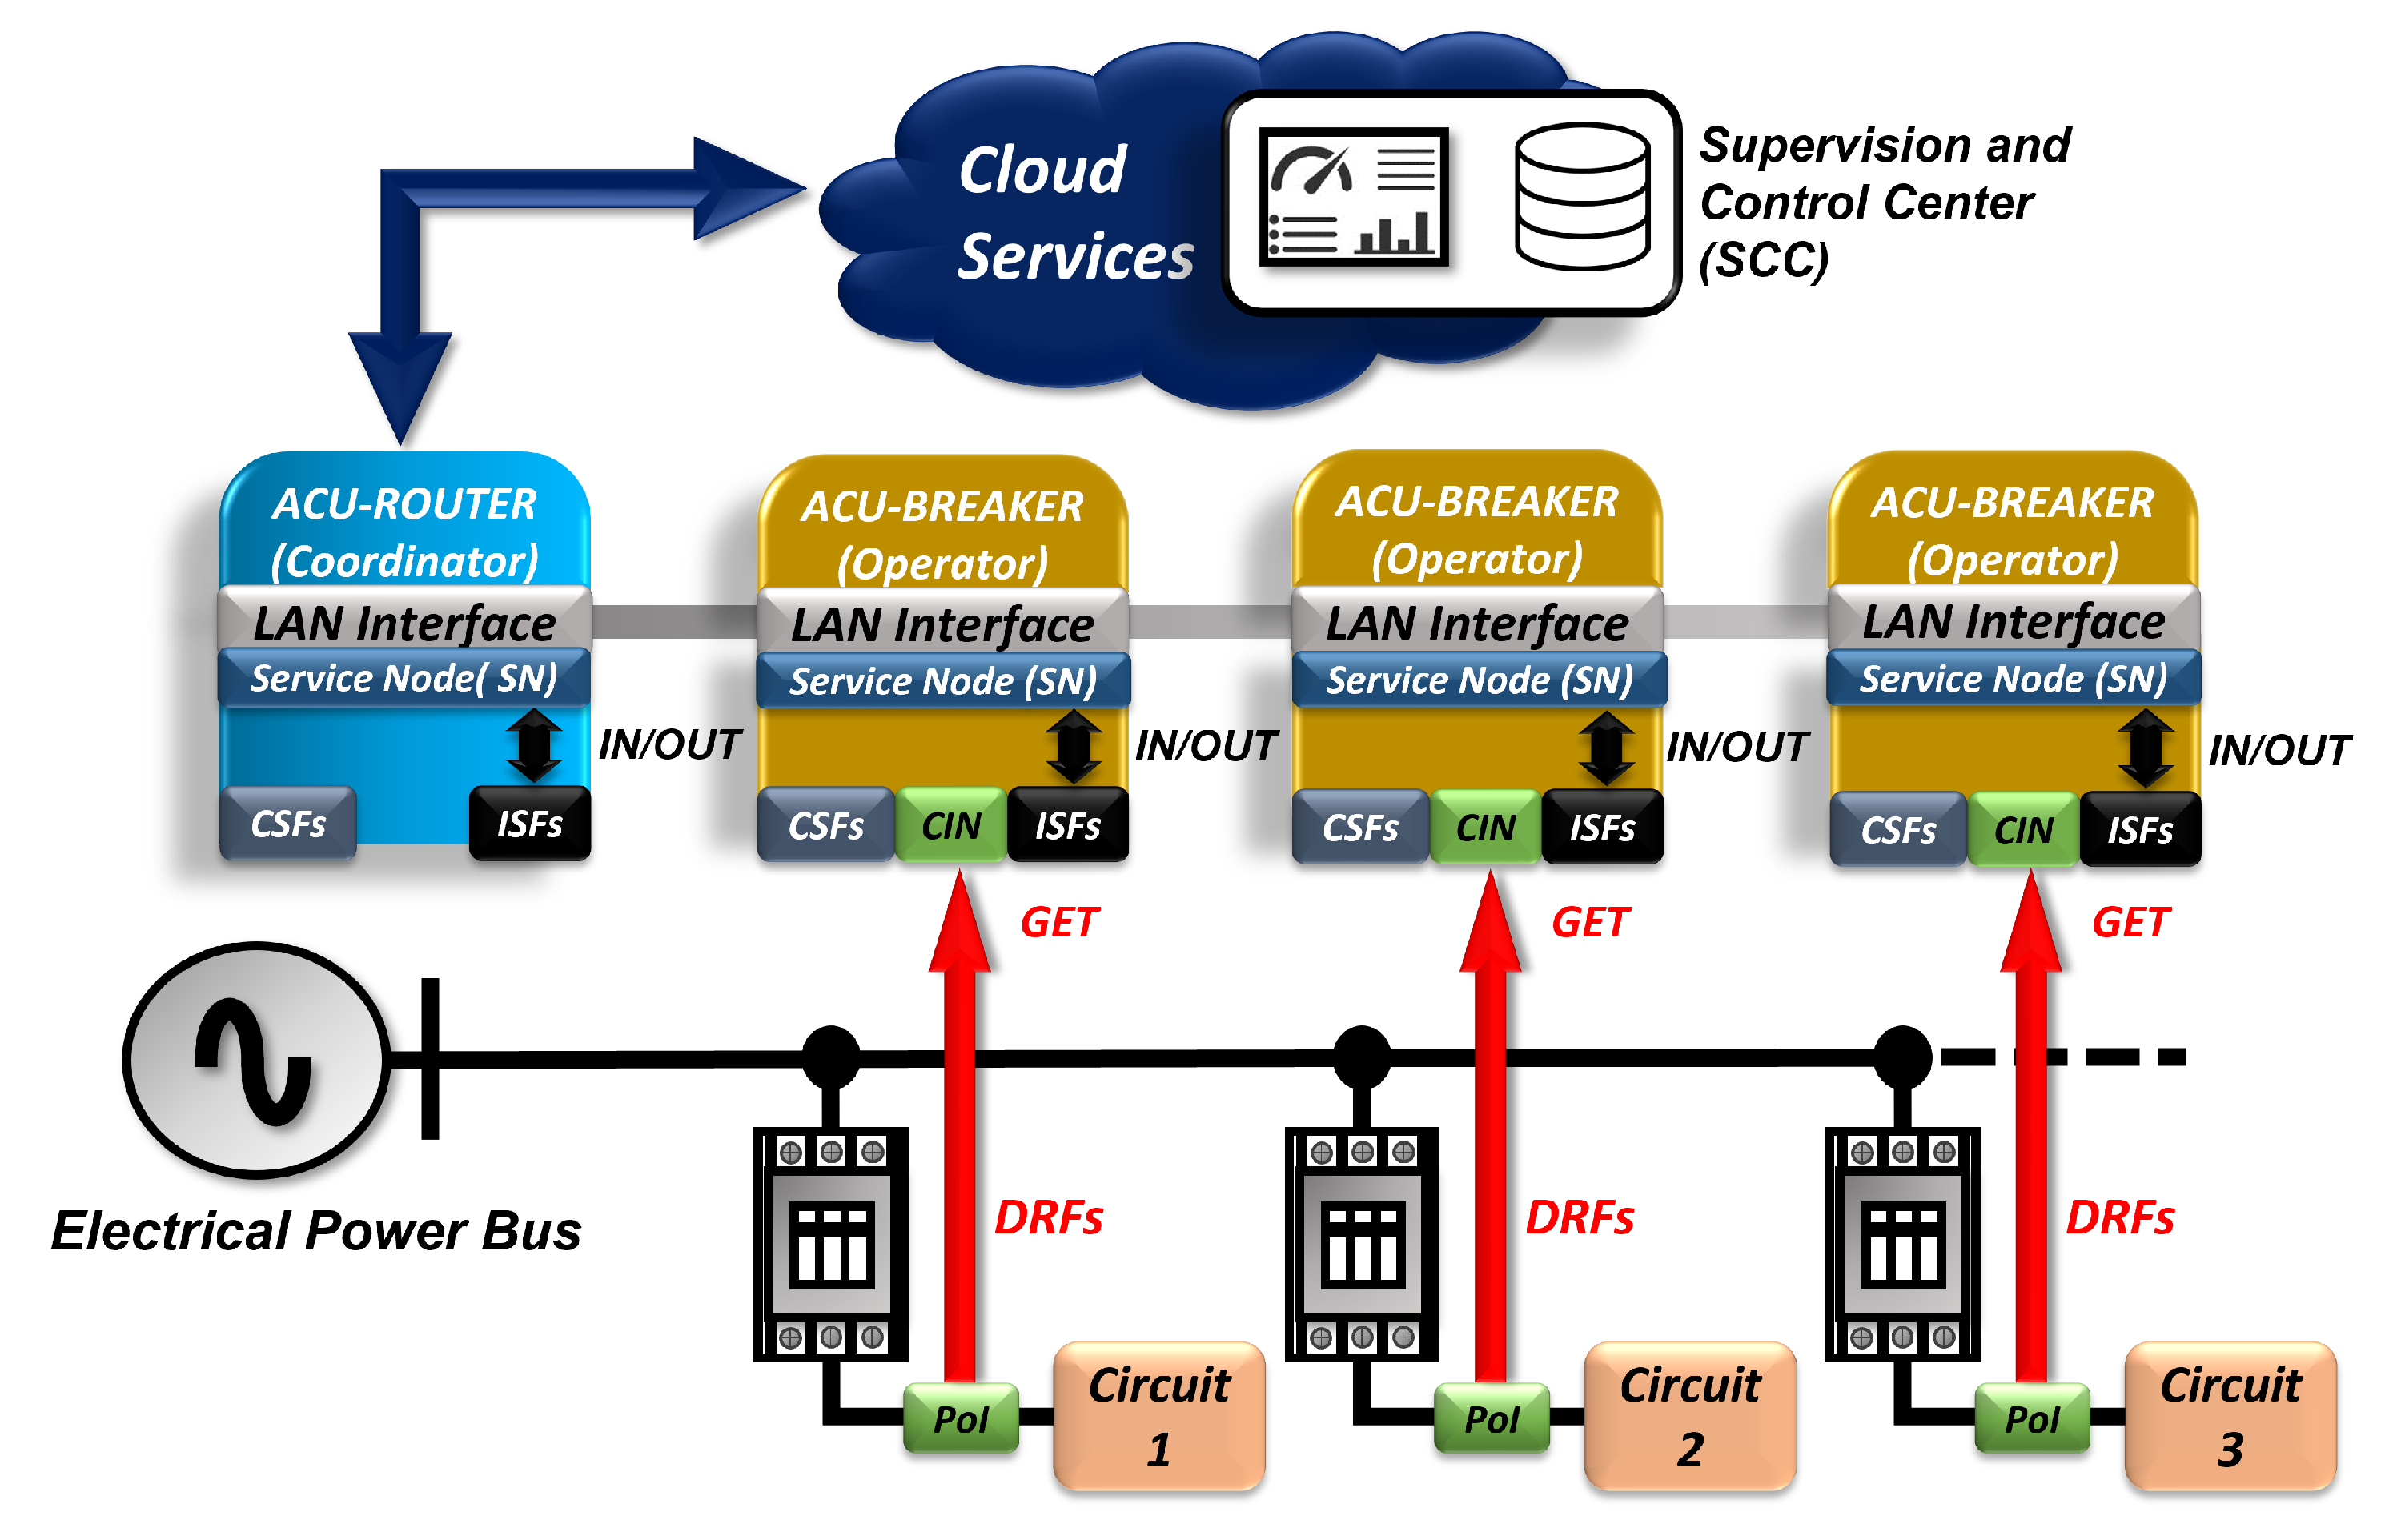
Figure 3 illustrates the interfaces adapted from the SmartLVGrid metamodel for the proposal of this paper, along with the integration with the supervision and control center (SCC).
In this paper, retrofit modules for measuring electrical parameters act as ACU operators in the system. They were called ACU-BREAKERs, because they are located next to the circuit breakers of the legacy circuits. In addition, the proposed implementation relies on a router to communicate and interface with the cloud services responsible for housing the dashboard and database. Therefore, in the proposed architecture, this device has been classified as an ACU coordinator, and is referred to as ACU-ROUTER.
Figure 3 illustrates the interoperability between the ACUs over the local area network (LAN) interface. The ACU-ROUTER, in the role of coordinator, communicates with the supervisory and control center (SCC), which, in this paper, is located in the cloud next to the other computational services for visualizations and data processing in the context of energy efficiency and power quality. With the ACUs interconnected, each circuit can be virtualized by the SCC in order to individually organize the parameters obtained by each circuit. It should be noted that the interface point is located between the circuit breaker and the electrical circuit, from where the Get port extracts the measurement data up to the CIN. In this case, the service nodes act as the interface of the available communication media with the LAN network, providing the data and access paths for this (TCP ports, IP addresses, SSID, among others). The following subsection presents a brief description of the architecture of each ACU developed in our proposal.
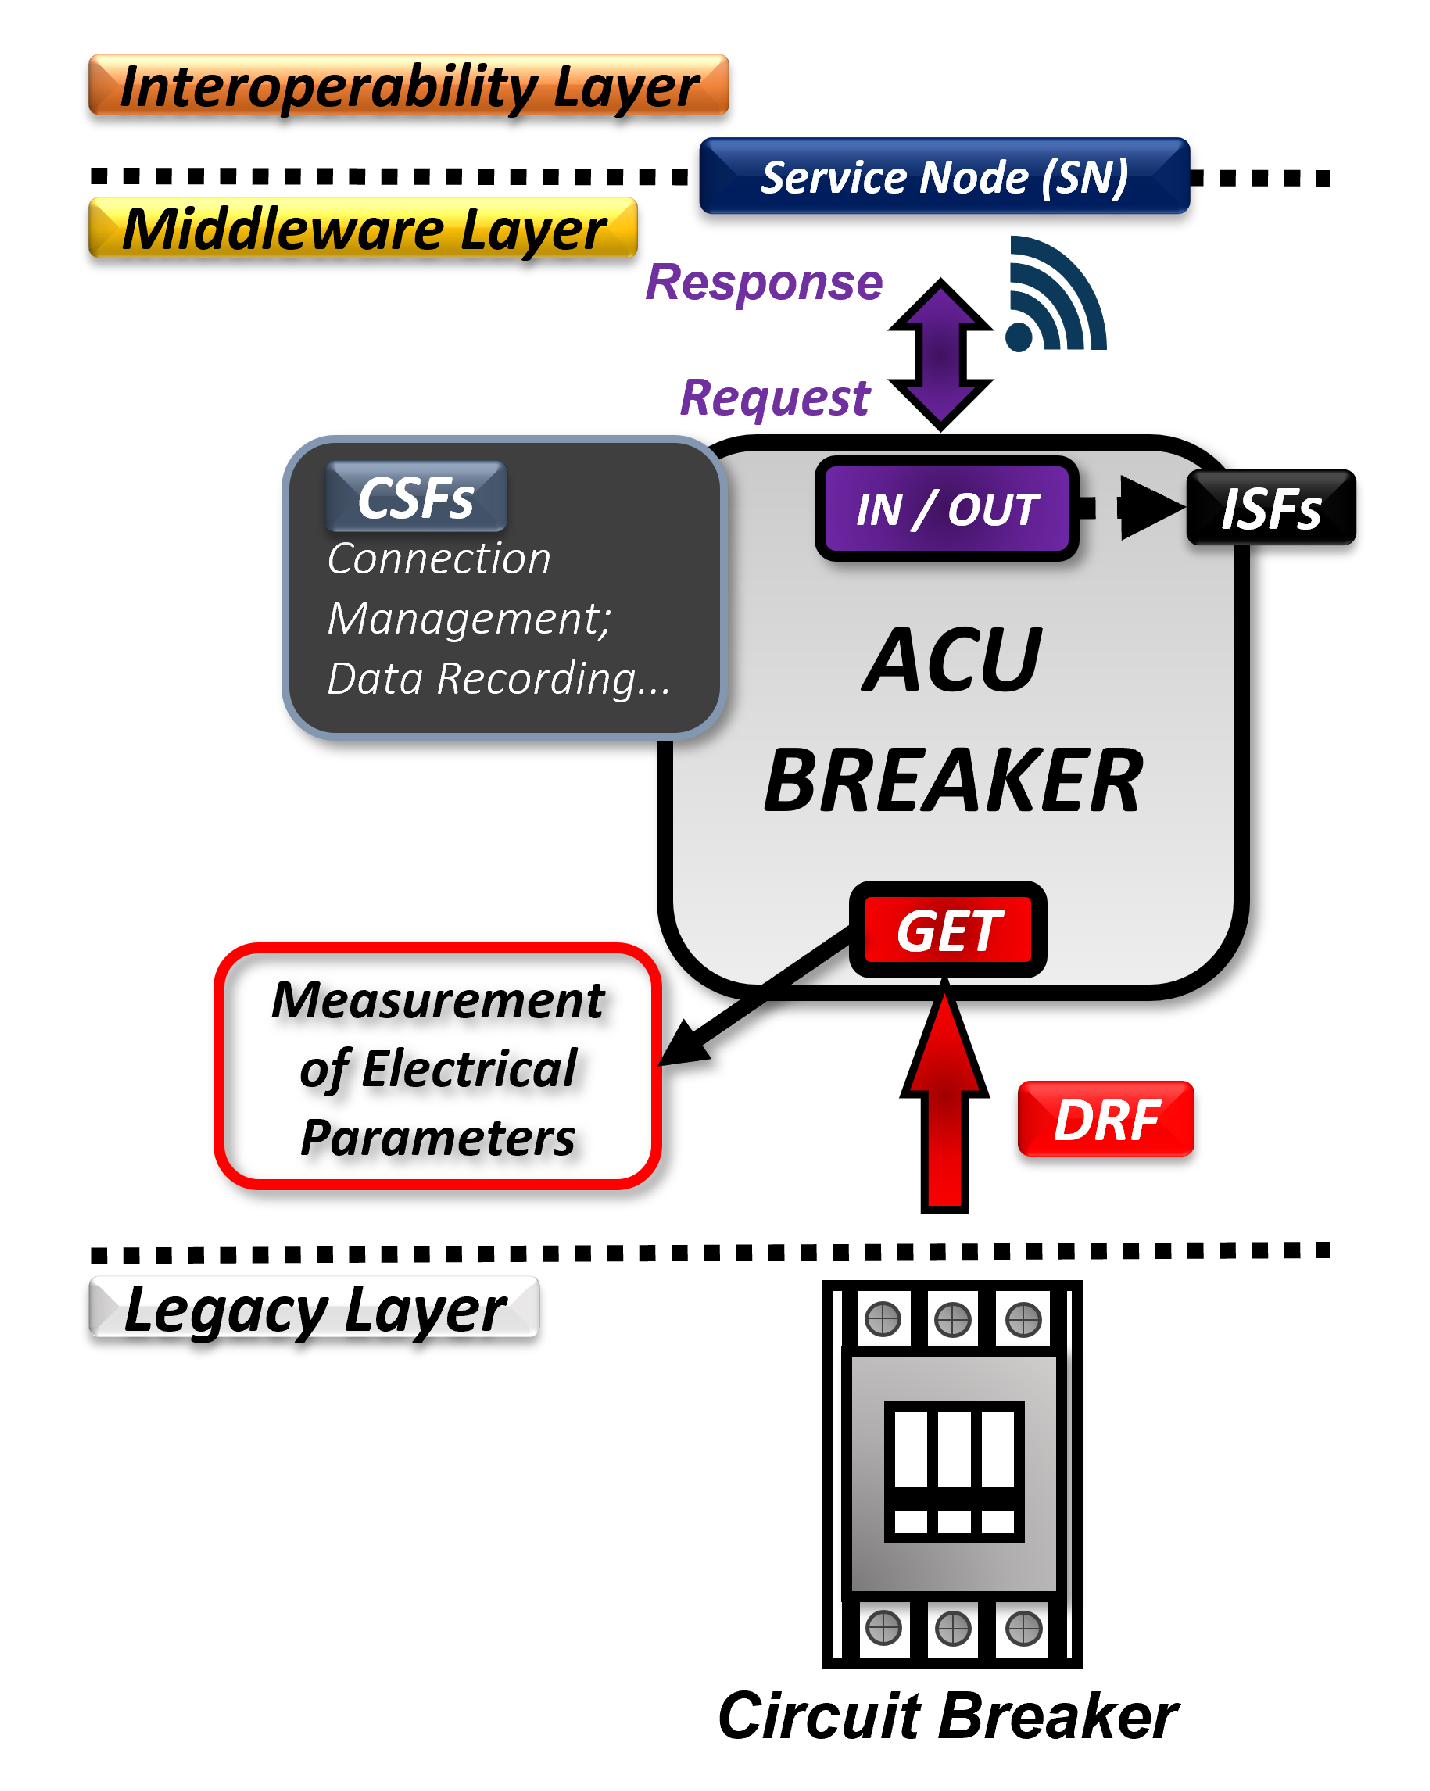
4.1.1. ACU-BREAKER Modeling
Figure 4 exposes the architecture diagram of the ACU-BREAKER and its interfaces. As mentioned, this ACU is responsible for collecting the electrical parameters of the legacy circuit associated with its respective breaker. The measurement of the electrical parameters, according to the SmartLVGrid metamodel, is characterized as a DRF executed by the Get port of this ACU. Similarly, the communication of this ACU is done through the In/Out port, responsible for executing the ISFs of requests and responses to the ACU coordinator (ACU-ROUTER). Moreover, the ACU-BREAKER has CSFs associated with data storage, device configuration, and network connection management. To perform the abovementioned operational primitives, it should be noted that this ACU has digital processing resources for acquisition and adjustments of the measured electrical parameters, communication, transduction, and conditioning of electrical signals, and also protection against possible overcurrent and overvoltage surges.
4.1.2. ACU-ROUTER Modeling
Similarly,
Figure 5 illustrates the ACU-ROUTER architecture diagram and its respective interfaces. Although this ACU does not have interfaces with the legacy layer and does not have Get and Run ports for DRF execution, it plays an important role in the proposed system. Through it, it is possible to interface the ACU operators, responsible for measuring the electrical parameters, with the supervisory control center (SCC), which is located in the cloud. The ACU-ROUTER/SCC interface is also performed through In/Out ports, by means of ISFs associated with request and response messages. Regarding CSF, the ACU-ROUTER performs the connection management of the ACU operators on the data network used.
5. Materials and Specifications for System Implementation
This section presents the strategies used to develop the middleware and interoperability layers and the supervision and control center (SCC) of the monitoring system in this paper. To this end, the software features, message exchange patterns, and hardware and firmware specifications of the retrofit modules will be defined, according to the specifications of our proposal.
5.1. Definition of the System Interoperability Layer
Because our proposal is based on retrofit, we reused existing network and infrastructure resources in the scenario used for the case study. In this sense, to provide network interconnection for the ACUs, we reused the wi-fi network infrastructure available in the vicinity of the power distribution board and jointly employed the MQTT communication protocol. From this, we established the premises to enable interoperability with the ACU devices in our proposal.
We used the Mosquitto MQTT broker running on a cloud-resident virtual machine (DigitalOcean Droplet), along with the applications and software services of the SCC. The packets were transmitted in the system with QoS 0, to reduce the latency of the data exchange between the ACUs and the broker [
53,
54]. The virtual machine’s IP address and TCP port 1883 were used to provide access to the MQTT broker. This address and port was passed to the firmware for networking the ACUs via messages presented later in the paper. Thus, the service nodes (SNs) recommended in the metamodel were implemented with the establishment of the network connection of the ACUs to the MQTT broker. It is important to mention that in order to have interoperability between the ACU-ROUTER and ACU-BREAKER middleware, the In/Out ports and the SNs must use the same standard and communication network.
To enable interoperability between ACUs via Wi-Fi LAN and the MQTT protocol, we used request and response messages in JSON format, implemented via the cJSON library [
55]. Because the SCC is hosted in the cloud, its connection to the ACU-ROUTER takes place via the Internet. The MQTT messages were transmitted in the SCC/ACUs direction and the responses transmitted in the opposite direction. In this context, messages were used for electrical parameter requests, updating device network registration, and updating device calibration parameters.
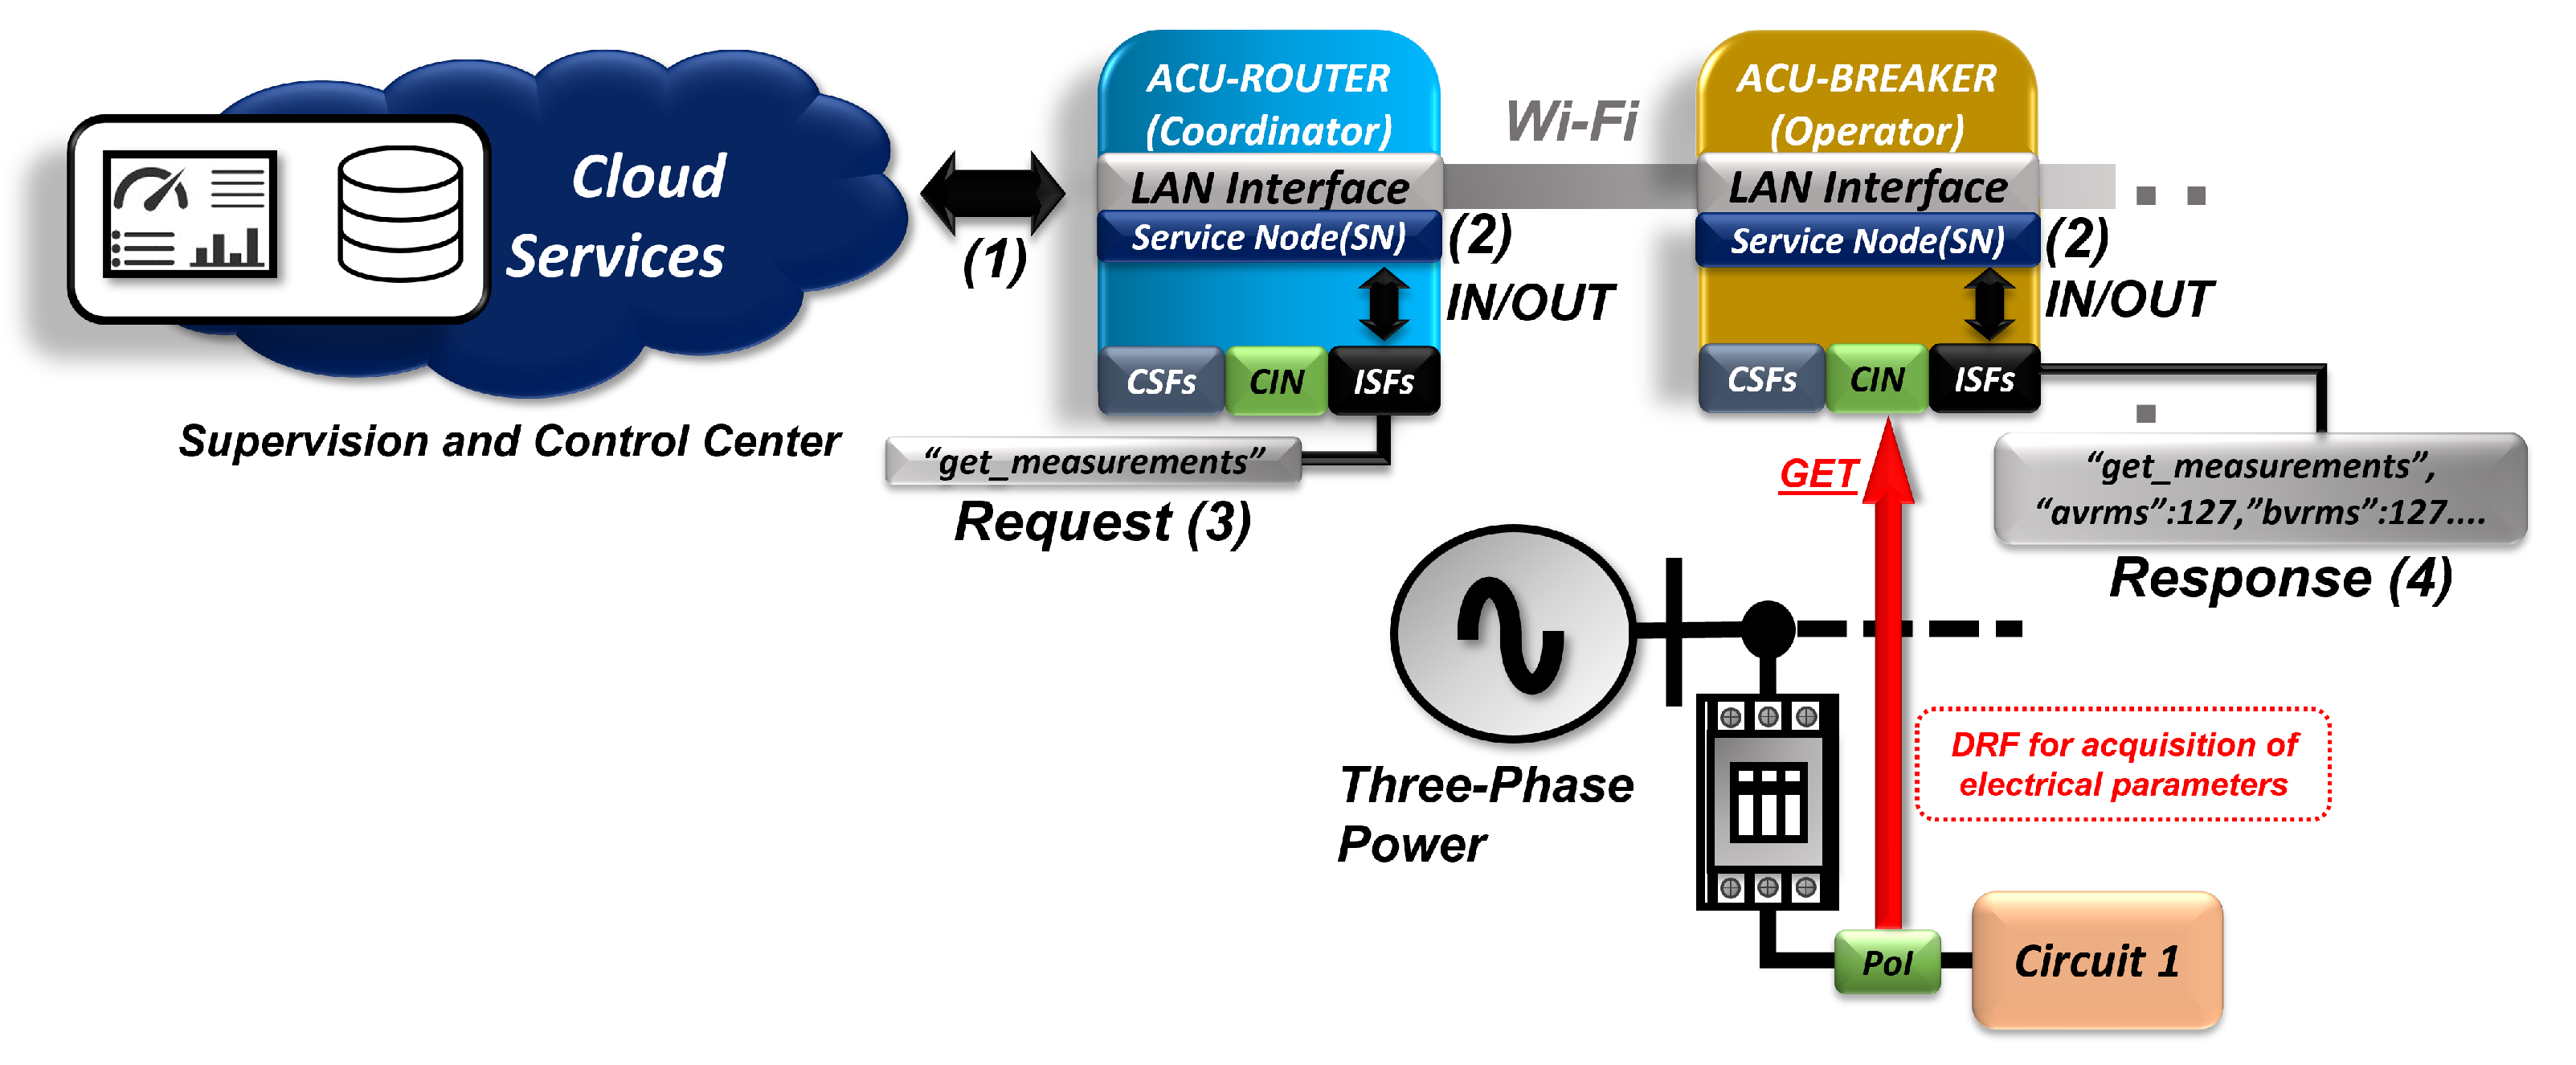
Figure 6 illustrates the process adopted to enable the communication of the ACUs with the cloud-hosted SCC, according to the proposed architecture, for a request to send electrical parameters as follows:
The SCC, via the Internet, establishes communication with the Wi-Fi LAN interface of the ACU-ROUTER and ACU-BREAKER (1);
The configuration of the service nodes (SNs) of the ACU-ROUTER and ACU-BREAKER is performed (2);
The request message (3) is transmitted;
By means of MQTT messages, the ISFs for synchronizing communication and sending data from the ACUs (4) are executed.
5.2. Implementation of ACU-BREAKER Middleware
The conception of the ACU-BREAKER was based on the development of a hardware device, and respective firmware, to monitor the electrical parameters in real time of a three-phase circuit located in a power distribution board, being possible to use it to monitor two-phase or single-phase circuits. To monitor the switchboard circuits through the retrofit strategy recommended in the proposed system architecture, we designed a panel containing six ACUs-BREAKER, power supplies, and battery backup for continuous operation in cases of power interruption. In this way, it is possible to detect power interruption or voltage and current variation events in cases of re-energization of the monitored circuits.
Each ACU panel was installed next to six circuit breakers in the switchboard. Thus, for 48 circuits present in the electrical panel, eight panels containing six ACUs each were developed. The ACU-BREAKER was designed with reduced dimensions in order to facilitate its installation.
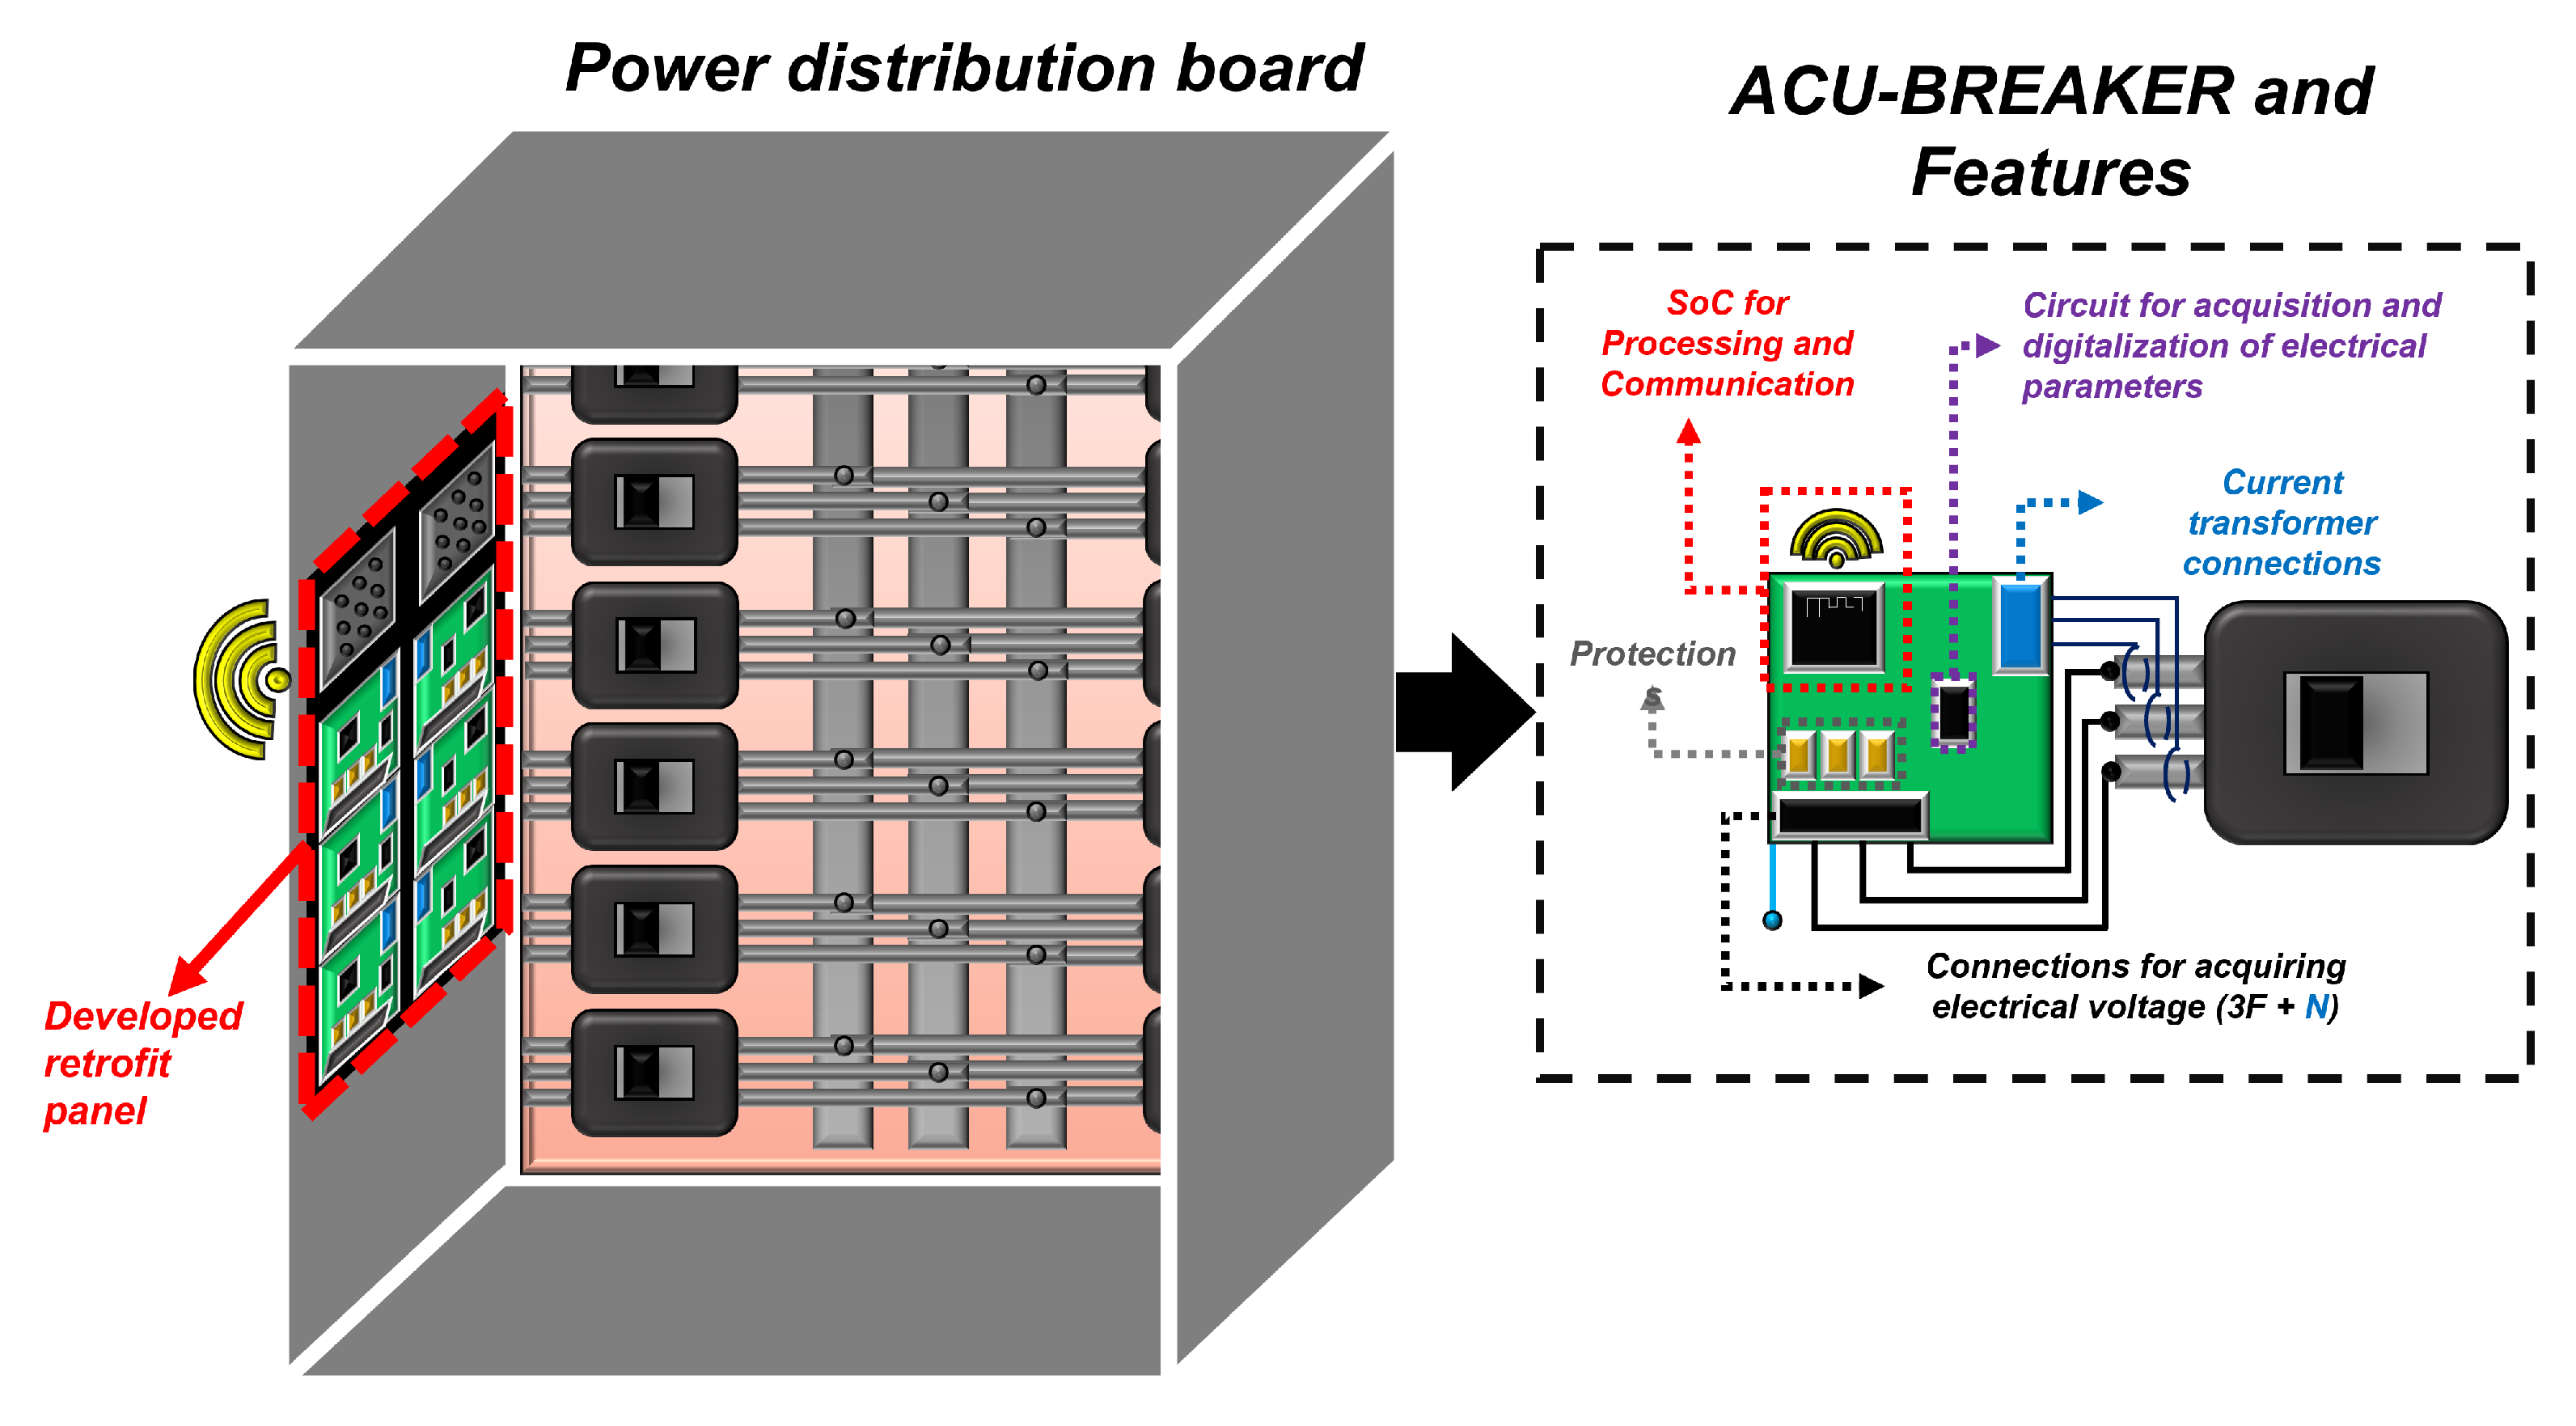
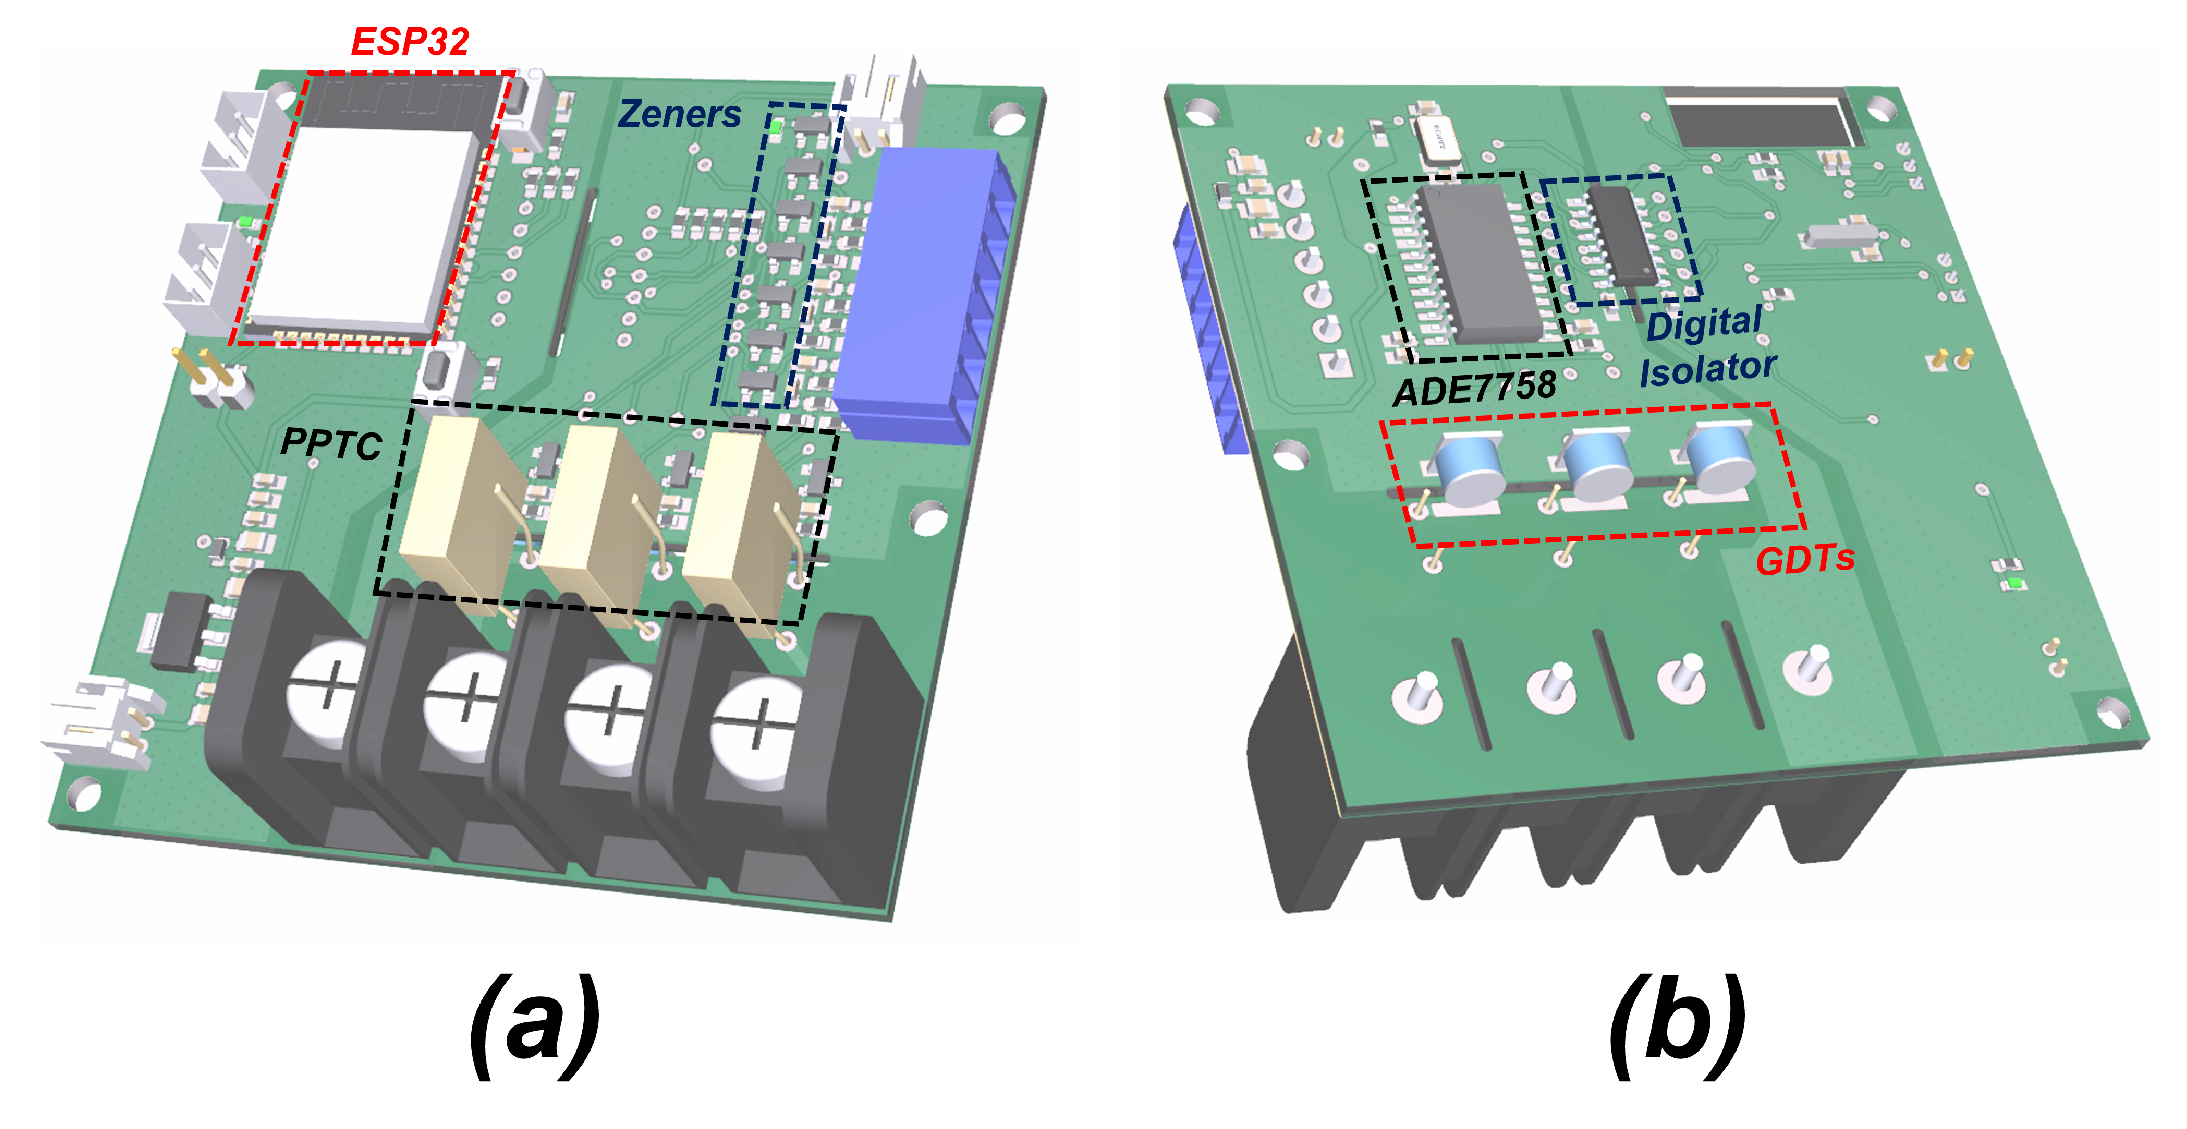
Figure 7 illustrates the strategy described above for installing the ACU-BREAKER and the hardware features present in its design. On the other hand, the main hardware components of the ACU-BREAKER are detailed in
Figure 8, including the connections to the support board that distributes the power supplies and battery backup to each ACU.
5.2.1. SoC for Processing and Communication
As mentioned, the ACU-BREAKER has a system-on-a-chip (SoC), with processing and communication capabilities, through which we develop the DRFs, CSFs, and ISFs of the ACU. To do this, we used the ESP32-D0WD-V3 SoC present in the ESP32-WROOM-32E module from the manufacturer Espressif [
56,
57]. Through the ESP32 module, it was possible to take advantage of wi-fi communication resources and the MQTT protocol to implement the ISFs through request and response messages, and network connection management (one of the CSFs). In addition, the ESP32 module has serial communication peripherals used to debug the developed firmware and to communicate with the electrical signal acquisition circuitry. The ESP32-WROOM-32E module has a 4 MB flash memory, which was used to implement the CSF for storing the calibration settings parameters and for storing the communication network configuration parameters.
5.2.2. Circuit for Acquisition and Digitalization of Electrical Parameters
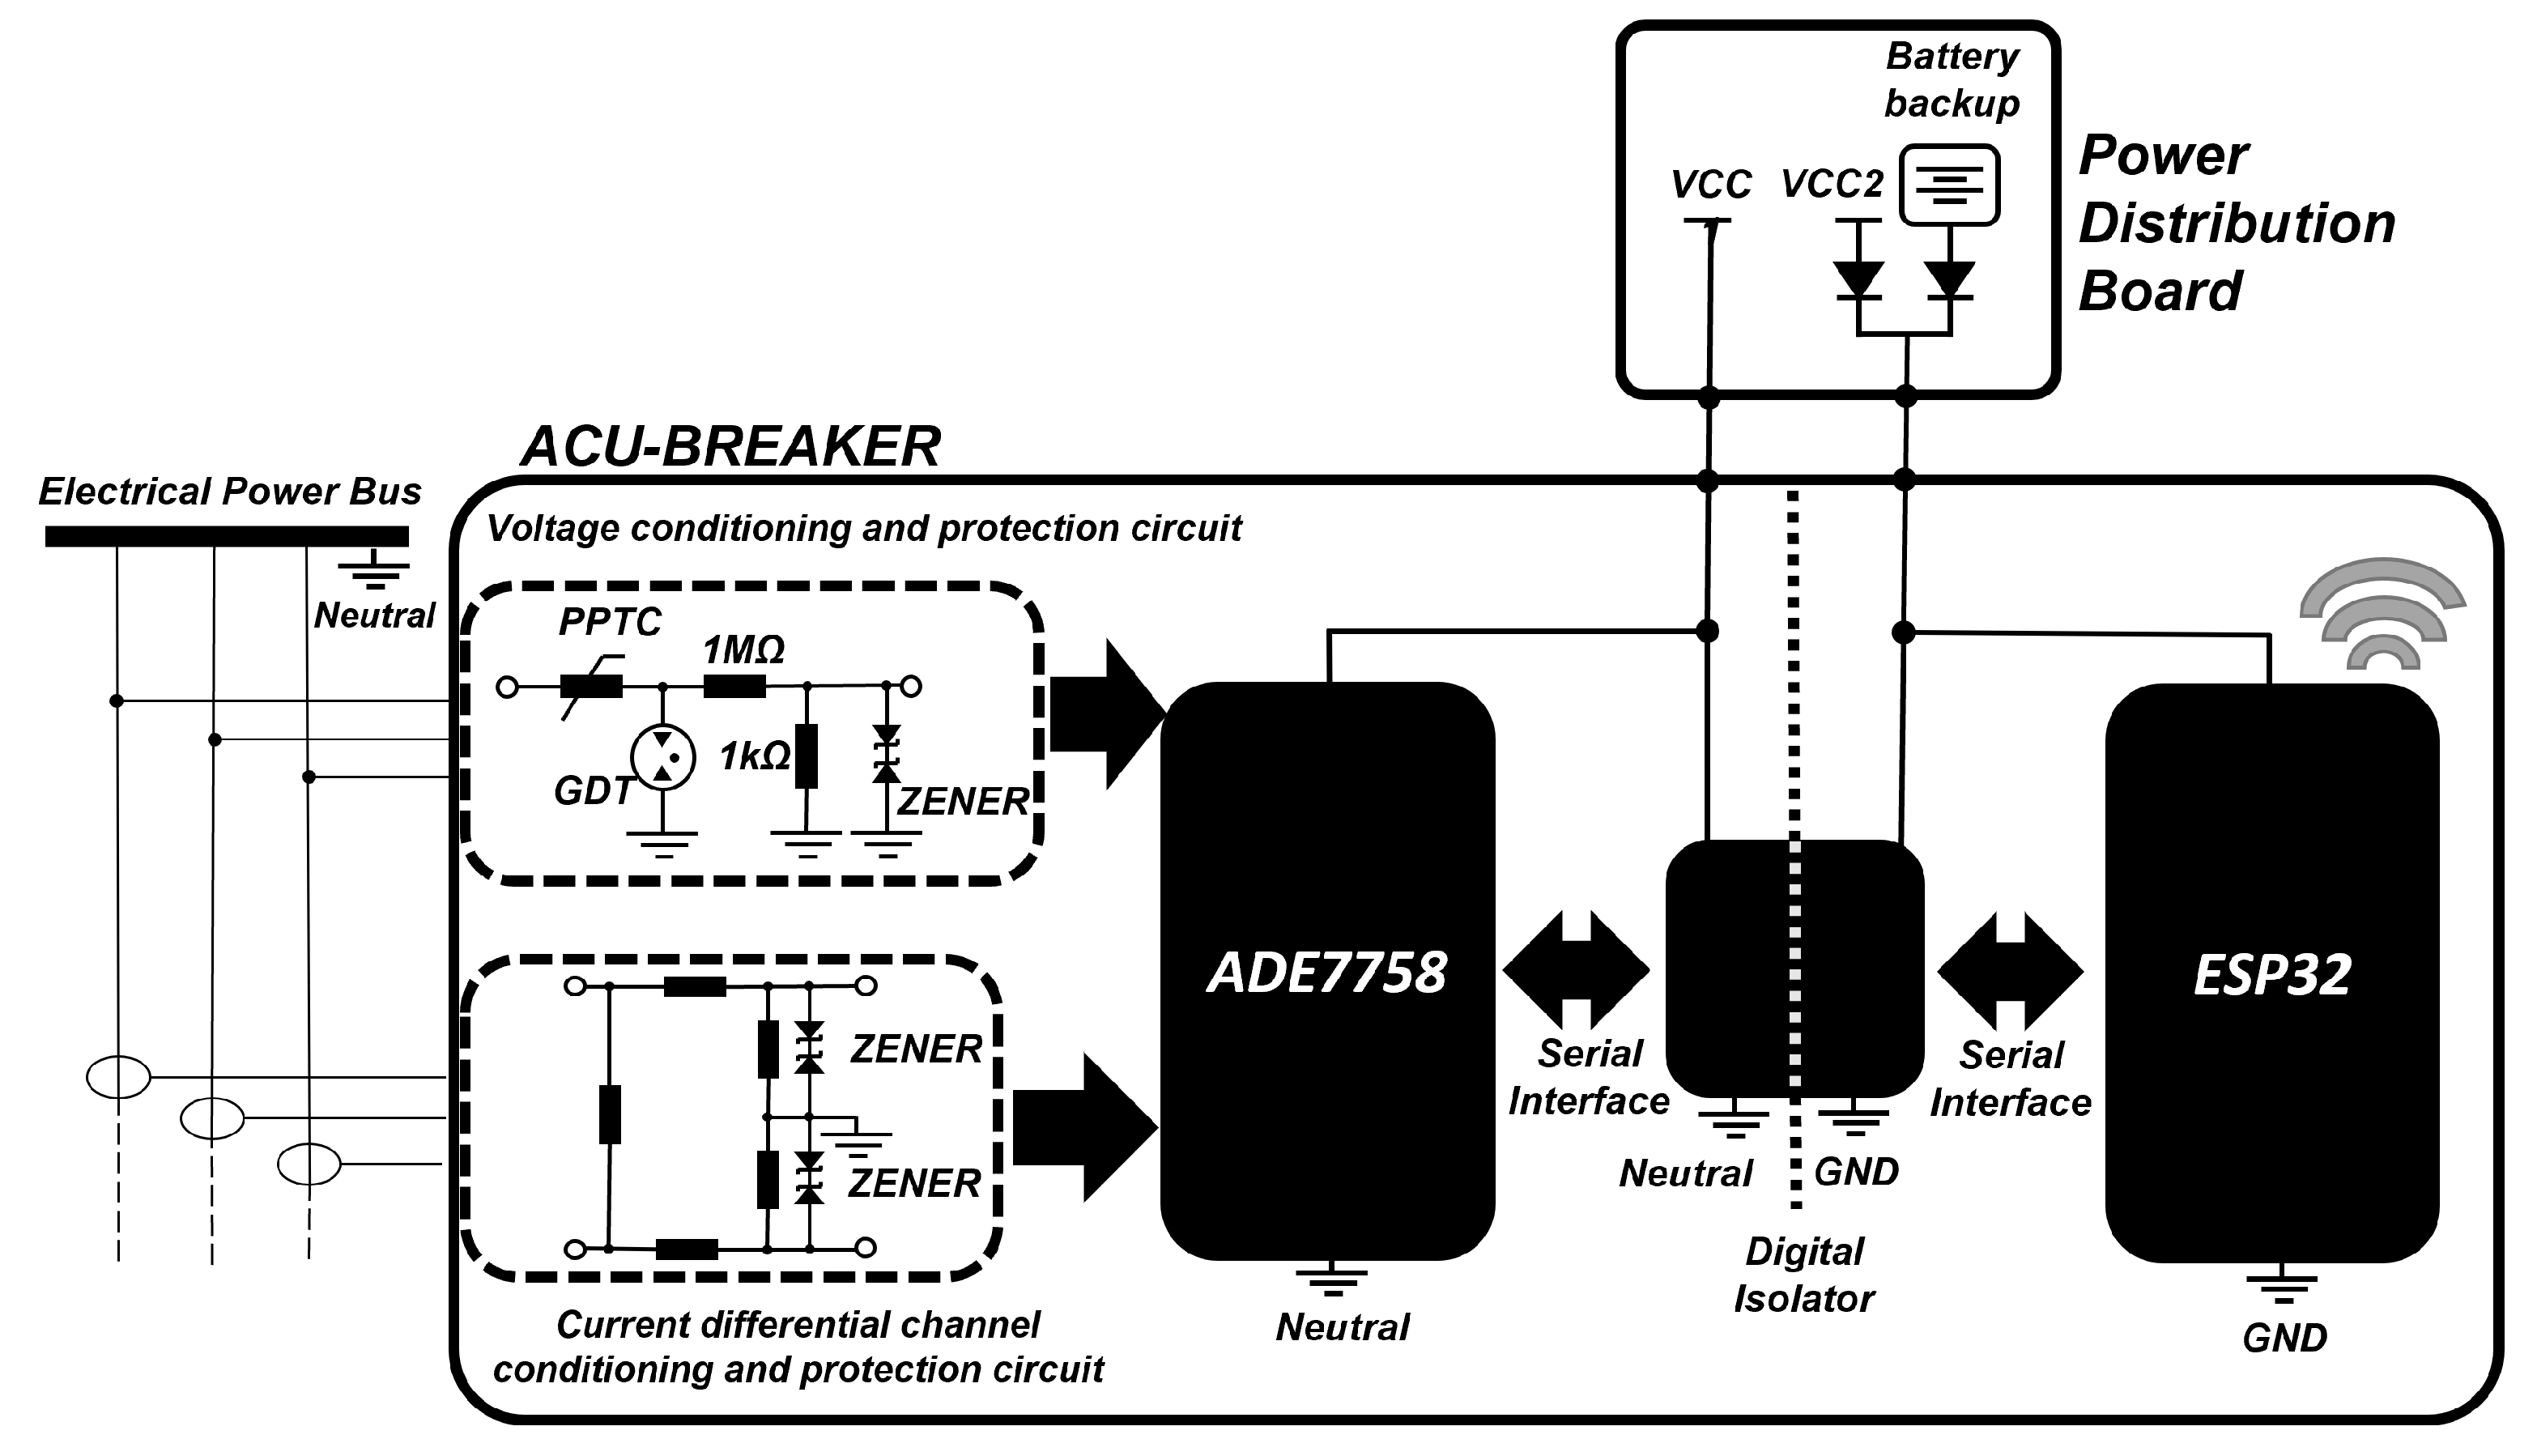
To ensure the reliability of the obtained electrical parameters, even in nonsinusoidal conditions, we chose to use an integrated circuit dedicated to the acquisition and digitization of the electrical parameters by means of the mean value technique. To do this, we employed the ADE7758 integrated circuit and the discrete components associated with it. This integrated circuit communicates with the processing unit by means of a serial interface and its function is to receive the electrical parameters of voltage and current previously conditioned, and then to digitize and process these parameters. The use of this integrated circuit in the ACU-BREAKER is detailed in
Figure 8. Through this process, we obtained the parameters of effective voltage and current, network frequency and active, reactive and apparent power. The active, reactive and apparent power and power factor parameters were computed by the ESP32 module by using the active, reactive, and apparent power parameters obtained. All the technical aspects, equations, and diagrams used to support the use of the ADE7758 as commented above are detailed in its datasheet [
58].
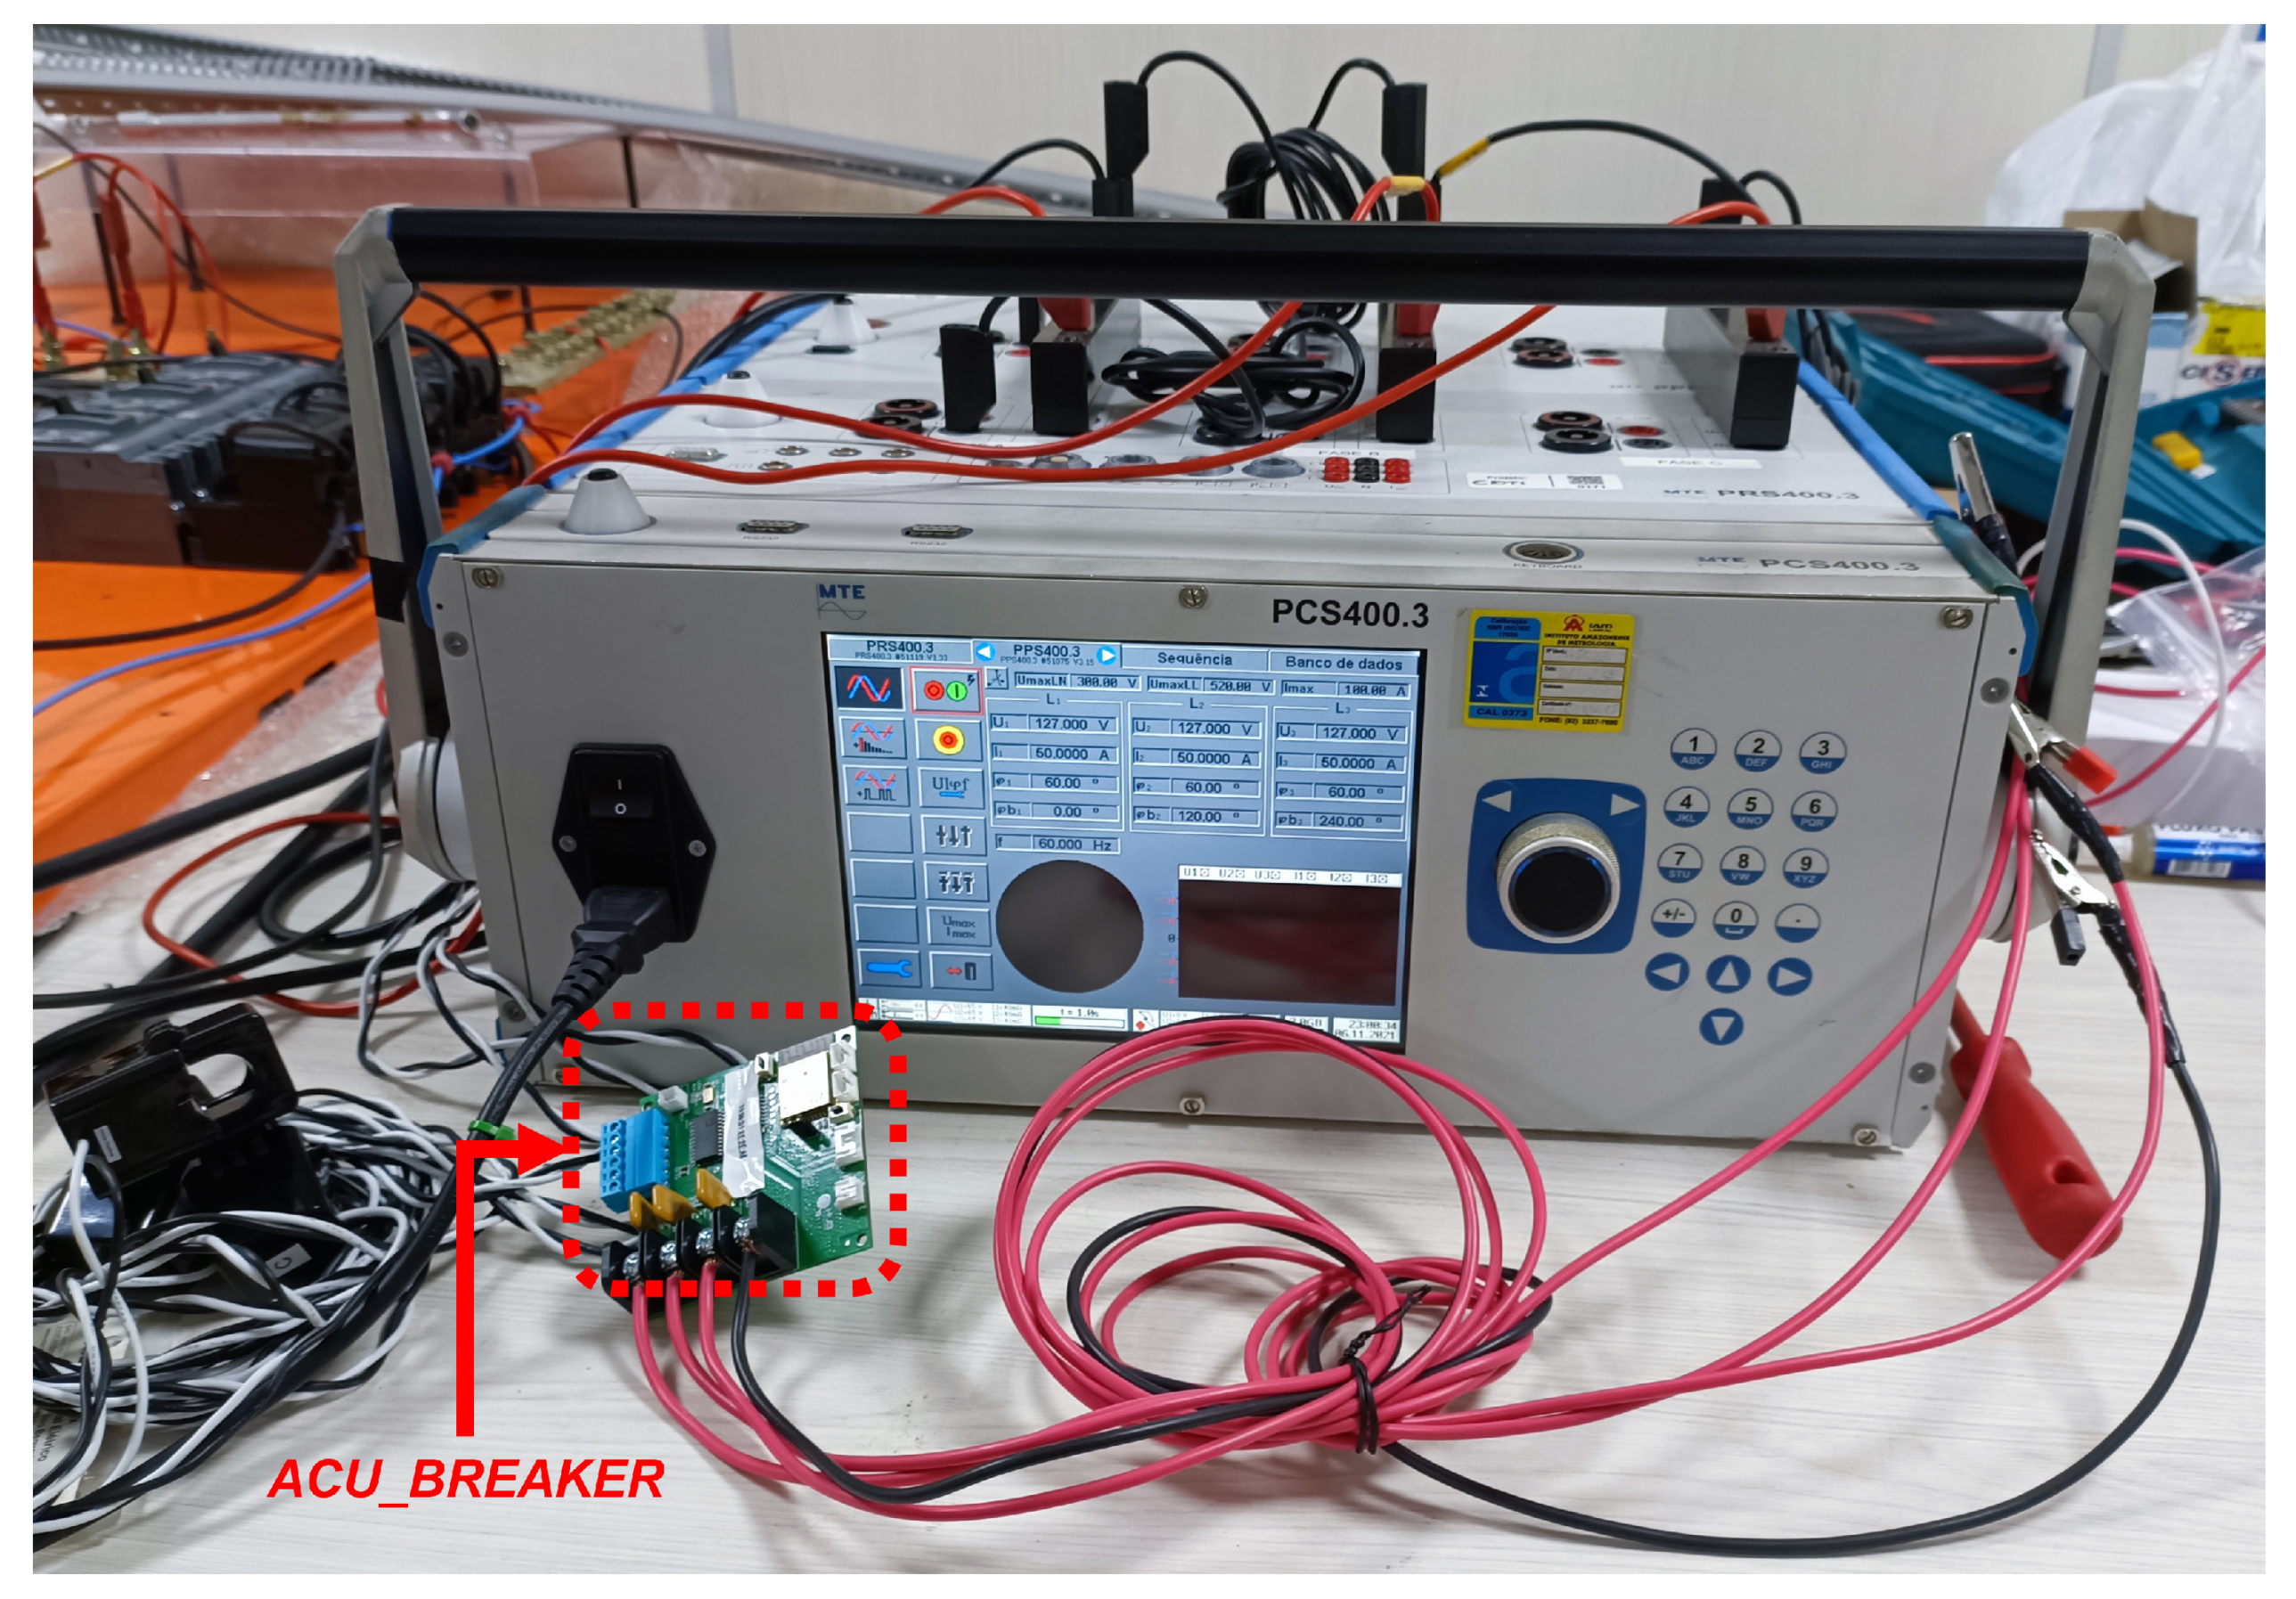
Through the integrated circuit ADE7758, we performed a procedure for calibration of the parameters obtained through gain and offset adjustments as described in its datasheet, ensuring the accuracy of the acquired values. To perform the calibration, we used a precision source, PPS400.3 from the manufacturer MTE [
59], to provide known parameters of voltage and current. In this way, it was possible to adjust the gain and offset parameters based on the values provided by the precision source and the measurement performed by the ADE7758. We developed a routine in the firmware of the ACU-BREAKER to receive, adjust, and update the parameters in the internal registers of the ADE7758, as specified in its datasheet. It is important to note that each ACU-BREAKER was calibrated individually, as each was affected differently by the tolerance or precision of the components used for signal conditioning or transduction. In the tests performed, it was possible to obtain a measurement with about 1% error through the calibration adjustments.
Figure 9 illustrates the ACU-BREAKER on a bench to be calibrated by using the precision source used.
5.2.3. Protections and Connections for Measuring Voltage and Current
As illustrated in
Figure 7 and
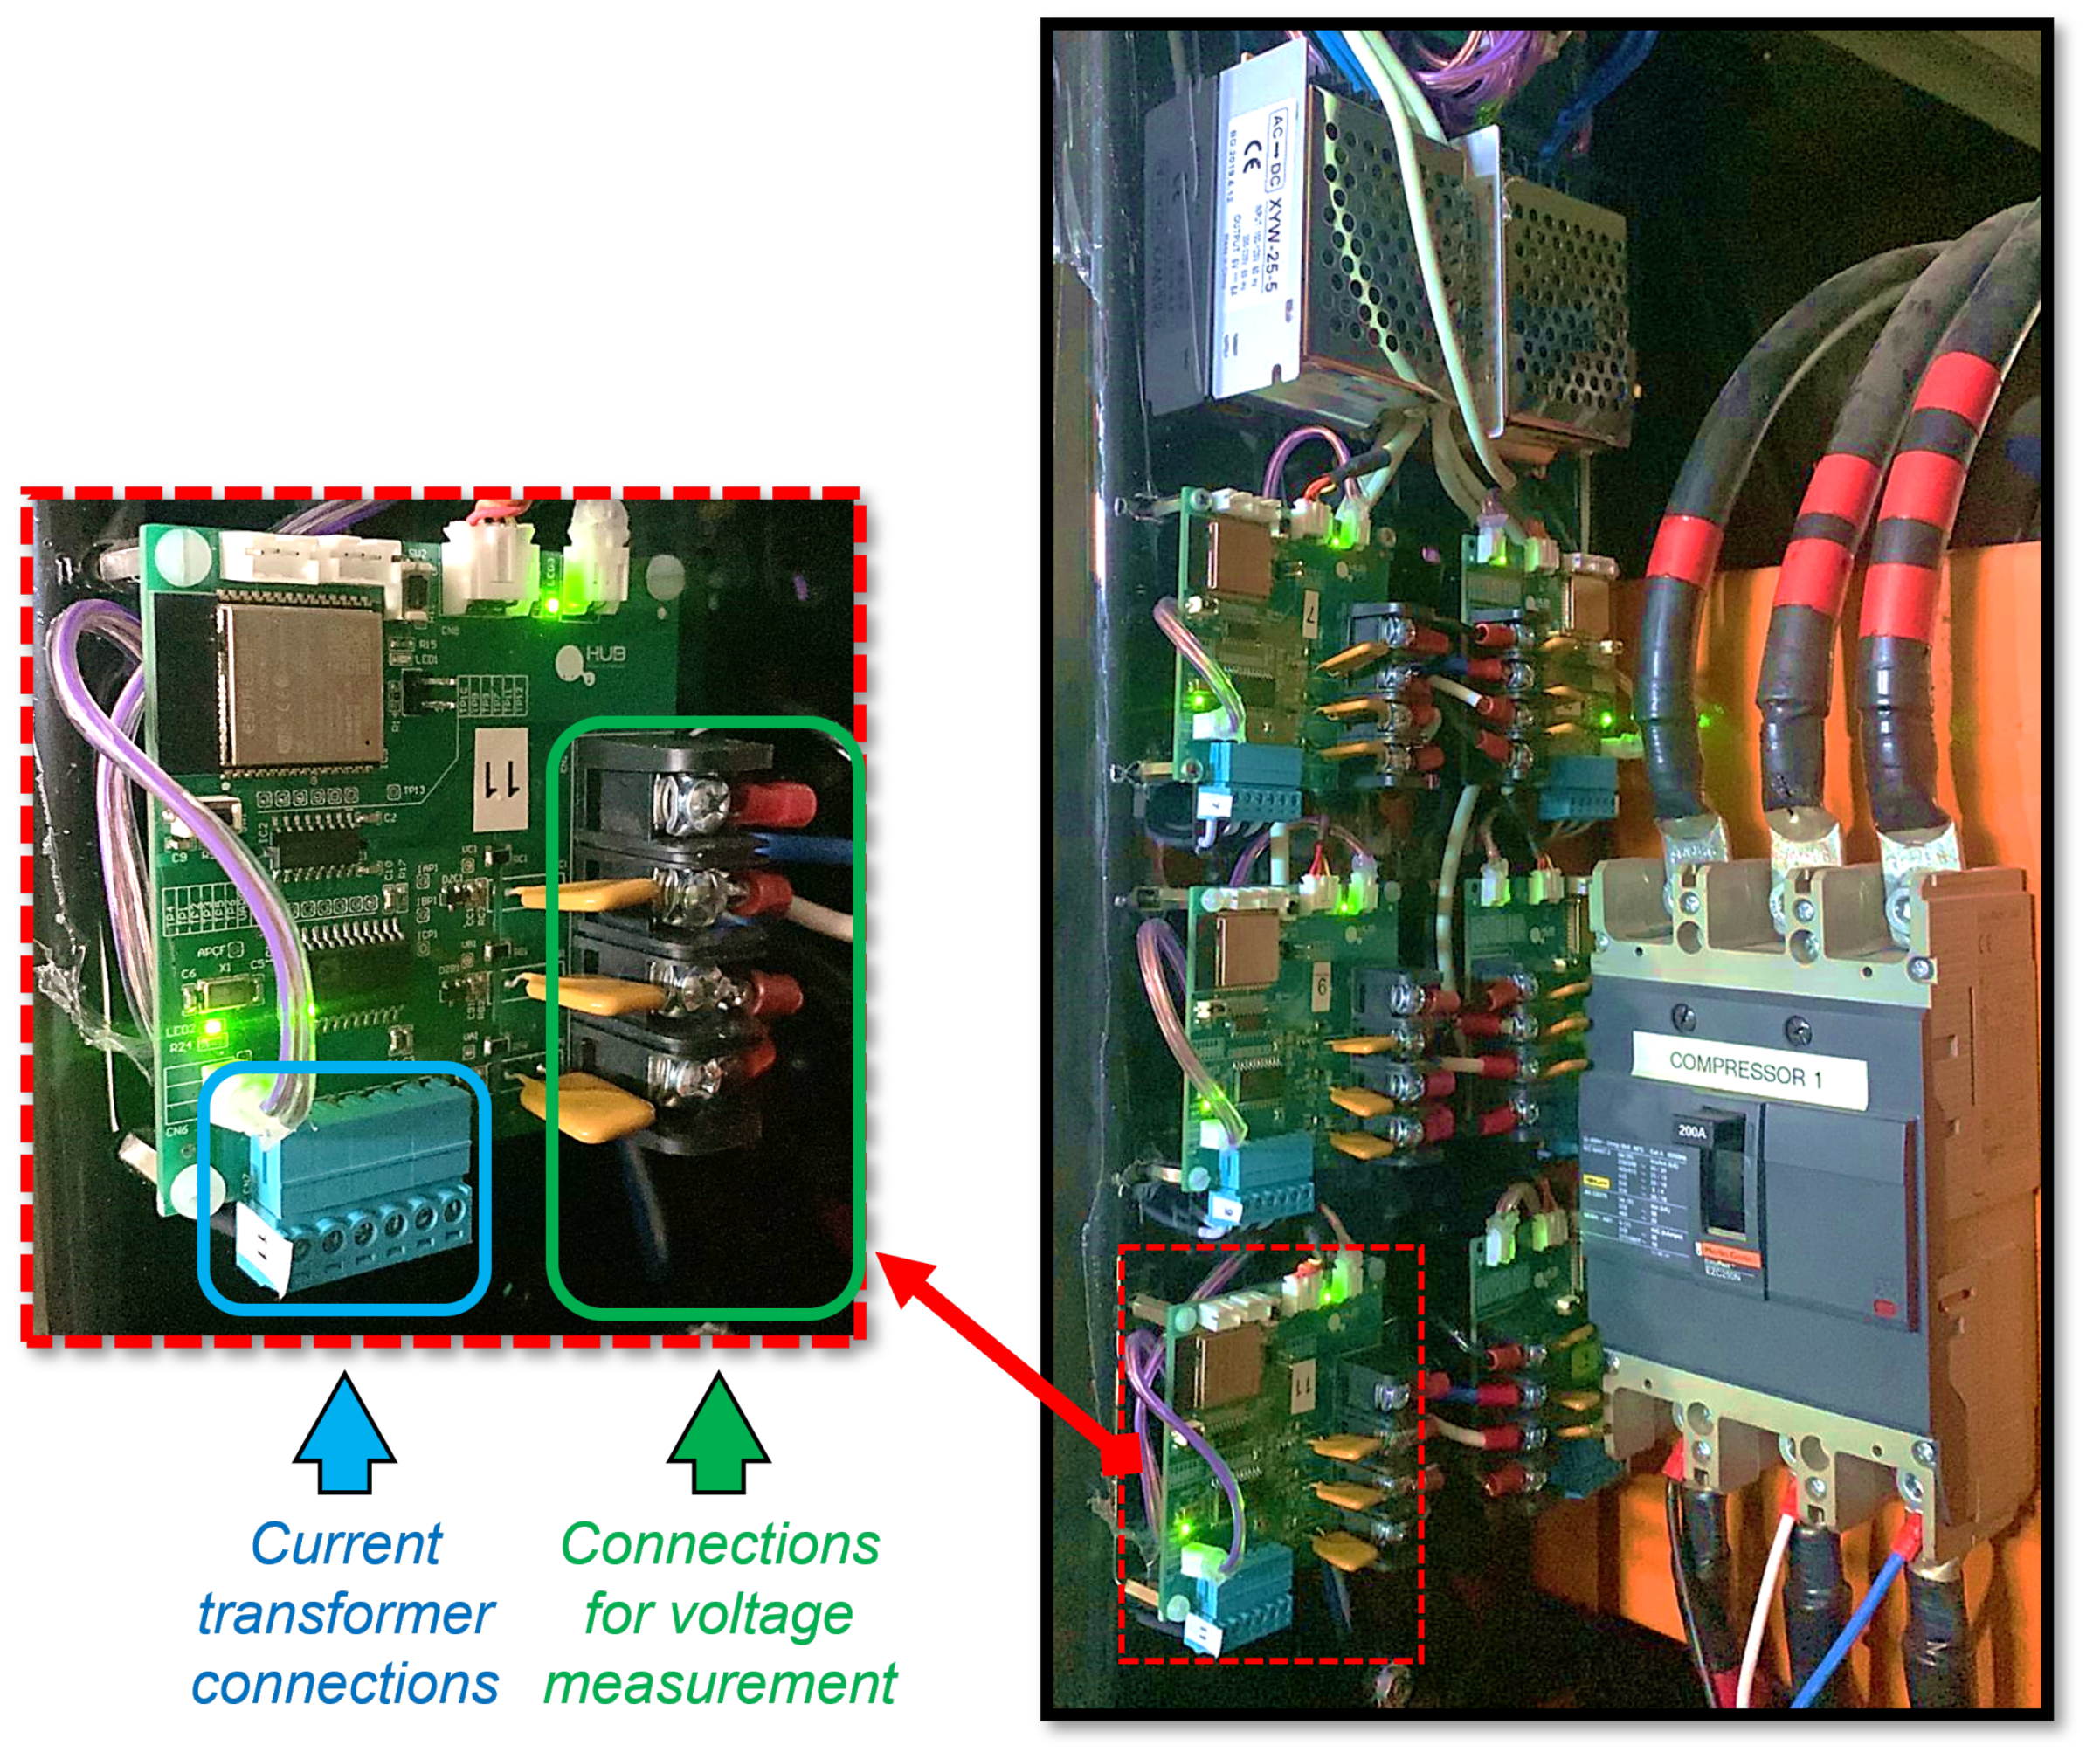
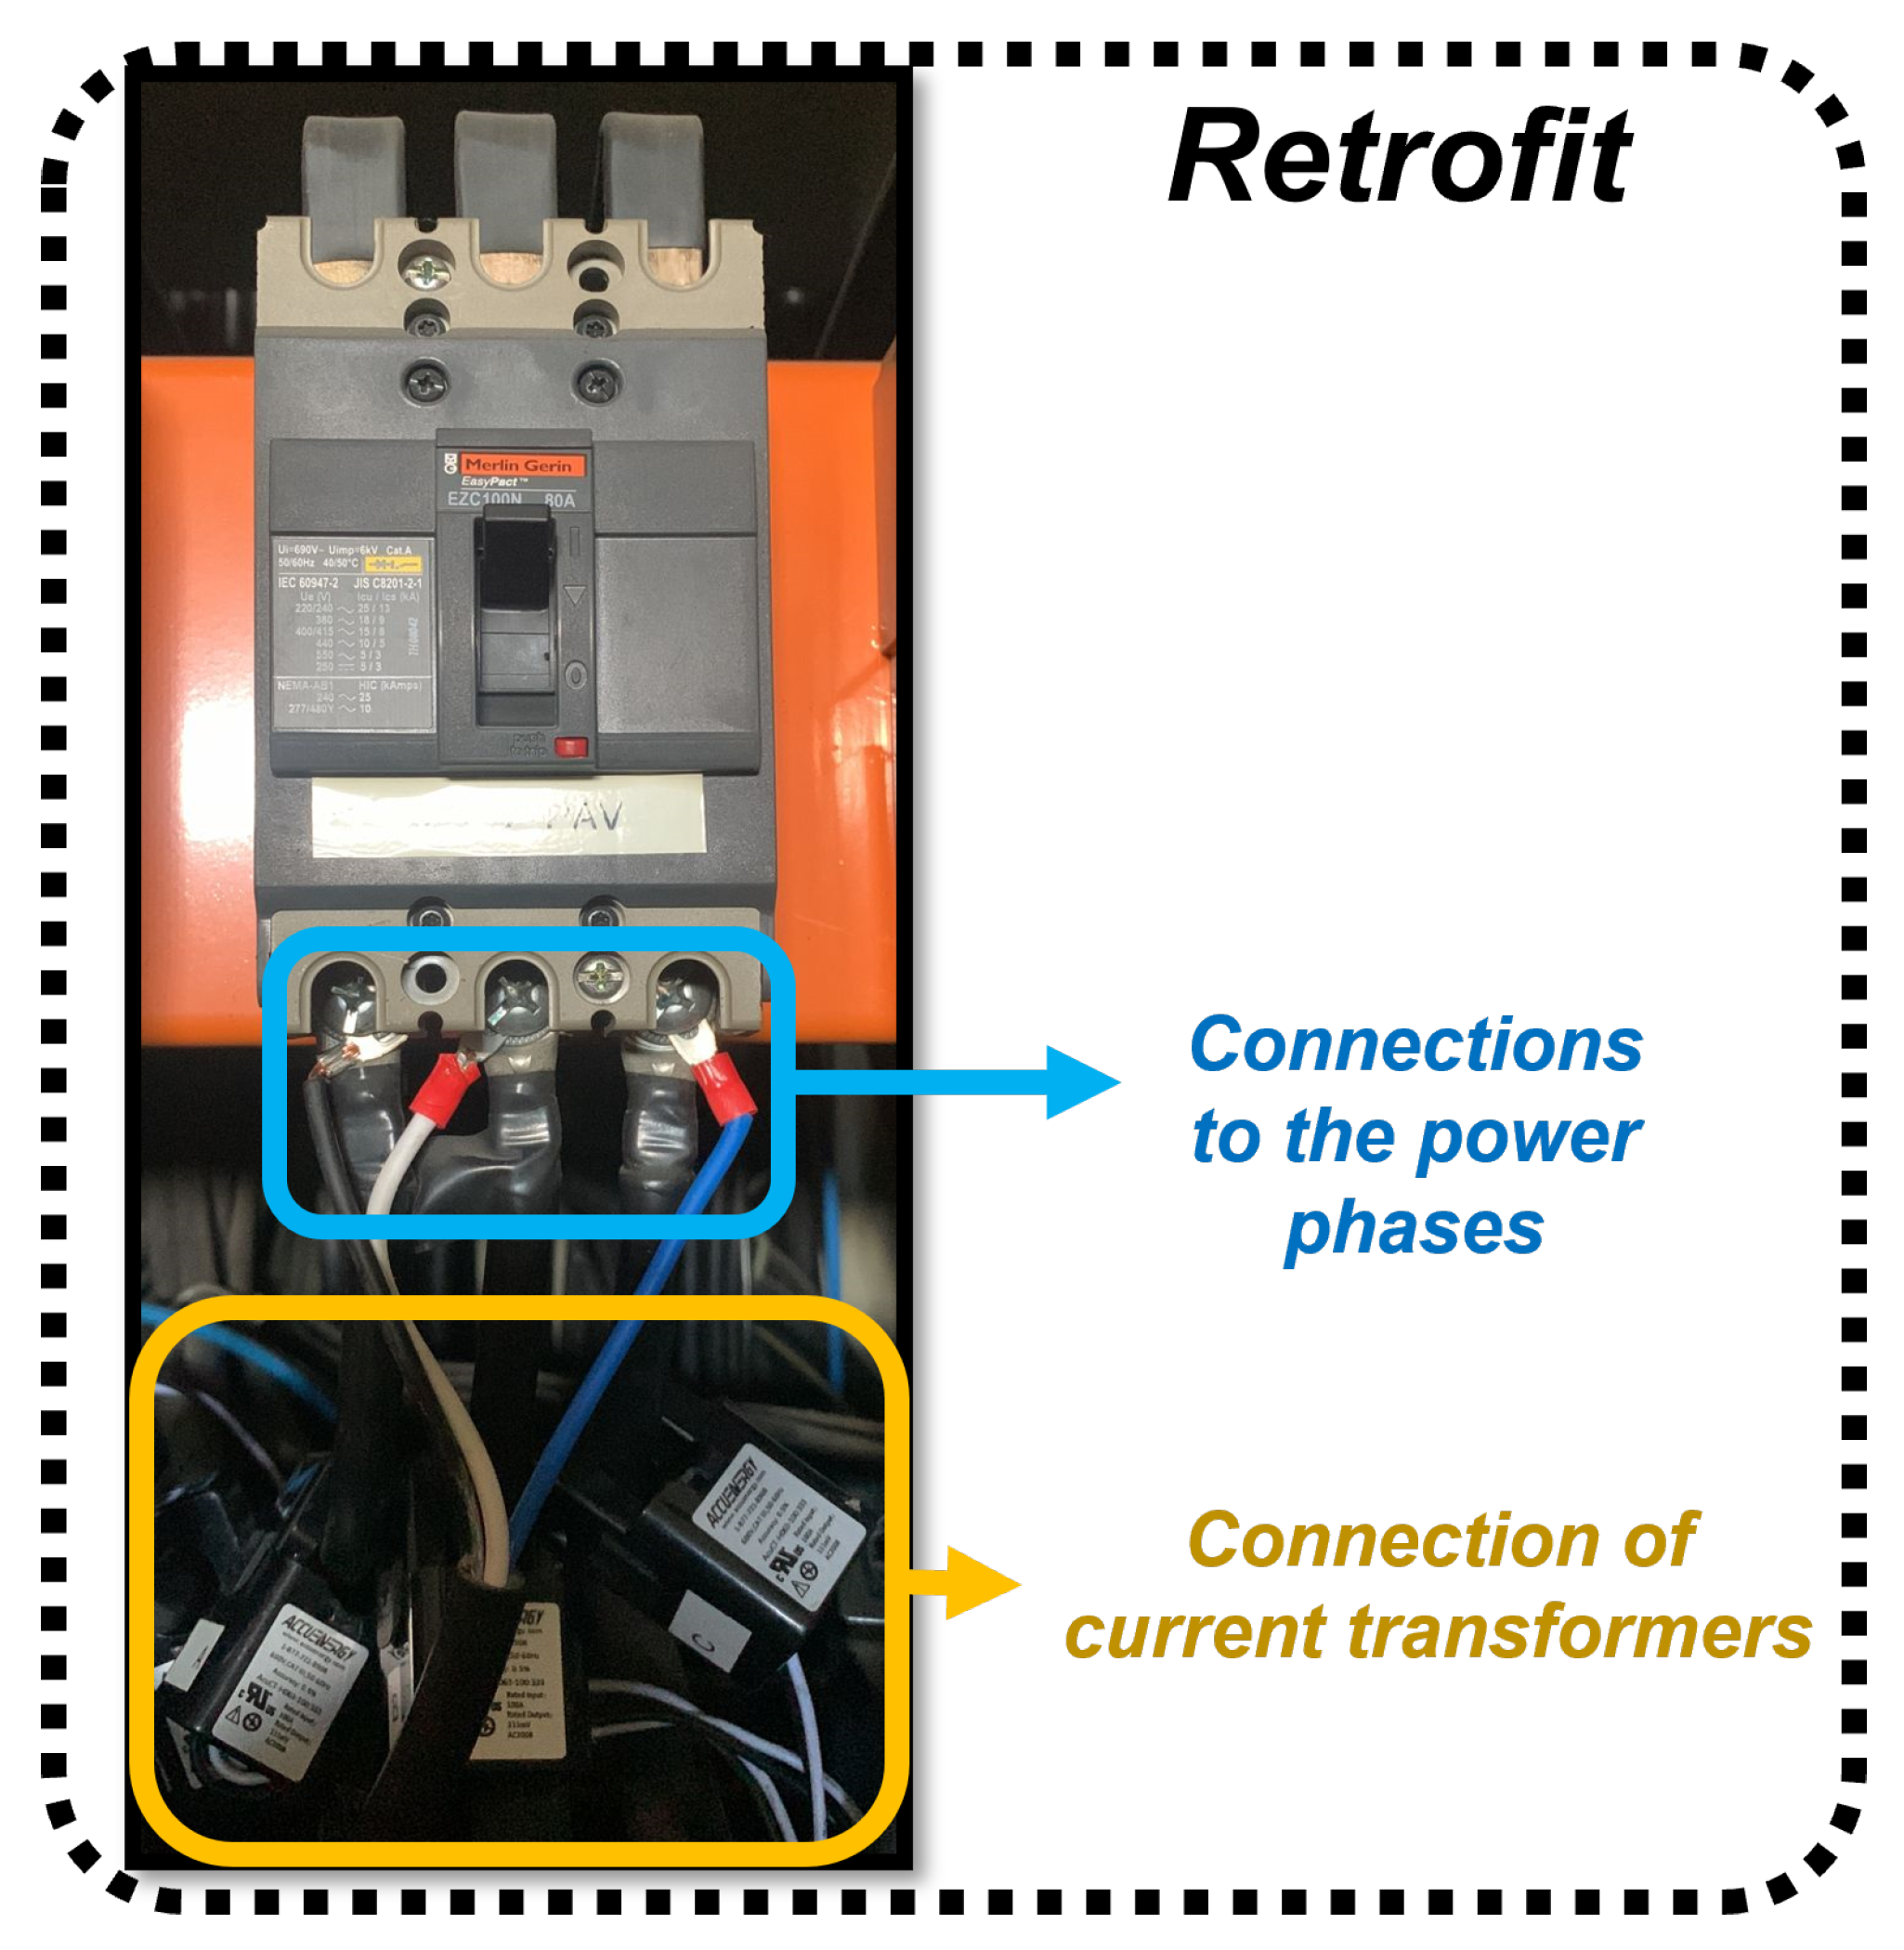
Figure 8, the ACU-BREAKER has discrete components responsible for the protection and conditioning of the electrical signals to be introduced in the integrated circuit ADE7758 and, which were previously obtained through the connections of acquisition of the electrical voltages and the connections with the current transformers with the differential channels of the mentioned circuit. It is important to note that these connections physically implement the Get port of this ACU.
The internal ADCs of the ADE7758 rely on pre-conditioned voltage and current signals with low values, being 500 mV the maximum peak value of the signals inserted into the three voltage and current channels [
58]. Consequently, in order to be able to perform maximum 500 V peak readings from the mains, we set up the voltage transduction circuit by using a resistive divider to create the 500 mV/500 V ratio on the voltage channels. Considering the neutral as the reference, we use a resistive divider of 1 (MΩ) and 1 (kΩ) after the voltage connector. In this way we establish the conditioning of the voltage channels. It is important to note that the resistors used are accurate to 1%, to maximize the effectiveness of the system, and operate with powers of up to 250 mW, avoiding overheating due to the high electrical potentials to which they can be subjected.
The current transformers were sized to meet the circuit breaker currents. To meet this demand, we chose to use the noninvasive current transformers of the AcuCT mV series, produced by the manufacturer Accuenergy [
60]. Regardless of the nominal current of these transformers, their full-scale outputs are 333 mV. However, to use them with the differential current channels of the ADE7758, it was necessary to make adjustments to the signals obtained from these transducers. The maximum full scale of the current channels is 500 mV peak, but it can be adjusted to 250 mV or 125 mV peak. In this sense, we used a resistive divider to adjust the current transformer output to 250 mV peak in each circuit and set the current channel full scale to the same value, changing the internal gain registers of the ADE7758.
Because the electrical voltage transduction is performed in a non-isolated manner, to ensure protection against surges, overcurrents and overvoltages, the input protections of the ACU-BREAKER voltage channels are composed of gas discharge tubes (GDTs), polymeric positive temperature coefficient (PPTC) resettable fuses and Zener-type diodes. To ensure the protection of the ESP-WROOM-32E module in serial communication with the ADE7758, we used a digital isolator to separate the main’s neutral from the module’s digital reference. Thus, it was necessary to use two power supplies in the panel of the designed ACUs, one for power supply to the ADE7758 and one for power supply to the ESP-WROOM-32E and its peripherals. On the other hand, the current channels rely on galvanic isolation and the noninvasive measurement of current transformers. Therefore, only Zener-type diodes have been used to prevent overdrafts from damaging the ACU-BREAKER current channels.
5.2.4. Electrical Schematic and Layout
The electrical schematic and layout of the ACU-BREAKER were developed in Altium 21 software.
Figure 10 illustrates a three-dimensional (3D) perspective of the layout designed for the ACU-BREAKER.
5.2.5. ACUs Panel
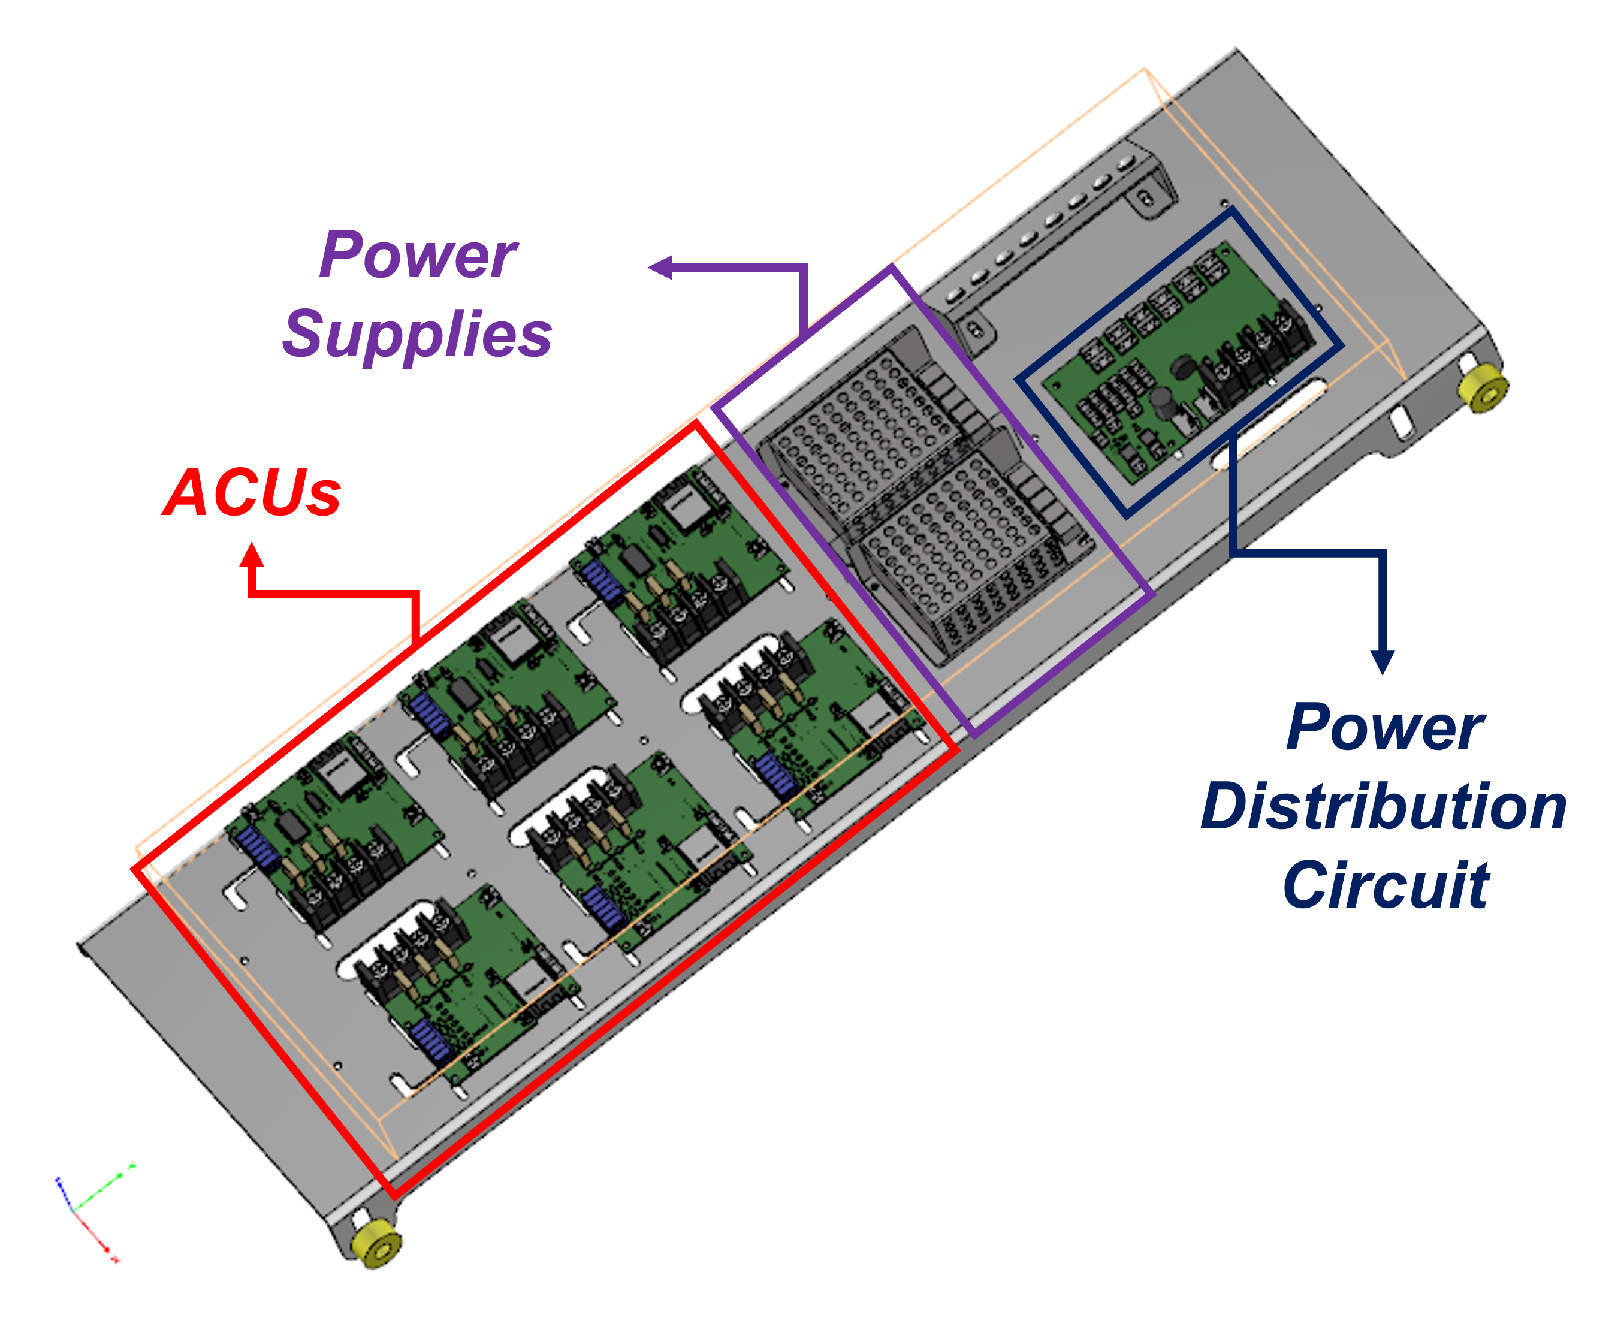
As mentioned earlier, a panel containing six ACU-BREAKERs, two 5 V power supplies, one for the ESP32-WROOM-32E module’s digital circuit and one for the ADE7758’s acquisition circuit, and a battery backup were designed. Additionally, a power distribution board was designed and positioned on the panel to share power from the power supplies with the ACUs via connectors. The board was designed to be positioned internally to the distribution board and installed on six of the circuits present. For a total of 48 circuits, eight panels were developed.
Figure 11 illustrates the ACU panel previously developed in Inventor software.
5.3. The ACU-ROUTER Middleware
An ACU does not necessarily have to be a hardware device to be developed based on the premises of the SmartLVGrid metamodel. Because it is based on a retrofit strategy, the technological adaptation process can occur through existing devices with the necessary interfaces to enable interoperability with other system applications. In this sense, to interface with the other ACU operators (e.g., ACU-BREAKER) and enable system communication, the ACU-ROUTER (coordinator) was selected to be a wi-fi router in the vicinity of the electrical panel used to implement the proof of concept of this article. The router used was the AP 310 model from Intelbras manufacturer [
61].
The wi-fi router does not implement control or monitoring functionality on the electrical circuits or any host system. Therefore, as an ACU, it does not perform DRFs on the host system. However, through it, you can perform message exchanges and communication synchronization with other ACU operators. Thus, through its In/Out port, implemented through its wireless communication transceivers, it was possible to perform ISFs in the system. In addition, this device counts on computational resources for connection management and network configuration, which characterizes its CSFs. For future implementations based on the SmartLVGrid metamodel, it is important to emphasize that the desired operational primitives (DRFs, CSFs and ISFs) depend on the application of ACUs in future systems. Thus, if a market device allows for a non-abrupt technological transition and meets the needs for interfaces to existing/developed systems, it can be used as an ACU. However, for customized solutions, like the ACU-BREAKER, it is necessary to develop the hardware resources and the respective firmware to enable the interaction with other ACUs and the legacy layer, preserving it as much as possible.
5.4. Implementation of the Supervision and Control Center
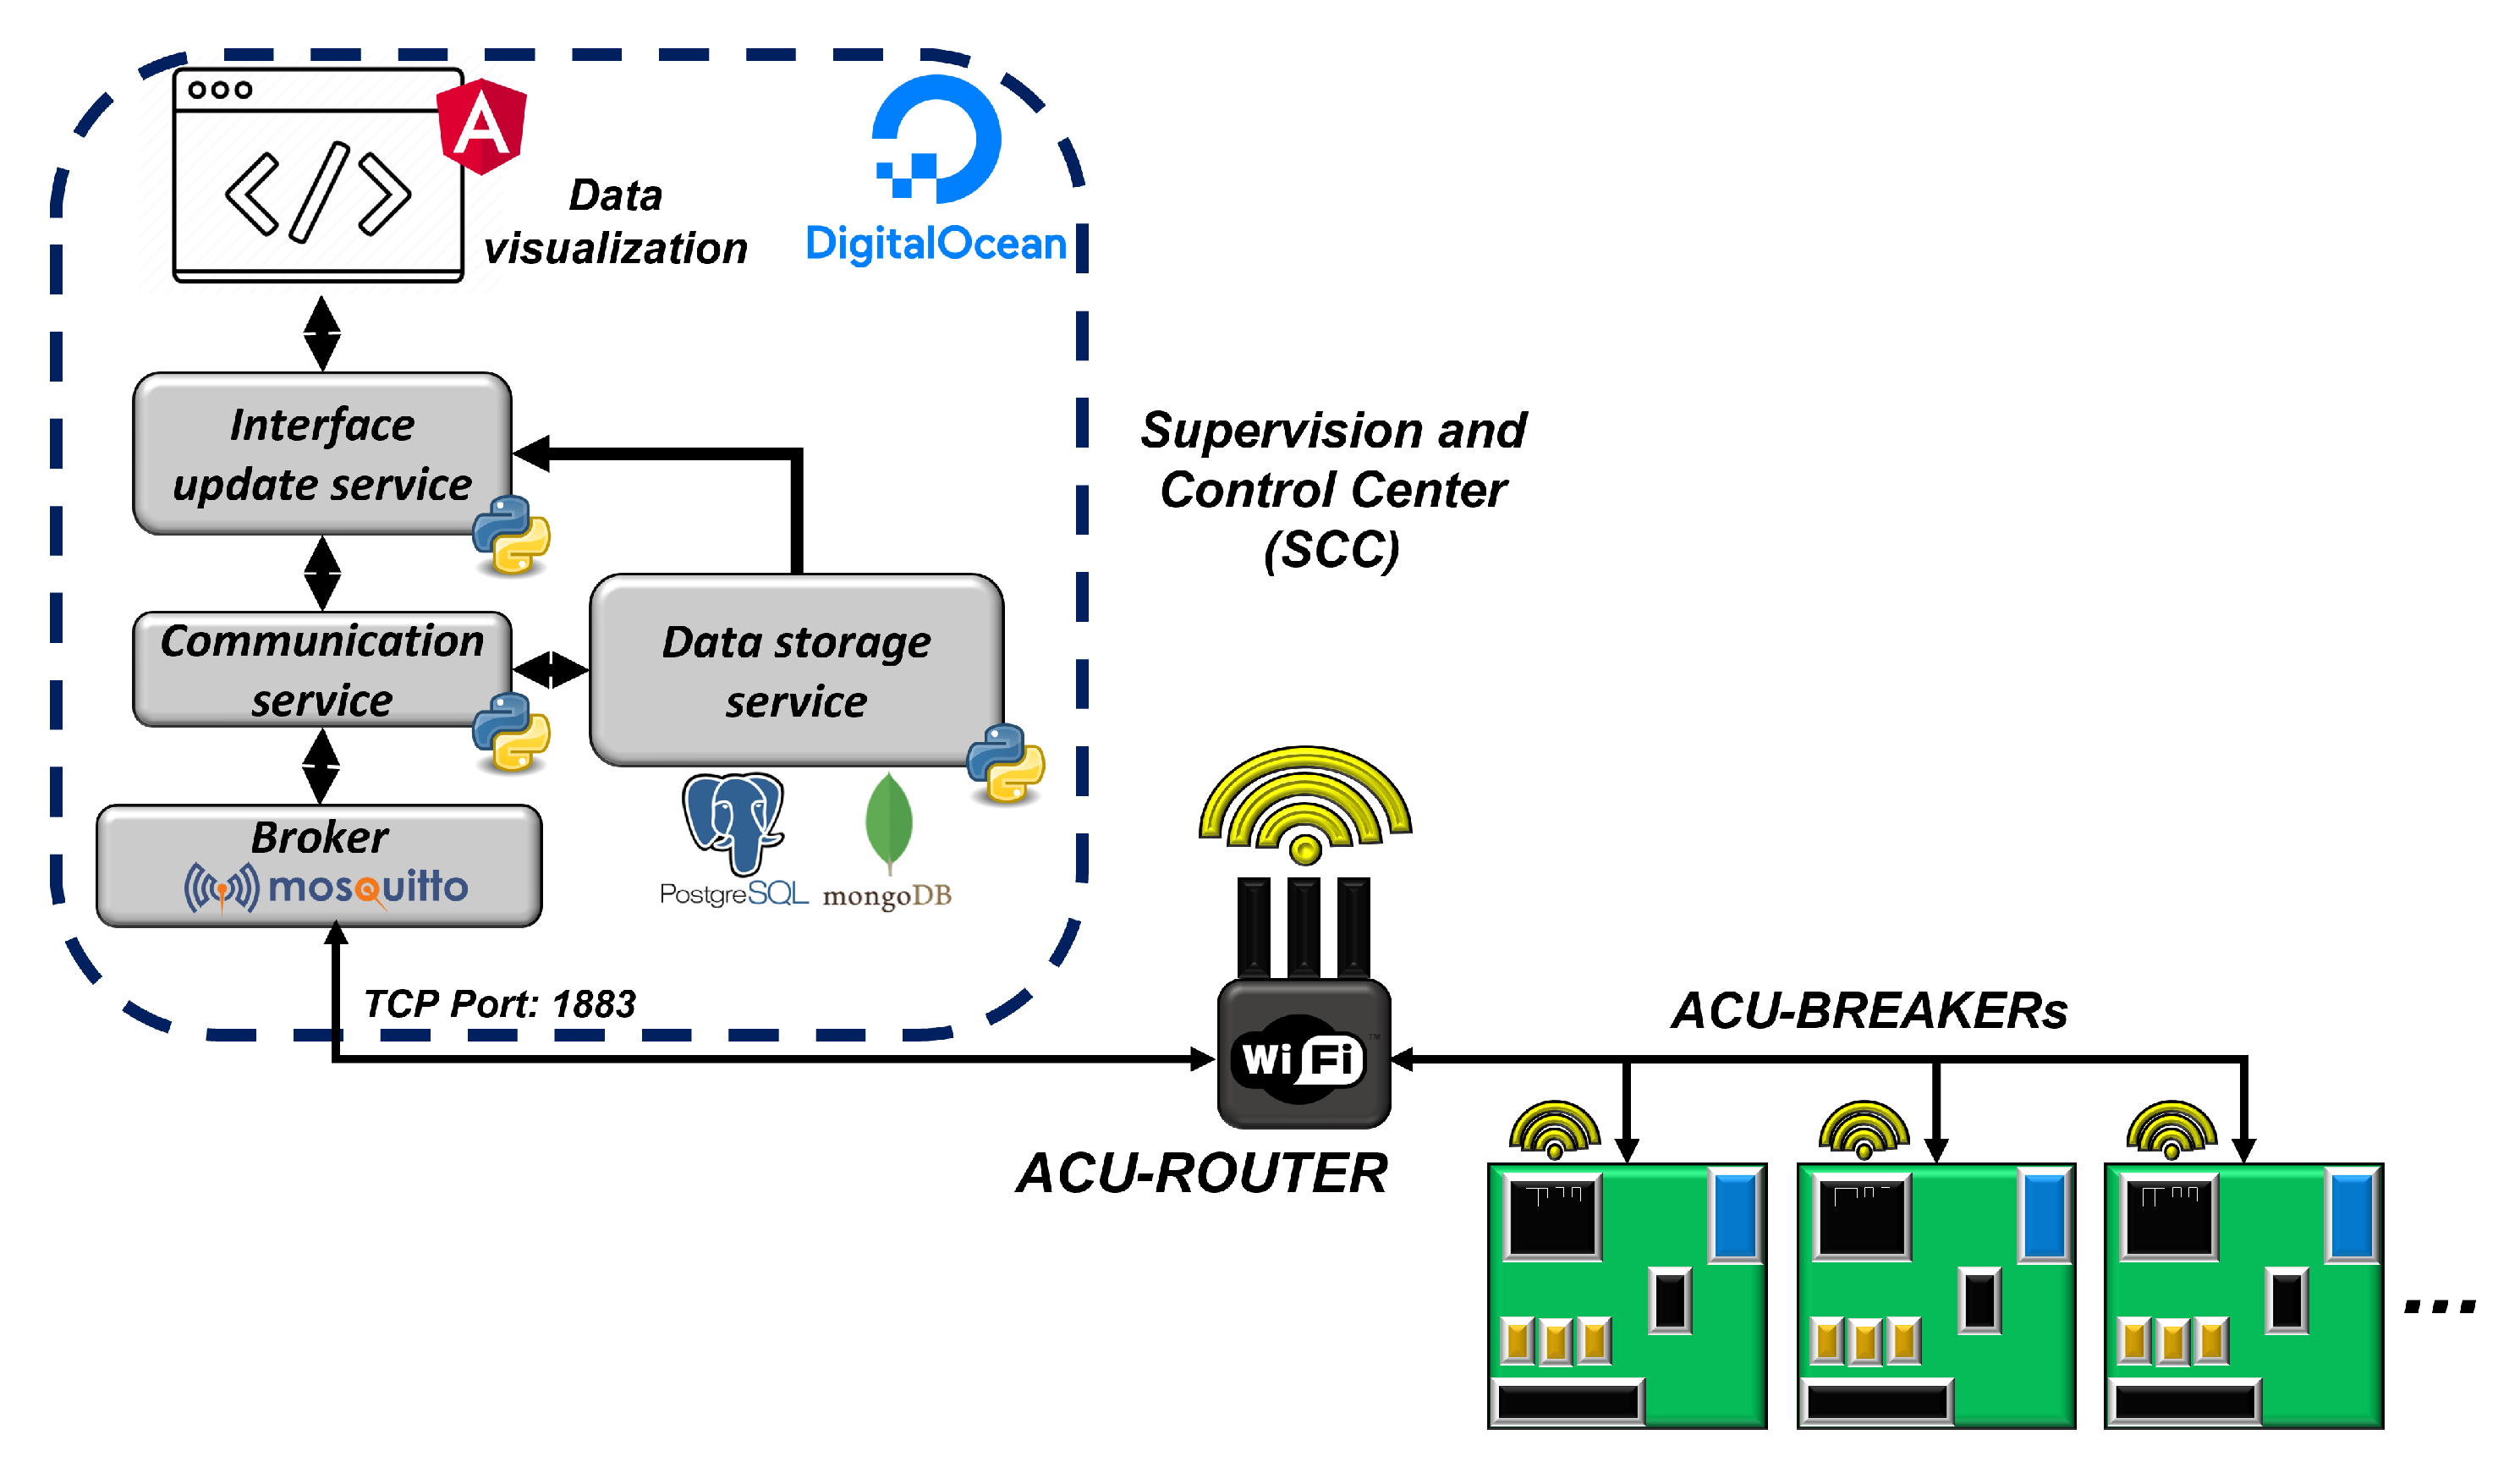
The supervision and control center was implemented by means of software services and applications, including databases and dashboards, located in a virtual cloud machine on the DigitalOcean [
62] provider. Through the SCC, it was possible to view the update of monitored electrical parameters in real time and to register ACUs in order to virtualize the energy monitoring of each circuit in the switchboard.
To develop the screens and dashboards we used the Angular framework in version 10, an open source platform for Web application development [
63]. On the other hand, Python language version 3.9 was used to develop software services to transport data to the developed Web application and support the management of other services, such as data storage and device registration. The websocket protocol was used to enable real-time communication between the MQTT broker and the Web application, because through it, it is possible to send requests and receive event-driven responses without the need to consult a server to update the interface [
64].
In order to enable the storage of the monitored data in real time, we used the MongoDB database. On the other hand, the event history and device registration were stored in the PostgreSQL database for organization according to data type.
Figure 12 illustrates the architecture of the SCC described in this section and its integration with the devices in our proposal.
5.5. Proposal Evaluation Scenario
Our retrofit proposal for monitoring electrical circuits in smart buildings was evaluated in the dental polyclinic of the State University of Amazonas, located in the Cachoeirinha neighborhood, in Manaus. The demands contracted by the distributor are 115 kW during peak hours, from 08:00 pm to 10:59 pm, and 160 kW during off peak hours during the rest of the day. The peak and off-peak tariff schedules for each energy distributor in Brazil can be consulted on the website of the National Agency for Electrical Energy, ANEEL, under “Tariffs and Economic-Financial Information” [
65]. Currently, in the case of the polyclinic in question, the electric power distributor is Amazonas Energia.
The polyclinic has an electrical power distribution board, a switchboard, that operates with a nominal voltage of phase-neutral 127 , voltage to which the ACU-BREAKERs were calibrated on the bench. The board in question has 48 circuits and all were monitored by each ACU individually. Each ACU-BREAKER was identified according to the circuit enumeration of the board. The Wi-Fi network configuration parameters, containing the IP address of the virtual machine and the TCP port for MQTT communication, along with the identification of the ACUs, were passed on and stored in the ACUs after the bench calibration procedure. After this, it was possible to assemble the panels with the ACU-BREAKERs, power supplies, batteries, backing plates, and the necessary cabling for installation.
Each ACU-BREAKER was connected to its respective circuit via voltage connectors and current transformers. The panel, in turn, was positioned on the inside of the switchboard.
Figure 13 illustrates the ACU panel installed in that scenario. Then, illustrating the retrofit of the switchboard circuits,
Figure 14 exposes the ACU-BREAKER connections that interface with the legacy layer of the system. Once powered up, the ACUs, preconfigured with network parameters, began communicating with the MQTT broker running on the virtual machine hosting the SCC applications in the cloud.
6. Results
In this section, the results obtained from the implementation and performance evaluation of our monitoring proposal for the legacy electric power distribution board will be presented. Initially, the service nodes (SNs) were established by connecting the ACUs to the supervision and control center (SCC) through pre-registered network data. From this, it was possible to evaluate the execution of the operational primitives (DRFs, ISFs, and CSFs) established for the ACU-BREAKER and the ACU-ROUTER, which validates the adaptation of the SmartLVGrid metamodel and the retrofit strategy used. To present the energy management capabilities made available by the proposal, we developed software interfaces that record and expose events and electrical parameters obtained in real time.
6.1. Validation of CSFs
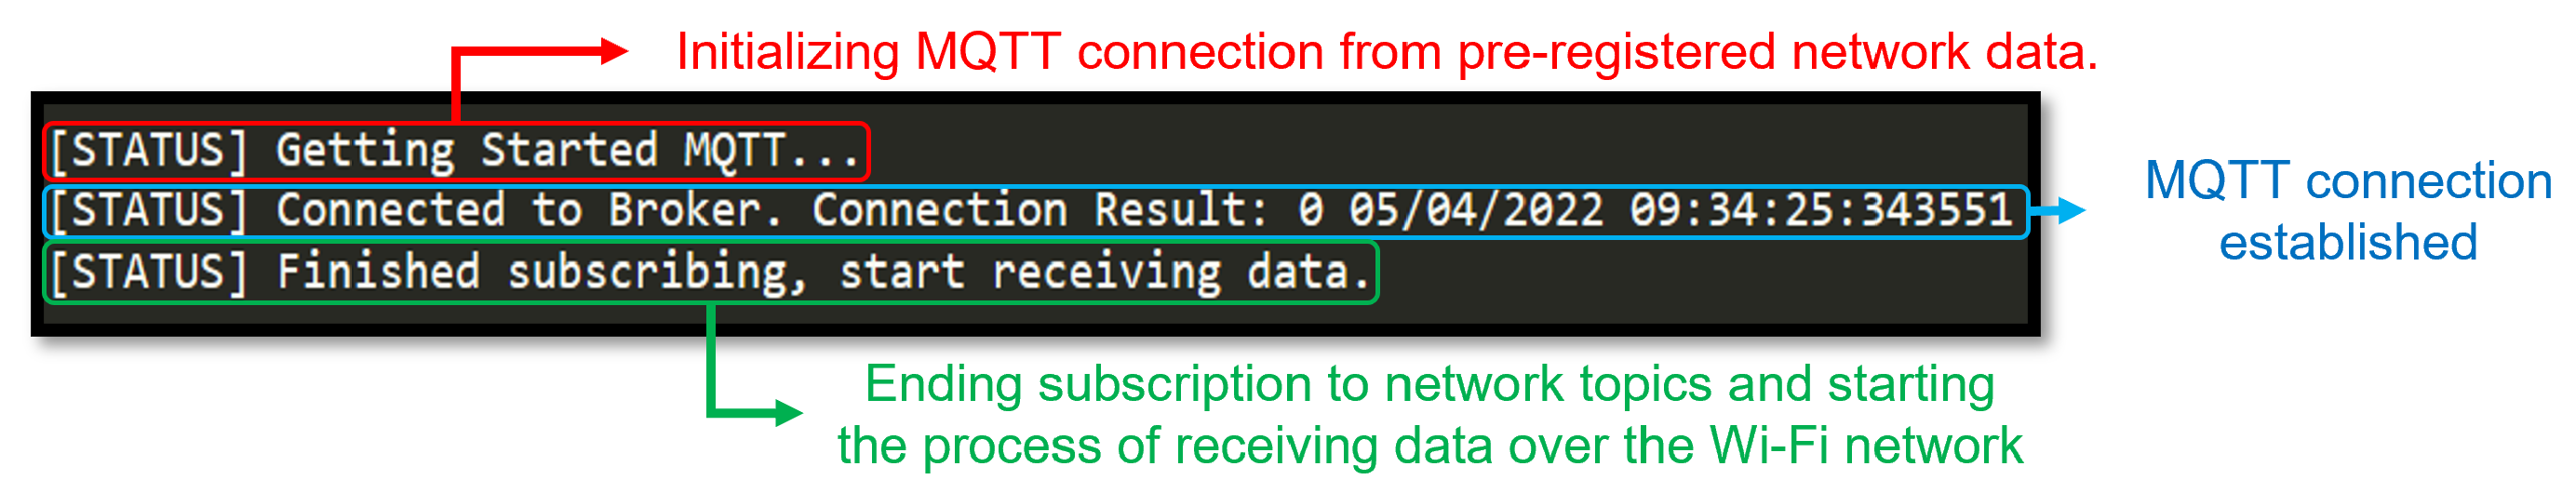
CSFs have been implemented to manage network services and store network configuration data. To illustrate the execution of this operational primitive,
Figure 15 exposes some of the logs from the CSF routines implemented in the ACU-BREAKER, obtained by debugging through the universal asynchronous receiver/transmitter (UART) serial interface. In a dual form, these logs also represent the establishment of the network connection made through the LAN interface to the ACU-ROUTER, which in turn establishes communication with the MQTT broker through the Internet.
6.2. Validation of ISFs and DRF Monitoring of Electrical Parameters
The message exchange process established through the ISFs made it possible to send requests and receive responses between the ACU-BREAKER and the supervision and control center (SCC). This was accomplished via encapsulated packets in JSON format, transmitted via the MQTT protocol with QoS 0. To validate this operational primitive, we captured the sending and receiving data logs from the communication service implemented in Python language in the SCC. From this, it was possible to configure the ACUs, calibrate them, and request the measured electrical parameters of each circuit, characterizing the DRF performed by the ACU-BREAKER.
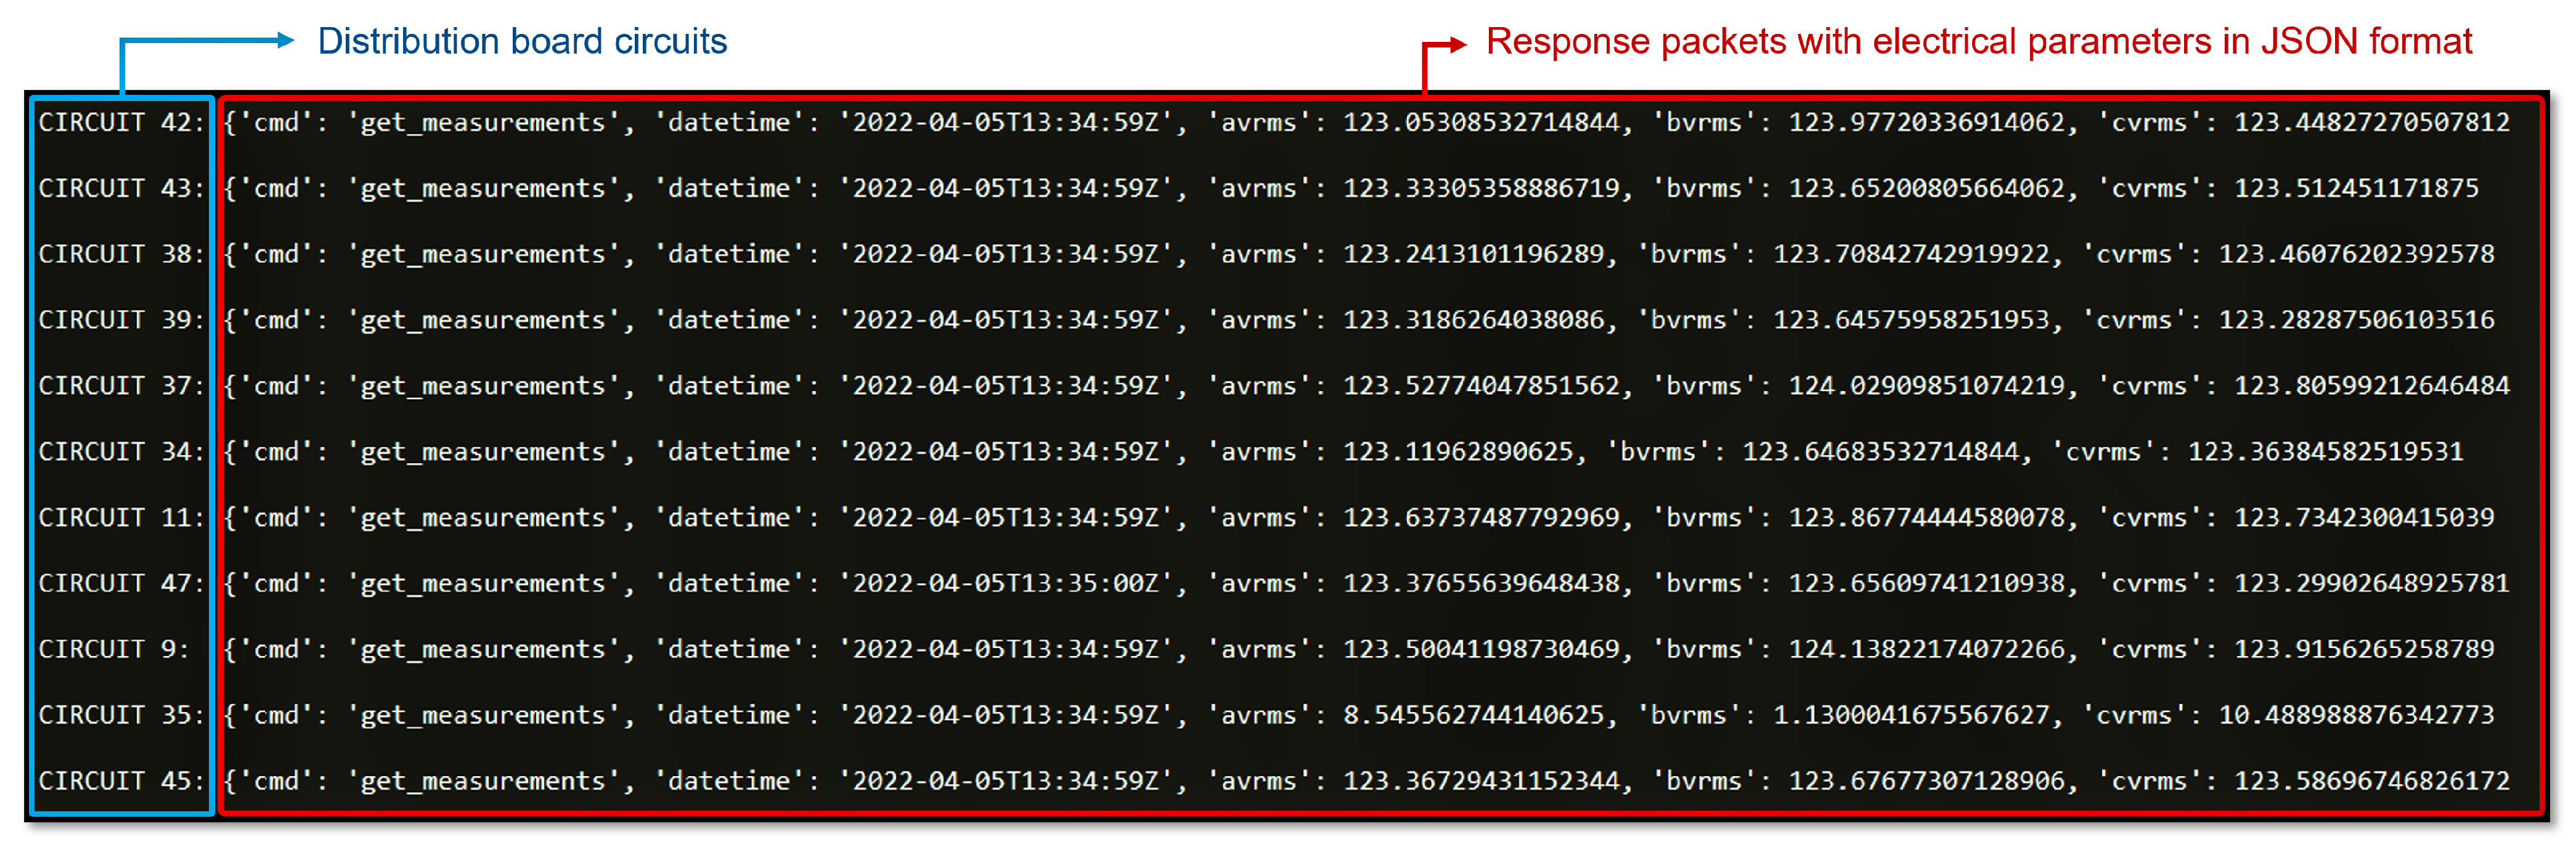
Figure 16 illustrates the logs of the responses of the electrical parameter requests made to the ACU-BREAKER connected to the different circuits of the legacy power distribution board.
It can be seen in the “datetime” field that the electrical parameters were collected at practically the same timestamp, which characterizes the synchronism of the proposed real-time system. In circuit 35, the measured voltages are far below the nominal voltage (127
), indicating an undervoltage event. Note that the voltages of phases A and B of the other circuits are below the nominal voltages, but within the 5% of variation allowed according to the resolution of quality of electric power supply established by ANEEL [
66].
6.3. SCC Interfaces
The proposed SCC has the premise of enabling real-time energy management with resources for analysis of power quality and energy efficiency, which is one of the contributions of this work. Its access was accomplished by accrediting users through a login and security key after accessing the address and TCP port of the cloud virtual machine where the application was installed. With the software services in operation, it was necessary to develop interfaces that indicated changes in the power factor, energy demand, monitored electrical quantities and quality of service parameters such as overvoltage and overcurrent [
67]. The electrical parameters provide subsidies for the analysis of energy quality, which ensure the reliability of the electrical energy supply service also in low-voltage consumer units [
68]. Thus, the importance of this monitoring is justified.
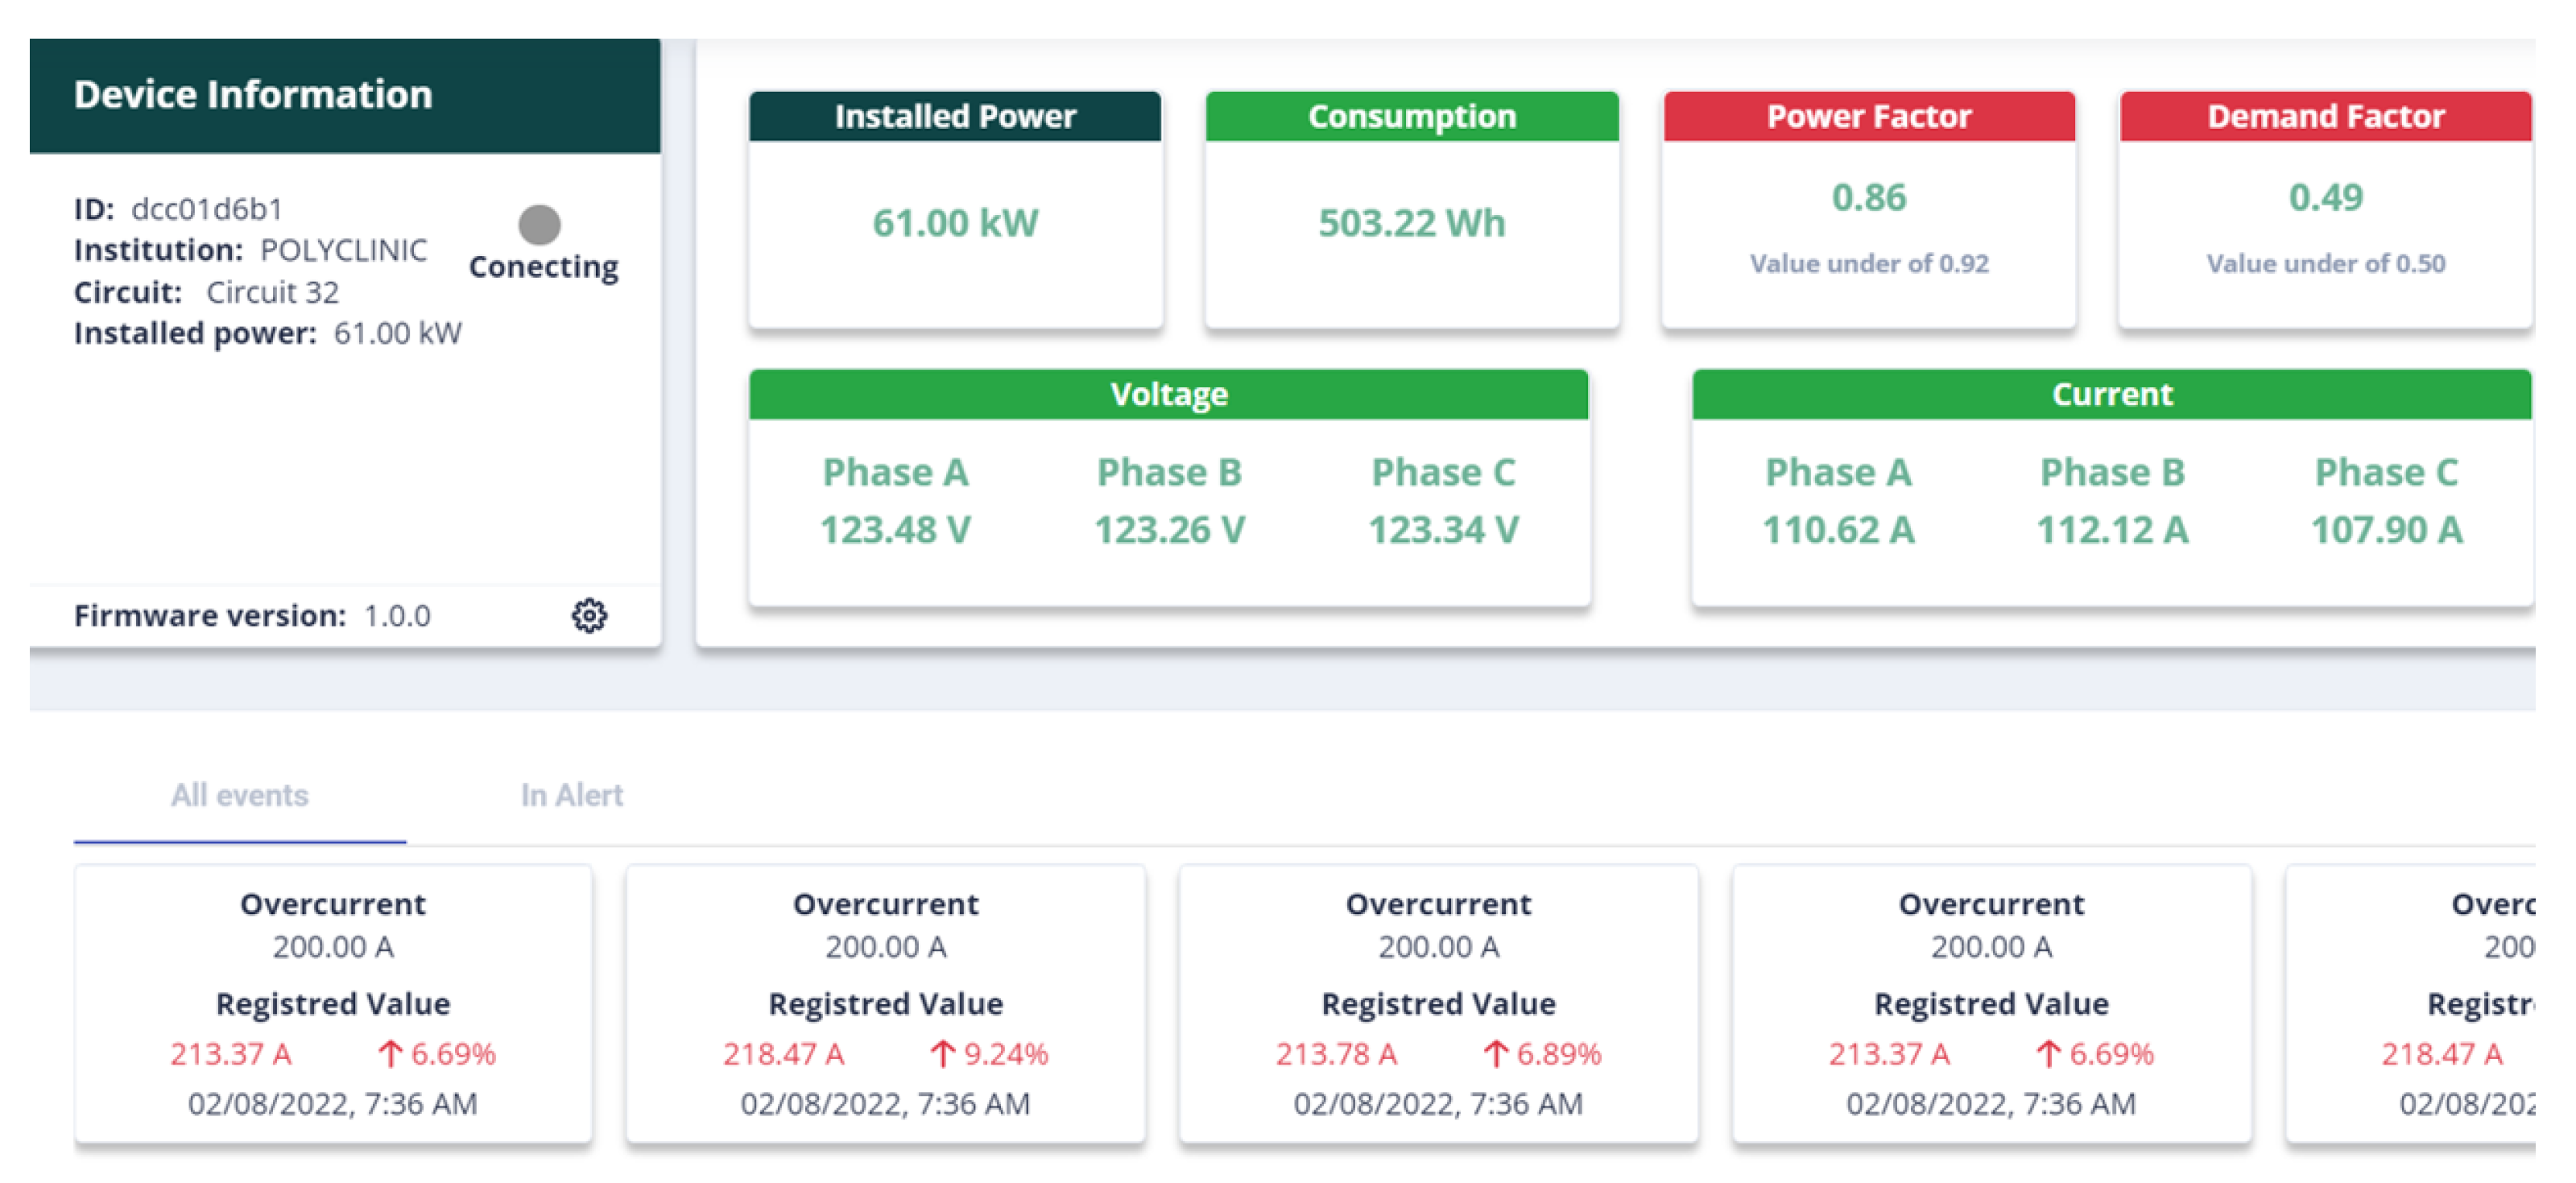
Figure 17 illustrates the interface developed to identify the ACUs in operation associated with each circuit in the frame, including a dashboard to view the instantaneous electrical quantities per phase, the power factor and demand factor, the installed power of the circuit, energy consumption and events related to power quality and energy efficiency. In the “Device Information” field, the unique identification of the ACU in the network (ID) is noted. The consumer unit is also informed, along with the circuit ID (Circuit 32), the installed power and the firmware version of the ACU. There is an indicator as to whether the ACU is connected or not. The field that exposes the occurred events presents the time (timestamp) of occurrence and which event occurred, the value and the percentage of variation of the parameter in relation to the nominal conditions. In
Figure 17, the ACU of this circuit has identified consecutive overcurrent events.
In the dashboard, the cards signal in red the nonconformities with the observed parameters. The demand factor, for example, which represents the ratio of active power measured by the installed power, is below 50%. This value was the threshold set for this metric for analyzing the usage of each circuit in the facility. We established with the building’s engineering team that below 50%, the circuit would be underutilized; hence, the definition of this threshold, for this case.
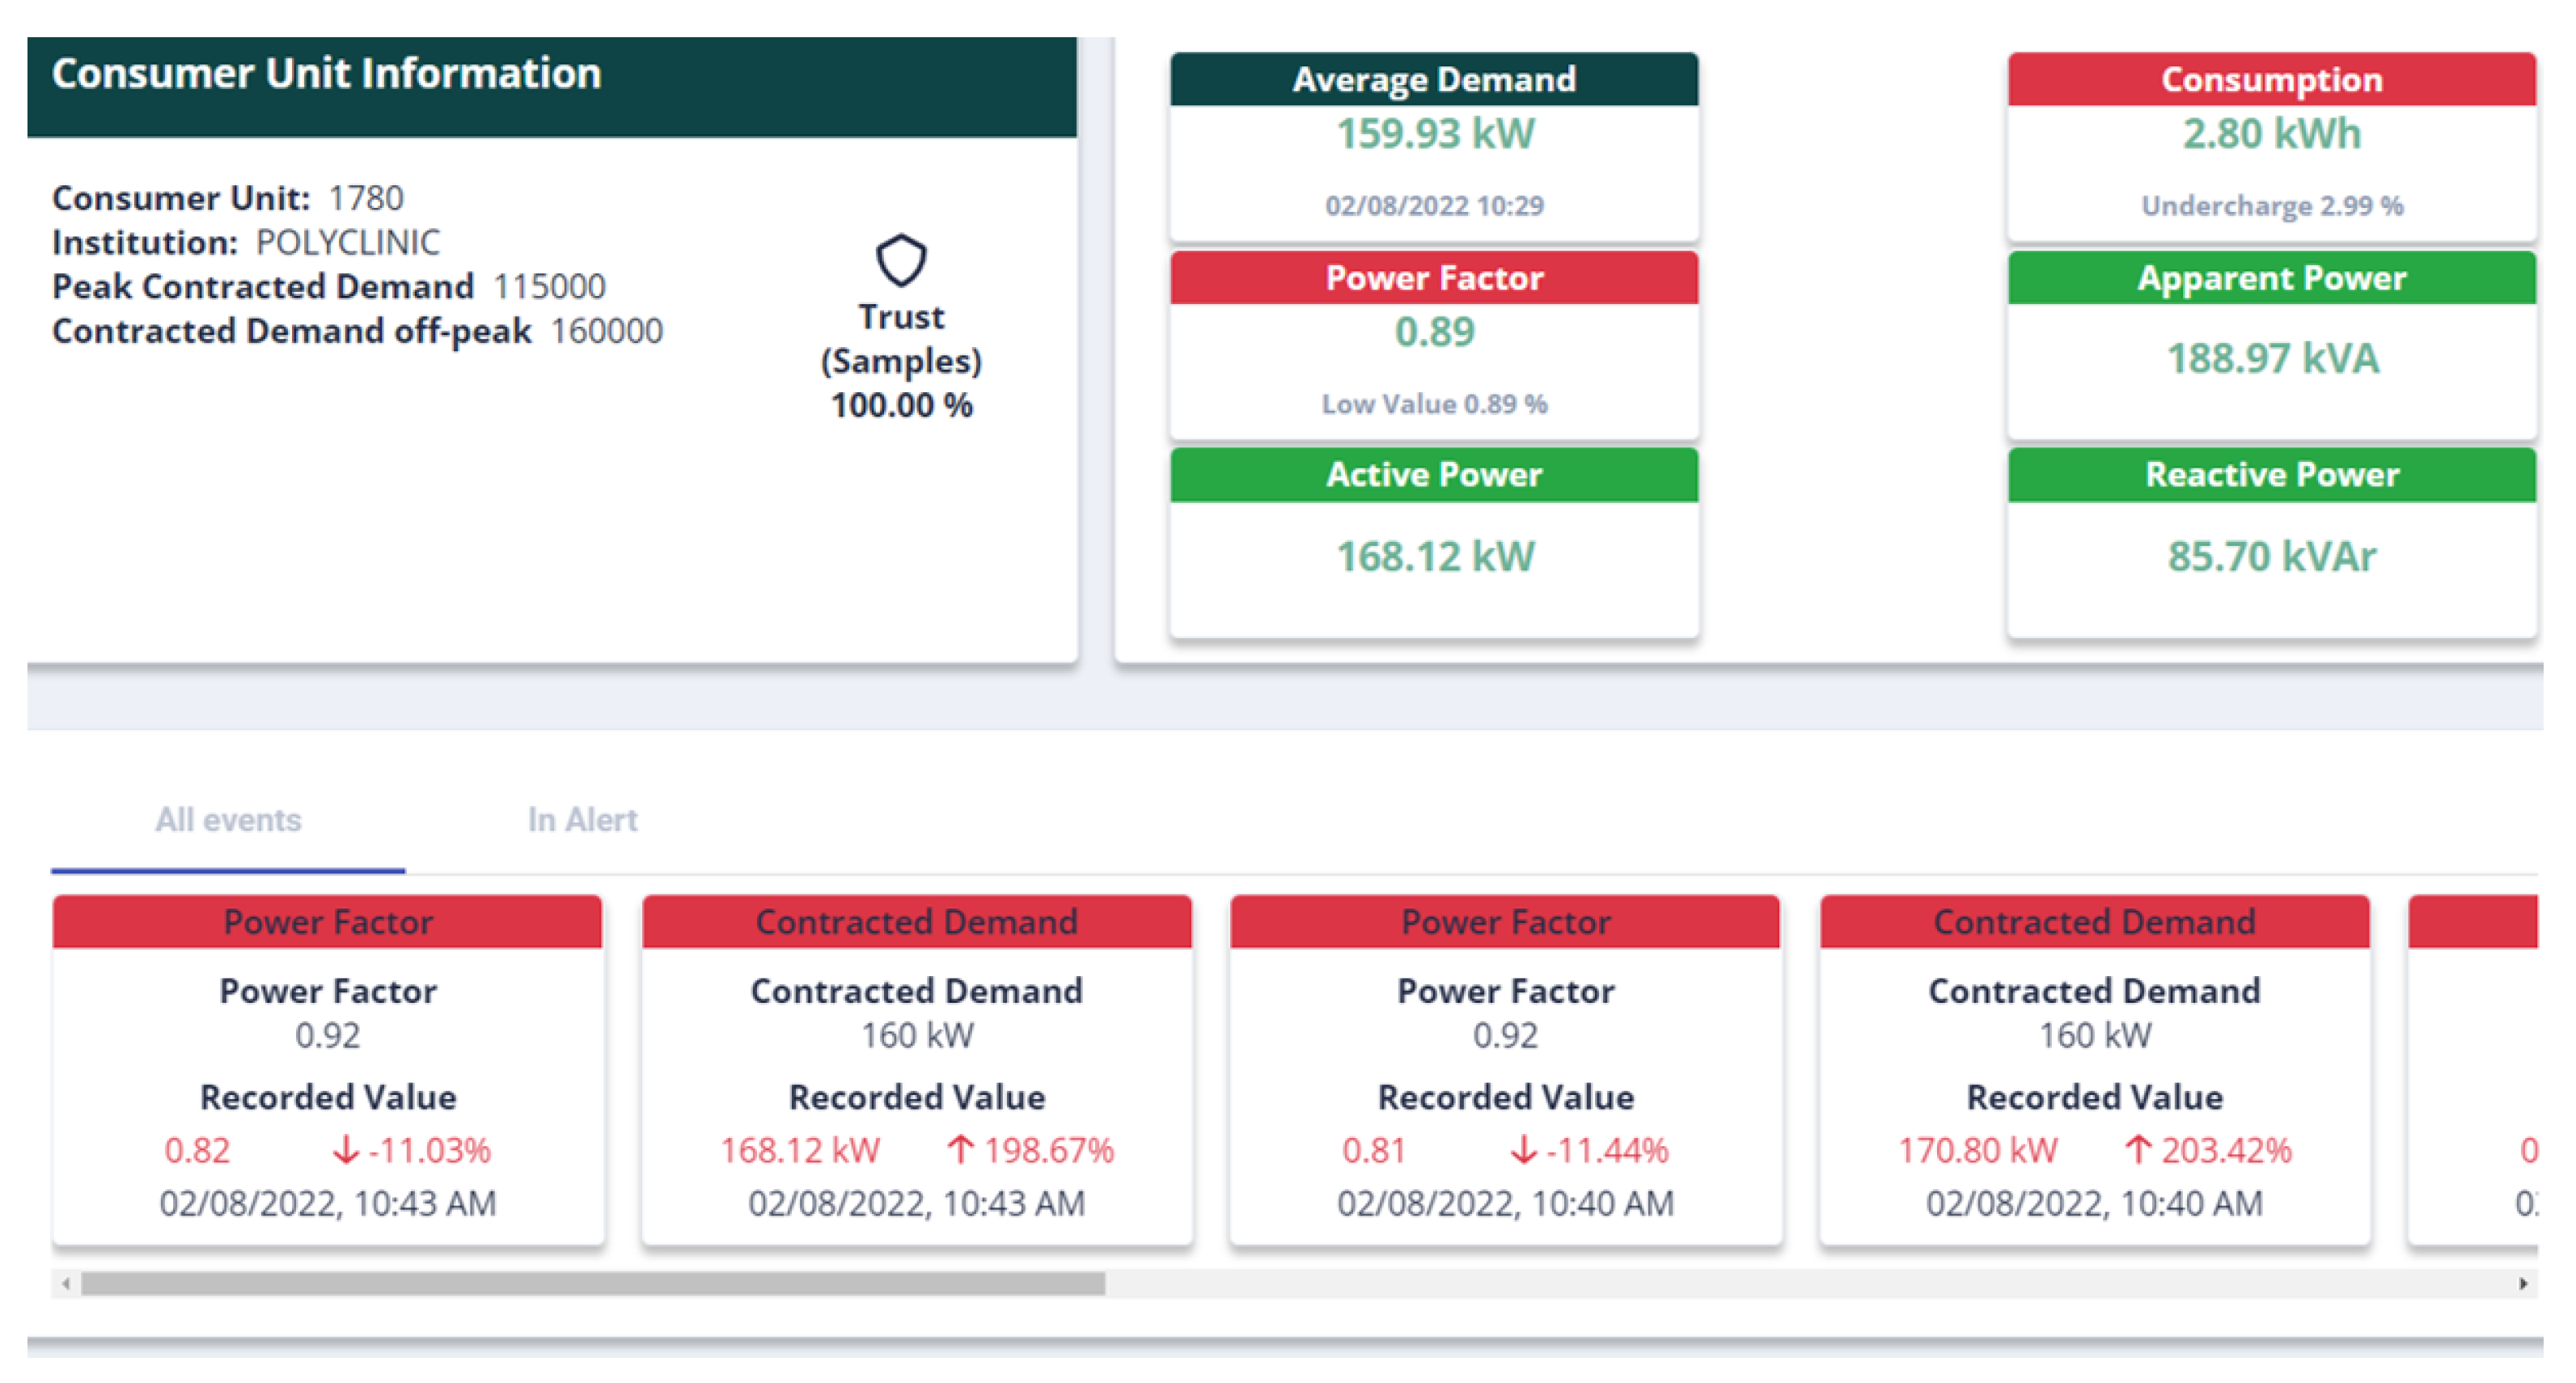
Similarly,
Figure 18 exposes the information resulting from the consumer unit, based on the parameters monitored by the ACUs. In the “Consumer Unit Information” field, one can see the consumer unit identification (1780), the consumer unit, and the values of the demands contracted by the utility at peak (115 kW) and off-peak (160 kW) hours. In the dashboard on the side it is possible to view the last registered values of the power factor, active, apparent and reactive power, and energy consumption. According to module 8 of the Brazilian normative resolution ANEEL nº 956/2021, a power factor of the installation below 0.92 results in fines in the energy bill, and this is the threshold for this ratio [
66]. In
Figure 17 and
Figure 18, respectively, it is possible to observe the power factor card of circuit 32 and the installation in red, as they are below the previously defined threshold. In addition,
Figure 18 exposes alerts that identify events of exceeding the demand contracted by the utility in off-peak hours, thus events signaling the reduction of the facility’s power factor below 0.92.
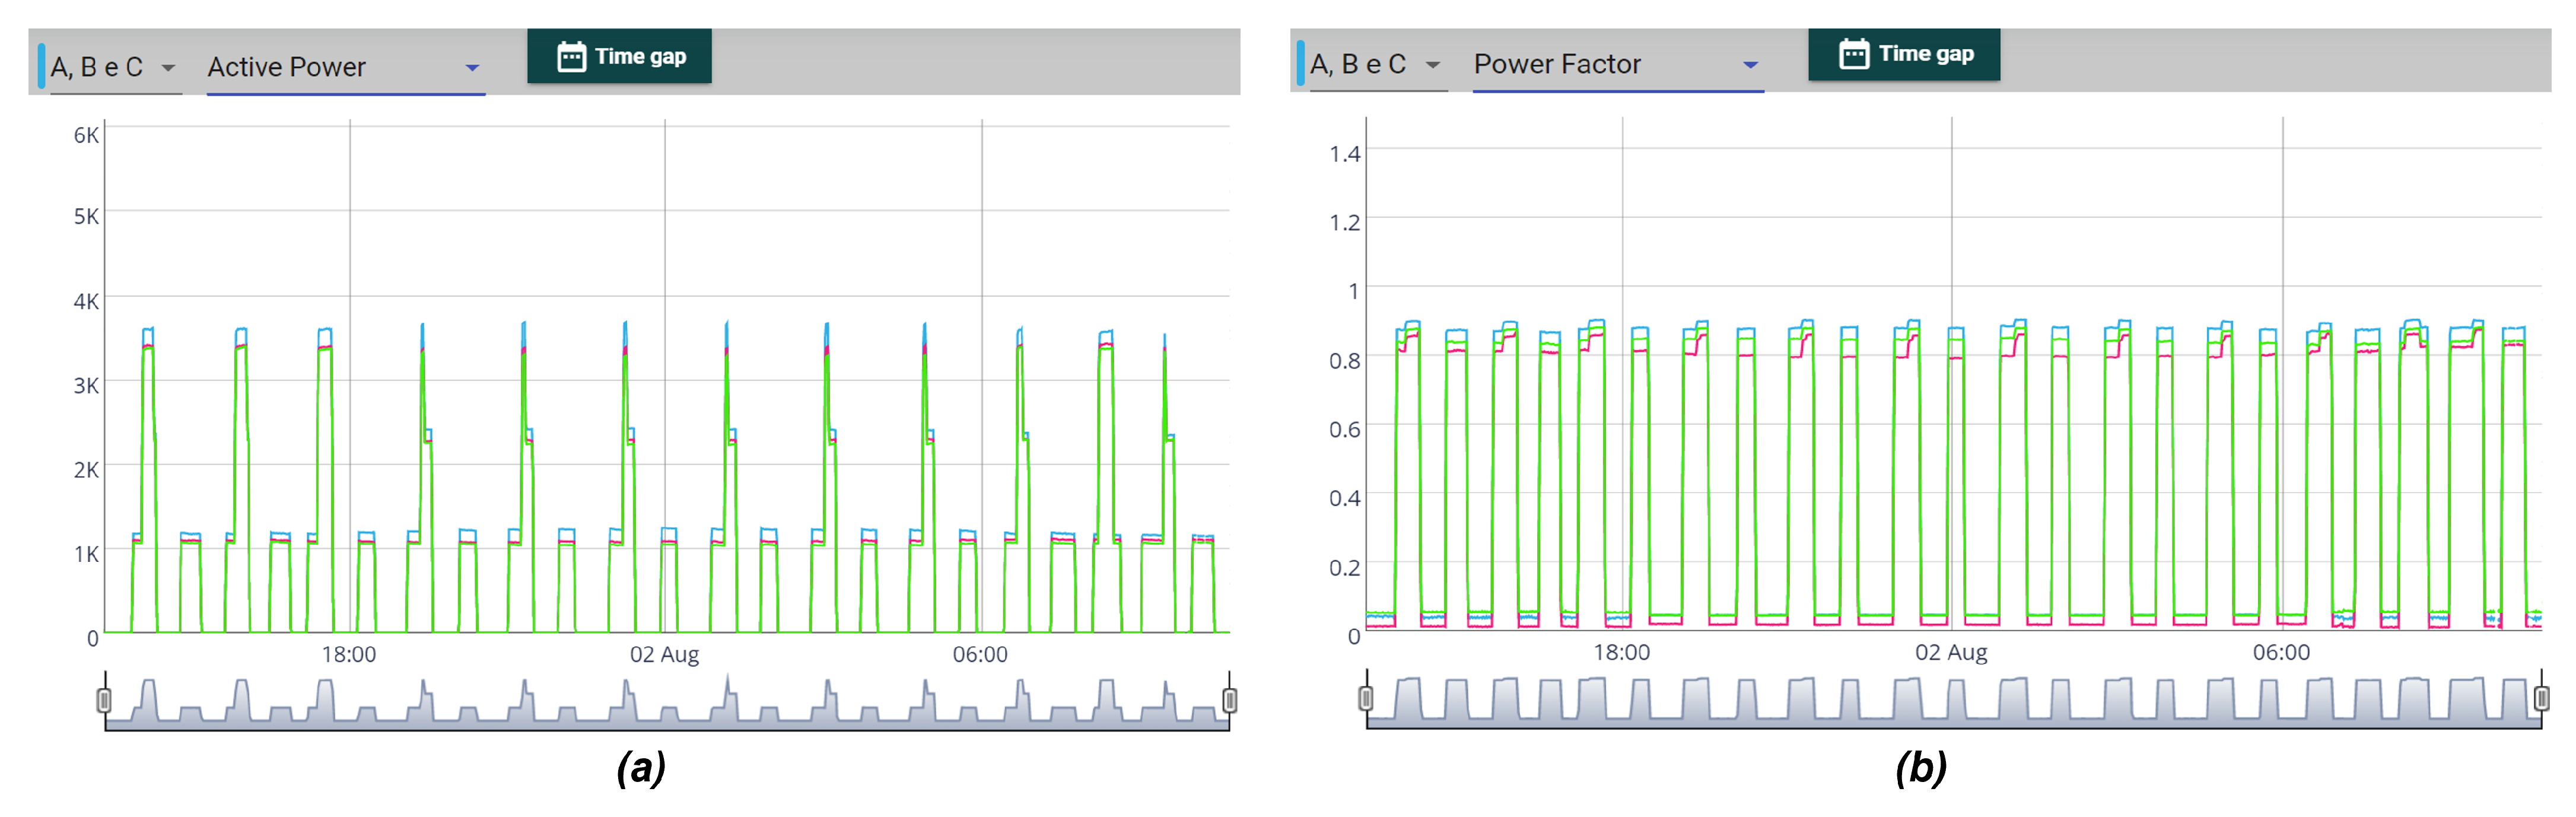
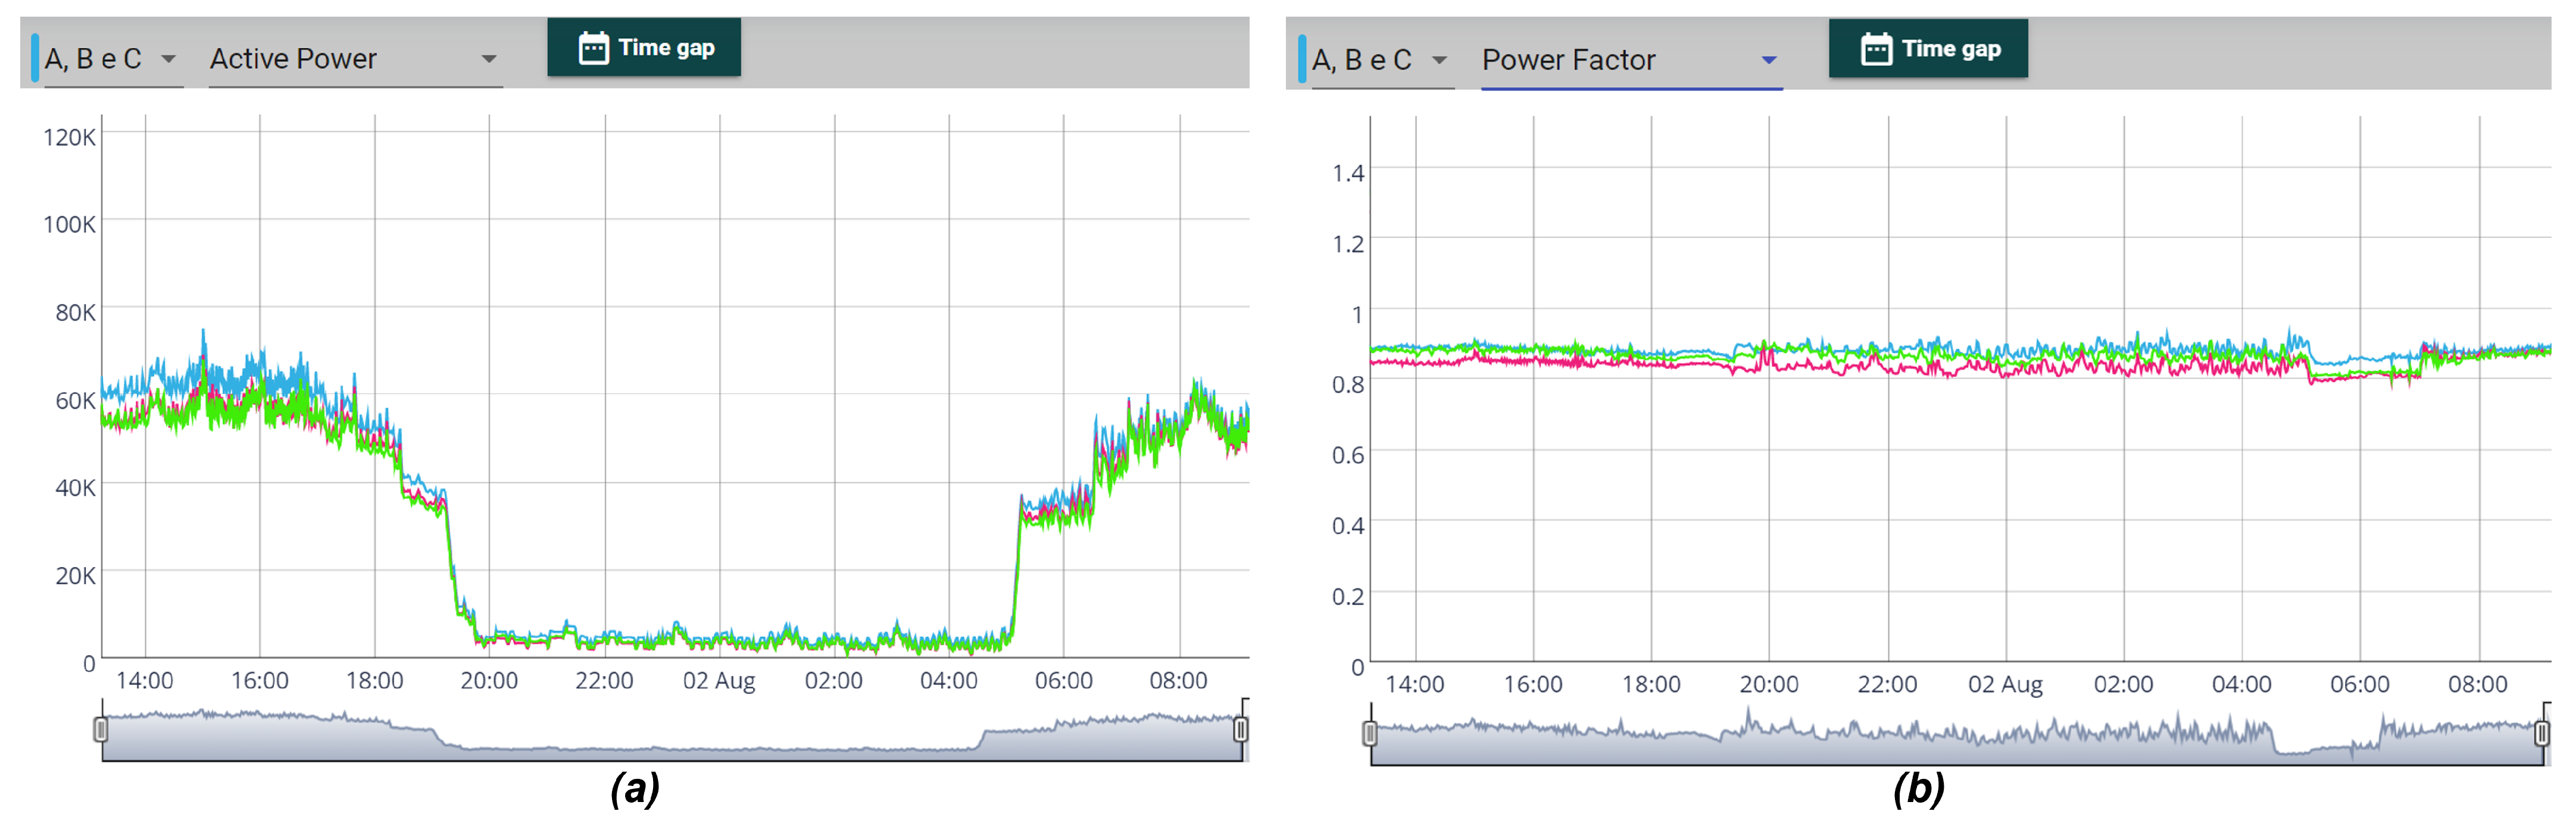
By using the SCC, it is also possible to observe the time series collected from the ACUs.
Figure 19 and
Figure 20 expose the active power (a) and the power factor (b) of circuit 47 of the facility and the consumer unit, respectively. Circuit 47 supplies a refrigeration compressor in the installation. In these figures, phases A, B, and C are represented by the curves in blue, red, and green, respectively. The time graphics display up to two monitored electrical quantities per phase or the graphics of the three phases of a single parameter. It should be noted that the viewing history can be selected through the time gap icon and that below the graph the instantaneous values of the quantities are displayed as the cursor is positioned on the screen. In
Figure 19 and
Figure 20, the visualization period is from 1–2 August 2022.
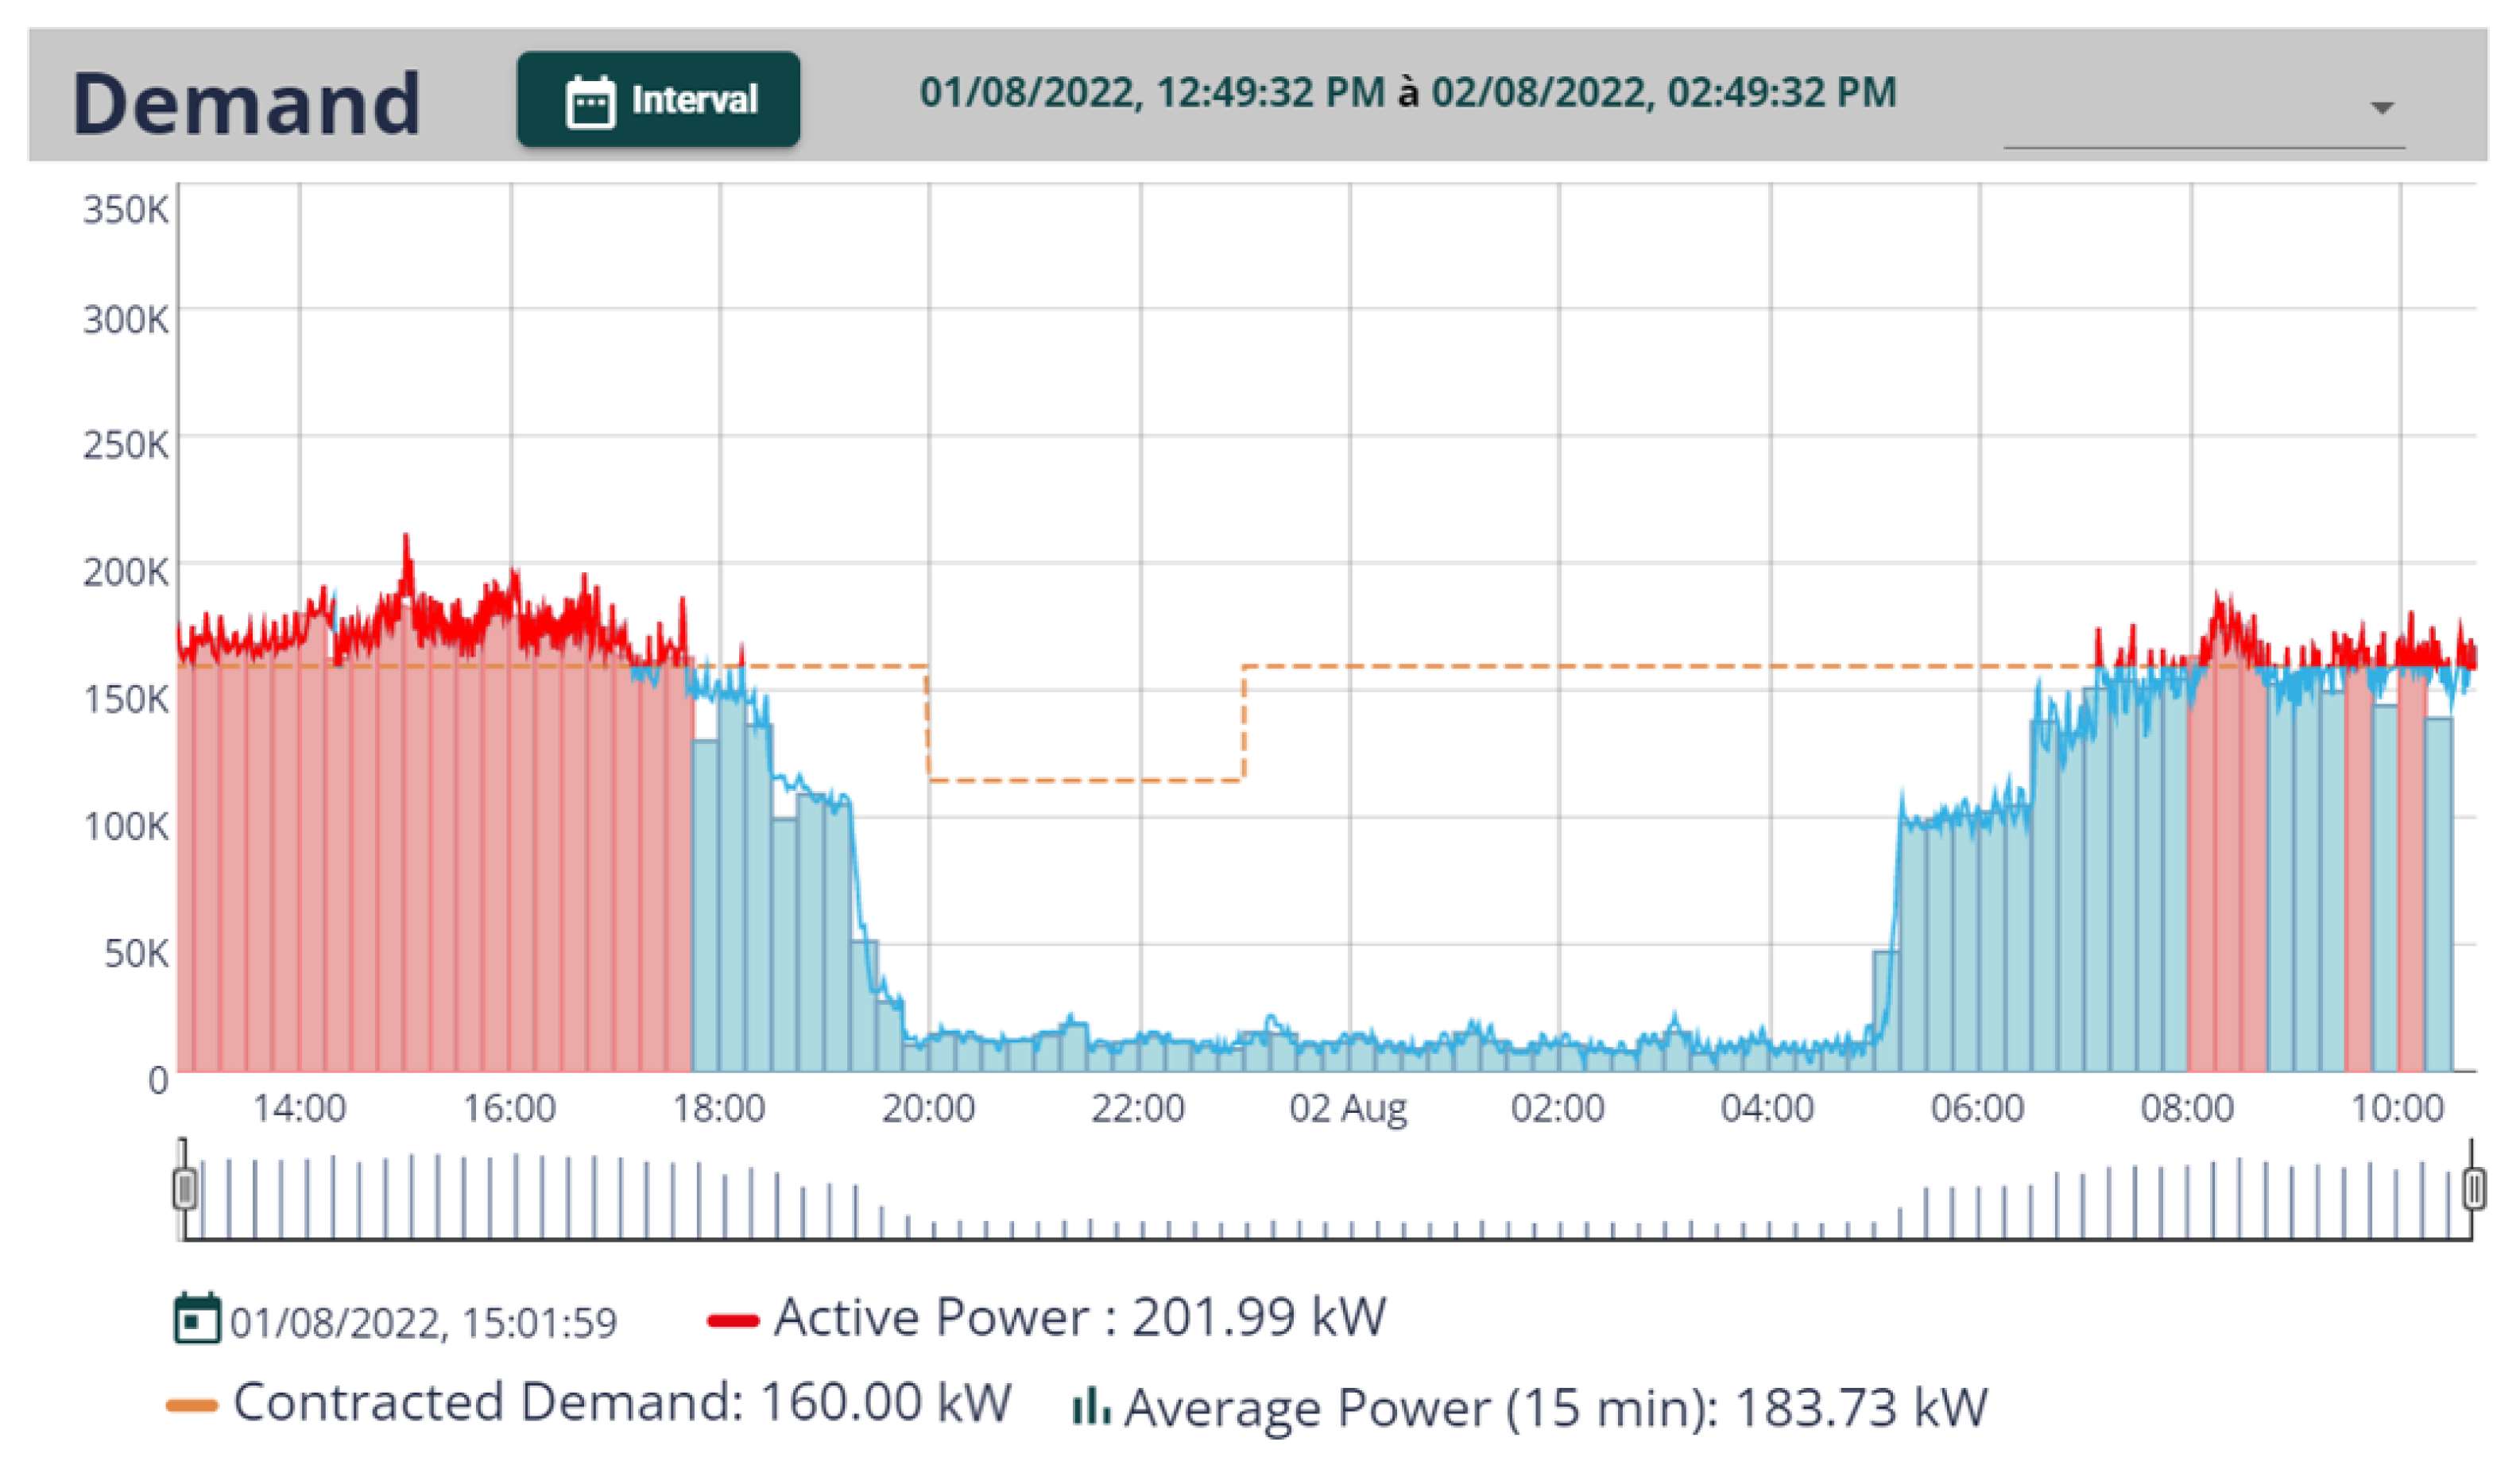
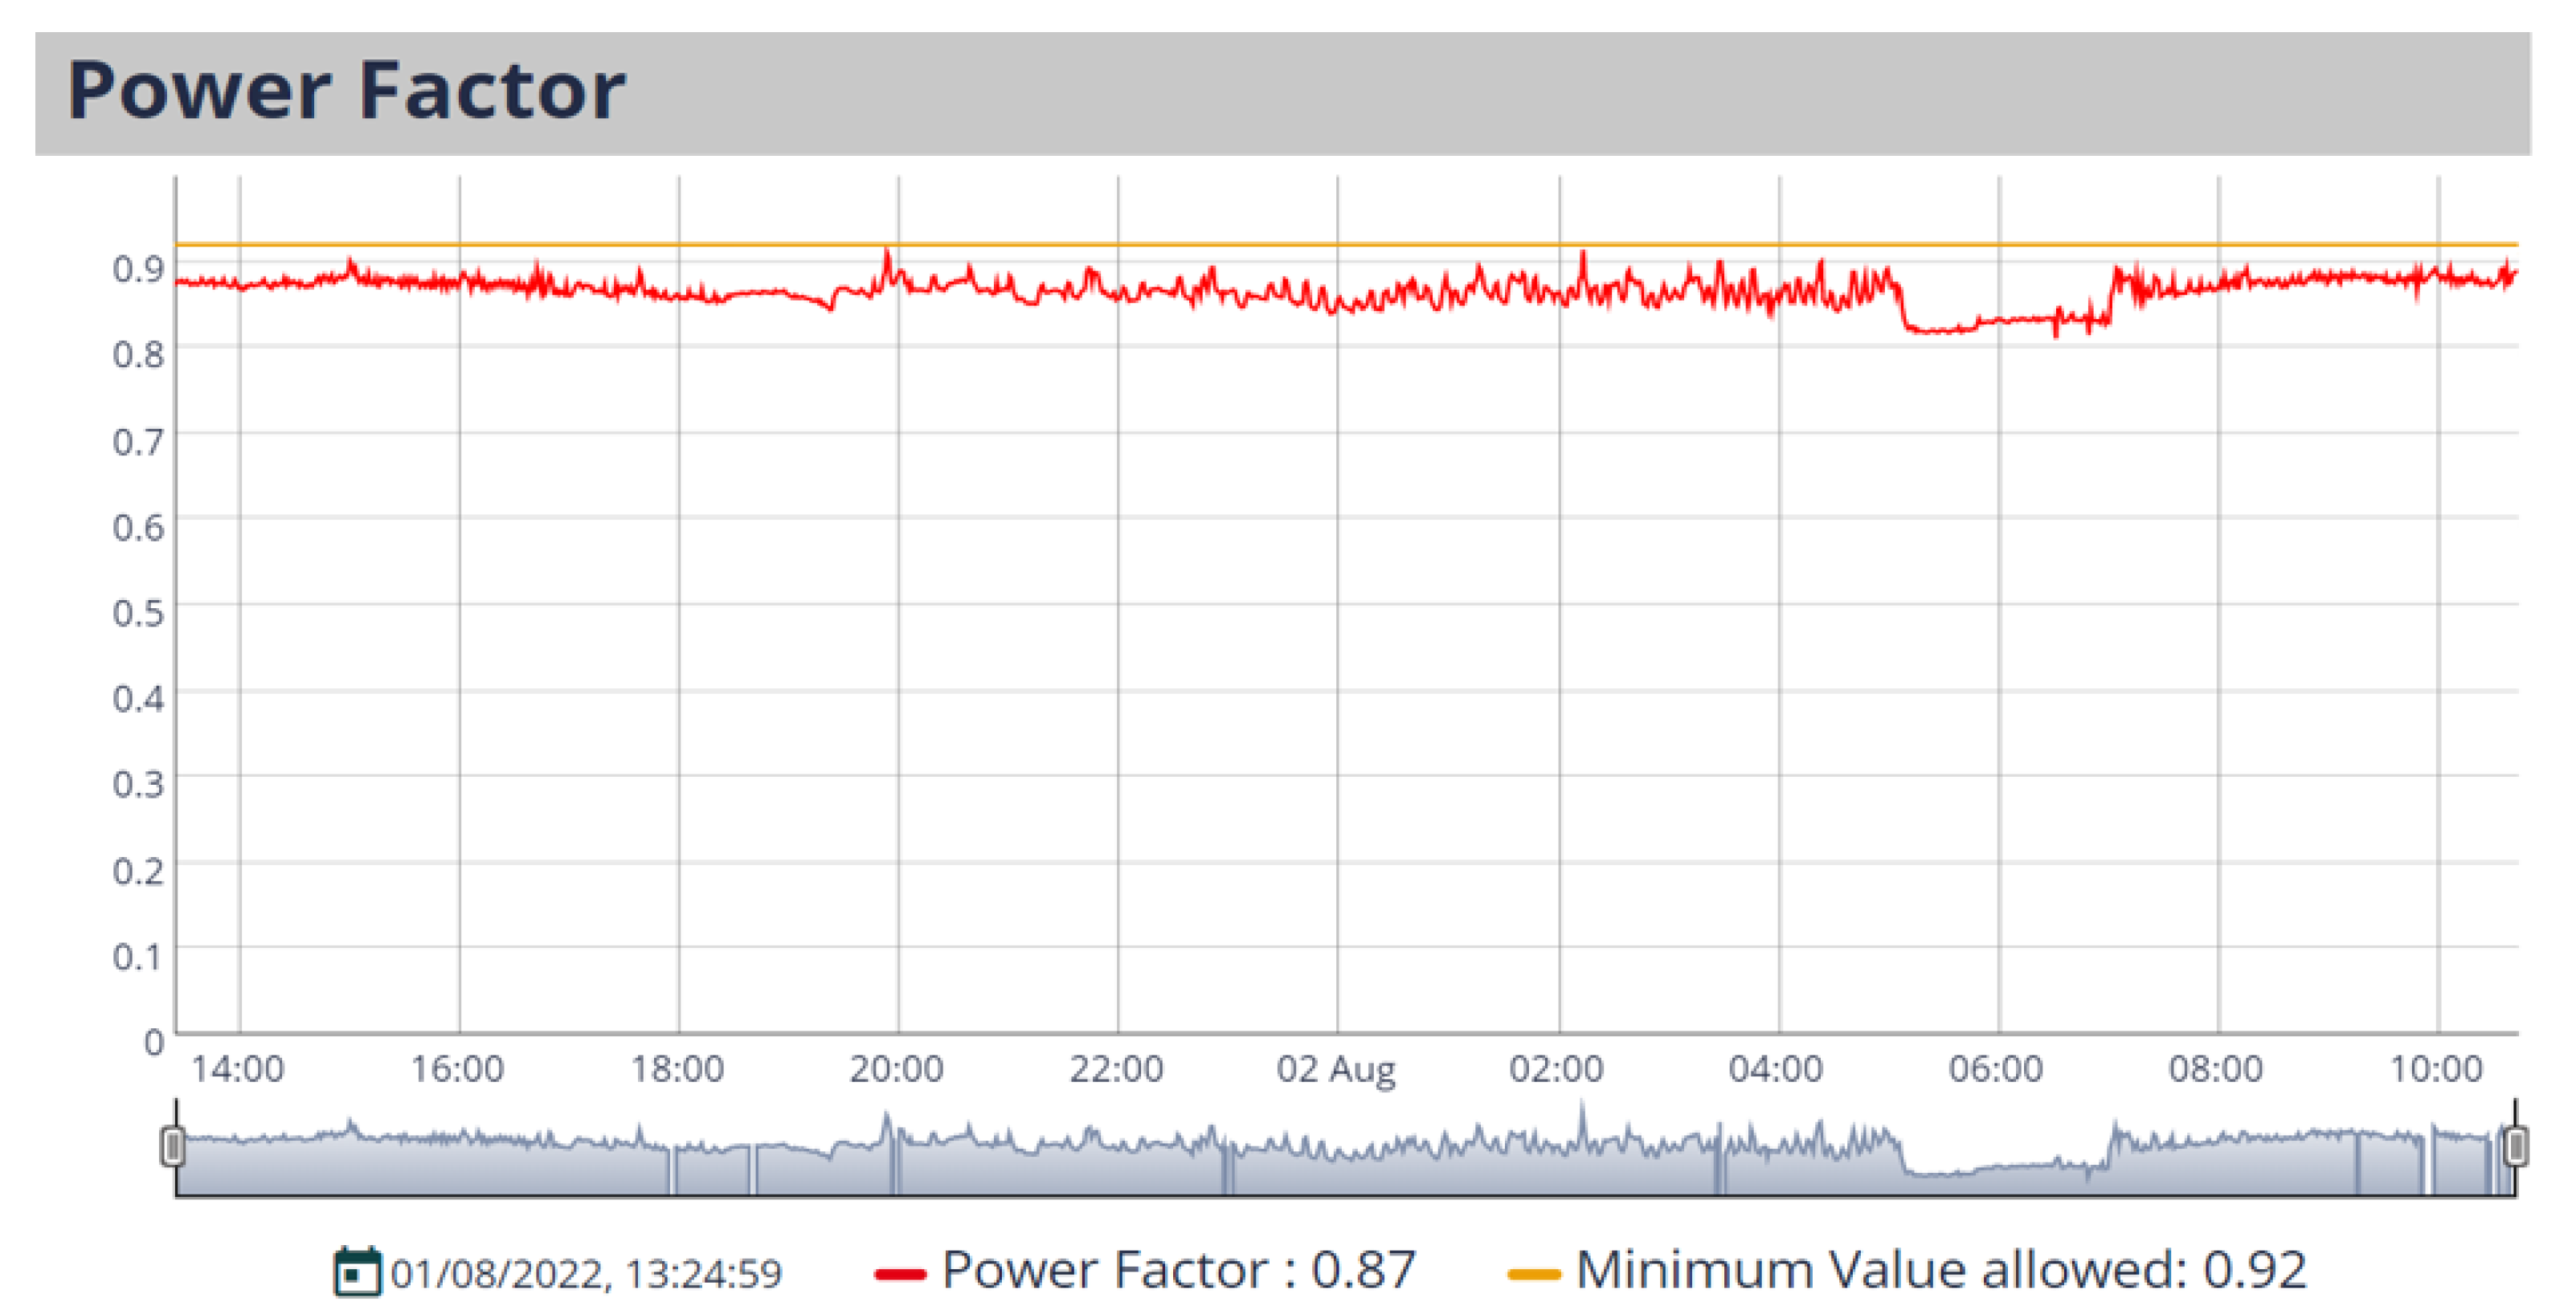
To visualize the demand and the power factor of the consumer unit with respect to the contract previously established with the utility from the monitored board, we developed differentiated interfaces for analyzing the demand and the power factor. During the same period from 1–2 August 2022,
Figure 21 and
Figure 22 illustrate the three-phase energy demand and power factor of the installation, respectively. In
Figure 21, the three-phase power resulting from the active power of each phase of the consumer unit is observed. As established in the Brazilian normative resolution ANEEL no. 1000/2021, the measured demand must be computed from the average of the three-phase active power every 15 min [
69]. Thus, we show in
Figure 21 a bar graph to illustrate the demand measured every 15 min of monitoring. We insert the dotted orange curve to represent the demand contracted by the utility at peak and off-peak times. At times when the bar graphs are red, it shows the excess of contracted demand. Otherwise, the graph remains blue. Below the graph, as we position the cursor on the screen, the instantaneous parameters of the graph are shown. On the other hand,
Figure 22 shows the installation’s power factor, including the limit line that establishes the minimum power factor (0.92).
6.4. Case Study with Proposed System
In Brazil, the consumer units can be classified according to the tariff group, according to the contracting options defined by the National Agency of Electric Energy in the Brazilian normative resolution ANEEL n° 1000/2021 [
69]. Consumer units of group A are usually medium and high-voltage consumers (industrial, shopping malls, buildings), while consumer units of group B are low-voltage consumers (houses, apartments) [
70,
71]. Although group B consumer units are charged only for energy consumption, group A consumer units are said to be binomial, and can be charged both for energy consumption and for an energy demand previously contracted with the energy provider [
72]. In addition, if the average demand of the 15 min is higher than the contracted demand, the consumer unit will pay a fine for exceeding the demand.
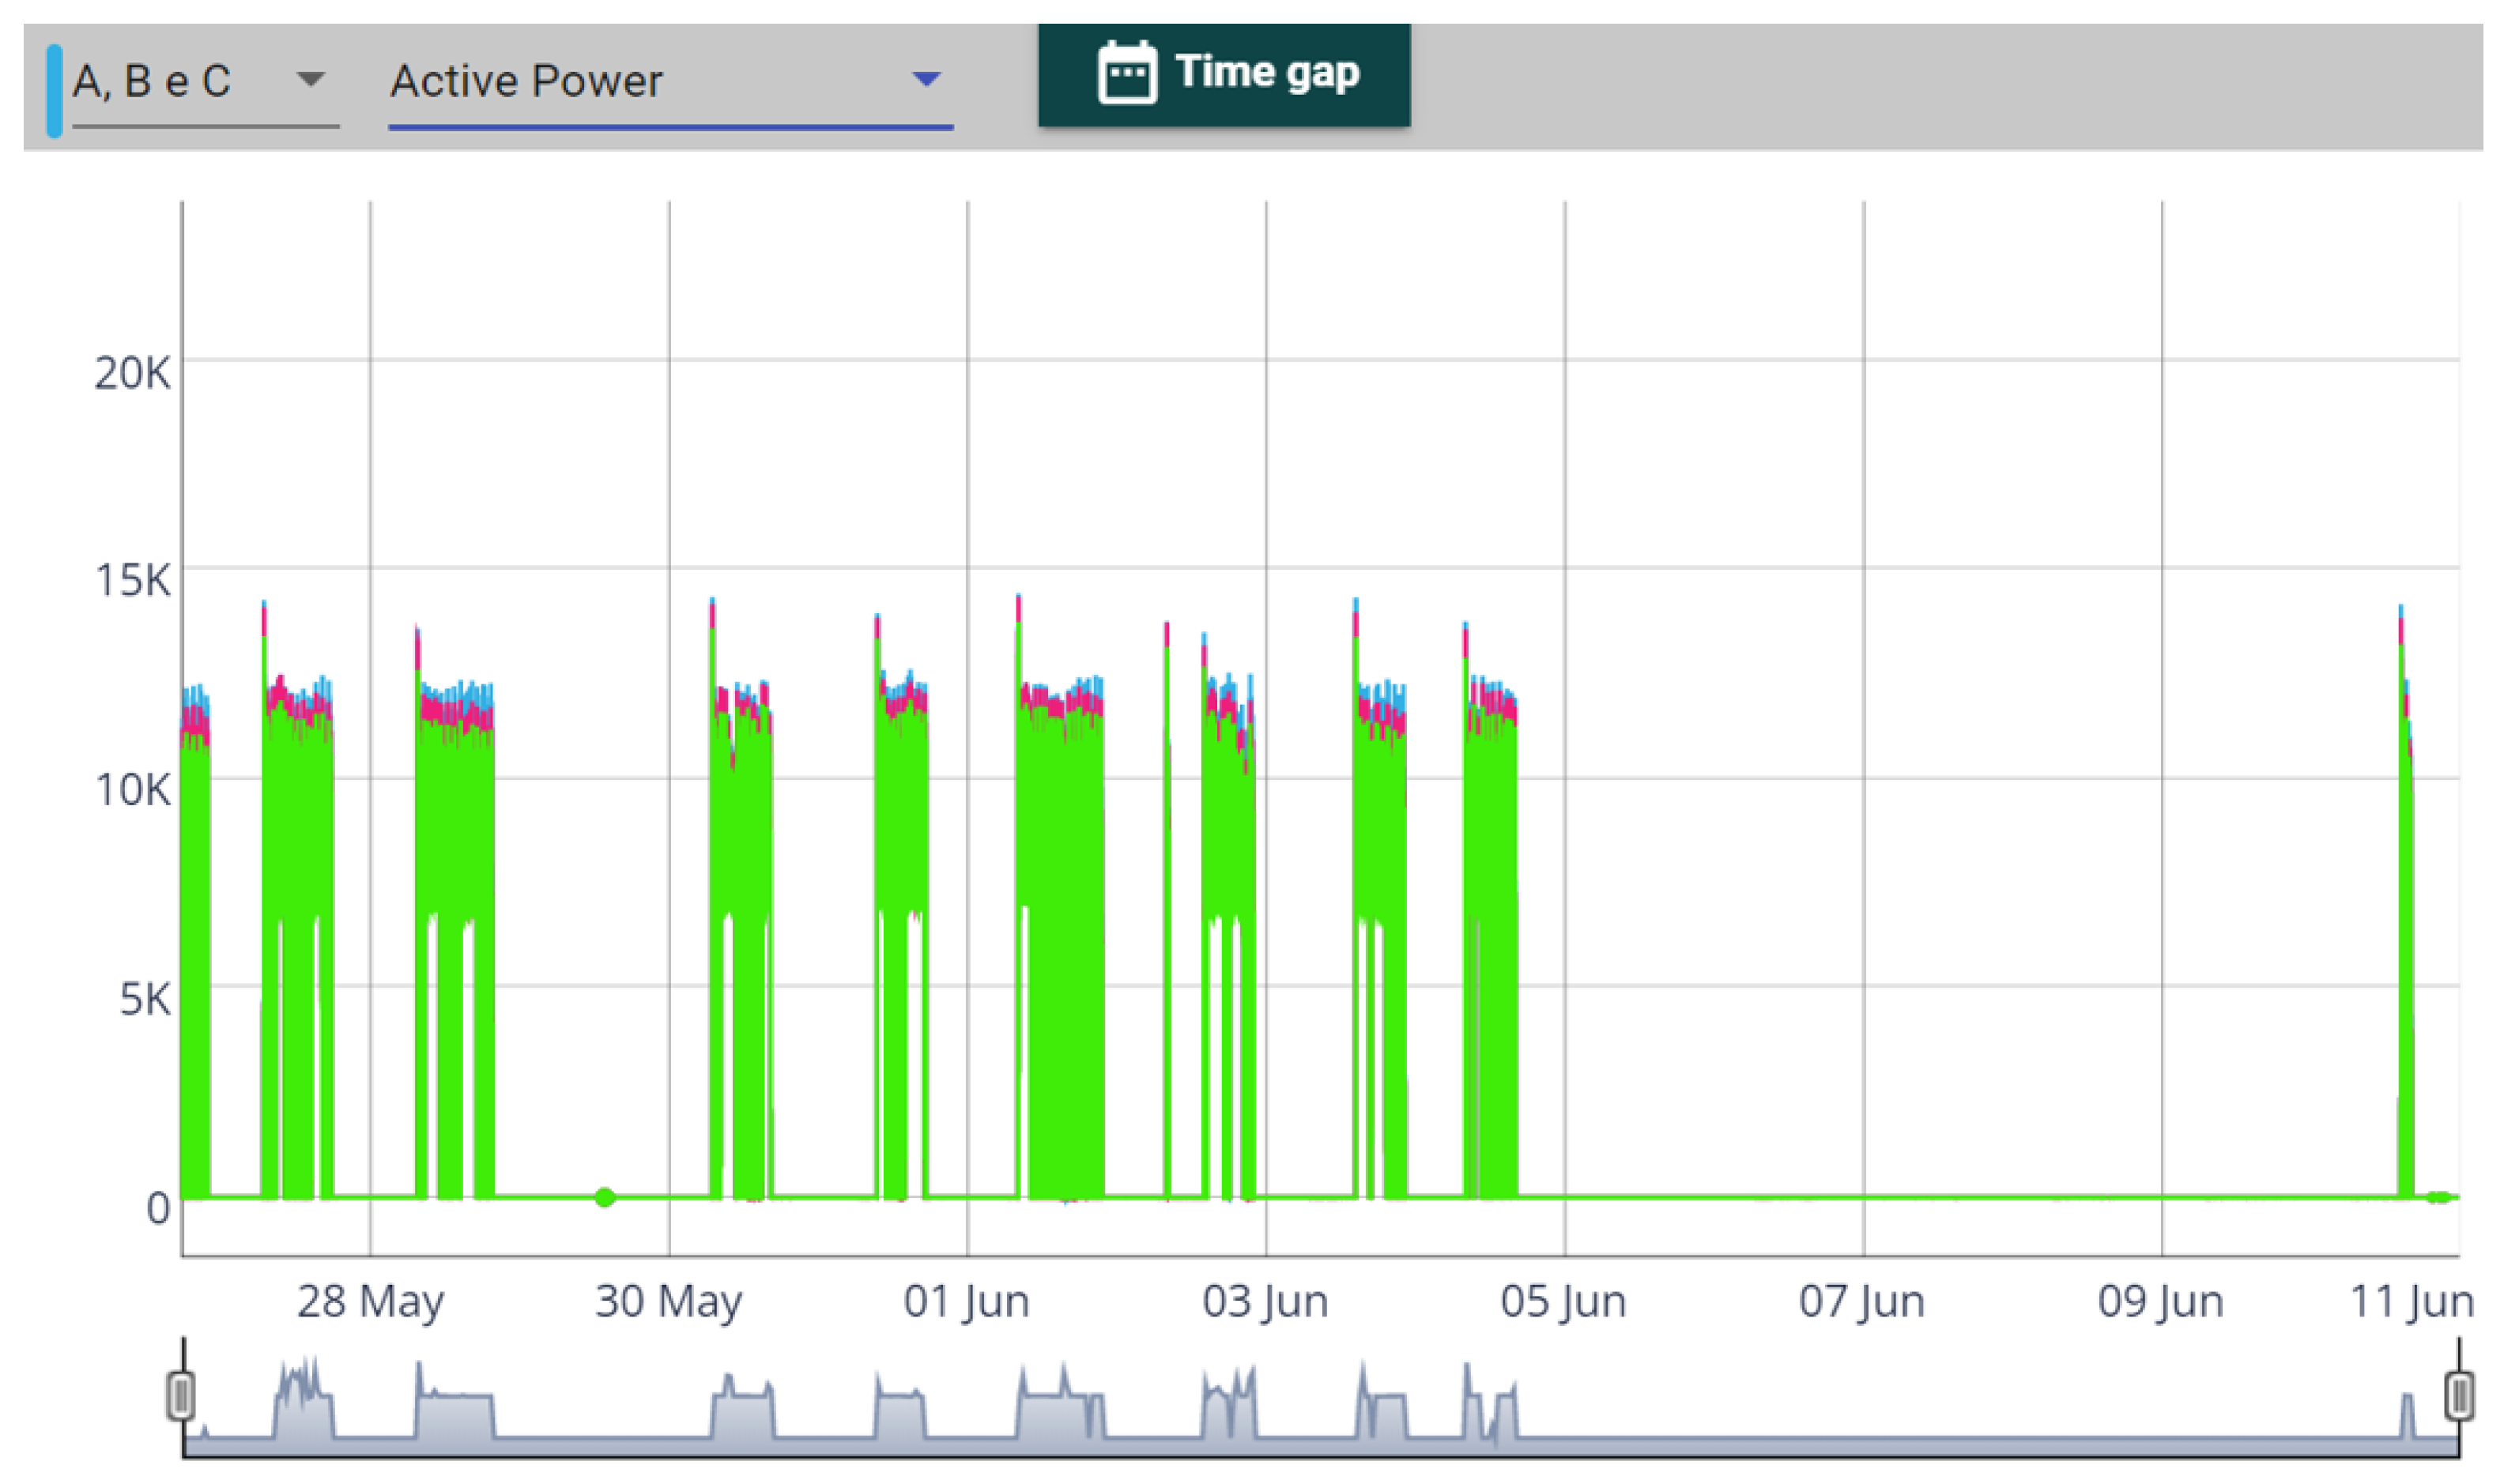
The dental polyclinic of the State University of Amazonas fits in group A and has a contracted off peak demand of 160 kW and peak demand of 115 kW since its inauguration. Currently, the university usually receives monthly increases in its energy bill as a result of excessive energy consumption and excess demand. Subsequently, we identified that since the inauguration, some equipment has been installed in the polyclinic, which has led to increased energy demand. An example of this is circuit 32, which represents the circuit of a compressed air compressor that serves all floors of the facility. Through the ACU-BREAKER responsible for monitoring this circuit, we identified that it is responsible for raising the demand by about 42 kW, approximately 14 kW per phase, as illustrated in
Figure 23. In this figure, phases A, B, and C are represented, respectively, by the curves in blue, red, and green.
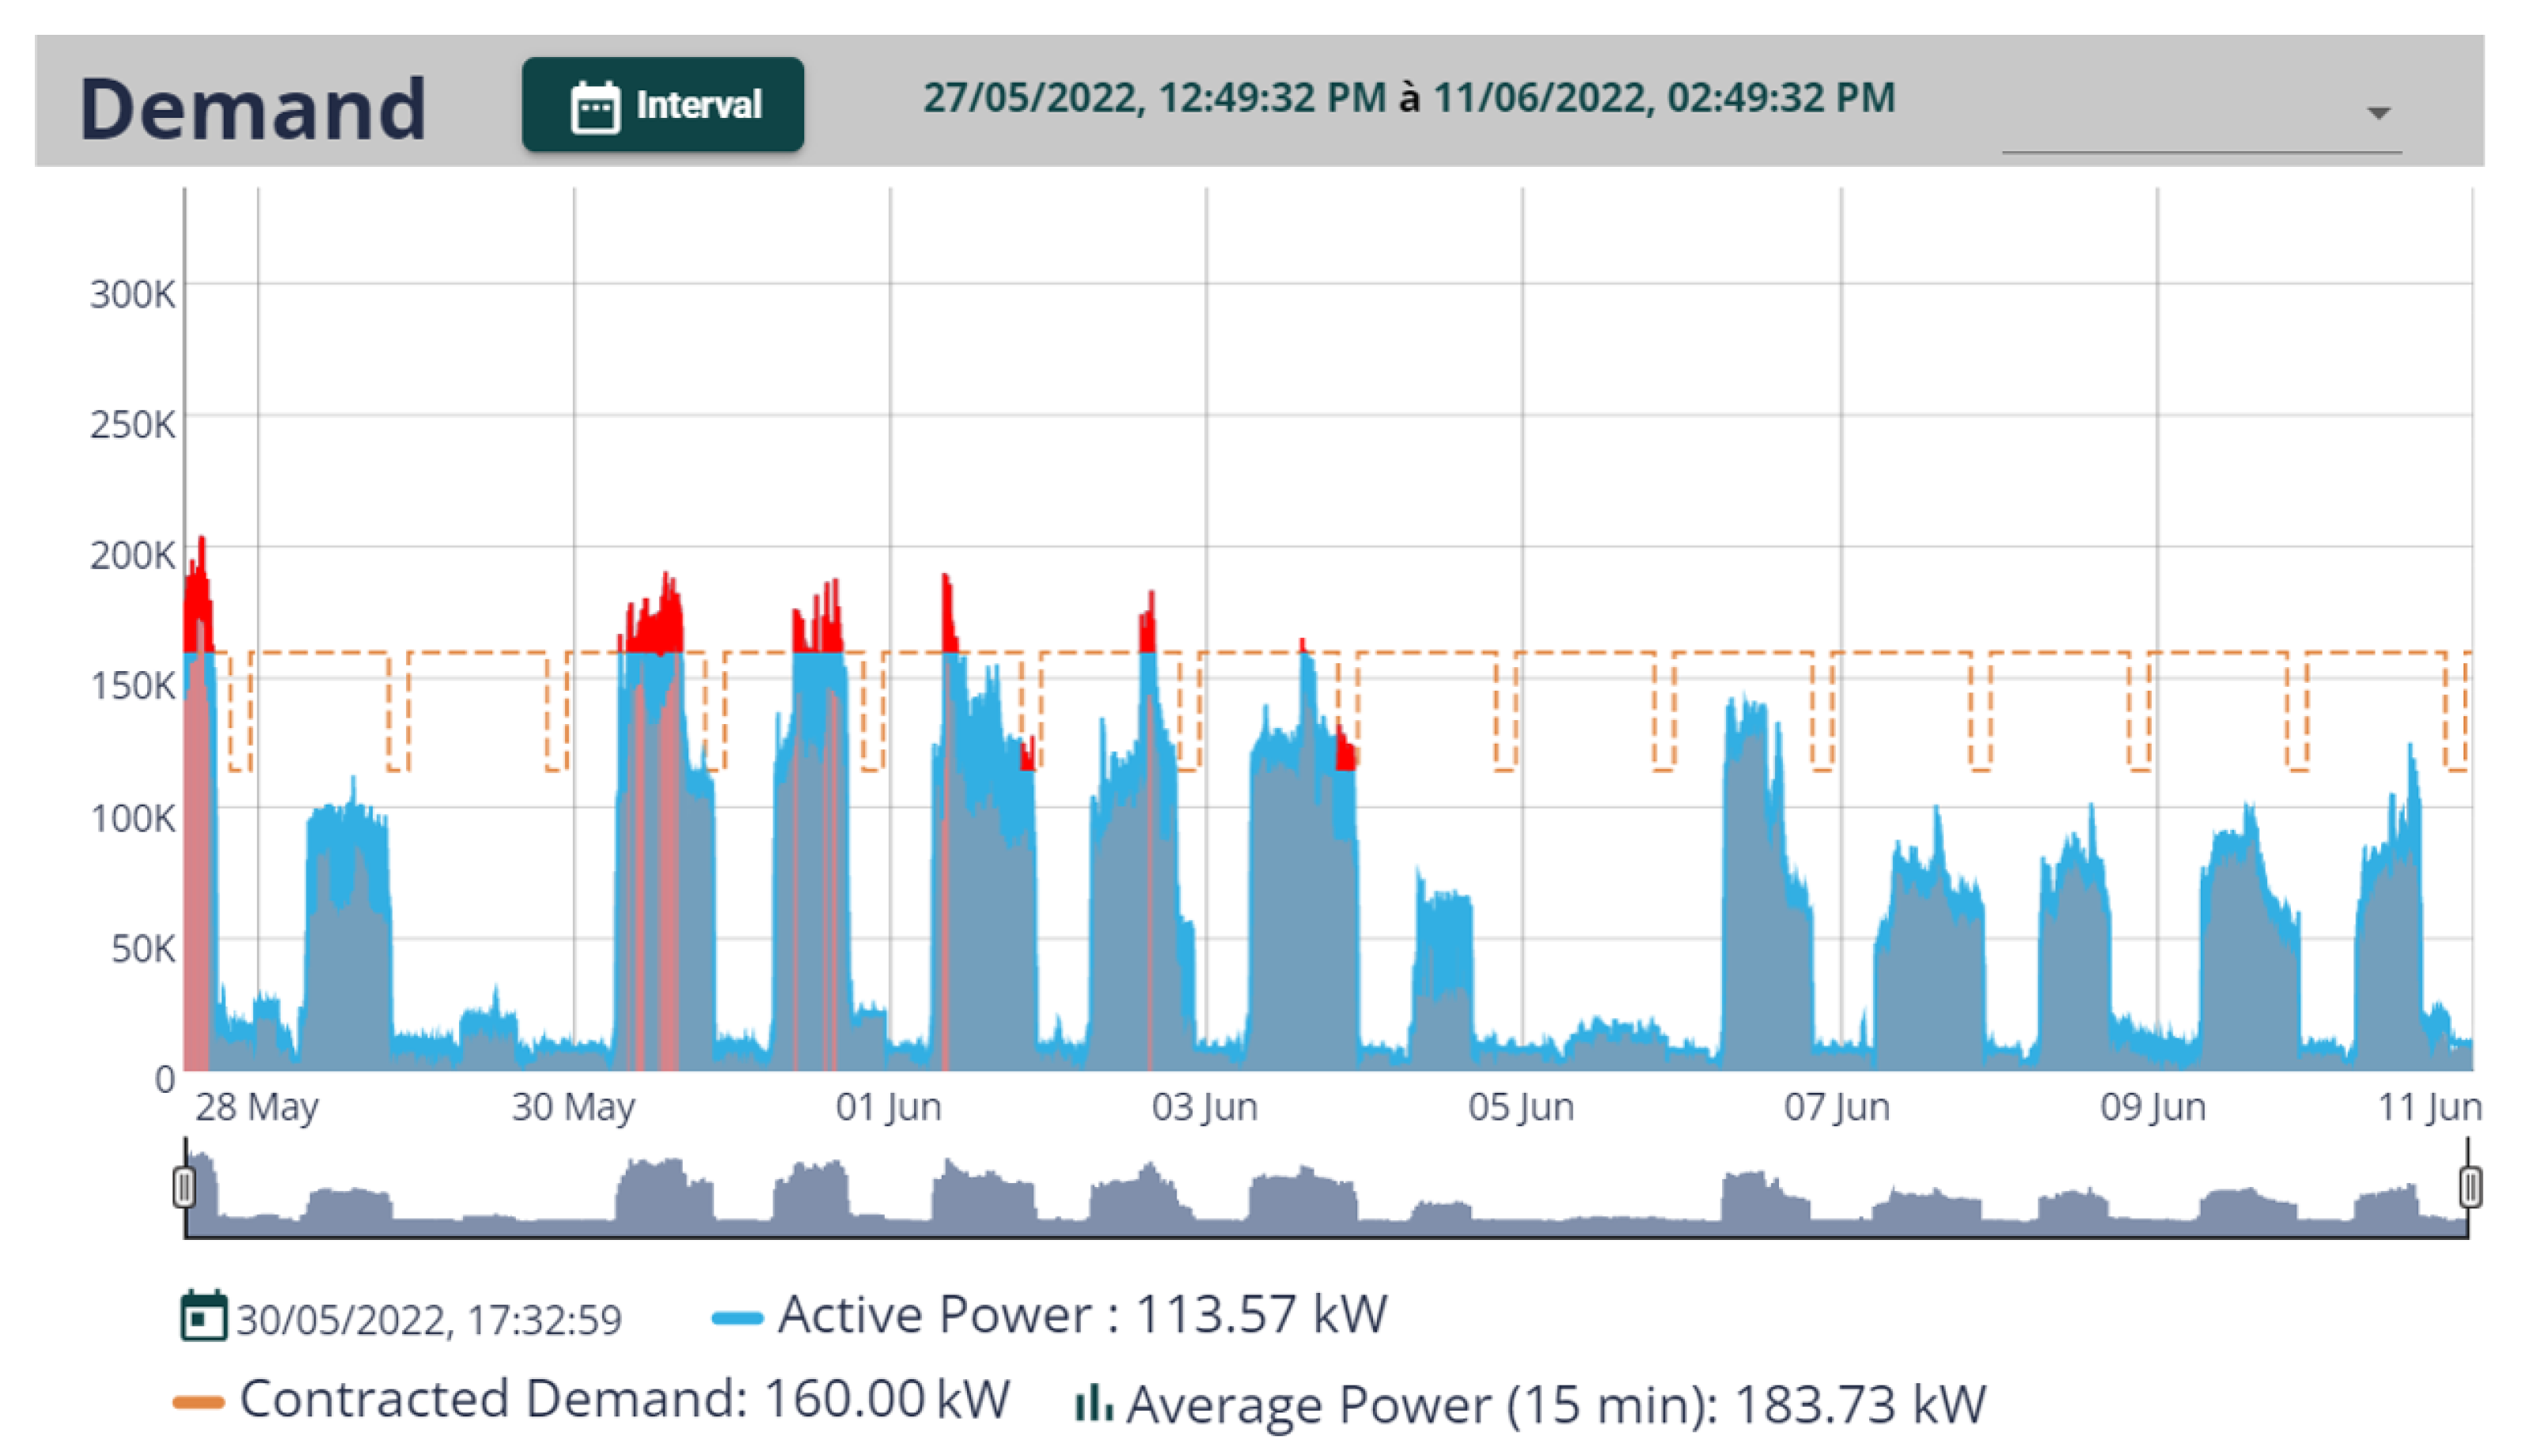
From our proposal, we identify between May and June 2022 contracted demand exceedances, as shown in
Figure 24. It can be observed that at times when the active power is reduced in
Figure 23, the demand of the installation is reduced in
Figure 24. This way, it can be inferred that circuit 32 is one of the circuits responsible for exceeding the contracted demand in the dental polyclinic facility. Because this circuit supplies an essential load for the activities in the facility, regarding the clinical care of patients, the demand control or equipment replacement are infeasible alternatives at the present moment. In this case, it will be necessary to renegotiate the contracted energy demand, because the initial contracted demand is still being exceeded due to the growth of the polyclinic over the years and the use of energy-intensive equipment. In this way, it is expected that, even with the increase in the contracted demand from the energy concessionaire, the excess fines for exceeding the contracted demand will be reduced, and, with this, the monthly bill. In other words, with the measurements taken from the retrofit strategy implemented in our proposal, it is possible to monitor the energy demand and define actions for the rational use of electricity.
6.5. Discussion
Based on the tests and analysis to validate the retrofit functions and operational primitives of the measurement modules, the conformity of the results with respect to the proposed architecture was noted. Thus, it can be inferred that there was success in adapting the SmartLVGrid metamodel to enable the monitoring interfaces of the electrical circuits of a legacy building installation. It is noteworthy that both ACUs enabled the insertion of remote monitoring resources in a network of devices from the retrofit performed, especially the ACU-BREAKER, which in its operation domain enabled the obtainment of the electrical parameters of each circuit in the grid. Another important validation was the exchange of messages between the supervisory center (SCC) and each ACU-BREAKER, as established in the premises of the interoperability layer.
The parameters monitored by our proposal are of utmost importance for power quality and energy-efficiency studies, because they enable the implementation of energy audit processes to optimize the use of electric energy and reduce costs to the final consumer. In this context, the final consumer can audit and mitigate energy consumption and power quality in a sectored way, analyzing the contribution of each circuit to the increase in energy demand or change in energy quality parameters. With this, the consumer can study the feasibility of contractual changes in energy demand, make changes to the facilities or reduce the use of installed equipment, if possible. Thus, the use of stationary measurement of circuits as proposed in this work is justified. Examples of this were presented in the verification of excess demand and the low power factor of the installation’s circuits, as well as of the consumer unit itself. According to the case study shown, the demand of the installation is higher than the contracted demand, suggesting the readjustment of the demand contracted with the concessionaire. It is important to mention that our proposal can be applied to mitigate similar problems in electrical circuits present in large industries and other building facilities, helping managers of these sectors in decision making that lead to significant reductions in energy demand and adequacy of energy quality parameters.
The retrofit strategy used made it possible to take advantage of the entire legacy infrastructure, from the available data network to the electrical materials present in the facility. Despite being a gradual and not-abrupt technological process, the proposed strategy added new resources for building energy management. Considering the deployment of clusters from the proposed architecture, our strategy enables the scalability of the monitoring system as well as the distributed processing of electrical parameters.
The cost of the retrofit carried out in relation to the costs of existing solutions on the market for monitoring building electrical circuits was also analyzed. Initially, before the proposal presented in this work, the maintenance team of the dental polyclinic carried out initial quotations to evaluate the possibility of acquiring devices for monitoring electrical parameters. This survey was conducted through regional and national distributors. At the best quote obtained, each monitoring device was budgeted at about $213.41. In addition, most solutions on the market would not be customized to the needs of the building maintenance team or would take advantage of part of the pre-existing infrastructure in the installation, requiring more resources to operate in the desired way. However, each ACU-BREAKER has a unit production cost of $41.79, not counting the solution development cost (hardware and firmware) and SCC costs. It is known that for large quantities, the cost of the ACU-BREAKER tends to be reduced. Even so, our solution, adapted to the customer’s needs, exceeded almost 80% of the cost of the market solution quoted in the region and in Brazil by the maintenance team itself.
The studies found in the literature do not address the use of metamodels based on the retrofit strategy to enable energy management. In addition, most of these studies present specific solutions for pre-established cases, without the use of architectural models that enable the use of legacy infrastructure, in a scalable manner, in order to perform energy monitoring. Furthermore, many of them do not address the reuse of legacy resources. However, the system proposed in this paper distinguishes itself by presenting a method, based on the SmartLVGrid metamodel, dedicated to energy management from the retrofit of legacy low-voltage electrical circuits of a distribution board. More than that, the proposal presents a cloud-based supervisory center, ensuring security and access to data regardless of location, with dashboard capabilities for viewing the history of electrical parameters and events associated with power quality and energy efficiency. Thus, this approach fills a gap observed in the state of the art and technique for energy monitoring, in a systemic and hierarchically well-defined way.
7. Conclusions
In this work, the SmartLVGrid metamodel was used to enable energy management through the monitoring of electrical parameters in real time from the retrofit of the circuits of a legacy switchboard. To do this, an architecture based on the adaptation of the physical and logical interfaces of the original metamodel was proposed so that this new load profile, the circuits of a building installation, could receive new technological functionalities making the most of the pre-existing elements. To validate the strategy presented, it was necessary to develop the hardware and respective firmware of a retrofit module for monitoring electrical quantities, called ACU-BREAKER. This device was assigned operational primitives (DRFs, CSFs, and ISFs), based on the SmartLVGrid metamodel, to execute its functionalities. In order to enable the interconnection of each ACU-BREAKER in a wireless data network, a wi-fi router was used as the system hub, called ACU-ROUTER in the proposed architecture. The ACU-BREAKER and the ACU-ROUTER implement, respectively, the role of operator and coordinator of the proposal. In addition, a cloud-based supervisory system (SCC) was developed to store the monitored parameters and make them available in interactive dashboards for quality and energy efficiency analysis. The monitored parameters were the reactive, active and apparent powers, the power factor, the current and the effective voltage in the three phases of each circuit of the board. Based on the results obtained, it was verified that the proposal enables energy management through a transparent process of technological transition, allowing the maximum use of the available infrastructure of the pre-existing legacy circuits. The proposed architecture is customizable to the installation’s needs, because the retrofit can be applied according to the physical and logical interfaces available. In addition, the system’s middleware and interoperability layers allow for systemic development and enable distributed processing and scalability for cases of energy monitoring expansion. It is emphasized that, through the results presented, it is possible to mitigate possible excess demand, the reduction of the power factor, and the conformity of the electrical parameters of the installation from the individual analysis of each circuit. In this way, a first step is taken to implement an energy audit process. For future work, we suggest the integration of the proposal of this work with monitoring systems in smart grids and the implementation of clusters based on the proposed architecture, including the analysis of the harmonics present in the system and the evaluation of the performance of the SCC hosted in the cloud with the increase of monitored data. We also suggest the integration and evaluation of our proposal with new dynamic energy markets, involving the apportionment of energy through other alternative energy sources. In addition, with the data collected, it is suggested to label and treat them to predict the demand for energy and other electrical quantities to control the demand of the installation by using electrical drive devices for this purpose. It is also suggested that an economic analysis of the consumer unit through the proposed system be performed.


 ,
, 


