Article

Techno-Economic Analysis of a Fuzzy Logic Control Based Hybrid Renewable Energy System to Power a University Campus in Japan

Interdisciplinary Graduate School of Engineering Sciences, Kyushu University, Fukuoka 816-8580, Japan
*
Author to whom correspondence should be addressed.
Energies 2021, 14(7), 1960; https://doi.org/10.3390/en14071960
Submission received: 26 February 2021 / Revised: 28 March 2021 / Accepted: 30 March 2021 / Published: 1 April 2021
(This article belongs to the Special Issue Renewables-Based Microgrids)

Abstract

:
In order to reduce the load demand of buildings in Japan, this study proposes a grid-tied hybrid solar–wind–hydrogen system that is equipped with a maximum power point tracking (MPPT) system, using a fuzzy logic control (FLC) algorithm. Compared with the existing MPPTs, the proposed MPPT provides rapid power control with small oscillations. The dynamic simulation of the proposed hybrid renewable energy system (HRES) was performed in MATLAB-Simulink, and the model results were validated using an experimental setup installed in the Chikushi campus, Kyushu University, Japan. The techno-economic analysis (TEA) of the proposed system was performed to estimate the optimal configuration of the proposed HRES, subject to satisfying the required annual load in the Chikushi campus. The results revealed a potential of 2% surplus power generation from the proposed HRES, using the FLC-based MPPT system, which can guarantee a lower levelized cost of electricity (LOCE) for the HRES and significant savings of 2.17 million yen per year. The TEA results show that reducing the cost of the solar system market will lead to a reduction in LCOE of the HRES in 2030.

1. Introduction

1.1. Background and Literature Review

Today, the earth faces a significant environmental problem, which is global warming. Renewable energy is one of the best ways to solve this problem. After the Great East Japan Earthquake, the share of nuclear electricity in Japan has decreased significantly [1]. This is because the public’s concern about nuclear power plants has risen due to the nuclear accident. As a result, the dependence on thermal power generation has increased. However, Japan lacks energy resources; its energy self-sufficiency rate is meager compared to that of other OECD countries [2,3].
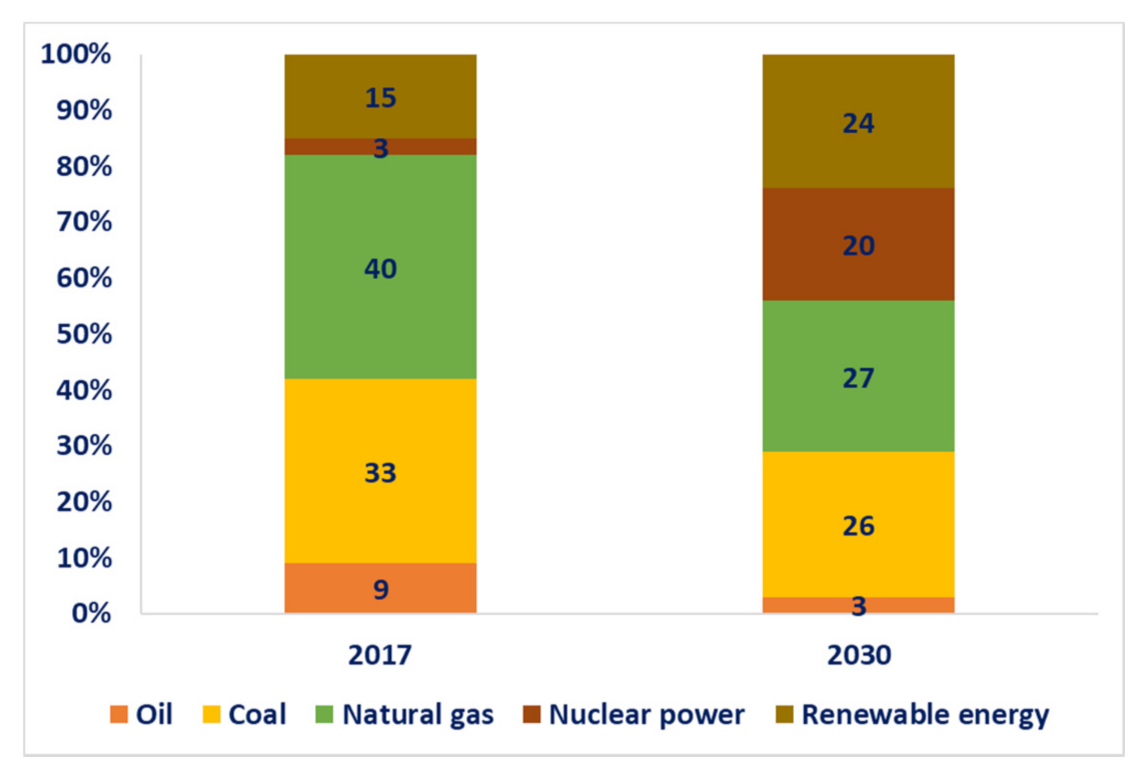
In 2013, the Japanese government promoted an initiative (3E + S) to achieve energy security, economic efficiency, and environmental compatibility, with safety as a priority [2]. According to this plan, the desirable future energy mix in 2030 is as represented in Figure 1.
As shown in Figure 1, renewable energy is an effective countermeasure to increase energy resilience in Japan. For the current electricity market in Japan, renewable energy sources (RES) utilization mostly focuses on individual power sources, including solar photovoltaic systems, wind turbines, micro-hydropower, etc. However, the big concern with RES is their intermittency due to dependence on uncertain climate conditions [4]. Consequently, reliance on an individual power system can result in over-sizing of the system and also a significant rise in the total cost of the system. The hybridization of variable renewables can allow for smooth, durable, and reliable output to power grids to improve the safety, reliability, and stability of dispatched power, which is cheaper than investing in single renewable technologies [5,6,7]. Numerous scholars have focused on optimal designing and planning of the hybrid renewable energy systems (HRES) in Japan. Yoshida and Farzaneh applied the particle swarm optimization (PSO) method to find the optimal configuration of a stand-alone microgrid (Photovoltaic (PV)/wind/battery/diesel) used in providing the required electricity for the residential area in Fukuoka [8]. Takatsu and Farzaneh proposed a hybrid hydrogen-based microgrid, consisting of a biomass supercritical gasifier and a solar water electrolyzer to provide the residential demand load requirement in Shinchi-machi, Fukushima Prefecture [9]. Shaqour et al. proposed an efficient control scheme and design for a hybrid renewable energy system consisting of PV, wind turbine generator, lead-acid battery, inverter, and control unit installed in a typical Japanese house located in Kasuga City, Fukuoka Prefecture [10]. Guohong Wu et al. designed a hybrid microgrid energy system consisting of PV, wind, battery storage, and an electrical double-layered capacitor as secondary battery storage implemented at the Tagajo campus Tohoku Gakuin University, Japan [11]. Sugimura et al. developed a hybrid energy microgrid system consisting of a PV, wind generator, and diesel generator as the primary power sources, with battery energy storage for Aguni Island, located in Okinawa, Japan. They investigated the operation schedule of both the battery system and diesel generator and the optimal system configuration in terms of capacity under the application of demand response programs [12].
The output power of the proposed HRES varies on environmental variables such as solar irradiance, wind, and operating temperature. The maximum power point tracking (MPPT) control technique is mainly used to extract the maximum capable power of the HRES with respective solar irradiance, wind speed, and temperature at a particular instant of time point.
The MPPT controller will make use of nearly 100% of the available power. In recent years, there has been great interest in the study, improvement, and implementation of MPPT algorithms [13]. MPPT aims to regulate the actual operating voltage of solar panels to the voltage at the MPP. For this purpose, MPPT adjusts the output power of the inverter or DC converter. If the PV output voltage is higher than the maximum power point voltage, then transferred power to the load or network is increased; otherwise, it is decreased. The MPPT methods can be classified into indirect and direct methods. The indirect methods, such as short-circuit and open-circuit methods, need a prior evaluation of the PV panel, or they are based on mathematical relationships or a database not valid for all operating meteorological conditions. Therefore, they cannot obtain exactly the maximum power of a PV panel at any irradiance and cell temperature. Conversely, the direct methods operate at any meteorological condition and act in real time on the voltage reference variable, corresponding to the maximum power provided by the PV system. MPPT can be realized in the wind power generation control by adjusting the power or torque command. The input of the control block is the rotor speed. The optimum power corresponding to this speed will be generated and will be passed to the outer power control block as the power command. Even though a few improvement methods have just been utilized for MPPT, different and new methods may prompt better outcomes and are suggested for future research. Many algorithms have been developed to efficiently track the maximum power point, such as incremental conductance (INC), hill climbing, or perturbation and observation (P&O) [14]. Zhang et al. proposed a hybrid MPPT algorithm that combines an iterative learning controler (ILC) and P&O to extract maximum power from PV systems. In their research, the ILC was proposed to obtain the maximum power point (MPP) in steady-state operation under periodic long-term variations in irradiance and temperature, where the working power point oscillates near the MPP. A high-frequency P&O was proposed to overcome the ILC’s shortcomings under highly changing irradiance, improving the dynamic response under such conditions [15]. Messalti et al. proposed and tested two new artificial neural network (ANN) MPPT controllers based on fixed and variable step size. The neural network was trained based on data collected, using the P&O algorithm for the offline phase of training, configuring the neural network, and using the ANN in a PV system [16]. Ahmed and Salam introduced a modified P&O MPPT algorithm in order to reduce steady-state oscillations and decrease the occurrence of tracking direction errors for the P&O-based MPPT controller. They introduced a modified scheme that dynamically alters the perturbation size coupled with introducing a dynamic boundary condition to prevent divergence from the tracking locus, indicating about 1.1% improvement over the traditional P&O when there is a slow change in irradiance levels and about 12% increase in efficiency under fast irradiance changes [17]. Mei et al. implemented a novel incremental-resistance MPPT with variable step size, addressing the advantages of the ILC-based MPPT. They reported a significant improvement in MPPT response speed and accuracy at the steady-state condition, with an extensive operating range [18]. Sher et al. presented a hybrid MPPT algorithm that combines the fractional short circuit current (FSCC) measurement and the P&O algorithm. The two-stage algorithm proposed increases performance under changing weather conditions, and the reliability of the model under environmental scenarios was satisfactory with both software and experimental validation [19]. Table 1 shows the recent MPPT techniques for PV and wind renewable energy systems.
As mentioned above, although there is substantial research concerning the different MPPT algorithms, there are two challenges with the application of them in HRES:
  • Most of them suffer from the drawback of being slow tracking, due to which the utilization efficiency is reduced.
  • Furthermore, intermittency, rapid irradiation, and temperature changes may cause the MPPT to be oscillating around one of the multiple local peaks of power.

1.2. What Will Be Elucidated in this Research

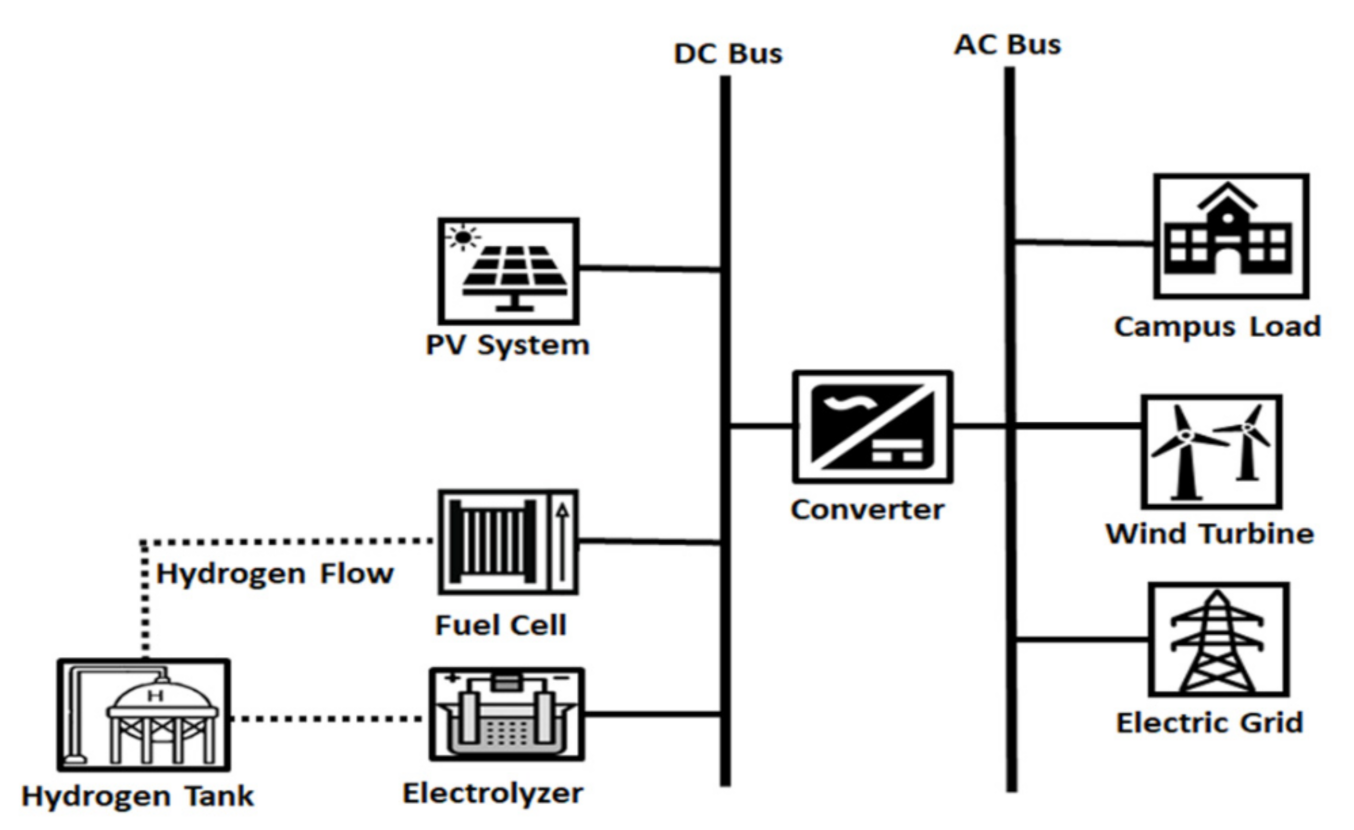
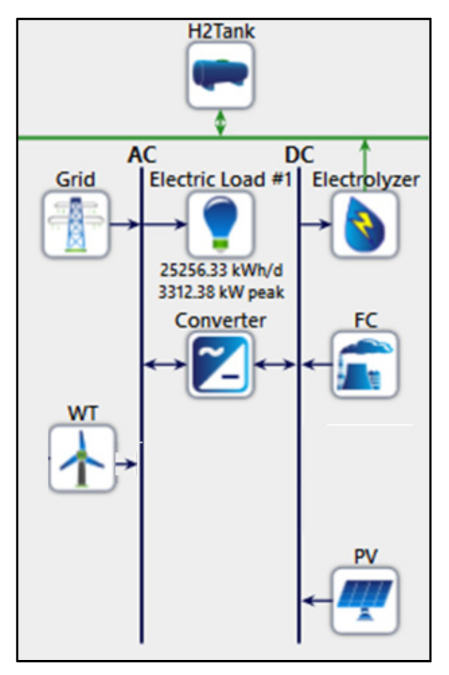
Based on the above discussion, this study aims to introduce a hybrid renewable energy system (HRES) equipped with an advanced MPPT, which is envisioned to be installed at Kyushu University’s Chikushi Campus in Kasuga, Japan (
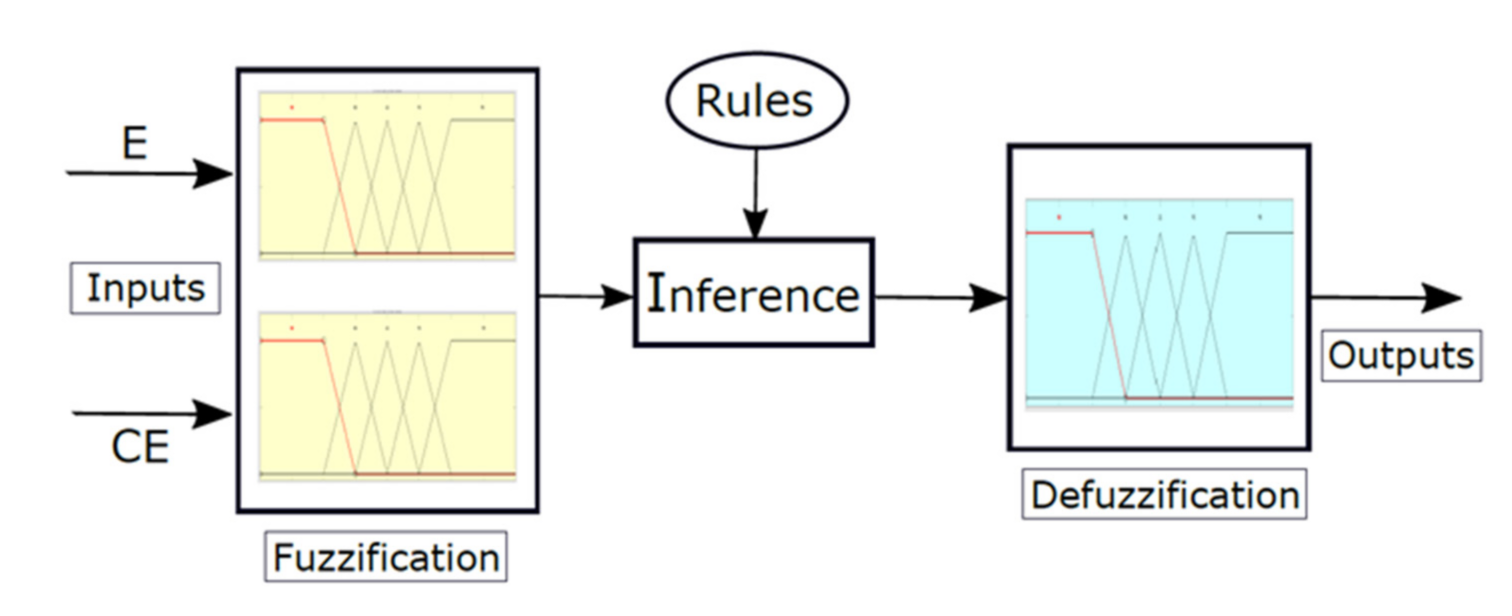
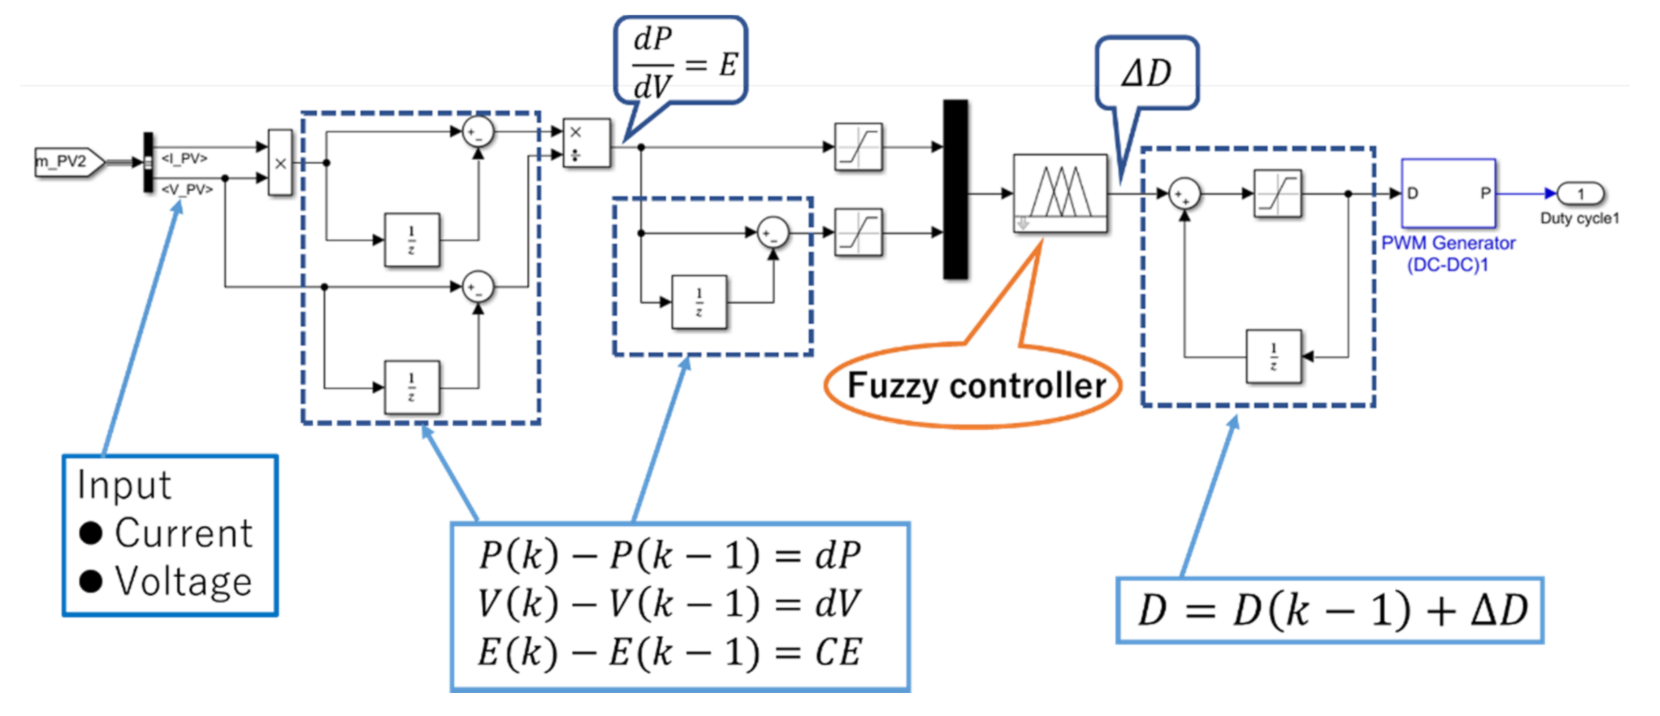
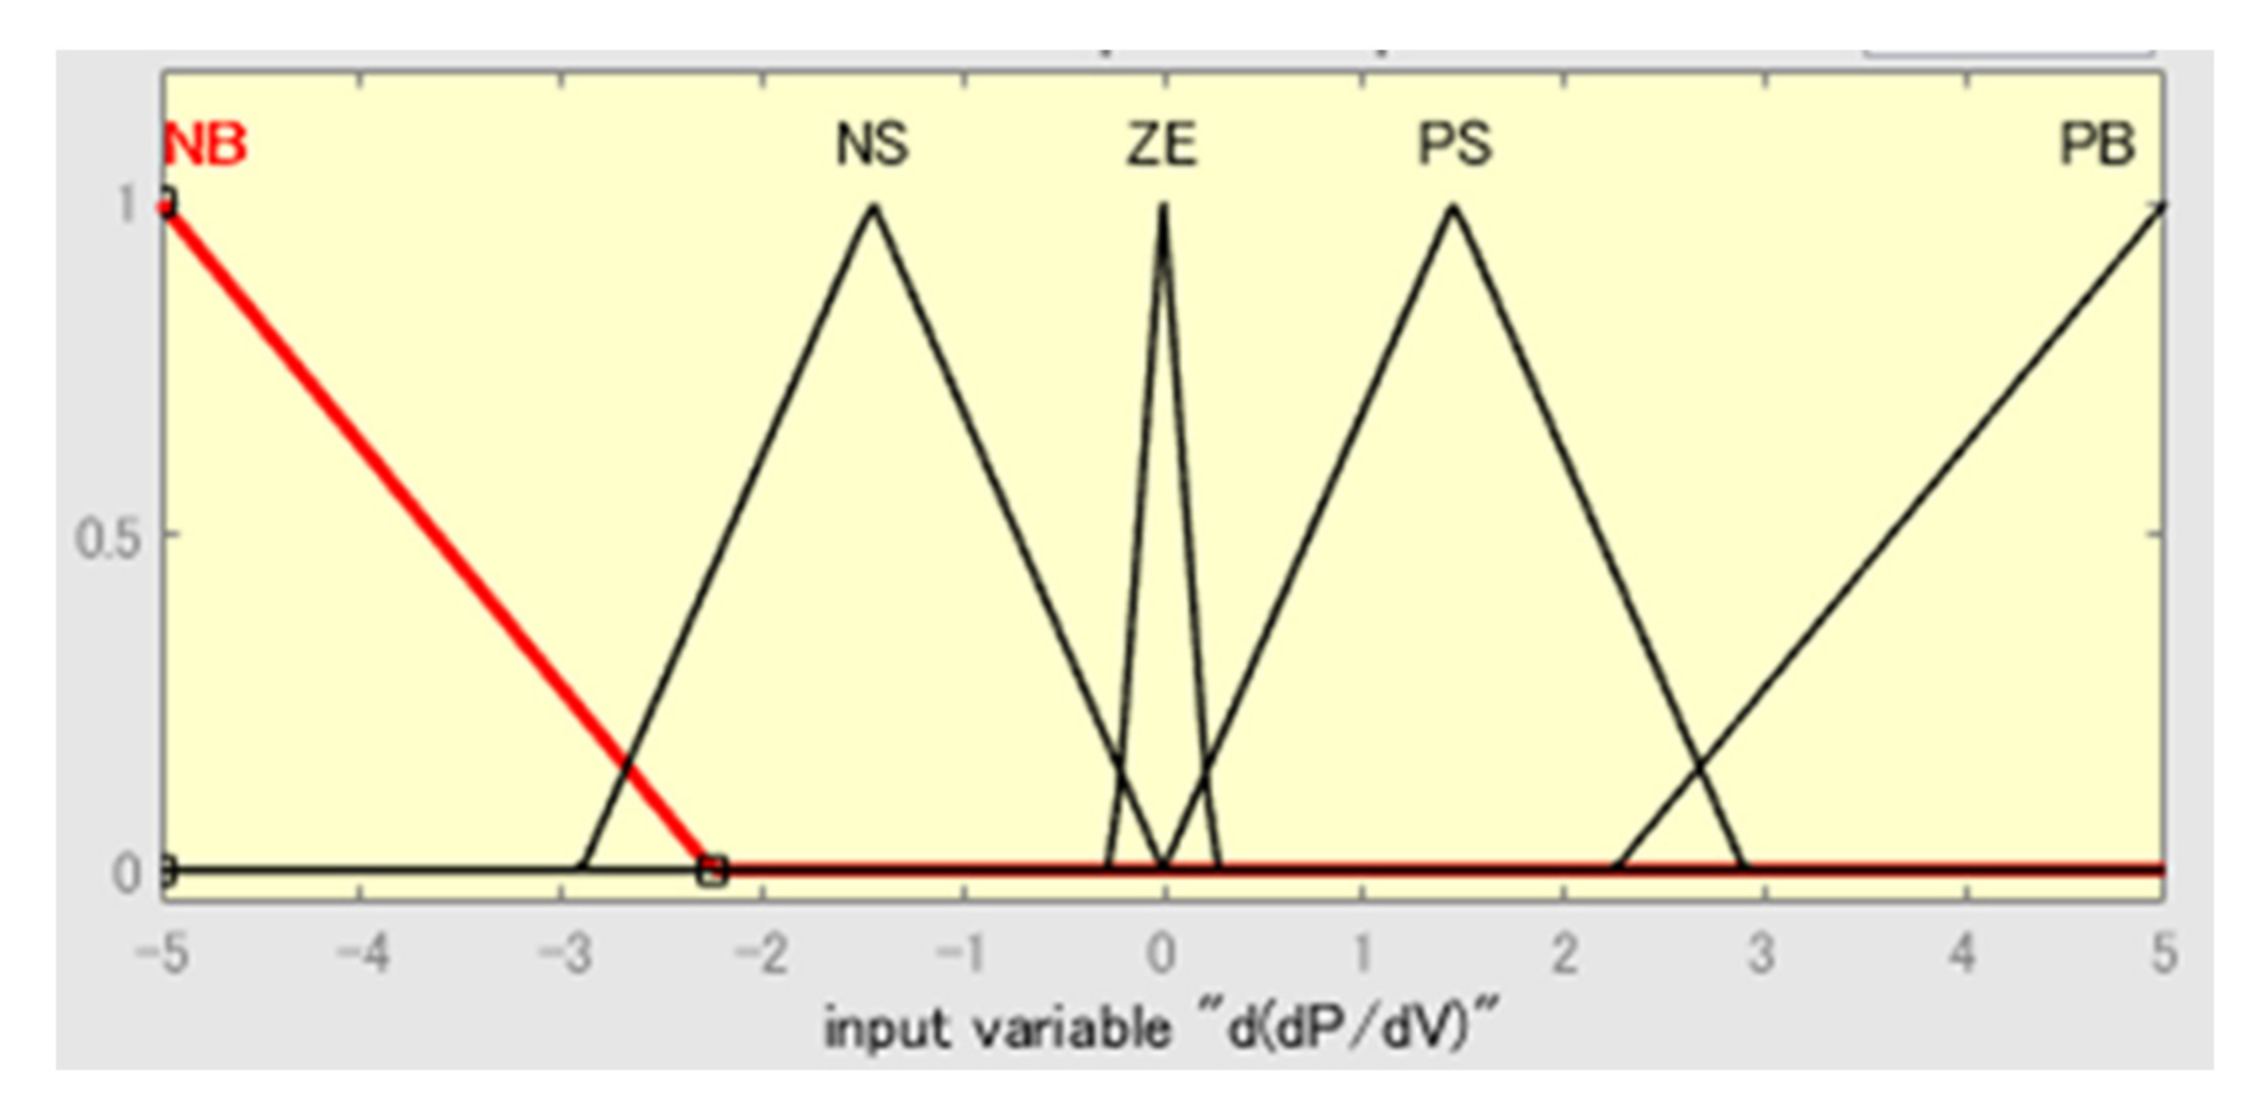
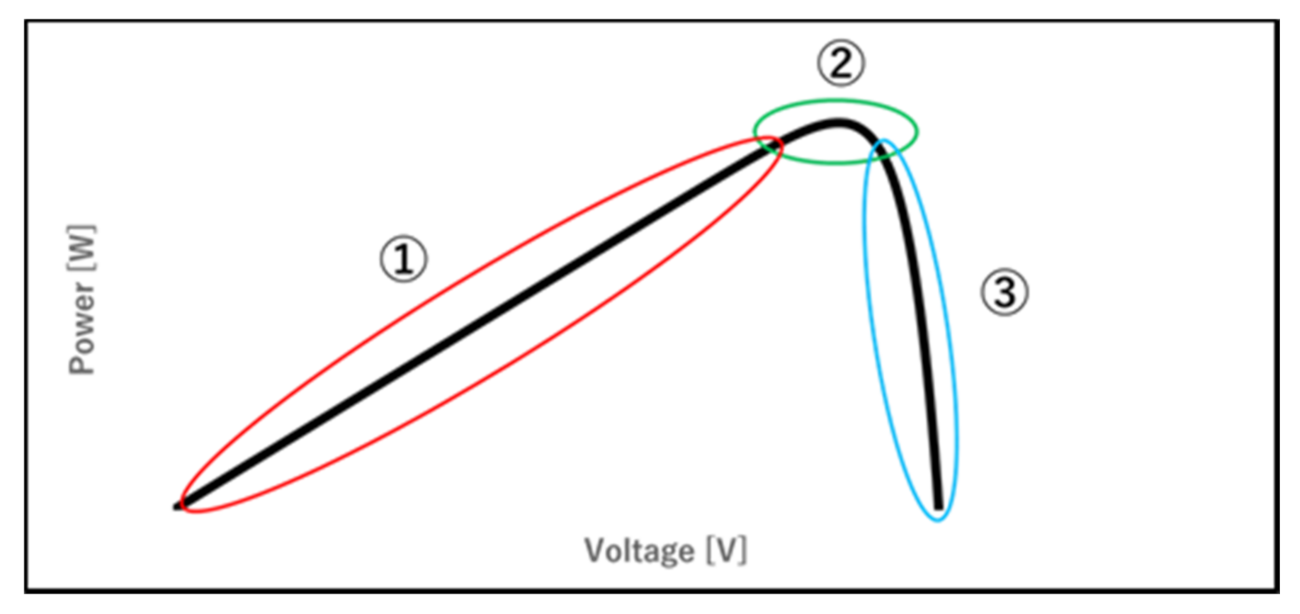
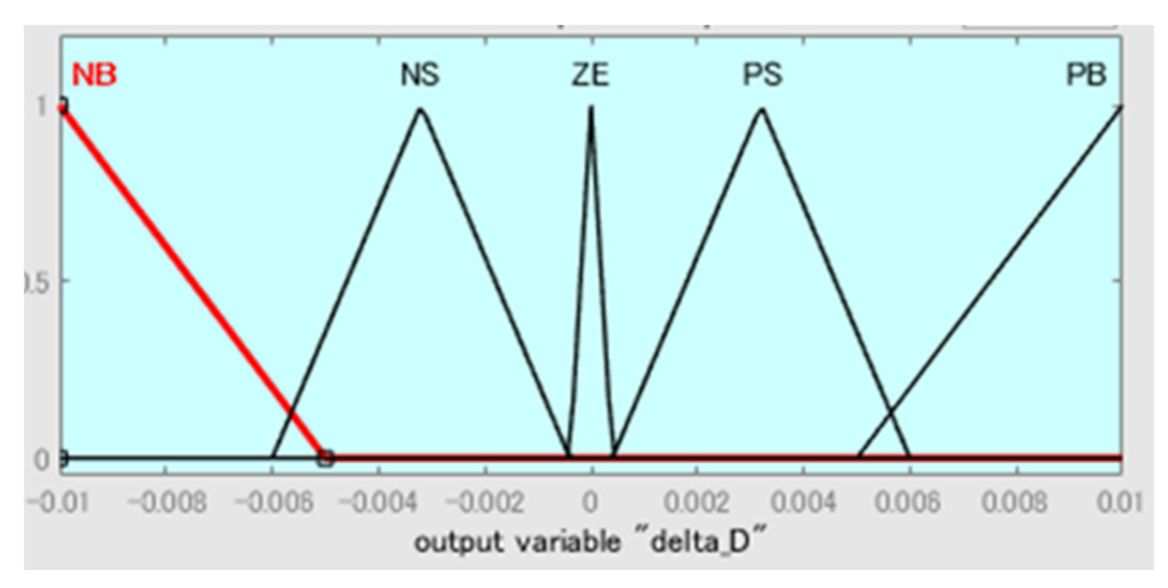
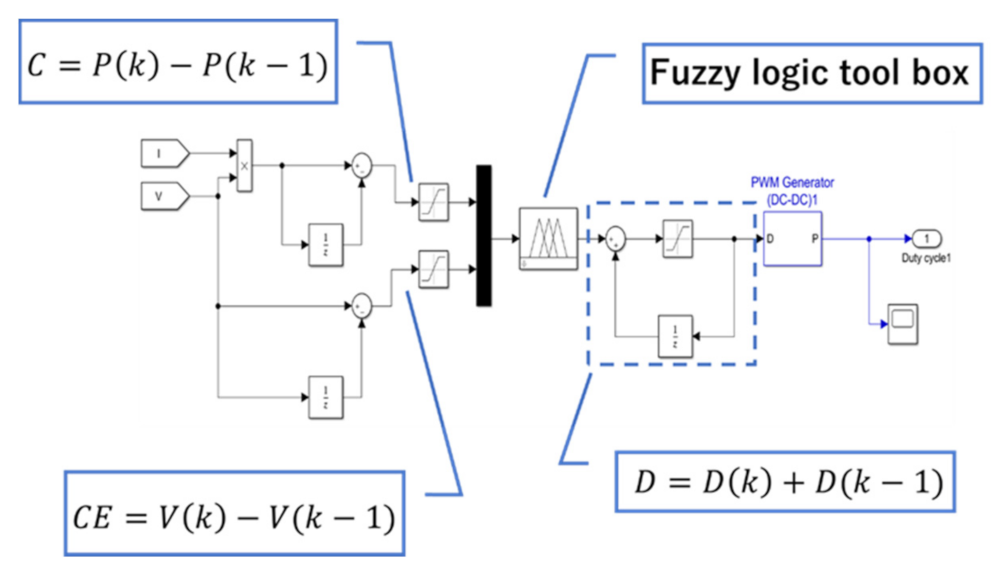
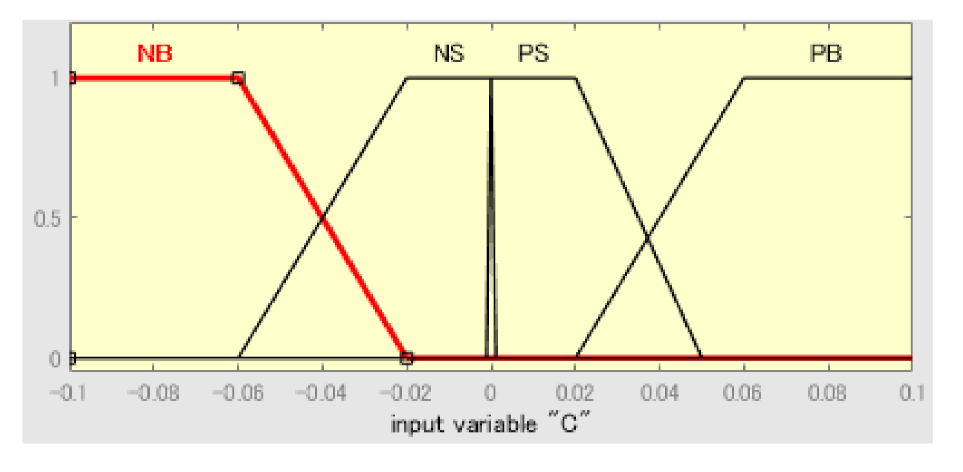
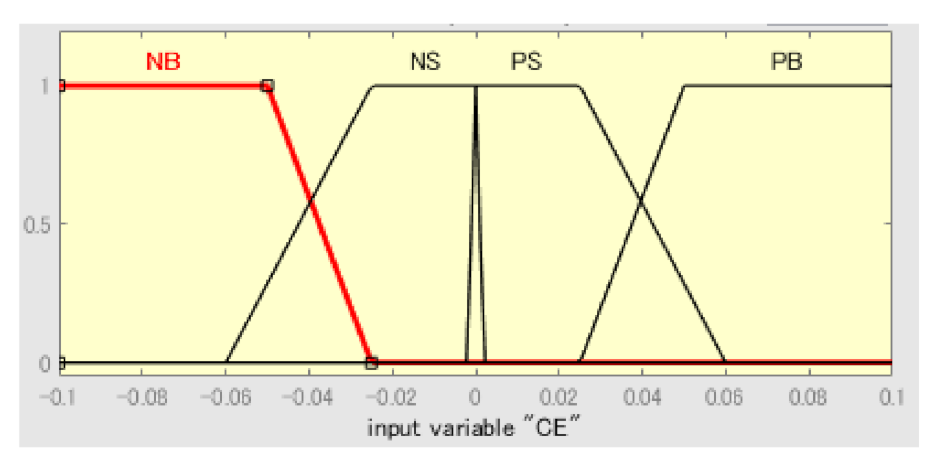
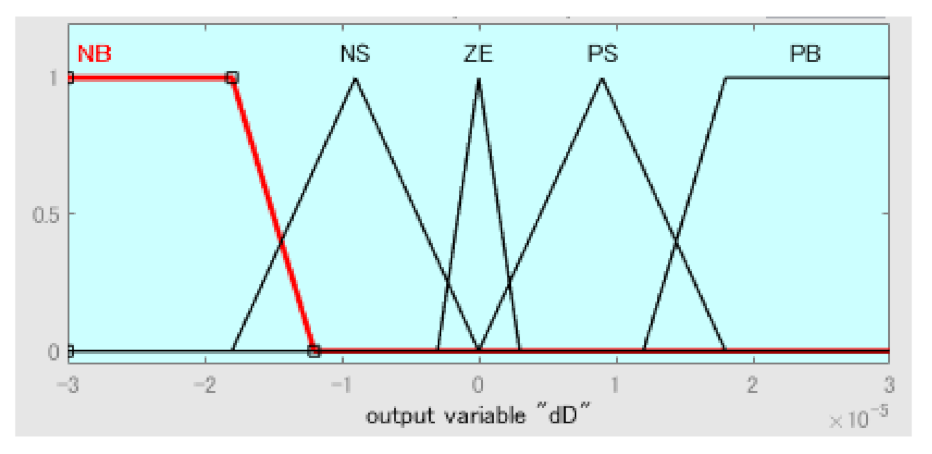
Figure 2). To overcome the drawbacks mentioned on the existing tracking systems, such as the P&O method, this study aims at introducing a MPPT system based on fuzzy logic control (FLC), which provides rapid control, and small oscillations once it reaches the MPP, under varying weather conditions. The proposed FLC-based MPPT controls the DC–DC converter, which is connected to the solar panel and wind turbine. The determination of input and output magnitude is the most notable feature of the FLC-based MPPT. The FLC determines the numerical input as a linguistic magnitude based on its own rules. It then selects the linguistic output corresponding to the linguistic information and finally converts it into an output value as a number. Thus, the FLC-based MPPT is faster and more accurate than other MPPT controllers, such as P&O, because it has the flexibility to change the magnitude of the output values depending on the position of the points, resulting in more power output from the HRES.
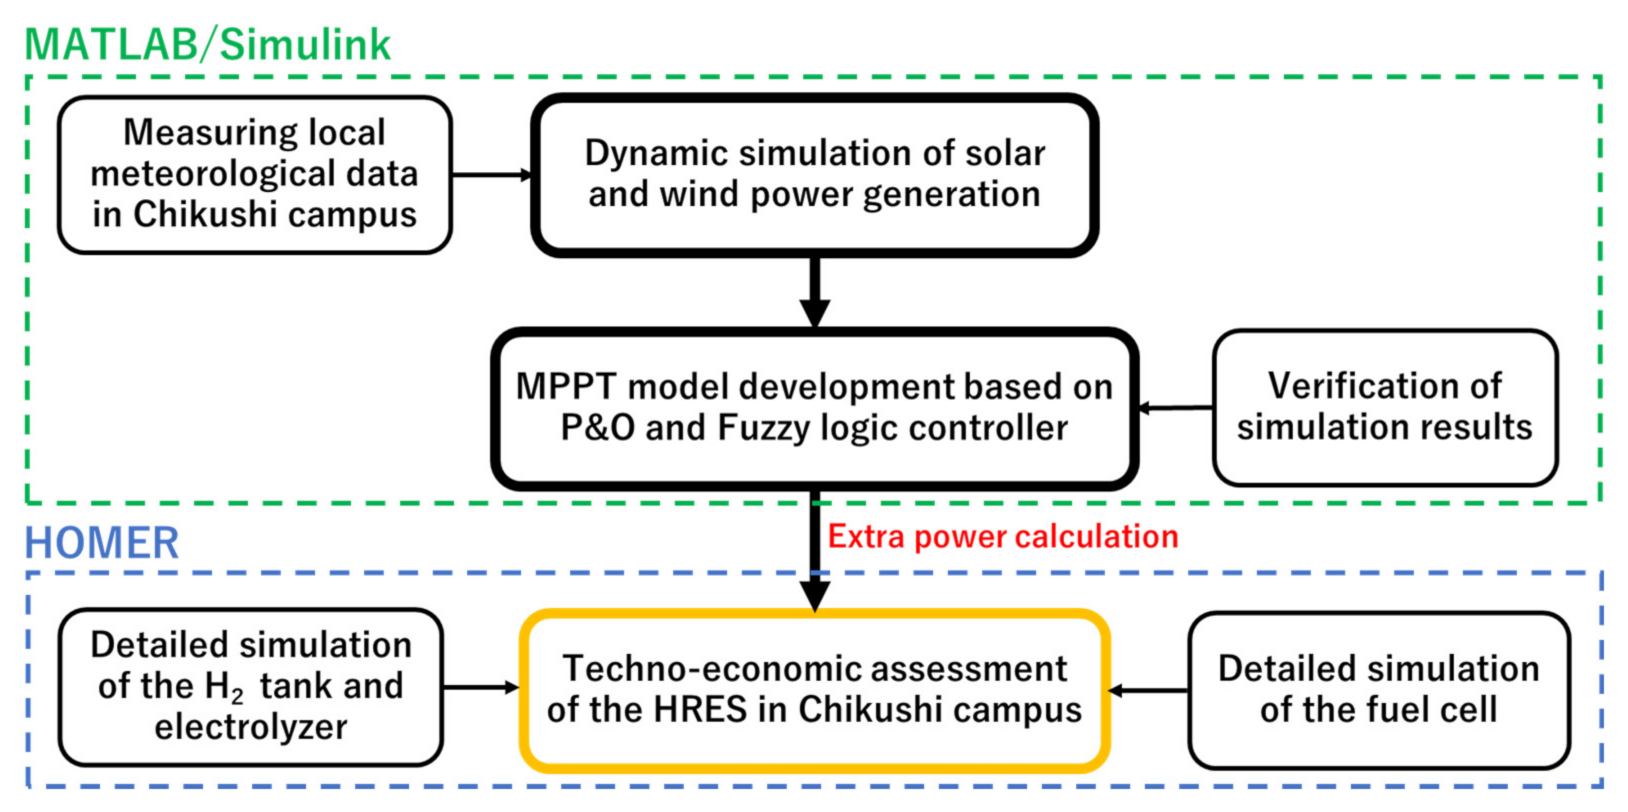
The research flow diagram in this paper is shown in 
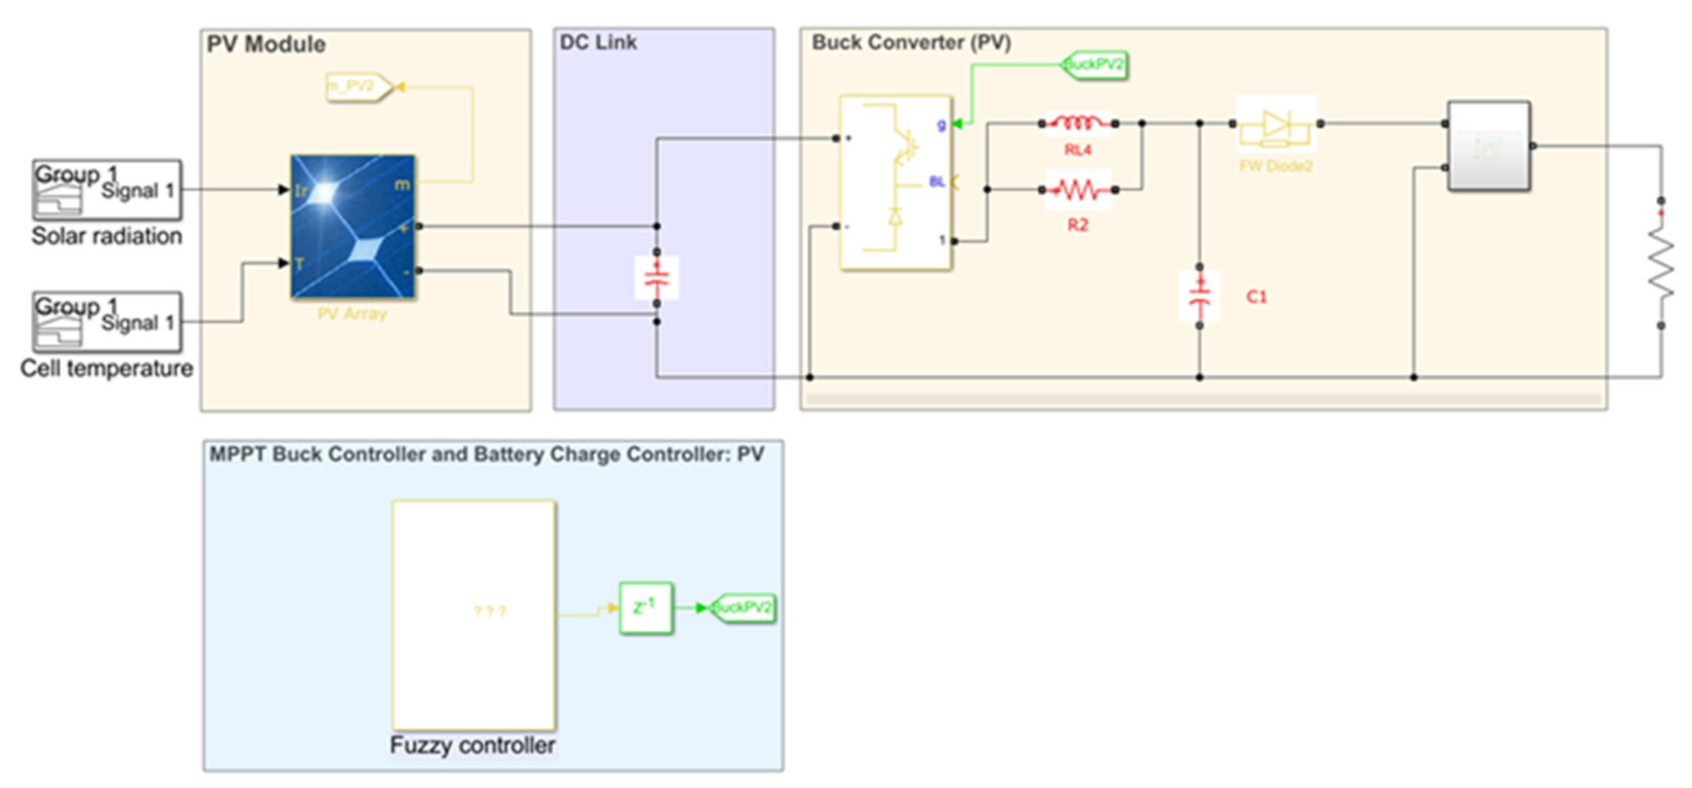
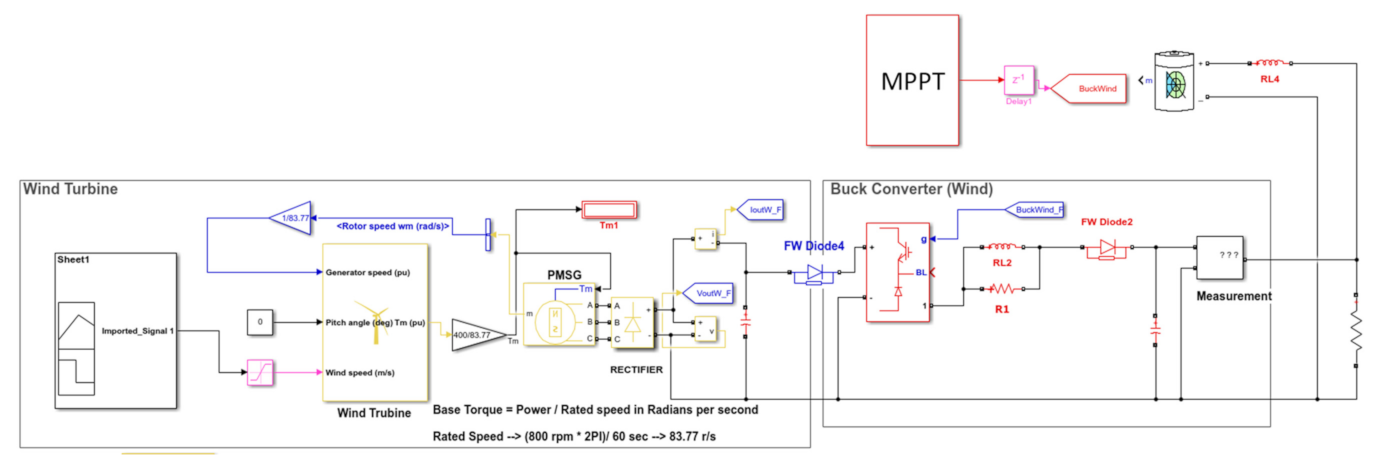
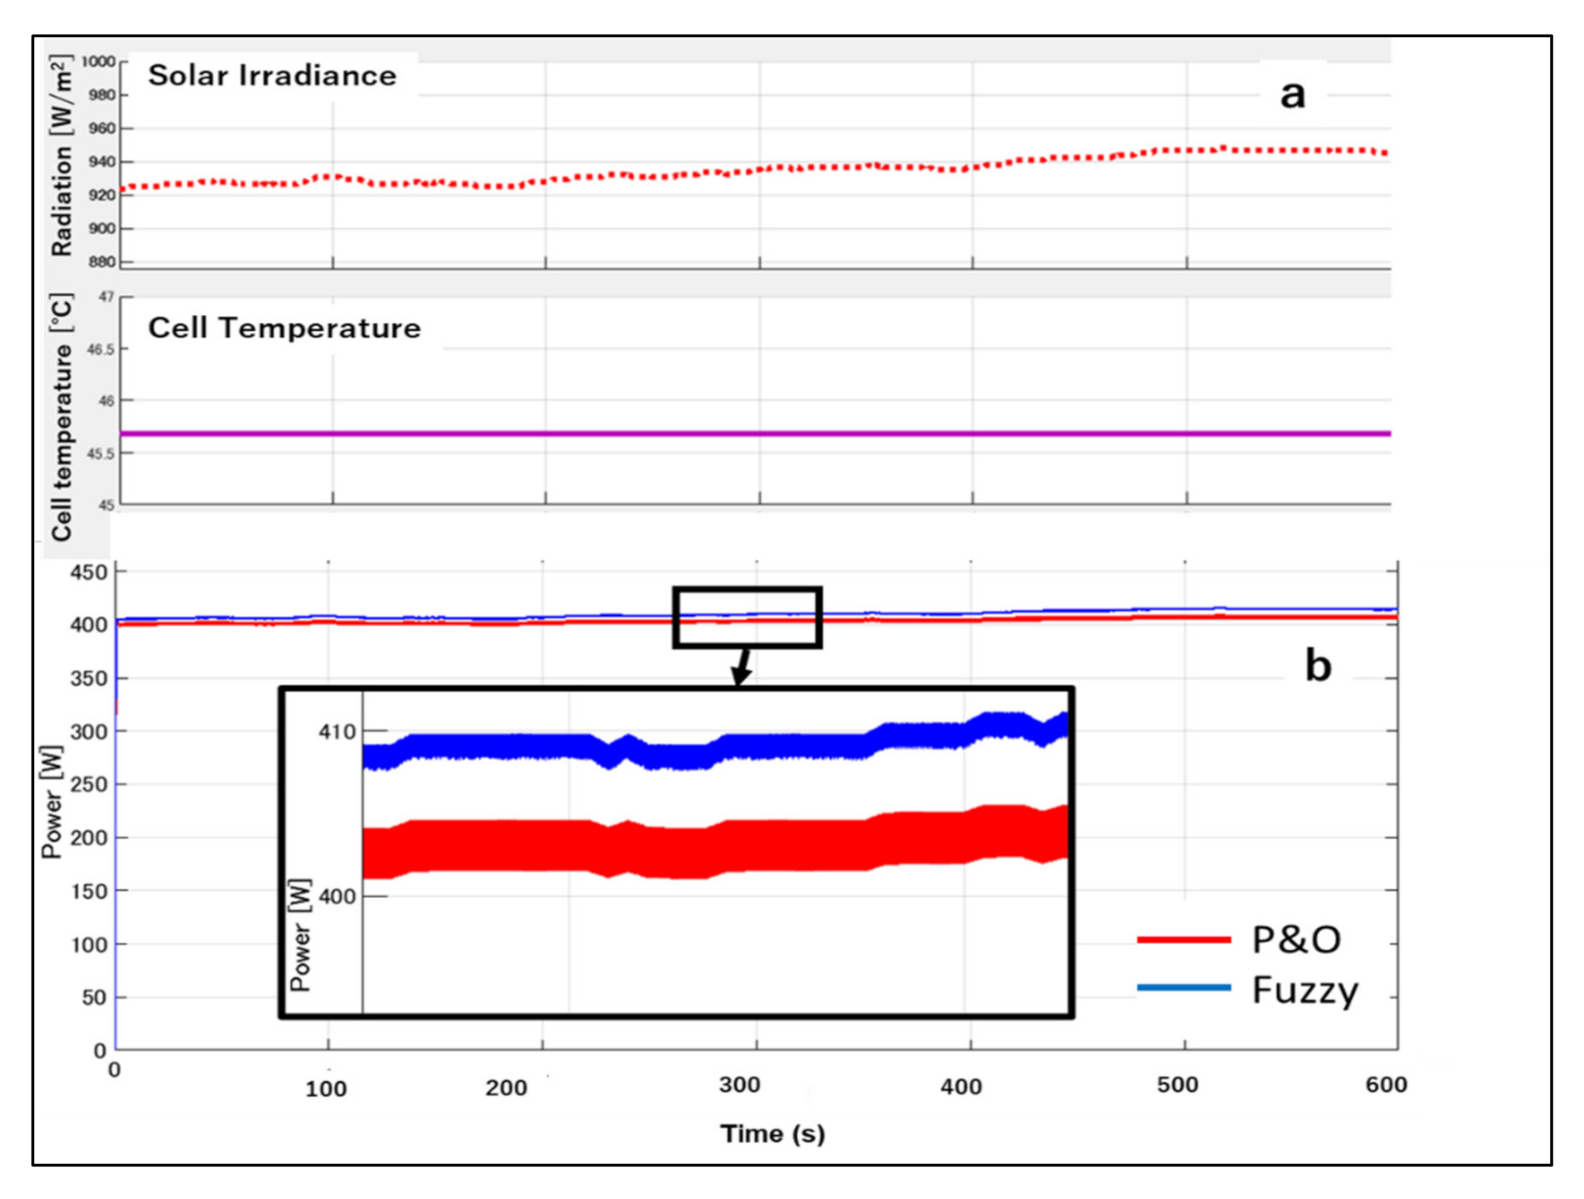
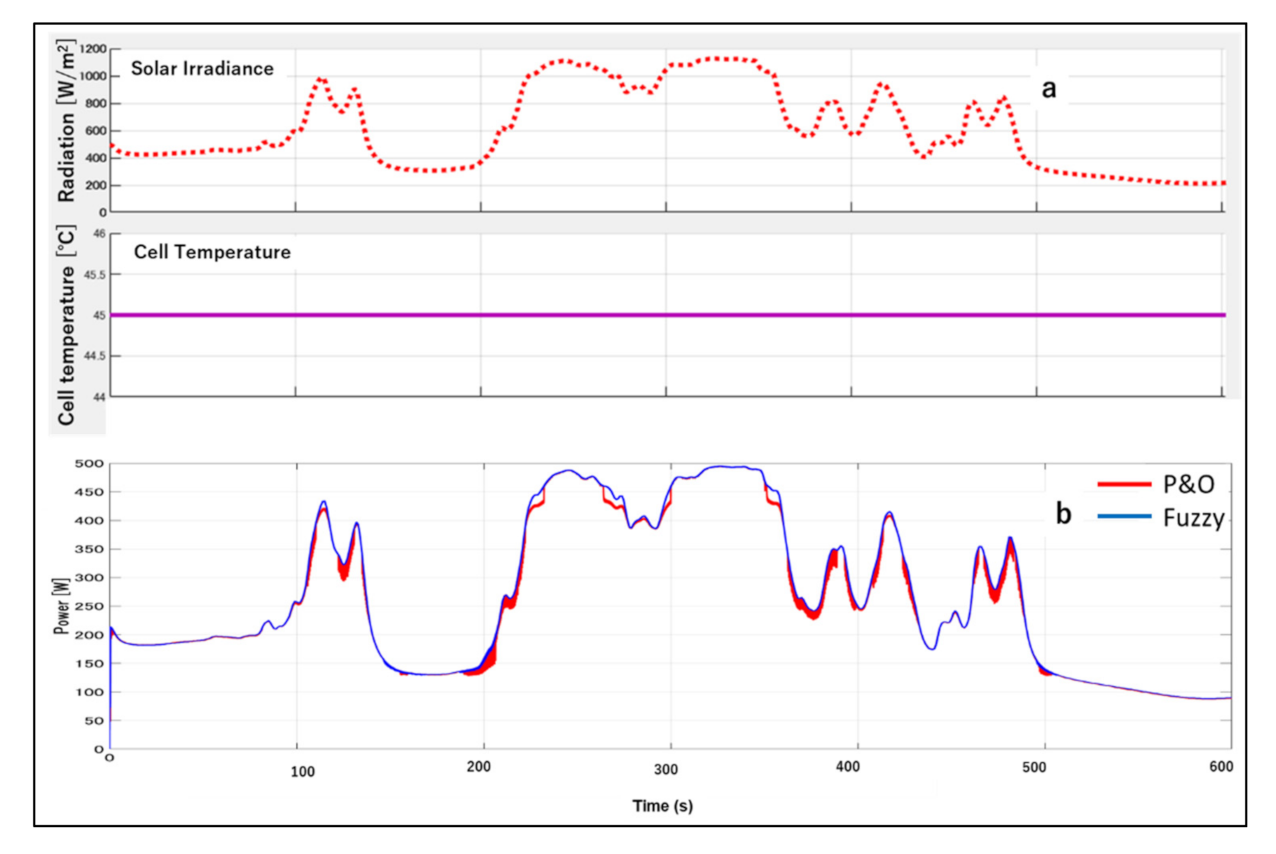
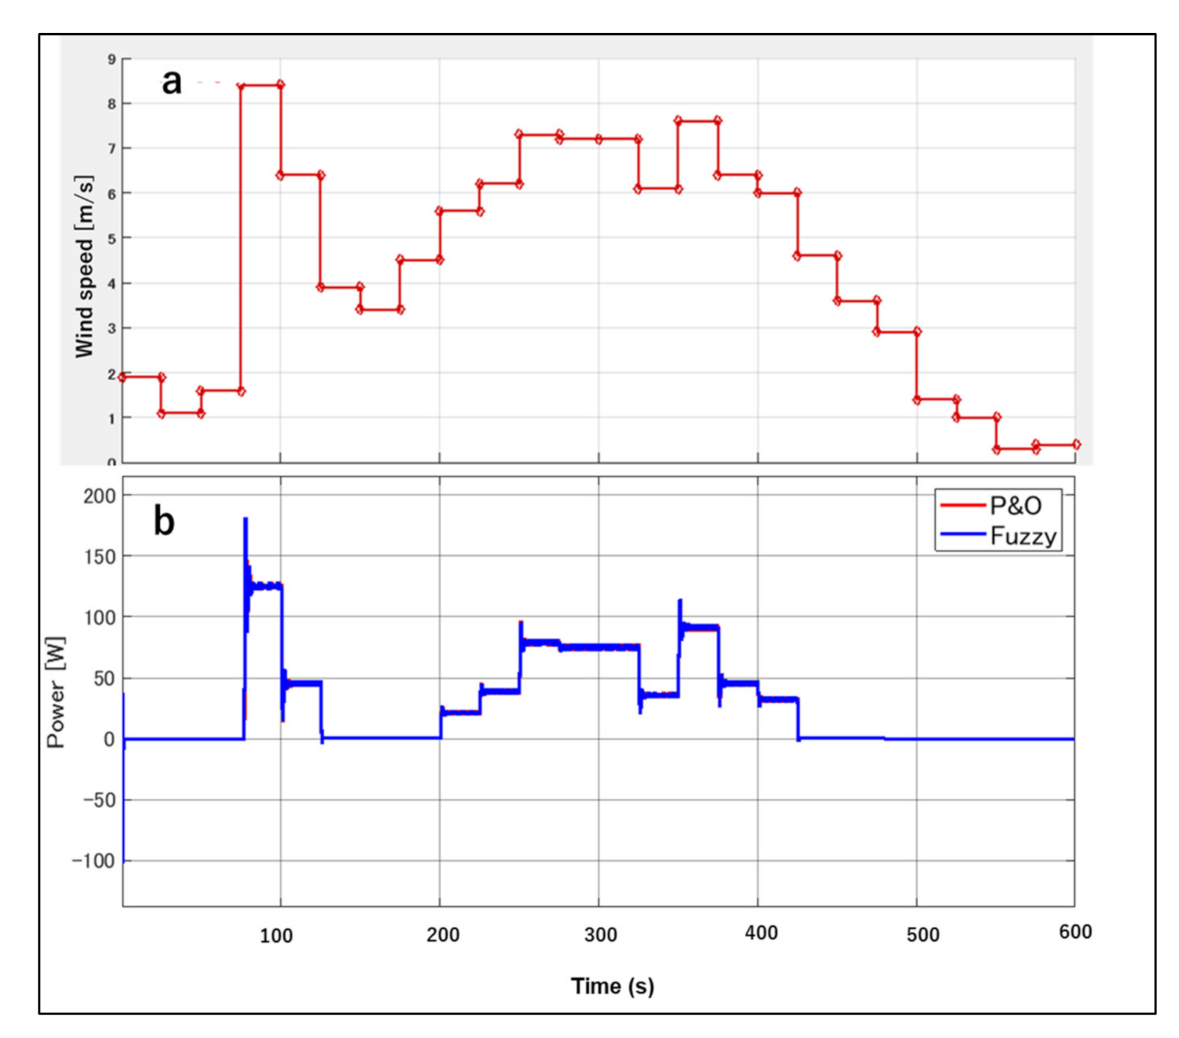
Figure 3. The first part of this research includes developing a detailed dynamic simulation performed in MATLAB Simulink to simulate the technical performance of the PV arrays and wind turbine, which are equipped with the FLC-based MPPT. The Simulink is used to evaluate the effectiveness of the FLC-based MPPT in rapid tracking of the MPP and extracting surplus power from the HRES, compared with a conventional P&O-based MPPT. The detailed meteorological data used in this study are collected from the Japan Meteorological Agency for Fukuoka City.
The second part of the study discusses a detailed techno-economic analysis (TEA) of the proposed HRES, including the hydrogen production and storage components. TEA is used to find the optimal configuration of the HRES and verify the balance of electricity and hydrogen generation for securing the operation feasibly during the system’s lifetime. Furthermore, it addresses the role of the FLC-based MPPT in reducing the levelized cost of electricity (LCOE) of the proposed HRES and, finally, the impact of the future costs of each component (solar, wind, fuel Cell) on the LCOE in 2030 will be evaluated.

2. Model Development

2.1. Solar Power Simulation Model

Figure 4 shows the whole solar-module Simulink model, including FLC–MPPT systems. The technical specification of the solar panel used in this study is given in Table 2. Figure 5 shows the schematic diagram of the buck converter. The DC–DC converter is used as an impedance matching system to track the MPP. The buck converter switches ON and OFF to adjust the output voltage by referring to the duty cycle from the MPPT, following the MPP voltage.
Table 3 shows the technical parameters of the buck converter. In this buck converter, an insulated-gate bipolar transistor (IGBT) buck converter is connected to each PV panel. The pulse width modulation (PWM) is controlled by combining IGBTs and diodes, followed by inductors, freewheeling diodes, and capacitors.
Fuzzy logic is a type of multi-valued logic that can express linguistic variables by using values from 0 to 1, similar to human thinking. The fuzzy logic controller comprises three components: fuzzification, rule interface, and defuzzification, as shown in Figure 6.
In the stage of fuzzification, numeric input variables are transformed into linguistic variables. Typically, the input variables of the controller are the error (E) and the variation of error (CE). The error shows the operating point of the PV system concerning the MPP, where it should be zero, and its variation shows how this point moves in the power-voltage curve. The transformation is carried out by applying the membership functions set for different input variables ranges, and its value varies between 0 and 1. The interface is responsible for implementing the rule-based functions that define the behavior of the controller. The controller output will be a linguistic variable that establishes the duty ratio of the converter and iteratively makes the error tend to zero. In the defuzzification stage, the membership functions are applied to obtain the numerical output values.
The FLC judges the operating point (OP) position by using two inputs. These are the slope of the power–voltage (P–V) curve’s tangential line dP dV and displacement direction of the operating point d 2 P dV 2 , which are shown in Figure 7.
The FLC judges the MPP position by using two inputs. These are the slope of the P–V curve’s tangential line dP dV and displacement direction of the operating point d 2 P dV 2 . These two inputs are expressed following equations, respectively.
E k = P k P k 1 V k V k 1
C E = E k E k 1
where, P (k) and V (k)are the power and voltage of the PV panel at sample time k.
These input values are converted to the linguistic variables through membership functions. Figure 8 and Figure 9 show the membership functions for input values in this research. Linguistic variables are divided into five categories: NB (negative big), NS (negative small), ZE (zero), PS (positive small), PB (positive big).
Table 4 shows the fuzzy rule used in this research [33]. These 25 rules determine fuzzy outputs. In the power–voltage curve, there are three regions, as shown in Figure 10. In region ①, E(k) is positive. This indicates that the operating point is on the left side of the MPP. To reach the MPP, the duty ratio should be decreased. For example, when E(k) is PS and CE(k) is NS, it means OP is approaching MPP from the left side. At this time, the fuzzy controller outputs ZE not to make oscillations. In region ②, E(k) is zero, and OP is close to MPP. When CE(k) is NB, the OP is moving towards the right side. And the controller outputs PS to stop the OP from moving. In region ③, E(k) is negative. When CE(k) is negative, the OP is getting away from MPP towards the right side. At this stage, the controller increases the duty cycle to bring the OP closer to MPP. Finally, the outputs (ΔD) from the fuzzy controller are converted into numerical values, as shown in Figure 11, and duty cycle D(k) is calculated by the following equation:
D k = D k 1 + Δ D

2.2. Wind Power Simulation Model

Figure 12 shows the wind turbine generator in the Simulink model, which consists of the wind turbine itself, back converter, and MPPT controller. A battery is also connected to the load part in parallel in order to keep the voltage applied to the load constant and prevent errors that may occur during the simulation. The technical specification of the wind turbine generator used in this simulation is shown in Table 5. Figure 13 shows the MPPT controller’s details, where the fuzzy controller determines the appropriate output value ΔD. The following equations represent inputs for the fuzzification in the wind turbine.
E k = P k P k 1
C E k = V k V k 1
D k = D k 1 + Δ D
Table 5 represents the fuzzy rules that are used in the wind turbine MPPT system.
Figure 14, Figure 15 and Figure 16 show membership functions for E k , C E k and Δ D , respectively. Table 6 represents the fuzzy rules.

3. Experimental Setup

Figure 17 shows the proposed HRES, which is installed at the campus in Kasuga City, Fukuoka Prefecture, Japan [9]. The proposed system consists of three PV modules with a total power of (480 W), a wind turbine (400 W), a lead-acid battery (30 Ah), an inverter, and a MPPT controller, which operates based on the P&O method.
The solar panel surface temperature was measured by using a LM335 temperature sensor, which was installed on the surface of the panel. The incident solar radiation on the PV panels was measured, using an MS-40S pyranometer. The solar analyzer (PROVA 200A) was used to measure the short-circuit current and open voltage of the solar panel and extract the current-voltage curves under the various solar irradiations and ambient temperatures.

4. Results and Discussions

4.1. Comparison between the FLC-Based and P&O-Based MPPT Systems

The simulation model was carried out, considering a sunny, cloudy, and rainy day in each month (see Table 7). Figure 18 shows the comparison between the P&O-based and the proposed FLC-based MPPTs in this research for a short period of 10 min simulation on this sunny day. As shown in this figure, the FLC-based MPPT extracts higher power with lower oscillation than the P&O controller. The better performance of the FLC is more evident at the higher levels of solar irradiation. The simulation results reveal that the output power based on the FLC-based MPPT is significantly higher than the P&O-based MPPT on cloudy days. This is because the P –V curve slope is extremely small due to the low solar radiation (see Figure 19).
The deviation from the P&O-based MPPT appears during the fast-changing environmental conditions, such as rapid changes in solar irradiation or ambient temperature, which is basically due to its lower tracking speed, especially when the variation of power caused by the different intensity of irradiation is larger than the one produced by the perturbation. Compared with the FLC-based MPPT, the fixed step-size perturbation applied to the P&O-based MPPT cannot satisfy both dynamic and steady-state response conditions, since big perturbations provide a rapid reach of MPP, but also cause large oscillations. On the other hand, small changes remove these oscillations but give a slow performance to the MPPT. Furthermore, partial shading can cause the MPP tracker to be oscillating around one of the multiple local power peaks. Another drawback of the P&O-based MPPT is that it cannot recognize the difference between local and global MPP. Therefore, the expected output power is lower than the FLC-based MPPT.
Figure 20 shows the comparison between the FLC-based and P&O-based MPPTs for the wind turbine on 1 April 2020. As shown in this figure, there are almost no differences between fuzzy and P&O controller results for the wind power generator. Although the proposed FLC offers excellent performance in controlling solar panels, it doesn’t significantly improve the wind turbine’s maximum power, particularly at low wind speed. This is because the wind control system includes mechanical (pitch control) and electrical power sections, but only the electrical part was considered in the simulation model.
The simulation results for an entire period of one year are reported in Table 8. The results revealed a potential of 2% extra power generation from the proposed HRES, using the FLC-based MPPT system. According to the results, by implementing the FLC-based MPPT system, about 26.2 kWh/y excess electricity can be extracted from each kW installed capacity of solar panels in the Chikushi campus.

4.2. Techno-Economic Analysis of the Proposed HRES

HOMER Pro is used for the techno-economic analysis in this research. HOMER software was developed by NREL (National Renewable Energy Laboratory). This software enables the optimal design and sizing of hybrid renewable energy systems by performing a techno-economic analysis of off-grid and grid-connected power systems [34]. HOMER considers two economic indicators, net present cost (NPC) and levelized cost of energy (LCOE). The total NPC of a system is the present value of all the costs the system incurs over its lifetime, minus the present value of all the revenue it earns over its lifetime. Costs include capital costs, replacement costs, O&M costs, fuel costs, emissions penalties, and the costs of buying power from the grid. Revenues include salvage value and grid sales revenue. HOMER calculates the total NPC by summing the total discounted cash flows in each year of the project lifetime [35]. The formula for calculating NPC is expressed as follows:
N P C = I + i = 1 n C y [ 1 1 + d i ]
The LCOE is defined as the average cost per kWh of electrical energy produced by the system, as follows:
L C O E = C a n n , t o t E s e r v e d
where:
I : Initial capital cost [JPyen]
n : Project span [year]
C y : Yearly cost (O&M and replacement) [JPyen]
d : Discount rate [%]
E s e r v e d : Total electrical served [kWh/year]
C a n n , t o t : Total annualized cost of the system [JPyen/year]
Figure 21 represents the proposed grid-tied system, including solar PV, wind turbines, fuel cells, electrolyzers, and hydrogen tanks, as shown in the (FC: Fuel cell, WT: Wind turbine). All renewable energy systems are connected to the DC bus, and the electrolyzer uses only electricity supplied by solar and wind power to electrolyze water and produce hydrogen. The AC bus is connected only to the grid, and the electricity provided by the power company is used solely for power consumption on campus. Figure 22 shows the average hourly power consumption, maximum and minimum power consumption for each month at the Chikushi campus. When considered throughout the year, the average total daily power consumption is estimated at 25,256 kWh/day, and the total annual power consumption is about 9218.5 MWh/year.
In this study, the wind turbine size is limited in the range of 0 to 10 kW. This is because the campus site area where the HRES will be installed is restricted, and wind turbines require more land than any other renewable energy system. The installed capacity of the hydrogen system is considered as: 1 kW (Fuel cell): 10 kW (Electrolyzer): 1 kg (H2 tank). This is based on the assumption that the electrolyzer operates for 9 h during the day to produce hydrogen, and the fuel cell consumes the stored hydrogen for 7 h after sunset. The electrolyzer’s power consumption is assumed about 46.4 [kWh] per 1 kg of hydrogen.
Table 9 shows the current estimated costs for each component and economic data. The costs are divided into initial capital cost, operation and maintenanc (O&M) cost, and replacement cost. Besides this, the purchase price of electricity was considered to be 22 JPYen/kWh [8].
It is noted that the economic benefit from surplus power generated by the FLC-based MPPT is monetized as a reduction in O&M cost. As shown before, for each 1 kW of installed capacity of the PV, about 26.2 kWh surplus electricity can be generated from the FLC-based MPPT system.

4.2.1. Base Case Scenario

The simulations were performed for ten different fuel cell sizes from 10 kW to 100 kW at 10 kW intervals. The capacity of each component, except the hydrogen system, is determined by HOMER optimization. The simulation results show that the best COE for both P&O and the fuzzy controller is obtained when the smallest fuel cell of 10 kW is used. Table 10 and Table 11 show the breakdown of HRES and cost analysis results for the FLC-based and P&O-based MPPTs.
According to the base case scenario, the FLC-based HRES enables the installation of more PV systems than the P&O-based system. With the increase in PV system generation, the energy supply to the electrolyzer also increases. This means that the fuel cell in the FLC-based HRES generates more electricity than the P&O-based system. Furthermore, the FLC-based HRES shows better cost benefits.

4.2.2. Future Cost Scenario

This scenario discusses the cost analysis of the HRES components based on their future prices. Table 11 summarizes the initial capital costs in 2020 and expected costs in 2030 for solar panels, wind turbines, fuel cells, and electrolyzers. Over the past few years, the amount of renewable energy plants installed has increased dramatically due to the policies, research and development, and funding of each major country. Among them, solar power is considered to be one of the most competitive technologies. The total installed cost has decreased by 74% between 2010 and 2018. For the case of wind power, improvements in technology and manufacturing processes, as well as the rise of competitive supply chains, are driving down the price of installation costs; average prices in 2018 ranged from 790 to 900USD/kW, down from 910 to 1050 USD/kW in 2017. In 2017, the Japanese government established the Strategic Roadmap for Hydrogen and Fuel Cells, the world’s first national hydrogen strategy. Specifically, it aims to achieve hydrogen costs comparable to gasoline and LNG costs, along with a reduction in the cost of installing fuel cells and electrolysis equipment [36]. Based on the cost projections in Table 12, the following three scenarios were considered for the proposed FLC-based hybrid system.
  • Scenario (1): future costs are only applied to solar panels;
  • Scenario (2): future costs are only applied to fuel cells and electrolyzers;
  • Scenario (3): future costs are applied to all components.
Table 13 represents the respective values of cost of electricity (COE) based on the above scenarios, taking into account the various sizes of the cells from 10 kW to 100 kW. The lowest COE can be achieved with a 10 kW fuel cell in all scenarios. The best results are obtained in scenario (3).
Table 14 shows the component sizes of each RES for different classes of (A) through (D). It can be seen that all the component sizes of class (C) are the same as the class (A), and there is not much difference in the COE, even though the installation cost of the hydrogen system is decreasing. This is because the hydrogen system is only powered by the PV system. As long as PV system installations do not increase due to falling PV panel installation costs, the amount of electricity generated by the fuel cell will not increase, and the share of HRES in the total electricity will not change. In addition, class (D) has the most extensive size of the hydrogen system and the largest solar panels to provide its electricity supply.
Table 15 shows the electricity generation and COE for each component from class (A) to class (D). Based on class (D), the amount of electricity generated by each component increases in proportion to the installed capacities.
It can be observed that the electricity generation from the fuel cell in class (D) is substantial. Based on these results, larger capacity components can be adopted, as the installation and maintenance costs of renewable energy systems are expected to be reduced in the future. This will lead to better COE, which will contribute to the realization of a cleaner energy society.

5. Conclusions

This study proposed a grid-tied hybrid solar–wind system, which can be installed at Kyushu University’s Chikushi Campus in Kasuga, Japan. The proposed HRES is equipped with a FLC-based MPPT, which provides rapid power control with smaller oscillations under variable weather conditions. The dynamic simulation of the proposed HRES system was performed in MATLAB -Simulink. The research results indicated the FLC-based MPPT’s better performance in optimal power controlling of the HRES. According to the results, by implementing the FLC-based MPPT, about 26.2 kWh/y extra electricity can be extracted from each KW installed capacity of solar panels in the Chikushi campus.
The techno-economic analysis of the proposed system was performed in HOMER software, aiming to estimate the optimal configuration of the proposed HRES subject to satisfying the required annual load in the Chikushi campus. According to the results, the estimated value of COE for the HRES equipped with the FLC-based MPPT was lower. A sensitivity analysis was also carried out to assess the feasibility of the proposed HRES, using the future market price of renewable energy technologies in 2030. The results revealed that the coming decline in the solar system’s market cost, which is the largest energy source in the HRES, is essential for improving the COE. This study proves that larger systems can be installed if the costs of installing and maintaining renewable energy systems are reduced as expected.

Author Contributions

Conceptualization and methodology: H.F. and T.H., Investigation: T.H. and A.S.; Writing: H.F., T.H. and A.S.; Review, editing: H.F.; Supervising: H.F. All authors have read and agreed to the published version of the manuscript.

Funding

This research was supported by the Kyushu Natural Energy Promotion Organization.

Institutional Review Board Statement

Not applicable.

Informed Consent Statement

Not applicable.

Data Availability Statement

Not applicable.

Acknowledgments

The authors wish to thank the editor and the reviewers for their contributions on the paper.

Conflicts of Interest

The authors declare no conflict of interest

Nomenclature

ACOAnt Colony Optimization
ANNArtificial Neural Networks
CSCuckoo Search
DFOADragonfly Optimization Algorithm
FSCCFractional Short Circuit Current
FLCFuzzy Logic Control
GWOGrey Wolf Optimization
HHOHarris Hawk Optimization
HCSHill Climbing Search
HRESHybrid Renewable Energy System
INCIncremental Conductance
ILCIterative Learning Controler
IGBTInsulated-Gate Bipolar Transistor
LCOELevelized Cost of Electricity
MPPTMaximum Power Point Tracking
MPPMaximum Power Point
NBNegative Big
NS
NPC
Negative Small
Net Present Value
PSOParticle Swarm Optimization
P&OPerturbation and Observation
PWMPulse width modulation
PSPositive Small
PB
PID
Positive Big
Proportional–Integral–Derivative
RBFNRadial Basis Function Network
RSMCRobust Sliding Mode Control
SMCSliding Mode Controller
SIFLSpeed-Control and Single Input Fuzzy Logic
TEATechno-Economic Analysis
ZEZero

References

  1. McLellan, B.C.; Zhang, Q.; Utama, N.A.; Farzaneh, H.; Ishihara, K.N. Analysis of Japan’s post-Fukushima energy strategy. Energy Strat. Rev. 2013, 2, 190–198. [Google Scholar] [CrossRef] [Green Version]
  2. Agency for Natural Resources and Energy. Japan’s Energy; 2019. Available online: https://www.enecho.meti.go.jp/en/category/brochures/pdf/japan_energy_2019.pdf (accessed on 14 January 2021).
  3. Farzaneh, H. Devising a Clean Energy Strategy for Asian Cities; Springer Nature: Singapore, 2018. [Google Scholar]
  4. Esteban, M.; Portugal-Pereira, J.; McLellan, B.C.; Bricker, J.; Farzaneh, H.; Djalilova, N.; Ishihara, K.N.; Takagi, H.; Roeber, V. 100% renewable energy system in Japan: Smoothening and ancillary services. Appl. Energy 2018, 224, 698–707. [Google Scholar] [CrossRef] [Green Version]
  5. Yoshida, Y.; Keisuke, N.; Farzaneh, H. Optimal Design and Operation of a Residential Hybrid Microgrid System in Kasuga City. In Sustainable Production, Life Cycle Engineering and Management; J.B. Metzler: Stuttgart, Germany, 2021; pp. 499–512. [Google Scholar]
  6. Takatsu, N.; Farzaneh, H. Techno-Economic Analysis of a Hybrid Solar-Hydrogen-Biomass System for Off-Grid Power Supply. In Sustainable Production, Life Cycle Engineering and Management; J.B. Metzler: Stuttgart, Germany, 2021; pp. 483–497. [Google Scholar]
  7. Roth, A.; Boix, M.; Gerbaud, V.; Montastruc, L.; Etur, P. A flexible metamodel architecture for optimal design of Hybrid Renewable Energy Systems (HRES)–Case study of a stand-alone HRES for a factory in tropical island. J. Clean. Prod. 2019, 223, 214–225. [Google Scholar] [CrossRef] [Green Version]
  8. Yoshida, Y.; Farzaneh, H. Optimal design of a stand-alone residential hybrid microgrid system for enhanc-ing renewable energy deployment in Japan. Energies 2020, 13, 1737. [Google Scholar] [CrossRef] [Green Version]
  9. Takatsu, N.; Farzaneh, H. Techno-Economic Analysis of a Novel Hydrogen-Based Hybrid Renewable Energy System for Both Grid-Tied and Off-Grid Power Supply in Japan: The Case of Fukushima Prefecture. Appl. Sci. 2020, 10, 4061. [Google Scholar] [CrossRef]
  10. Shaqour, A.; Farzaneh, H.; Yoshida, Y.; Hinokuma, T. Power control and simulation of a building integrated stand-alone hybrid PV-wind-battery system in Kasuga City, Japan. Energy Rep. 2020, 6, 1528–1544. [Google Scholar] [CrossRef]
  11. Wu, G.; Kodama, S.; Ono, Y.; Monma, Y. A hybrid microgrid system including renewable power generations and energy storages for supplying both the DC and AC loads. In Proceedings of the 2012 International Conference on Renewable Energy Research and Applications (ICRERA), Nagasaki, Japan, 11–14 November 2012; pp. 1–5. [Google Scholar]
  12. Sugimura, M.; Senjyu, T.; Krishna, N.; Mandal, P.; Abdel-Akher, M.; Hemeida, A.M. Sizing and Operation Optimization for Renewable Energy facilities with Demand Response in Micro-grid. In Proceedings of the 2019 20th International Conference on Intelligent System Application to Power Systems (ISAP), New Delhi, India, 10–14 December 2019; pp. 1–5. [Google Scholar]
  13. Heydari-Doostabad, H.; Keypour, R.; Khalghani, M.R.; Khooban, M.H. A new approach in MPPT for photovoltaic array based on Extremum Seeking Control under uniform and non-uniform irradiances. Sol. Energy 2013, 94, 28–36. [Google Scholar] [CrossRef]
  14. García, A.E.; Tutor, A.; Ángel, J.; Ramírez, O. Maximum Power Point Tracking Algorithms for Solar Photo-Voltaic Systems; Universidad Politécnica de Madrid: Madrid, Spain, 2017. [Google Scholar]
  15. Zhang, X.; Gamage, D.; Wang, B.; Ukil, A. Hybrid Maximum Power Point Tracking Method Based on Iterative Learning Control and Perturb & Observe Method. IEEE Trans. Sustain. Energy 2021, 12, 659–670. [Google Scholar] [CrossRef]
  16. Messalti, S.; Harrag, A.; Loukriz, A. A new variable step size neural networks MPPT controller: Review, simulation and hardware implementation. Renew. Sustain. Energy Rev. 2017, 68, 221–233. [Google Scholar] [CrossRef]
  17. Ahmed, J.; Salam, Z. A Modified P&O Maximum Power Point Tracking Method With Reduced Steady-State Oscillation and Improved Tracking Efficiency. IEEE Trans. Sustain. Energy 2016, 7, 1506–1515. [Google Scholar] [CrossRef]
  18. Mei, Q.; Shan, M.; Liu, L.; Guerrero, J.M. A Novel Improved Variable Step-Size Incremental-Resistance MPPT Method for PV Systems. IEEE Trans. Ind. Electron. 2011, 58, 2427–2434. [Google Scholar] [CrossRef]
  19. Sher, H.A.; Murtaza, A.F.; Noman, A.; Addoweesh, K.E.; Al-Haddad, K.; Chiaberge, M. A New Sensorless Hybrid MPPT Algorithm Based on Fractional Short-Circuit Current Measurement and P&O MPPT. IEEE Trans. Sustain. Energy 2015, 6, 1426–1434. [Google Scholar] [CrossRef] [Green Version]
  20. Kumar, K.; Ramesh Babu, N.; Prabhu, K.R. Design and analysis of RBFN-based single MPPT con-troller for hybrid solar and wind energy system. IEEE Access 2017, 5, 15308–15317. [Google Scholar] [CrossRef]
  21. Zebraoui, O.; Bouzi, M. Improved MPPT controls for a standalone PV/wind/battery hybrid energy system. Int. J. Power Electron. Drive Syst. (IJPEDS) 2020, 11, 988–1001. [Google Scholar] [CrossRef]
  22. Mansoor, M.; Mirza, A.F.; Ling, Q. Harris hawk optimization-based MPPT control for PV systems under partial shading conditions. J. Clean. Prod. 2020, 274, 122857. [Google Scholar] [CrossRef]
  23. Benlahbib, B.; Bouarroudj, N.; Mekhilef, S.; Abdeldjalil, D.; Abdelkrim, T.; Bouchafaa, F.; Lakhdari, A. Experimental investigation of power management and control of a PV/wind/fuel cell/battery hybrid energy system microgrid. Int. J. Hydrog. Energy 2020, 45, 29110–29122. [Google Scholar] [CrossRef]
  24. Priyadarshi, N.; Ramachandaramurthy, V.K.; Padmanaban, S.; Azam, F. An Ant Colony Optimized MPPT for Standalone Hybrid PV-Wind Power System with Single Cuk Converter. Energies 2019, 12, 167. [Google Scholar] [CrossRef] [Green Version]
  25. Phan, B.C.; Lai, Y.C. Control strategy of a hybrid renewable energy system based on reinforcement learning approach for an isolated Microgrid. Appl. Sci. 2019, 9, 4001. [Google Scholar] [CrossRef] [Green Version]
  26. Hadjaissa, A.; Ameur, K.; Boutoubat, M. A WCA-based optimization of a fuzzy sliding-mode con-troller for stand-alone hybrid renewable power system. Soft Comput. 2018, 23, 7831–7842. [Google Scholar] [CrossRef]
  27. Tazay, A.F.; Ibrahim, A.M.A.; Noureldeen, O.; Hamdan, I. Modeling, Control, and Performance Evaluation of Grid-Tied Hybrid PV/Wind Power Generation System: Case Study of Gabel El-Zeit Region, Egypt. IEEE Access 2020, 8, 96528–96542. [Google Scholar] [CrossRef]
  28. Laxman, B.; Annamraju, A.; Srikanth, N.V. A grey wolf optimized fuzzy logic based MPPT for shaded solar photovoltaic systems in microgrids. Int. J. Hydrog. Energy 2021, 46, 10653–10665. [Google Scholar] [CrossRef]
  29. Li, X.; Wen, H.; Hu, Y.; Jiang, L. A novel beta parameter based fuzzy-logic controller for photovol-taic MPPT application. Renew. Energy 2019, 130, 416–427. [Google Scholar] [CrossRef]
  30. Keyrouz, F. Enhanced Bayesian Based MPPT Controller for PV Systems. IEEE Power Energy Technol. Syst. J. 2018, 5, 11–17. [Google Scholar] [CrossRef]
  31. ECO-WORTHY. Available online: https://www.eco-worthy.com (accessed on 24 February 2021).
  32. Algarín, C.R.; Fuentes, R.L.; Castro, A.O. Implementation of a cost-effective fuzzy MPPT controller on the Arduino board. Int. J. Smart Sens. Intell. Syst. 2018, 11, 1–10. [Google Scholar] [CrossRef] [Green Version]
  33. Lee, J.; Kim, Y.C. Fuzzy Logic Based Maximum Power Point Tracking Algorithm for Photovoltaic Power Generation System. J. Green Eng. 2016, 6, 403–426. [Google Scholar]
  34. Shahzad, M.K.; Zahid, A.; Rashid, T.U.; Rehan, M.A.; Ali, M.; Ahmad, M. Techno-economic feasibility analysis of a solar-biomass off grid system for the electrification of remote rural areas in Pakistan using HOMER software. Renew. Energy 2017, 106, 264–273. [Google Scholar] [CrossRef]
  35. HOMER–Hybrid Renewable and Distributed Generation System Design Software. Available online: https://www.homerenergy.com (accessed on 24 February 2021).
  36. Hydrogen and Fuel Cellsin Japan. 2019. Retrieved from EU-Japan Centre for Industrial Cooperation Web-site. Available online: https://www.eujapan.eu/sites/default/files/publications/docs/hydrogen_and_fuel_cells_in_japan.pdf (accessed on 14 January 2021).
Figure 1. Japan’s energy mix outlook in 2030 (Adapted from [2]).
Energies 14 01960 g001
Figure 2. Hybrid renewable energy system (HRES) at the Chikushi campus of Kyushu university.
Energies 14 01960 g002
Figure 3. Research flow in this paper.
Energies 14 01960 g003
Figure 4. PV Simulink model.
Energies 14 01960 g004
Figure 5. Schematic diagram of the buck converter.
Energies 14 01960 g005
Figure 6. Structure of fuzzy controller.
Energies 14 01960 g006
Figure 7. PV fuzzy controller Simulink model.
Energies 14 01960 g007
Figure 8. PV fuzzy logic control (FLC) membership function for E [19].
Energies 14 01960 g008
Figure 9. PV FLC membership function for CE [32].
Energies 14 01960 g009
Figure 10. Power –voltage curve of the PV panel.
Energies 14 01960 g010
Figure 11. Output membership function for ΔD [19].
Energies 14 01960 g011
Figure 12. Wind generator Simulink model.
Energies 14 01960 g012
Figure 13. Simulink model of the fuzzy controller for the wind generator.
Energies 14 01960 g013
Figure 14. Wind turbine FLC input membership for C.
Energies 14 01960 g014
Figure 15. Wind turbine FLC membership for CE.
Energies 14 01960 g015
Figure 16. Wind turbine FLC output membership function for ΔD.
Energies 14 01960 g016
Figure 17. Experimental setup in this study: (1) wind turbine, (2) weather measurement station, (3) power datalogger, (4) inverter, (5) PV DC converter and MPPT controller, (6) wind DC converter and MPPT controller, (7) MS-40C pyranometer, (8) PV modules, (9) battery, (10) LM335 thermocouple, (11) temperature datalogger, (12) solar analyzer PROVA 200A.
Energies 14 01960 g017
Figure 18. Comparison between the FLC-based and perturbation and observation (P&O)-based MPPT systems for PV (sunn day): (a) Weather conditions; (b) Output power.
Energies 14 01960 g018
Figure 19. Comparison between the FLC-based and P&O-based MPPT systems for PV (cloudy day): (a) Weather conditions; (b) Output power.
Energies 14 01960 g019
Figure 20. Comparison between the FLC-based and P&O-based MPPT systems for the wind turbine (windy day); (a) Wind speed; (b) Output power.
Energies 14 01960 g020
Figure 21. HOMER simulation model of the proposed HRES.
Energies 14 01960 g021
Figure 22. Monthly average electricity consumption in Chikushi campus, Kyushu University, Japan.
Energies 14 01960 g022
Table 1. A review of recent maximum power point tracking (MPPT) techniques for PV and wind renewable energy systems.
ConfigurationEnergy SourcesMPPT TechniqueTarget of ControlDescriptionRef
Stand-alone/grid connectedPV–windRadial basis function network (RFBN)-based single MPPT.Boost converterA single (RFBN)-based single MPPT controller was used to control both boost converters connected to the PV and wind systems, whereas one for each is used in conventional systems. They achieved higher performances over modified (improved) P&O.[20]
Stand–alonePV–wind-batteryP&O, FLC, sliding mode control (SMC), hill climbing search (HCS)Boost converterA hybrid method of P&O, FLC, and SMC was used for PV MPPT, and a hybrid of HCS and FLC were utilized for wind MPPT. The results show significant performance over conventional P&O, FLC, and robust sliding mode control (RSMC).[21]
Stand-alonePV–batteryHarris Hawk optimization (HHO)Boost converterThe HHO control was tested under highly varying irradiance, partial shading, complex partial shading, and accurate atmospheric data. It was then compared to PSO, cuckoo search (CS), grey wolf optimization (GWO), and dragonfly optimization algorithm (DFOA), where it showed 10–30% tracking time improvement, and to P&O, where it showed 95.45% steady-state oscillation reduction.[22]
Stand-alonePV–wind–battery–fuel cellSpeed-control and single input fuzzy logic (SIFL) controllersBuck converterValidated with an experimental setup, the speed-control was used for MPPT to the wind turbine while the SIFL controller was used for PV. A fractional order PID (FOPID) controller was used to control the Bi-directional buck-boost converter for the battery. The results show good potential and performance.[23]
Stand-alonePV–wind–batteryAnt colony optimization (ACO)Buck converterThe ACO MPPT controls a single buck converter for optimizing wind turbine power and battery charging. ACO achieved seven times faster convergence than particle swarm optimization (PSO). A fuzzy logic controller (FLC) was used to control the inverter.[24]
Grid connectedPV–wind–battery–fuel cell–diesel generatorA hybrid of P&O and Q-Learning (h-POQL)Boost converterA combination of the reinforcement learning (RL)-based Q-Learning algorithm and P&O was used for MPPT of the PV system, where it showed improved performance over conventional P&O.[25]
Stand-alonePV–battery–fuel cellFuzzy sliding-mode controller optimized with water cycle algorithm (WCA)Boost converterThe WCA was used for the first time in renewable energy systems to optimize the input and output gain of the fuzzy sliding-mode controller. The main target of the control system is to optimize for maximum PV power generation and DC–bus voltage error reduction.[26]
Grid connectedPV–windAdaptive incremental conductance (AIC), modified P&OBoost converterA variable step-size AIC was used for MPPT of the PV system, while a modified P&O was used for MPPT of the wind system. The results were validated with accurate monthly weather data.[27]
Stand-alonePVGrey wolf optimized adaptive fuzzy logic controller (AFLC)Boost converterGWO was used to optimize the membership functions of the AFLC MPPT controller and was tested on four shading patterns where it overcame the drawback of conventional FLC and P&O MPPT methods.[28]
Stand-alonePVA novel beta parameter-based FLCBoost converterA third intermediate beta parameter to the FLC was introduced to reduce the complexity of the fuzzy rule function and cover wider operating conditions reducing the user’s dependence on system knowledge.[29]
Stand-alonePVBayesian fusion general-purpose adaptive MPPT, PID controllerBoost converterBayesian fusion, which is a machine learning-based method, is used to avoid PowerPoint local minima under partial shading cases, while a PID controller is used to minimize steady-state oscillations. Results show enhanced response time and efficiency compared to state-of-the-art techniques.[30]
Table 2. Technical specifications of the solar panel [31].
ParameterValue
Maximum Power [W]160
Voltage at MPP [V]17.9
Current at MPP [A]8.94
Open circuit voltage [V]21.6
Short circuit current [A]9.47
Temperate coefficient of Isc 1 [%/°C]0.10 ± 0.01
Temperate coefficient of Voc 2 [%/°C]−(0.38 ± 0.01)%/°C
The number of cells on the PV panel36
1 Short-circuit current. 2 Open circuit voltage.
Table 3. Parameter of the buck converter [10].
ParameterValue
Capacitance (C1)2.2 [mF]
Capacitance (C2)2.2 [mF]
Resistance (R)10,000× 103 [Ω]
Inductance (L)3 [mH]
Table 4. Fuzzy rules for the PV panel.
ECE
NBNSZEPSPB
NBZEPBPBPBPB
NSPBPBPSZEZE
ZEPSZEZEZENS
PSZEZENSNBNB
PBZENBNBNBZE
Table 5. Wind generator parameters [10].
ParameterValue
Rated power400 W
Rated voltage 12 V
Start-up wind speed2.5 m/s
Rated wind speed10.5 m/s
Maximum wind speed35 m/s
Rated rotation speed800 rpm
Fan blade quantity3
Rotor blades diameter1.2 m
Table 6. Fuzzy rules for the wind turbine.
ECE
NBNSPSPB
NBNBNSPSPB
NSNSNSPSPS
PSNSZEZEPS
PBNSZEZEPS
Table 7. Selected dates for testing the simulation model in this study.
Sunny DayCloudy DayRainy Day
1-Jan13-Jan22-Jan
4-Feb7-Feb12-Feb
20-Mar22-Mar28-Mar
14-Apr15-Apr19-Apr
1-May25-May26-May
8-Jun4-Jun25-Jun
16-Jul17-Jul6-Jul
29-Aug28-Aug7-Aug
14-Sep20-Sep12-Sep
20-Oct8-Oct22-Oct
5-Nov19-Nov18-Nov
12-Dec29-Dec22-Dec
Table 8. Surplus output power from the FLC-based MPPT compared to the P&O-based MPPT.
MonthP&O Power [kWh]Fuzzy Power [kWh]Power Difference [kWh]Saving [%]
January33.4134.160.762.27
February38.5539.370.822.13
March52.9254.471.552.94
April66.0567.921.872.83
May62.3363.731.402.24
June66.2767.541.271.92
July26.2026.570.371.42
August54.0155.021.011.86
September52.6853.911.242.35
October59.6160.691.071.80
November49.6750.590.921.84
December15.7916.090.291.86
Total577.49590.0612.572.18
Table 9. Costs items of the main components of the proposed HRES.
ComponentLifetime [years]Initial capital cost [JPYen]Replacement [JPYen]O&M [JPYen/year]Reference
PV [kW]20230,000230,000P&O: 11,500 Fuzzy: 10,924 [8]
WT [kW]20250,723250,7237740[7]
Fuel cell [kW]10400,000400,0009000[8]
Electrolyzer [kW]10170,000170,0003000[8]
H2 tank [kg]20150,000150,0004000[8]
Inverter [kW]2013,97013,970110[7]
Parameter Values
Nominal discount rate [%]0.3
Expected inflation rate [%]0.98
Project lifetime [years]20
Table 10. Component capacity and electricity production of the proposed HRES.
P&O-Based MPPTFLC-Based MPPT
ComponentSize [kW]Electricity Production [MWh/Year]Size [kW]Electricity Production [MWh/year]
PV1675235017822500
Wind turbine 1014.51014.5
Fuel cell104.26104.6
Electrolyzer10054.1100−58.3
H2 tank2020
Converter14921542
Grid purchase72537144
Table 11. Cost analysis comparison of the FLC-based and P&O-based MPPTs.
ControllerNPC [JPYen]Cost Of Electricity [JPYen]Operating Cost [JPYen/Year]Total O&M [JPYen]Initial Capital [JPYen]
P&O4.31 B38.09180 M3.86 B433 M
Fuzzy4.29 B37.74178 M3.81 B458 M
Difference21.4 M0.3422.17 M46.7 M−25.3 M
Table 12. Summary of current and future initial capital costs in the future cost scenario.
Component2020 [JPYen]2030 [JPYen]
PV [kW]230,00091,740 [5]
WT [kW]250,723187,000 [5]
Fuel cell [kW]400,000300,000 [6]
Electrolyzer [kW]170,00050,000 [6]
Table 13. Summary of cost of electricity (COE) for each model in the future cost scenario.
Fuel Cell Size
Scenario10 kW20 kW30 kW40 kW50 kW60 kW70 kW80 kW90 kW100 kW
Based on current cost [JPYen]37.74 (A)38.0538.2838.5838.7338.9839.2139.4739.7440.04
Scenario (1) [JPYen]28.59 (B)28.7529.0029.2029.4029.6129.8030.0630.2230.49
Scenario (2) [JPYen]37.61 (C)37.7737.8337.9538.1138.1838.3838.4538.5938.70
Scenario (3) [JPYen]28.4128.5028.5928.6428.7428.8128.8828.9729.0729.33 (D)
A: Base scenario with 10 kW fuel cell; B: scenario (1) with 10 kW fuel cell; C: scenario (2) with 10 kW fuel cell; D: scenario (3) with 100 kW fuel cell.
Table 14. Size of each component of the HRES in the future cost scenario.
CategoryPV [kW]Wind Turbine [kW]Fuel Cell [kW]Electrolyzer [kW]H2 Tank [kg]Converter [kW]
Class (A)17821010100201542
Class (B)50081010100202786
Class (C)17821010100201542
Class (D)51481010010002002785
Table 15. Electricity generation from each component of the HRES in the future cost scenario.
CategoryPV [MWh/Year]Wind Turbine [MWh/Year]Fuel Cell [MWh/Year]Grid [MWh/Year]COE [JPYen]
Class (A)250014.54.6714437.74
Class (B)702614.514.3506828.59
Class (C)250014.54.6714437.61
Class (D)722314.5114492229.33
Publisher’s Note: MDPI stays neutral with regard to jurisdictional claims in published maps and institutional affiliations.

