Review

Standardization Challenges, Opportunities and Recent Evolutions for the G3-PLC Technology

1
EDF R&D, 91120 Palaiseau, France
2
Enedis, 92000 Nanterre, France
3
STMicroelectronics, 20864 Agrate Brianza, Italy
4
STMicroelectronics, 11100 Aosta, Italy
5
Renesas Electronics Europe, 40472 Düsseldorf, Germany
*
Author to whom correspondence should be addressed.
Energies 2021, 14(7), 1937; https://doi.org/10.3390/en14071937
Submission received: 19 February 2021 / Revised: 10 March 2021 / Accepted: 29 March 2021 / Published: 31 March 2021

Abstract

:
Considering the intrinsic benefits of power line communications, the long-lasting lifetime of industrial systems and the growth of IoT, PLC technologies will be part of the worldwide industrial landscape for many decades. This paper discusses the history of the G3-PLC technology and current challenges and opportunities identified in real systems. Finally, it introduces recent evolutions within the G3-PLC standard, which bring additional performance and versatility, enhancing the relevance of G3-PLC as a complementary technology to other telecommunication systems in a 5G-driven telecommunication technology landscape.

1. Introduction

Power line communications (PLC) have progressively gained popularity over the years since a first market push mainly led by Internet service providers integrating PLC in set-top boxes, supporting triple-play services and increasing connectivity inside households. More recently, utilities have chosen to massively roll out “narrowband PLC” (NB-PLC) technologies in smart meters. NB-PLC offers lower data rates but a longer range compared to “broadband PLC,” which is typically used for in-home multimedia applications. PLC has several intrinsic benefits making it an attractive technology for various use cases such as smart metering. These benefits include low total cost of ownership, independency on telecom operators and the fact that PLC is by nature connected to the grid.
NB-PLC, and more specifically the G3-PLC technology, was selected in numerous smart metering deployments worldwide amongst which is the Linky program in France. More recently, G3-PLC was also selected for railway applications and the G3-PLC Alliance has developed the first open specifications for hybrid G3-PLC & radio frequency (RF) communications, enhancing the relevance of NB-PLC for multiple applications.
When looking at the benefits of NB-PLC, the long-lasting lifetime of the abovementioned industrial systems—typically 20 years for smart meters—and the growth of IoT expanding connectivity to an increasing number of devices, PLC technologies will be part of the worldwide industrial landscape for many decades.
Section 2 sheds some light on the history of the G3-PLC technology, developed in the context of the Linky program. Section 3 introduces standardization challenges and opportunities encountered in the operation of NB-PLC in the low voltage (LV) grid. Then, the G3-PLC Hybrid PLC & RF profile and enhancements proposed by the G3-PLC Alliance are discussed in Section 4. Finally, concluding statements are made in Section 5, sketching a long-term vision of NB-PLC in the context of a 5G-driven telecommunication technology landscape.

2. History of the G3-PLC Technology and the Linky Program

For many utilities, Advanced Metering Infrastructures (AMI) constitute the first building block of low voltage (LV) smart grids. The Linky program, led by French distribution service operator (DSO) Enedis, and consisting of the roll-out of 35 million smart meters, is no exception. The Linky system complies with the generic architecture shown in Figure 1.
It relies on NB-PLC for last-mile connectivity: smart meters of the same public LV grid interact with a data concentrator (DC) using PLC communications. The central information system (IS) collects metering data through the DCs and is interfaced with the DSO’s internal systems and the utilities responsible for electricity retailing. On the last-mile segment, exclusively covered by NB-PLC, G3-PLC is the dominant technology covering 32 million Linky smart meters (the remaining portion uses a “first generation” single carrier S-FSK technology). G3-PLC enables reliable and secure IPv6 connectivity thanks to the characteristics of its protocol stack, based on state-of-the-art standards (the reference published international standard is ITU-T G.9903 [1], while power spectral density requirements are given in ITU-T G.9901 [2]). Yet, G3-PLC is the result of an intense industrial effort sustained over years.
The first motivation for developing the G3-PLC standard and related certification program lies in multi-vendor interoperability in order to achieve long-term availability of components. For industrial projects such as Linky, interoperability is an essential requirement to limit the total cost of ownership over time by preventing vendor lock-in. The first version of the G3-PLC specifications, developed according to the technical requirements from Enedis, was released in 2009. From this starting point, field experiments and standardization activities, coordinated by the newly created G3-PLC Alliance have contributed to the maturity required for industrial-scale roll-out of the technology. In 2014, the certification program of the G3-PLC Alliance opened and in 2015, the Linky deployment was initiated as depicted in Figure 2.
In late 2020, almost 30 million Linky smart meters are deployed over the French territory with daily reading rates exceeding 98%. On an international scale, G3-PLC has also been selected for smart metering applications by various utilities and new use cases in different domains emerge (smart grids, street lighting, smart cities, railway control systems, etc.).
As testified by the high-performance levels obtained, G3-PLC meets the technical and reliability requirements necessary in the hostile environment of PLC, because of its unique features such as a mesh routing protocol to determine the best path between remote network nodes, a “robust” mode to improve communication under noisy channel conditions and channel estimation to select the optimal modulation scheme between neighbouring nodes. Its support of IPv6, enabling easy integration of various application profiles, also adds high versatility and carries G3-PLC well into the future.
Nevertheless, increasing penetration of equipment embedding power electronics and intrinsic limitations of existing technologies face increasing expectations to extend NB-PLC infrastructures to new use cases: this questions the durability of NB-PLC in general. Therefore, the PLC community works hard on addressing well-known challenges while also taking the most advantage from existing deployments, as shown in the next section of this paper.

3. Standardization Challenges and Opportunities for the G3-PLC Technology

This section introduces the latest developments in the domain of electromagnetic compatibility in the frequency range from 9 to 150 kHz, the ongoing attempt to standardize operation of NB-PLC in higher frequency bands in Europe and concludes by showing how innovative services based on G3-PLC can provide complimentary added-value to existing deployments.

3.1. EMC in the Frequency Range 9–150 kHz

The frequency range between 9 and 150 kHz has been used by NB-PLC for a long time, but non-intentional emissions (NIE) stemming from non-communicating devices have not been subject to limitations, except in rare cases (namely, LED lamps and induction cooking plates). The problem was initially identified in CENELEC technical reports [3,4], showing an increasing number of electromagnetic interference cases between appliances and NB-PLC devices, due to the growing penetration of power electronics in electrical appliances.
Following these observations, IEC SC77A (responsible for standardization in the field of EMC with regard to low-frequency phenomena) addressed the issue after long and controversial discussions with the publication of two amendments to IEC 61000-2-2 [5] in 2017 and 2018. This standard introduces “compatibility levels” up to 150 kHz, i.e., voltage levels not exceeded in more than 95% of locations (at the point of common coupling between private installations and the LV public distribution network), 95% of the time. Compatibility levels are used to coordinate the setting of emission limits and immunity level, both applying to individual equipment, as described in IEC Guide 107 [6]. The work is now pursued in the CISPR technical committee, which is responsible for setting emission limits above 9 kHz, in collaboration with IEC SC77A within a new joint working group (CIS-H/JWG6).
JWG6 works on the introduction of requirements in the band 9–150 kHz targeting generic emission standards (the standards that apply in the absence of any product-specific standard: IEC 61000-6-3 [7] and IEC 61000-6-8 [8] cover the EMC environments described in IEC 61000-2-2 [5]) and product standards applying to specific types of equipment (such as CISPR 15 [9] for lighting equipment or CISPR 32 [10] for multimedia equipment).
The discussion in JWG6 converges towards an emission limit, corresponding to quasi-peak (QP) voltages measured according to the CISPR 16 methodology in each 200 Hz sub-band. The curve proposed to amend IEC 61000-6-3 [7], compared to the compatibility level curve, is depicted in Figure 3.
In addition, the group works on a second, more innovative level, which aims at limiting the power density of the spectrum in the 9–150 kHz band, to which NB-PLC receivers are sensitive. Power density limitation is not covered in existing EMC standards, as they only limit too narrow portions of the spectrum (200 Hz). The new, Integral Voltage Level (IVL) is computed from existing CISPR 16 200-Hz average (AV) measurements (UAV, 200 Hz) in a given frequency band (fstart to fstop).
IVL f start f stop   ( dB ( µ V ) ) = 20   log f step 200   Hz f start f stop U AV , 200   Hz   2 ( V ) 1   µ V
Remark 1.
In (1), a correction factor expressed as (Δfstep(Hz)/200 Hz) is defined to take into account overlapping between adjacent 200-Hz frequency bands, to avoid counting the same voltage component several times.
The introduction of QP emission limits and IVLs derived from AV measurements in generic emission standards are still under discussion in late 2020. Yet, the current standardization work strengthens the foundations required for the sustained development of NB-PLC.

3.2. NB-PLC above 150 kHz in Europe

While NIE have been limited in the frequency bands above 150 kHz for a long time, regulation of NB-PLC operation is unequal worldwide, American FCC and Japanese ARIB regulations, adopted in many regions globally, well define under which conditions NB-PLC technologies can be operated above 150 kHz. The European regulation is nevertheless perceived as fuzzier and lacks harmonized standardization.
In the European market, products must either comply with a harmonized standard or be submitted to certification by an independent Notified Body, according to the EMC Directive [11]. Both options may be considered for NB-PLC, within the frequency range 3–148.5 kHz, compliance with EN 50065-1 [12] is required, while operation above 150 kHz requires independent notified body certification, since no harmonized standard is available yet. It is up to the manufacturer to decide which procedures and methods should be followed to provide a statement of conformity declaring the compliance of its products with the protection requirements based on the EMC Directive. In 2020, CENELEC TC205A WG9 has started to work on the next revision of EN 50065-1 [12], considering a possible extension of the standard to higher frequency bands.
G3-PLC is already operated in Europe using the “FCC bandplan,” ranging from 154.7 to 487.5 kHz. Austria is one of the first EU countries deploying G3-PLC smart meters in the FCC bandplan: the general strategy chosen by DSOs is to maximize the transmitted level up to the limit of 137 dBµV peak over the whole operating frequency band, as defined in ITU-T G.9901 [2], while certain frequency ranges are notched locally to avoid disturbances to specific radio services.
The advent of a harmonized standard is expected to further foster deployments in this frequency band.

3.3. Innovative Added-Value Services Build on Top of G3-PLC Smart Metering Infrastructures

Beyond the main function of G3-PLC to transmit data through the grid, this sub-section shows how new added-value services can be provided on top of basic AMI functionalities. Three features of Enedis’ Linky system are described: power outage detection, phase detection and grid map consolidation.

3.3.1. Power Outage Detection

G3-PLC enables near real-time power outage identification for immediate action of the grid maintenance crew, even before any problem is reported by affected customers.
This feature is derived from the capabilities of G3-PLC to recognize channel conditions between neighbouring nodes. Each G3-PLC node’s neighbour table (NT) is populated with channel estimation data towards each possible neighbour node. While this mechanism initially intends to optimize the modulation scheme to achieve the best compromise between data rate and robustness, cross-checking the NTs of different G3-PLC nodes may lead to the recognition of a repeated deviation of the NT entry’s valid time for a particular node with respect to others. In fact, an outdated valid time for a specific node reveals the absence of communication towards this node. As shown in Figure 4, if the same deviation is found in several NTs (maintained by several nodes), then a power outage is suspected at a particular location (the repeated deviation is found for only one node) or in an area (repeated deviations are found for several nodes).

3.3.2. Phase Detection

In France, most LV installations are single-phased: the phase a customer is connected to, is chosen randomly, unavoidably entailing unbalanced loading of the three-phase electrical system. Unbalanced loading is one of the causes contributing to the degradation of power quality in public distribution networks (voltage unbalance, increased harmonic emissions, significant supply voltage variations, etc.) that may cause overloads or equipment malfunction. When needed, utilities may undertake phase swapping to recover an acceptable situation, but phase attachment information has to be provided for each customer beforehand. Therefore, Enedis decided to embed a phase detection feature in the Linky smart meters. Electrical phase information may be easily conveyed by synchronizing communication with the mains signal (50 Hz, in France). Yet, the G3-PLC technology uses an asynchronous CSMA/CA access method.
Hence, ITU-T G.9903 [1] specifies a dedicated phase detection mechanism. The delay between the mains signal zero crossing on rising edge and the currently processed data transmission is computed and included in a dedicated header in the frame sent. This delay corresponds to the current value of an 8-bit counter (cTX) synchronized with the mains signal seen by the transmitter node (TX). Upon reception of the frame by the receiver node (RX), the value of cTX extracted from the frame is compared with the value of the local counter (cRX), which characterizes the time elapsed since the last local zero crossing on rising edge (at the instant of reception). As depicted in the example given in Figure 5, the difference between cRX and cTX (255 − 85 = 170) reveals a phase shift of 120° between the two nodes.
The phase shift is finally stored in the neighbour table of the RX node. Every time a frame is sent in the G3-PLC network, phase information is updated. Relative node-to-node phase differences can easily be retrieved from all G3-PLC nodes in order to establish a system of equations allowing for reliable computation of phase difference with respect to an absolute reference. Thanks to this procedure, native to the G3-PLC technology, Enedis has detected and corrected multiple cases of unbalanced loading countrywide.

3.3.3. Grid Map Consolidation

A further step has been taken in the analysis of G3-PLC neighbour tables. Like many utilities, Enedis operates a public distribution network developed over many years, some parts having been installed more than a century ago. This long legacy easily explains that existing cartographic data is prone to approximations and even errors. In addition, the details of the electrical topology beyond the point of common coupling are rarely known in the case of multi-storey buildings. G3-PLC’s data sets can also help here.
Figure 6a shows all possible links having been established between neighbour nodes (obtained from NTs). Figure 6b shows the routes actually established between nodes at a certain point of time thanks to the collection of routing tables (RT) or the use of the G3-PLC Path Discovery feature, which determines all intermediate hops and related metric information to the targeted node (similar to the traceroute program used to diagnose IP routes).
As depicted in Figure 7, the abovementioned route analysis is repeated over time during 30 days and results in an aggregated representation of the network, where links are weighed depending on how often they are actually on a path towards a targeted node. The more a link is weighed, the more it is used for communications, the higher the probability this link matches a real electrical connection.
The previous observations lead to the possibility to define so-called “telecom communities” consisting in groups of meters in a close neighbourhood with a same colour code, as shown in Figure 8a. Each meter and the telecom community it belongs to are then mapped onto the existing cartographic data in Figure 8b, where meter clusters represented in the graph are supposed to be supplied by the same electrical feeder.
When discrepancies are detected, i.e., when different colour codes are found in the same cluster as illustrated in Figure 8b, errors in the existing cartographic data are suspected. Final verifications in the real field allow the correction of the cartographic data.

4. Further Developments: Enhancements of the G3-PLC Technology and Introduction of the G3-PLC Hybrid PLC & RF Profile

Parallel to the development of the added-value services outlined previously, end-users and industry stakeholders also decided to work on evolutions and optimizations of the G3-PLC protocol to gain market shares and increase long-term upgradability. The following sub-sections introduce the routing protocol and broadcast mechanism enhancements to increase performances in dense networks, and finally, the G3-PLC Hybrid PLC & RF profile.

4.1. Increasing Performances in Dense Networks

When a single G3-PLC network counts more than 400 nodes, it can be categorized as a dense network. In dense networks, it is easier to reach the capacity limit when the application traffic increases. This can be problematic for DSOs willing to implement use cases beyond smart meter reading, such as intraday reading or demand response.
When observing G3-PLC traffic in a real 800-node network using a sniffer installed in the low voltage substation close to the data concentrator, it can be established that more than a half of the packets captured over the observation period are broadcast packets generated by the LOADng protocol [
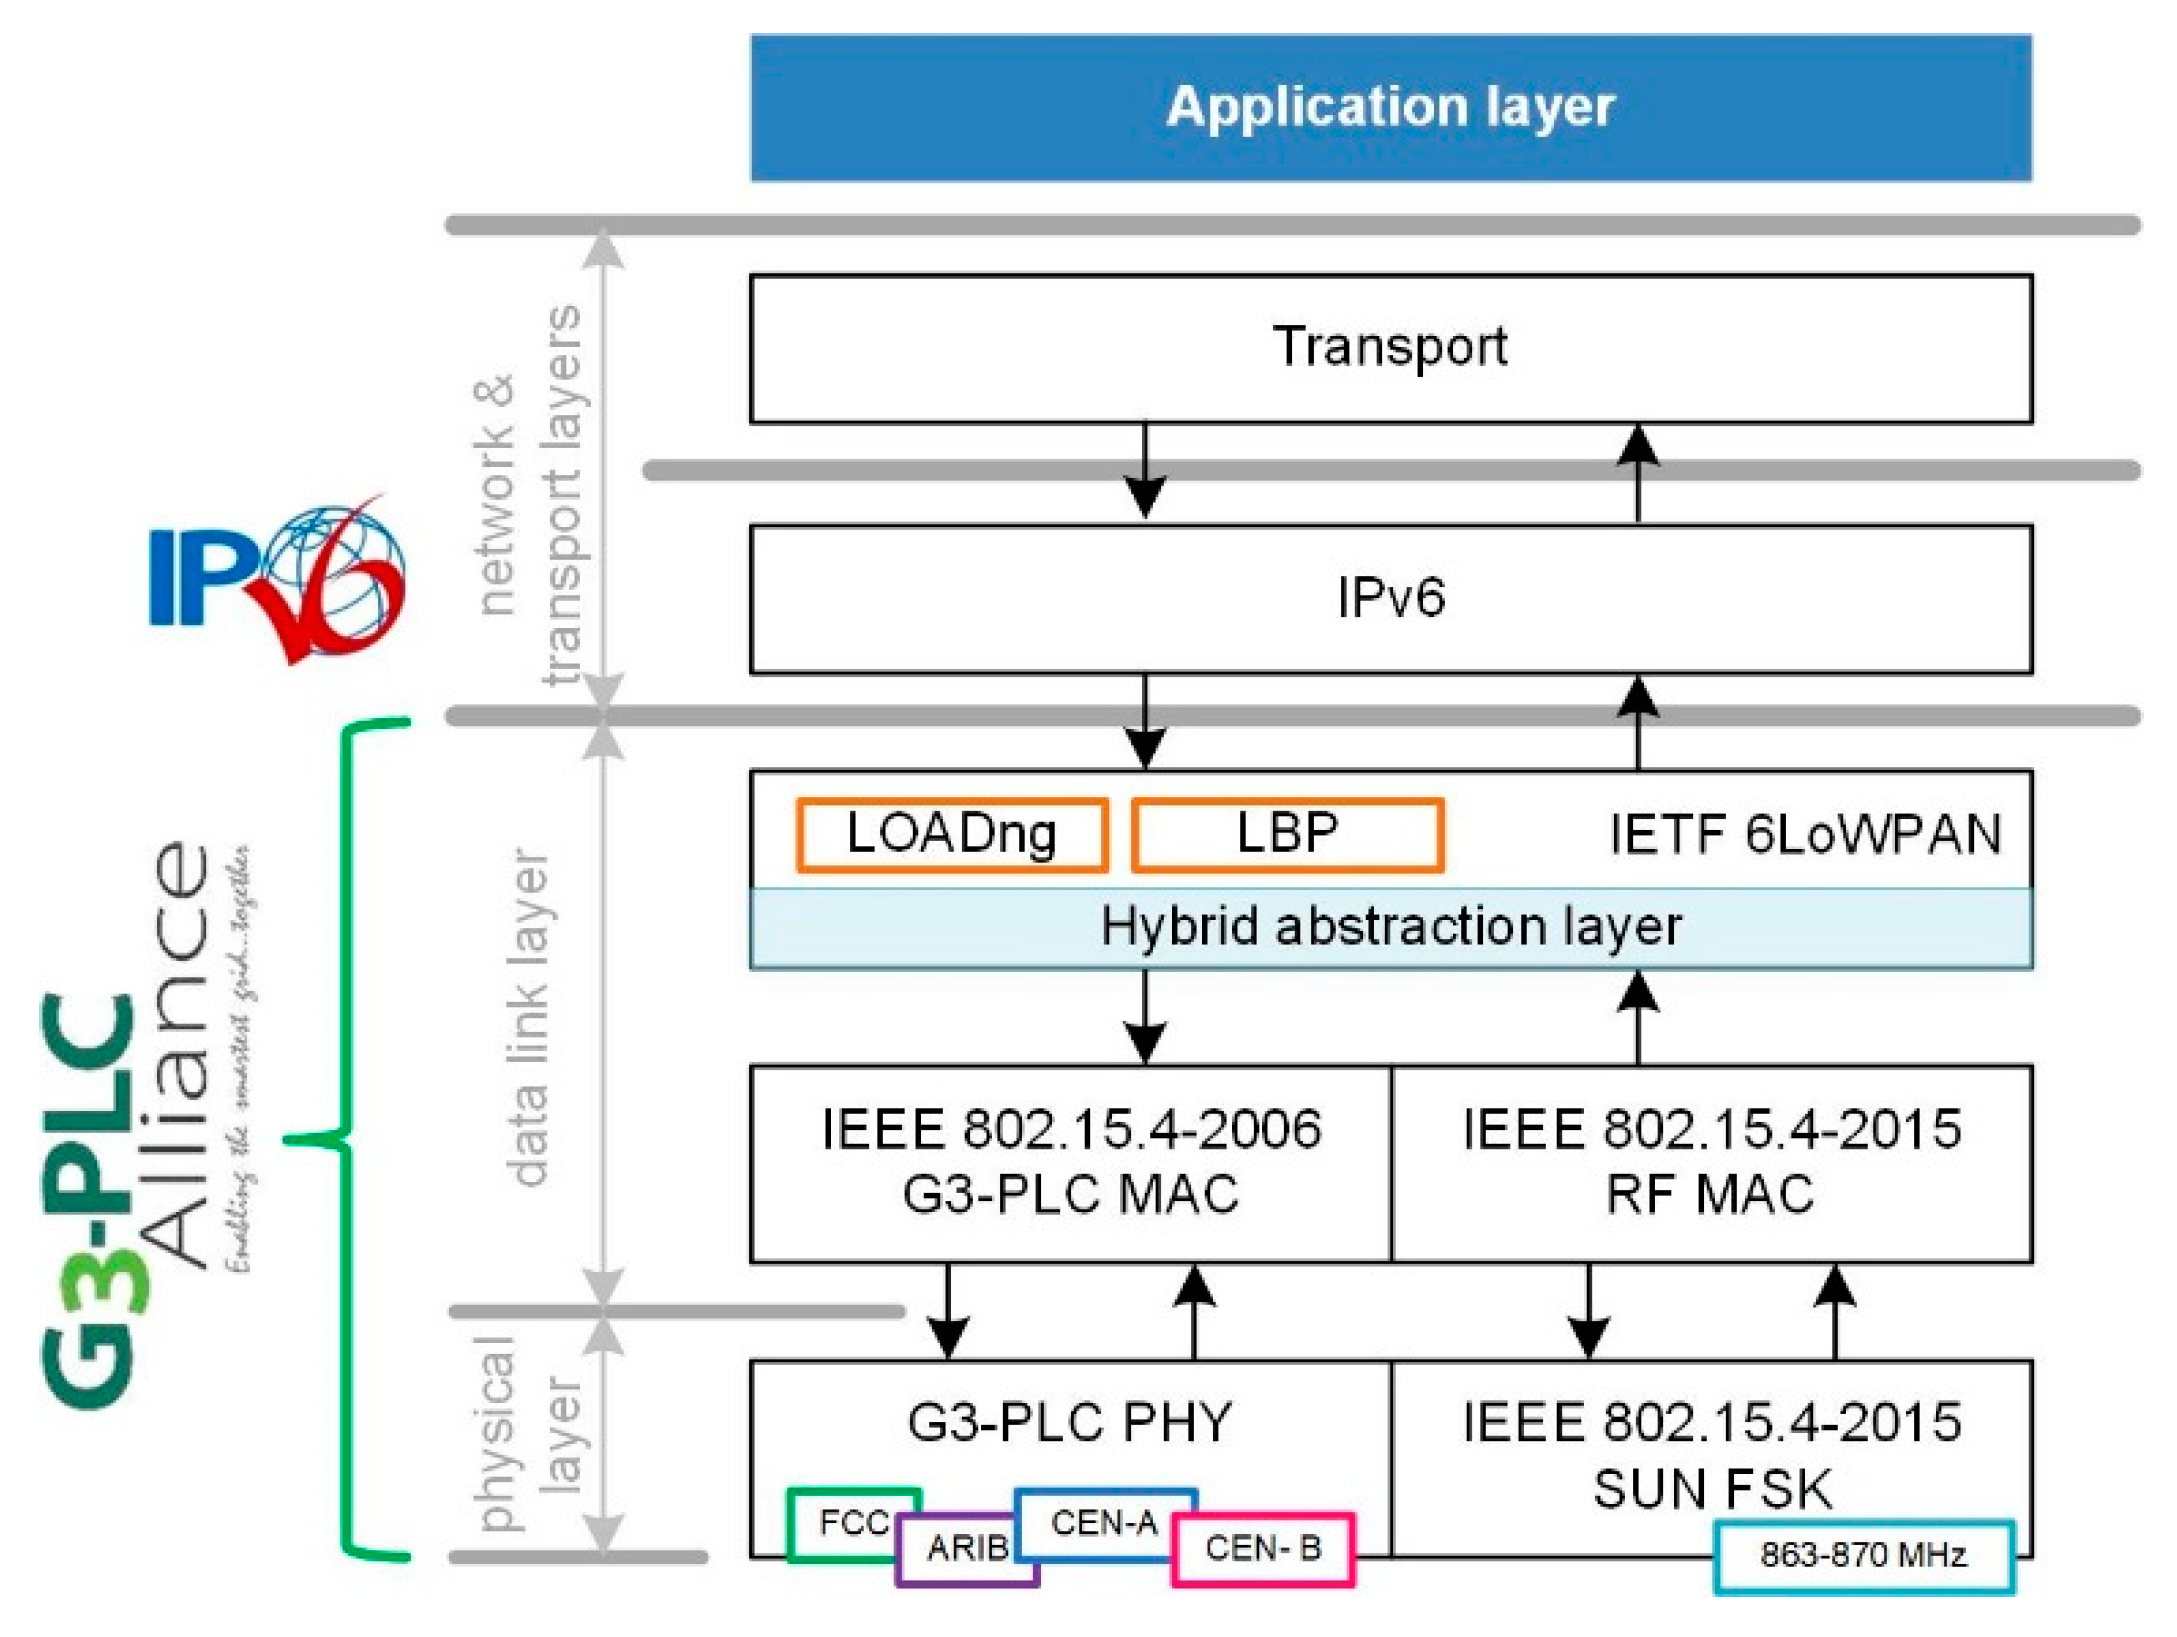
1], which is the default routing mechanism in G3-PLC networks operating within the 6LoWPAN Adaptation layer (upper data link layer). More specifically, these broadcast packets correspond to the LOADng RREQ (Route Request) messages Table 1 refers to. The principles of the LOADng routing protocol are briefly reminded in Section 4.1.1.
In dense networks, this behaviour can be explained by unstable routes due to frequent data packet loss as the G3-PLC network is operated close to its capacity limit. Despite the use of CSMA/CA, many nodes try to access the transmission channel at roughly the same time, which comes in addition to the hidden node problem and increases the risk of frame collisions. In this situation, data packet loss implies transmission retries and finally route breakages. The routes are continuously repaired, according to the LOADng principles, which creates even more congestion due to the broadcasting of RREQ messages, leading to a higher probability of packet loss and reducing the bandwidth available for application layer traffic. This series of events leads to a self-perpetuating cycle.
While optimizing existing G3-PLC parameter settings, controlling the behaviour of the stack would help to solve issues encountered for a specific dense network, the G3-PLC Alliance decided to move one step ahead by introducing substantial enhancements to the LOADng routing protocol. This is introduced in Section 4.1.1.
In parallel, beyond the operation of the routing protocol, the G3-PLC Alliance has also recognized that there is room for improvement with respect to the existing broadcast mechanism of data frames, which is hardly efficient in dense networks. Indeed, for both LOADng and data transmission, broadcast propagation is based on the flooding principle, i.e., all nodes in the network will propagate the information to other nodes by retransmission of the received data frame. Section 4.1.2 shows how the current design of the data broadcast mechanism has been upgraded.

4.1.1. Enhanced Routing with the RREQ Jittering Mechanism

For each destination node towards which a route is sought, LOADng consists of broadcasting RREQ messages through the network towards this destination node (flooding). The selection of the best route is done by the destination node after reception of various copies of the original RREQ message. Each copy of the original RREQ message carries a Route Cost (RC) computed during its propagation along the path towards the destination node. The RC, specific to each copy, is an aggregation of the Link Costs (LC) computed at each intermediate hop. Annex B of ITU-T G.9903 [1] specifies a default calculation method: in its basic variant, the LC varies according to the Link Quality Indicator (LQI), based on the SNR, and the number of intermediate hops (hop count). The route with the lowest RC is selected, and the destination node sends a Route Reply (RREP) message in unicast back to the RREQ originator node, along this route. During the hop-by-hop propagation of the RREP, the route is installed in the intermediate nodes which will act as relays for subsequent data traffic.
When RREQ messages are flooded over the network they count on the sole underlying CSMA/CA access method to spread them over time. For a given route establishment procedure, when receiving multiple copies of the same original RREQ (having been forwarded along different paths and therefore carrying a different RC) over time, an intermediate node forwards a RREQ message only if the RC of the new RREQ is lower compared to the RC of the last forwarded RREQ. Relying only on CSMA/CA when broadcasting RREQ messages is not always efficient, especially in large networks, as some RREQs could be afflicted by collisions or could not be transmitted as the channel is busy. As a consequence, some good routes may be lost unexpectedly.
Therefore, the new revision of the G3-PLC specifications will include a controlled jittering mechanism applied when forwarding RREQ messages. By doing so, intermediate nodes help increasing the chances that the route with the lowest RC is always selected by the RREQ destination node. For a given route establishment procedure, after the reception of the first RREQ message, an intermediate node evaluates the jitter time based on the LQI measured for this message. During this period, the intermediate node puts the RREQ message in a queue. If a new RREQ message with lower RC is received, the original RREQ in the queue is overwritten, lowering the flooding, and increasing the probability of forwarding only RREQs that may be selected by the RREQ destination node. Figure 9 shows an example of the calculated jittering delay as a function of the LQI.
Messages with low LQIs are put in the queue for a longer time as they were received through unreliable links with poor SNR. Similarly, messages with high LQI, probably received from a very close neighbour node, are put in the queue as well: favouring short links results in a route with more hops to the destination, which is not the best solution either. LQIs with intermediate values are linearly interpolated. In Figure 9, RREQs with an LQI value equal to 86 (corresponding to a 12 dB SNR) are chosen as most suitable for immediate forwarding.
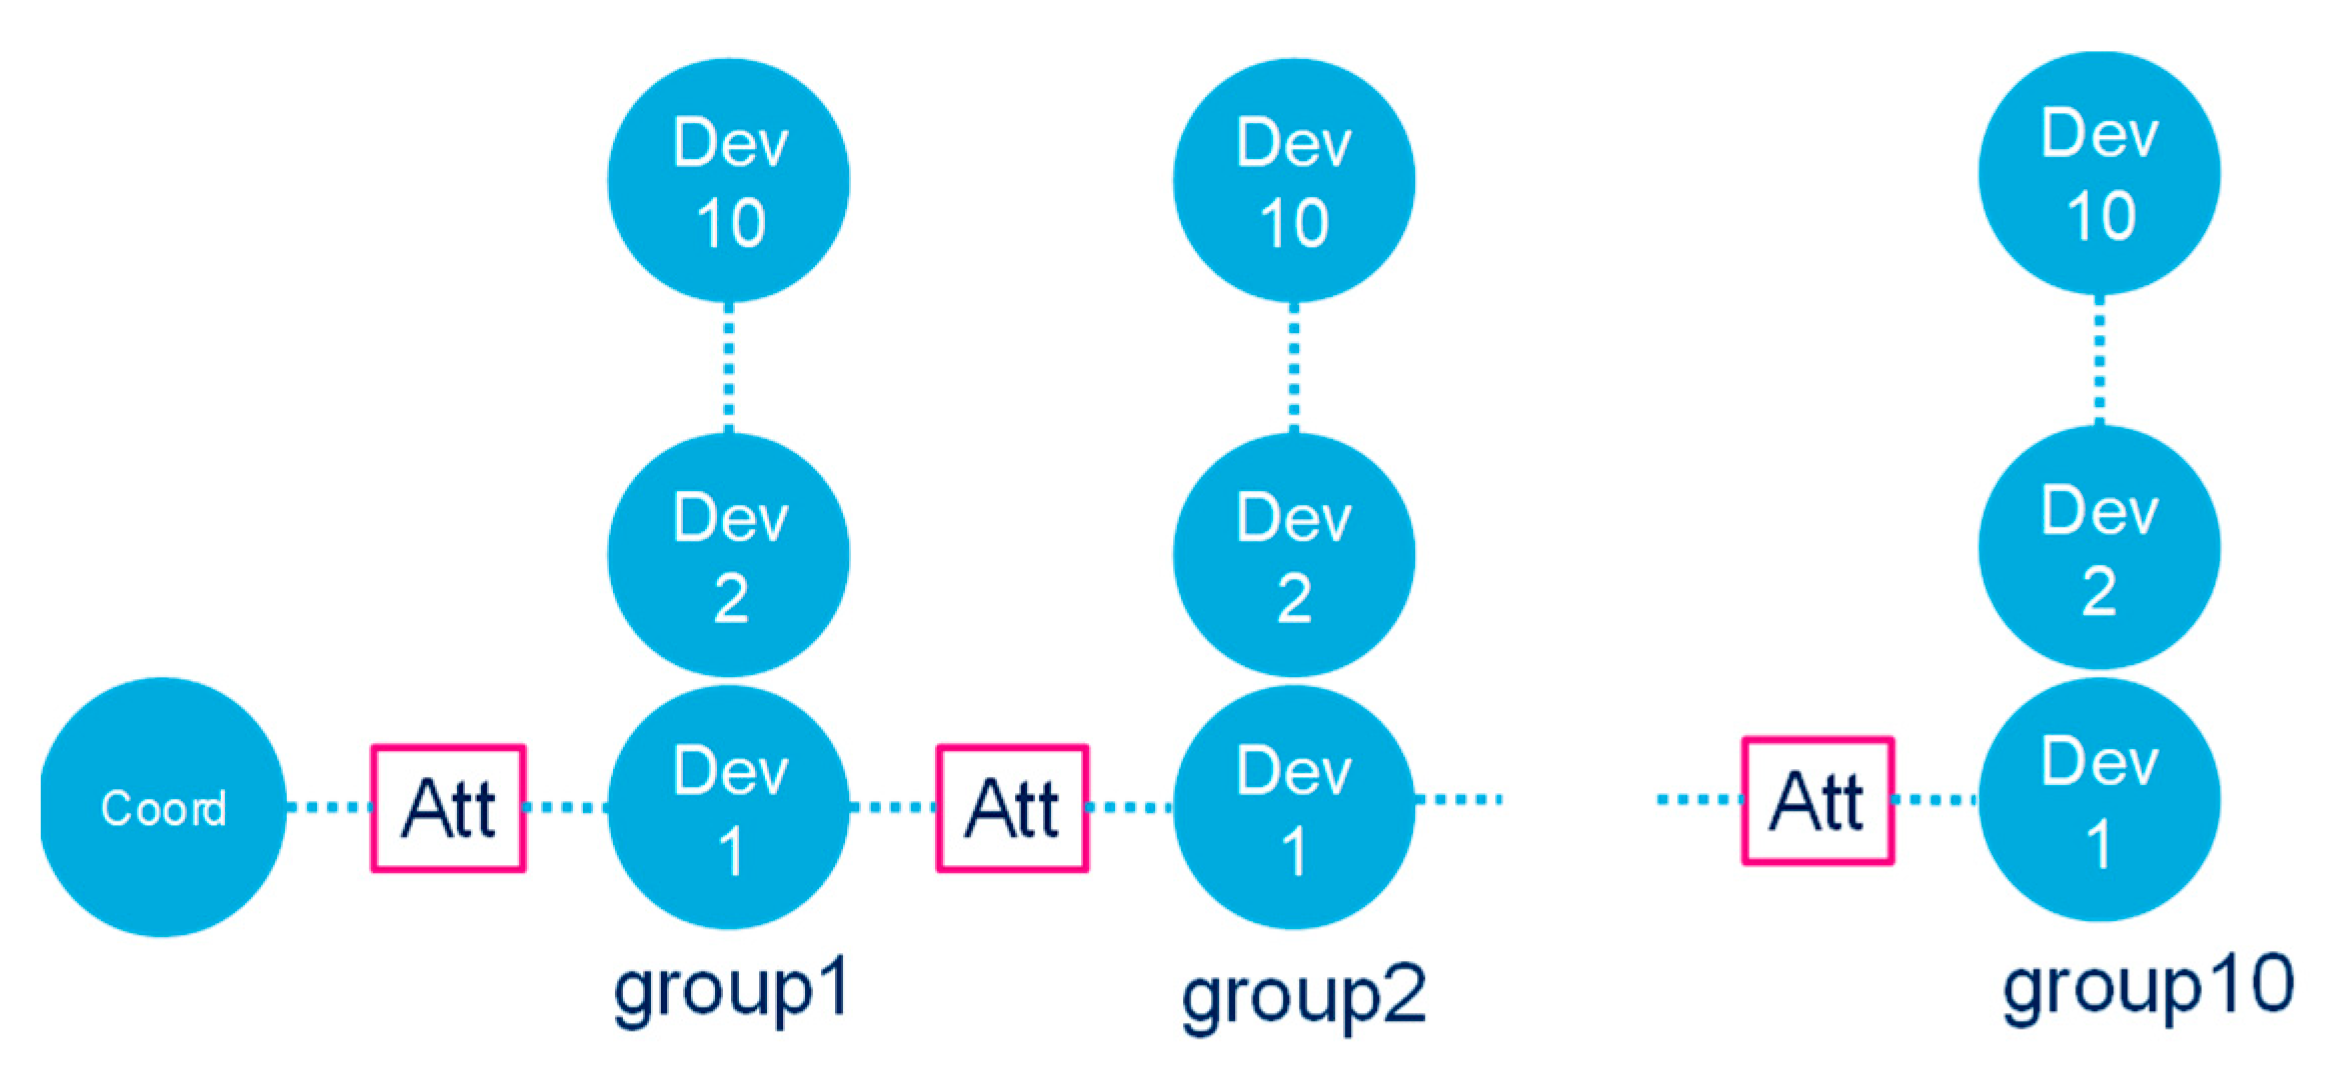
The implementation of this mechanism has been verified performing route discoveries from the coordinator to all the nodes in the scenario shown in Figure 10: 10 groups formed of approximately 10 nodes (total number of 101 nodes) considering three topologies with 0, 10 and 20 dB attenuations between each group of nodes.
As reported in Table 2, three main use cases have been tested: use_case_0 corresponds to the default configuration of the G3-PLC protocol stack (no RREQ jittering), use_case_1 and use_case_2 apply RREQ jittering with different values for “Low LQI” and “High LQI.” These two parameters quantify the penalty introduced by the LQI in LC computation (cf. Annex B of [1]): use_case_1 corresponds to the default setting, while use_case_2 favours a progressive penalty within the actual range of SNR values encountered in the field.
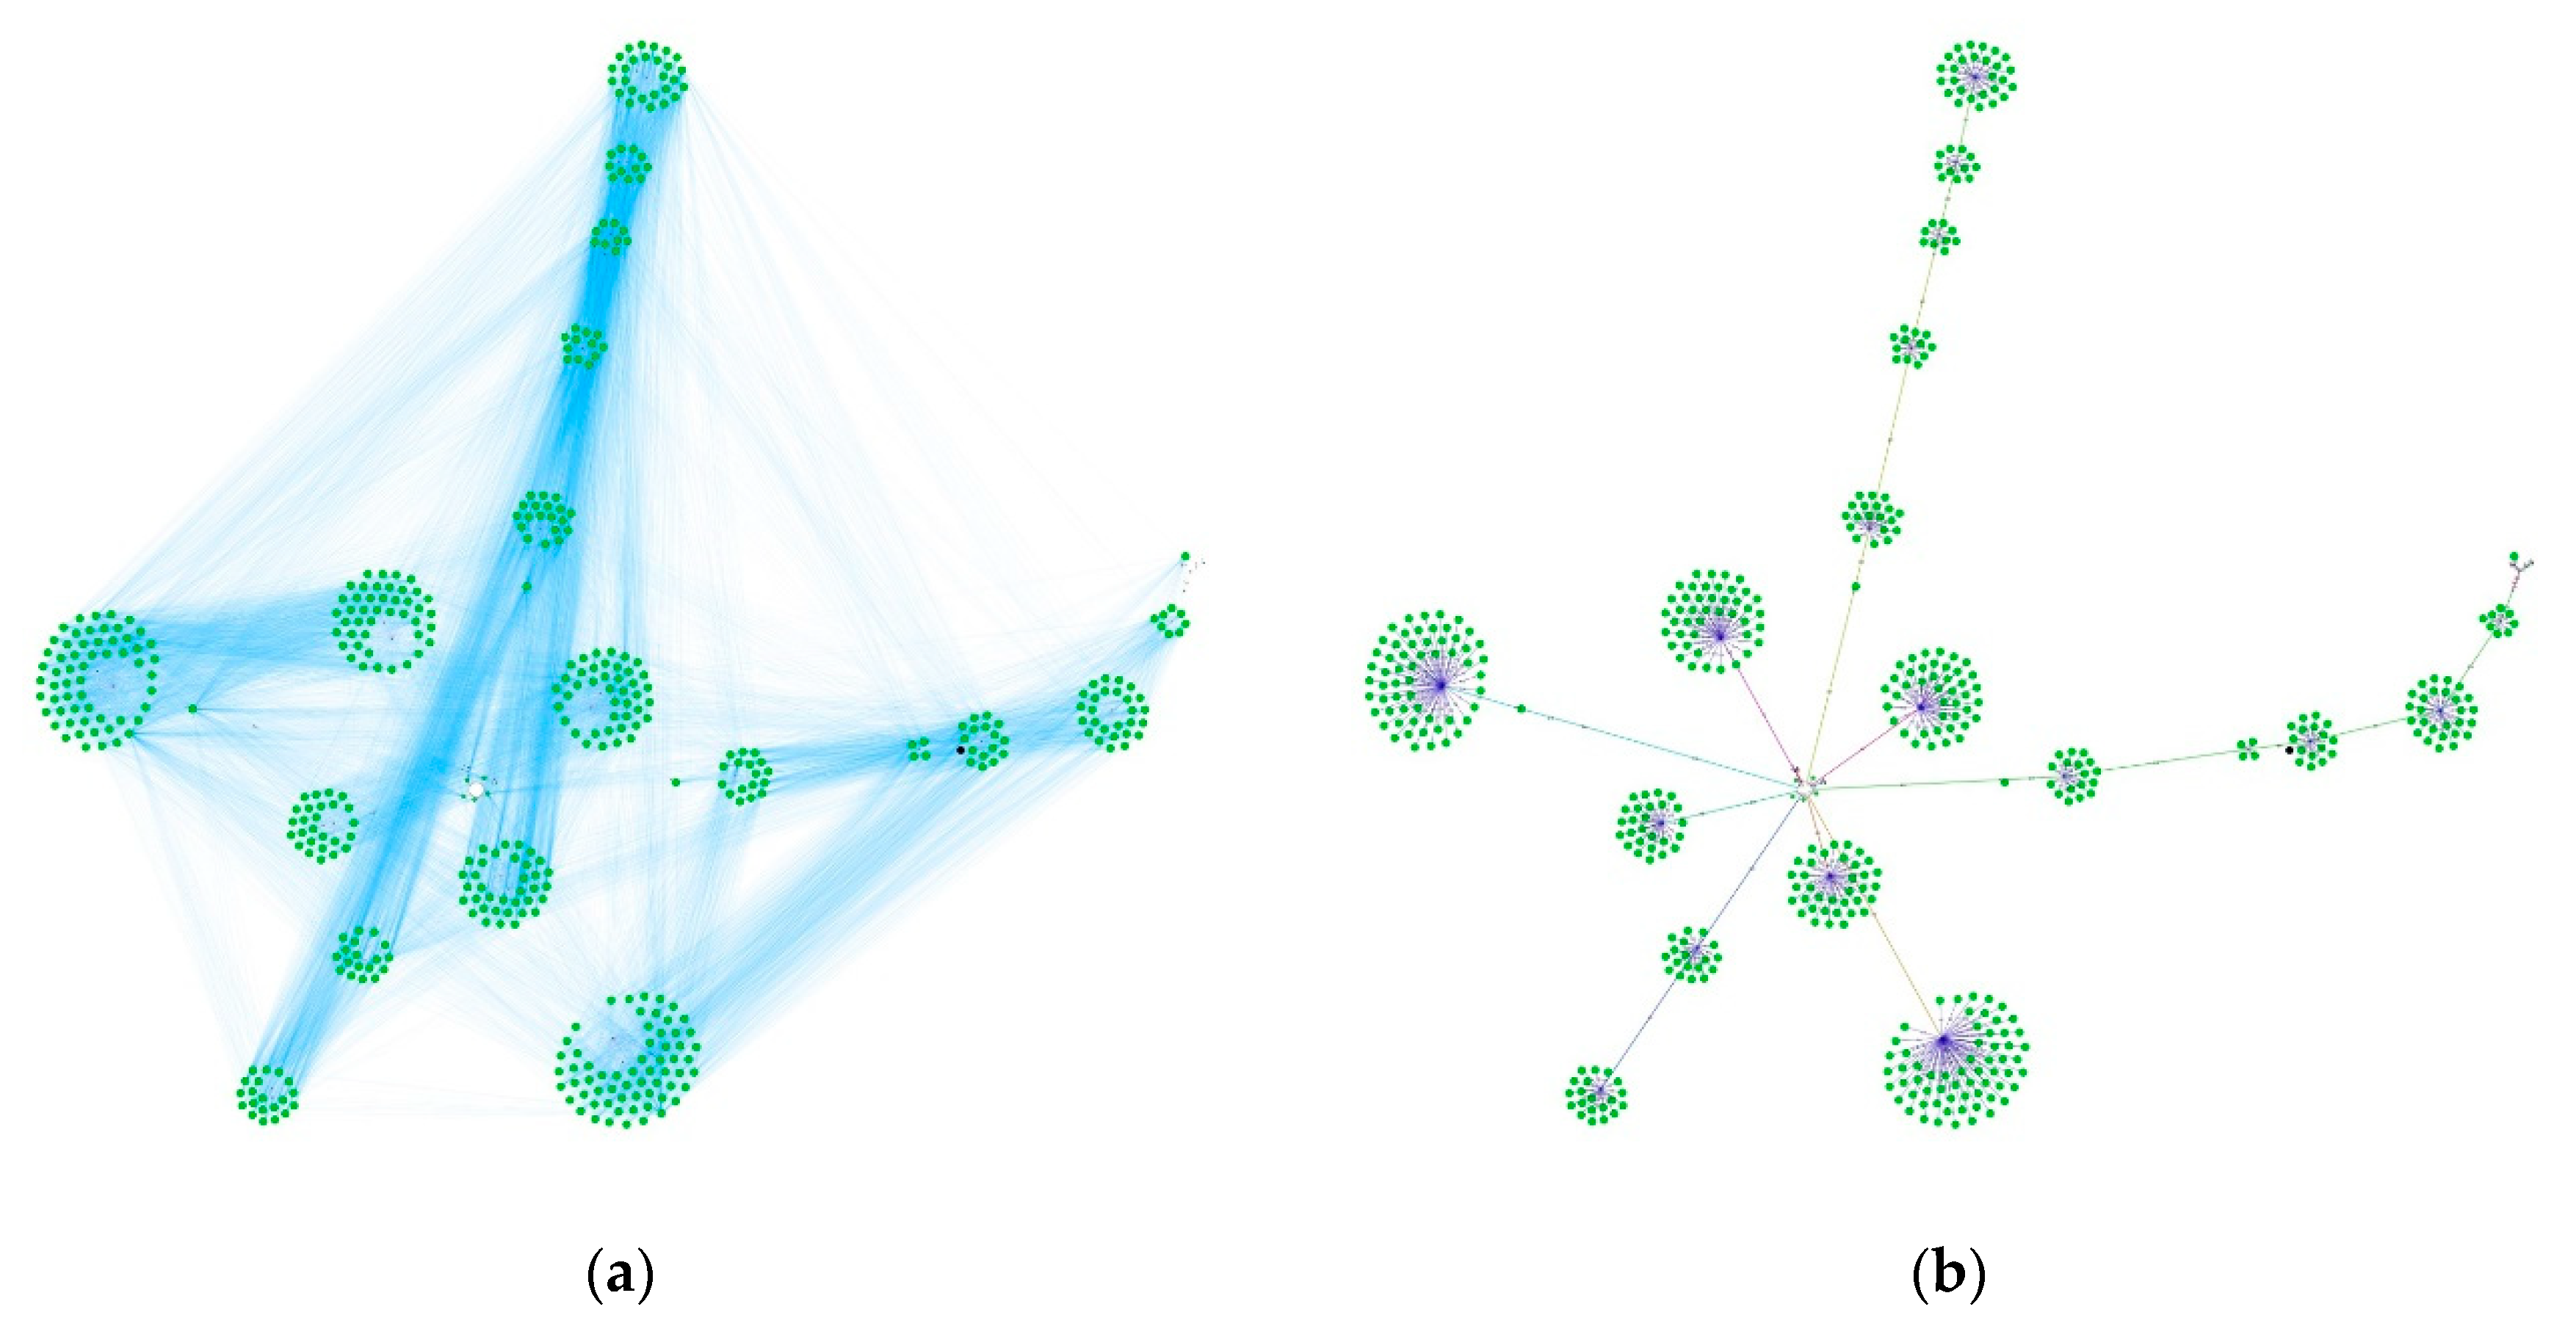
Figure 11a shows the average number of RREQ messages received by one node. When comparing use_case_0 and use_case_1, the number of received RREQs is decreasing when RREQ jittering is applied, showing an overall network flooding reduction for all three topologies. When RREQ jittering is enabled, intermediate nodes delay the forwarding of RREQ messages not carrying an optimal RC. Thanks to the jittering mechanism, the probability that those RREQs will be overwritten by a better one is increased, as represented in Figure 11b.
The absolute number of overwritten RREQ messages strongly depends on both network topology and routing parameters. In the 0 dB topology (blue lines), the network is more congested since all nodes are in the same collision domain, and the probability of collision between RREQs is higher. In the 20 dB topology (green lines), groups of nodes are separated in several collision domains due to the high attenuations. The 10 dB topology (red lines) corresponds to a mixed scenario, where a node of a given group can receive messages from nodes located in the closest groups. For use_case_2, low LQI and high LQI settings enable a more accurate RC computation based on realistic SNR values, which improves the forwarding decision made by each intermediate node.
As shown in this section, RREQ jittering as a function of the LQI can significantly reduce LOADng overhead in dense networks. In addition, care should be taken to correctly choose the parameters affecting the weight of LQI in the LC computation formula as defined in [1].

4.1.2. Enhanced Data Broadcast Mechanism Using the Trickle Algorithm

Broadcast transmissions are used for route establishment but also for data distribution based on the 6LoWPAN broadcast mechanism [13]. The broadcast flooding mechanism as specified in the current version of ITU-T G.9903 [1] makes use of the 6LoWPAN broadcast header (LOWPAN_BC0) as specified in RFC 4944 [13], which uniquely identifies frames belonging to the same flooding event. The broadcast log table holds information about all previously received broadcast frames, and thanks to the broadcast header, it ensures that each node in the network will trigger a retransmission exactly once for a given flooding event.
This mechanism provides a high level of redundancy since all nodes in a network contribute to data propagation during the flooding event. While this high level of redundancy might be beneficial in theory, in reality, it leads to several problems caused by the limited resource of transmission channel availability, especially in dense networks as previously explained in Section 4.1.
To avoid overloading the shared transmission channel, the redundancy provided by the broadcast mechanism should be controlled, i.e., only provide redundancy to the extent needed to propagate the information through the entire network. To achieve that goal, the broadcast flooding mechanism has been extended with concepts described by “The Trickle Algorithm” defined in RFC 6206 [14]. One of the fundamental concepts of “Trickle” is to consider retransmissions of data frames only if the redundancy in the network is not sufficient. The measurements of redundancy in this case are based on a count of received frames of a given flooding event in a given period of time. If sufficient frames from a flooding event have already been received from other nodes in the neighbourhood, a given node will suppress its own retransmission. Based on this concept, the optimized algorithm for broadcast propagation looks as follows:
IF (SrcAddr, SeqNumber) exists in broadcast log table
  • Increment counter c by 1
  • Discard frame
ELSE
  • Create entry with (SrcAddr, SeqNumber) in broadcast log table
  • Set counter c to 0
  • Choose an interval I between [Imin, Imax]
  • Choose a duration t in the interval [I/2, I]
  • Wait for duration t
  • IF (c < Ki)
    Trigger the frame transmission
  • ELSE
    Discard frame
The parameter Imin determines the minimum interval length, Imax, the maximum interval length (Imax resulting from a multiplication of Imin by a predefined factor) and Ki, the redundancy constant. The relation between these parameters and the mechanism itself is shown in Figure 12.
In contrast to the original Trickle algorithm, as defined in RFC 6206 [14], interval doublings are not considered here. For the relation of Imin and Ki, RFC 6206 [14] recommends that “a protocol should set Ki and Imin such that Imin is at least two to three times as long as it takes to transmit Ki packets”. The size of broadcast messages may vary between some 10 s of bytes for control messages and several 100 s of bytes for firmware update messages. Therefore, to avoid preconfiguring Imin to a fixed value based on the longest frames and its negative impact on the latency for smaller control frames, Imin is computed adaptively based on the size of the incoming broadcast frame
Imin = tframe × Ki_max × 3,
where tframe is the duration of the received broadcast frame, Ki_max the pre-configured upper bound of Ki and 3 the recommended factor from RFC 6206 [14].
In addition, according to [14], the redundancy constant Ki should be a pre-configured value between 1 and 5, with the default set to 3. However, to better reflect the differences in network topologies expected for various use cases of the G3-PLC technology, the redundancy constant can alternatively be derived adaptively based on the density of the network, as also suggested in [15]. As a measure for the network density (i.e., the number of nodes in the neighbourhood of a given node), the number of entries in the node’s POS table (Personal Operating Space) is considered
K i = min [ ceil ( N POS S )   ;   K i _ max ] ,
where NPOS corresponds to the number of POS table entries and S is a pre-configured constant for mapping the number of POS table entries to the redundancy constant. The adaptive computation of Ki then assumes that a higher redundancy will be observed in dense network topologies where the node’s POS table will contain a larger number of entries.
The proposed optimized broadcast propagation algorithm has been evaluated in a G3-PLC test environment. The general setup for the tests is given as follows:
  • Test network: 329 nodes, 2 ROBO hops
  • Interval between flooding events: 15 s
  • Frame size: 350 bytes (approximately 460 ms).
Two performance criteria were used for the evaluation, i.e., the error rate, given as the average percentage of broadcast frames, which have not been received by nodes in the network, and the drop rate, given as the average percentage of frames dropped by nodes in the network because the condition c < Ki was not met. Higher drop rates lead to a lower number of messages in the network, reducing the risk of collisions and channel access failures. The test results are summarized in Figure 13 for different combinations of parameters.
The reference test has been performed with the default broadcast propagation mechanism based on uncontrolled flooding; due to collisions and channel access failures, more than 25% of the frames do not reach their destination. For the remaining tests, the improved controlled flooding mechanism was used. Considering that the typical number of POS table entries in the test environment is more than 50, the setting of step size S = 5 practically leads to a static configuration of Ki = Ki_max. The results show that the drop rate depends on the relation between Ki and Imax. Small Ki in combination with large Imax yield high drop rates, whereas large Ki leads to low drop rates. This is expected behaviour since Ki determines the level of redundancy in the flooding event. The error rate is reduced to below 15% for the first set of parameters where Imax = 2. Further reduction to ~1% error rate has been achieved by increasing this value, i.e., Imax = 8. The last set was performed with S = 50, which yields an adaptive setting of Ki for each node in the network depending on the number of entries in the POS table. With the combination of S = 50, Ki_max = 3 and Imax = 4, the resulting error rate becomes ~0% in the test environment.
Since the test results obtained during evaluation showed significant improvement compared to the currently specified data broadcast mechanism, the improved mechanism will be adopted in the next revision of the G3-PLC specifications. Once the mechanism has been integrated into final products, further parameter optimization under real-world conditions can be performed to maximize the mechanism’s performance.

4.2. The G3-PLC Hybrid PLC & RF Profile

Why not combine the advantages from PLC and RF technologies rather than oppose them as competitors? Hybrid PLC and RF communications is a well-identified concept answering this question and led to explorations by the PLC community over the last years. Hybrid PLC and RF technologies have even been put on the market, first in home networking together with other wired technologies [16] and followed by smart grid applications with the advent of several proprietary implementations. In [17], e.g., authors discuss routing as a central component for the real-time selection of PLC or RF media in one of these implementations.
The concept only gained sufficient maturity and interest from a critical mass of industry stakeholders quite recently, creating the need for an open standard guaranteeing interoperable multi-vendor implementations. As already shown, in particular, in past and current smart meter roll outs, representing up to tens of millions of units each, interoperability is no longer an option for the implementation of sustainable large-scale systems.
In early 2020, the G3-PLC Alliance decided to launch the work to specify the G3-PLC Hybrid PLC & RF profile, to increase relevance and versatility of G3-PLC on worldwide markets. The new hybrid protocol stack, illustrated in Figure 14, integrates a secondary medium consisting of PHY and MAC RF lower layers based on IEEE 802.15.4-2015 [18] and IEEE 802.15.4v-2017 [19] Smart Utility Network (SUN) FSK RF technology, in addition to the primary G3-PLC medium. In the first release of the G3-PLC Alliance hybrid companion specifications, the frequency band 863–870 MHz is supported. At the MAC layer, unslotted CSMA/CA for non-beacon-enabled networks is used (similar to the access method used for the PLC medium). RF information, such as duty cycle consumption or link quality, is shared between neighbour nodes using the Information Element (IE) mechanism defined in [18]. All nodes maintain RF information related to neighbours in a dedicated “POS table”.
Switching between primary (PLC) and secondary (RF) media is decided in the adaptation layer using the LOADng routing protocol. The “hybrid abstraction layer” provides appropriate interfaces between the 6LoWPAN adaptation layer and the two lower layer stacks. It also allows transmission over the backup medium if the selected medium (found in the routing table) leads to a transmission failure, increasing global resilience of the hybrid protocol stack. The LOADng routing protocol builds optimal routes according to the routing metric defined in [1] and updated with a dedicated formula, used to compute the link cost over RF links: the link cost is updated with a RF Link Quality Indicator (LQIRF) penalty and a duty cycle penalty, resulting in the spreading of routes amongst several neighbours to avoid too high duty cycle consumption at a same next hop node, entailing possible transmission failures at this neighbour node.
Through these development, significant advantages are brought by the synergy of traditionally competing technologies in the market. As shown in Figure 15, a hybrid network topology will help gaining in coverage with respect to PLC-only or RF-only networks.
The meshed hybrid network can overcome poor channel conditions for the PLC medium (local noise or too low impedance) or for the RF medium (spectrum congestion or equipment located out of range, e.g., in a basement). In addition, the G3-PLC Hybrid PLC & RF profile is fully backward compatible with G3-PLC, i.e., hybrid and non-hybrid G3-PLC nodes can be mixed in the same network. Upgrading or extending existing deployments is therefore possible, favouring the development of new applications beyond smart metering, possibly over the same shared “smart energy” communication infrastructure. Finally, the application layer is agnostic with respect to the medium actually used, as the hybrid protocol stack automatically manages the switching between PLC and RF.
While the certification program has been launched in early 2021, the G3-PLC Alliance already projects extensions of the G3-PLC Hybrid PLC & RF profile to new frequency bands, and the integration of frequency hopping to tackle worldwide regulations.

5. Conclusions

After giving a short overview of the history of G3-PLC in standardization and its first application in the Linky smart metering program, this paper outlined the still-existing challenges in the frequency band of 9–150 kHz, used for the operation of NB-PLC technologies in general. On this aspect, PLC industry experts are strongly committed to ensure a positive outcome of current standardization processes which will be instrumental in helping long-term reliability of existing NB-PLC infrastructures, and in contributing to the further development of NB-PLC above 150 kHz.
Beyond these challenges, it should not be forgotten that many opportunities emerge and that more are still to be discovered in existing deployments. This is highlighted in three examples, where Linky smart meters embedding G3-PLC contribute to the operation of the grid with innovative added-value services: power outage detection, phase detection and grid map consolidation. Moreover, to better prepare for the future, the G3-PLC Alliance strives for extending current capabilities of the G3-PLC technology. This is illustrated through recent advances with the specification of LOADng default routing protocol optimizations in order to limit its impact on the network load, an enhanced data broadcast service and a major evolution with the development of the G3-PLC Hybrid PLC & RF profile, which combines the advantages of G3-PLC and SUN FSK RF technologies. These evolutions will help G3-PLC in gaining additional performance and versatility, for future relevance of the G3-PLC technology.
The next generation of mobile networks, the 3GPP-specified 5G technology, is likely to make several older technologies obsolete. Beyond the performance gain for general consumer use, its versatile design will also allow many industry use cases to be addressed. However, experience has also shown that one size does not fit all. The future will most likely consist of a profusion of various legacy and new telecommunication technologies dominated by 5G, itself consisting of an aggregation of various technologies complementing the 5G NR (New Radio) RAN (Radio Access Network): LTE-M, NB-IoT, etc. The industry may also pursue a balance between public and privately owned telecommunication networks for the sake of resilience and independence from third parties where and when needed. Furthermore, spectrum is a rare resource, and benefiting from the bandwidth offered by any wired communication medium, including powerlines in addition to wireless services, offers a valuable opportunity. It would be advisable to preserve the wired option whenever it makes sense.
From these perspectives, PLC technologies will play a role as a complement to the fast-paced evolution of the telecommunication technology landscape undoubtedly drawn by the 5G revolution. More specifically, NB-PLC and G3-PLC can successfully provide the required services as long as application traffic patterns, data rate and latency requirements are met. Low data rate and low-cost IoT devices are more likely to be covered by low-cost solutions such as G3-PLC while they are also interconnected to the central system or external systems through border routers or gateways.

Funding

This research received no external funding.

Institutional Review Board Statement

Not applicable.

Informed Consent Statement

Not applicable.

Data Availability Statement

Not applicable.

Acknowledgments

Authors acknowledge all G3-PLC Alliance members having contributed to the specification, design and testing of the mechanisms and protocols outlined in this paper.

Conflicts of Interest

The authors declare no conflict of interest.

References

  1. Recommendation ITU-T G.9903 (08/2017): Narrowband Orthogonal Frequency Division Multiplexing Power Line Communication Transceivers for G3-PLC Networks. Available online: http://www.itu.int/rec/T-REC-G.9903/en (accessed on 20 February 2021).
  2. Recommendation ITU-T G.9901 (06/2017): Narrowband Orthogonal Frequency Division Multiplexing Power Line Communication Transceivers—Power Spectral Density Specification. Available online: http://www.itu.int/rec/T-REC-G.9901/en (accessed on 20 February 2021).
  3. The National Standards Authority of Ireland. CLC/TR 50627:2015: Study Report on Electromagnetic Interference between Electrical Equipment/Systems in the Frequency Range Below 150 kHz; NSAI: Dublin, Ireland, 2015. [Google Scholar]
  4. The National Standards Authority of Ireland. CLC/TR 50669:2017: Investigation Results on Electromagnetic Interference in the Frequency Range below 150 kHz; NSAI: Dublin, Ireland, 2015. [Google Scholar]
  5. IEC. IEC 61000-2-2: Electromagnetic Compatibility (EMC)—Part 2-2: Environment—Compatibility Levels for Lowfrequency Conducted Disturbances and Signalling in Public Low-Voltage Power Supply Systems; IEC: Geneva, Switzerland, 2018. [Google Scholar]
  6. IEC. IEC GUIDE 107: Electromagnetic Compatibility—Guide to the Drafting of Electromagnetic Compatibility Publications; IEC: Geneva, Switzerland, 2014. [Google Scholar]
  7. IEC. IEC 61000-6-3: Electromagnetic Compatibility (EMC)—Part 6-3: Generic Standards—Emission Standard for Equipment in Residential Environments; IEC: Geneva, Switzerland, 2020. [Google Scholar]
  8. IEC. IEC 61000-6-8: Electromagnetic Compatibility (EMC)—Part 6-8: Generic Standards—Emission Standard for Professional Equipment in Commercial and Light-Industrial Locations; IEC: Geneva, Switzerland, 2020. [Google Scholar]
  9. IEC. CISPR 15: Limits and Methods of Measurement of Radio Disturbance Characteristics of Electrical Lighting and Similar Equipment; IEC: Geneva, Switzerland, 2018. [Google Scholar]
  10. IEC. CISPR 32: Electromagnetic Compatibility of Multimedia Equipment—Emission Requirements; IEC: Geneva, Switzerland, 2019. [Google Scholar]
  11. Directive 2014/30/EU of the European Parliament and of the Council of 26 February 2014 on the Harmonisation of the Laws of the Member States Relating to Electromagnetic Compatibility. Available online: https://eur-lex.europa.eu/legal-content/EN/TXT/?uri=CELEX:32014L0030 (accessed on 20 February 2021).
  12. European Commission. EN 50065-1: Signalling on Low-Voltage Electrical Installations in the Frequency Range 3 kHz to 148,5 kHz—Part 1: General Requirements, Frequency Bands and Electromagnetic Disturbances; European Commission: Brussels, Belgium, 2011. [Google Scholar]
  13. IETF RFC 4944: Transmission of IPv6 Packets over IEEE 802.15.4 Networks. Available online: https://tools.ietf.org/html/rfc4944 (accessed on 20 February 2021).
  14. IETF RFC 6206: The Trickle Algorithm. Available online: https://tools.ietf.org/html/rfc6206 (accessed on 20 February 2021).
  15. Coladon, T.; Vucinic, M.; Tourancheau, B. Multiple Redundancy Constants with Trickle. In Proceedings of the IEEE International Symposium on Personal, Indoor and Mobile Radio Communications (PIMRC), Hong Kong, China, 30 August–2 September 2015. [Google Scholar]
  16. Mengi, A.; Kortebi, A.; Lucht, H.; Brzozowski, M.; Koch, M.; Bouchet, O.; Maye, O. IEEE 1905.1 hybrid home networking standard and its implementation with PLC, Wi-Fi and Ethernet technologies. In Proceedings of the International Symposium on Power Line Communications and its Applications (ISPLC), Bottrop, Germany, 20–23 March 2016. [Google Scholar]
  17. Lermercier, F.; Montavont, N.; Toutain, L.; Vijayasankar, K.; Vedantham, R.; Chiummiento, P. Support for Hybrid Network in RPL. In Proceedings of the IEEE International Conference on Smart Grid Communications (SmartGridComm), Sydney, Australia, 6–9 November 2016. [Google Scholar]
  18. IEEE. IEEE 802.15.4-2015: IEEE Standard for Low-Rate Wireless Networks; IEEE SA: Piscataway, NJ, USA, 2015. [Google Scholar]
  19. IEEE. IEEE 802.15.4v-2017: IEEE Standard for Low-Rate Wireless Networks—Amendment 5: Enabling/Updating the Use of Regional Sub-GHz Bands; IEEE SA: Piscataway, NJ, USA, 2017. [Google Scholar]
Figure 1. Generic architecture of an Advanced Metering Infrastructures (AMI) with last-mile Power line communications (PLC) connectivity (source: ITU-T G.9903 [1]).
Energies 14 01937 g001
Figure 2. History of the G3-PLC technology.
Energies 14 01937 g002
Figure 3. Compatibility level (green curve, dotted) and emission limit proposed in CIS-H/JWG6 (red curve, plain).
Energies 14 01937 g003
Figure 4. Neighbour tables without repeated deviation (top), neighbour tables with repeated deviations (bottom).
Energies 14 01937 g004
Figure 5. G3-PLC phase detection principle.
Energies 14 01937 g005
Figure 6. Links (a) and routes (b) over a same G3-PLC network topology.
Energies 14 01937 g006
Figure 7. Aggregated view of the network showing the links actually used on a path towards each node over time.
Energies 14 01937 g007
Figure 8. Telecom communities mapped over the G3-PLC network topology (a) and over existing cartographic data related to the network’s electrical topology (b).
Energies 14 01937 g008
Figure 9. Representation of the jittering delay as a function of the LQI.
Energies 14 01937 g009
Figure 10. Network topology for testing the RREQ jittering mechanism.
Energies 14 01937 g010
Figure 11. Route Request (RREQ) messages received by one node (a) and RREQ messages overwritten by one node (b).
Energies 14 01937 g011
Figure 12. Trickle-based broadcast mechanism and parameters.
Energies 14 01937 g012
Figure 13. Trickle-based broadcast mechanism test results.
Energies 14 01937 g013
Figure 14. The G3-PLC Hybrid PLC & RF protocol stack.
Energies 14 01937 g014
Figure 15. Typical hybrid network topology.
Energies 14 01937 g015
Table 1. Percentage of packets received for each traffic type.
Type of TrafficPercentage of Packets Received
(MAC) Beacon<1%
(MAC) Tone Map Response8%
(6LoWPAN) LOADng RREQ53%
(6LoWPAN) LOADng RREP and RERR32%
(6LoWPAN) LOADng PREQ and PREP1%
(6LoWPAN) Boostrapping2%
(Application layer) DLMS/COSEM3%
Table 2. Use cases for testing the Route Request (RREQ) jittering mechanism.
RREQ JitteringLow LQIHigh LQI
Use_case_0No0255
Use_case_1Yes0255
Use_case_2Yes40108
Publisher’s Note: MDPI stays neutral with regard to jurisdictional claims in published maps and institutional affiliations.

