Article

Effect of Soiling on Solar Photovoltaic Performance under Desert Climatic Conditions

1
Petroleum Development Oman, P.O. Box 81, Muscat 100, Oman
2
University of Nizwa, P.O. Box 33, Nizwa 616, Oman
3
School of Energy and Electronic Engineering, University of Portsmouth, Portsmouth PO1 3DJ, UK
*
Author to whom correspondence should be addressed.
Energies 2021, 14(3), 659; https://doi.org/10.3390/en14030659
Submission received: 22 December 2020 / Revised: 13 January 2021 / Accepted: 25 January 2021 / Published: 28 January 2021
(This article belongs to the Special Issue Solar Photovoltaics and Solar Thermal Energy Systems)

Abstract

:
The solar irradiation at the gulf Arabia is considered one of the highest in the world. However, this region is classified as a desert with high dust accumulation. Thus, the objective of this study is to analyze the effect of soiling and the photovoltaic (PV) tilt angle on the performance of 2.0 MWp of car park PV plant in Oman. Experimental measurements were taken and a model was developed for simulation. The power generation by the cleaned PV system was measured as 1460 kW around noon. After one week of operation, the power production (at the same irradiance level) reduced to 1390 kW due to soiling. It further reduced to 1196 kW and 904 kW after three and five weeks of operation, respectively. The results also show that a soiling-percentage of 7.5% reduced the monthly electricity generation (307 MWh) by 5.6% and a soiling-percentage of 12.5% reduced the generation by 10.8%. Furthermore, the increase in tilt is not recommended due to the duo-pitch canopy effect of the car park where the panels with 180° azimuth generate lower electricity than the panels with 0° azimuth. In addition, the part of the car park with 180° azimuth caused shading to the other part for high tilt angles.

1. Introduction

The use of renewable resources, such as solar, wind, hydropower, geothermal, and biomass have increased significantly due to their competitive costs [1]. Nowadays, photovoltaic (PV) is considered as the main technology to generate electricity from the incident solar irradiation. Because of the attractive prices of the PV, the total contribution of the electricity generated by PV from the overall renewable energy is expected to reach 25% and 31% by 2020 and 2030, respectively [2].
The gulf Arabia area climatic conditions are classified as one of the highest solar irradiations throughout the year, where the direct normal irradiation (DNI) levels for the regional countries, such as Qatar, Oman, and Saudi Arabia are in the order of 1900, 2500, and 2800 kWh/m2/year, respectively [3]. The reports show an increase of renewable energy resource utilization in countries in the Gulf Cooperation Council (GCC), Oman, Kuwait, Qatar, Bahrain, UAE and Saudi Arabia, in terms of investments and research. It was estimated that, by 2015, the renewable energy contribution in the GCC countries would be 13,000 MW and reach up to 10 GW by 2022 [4]. However, the harsh environmental conditions in this region, such as high dust accumulation, ambient temperature, and humidity, dramatically decreases the performance of the solar system [5].
PV systems are strongly affected by environmental conditions, such as temperature, wind, and the amount of dust accumulated in the air. Charabi and Gastli [6] investigated the effects of weather conditions on the PV power plant using a geographic information system (GIS). The study showed that the PV system decreased significantly by 81% under the temperature and dust constraints. Kazem and Chaichan [7] conducted an experimental investigation on the effects of environmental variables, such as temperature, solar intensity, relative humidity, wind speed, and dust accumulation on the performance of the photovoltaic.
Ambient temperature is considered one of the meteorological variables that affects the performance of the PV. It was estimated that the crystalline solar cells efficiencies decrease by the ratio of 0.248%/°C [8]. Radziemska [9] conducted an experimental investigation of a single-crystalline silicon solar cell under a constant solar irradiance where the solar cell temperature was controlled using a temperature stabilizer up to 80 °C. A reduction was noticed in the output power of the solar cell by more than 0.65%/K. Researchers studied many techniques to reduce the PV temperature and, hence, increase the electrical efficiency, such as heat spreading plates [10], air cooled fins [11], phase change materials [12], heat pipe [13] jet impingement [14], liquid immersion [15], and a water cooled microchannel technique [16].
Wind speed and its direction are considered other meteorological variables that affect the efficiency of the PV solar system [17]. This is due to the direct relation between the wind and the natural convection phenomena on reducing the temperature of the PV module. The natural convection was estimated for a 0.5 m2 plate and 1 m/s of 9.5 W/m2 K, and the coefficient is reduced when adding the radiation to be 5.8 W/m2 K [18]. Humidity is another climatic condition that affects the performance of PV systems. Kazem and Chaichan [19] studied the effect of the humidity and concluded that the relative humidity has the highest impact compared to the other ambient parameters, such as temperature and dust, where the inverse relation between the humidity and the electrical parameters were found. In addition, the increase of the humidity during the day will result in high moisture in the PV surface, where it will introduce mud accumulation. The resulting mud structure is strong, very difficult for high wind speed to remove, and results in partial shading to the PV [20]. In fact, wind speed and direction features impact the amount of soiling [21].
The accumulation of dust on top of the PV surface has a major effect on the solar PV system efficiency, and is considered one of the most important research areas that the researchers are focusing on at present. The dust accumulation has two effects on the PV system: (1) it reduces the amount of solar irradiation received by the solar cell—and the partial dust accumulation on the PV modules will cause non-uniformity of solar irradiation, and (2) it acts as partial shading to the module. This means lower energy output generated by the PV system. Ahmed et al. [22] conducted a literature review on the effect of dust on the PV performance due to the dust presence throughout the year in the middle east region. The study highlighted the importance of dust properties, such as the size and geometry on the system performance and the need of an optimization study for each geographical location. Darwish et al. [23] reviewed the effects of dust type on the PV performance. The study specified 17 different types of dust; the most commonly dust types that have more effects on the PV performance are sand, ash, red soil, limestone, calcium carbonate, and silica. The authors found that most of the conducted studies on dust accumulation used artificial dusts, and very few conducted studies using natural dust effect. Kaldellis and Kapsali [24] analyzed the effect of three air pollutants of red soil, limestone, and carbonaceous fly-ash particles on the electrical performance of PV by simulating experimentally the dust accumulation. The study showed that red soil has the greatest impact on reducing the electrical power of pollutant mass up to 0.3 g/m3.
Vaishak and Purnanand reported the effects of dust accumulation on a photovoltaic/thermal system using an experimental approach in outdoor conditions in India [25]. Different measurements were used to quantify the impact of dust by measuring the glass transmittance, electrical performance measurements, and the coefficient of performance (COP) measurements. Due to the dust deposition, the study showed a high reduction for a period of eight weeks in the glass transmission, PV electrical efficiency, and the COP, by 44.16%, 8.53%, and 45%, respectively. In another study, Tanesab et al. [26] investigated the effects of dust on the degradation of photovoltaic for two different locations in Australia. The research studied the dust particles size, its minerals, and the electrical parameters for the PV. The results show that dust porosity has a significant impact on the amount of light passed to the PV.
Menoufi [27] reviewed the dust accumulation on the PV and introduced the photovoltaic soiling index (PVSI) as an indicator for the performance of PV panels. The author claimed that the PVSI would be a common standard for future studies. The proposed PVSI could be an essential parameter in the datasheets of PV modules similar to the temperature coefficient parameters that give the change in the PV performance due to change in cell temperature. The proposed PVSI is calculated for each location by considering the average dust density and dust deposition rate in the four seasons of the year.
Said and Walwil [28] conducted research on the effect of soil fouling on the PV performance. The study was conducted in a harsh environment of Dhahran, Saudi Arabia, by focusing on the optical performance of the glass transmittance, type of glass (anti-reflective coated), and the characterization of properties of dust particles. In a 45-day testing period, a huge reduction in the overall glass transmittance, by around 20%, and the dust deposition, by 5 g/m2, was found. In another location (Tehran, Iran), Gholami et al. [29] conducted an experimental investigation on the dust deposition effects on the photovoltaic performance by comparing the electrical outputs of cleaned and dusted PV modules under similar operating conditions. In addition, glass samples were placed on each of the modules for the chemical and optical characterizations. By the end of the 70 days, the results showed the dust surface density increased by 6.10 g/m2; this led to a 21.47% reduction in the electrical power output. Using another approach for the dust accumulation investigation, Sulaiman et al. [30] proposed artificial dust in their study (mud and talcum) under a constant irradiance inside the lab. This setup enables the dust thickness uniformly across the PV panel surface. The results clearly show a decrease of the PV efficiency in the presence of mud and talcum by 3.95% and 4.03%, respectively. In Qatar, the dust accumulation was estimated to be 100 mg/m2/day for a two-month exposure time [31]. Other studies were conducted for other specific locations, such as Oman [32], Morocco [33], India [34], and Malaysia [35].
PV cleaning methods are classified as manual and robotic, where the manual cleaning method uses human workforces to clean the PV using dry or wet cleaning methods. Manual cleaning is considered more suitable in small capacity PV. The medium and large PV capacity requires robotic cleaning methods to allow quick and efficient cleaning for the PV. Robotics cleaning methods include the curtain brush, automatic robots, and drones [36].
Installation of PV in car parks has increased significantly due to large land reserved for car parking in capital cities around the world (estimated by 16% in some cities) and the high cost of the land in capitals. Therefore, PV installation is considered as a new driver in the feasibility of car park projects in the future [37]. Figure 1 shows the two types of car parking structures in which PV can be installed: duo-pitch canopy and the mono-pitch canopy. The duo-pitch canopy arrangement uses two inclined sheds opposite to each other. It allows less torque and, hence, less support structure. The mono-pitch canopy arrangement uses one inclined shed; this will introduce a higher torque compared to the duo-canopy car park arrangement and larger structure support. The mono-pitch canopy is considered less complicated, concerning the shading issues, compared to the duo-pitch canopy, as it only has one inclination shed.
The installation of PV in the car park is considered a unique application of PV, and many factors must be considered to ensure its maximum operation, such as the tilt angles and difference in azimuth in a single string. Very few studies have been conducted to discuss the PV installation on the car park, its operation, and performance. This work is considered the first in the region to investigate the performance of the PV plant located at the top of the car park. The objective of this study is to investigate experimentally the performance of a 2.0 MWp PV system installed on the top of the car park in Muscat, the capital of Oman. Hence, the study analyzed the PV plant performance under different annual climatic conditions, in harsh environmental conditions. In addition, the simulation approach was used to conduct a parametric study for five tilt angles and three soiling percentages. The simulation model was validated using the experimental data.

2. Experiment Description and Mathematical Formulation

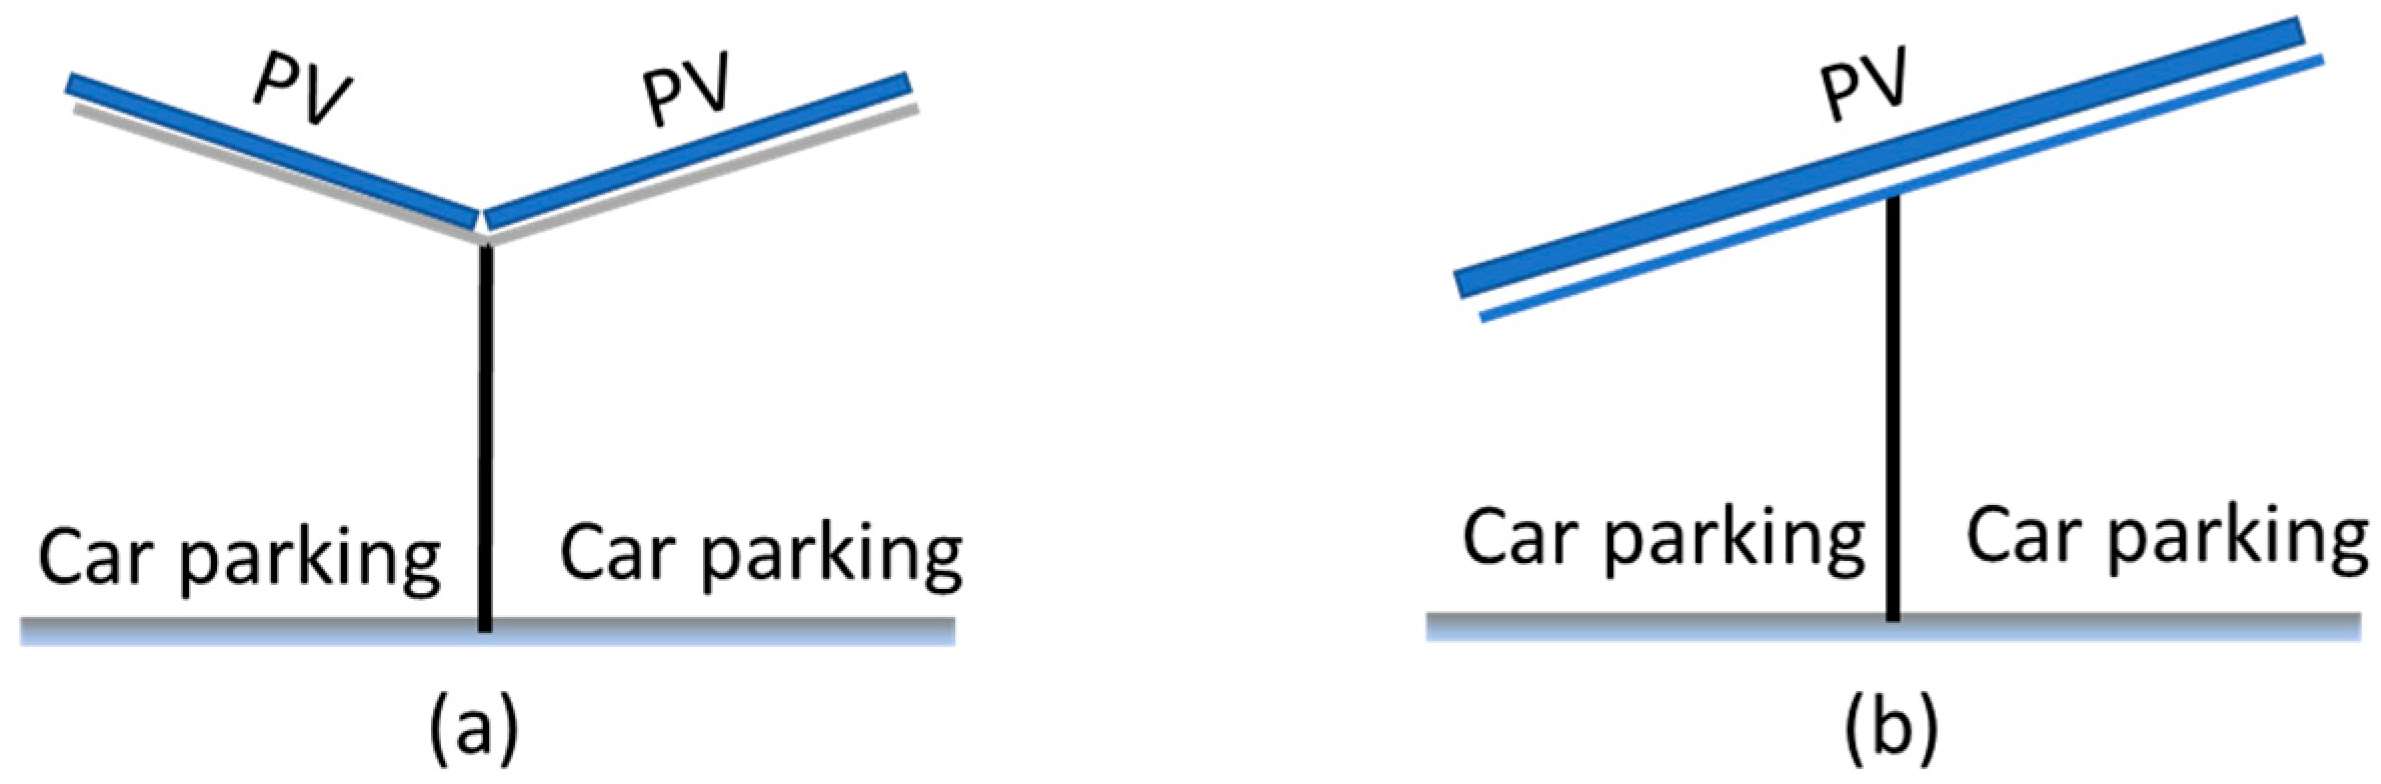
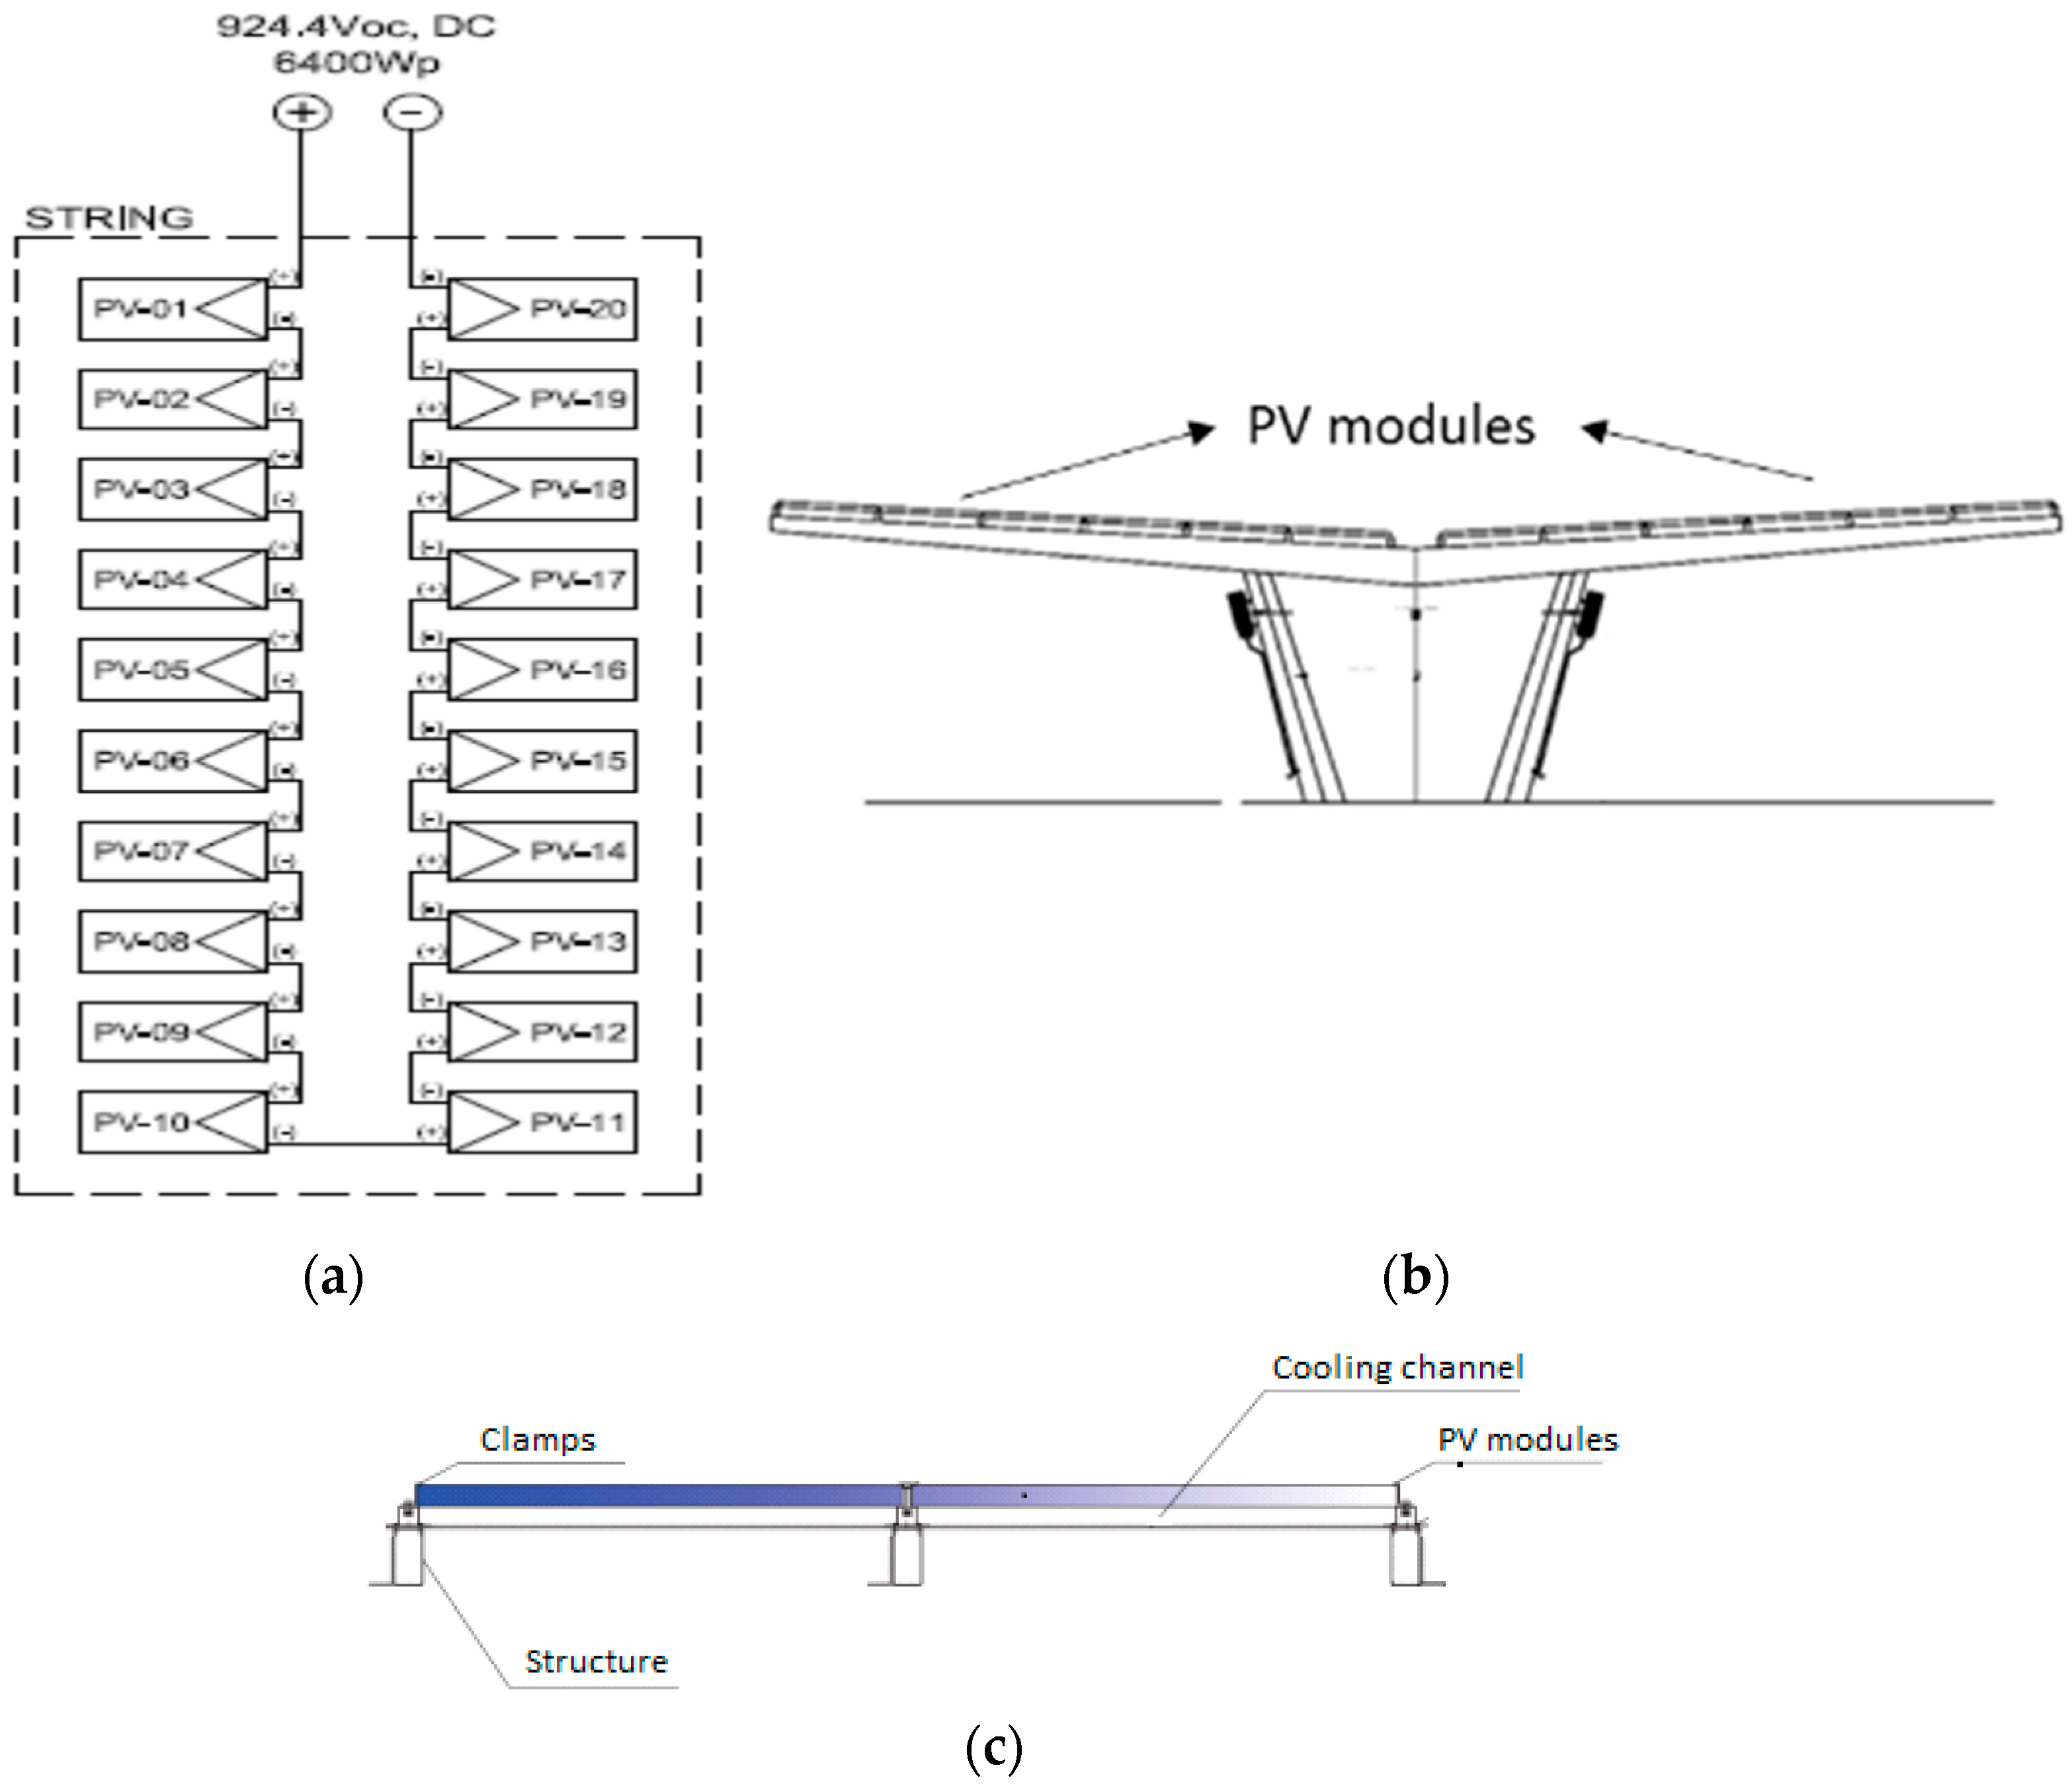
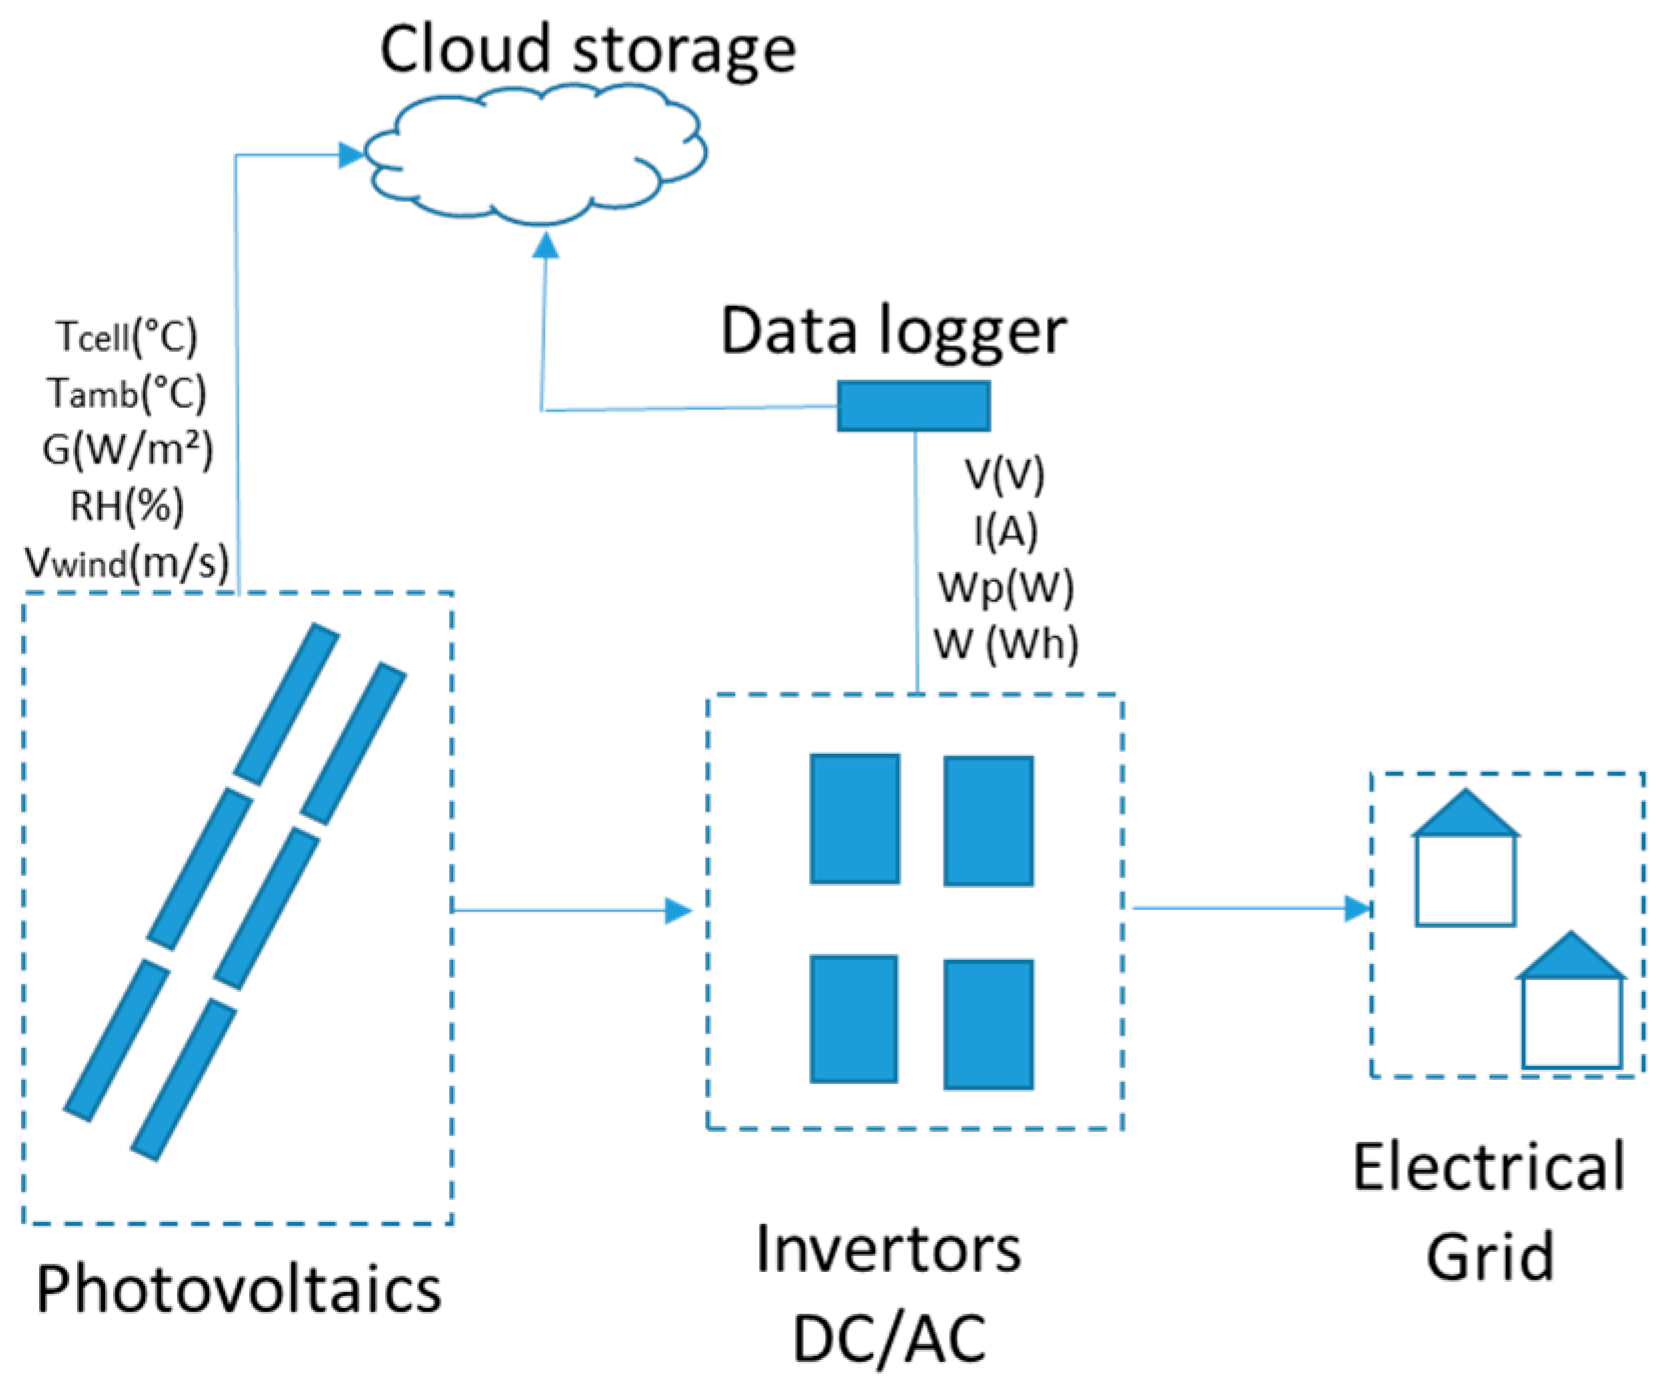
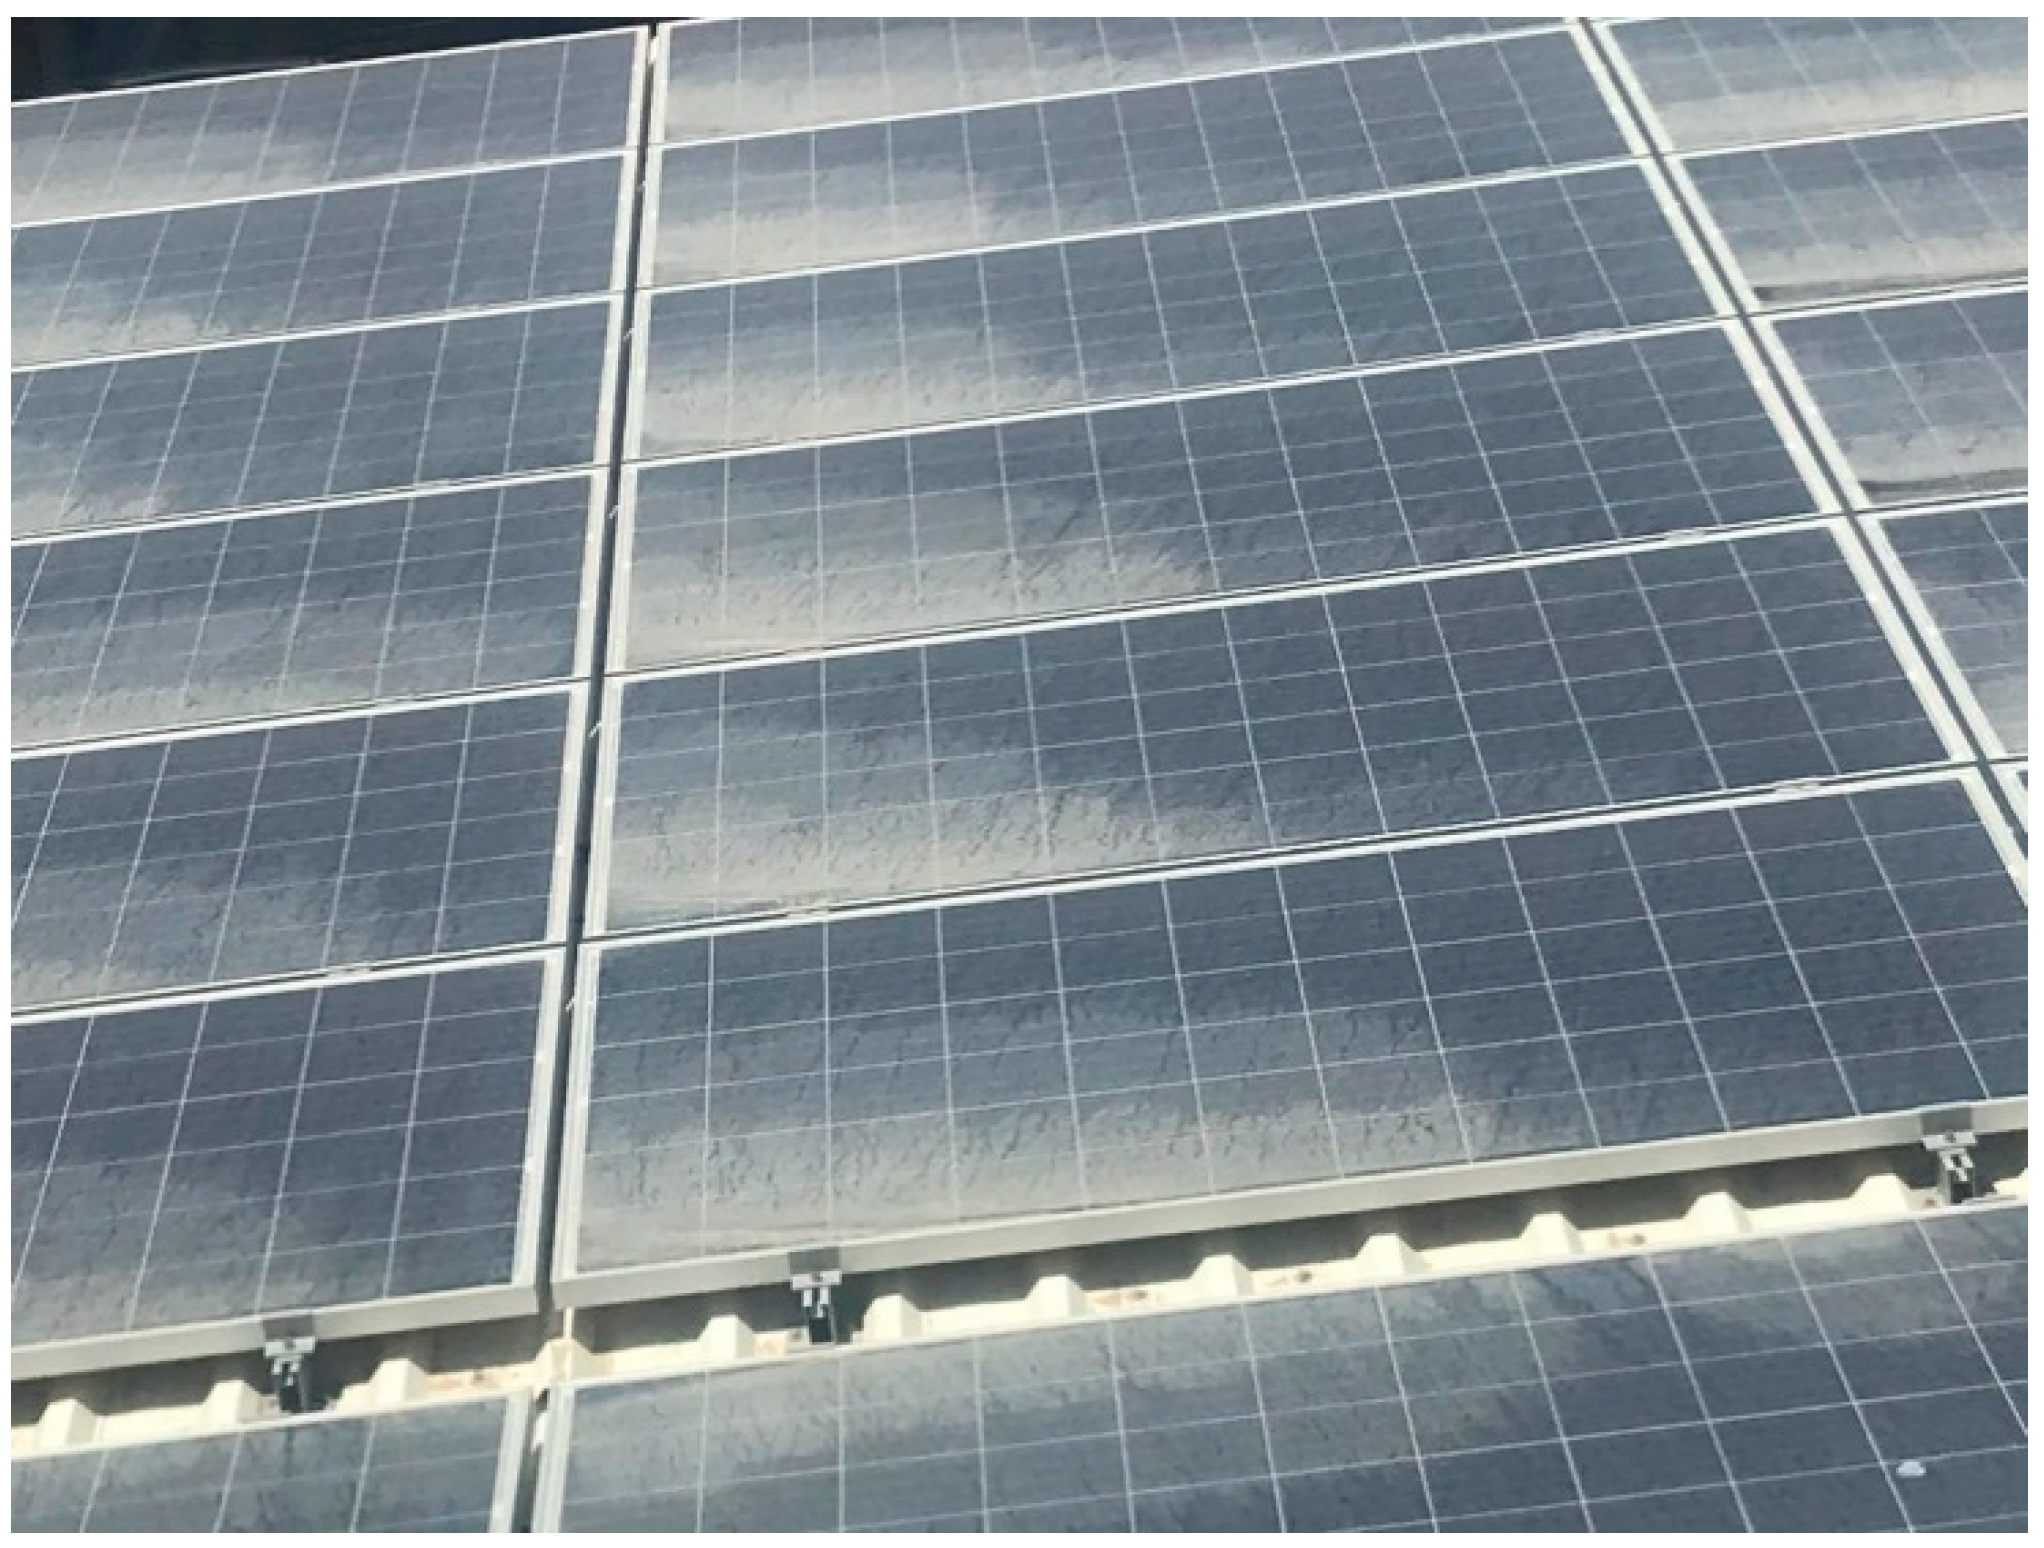
2.1. System Description

The studied PV system is installed in Muscat, the capital of Oman (23°37′28.9″ N 58°31′10.5″ E). The main purpose of the PV plant is to utilize the available space on the top of the car park shed. The land space is valuable in this area, in terms of the land cost, and would be a great investment in the solar PV installation. Due to the huge impact of weather conditions, such as dust, ambient temperature, and wind on the performance of the system, proper maintenance of the PV system is essential in order to maximize the power generation and, hence, reduce the payback period. Determination of the proper maintenance and cleaning schedules of the PV panels are achieved by comparing the existing performance with the ideal cleaning system performance. In addition, having a model that is able to predict the electricity generation on a daily basis is vital to the electricity regulator for planning the generation.
The studied system is considered a conventional solar PV plant and consists of PV panels connected in series to form a string. Each string consists of 20 panels in which the panels are connected in parallel to the electrical invertors, where each invertor has 12 strings. The invertors output is connected into a low voltage board, then to a step-up transformer, and finally to the grid. Figure 2 shows the overall system configuration of the PV, schematic of the car park shed, and the typical PV module installation.
Details of the main components of the PV and the inverters are shown in Table 1 and Table 2, respectively. The installed PV modules are of dimensions 0.99 m × 1.96 m, with a rated power of 320 W at standard test conditions (STC), and a module conversion efficiency of 16.51%. The panels have temperature coefficient for a maximum power of −00.410%/°C. The electrical inverters capacities of 60 kW each.
The logging and monitoring system is another important part of the solar system. It is required for logging and monitoring both the input and the output parameters related to the performance of the solar system. Figure 3 shows the system configuration and the schematic of the system outputs. The studied system is equipped with a calibrated cell and pyranometer to measure the global solar irradiation fallen onto the solar panels. The total generated power is recorded at each 10 min interval. In addition, the weather station measures the temperature, relative humidity, wind speed, and direction. The measuring instruments details are shown in Table 3.

2.2. Experimental Procedure

The studied system was installed for commercial electricity generation and all of the considered measurements for this analysis are taken directly from the logging system. The logging system has two parts: the weather station and the solar system. Both loggers used the same monitoring system with the shortest time step of 10 min. Both recorded parameters; weather data and the system input and output data were logged into one system, where the data were pulled for analysis. Table 4 shows the parameters for the weather station and the solar system.
Quality control is an essential procedure due to the large volume of data obtained from the different instruments and the errors generated by the sensors and data loggers [38,39]. In this study, the main parameter of quality control is solar irradiation. Hence, the quality control, checked for the global solar irradiance, is its upper limit, by 1200 W/m2.

2.3. Mathematical Model of Relevant Parameters

Different parameters describe the performance of the PV system. These are used to ensure that the system works as designed and to access the system performance during the life cycle of the plants. The amount of electricity produced by the PV plant in a day and a month in kWh are given as [40]:
P A C , d = 1 24 P A C , h
P A C , m = 1 N P A C , d
where ( P A C , h ), ( P A C , d ), and ( P A C , m ) are the amount of electricity produced by the PV plant and exported to the connected electricity grid in an hour, day, and month, respectively. N is the number of days for the same month. The plant yield ( Y P V ) is defined as the ratio of the total produced power ( P D C ) by the total rated power of the PV plant ( P P V , r a t e d ) and expressed as [41]:
Y P V = P D C P P V , r a t e d
where both the P D C and P P V , r a t e d are in DC and in kWh. The daily array yield ( Y P V , d ) and the monthly average array yield ( Y P V , m ) are given as [42]
Y P V , d = P D C , d P P V , r a t e d , d
Y P V , m = 1 N   1 N Y P V , d
where N is the total number of days for the same month. Al-Otaibi et al. [43] defined the final plant yield ( Y f ) as the ratio of the AC power produced by the PV plant divided by the rated power of the installed PV. The final yield is defined as
Y f , d = P A C P P V , r a t e d
Y f , m = 1 N   1 N Y f , d
The reference yield ( Y r e f ) is another parameter to assess the PV plant in a specific location. The reference yield represents the loss of PV system when converting from the DC to AC. It is defined as the global solar radiation (H) in kWh/m2 by the reference radiation of the PV (HPV) in kWh/m2 and expressed by [44]
Y r e f , d = H H P V
The performance ratio (PR) considers the loss related to the system resulting from dust, ambient temperature, invertor losses, and cables. It is defined as the ratio of final yield ( Y f ) by the reference yield ( Y r e f ) and defined by [45]
P R = Y f Y r e f
Hence the loss of PV plant ( L C ) due to cables and weather conditions can be found by subtracting the reference yield ( Y r e f ) and the plant yield ( Y P V ) and expressed as [46]
L _ C = Y _ r e f Y _ P V
The system losses caused by the invertor ( L S ) can be expressed as
L _ S = Y _ P V Y _ f
The conversion efficiency ( η P V ) is expressed as [24]
η P V = P o u t P s o l a r
The PV power production decreases with the increase in the cell temperature and this can be calculated using the temperature loss coefficient ( η T ) and is given as
η T = 1 + β   ( T C 25 )
where T C is the PV temperature and β is the temperature coefficient of the PV module.
T C = T a + I A   ( T N O C T 20 )
where I is the solar irradiance (W/m2) at a specific time and T N O C T is the nominal operating cell temperature. A is the solar irradiation at the nominal operating condition (800 W/m2).

2.4. System Modelling and Simulation

In this study, the solar system was simulated using a HelioScope simulation tool. The tool offers simulation of the proposed system in the design stage or the existing solar system for a specific location and weather conditions. Many factors should be considered, such as module losses (temperature, shading, and conversion efficiency), invertor losses, and cable losses. Hence, the model calculates the system output by interacting with each other in series or parallel. This model offers many opportunities for conducting parametric studies of the effect of temperature, due to the system arrangement, and dust due to the tilted system and surroundings.
The adopted model uses many inputs from the physical components of modules, wire combiner boxes, and the invertors to build up the system, as per the data sheet provided by the manufacturers.
The considered meteorological data are from the National Solar Radiation Database in a typical meteorological year. This includes the hourly global horizontal solar irradiance (GHI) in W/m2, ambient temperature (T) in °C, and wind speed (ν) in m/s. Generally, the weather stations measure the global solar radiation on a horizontal surface, whereas the amount of the incident solar irradiance onto the panels in a specific location depend on the azimuth and tilt angle of the system. Various models were proposed for estimation of the solar radiation on tilted surfaces in the last decades.
In real life, pyranometer is used to measure the global solar radiation on horizontal surfaces. The total global solar radiation on horizontal surfaces (IGH) in W/m2 is the sum of the diffuse solar radiation (Id) and the direct solar radiation (Ib):
I G H = I d + I b  
The global solar irradiation on inclined surfaces (IGi) is the sum of three components: direct radiation (Ibi), diffuse radiation (Idi), and reflected radiation (Iri).
I G i = I b i + I d i + I r i
The diffuse solar radiation models for inclined surfaces are classified as isotropic and anisotropic. In this study, the Hay’s model was used for the anisotropic model. The Hay’s model was proposed by Hay and Davies, which considers two main sources of diffuse radiation: the sun and the sky [47]. Hence, the diffuse radiation on the inclined surface is expressed as:
I d i = I d [ f H ( cos θ cos θ z ) +   ( 1 +   cos β 2 ) ( 1 f H ) ]
where f H is the clearness index. θ , θ z , and β are angle of incidence of sun ray on the surface, zenith angle, and the tilt angle, respectively. Where the clearness index f H is given by
f H = I b I o
where I o is the solar irradiance outside the atmosphere [48]. Part of the incident solar irradiance on the module is the reflected one ( I r i ) and this is found by
I r i = I b i .   α   ( 1 cos β 2 )
where α is the albedo. The module is considered as the core of the PV system as it is the source of power generation. The absorbed solar irradiation by the module is converted partially to electricity and the rest to heat. The current generated by a single-diode module ( I P V ) [49] is written as
I P V = I s c I o ( e q k T . 1 γ N C S ( V + I . R s ) 1 ) V + I R s R s h
where I s c is the short circuit current, I o is the saturation current, q is the charge of the electron, k is Boltzmann constant, T is the module temperature, γ is module factor, N c s is number of cells in series, V is the generated voltage, R s is the series resistance and R s h is the shunt resistance.
The short circuit current I s c is a characteristic of the module and dependent on the solar irradiation and the temperature [50]. It can be calculated as follows
I s c = ( I b i I r e f ) ( I s c , S T C + T c o f f ( T C T S T C ) )
where I r e f is the reference irradiance (1000 W/m2) and T c o f f is the temperature coefficient of the module. I s c , S T C and T S T C are the short circuit current and temperature at the standard test conditions. Figure 4 shows the I–V curve for the selected module, in the lab, under a different solar irradiation of an indoor temperature of 25 °C.
The module output simulations are duplicated due to similarity and all of the losses caused by wiring, DC combiner boxes, and invertors, to be considered in the model. The total output voltage of the module ( V t o t a l ) can be found.
V t o t a l = V s o u r c e I ( 2 L   ρ )
where L is the wire length and ρ is the resistance of the wire. Because of the series connection of module in an array, the current is the same and the voltage is the summation.
I o u t = I i n
V t o t a l = i = 1 N V s o u r c e I o u t ( 2 L t o t a l   ρ )
where N is the number of modules in a specific array. Combiners is the part where the array of the same invertor connected. Hence, the final voltage of the combiner box is the same, and the current is the summation:
V c o m b i n e r = V t o t a l
I c o n b i n e r = i = 1 N I a r r a y
The invertor efficiency is usually published by the manufacturers on a graph where those are used in the models [40].

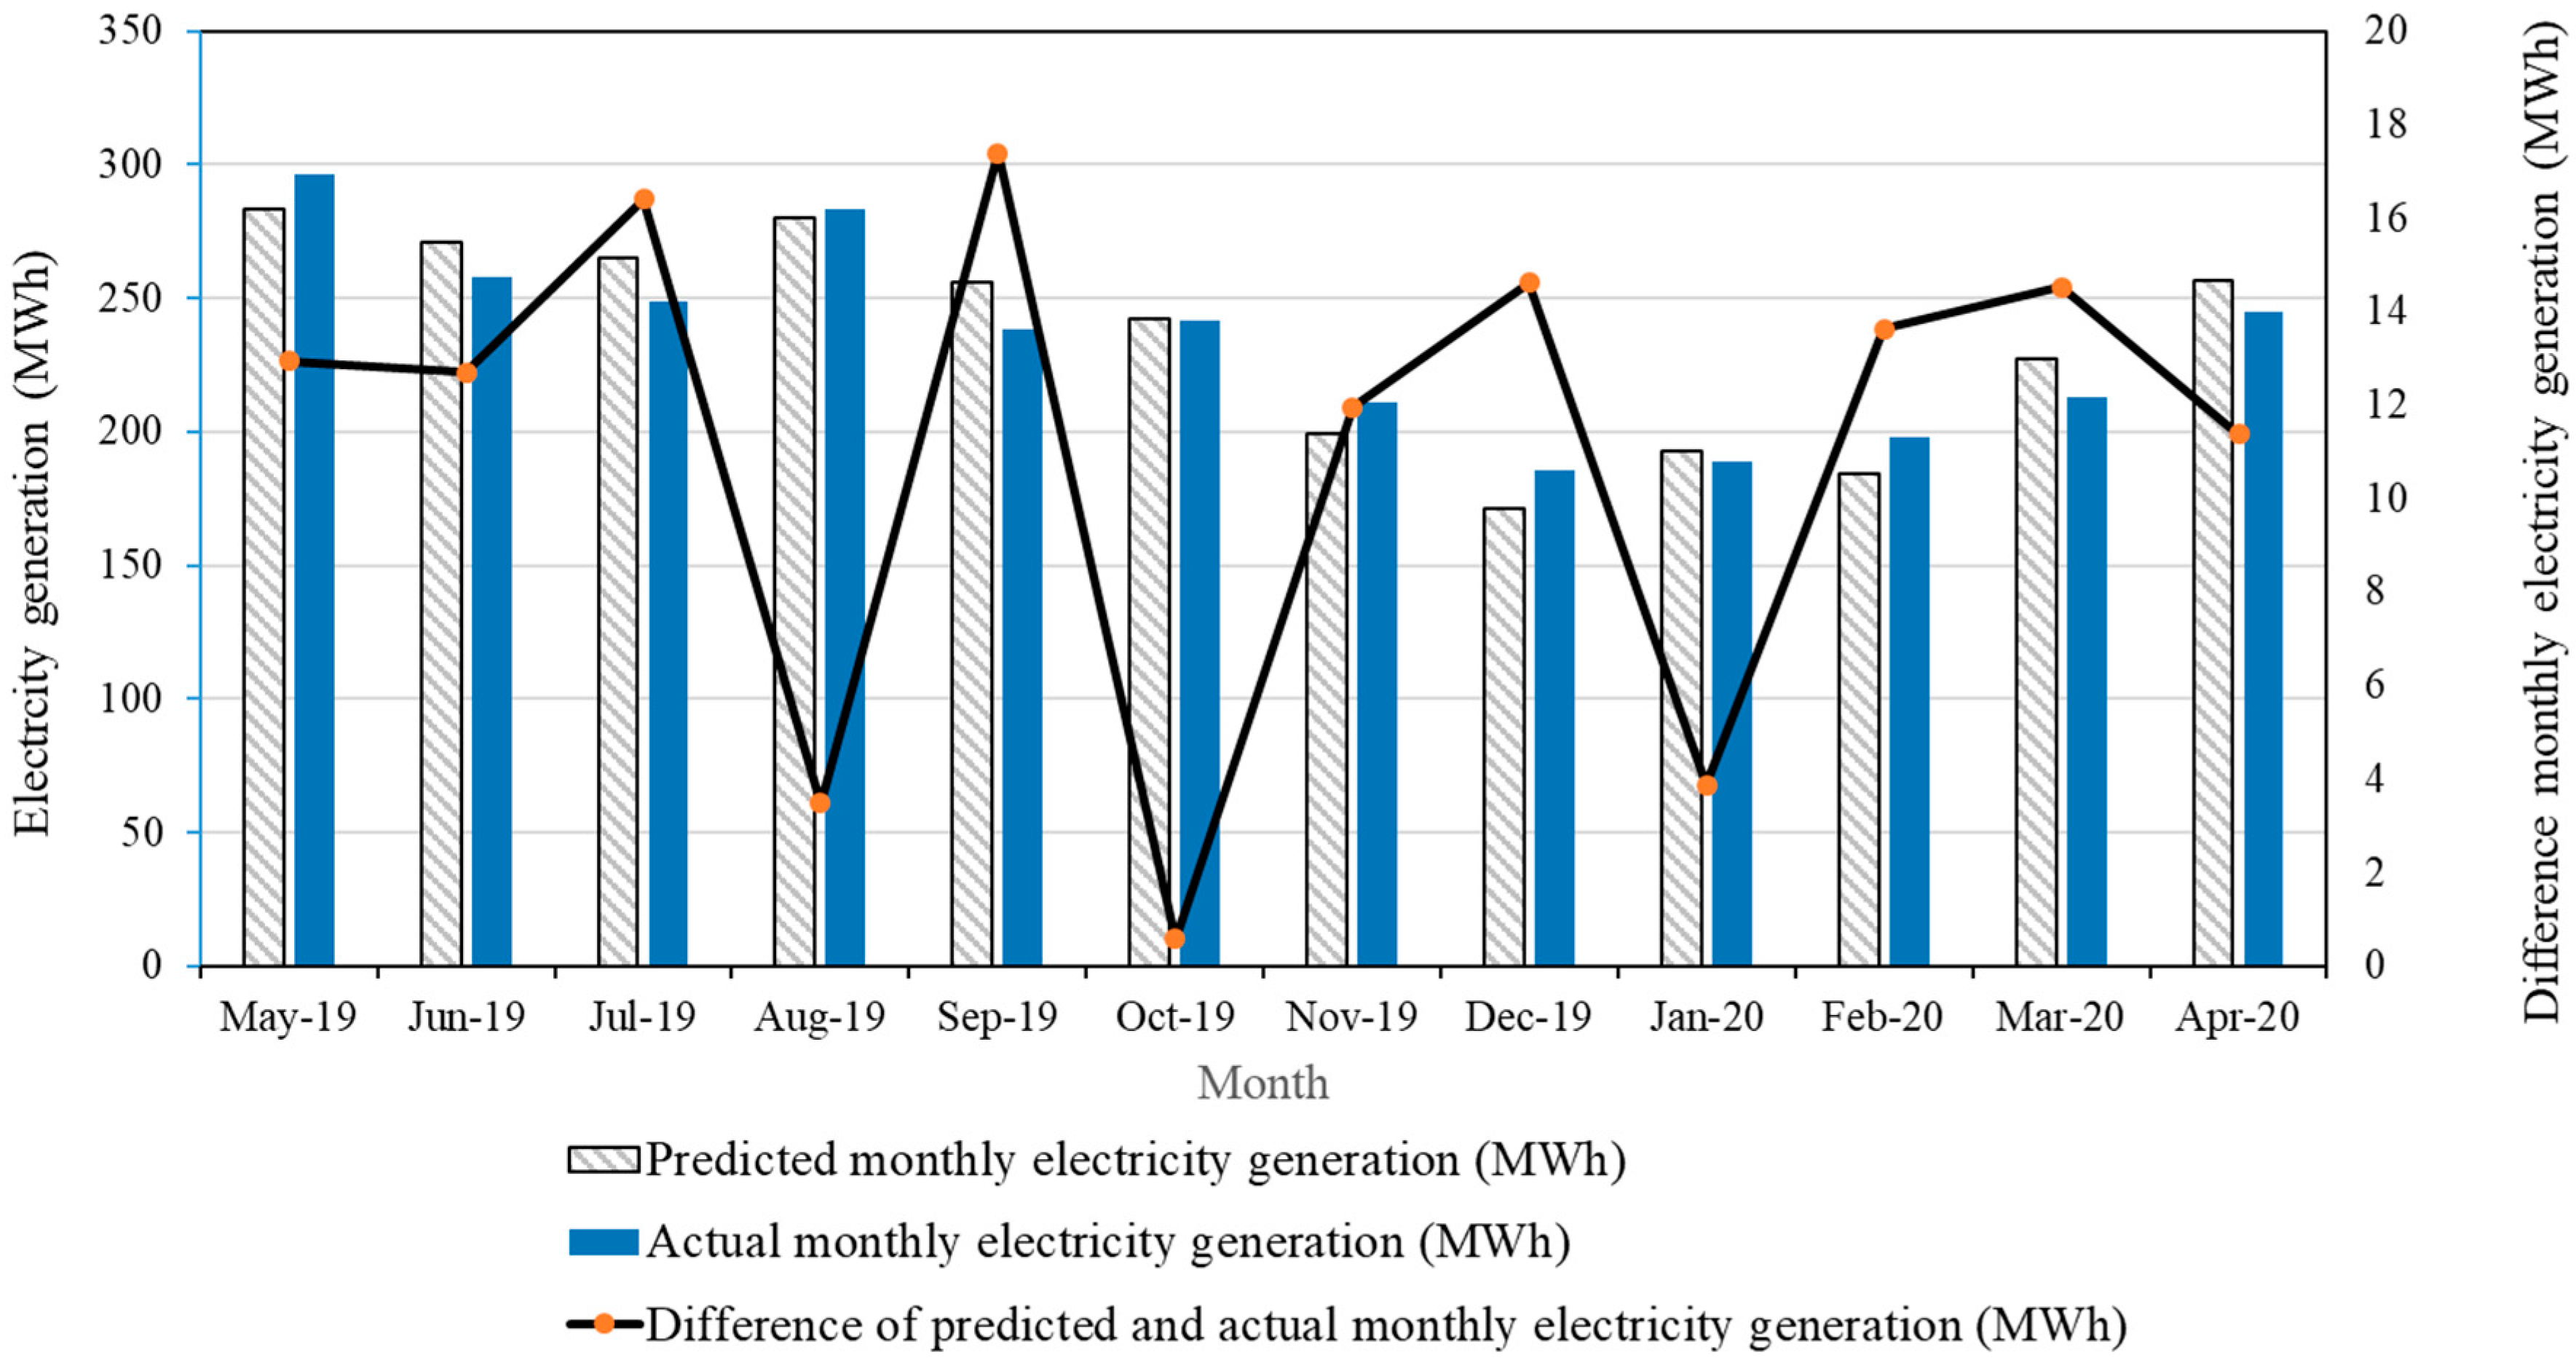
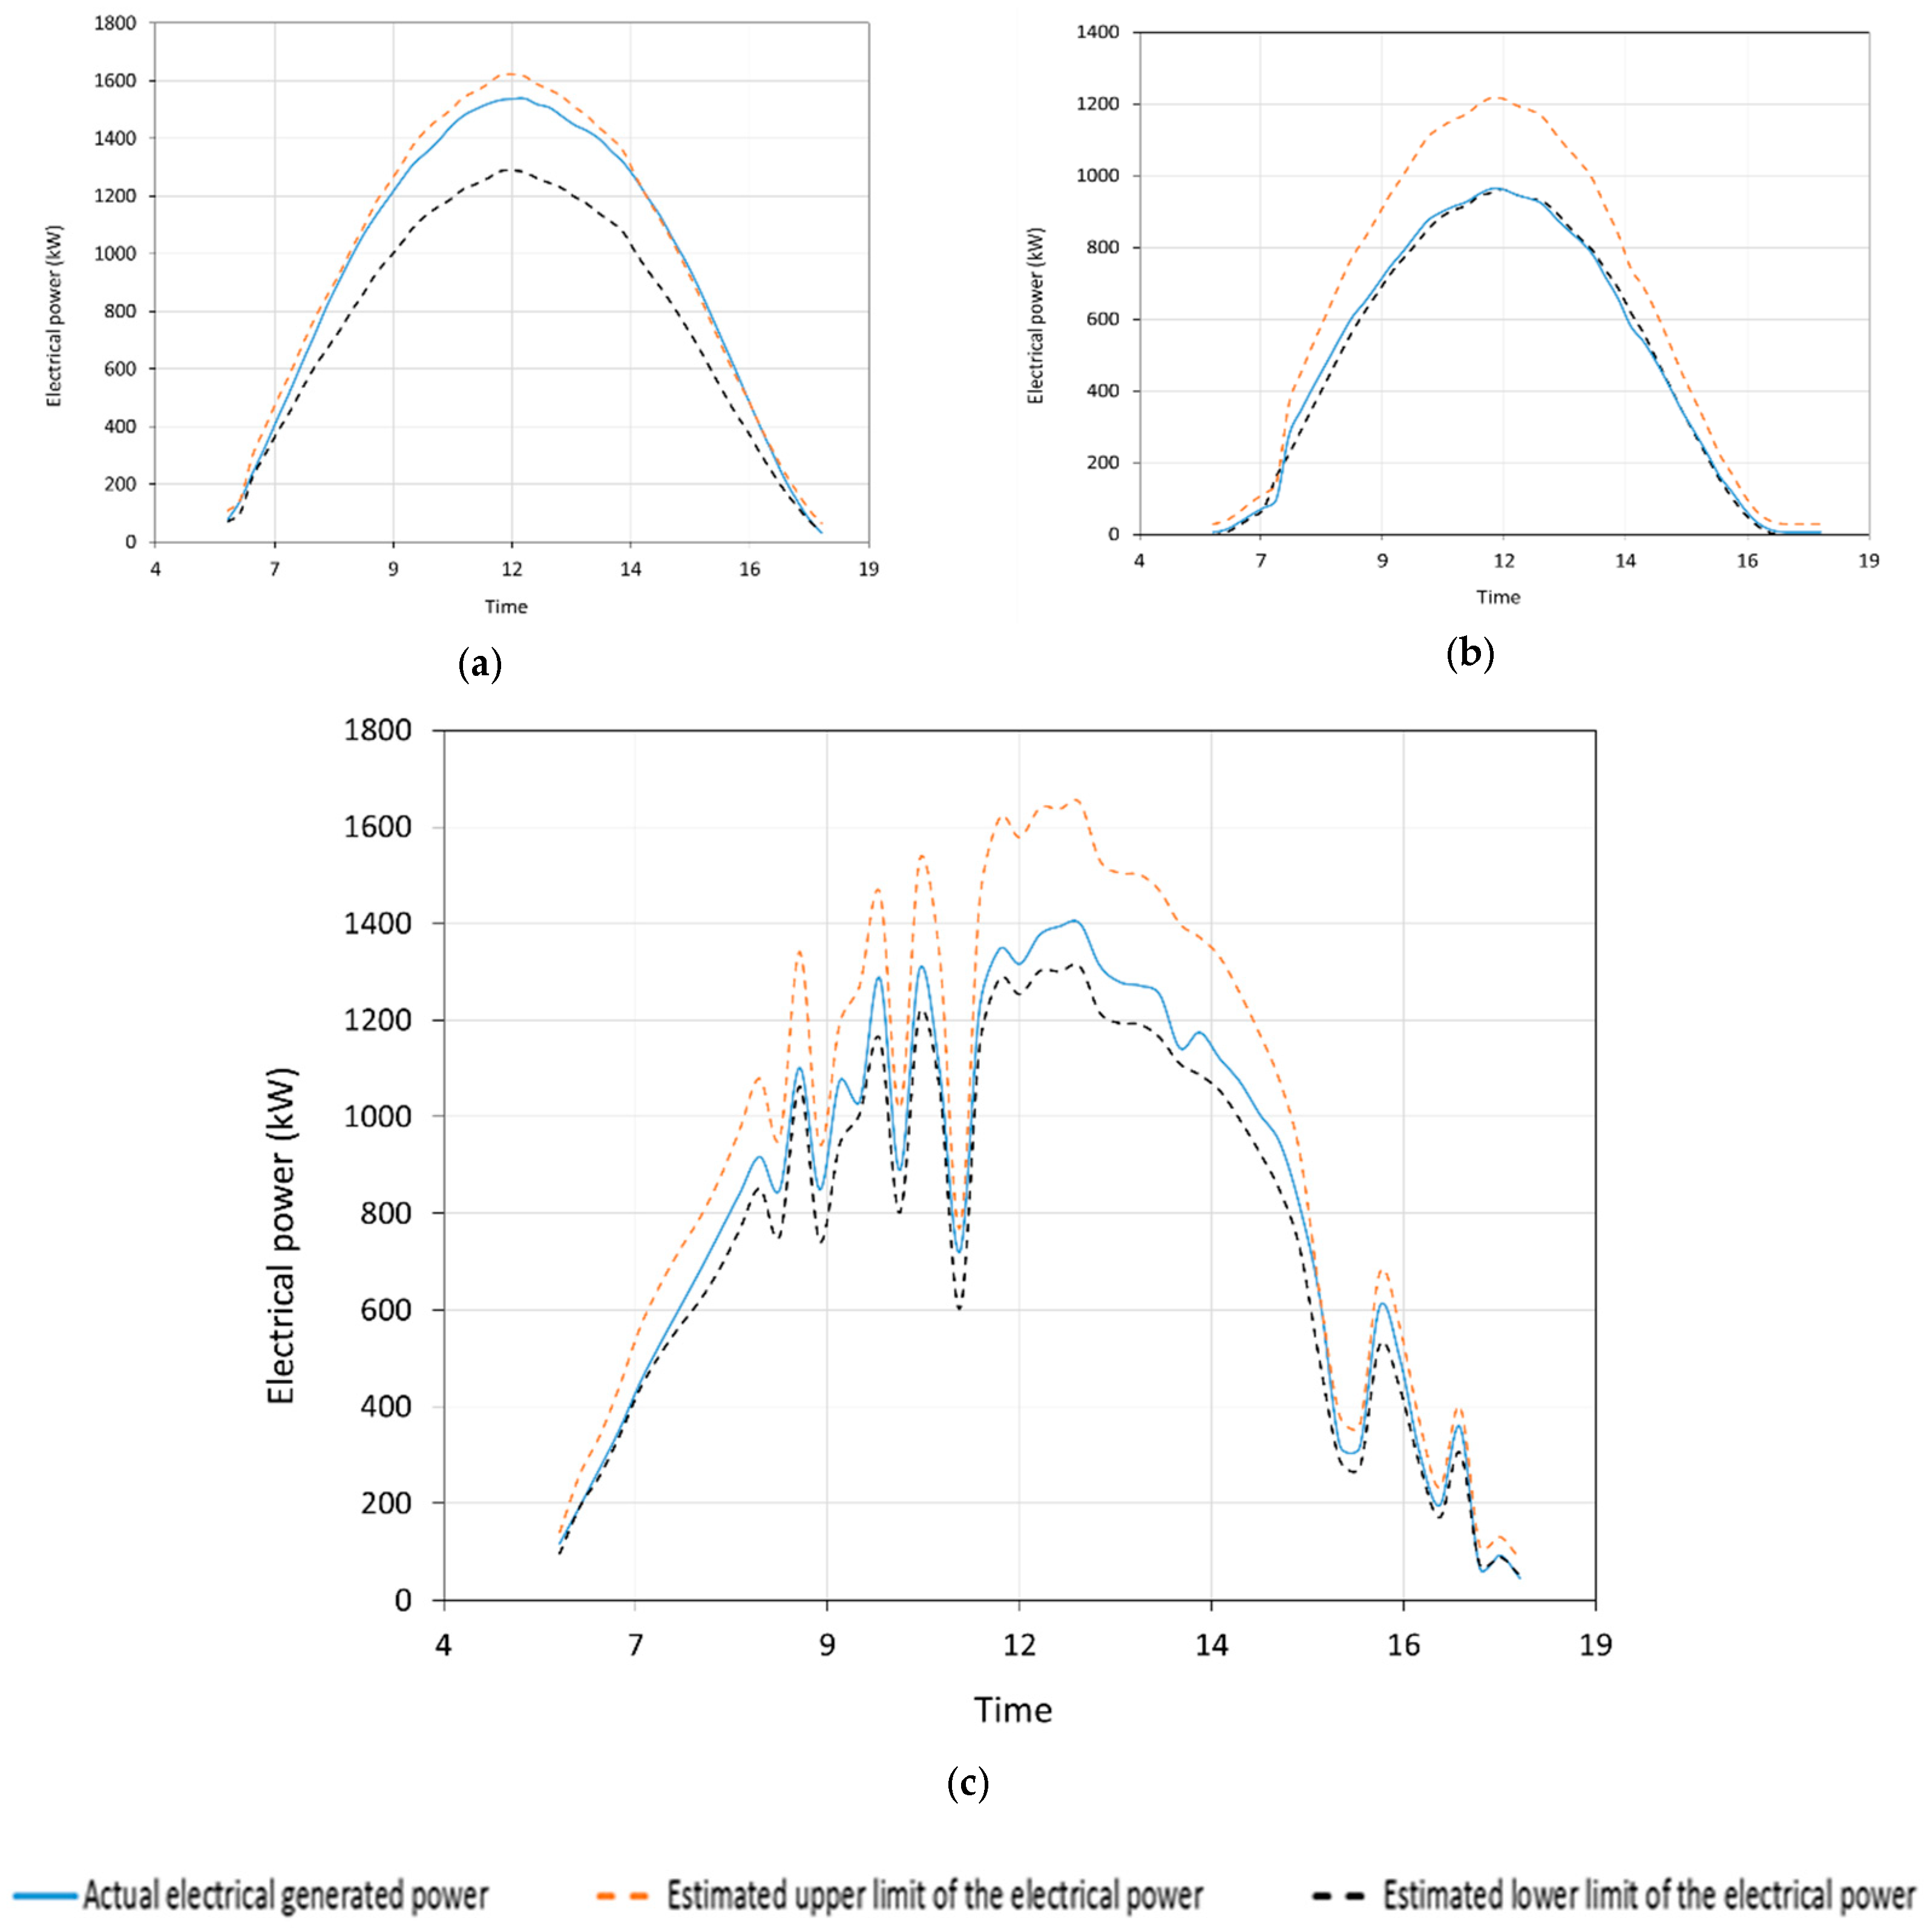
2.5. Model Validation

The existing solar system model has been validated using the actual results of the same system configuration and parameters of the climatic conditions. Hence, the system tilt angle, the azimuth, PV array arrangements, and the shading caused by the objects are the main configuration parameters where the climatic conditions are the incident solar irradiation, ambient temperature, and the wind characteristics. The monthly electricity generation by the PV array system was used as the validation parameter of the simulated model.
The predicted and actual values of the monthly electricity generation are graphically represented in Figure 5. The generation represents a 12-month period, between May 2019 and April 2020. The predicted values show good matching with an absolute percentage difference between 0.23% and 7.8%. The highest predicted monthly electricity generation occurs for the month of May 2019, which is 283 MWh, with a percentage difference of 4.3% from the actual. In addition, the graphical representation shows the lowest predicted monthly electricity generation occurs for the month of December 2019, which is 171 MWh with a percentage difference of 7.8% from the actual. Therefore, this is considered an accurate model, and can be used to study the effects of parameters, such as soiling and tilted angles.

3. Results and Discussion
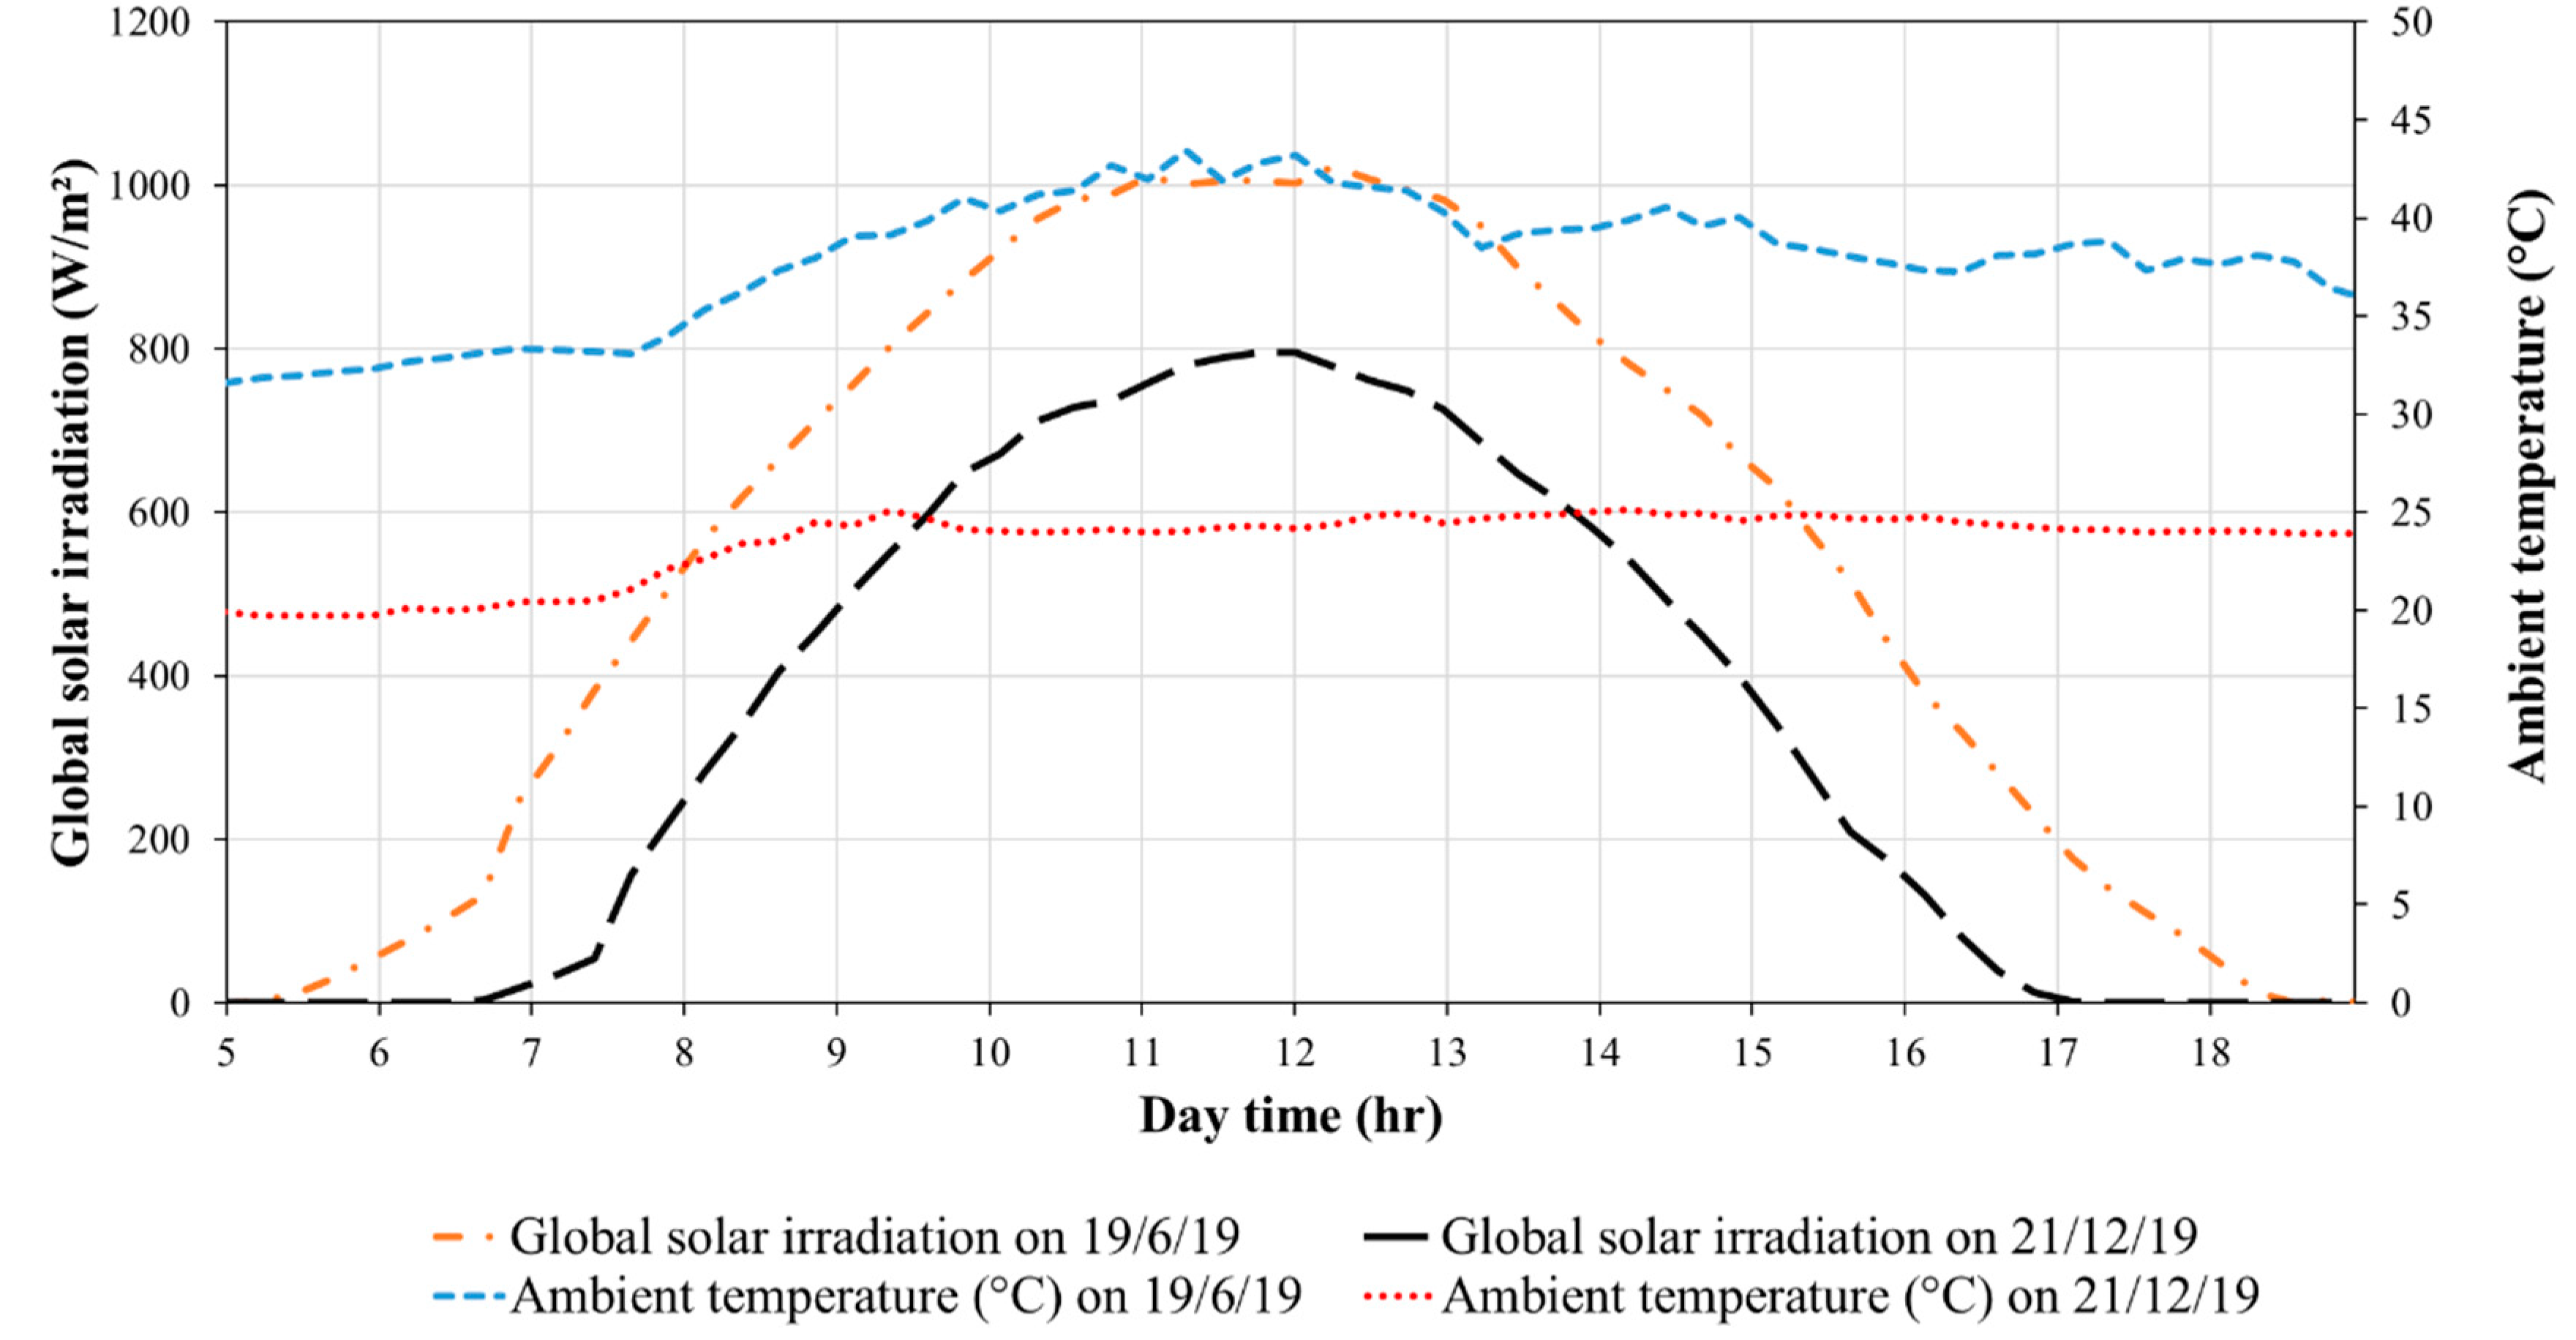
The overall performance of the PV system is evaluated by presenting the weather data for the location and the electrical output of the system. After that, the upper and lower limits of PV plant operation profiles were allocated to identify whether the system is clean or dusty on a specific day. In addition, the effect of dust on the system performance was investigated using a continuous period of operation. Finally, the validated model was used to conduct the parametric study, to find the effect of the tilt angle and soiling percentages.

3.1. Weather Data

As mentioned earlier, the studied system is located in Muscat, the capital of Oman. The global solar irradiance and the ambient temperature for the shortest day and the longest day are shown in Figure 6. The shortest day duration for this location is on 21 December 2019, i.e., 10 h 40 min, where the practical solar irradiation duration to the PV module is shorter than 10 h. Figure 6 shows a small variation of the ambient temperature during the day between 20 °C and 26 °C. This ambient temperature is considered an acceptable range as it is within the STC of modules. As expected, during the clear sky day, the profile of the irradiance curve is symmetric around noon where the maximum solar radiation is around 12 p.m., i.e., 800 W/m2. The longest day duration of this location is on 19 June 2019, for 13 h 34 min, and, as mentioned, the practical solar irradiation duration to the PV modules is less than this duration due to the shading caused by the natural objects. The ambient temperature varies between 32 °C and 42 °C. This ambient temperature is expected to reduce the PV performance by the range of −0.410%/°C. Under the clear sky day, the maximum measured irradiance is 1000 W/m2, where the period of exposure to the high solar radiation is more than 2 h; this is considered as a high gain to the power factor to the PV system.

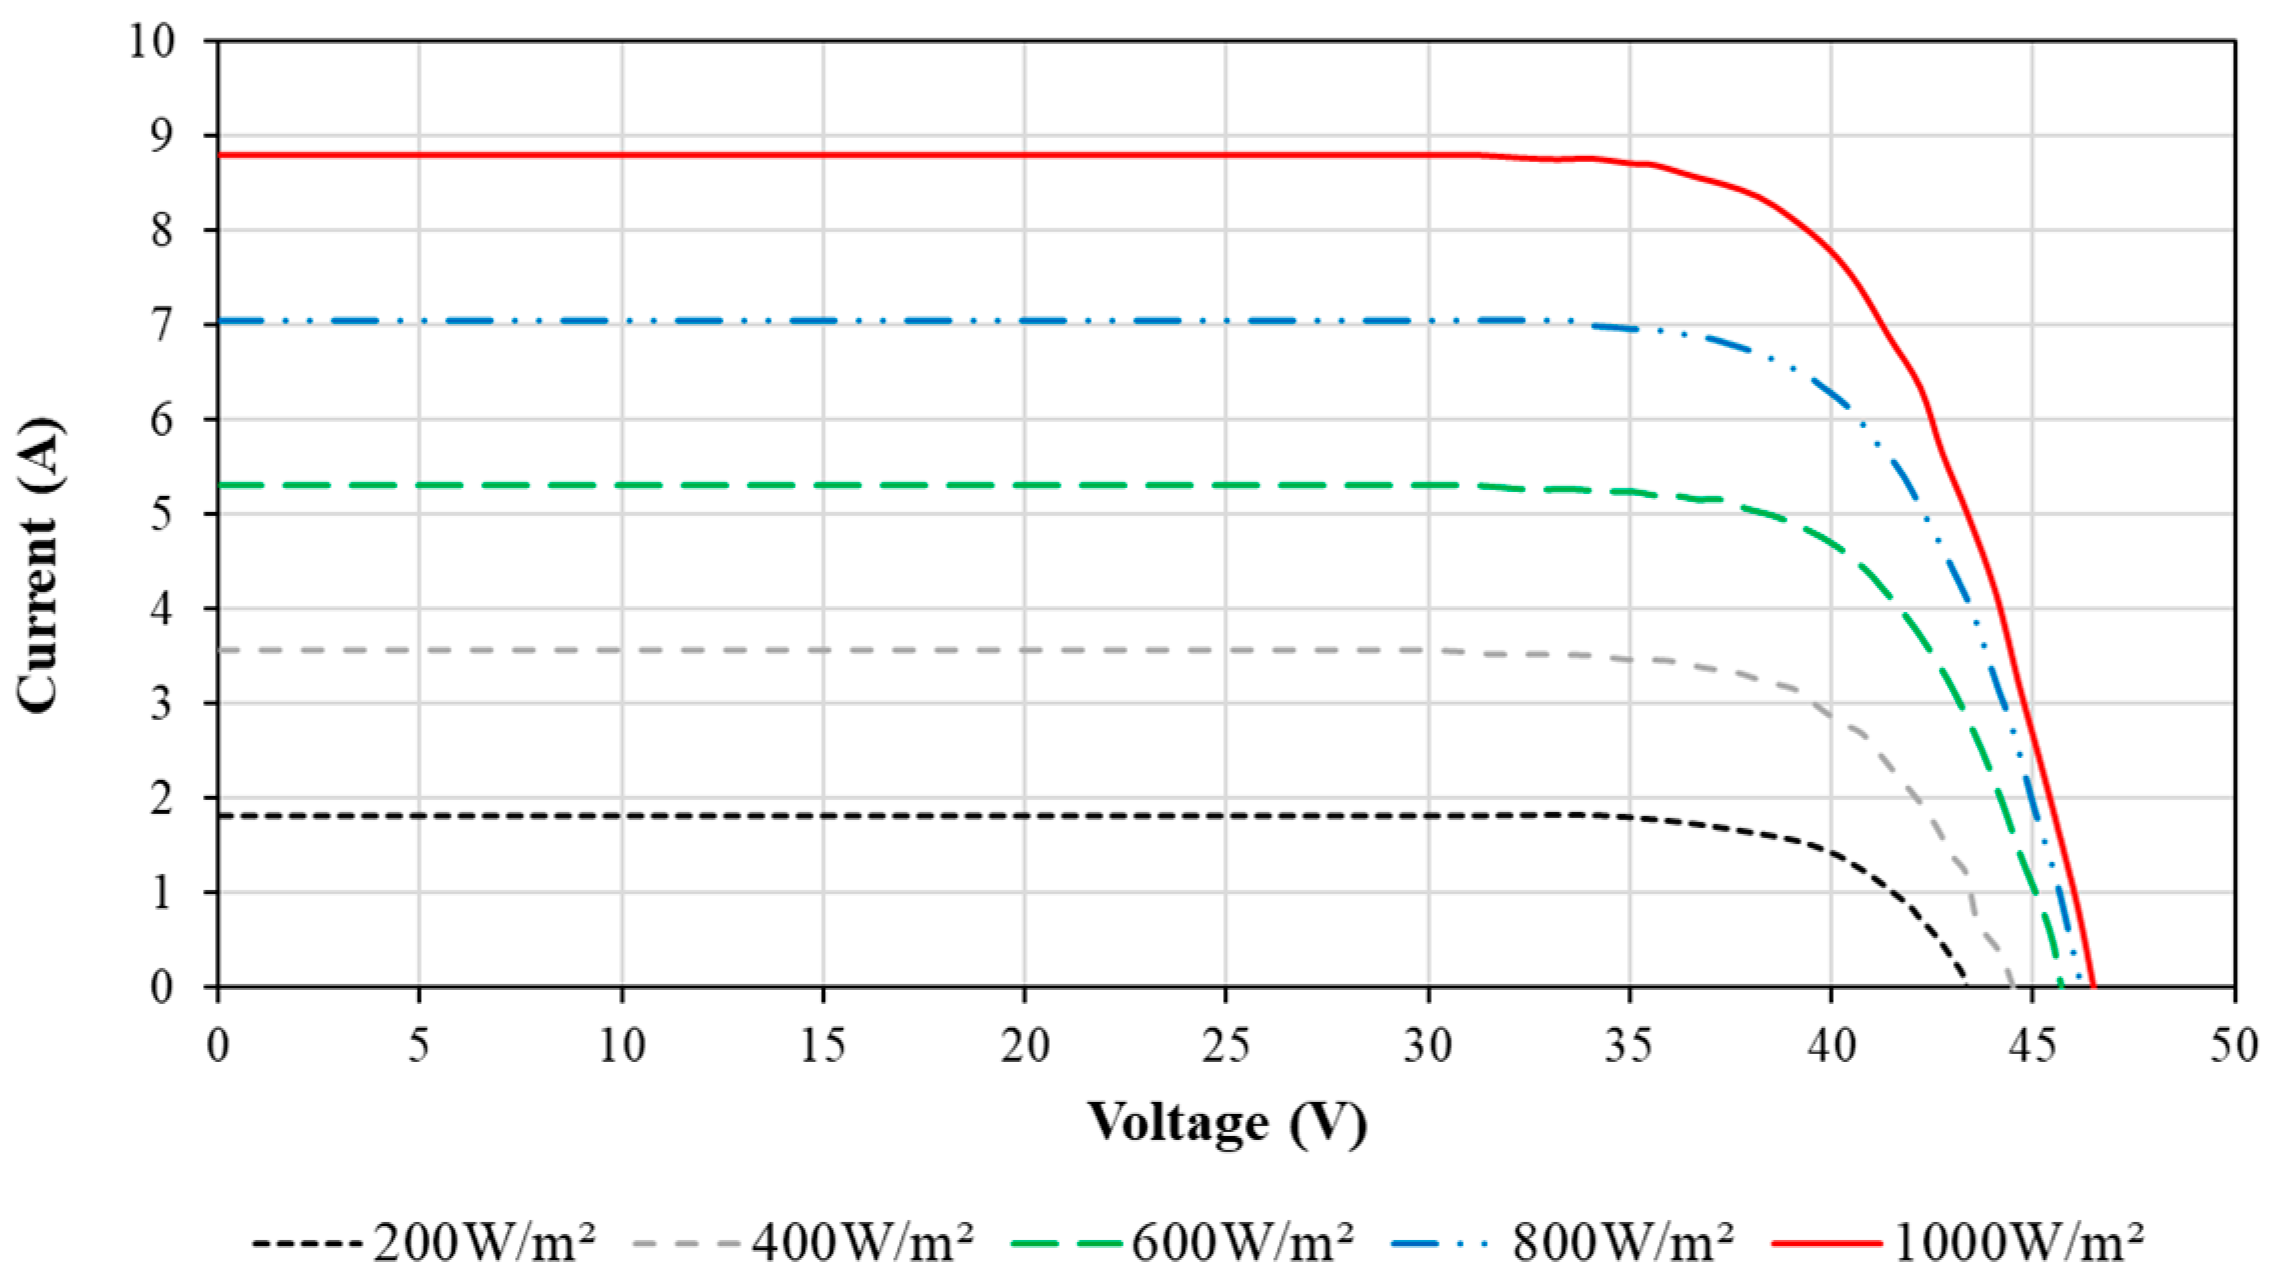
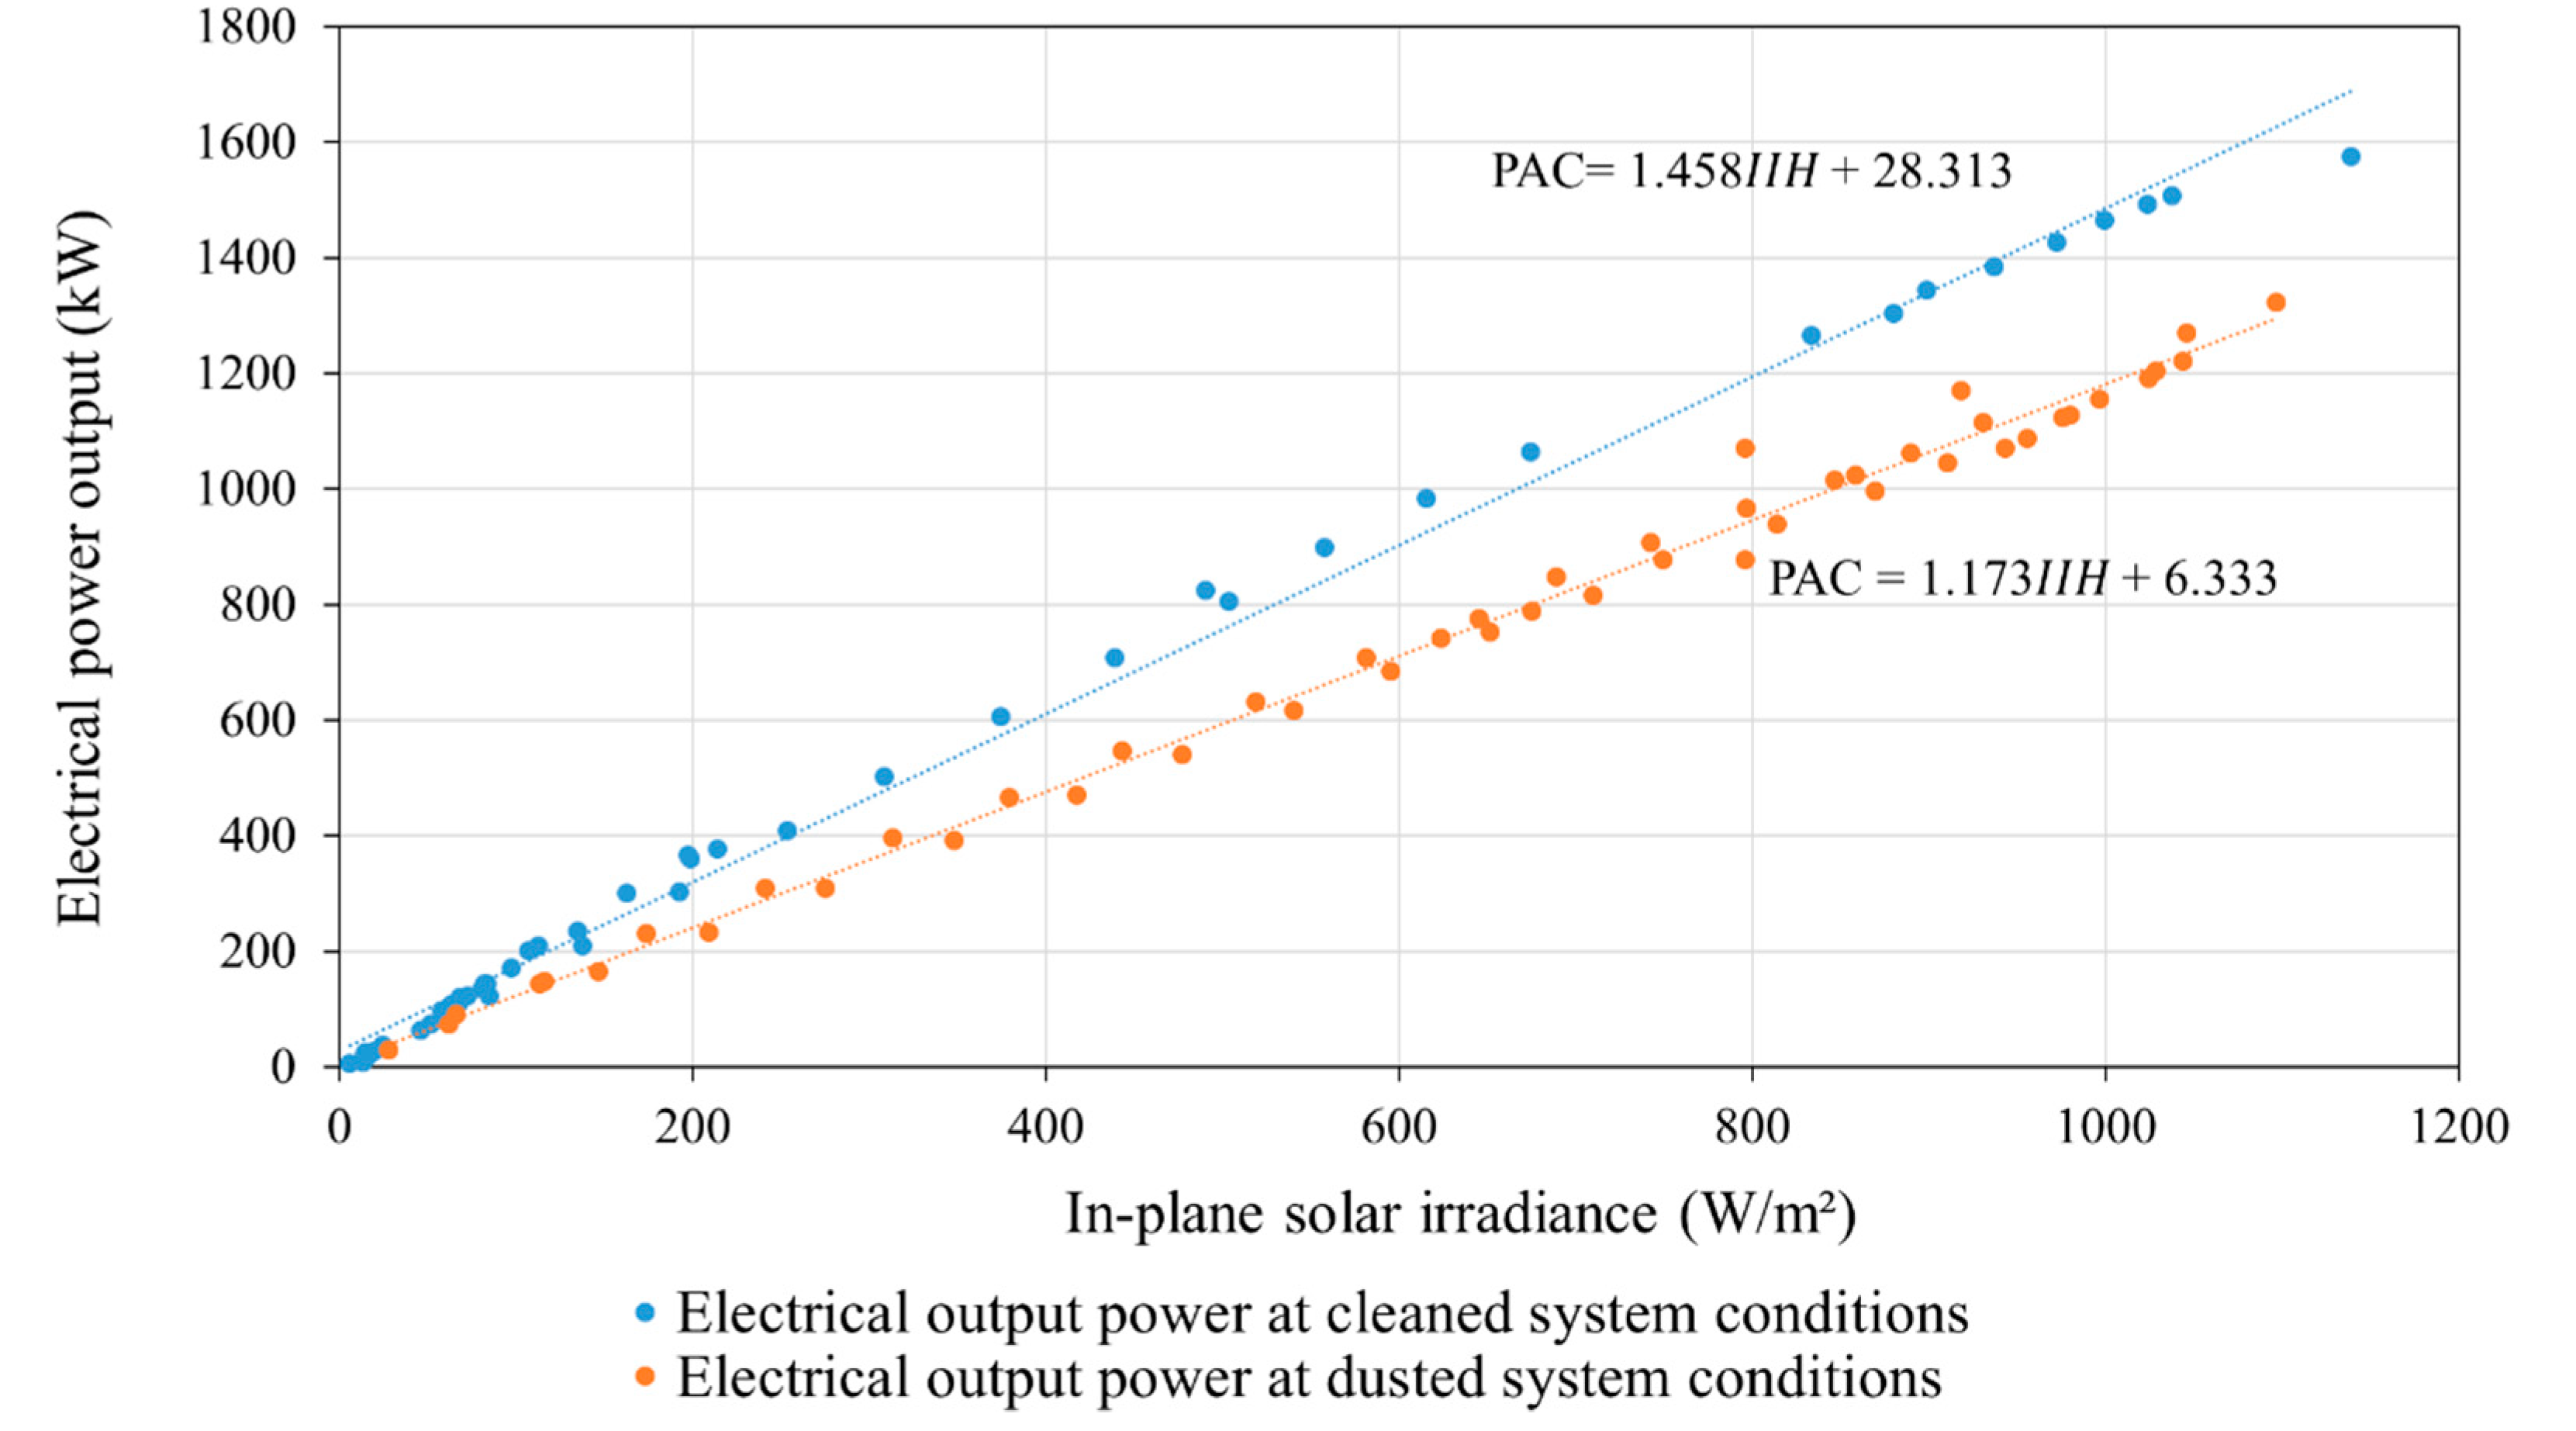
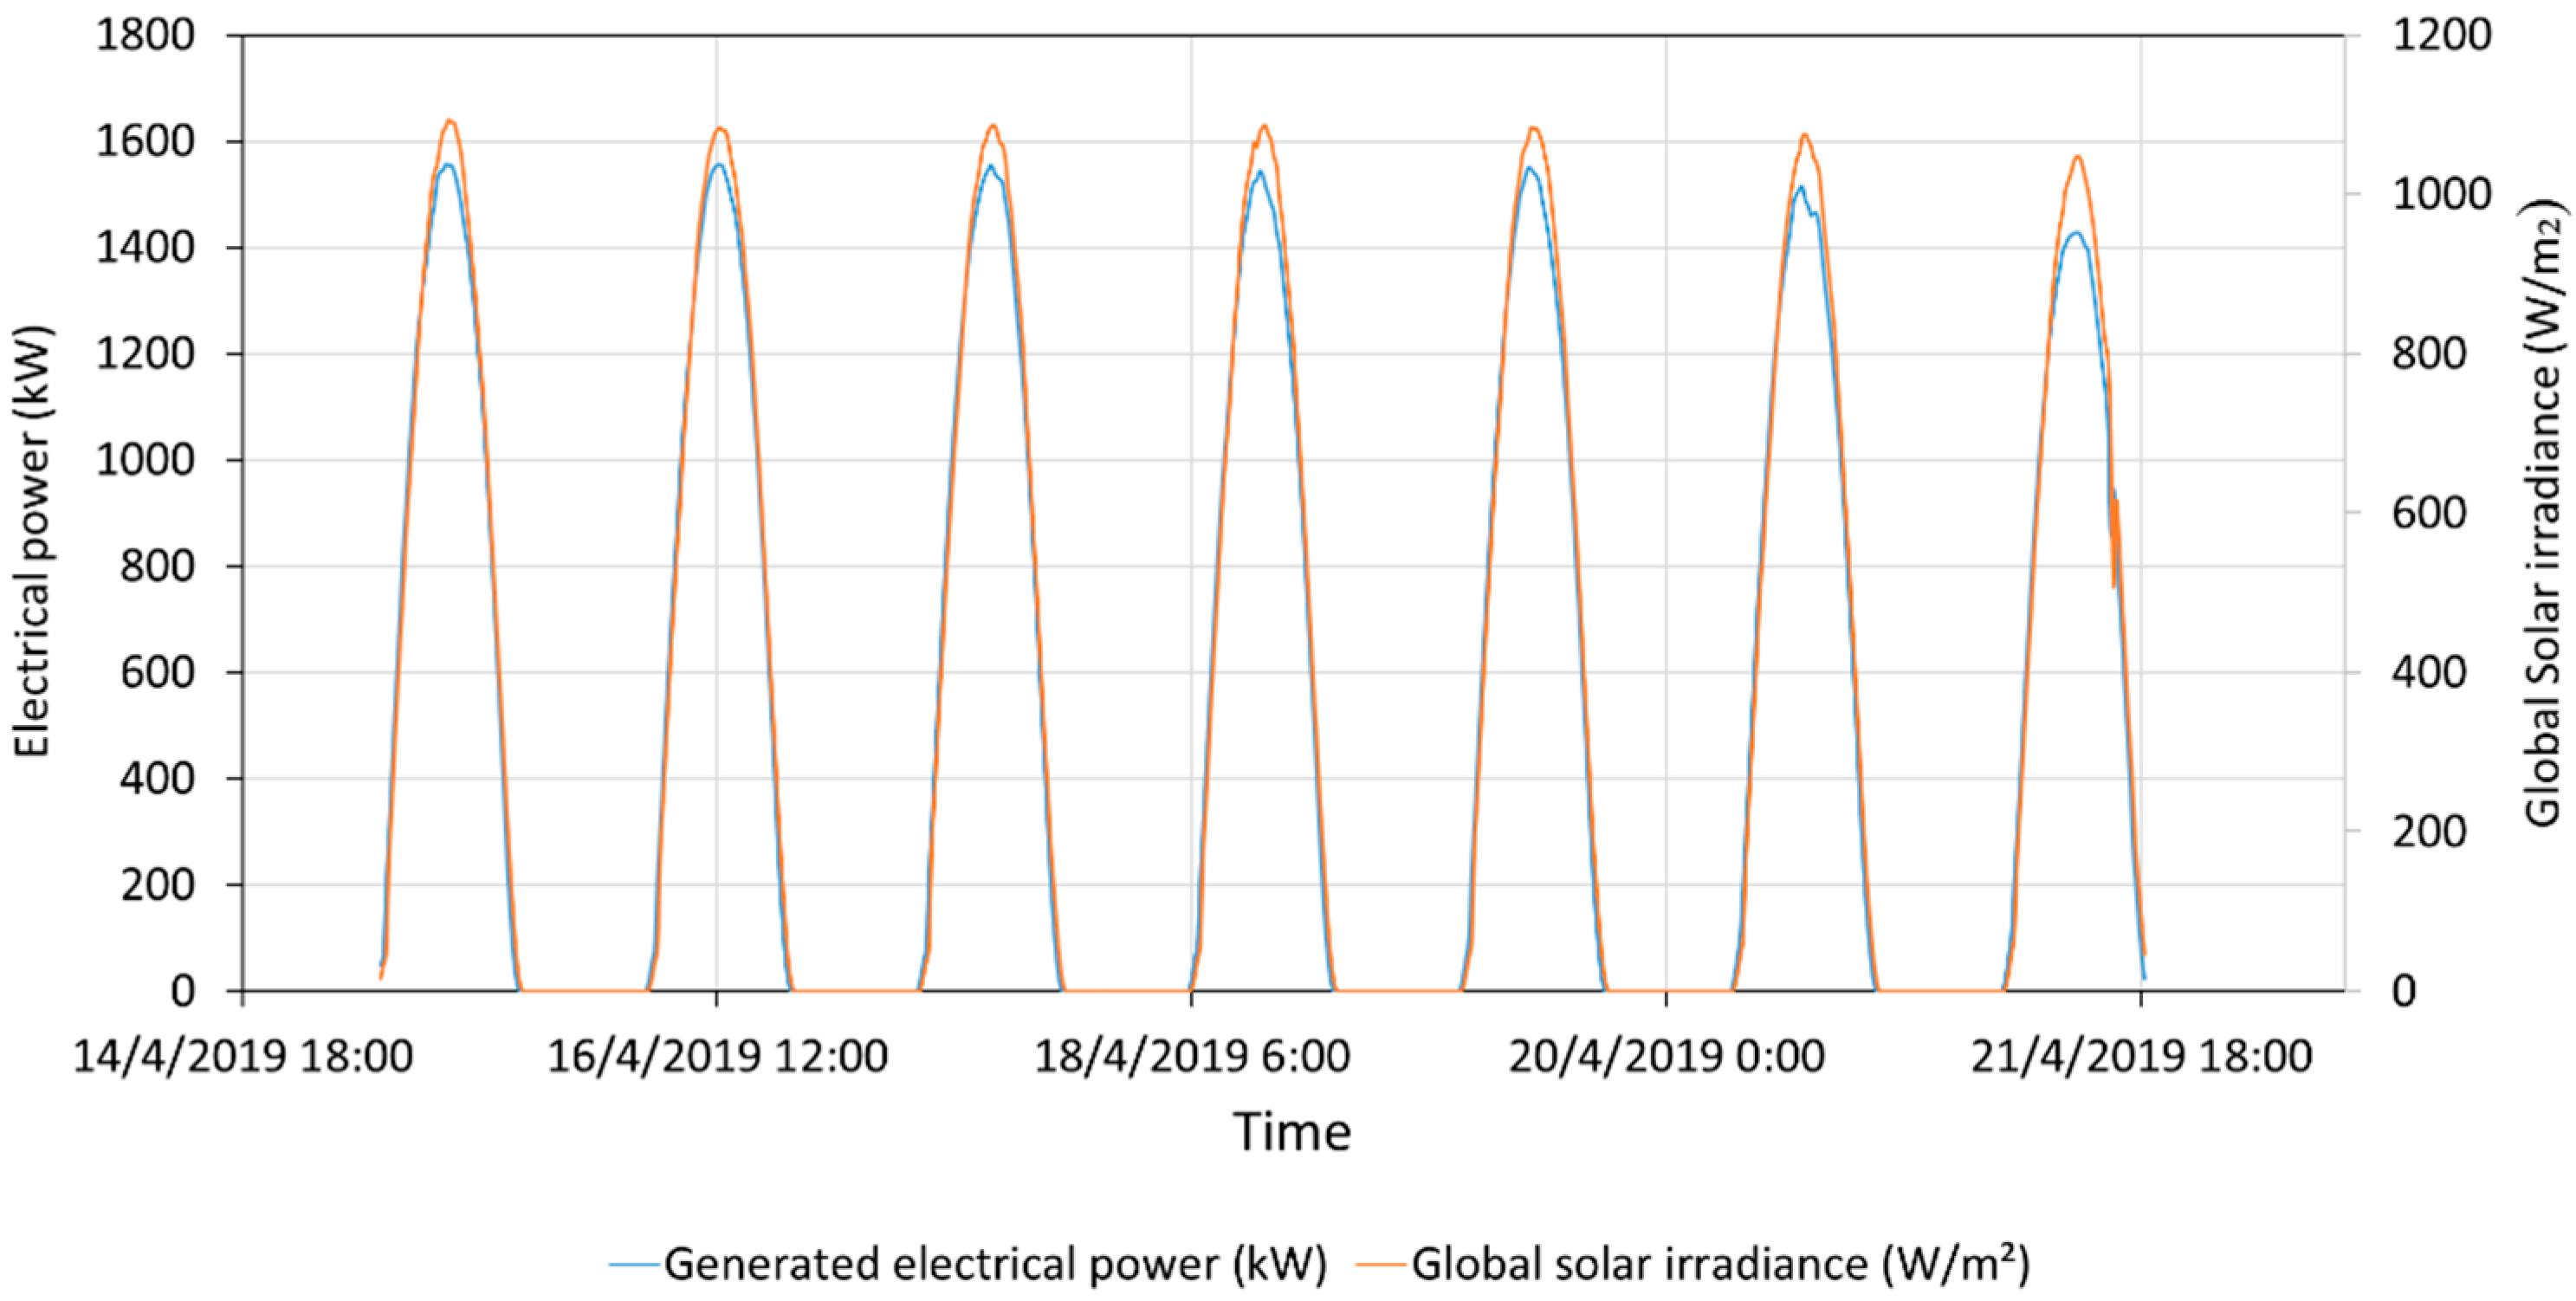
3.2. Electrical Performance
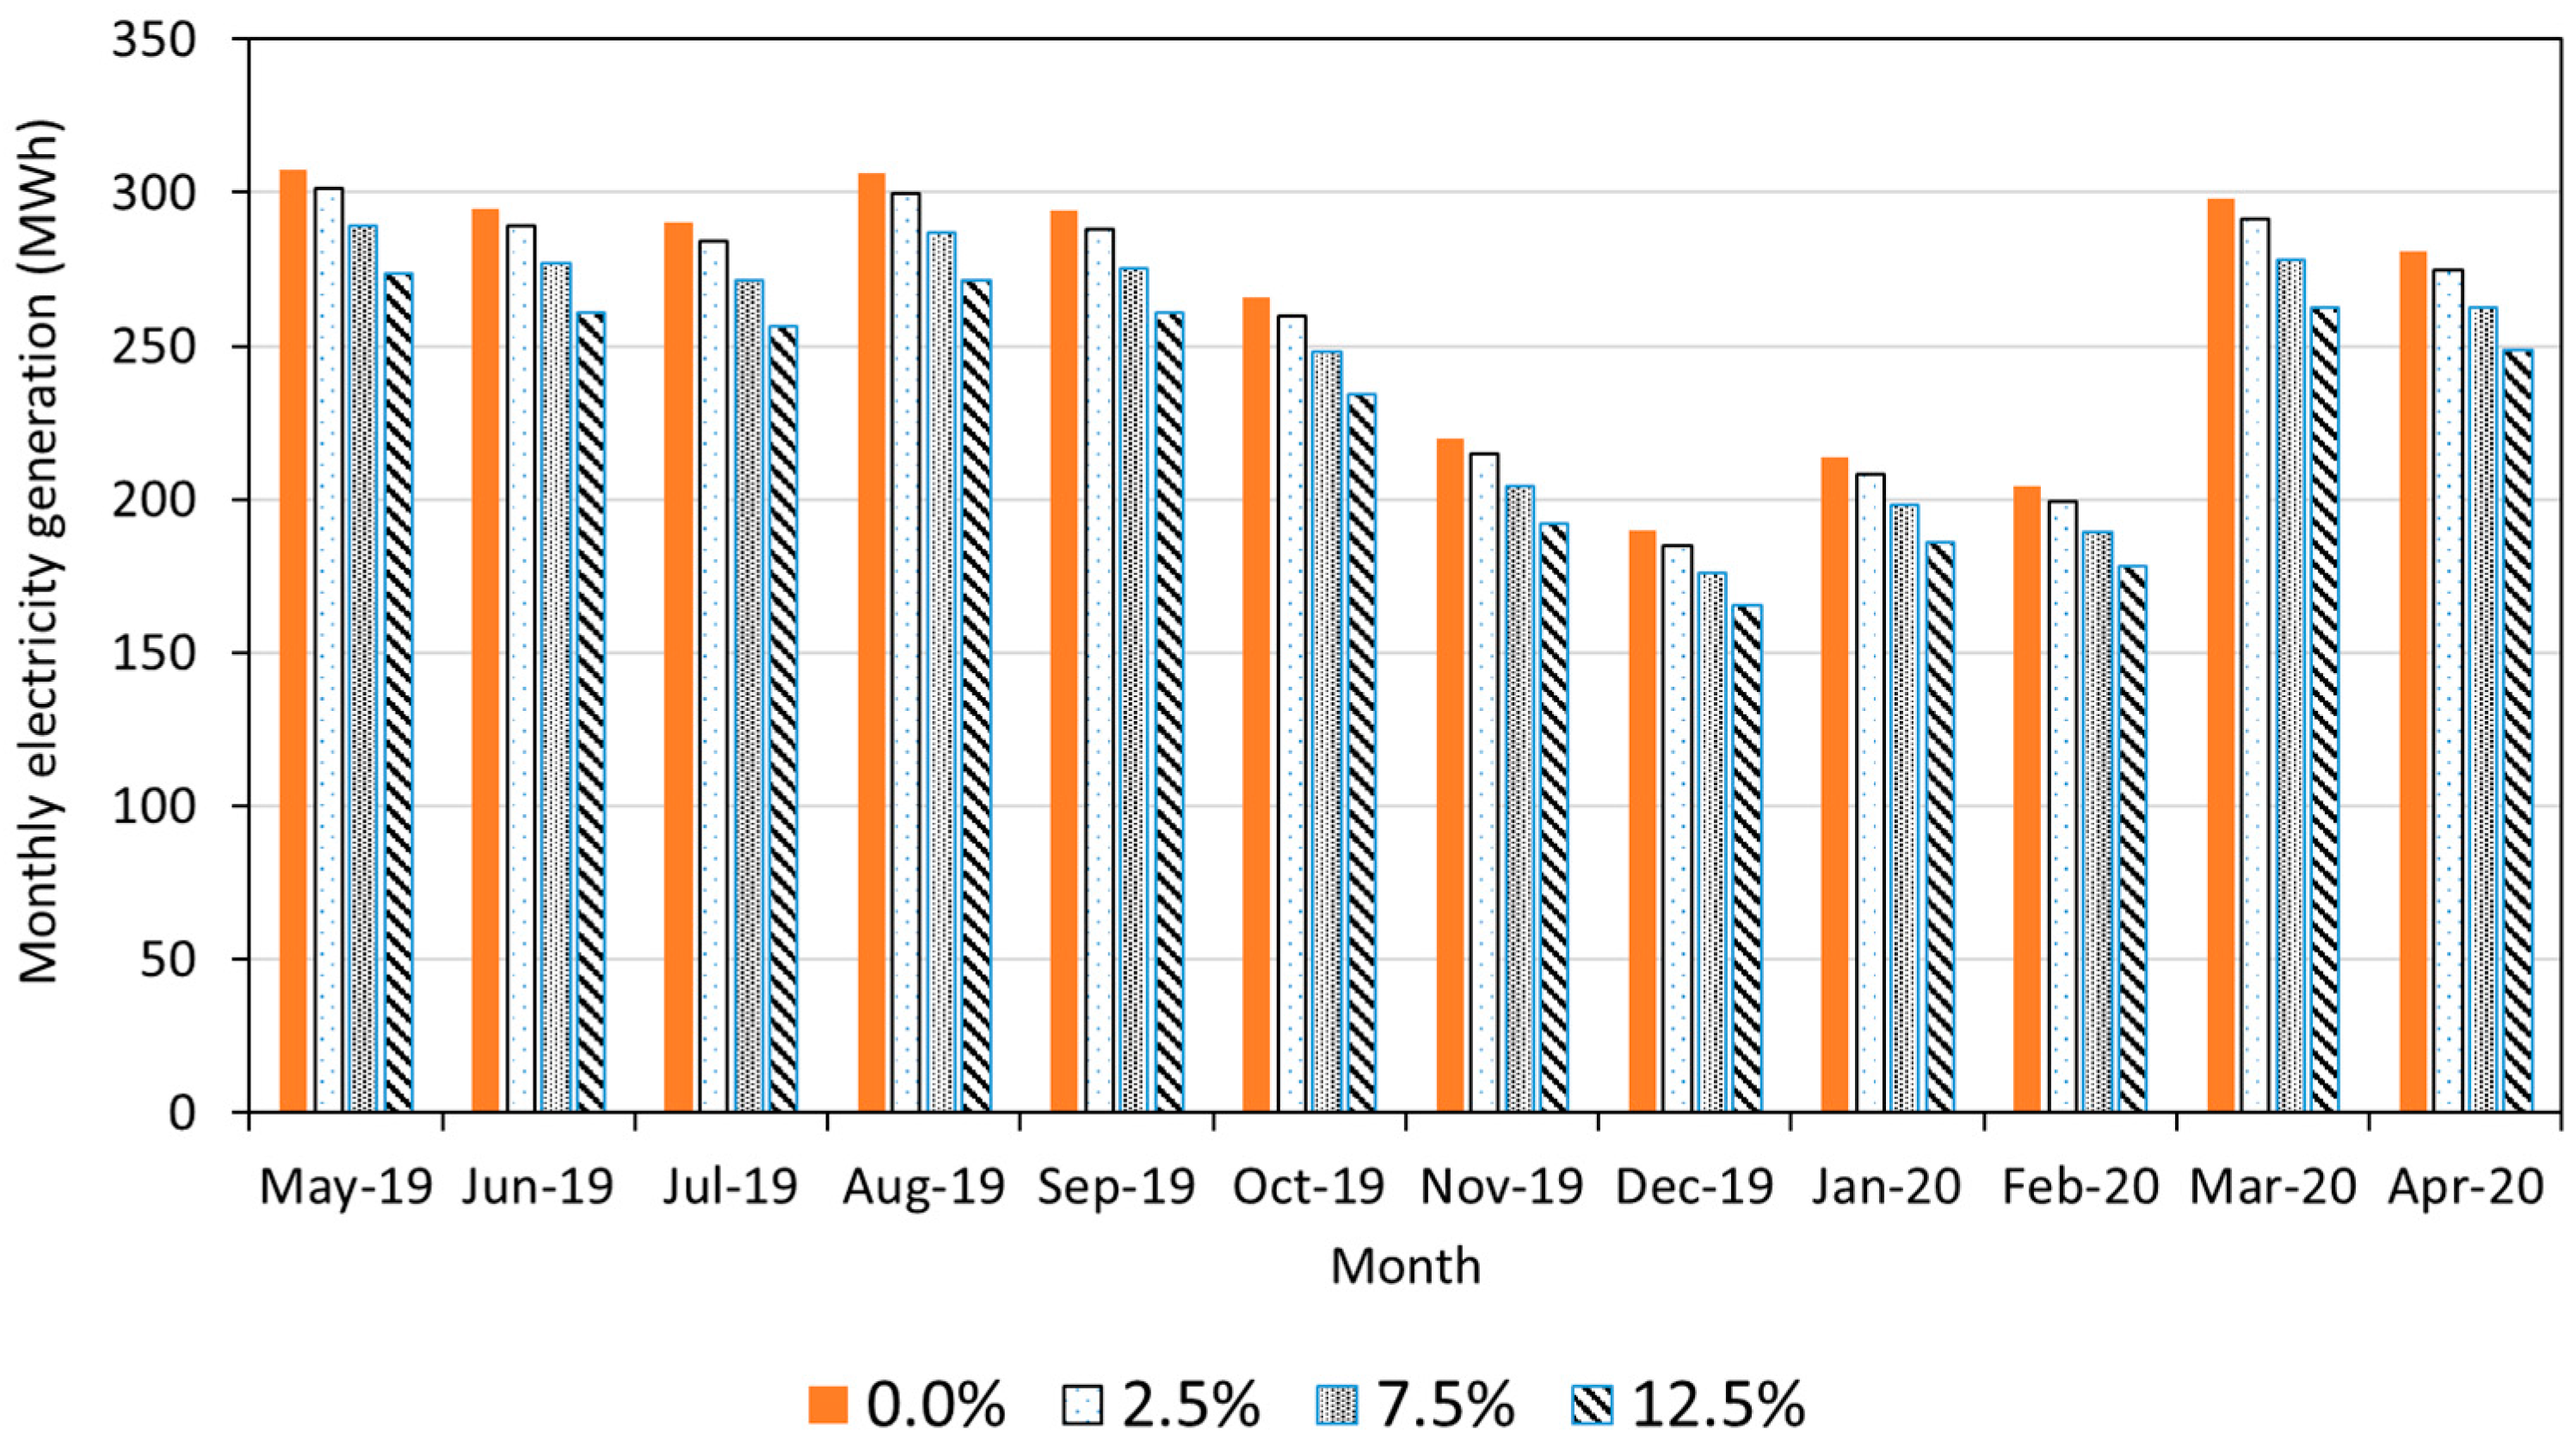
As mentioned earlier, the solar PV system is affected mainly by the solar irradiation, ambient temperature, the module temperature, wind direction, and speed. Hence, the studied system is assumed to have similar behavior under specific solar irradiation, where the deviation from this pattern is caused by both the weather conditions and the system conditions. In addition, the variation in the system performance might be referred mainly to the amount of solar irradiation reached to the PV. The electrical performance of the system in cleaned and dusty surface conditions were determined on 14 April 2019, and 12 May 2019, respectively. Figure 7 shows the power generated by the system versus the global solar irradiation. The relation between the electricity generation by the system and the incident global solar radiation on the system is approximated linearly, where the equation is shown in the same graph. Both lines show good fit to the measured electricity generation data, with a maximum difference of 100 kW and 40 kW for the cleaned and dusty day conditions, respectively.
For the cleaned system, the power production reached 1576 kW, for the case of high global solar irradiation (1140 W/m2), which shows that the cleaned system can reach up to 78.8% of the nominal capacity. In addition, power production by the system under the global solar irradiance of 1000 W/m2 was 76.1% of the nominal system capacity. On the other hand, for the dusty system, the power production reached 1322 kW under solar irradiance of 1096 W/m2, which is 66.1% of the nominal capacity. However, the power production by the system under the global solar irradiance of 1000 W/m2 was 57.5% of the nominal capacity, which shows a reduction of 18.6% compared to the cleaned system.
In order to find out whether the system is clean or dusty, upper and lower limits are defined. Figure 8 shows the daily actual electricity generation and the estimated upper and lower limits of electricity generation for the three days. It can be seen that the two days (26 April 2019, and 23 November 2018) are typical, clear sky days, where no abrupt fluctuation in the global solar irradiation was noticed. Figure 8a shows that the actual maximum electricity generation during the day is 1539 kWp, which indicates excellent performance of the system, and it is 97.6% compared to the upper limit, and this shows that the system is clean from dust. On the other hand, Figure 8b shows that the actual power generation is near to the lower limit and the maximum actual electricity generation during the day is 961 kWp, which is 61% compared to the upper limit; this shows a significant dust accumulation on the PV panels. Finally, the system performance was investigated in fluctuating solar irradiation, as shown in Figure 8c. The results show that the estimated upper and lower limits are well set-up to cover the actual energy generation during the day.

3.3. Effect of Dust

The effect of dust on the power production was investigated in this section. As shown in Figure 9, the dust accumulation on the module surfaces is significant in the location where the dust mainly locates on the lower corners of the modules. This dust accumulation will have two impacts: (1) reducing the amount of the solar irradiation reached to the solar cells, and (2) creating a partial shading to the modules.
In order to investigate the effect of dust on the power production; three intervals were studied; daily, weekly, and bi-weekly. Figure 10 shows the power production and the global solar irradiation in the period between 15 April 2019 and 21 April 2019. The period was selected taking a cleaned system on the 14 April 2019. As can be seen from the figure, the power generation reduced by 8.17% by the end of the period. However, it was not assured that the reduction was due to dust accumulation on the modules, because the maximum solar radiation also reduced by 4.43% by the end of the period.
In order to calculate the rate of reduction in the power generation due to dust, various levels of solar irradiance were taken to compare the power generation by cleaned and dusty panels. Table 5 and Table 6 show the maximum power generation at five different global solar irradiance levels for weekly and bi-weekly intervals, respectively. Table 5 shows a reduction in the power generation by more than 5% during the first two weeks. Further reduction in the power generation is noticed during weeks 4 and 5 by 30%, for all of the solar irradiance levels. The extended time intervals in Table 6 show higher effects of the dust on the power generation, where, by the end of the two-and-a-half months, the power generation could be reduced by 30% and 40% under the global solar irradiation of 1000 W/m2 and 200 W/m2, respectively. Readers can refer to [20] for dust composition and particle sizes available in the experiment location.

3.4. Parametric Study

Series of numerical calculations for the parameters of soiling and tilt angle have been conducted to investigate their effects on electricity generation. All of the calculations are conducted using the model that was validated earlier.
The model of the PV plant was run for various soiling percentages. The selected soling percentages are 2.5%, 7.5%, and 12.5%. It should be mentioned that the soiling is assumed homogeneous on the module surface where it will impact the electricity generation; Figure 11 shows the monthly electricity generation for the different soiling percentages. As can be seen, the higher the soiling accumulated on the PV, the lower the monthly electricity generation, where the 12.5% soiling accumulation scenario generates the lowest electrical generation. Because of the low solar radiation in December, the monthly electricity generation is the lowest, found to be 185 MWh, 175 MWh, and 165 MWh for soiling percentages of 2.5%, 7.5%, and 12.5%, respectively. In addition, the figure shows that the increase of 5% of soiling in the PV cannot be interpolated with the monthly electricity generation, as in May, the increase of soling from 2.5% to 7.5% decreases the electricity generation by 12.5 MWh, whereas the increase in soiling from 7.5% to 12.5% decreases the electricity generation by 15.5 MWh. This can be referred to the lower efficiency of PV due to low solar irradiance falling on the cells.
The effect of tilt angle of the PV modules on the monthly electricity generation was investigated using the validated simulation model. Table 7 presents the monthly electricity generation by the PV plant for 0°, 5°, 10°, 15°, and 23° tilt angles. These tilt angles were selected to compare the flat PV installation with the different tilt angles and with the optimum tilt angle (without considering shading) for the fixed-tilt PV in this specific location. The results show that the maximum monthly electricity generation is at the 0° tilt angle. In addition, the monthly electricity generation decreases with the increase of the tilt angle. The average difference of the monthly electricity generation by increasing the tilt angle from 0° to 5°, 5° to 10°, 10° to 15°, and 15° to 23° are 2.7, 1.2, 3.6, and 11.1 MWh, respectively. The main reason for the reduction is the duo-pitch canopy effect of the car park, where the 180° azimuth part of the car park generates lower electricity than the 0° azimuth part. In addition, this part of the car park (180° azimuth) causes shading to the other part for high tilt angles. In practical applications, the 0° tilted angle arrangement is not recommended due to the accumulation of dust and water during the rain, and the small tilt angle would be preferable to allow the dust and water to fall using the gravity during the rain. This phenomenon was studied previously and indicates that the higher tilted angle would increase the overall system efficiency [34]. Further experiments/investigations in future studies will be required.

4. Conclusions

The rapid decrease in the cost of PV systems in the last few years has attracted many companies to invest in this area. Due to the availability of high solar irradiation in the Middle East, high electricity generation from PV is expected. However, climatic conditions, such as dust and high temperatures, have high impacts on PV performance. In this study, the effects of soiling and tilt angle on the performance of a car park photovoltaic system (2.0 MWp) were analyzed for a specific location in the north of Oman. The results show that power generation was reduced by 4.8%, 18.1%, and 38.1% due to soiling after one week, three weeks, and five weeks of operation, respectively. It was also found that a soiling percentage of 7.5% and 12.5% could reduce the monthly electricity generation from 307.2 MWh to 289.7 MWh and 274.0 MWh respectively. In addition, the duo-pitch car park canopy structure is considered more complicated, in terms of the optimum tilt angle, due to the two different inclined shed surfaces, where one part of the car park (180° azimuth) caused shading to the other part (0° azimuth) for high tilt angles. It was found that increasing the tilted angle increases the electrical generation, where dust accumulation is reduced due to both gravity and proper rain drain. Further analysis needs to be done on the short and long impacts of dust on individual modules, and the effects of various cleaning methods on the increase of generated electricity, and methods for maximization.

Author Contributions

I.A.S. conceived, designed, and performed the experiments; I.A.S. and A.A.M. analyzed the data; I.A.S. wrote the paper, A.A.S. and S.K. supervised the work and reviewed the paper. All authors have read and agreed to the published version of the manuscript.

Funding

This research received no external funding.

Institutional Review Board Statement

Not applicable.

Informed Consent Statement

Not applicable.

Data Availability Statement

Not applicable.

Acknowledgments

The authors would like to thank Petroleum development Oman Company for allowing and providing the solar plant details and the results for this study.

Conflicts of Interest

The authors declare no conflict of interest.

References

  1. Kazem, H.A. Renewable energy in Oman: Status and future prospects. Renew. Sustain. Energy Rev. 2011, 15, 3465–3469. [Google Scholar] [CrossRef]
  2. Ellabban, O.; Abu-Rub, H.; Blaabjerg, F. Renewable energy resources: Current status, future prospects and their enabling technology. Renew. Sustain. Energy Rev. 2014, 39, 748–764. [Google Scholar] [CrossRef]
  3. Singh, T.; Hussien, M.A.A.A.; Al-Ansari, T.; Saoud, K.; McKay, G. Critical review of solar thermal resources in GCC and application of nanofluids for development of efficient and cost effective CSP technologies. Renew. Sustain. Energy Rev. 2018, 91, 708–719. [Google Scholar] [CrossRef]
  4. Alnaser, W.E.; Alnaser, N.W. The status of renewable energy in the GCC countries. Renew. Sustain. Energy Rev. 2011, 15, 3074–3098. [Google Scholar] [CrossRef]
  5. Mahdi, A.M.J.; Reza, K.S.; Kadhem, J.A.; Al-waeli, A.A.K.; Al-Asadi, K.A.H.; Kadhem, A.H. The Effect of Iraqi Climate Variables on the Performance of Photovoltaic Modules. Int. J. Sci. Eng. Sci. 2017, 1, 7–12. [Google Scholar]
  6. Charabi, Y.; Gastli, A. Integration of temperature and dust effects in siting large PV power plant in hot arid area. Renew. Energy 2013, 57, 635–644. [Google Scholar] [CrossRef]
  7. Kazem, H.A.; Chaichan, M.T. Effect of environmental variables on photovoltaic performance-based on experimental studies. Int. J. Civ. Mech. Energy Sci. (IJCMES) 2016, 2, 1–8. [Google Scholar]
  8. Al Siyabi, I.; Khanna, S.; Sundaram, S.; Mallick, T. Experimental and Numerical Thermal Analysis of Multi-Layered Microchannel Heat Sink for Concentrating Photovoltaic Application. Energies 2019, 12, 122. [Google Scholar] [CrossRef] [Green Version]
  9. Radziemska, E. The effect of temperature on the power drop in crystalline silicon solar cells. Renew. Energy 2003, 28, 1–12. [Google Scholar] [CrossRef]
  10. Hong, H.-F.; Huang, T.-S.; Chiang, M.-H.; Shih, Z.-H. Degradation mechanism of concentrator solar receivers without protection layer. Microelectron. Reliab. 2013, 53, 1927–1932. [Google Scholar] [CrossRef]
  11. Micheli, L.; Sarmah, N.; Luo, X.; Reddy, K.S.; Mallick, T.K. Opportunities and challenges in micro- and nano-technologies for concentrating photovoltaic cooling: A review. Renew. Sustain. Energy Rev. 2013, 20, 595–610. [Google Scholar] [CrossRef]
  12. Al Siyabi, I.; Khanna, S.; Mallick, T.; Sundaram, S. Multiple Phase Change Material (PCM) Configuration for PCM-Based Heat Sinks—An Experimental Study. Energies 2018, 11, 1629. [Google Scholar] [CrossRef] [Green Version]
  13. Anderson, W.G.; Dussinger, P.M.; Sarraf, D.B.; Tamanna, S. Heat pipe cooling of concentrating photovoltaic cells. In Proceedings of the 2008 33rd IEEE Photovoltaic Specialists Conference, San Diego, CA, USA, 11–16 May 2008; pp. 1–6. [Google Scholar] [CrossRef]
  14. Lee, D.Y.; Vafai, K. Comparative analysis of jet impingement and microchannel cooling for high heat flux applications. Int. J. Heat Mass Transf. 1999, 42, 1555–1568. [Google Scholar] [CrossRef]
  15. Han, X.; Wang, Y.; Zhu, L. Electrical and thermal performance of silicon concentrator solar cells immersed in dielectric liquids. Appl. Energy 2011, 88, 4481–4489. [Google Scholar] [CrossRef]
  16. Al Siyabi, I.; Khanna, S.; Mallick, T.; Sundaram, S. Electricity enhancement and thermal energy production from concentrated photovoltaic integrated with a 3-layered stacked micro-channel heat sink. AIP Conf. Proc. 2018, 080001. [Google Scholar] [CrossRef]
  17. Csavina, J.; Field, J.; Félix, O.; Corral-Avitia, A.Y.; Sáez, A.E.; Betterton, E.A. Effect of wind speed and relative humidity on atmospheric dust concentrations in semi-arid climates. Sci. Total Environ. 2014, 487, 82–90. [Google Scholar] [CrossRef] [Green Version]
  18. Duffie, J.A.; Beckman, W.A. Solar Engineering of Thermal Processes; John Wiley & Sons: Hoboken, NJ, USA, 1976. [Google Scholar]
  19. Kazem, H.A.; Chaichan, M.T. Effect of humidity on photovoltaic performance based on experimental study. Int. J. Appl. Eng. Res. 2015, 10, 43572–43577. [Google Scholar]
  20. Kazem, H.A.; Chaichan, M.T. The effect of dust accumulation and cleaning methods on PV panels’ outcomes based on an experimental study of six locations in Northern Oman. Sol. Energy 2019, 187, 30–38. [Google Scholar] [CrossRef]
  21. Goossens, D.; Lundholm, R.; Goverde, H.; Govaerts, J. Effect of soiling on wind-induced cooling of photovoltaic modules and consequences for electrical performance. Sustain. Energy Technol. Assess. 2019, 34, 116–125. [Google Scholar] [CrossRef]
  22. Ahmed, Z.; Kazem, H.A.; Sopian, K. Effect of Dust on Photovoltaic Performance: Review and Research Status. Latest Trends Renew. Energy Environ. Inform. 2013, 193–199. [Google Scholar]
  23. Darwish, Z.A.; Kazem, H.A.; Sopian, K.; Al-Goul, M.A.; Alawadhi, H. Effect of dust pollutant type on photovoltaic performance. Renew. Sustain. Energy Rev. 2015, 41, 735–744. [Google Scholar] [CrossRef]
  24. Kaldellis, J.K.; Kapsali, M. Simulating the dust effect on the energy performance of photovoltaic generators based on experimental measurements. Energy 2011, 36, 5154–5161. [Google Scholar] [CrossRef]
  25. Vaishak, S.; Bhale, P.V. Effect of dust deposition on performance characteristics of a refrigerant based photovoltaic/thermal system. Sustain. Energy Technol. Assess. 2019, 36. [Google Scholar] [CrossRef]
  26. Tanesab, J.; Parlevliet, D.; Whale, J.; Urmee, T. The effect of dust with different morphologies on the performance degradation of photovoltaic modules. Sustain. Energy Technol. Assess. 2019, 31, 347–354. [Google Scholar] [CrossRef]
  27. Menoufi, K. Dust accumulation on the surface of photovoltaic panels: Introducing the Photovoltaic Soiling Index (PVSI). Sustainability 2017, 9, 963. [Google Scholar] [CrossRef] [Green Version]
  28. Said, S.A.M.; Walwil, H.M. Fundamental studies on dust fouling effects on PV module performance. Sol. Energy 2014, 107, 328–337. [Google Scholar] [CrossRef]
  29. Gholami, A.; Khazaee, I.; Eslami, S.; Zandi, M.; Akrami, E. Experimental investigation of dust deposition effects on photo-voltaic output performance. Sol. Energy 2018, 159, 346–352. [Google Scholar] [CrossRef]
  30. Rahman, M.M.; Islam, M.A.; Karim, A.H.M.Z.; Ronee, A.H. Effects of Natural Dust on the Performance of PV Panels in Bangladesh. Int. J. Mod. Educ. Comput. Sci. 2012, 4, 26–32. [Google Scholar] [CrossRef]
  31. Javed, W.; Wubulikasimu, Y.; Figgis, B.; Guo, B. Characterization of dust accumulated on photovoltaic panels in Doha, Qatar. Sol. Energy 2017, 142, 123–135. [Google Scholar] [CrossRef]
  32. Al-Badi, A. Performance assessment of 20.4 kW eco-house grid-connected PV plant in Oman. Int. J. Sustain. Eng. 2020, 13, 230–241. [Google Scholar] [CrossRef]
  33. Herbazi, R.; Amechnoue, K.; Khouya, A.; Chahboun, A.; Diani, M.; Louzazni, M.; Addou, M. Performance evaluation and analysis of polycrystalline photovoltaic plant located in Northern Morocco. Int. J. Ambient Energy 2019, 1–7. [Google Scholar] [CrossRef]
  34. Debnath, S.; Das, B.; Randive, P.R.; Pandey, K.M. Performance analysis of solar air collector in the climatic condition of North Eastern India. Energy 2018, 165, 281–298. [Google Scholar] [CrossRef]
  35. Manoj Kumar, N.; Sudhakar, K.; Samykano, M. Techno-economic analysis of 1 MWp grid connected solar PV plant in Malaysia. Int. J. Ambient Energy 2019, 40, 434–443. [Google Scholar] [CrossRef]
  36. Al-Housani, M.; Bicer, Y.; Koç, M. Experimental investigations on PV cleaning of large-scale solar power plants in desert climates: Comparison of cleaning techniques for drone retrofitting. Energy Convers. Manag. 2019, 185, 800–815. [Google Scholar] [CrossRef]
  37. Umer, F.; Aslam, M.S.; Rabbani, M.S.; Hanif, M.J.; Naeem, N.; Abbas, M.T. Design and optimization of solar carport canopies for maximum power generation and efficiency at Bahawalpur. Int. J. Photoenergy 2019, 2019. [Google Scholar] [CrossRef] [Green Version]
  38. De Miguel, A.; Bilbao, J.; Aguiar, R.; Kambezidis, H.; Negro, E. Diffuse solar irradiation model evaluation in the North Mediterranean Belt area. Sol. Energy 2001, 70, 143–153. [Google Scholar] [CrossRef]
  39. Bilbao, J.; de Miguel, A.H.; Kambezidis, H.D. Air temperature model evaluation in the north Mediterranean belt area. J. Appl. Meteorol. 2002, 41, 872–884. [Google Scholar] [CrossRef]
  40. Baghdadi, I.; El Yaakoubi, A.; Attari, K.; Leemrani, Z.; Asselman, A. Performance investigation of a PV system connected to the grid. Procedia Manuf. 2018, 22, 667–674. [Google Scholar] [CrossRef]
  41. Attari, K.; Elyaakoubi, A.; Asselman, A. Performance analysis and investigation of a grid-connected photovoltaic installation in Morocco. Energy Rep. 2016, 2, 261–266. [Google Scholar] [CrossRef] [Green Version]
  42. Adaramola, M.S.; Vågnes, E.E.T. Preliminary assessment of a small-scale rooftop PV-grid tied in Norwegian climatic conditions. Energy Convers. Manag. 2015, 90, 458–465. [Google Scholar] [CrossRef]
  43. Al-Otaibi, A.; Al-Qattan, A.; Fairouz, F.; Al-Mulla, A. Performance evaluation of photovoltaic systems on Kuwaiti schools’ rooftop. Energy Convers. Manag. 2015, 95, 110–119. [Google Scholar] [CrossRef]
  44. Kymakis, E.; Kalykakis, S.; Papazoglou, T.M. Performance analysis of a grid connected photovoltaic park on the island of Crete. Energy Convers. Manag. 2009, 50, 433–438. [Google Scholar] [CrossRef]
  45. Shiva Kumar, B.; Sudhakar, K. Performance evaluation of 10 MW grid connected solar photovoltaic power plant in India. Energy Rep. 2015, 1, 184–192. [Google Scholar] [CrossRef] [Green Version]
  46. Ayompe, L.M.; Duffy, A.; McCormack, S.J.; Conlon, M. Measured performance of a 1.72 kW rooftop grid connected photovoltaic system in Ireland. Energy Convers. Manag. 2011, 52, 816–825. [Google Scholar] [CrossRef] [Green Version]
  47. Hay, J.E. Calculation of monthly mean solar radiation for horizontal and inclined surfaces. Sol. Energy 1979, 23, 301–307. [Google Scholar] [CrossRef]
  48. Badescu, V. (Ed.) Modeling Solar Radiation at the Earth’s Surface: Recent Advances; Springer: Berlin/Heidelberg, Germany, 2008. [Google Scholar] [CrossRef]
  49. Segev, G.; Mittelman, G.; Kribus, A. Equivalent circuit models for triple-junction concentrator solar cells. Sol. Energy Mater. Sol. Cells 2012, 98, 57–65. [Google Scholar] [CrossRef]
  50. Radziemska, E.; Klugmann, E. Thermally affected parameters of the current-voltage characteristics of silicon photocell. Energy Convers. Manag. 2002, 43, 1889–1900. [Google Scholar] [CrossRef]
Figure 1. Types of car park roof structures (a) duo-pitch canopy and (b) mono-pitch canopy.
Energies 14 00659 g001
Figure 2. (a) Module string single line diagram; (b) schematic of the studied system; and (c) typical PV module installation.
Energies 14 00659 g002
Figure 3. Schematic of the experimental outputs.
Energies 14 00659 g003
Figure 4. I-V curves for the selected module under various solar irradiation levels.
Energies 14 00659 g004
Figure 5. The predicted and the actual electricity generation in MWh.
Energies 14 00659 g005
Figure 6. Actual global solar irradiation and the ambient temperature during the longest day (19 June 2019) and the shortest day (21 December 2019) in Muscat.
Energies 14 00659 g006
Figure 7. Global solar irradiation versus electrical power for the PV plant.
Energies 14 00659 g007
Figure 8. The daily actual electrical generation and the estimated upper and lower electrical generation on (a) 26 April 2019, (b) 23 November 2018, (c) 23 May 2019.
Energies 14 00659 g008
Figure 9. Photograph of partial section of the modules showing the high dust accumulation.
Energies 14 00659 g009
Figure 10. The power generation and the global solar irradiation in the period between 15 April 2019 and 21 April 2019.
Energies 14 00659 g010
Figure 11. Effect of the soiling percentage on the monthly electricity generation.
Energies 14 00659 g011
Table 1. Electrical characteristics of JAP6-72-320/4BB photovoltaic (PV) module.
SpecificationValue
Maximum power (Wp)320
Cell typePoly
Maximum power voltage (V)37.38
Maximum power current (A)9.06
Open circuit voltage, Voc (V)46.22
Short circuit current, Isc (A)8.56
Module efficiency (%)16.51
Temperature coefficient of short circuit current (%/°C)0.058
Temperature coefficient of open circuit voltage (%/°C)−0.330
Temperature coefficient of maximum power (%/°C)−0.410
Number of cells72
Module area (m2)1.938
Table 2. Specifications for SUNNY TRIPOWER 60 invertor.
SpecificationValue
Maximum efficiency (%)98.8
DC input data
Maximum Direct current (DC) power (W)90,000
Maximum DC voltage (V)1000
Alternate current (AC) output data
Maximum AC power (W)60,000
AC voltage range (V)360 to 530
Table 3. Measuring instruments details.
ItemManufacturerModelAccuracy
Calibrated cellAtersa-±2%
PyranometerGeonicaGEO-SR20±5 W/m2
Ambient temperature sensorGeonicaSTH-S331±0.1 °C
Relative humidity sensorGeonicaSTH-S331±0.8% RH
Wind speed sensorGeonica03002±0.5 m/s
Wind direction sensorGeonica03002±5°
Table 4. The list of the measured parameters.
Logging SystemParameter
Weather station
  • Ambient temperature
  • Wind speed
  • Wind direction
  • Global solar irradiation
Solar system
  • Total power AC
  • Invertor power AC
  • Total power (kWh)
Table 5. Power generation under different solar irradiance with weekly intervals.
Global Solar Irradiance (W/m2)Maximum Power Generation (kW)
15 April 20191 Week
21 April 2019
2 Weeks
28 April 2019
3 Weeks
5 May 2019
4 Weeks
12 May 2019
5 Weeks
19 May 2019
100014601390140511961155904
8001227114811509671071918
600935870861725684669
400642599630408470465
200329306353248234235
Table 6. Power generation under different solar irradiance with bi-weekly intervals.
Global Solar Irradiance (W/m2)Maximum Power Generation (kW)
15 April 20190.5 Month
1 May 2019
1 Month
15 May 2019
1.5 Month
1 June 2019
2 Months
15 June 2019
2.5 Months
1 July 2019
1000146013631181117711481008
80012271136935988922806
600935886699755626553
400642406498514476346
200329333235251211195
Table 7. The monthly electricity generation under different tilt angles.
MonthMonthly Electricity Generation (MWh)
10°15°23°
May 19286.29283.10284.28280.53270.62
June 19273.71270.69271.60267.77258.15
July 19267.90265.15266.29262.69253.15
August 19283.17280.09281.33277.41266.48
September 19271.77268.87270.28266.38254.33
October 19244.79241.88243.28239.25225.97
November 19201.51198.99200.11196.48184.06
December 19173.47171.19172.11169.06158.11
January 20195.26192.81193.94190.61178.52
February 20186.33184.33185.50182.53172.52
March 20274.18271.21272.69268.51255.26
April 20259.02256.36257.71254.29244.18
Publisher’s Note: MDPI stays neutral with regard to jurisdictional claims in published maps and institutional affiliations.

