
A Comparison of Alternative Fuels for Shipping in Terms of Lifecycle Energy and Cost


Abstract
:
1. Introduction
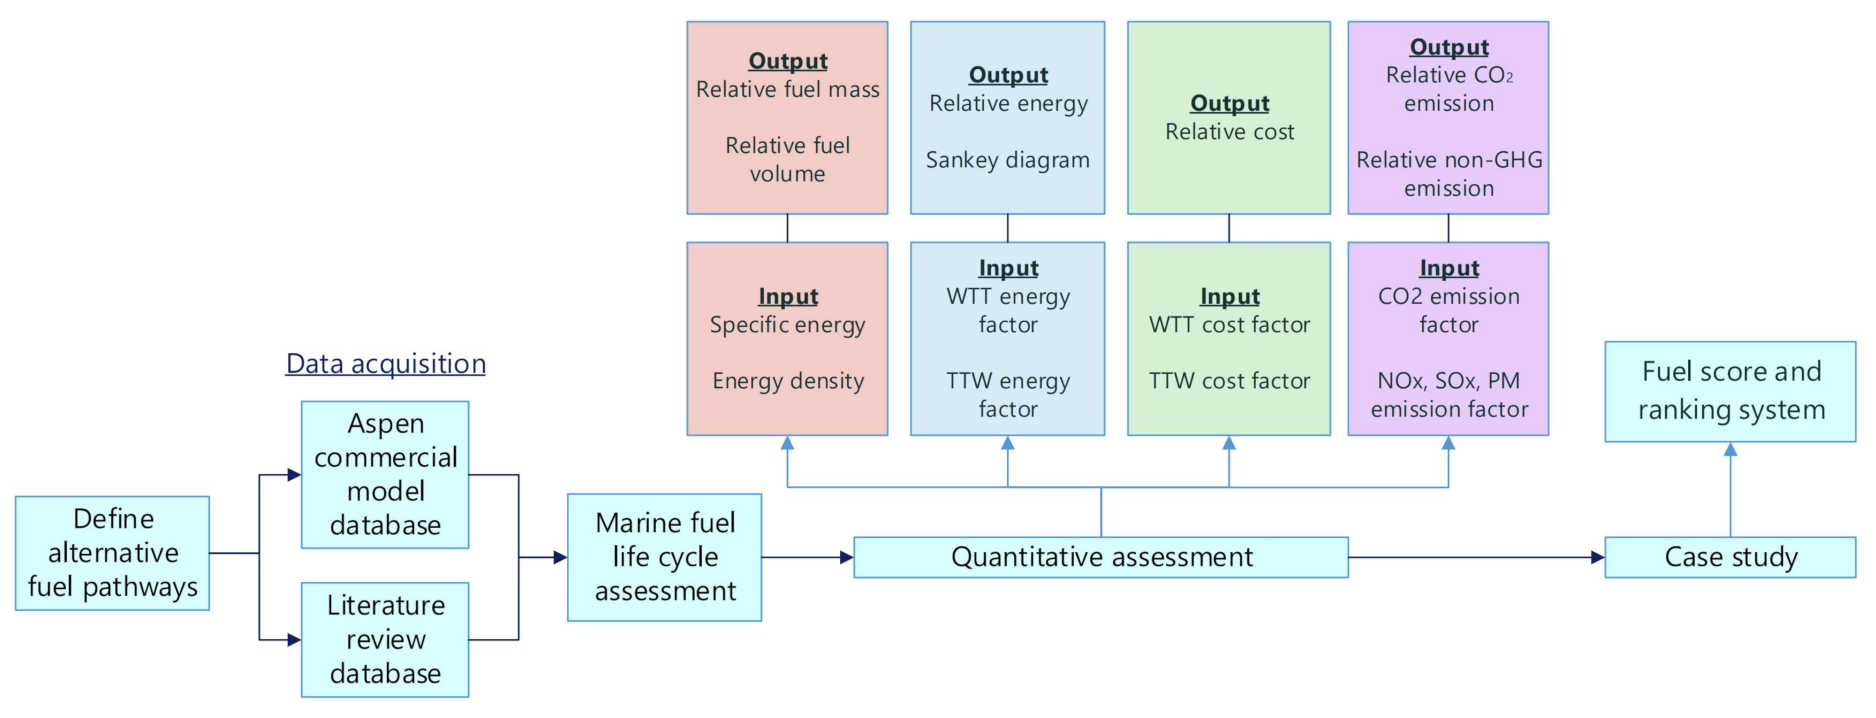
2. Methods
- High specific energy (kJ/kg) and energy density (kJ/m3) for low fuel mass and storage volume.
- Less energy intensiveness and lower fuel production cost for a cost-competitive fuel.
- Low life cycle GHG emissions (g CO2e/kJ) and the ability to achieve 50% carbon reduction by 2050.
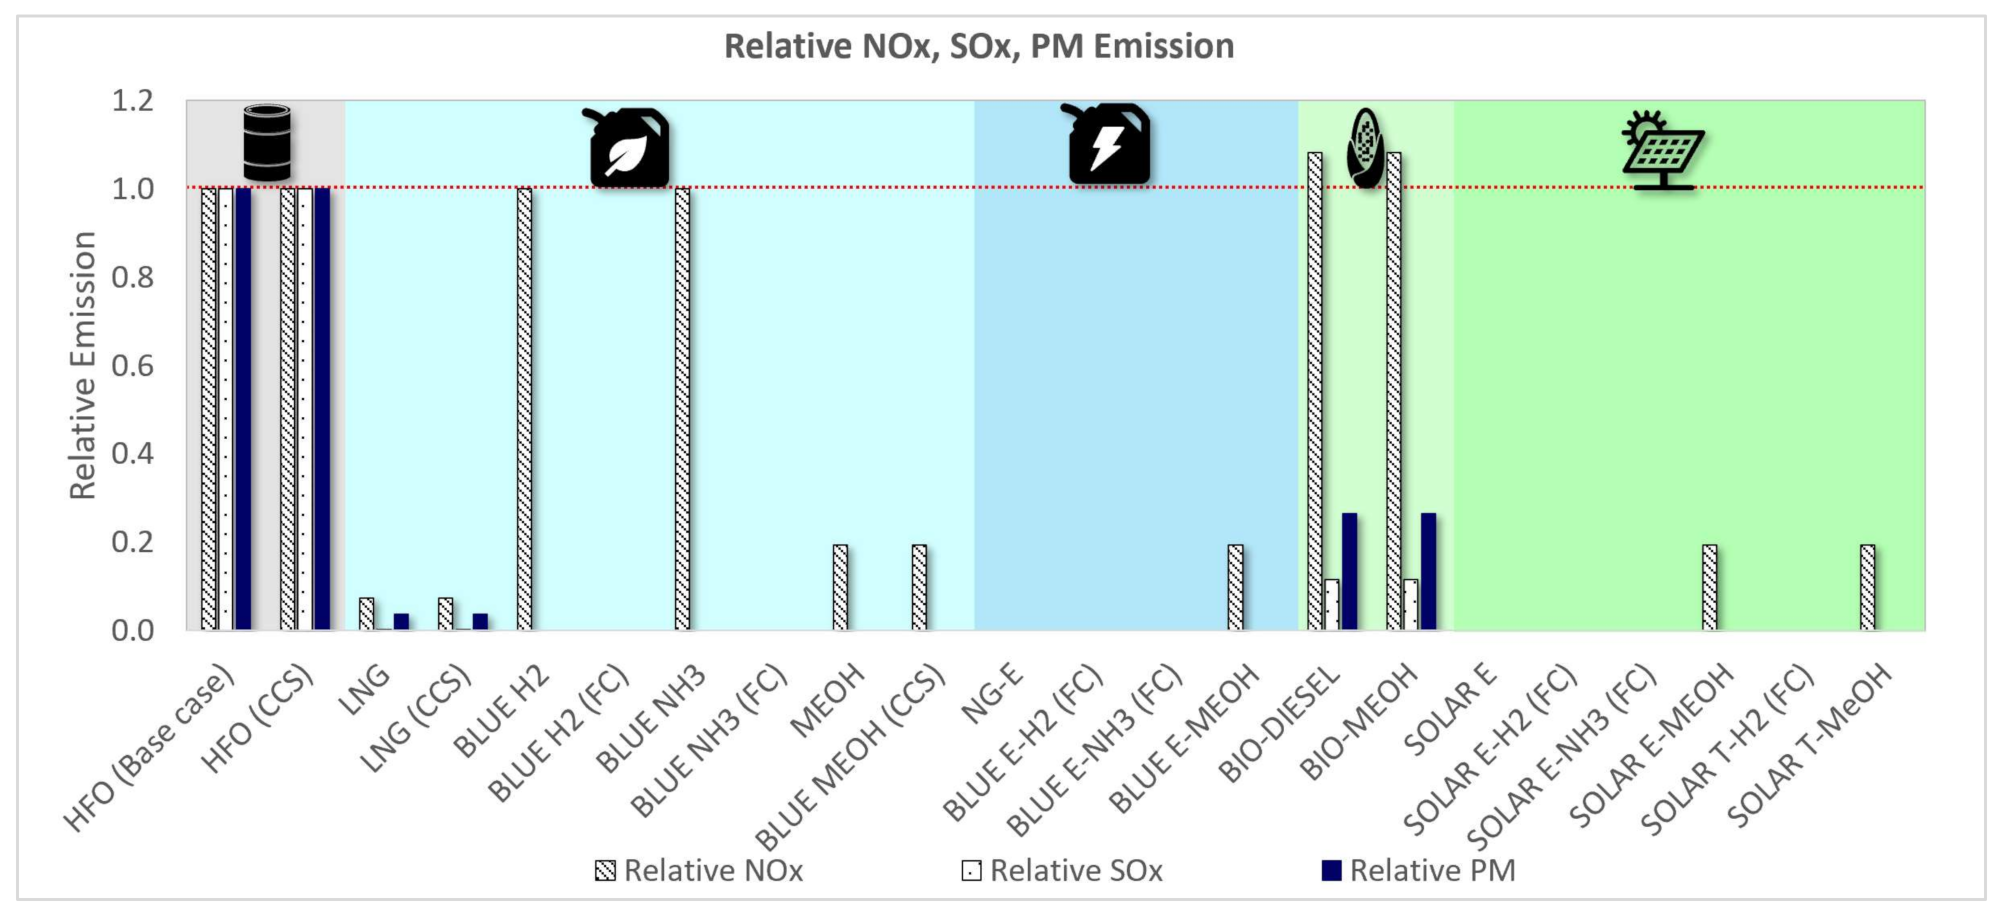
- Low non-GHG emissions (NOx, SOx, PM) to comply with IMO ECA regulations.
- Fuel is scalable to meet the additional demand from shipping apart of the existing industry demand.
- Fuel is safe to be used onboard with narrow flammability range, non-toxicity, non-corrosiveness, and availability of rules and regulations for onboard application.
- Mature technology including bunkering infrastructure, an energy converter, and fuel production facilities.
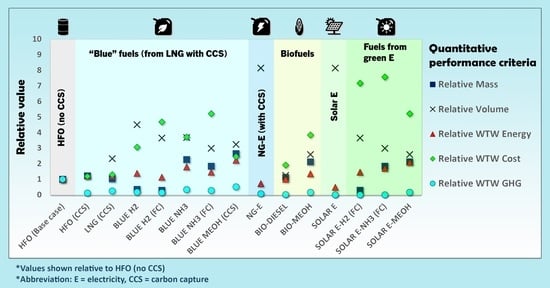
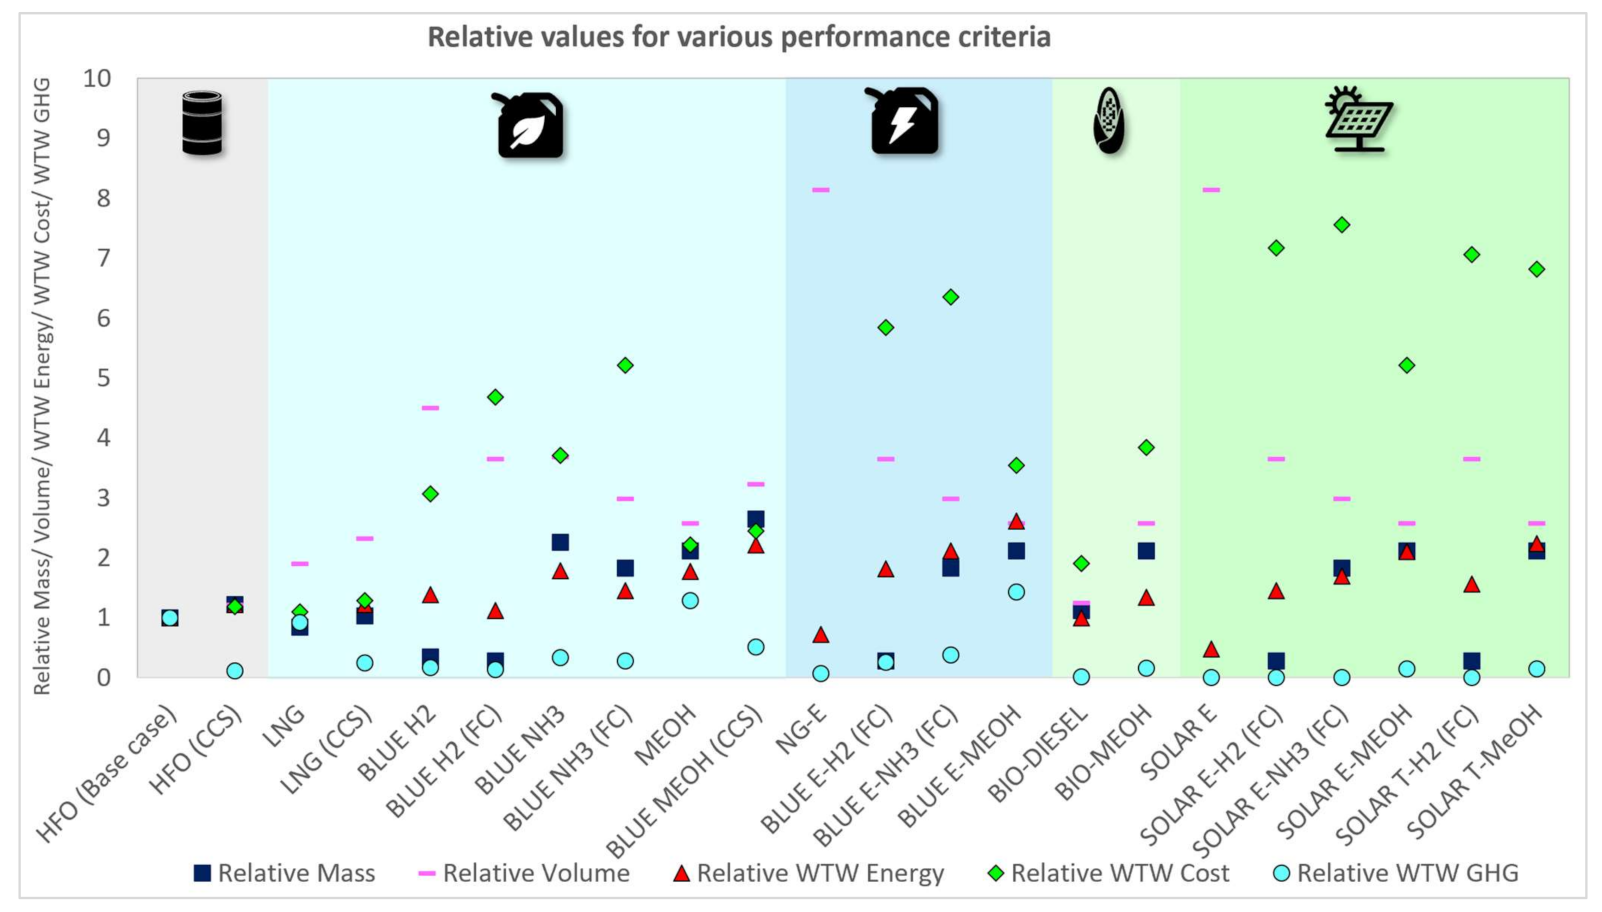
- Relative mass.
- Relative volume.
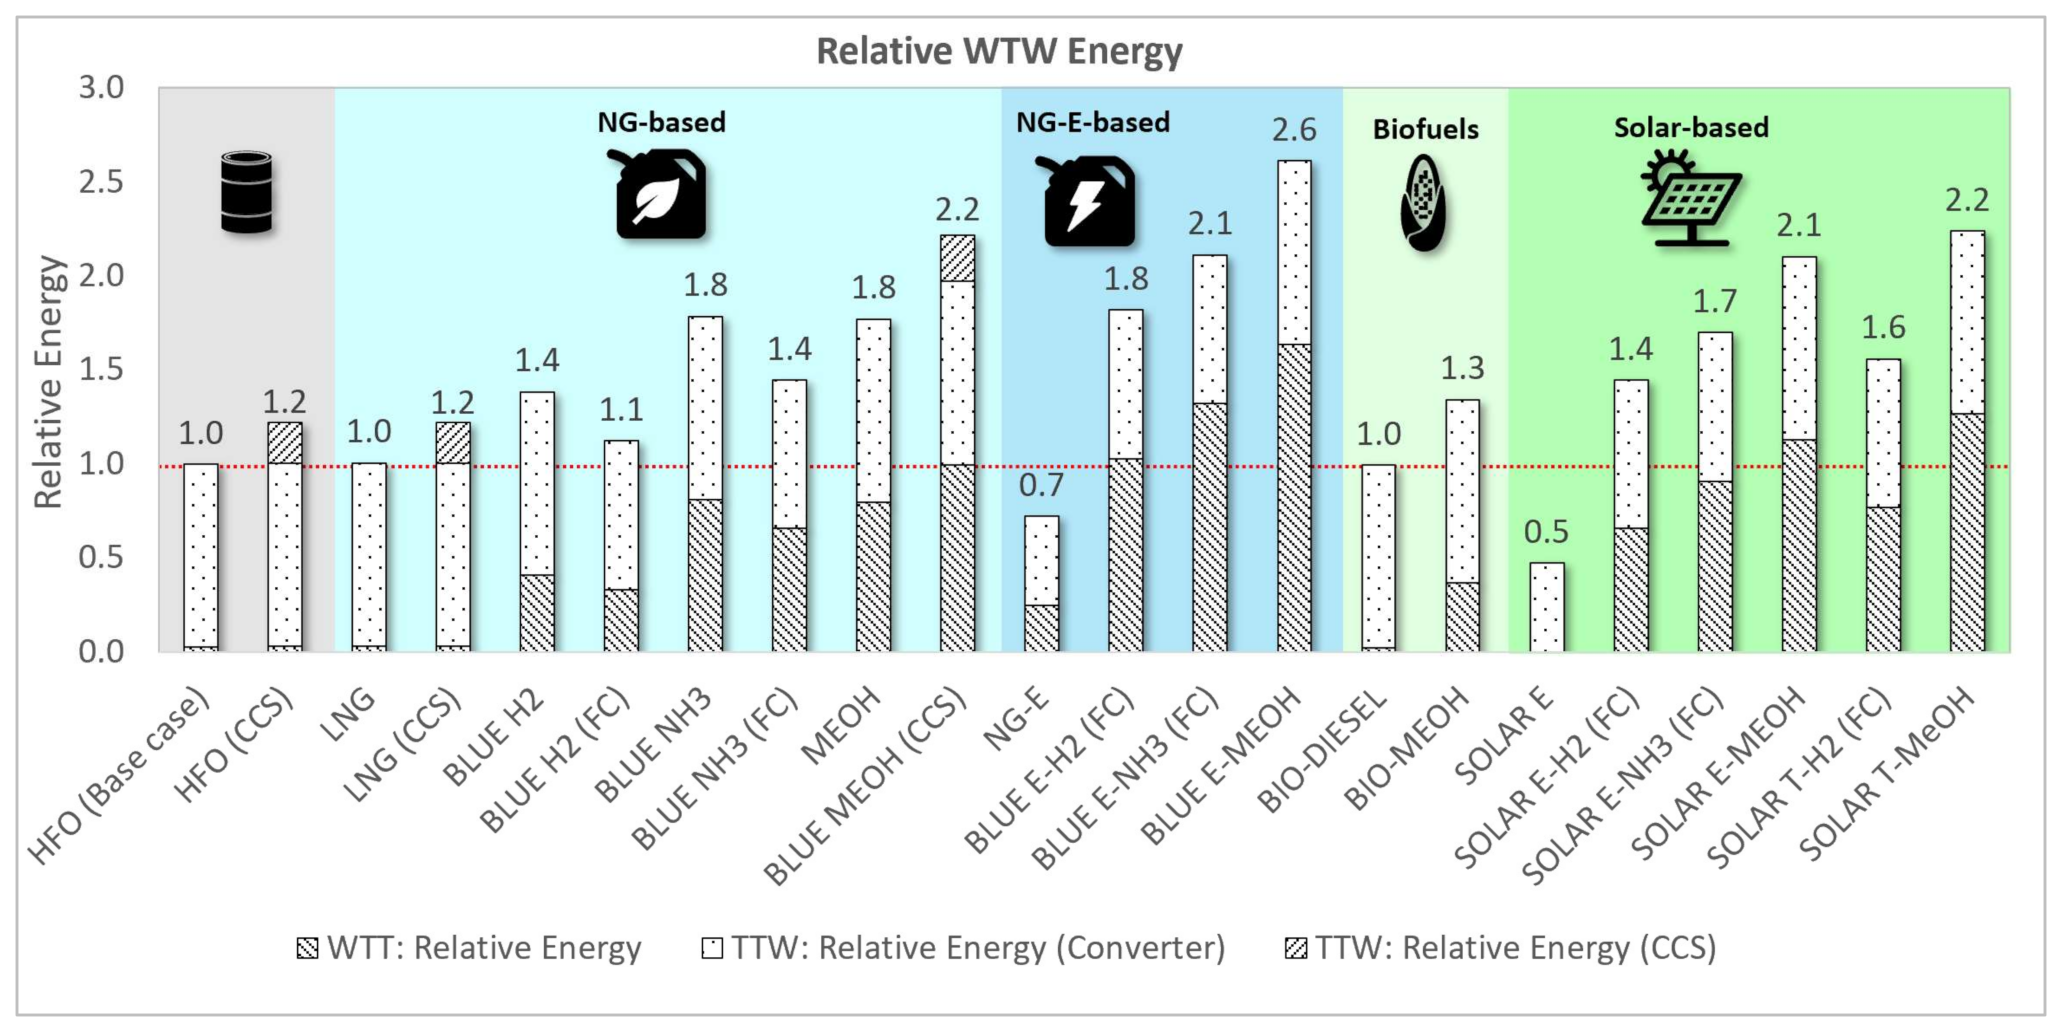
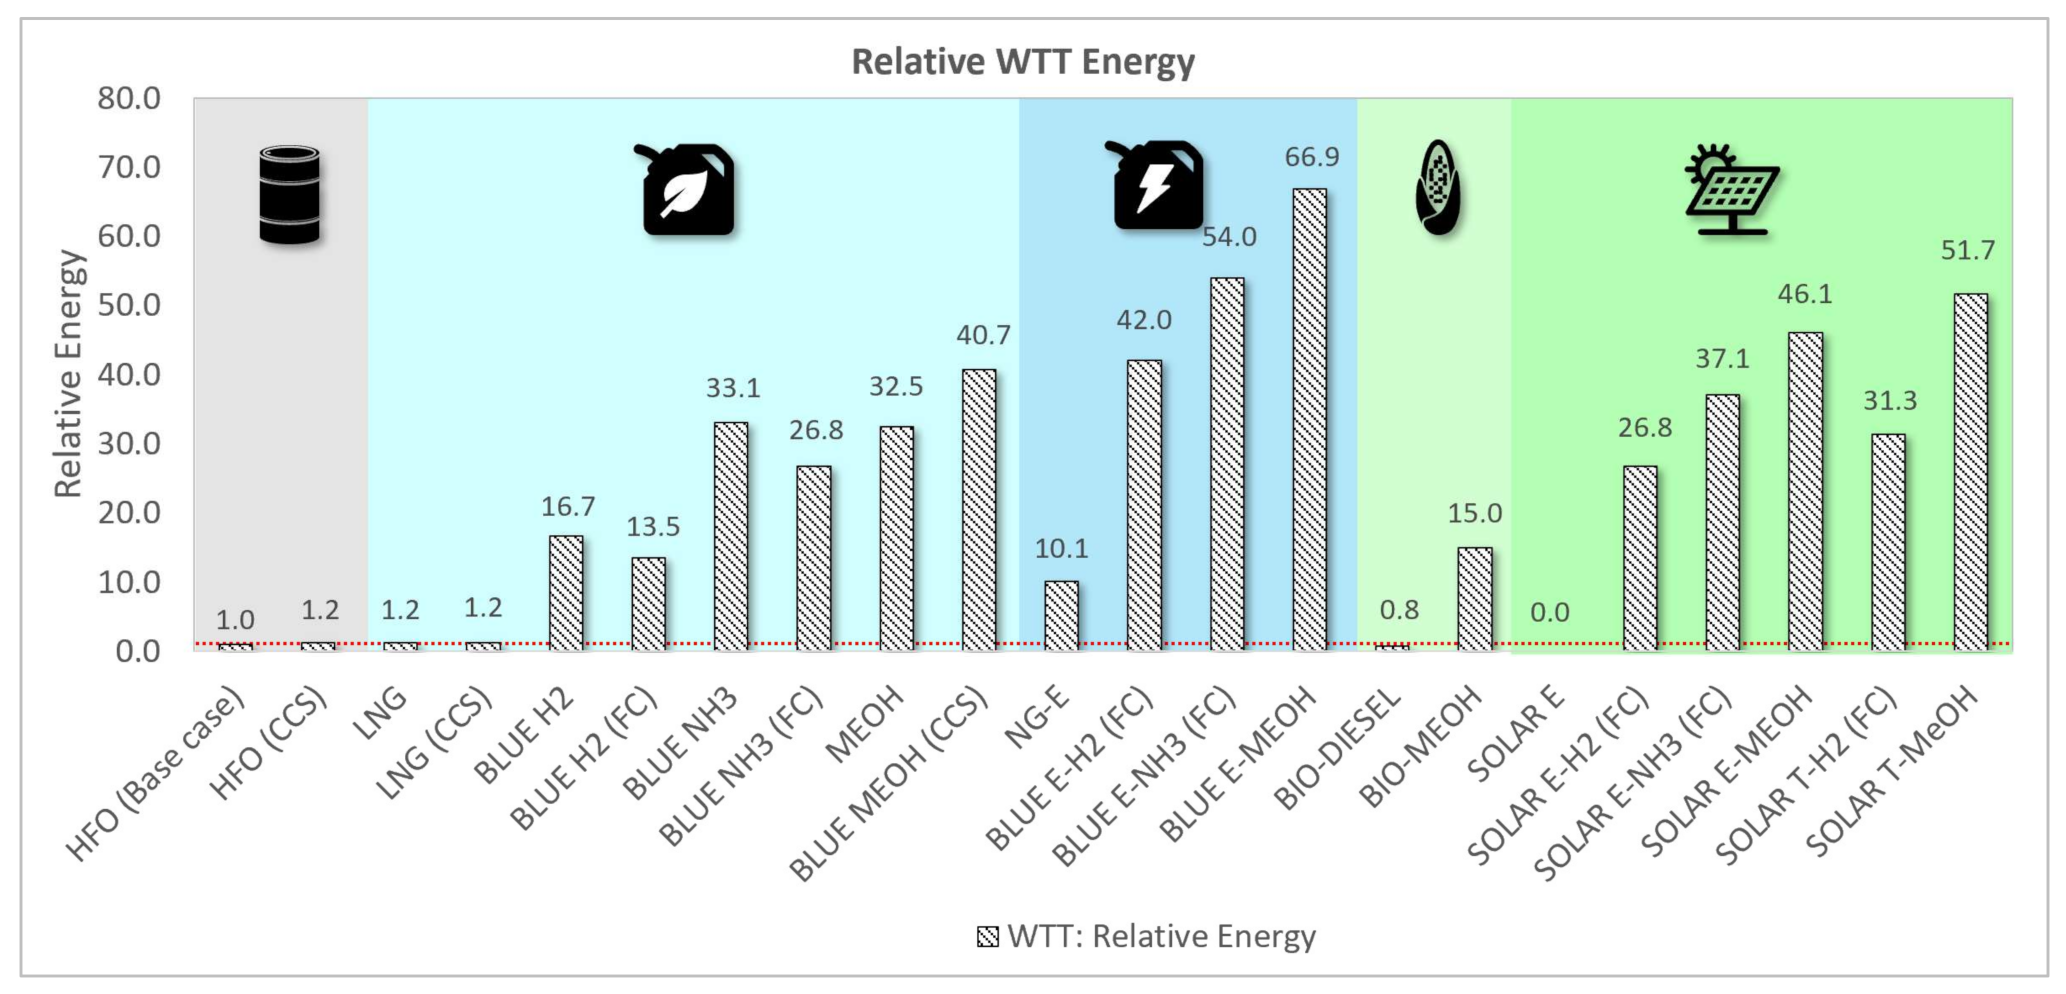
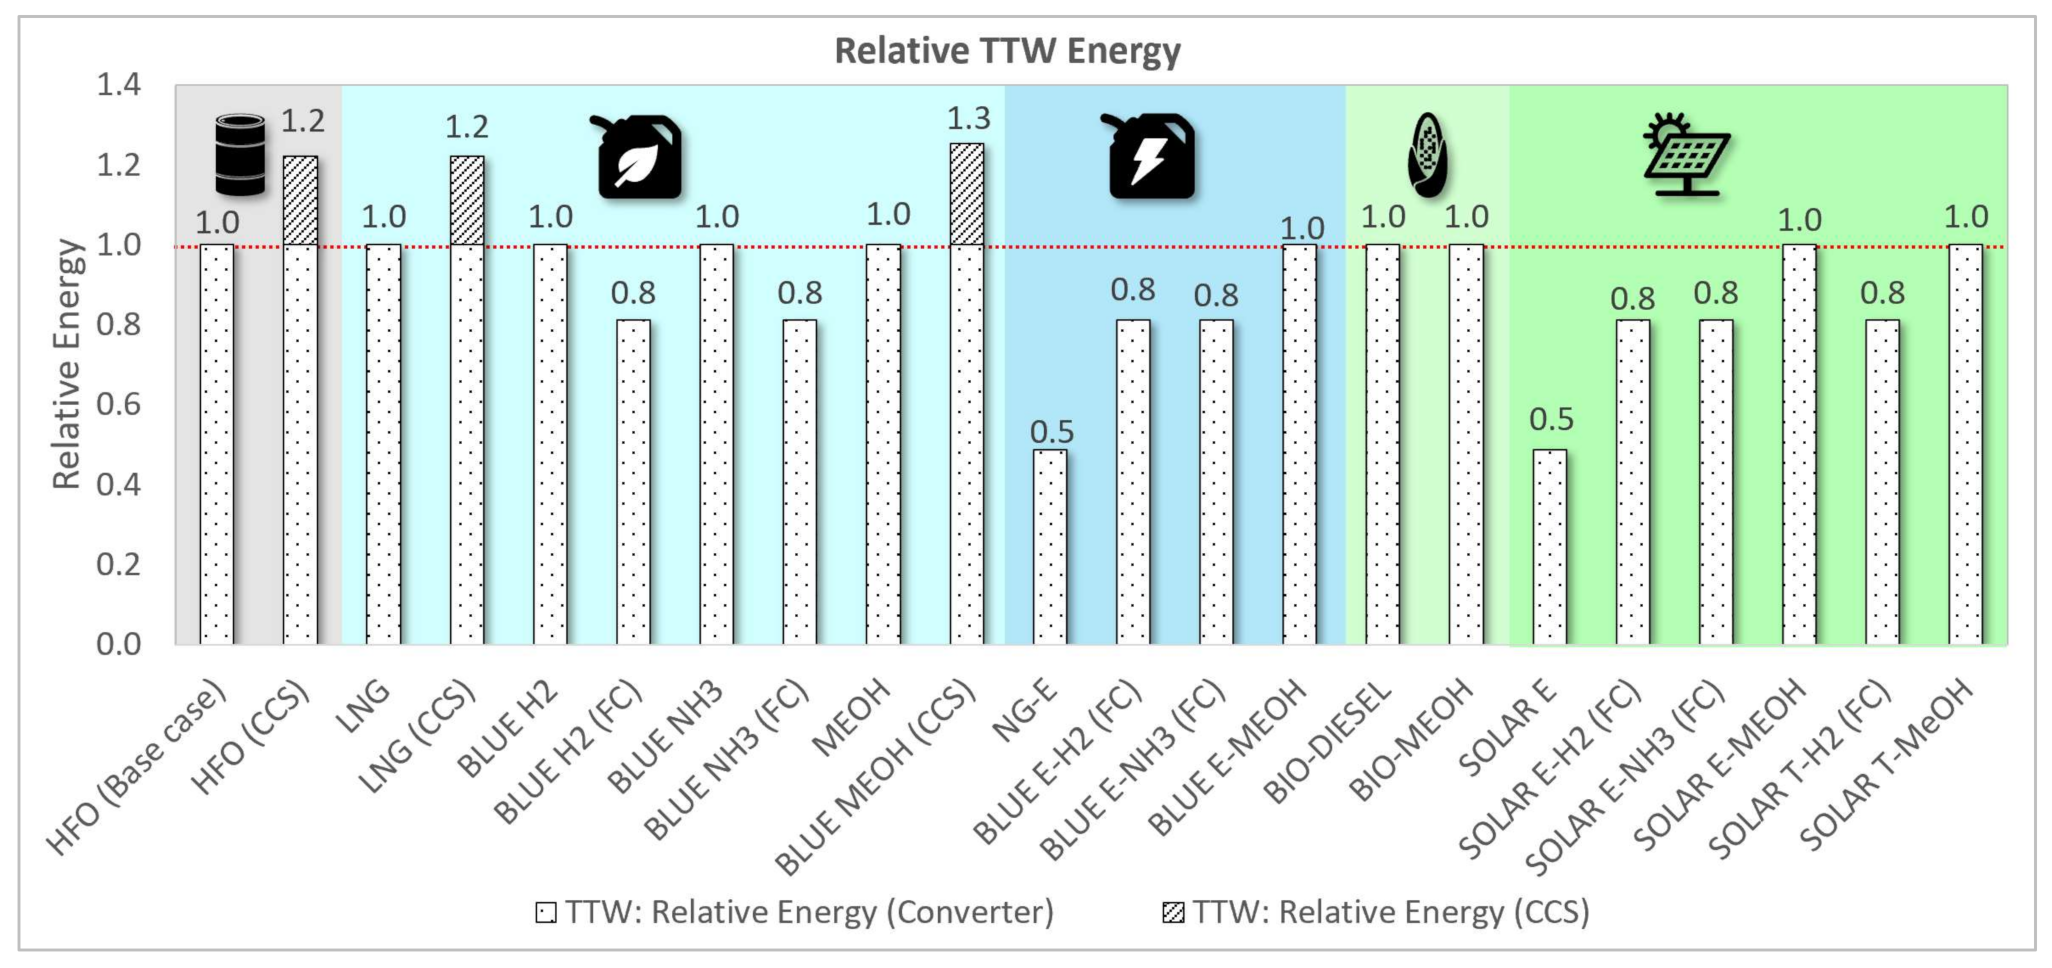
- Relative WTW energy.
- Relative WTW cost.
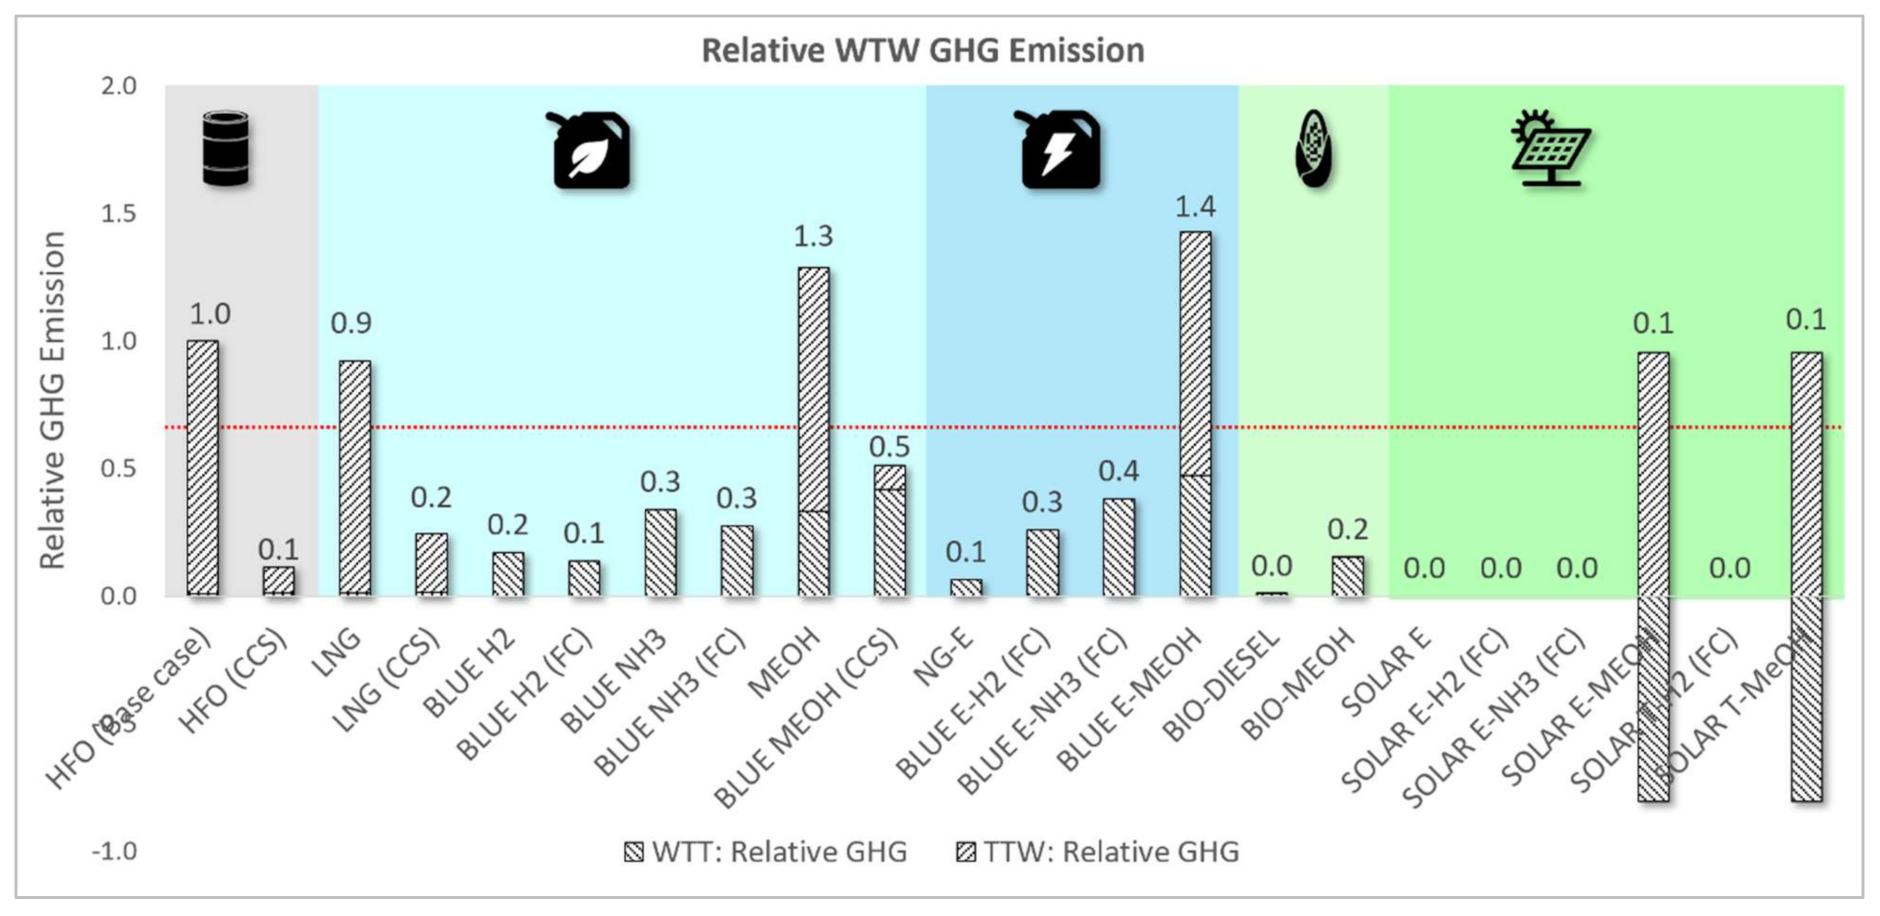
- Relative WTW GHG emission.
- Relative non-GHG emission.
3. Results
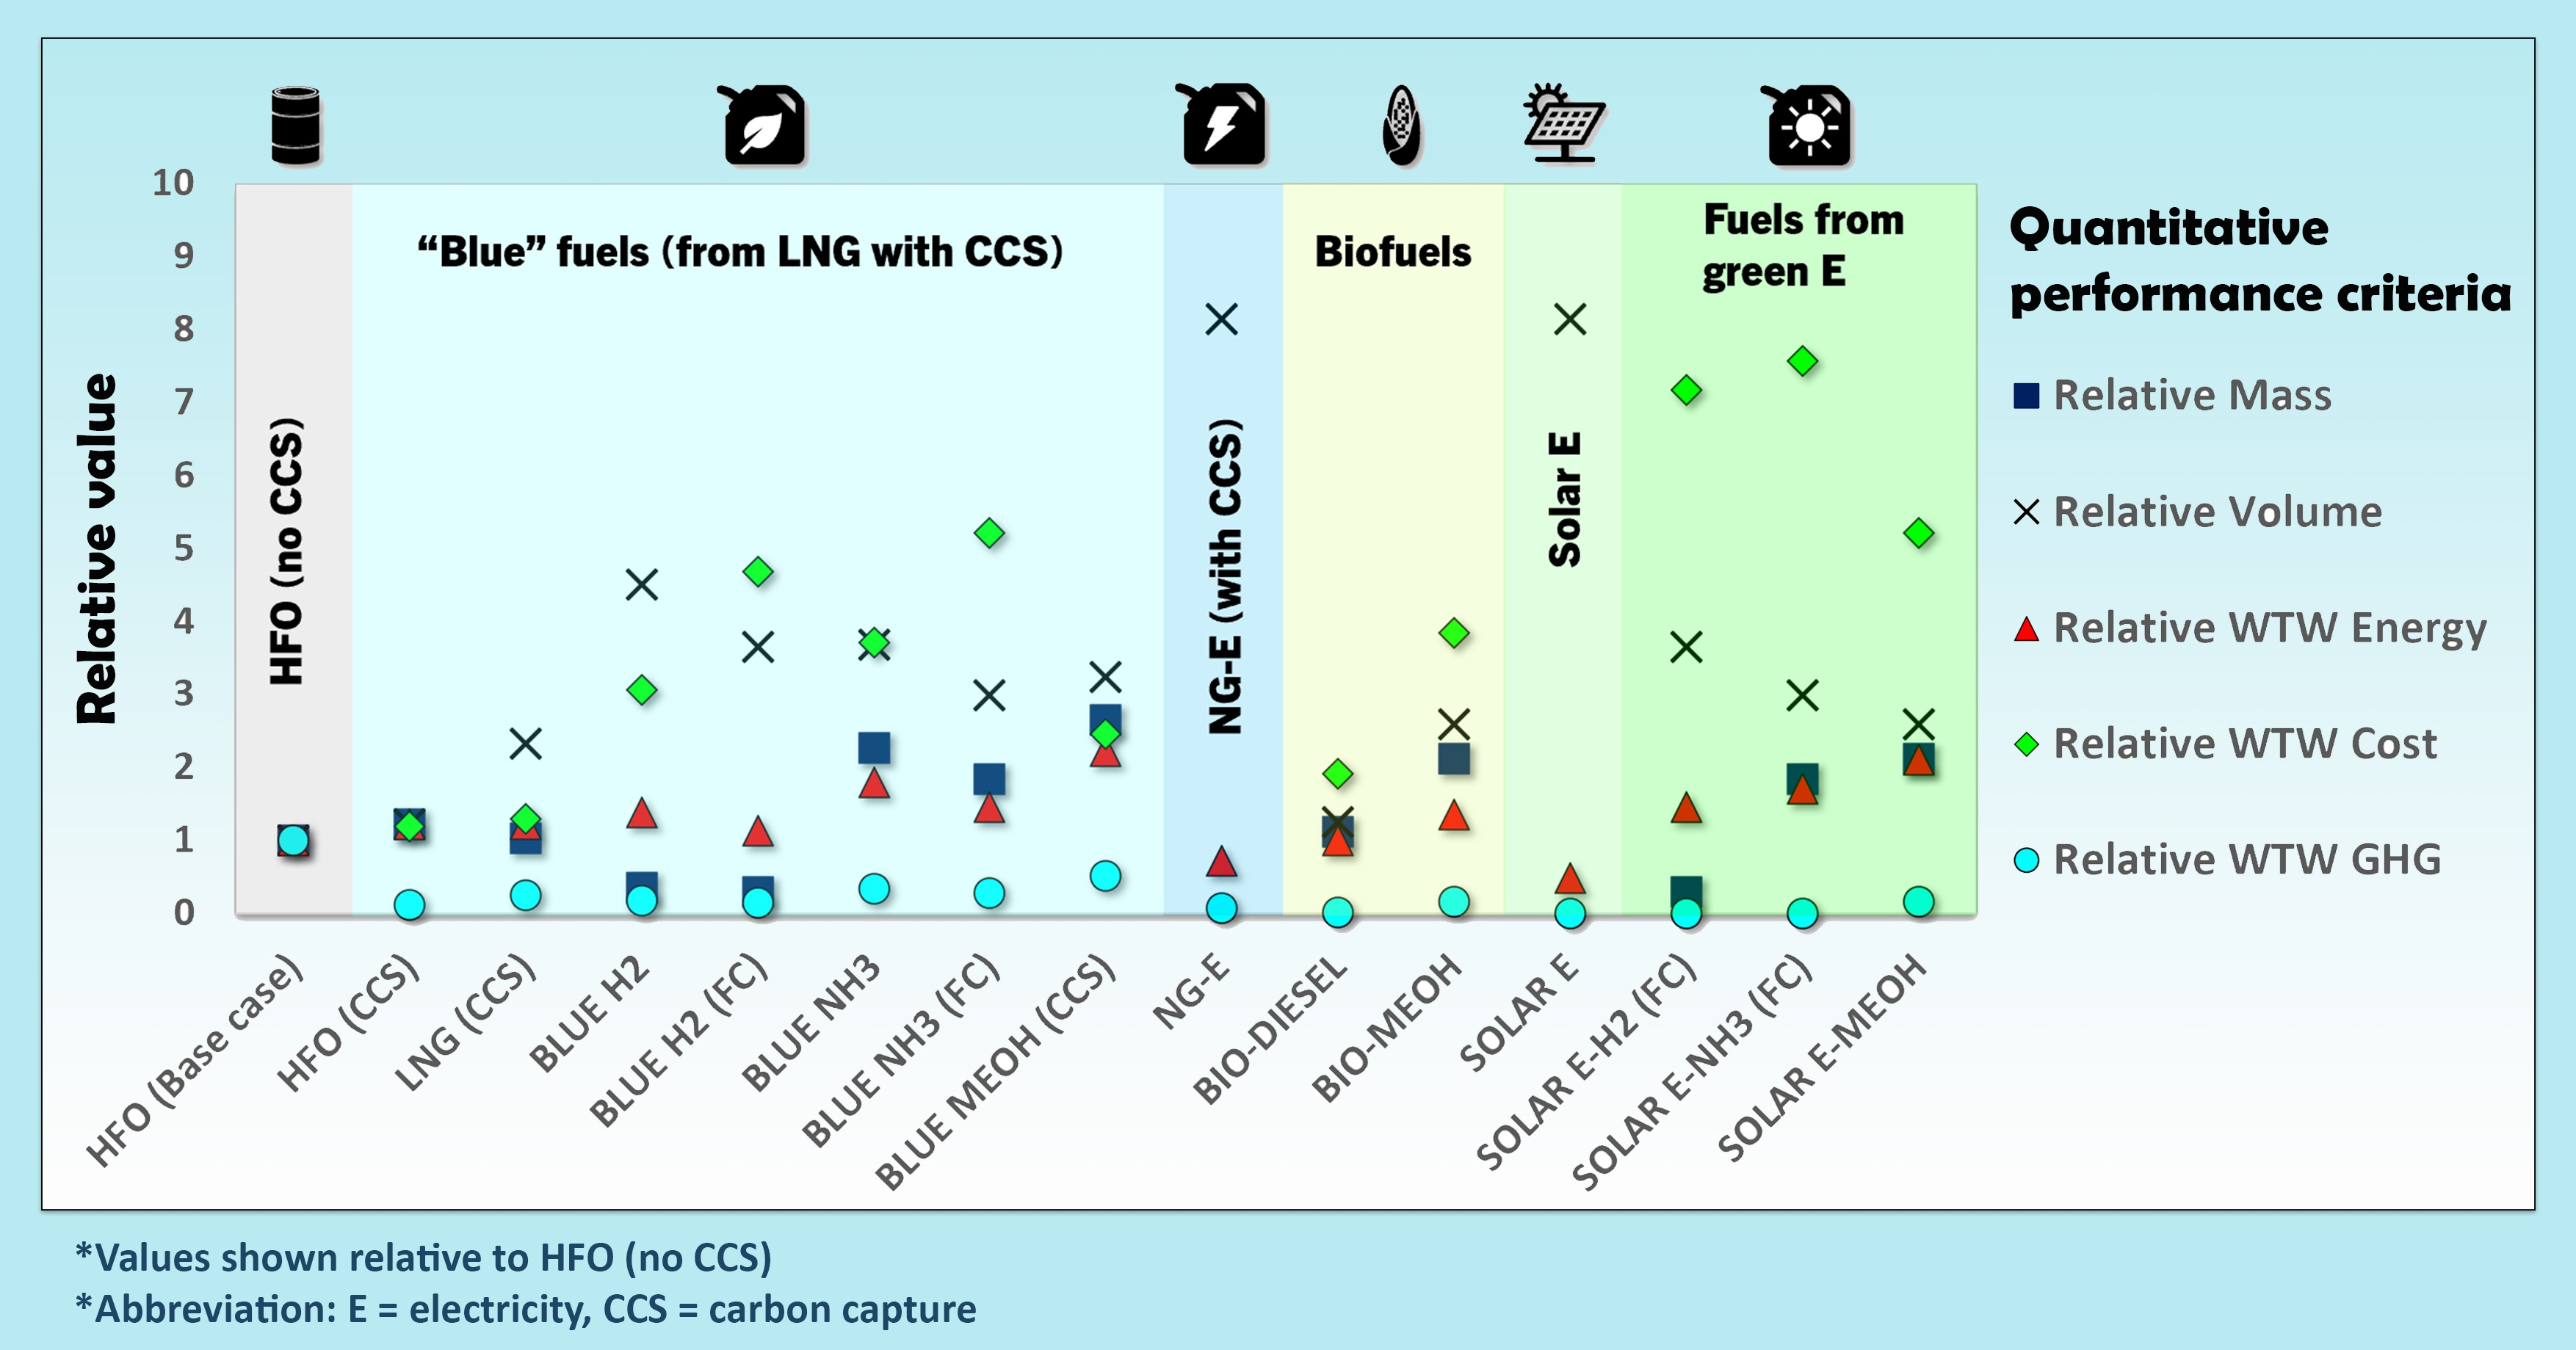
3.1. Quantitative Assessment
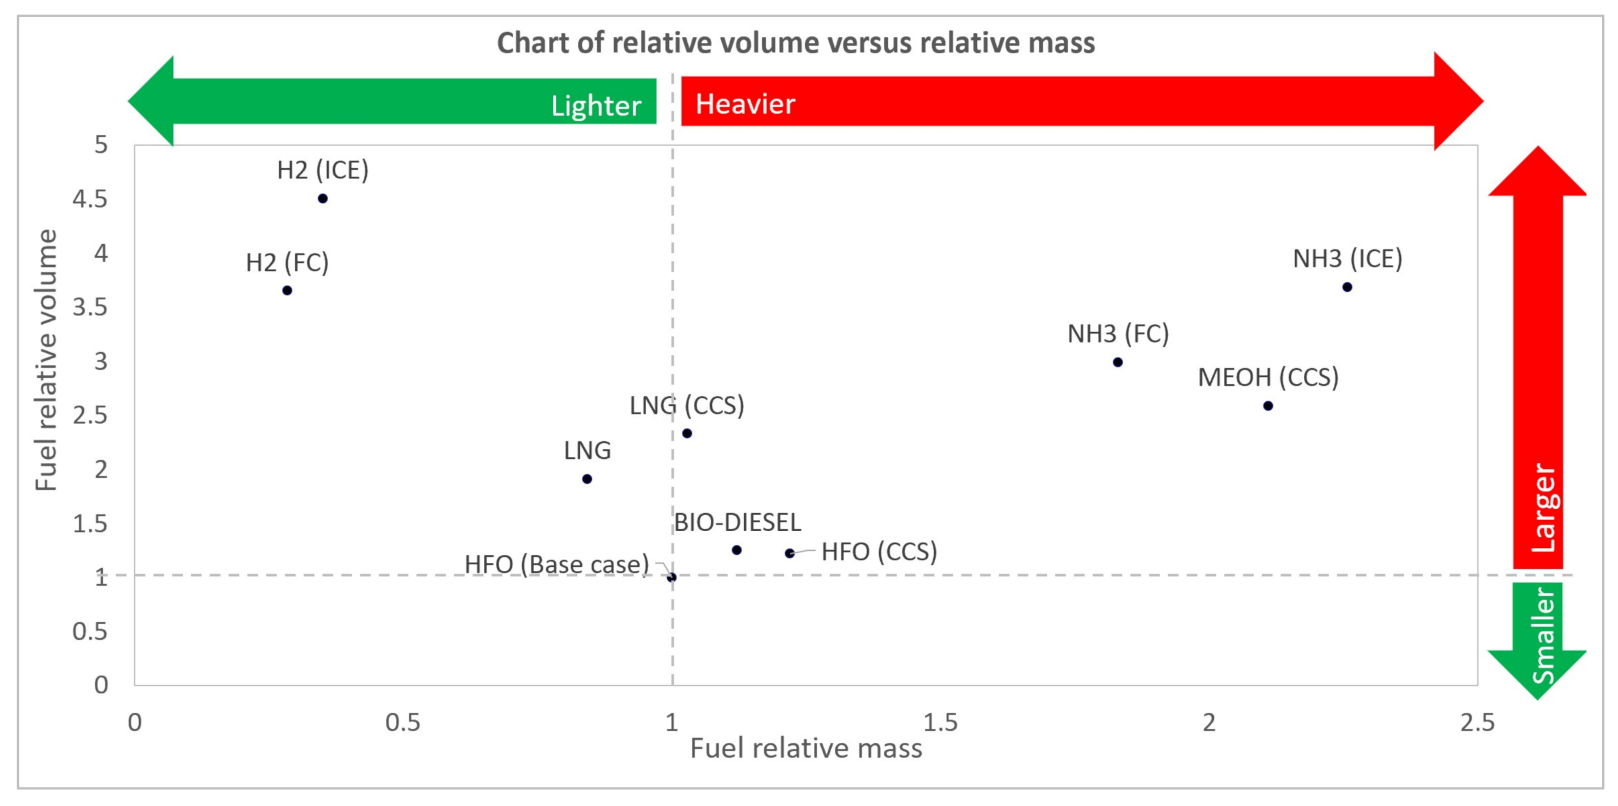
3.1.1. Relative Fuel Mass and Volume Assessment
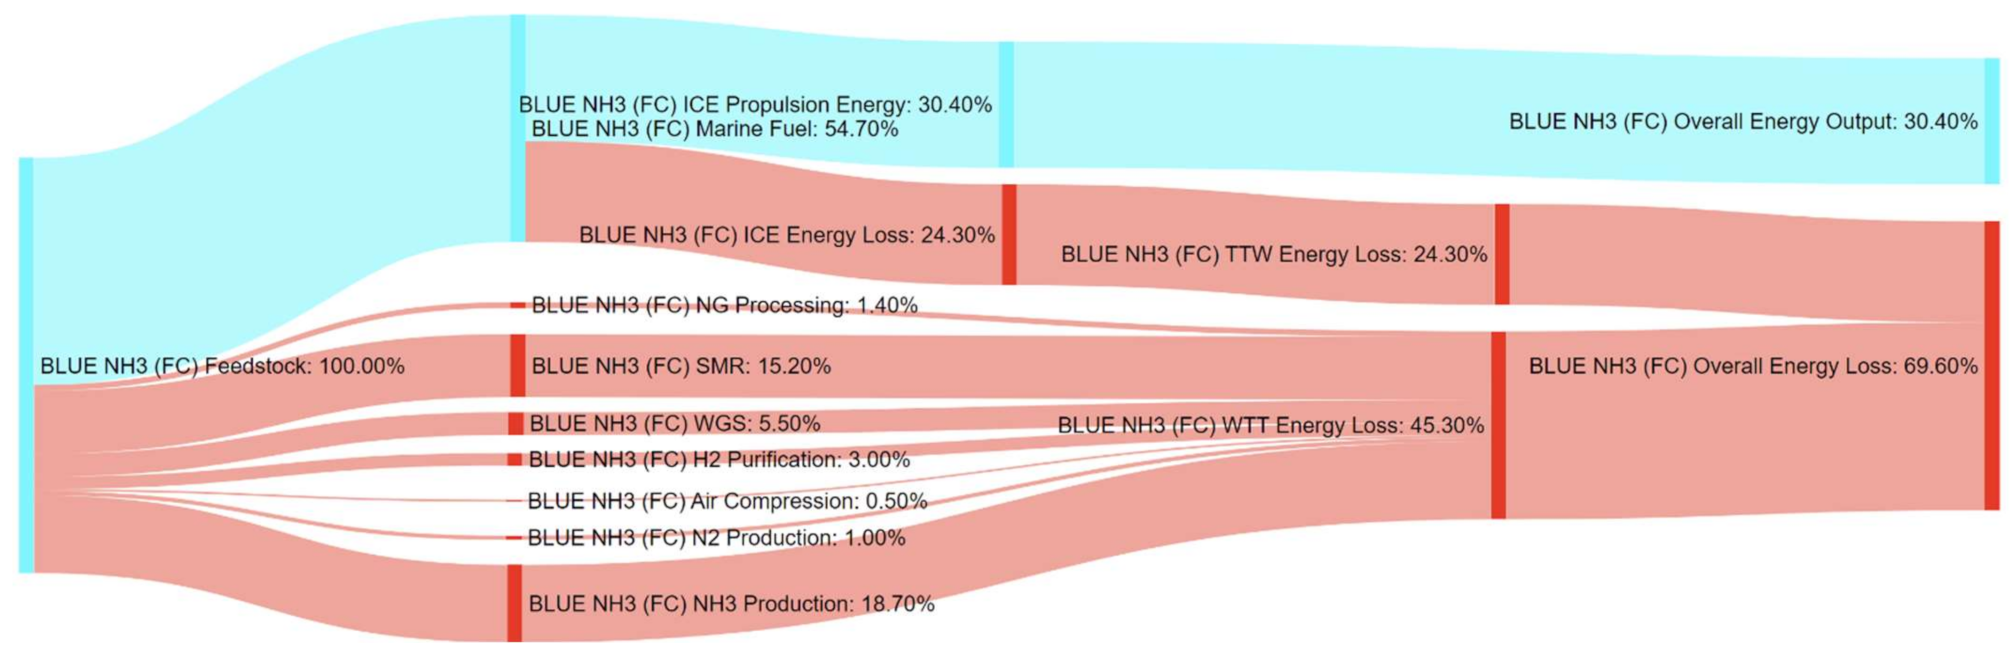
3.1.2. Relative Energy Assessment
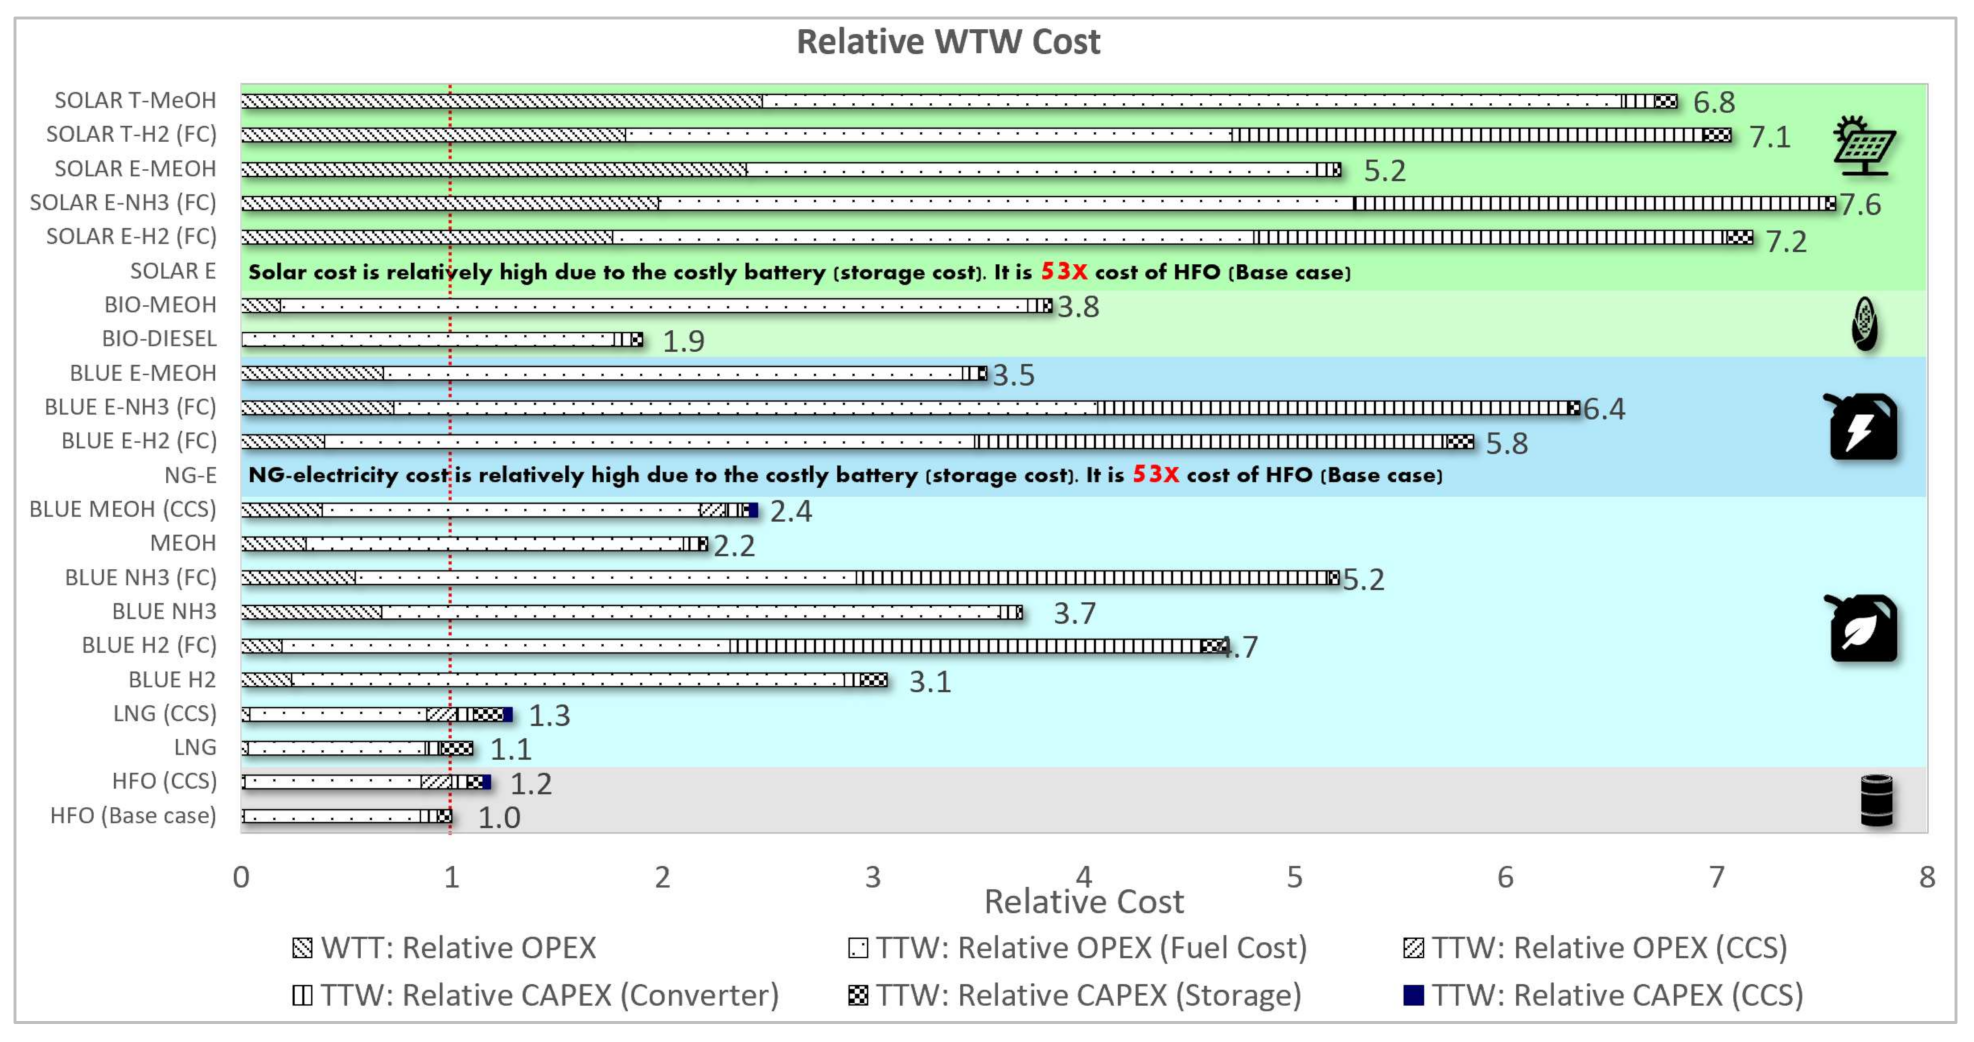
3.1.3. Relative Cost Assessment
3.1.4. Relative WTW GHG and Non-GHG Emissions Assessment
3.1.5. Summary of Quantitative Assessment
3.2. An Example Procedure for Reaching Fuel Selection
4. Discussion
5. Conclusions
Author Contributions
Funding
Institutional Review Board Statement
Informed Consent Statement
Acknowledgments
Conflicts of Interest
Appendix A


Appendix B

| Marine Fuel | WTT Energy Consumption Factor (Energy Consumed (KJ)/KJ of Fuel Produced) | TTW Energy Consumption Factor (Energy Consumed (KJ)/KJ of Propulsion Energy) | Efficiency Factor Engine/Fuel Cell Efficiency |
|---|---|---|---|
| BASE CASE: CRUDE–HFO–ICE | HFO processing = 0.02 (Aspen) | TTW = (considered in efficiency factor) | ICE = 45% [19] |
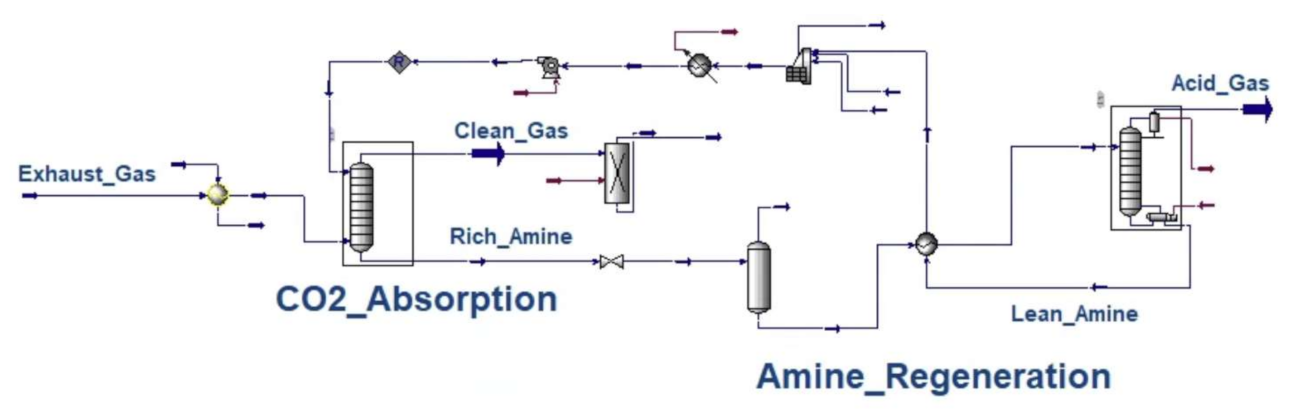
| CRUDE–HFO–ICE–CCS | HFO processing = 0.02 (Aspen) | TTW = (considered in efficiency factor) CCS = 0.2 (Aspen) | ICE = 45% [19] |
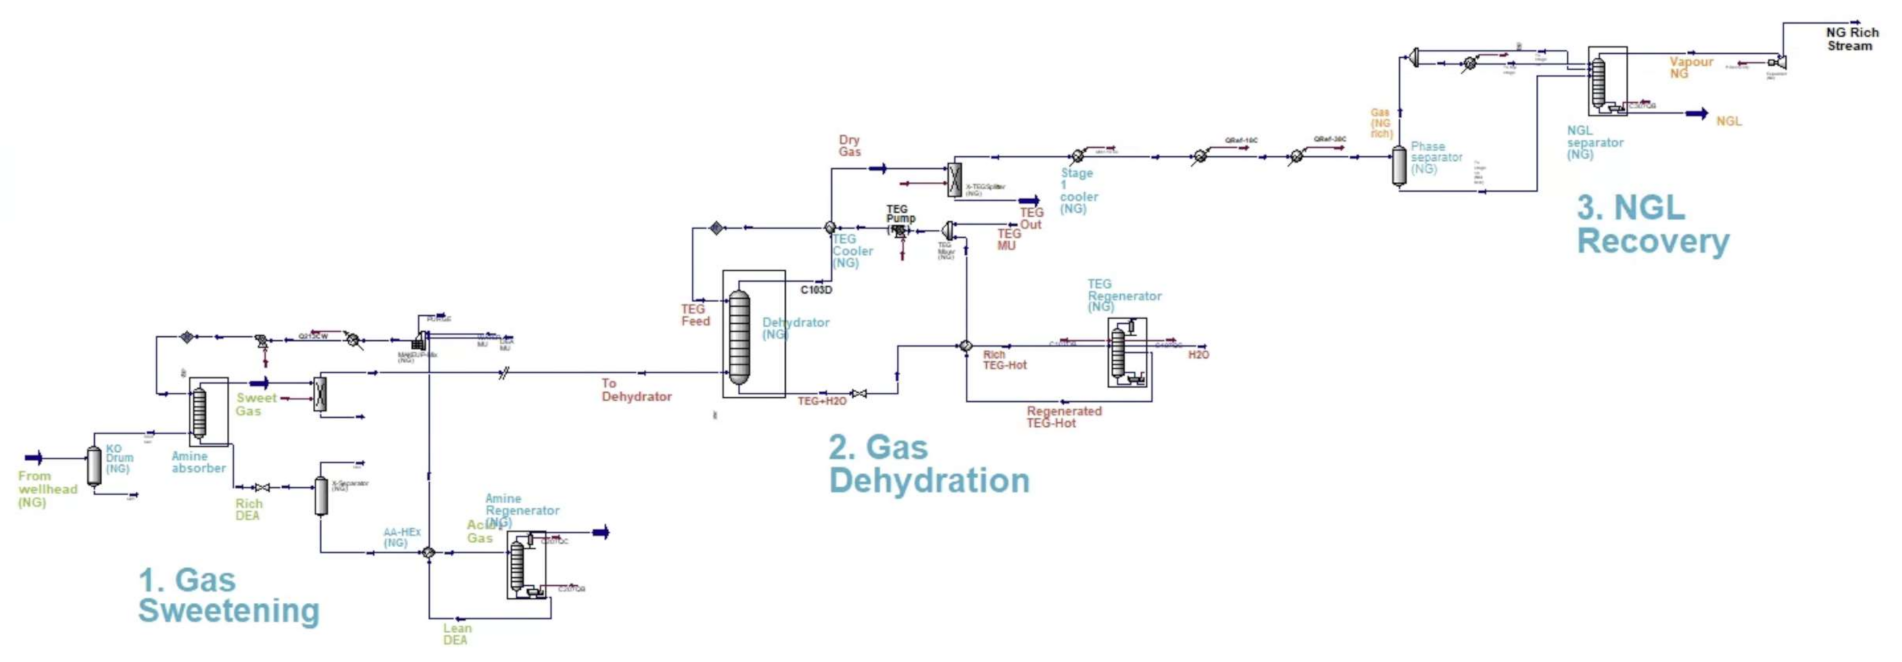
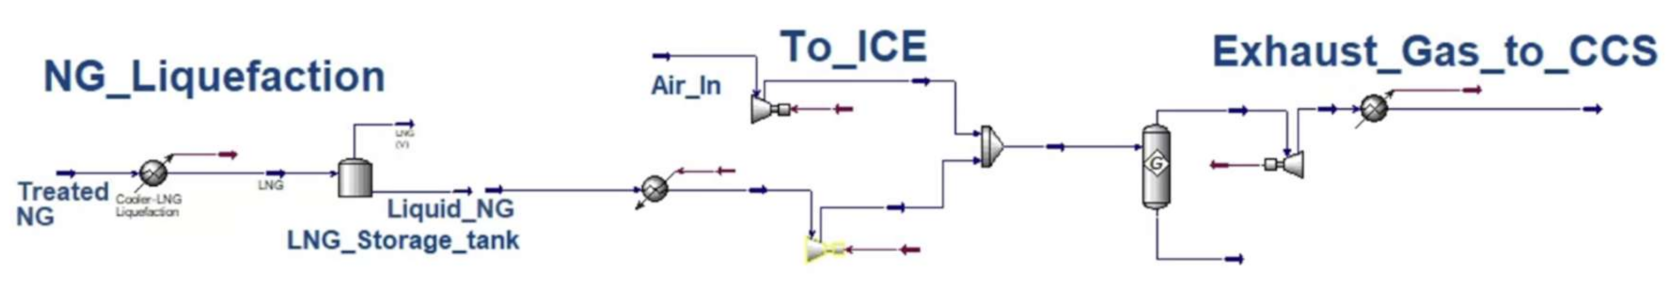
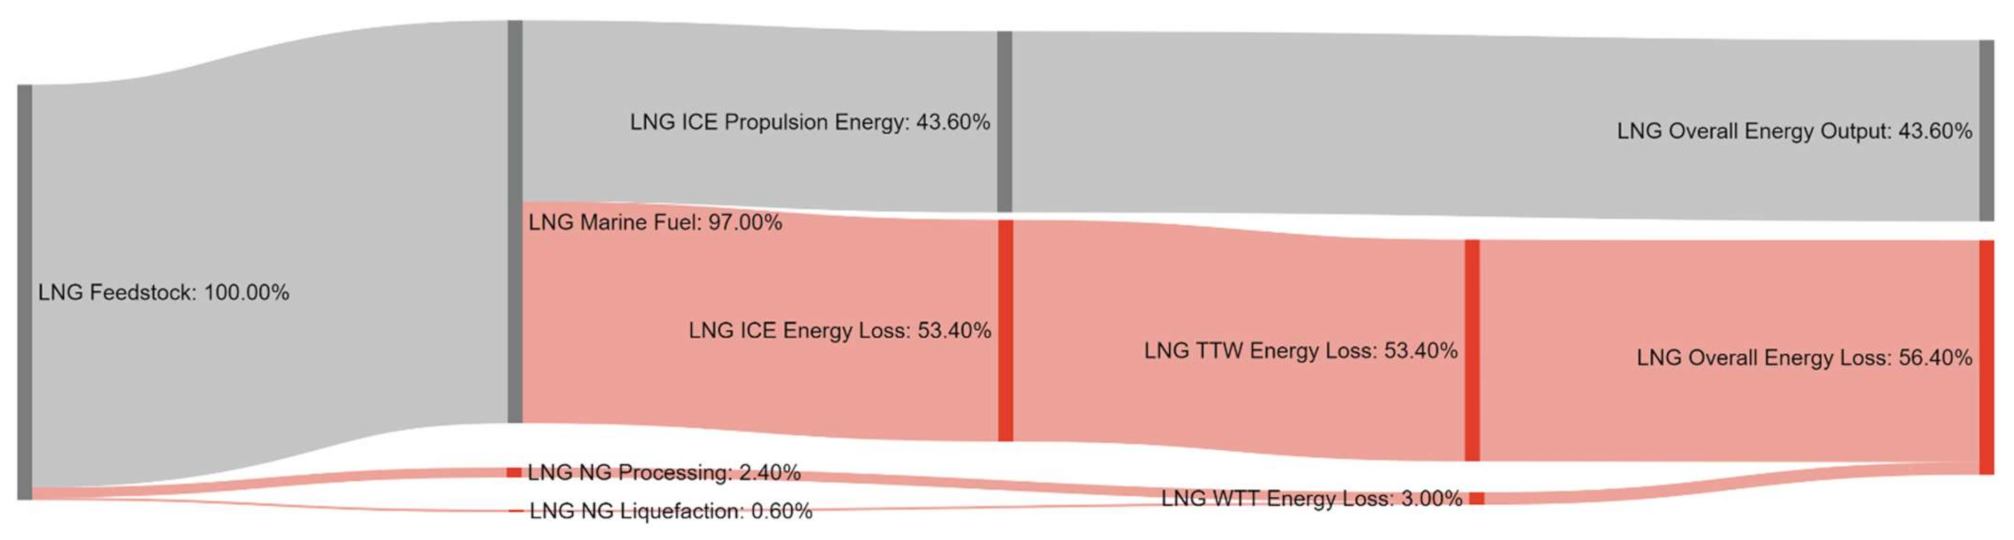
| NG–LNG–ICE–CCS | NG processing = 0.025 (Aspen) Liquefaction = 0.006 (Aspen) | TTW = (considered in efficiency factor) CCS = 0.197 (Aspen) | ICE = 45% [19] |
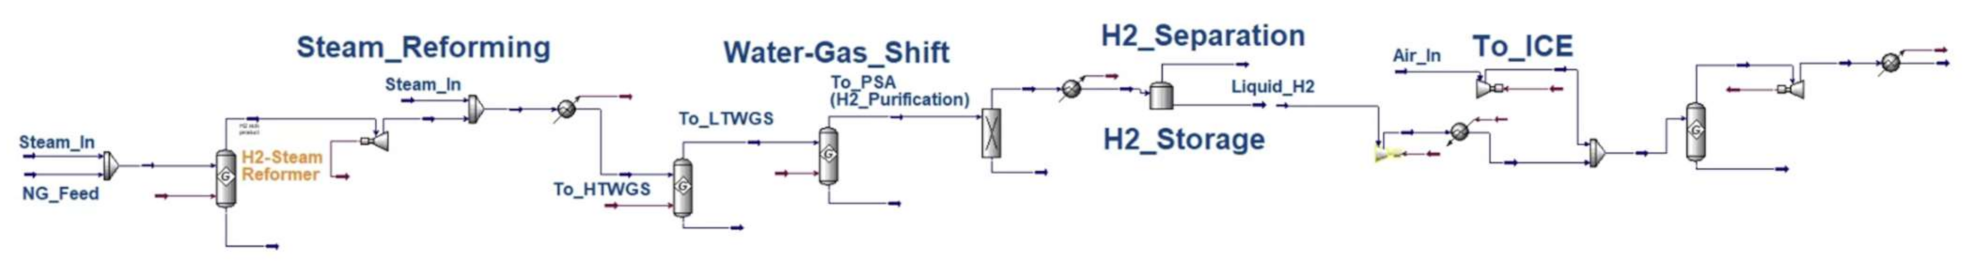
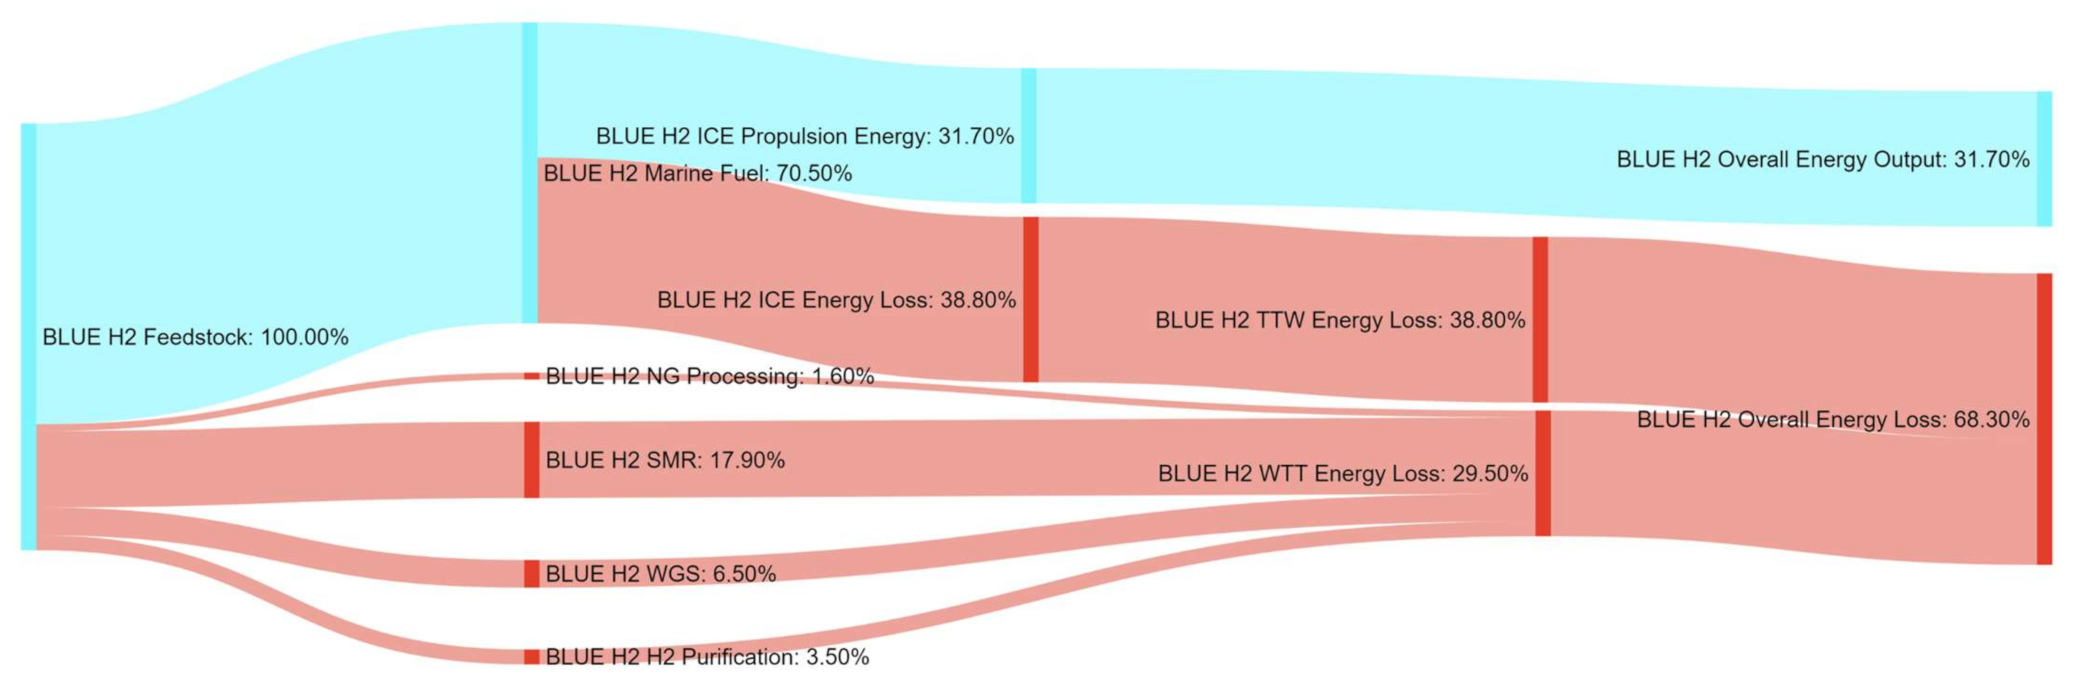
| NG–H2–ICE | NG processing = 0.025 (Aspen) H2 production_SMR = 0.2538 (Aspen) WGS = 0.092 (Aspen) H2 purification (PSA) = 0.05 (Aspen) | TTW = (considered in efficiency factor) | ICE = 45% [19] |
| NG–H2–FC | NG processing = 0.025 (Aspen) H2 production_SMR = 0.2538 (Aspen) WGS = 0.092 (Aspen) H2 purification (PSA) = 0.05 (Aspen) | TTW = (considered in efficiency factor) | Electric motor = 92.5% [21] Fuel cell = 60% [22] |
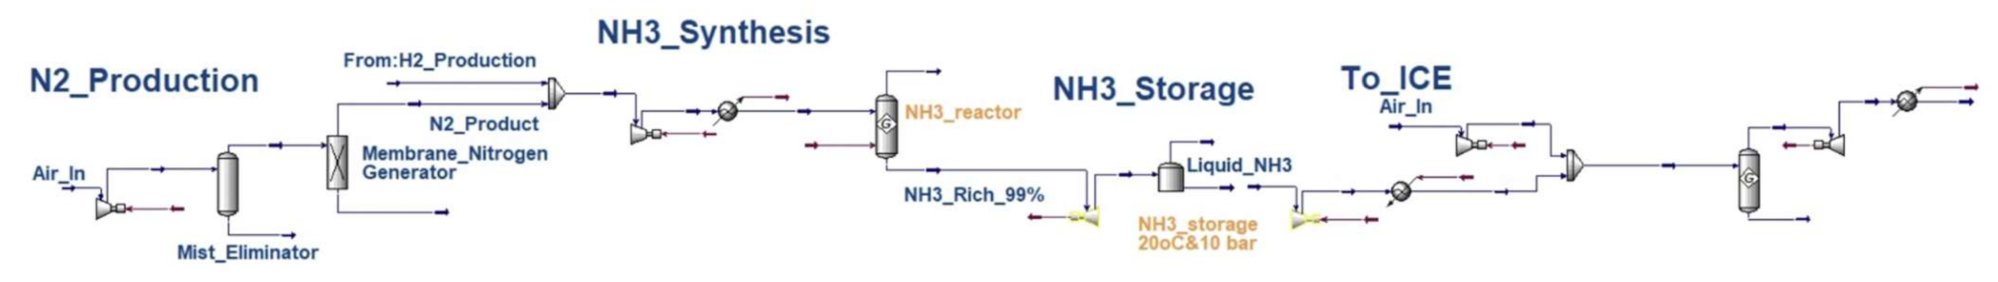
| NG–NH3–ICE | NG processing = 0.025 (Aspen) H2 production_SMR = 0.279 (Aspen) WGS = 0.101 (Aspen) H2 purification (PSA) = 0.055 (Aspen) N2 production = 0.027 (Aspen) NH3 production = 0.343 (Aspen) | TTW = (considered in efficiency factor) | ICE = 45% [19] |
| NG–NH3–FC | NG processing = 0.025 (Aspen) H2 production_SMR = 0.279 (Aspen) WGS = 0.101 (Aspen) H2 purification (PSA) = 0.055 (Aspen) N2 production = 0.027 (Aspen) NH3 production = 0.343 (Aspen) | TTW = (considered in efficiency factor) | Electric motor = 92.5% [21] Fuel cell = 60% [22] |
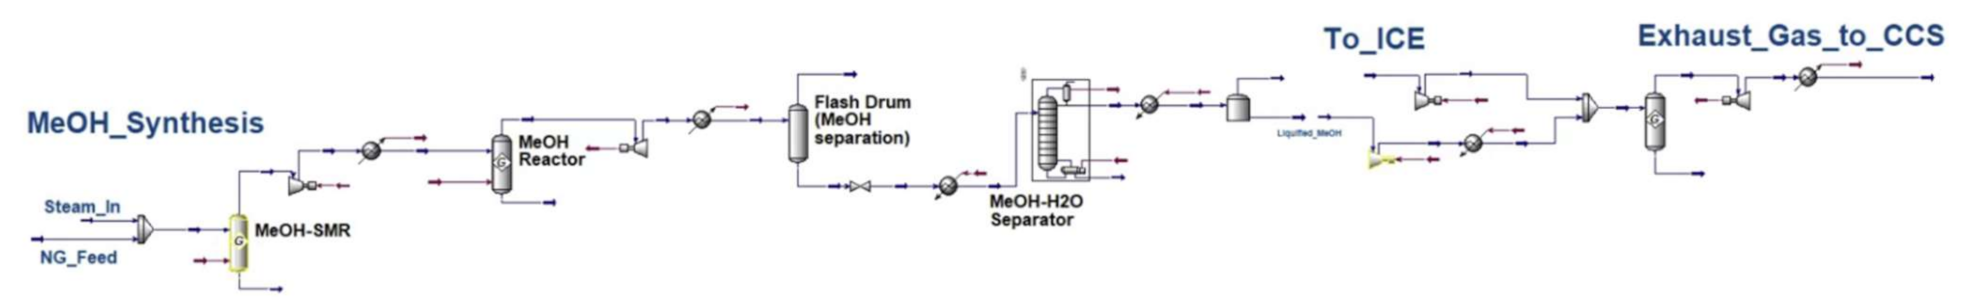
| NG–MEOH–ICE–CCS | NG processing = 0.031 (Aspen) SMR = 0.409 (Aspen) MeOH production = 0.175 (Aspen) MeOH separation = 0.201 (Aspen) | TTW = (considered in efficiency factor) CCS = 0.21 (Aspen) | ICE = 45% [19] |
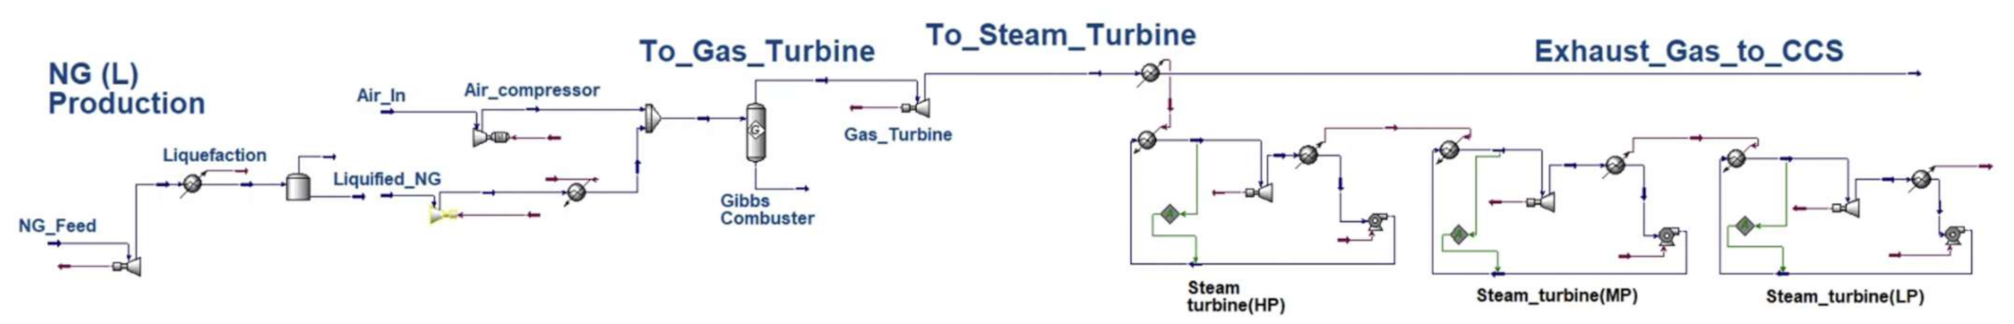
| NG–ELECTRICITY–EM | NG processing = 0.0222 (Aspen) Liquefaction = 0.0175 (Aspen) CCGT = 0.52 [28] CCS = 0.2403 (Aspen) | TTW = (considered in efficiency factor) | Electric motor = 92.5% (literature) |
| NG–ELECTRICITY–H2–FC | NG processing = 0.0222 (Aspen) Liquefaction = 0.0175 (Aspen) CCGT = 0.52 (52% based on literature) CCS = 0.2403 (Aspen) Electrolysis (H2 production) = 0.6 [29] | TTW = (considered in efficiency factor) | Electric motor = 92.5% [21] Fuel cell = 60% [22] Overall TTW efficiency = 92.5%∗60% = 55.5% |
| NG–ELECTRICITY–NH3–FC | NG processing = 0.0222 (Aspen) Liquefaction = 0.0175 (Aspen) CCGT = 0.52 [28] CCS = 0.2403 (Aspen) Electrolysis (H2 production) = 0.6 [29] N2 production = 0.027 (Aspen) NH3 production = 0.343 (Aspen) | TTW = (considered in efficiency factor) | Electric motor = 92.5% [21] Fuel cell = 60% [22] |
| ELECTRICITY–MEOH–ICE | NG processing = 0.0222 (Aspen) Liquefaction = 0.0175 (Aspen) CCGT = 0.52 [28] CCS = 0.2403 (Aspen) Electrolysis (H2 production) = 0.6 [29] MeOH production = 0.175 (Aspen) MeOH separation = 0.201 (Aspen) | TTW = (considered in efficiency factor) | ICE = 45% [19] |
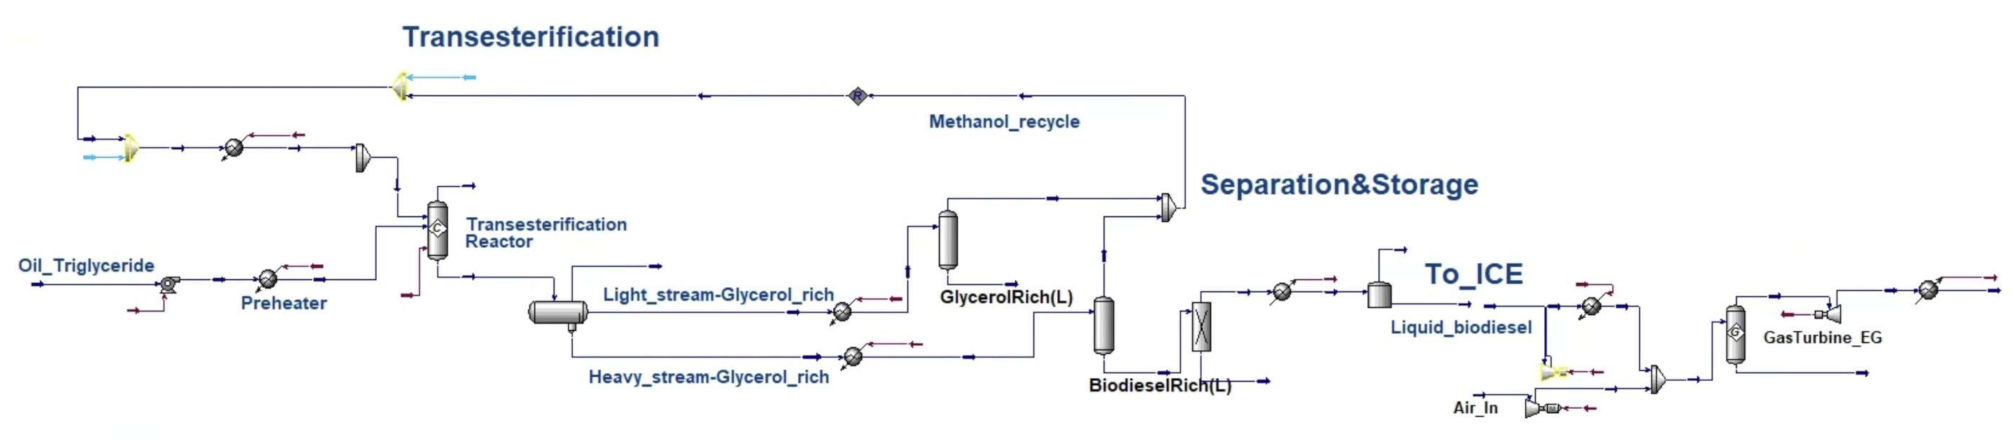
| BIOMASS–BIODIESEL–ICE | Soybean processing = negligible (Assume) Transesterification & separation = 0.02 (Aspen) | TTW = (considered in efficiency factor) | ICE = 45% [19] |
| BIOMASS–BIO-MEOH –ICE | Syngas production= zero (assume) MeOH production = 0.377 (Aspen) | TTW = (considered in efficiency factor) | ICE = 45% [19] |
| SOLAR–ELECTRICITY–EM | Solar electricity generation = zero (Assume) | TTW = (considered in efficiency factor) | Electric motor = 92.5% [21] |
| SOLAR–ELECTRICITY–H2–FC | Solar electricity = zero (Assume) Electrolyser = 0.6 [29] Compression = 0.06 [32] | TTW = (considered in efficiency factor) | Electric motor = 92.5% (literature) Fuel cell = 60% [22] |
| SOLAR–ELECTRICITY–NH3–FC | Solar electricity = zero (Assume) Electrolyser = 0.6 [29] N2 production = 0.02 (Aspen) NH3 production = 0.343 (Aspen) | TTW = (considered in efficiency factor) | Electric motor = 92.5% (literature) Fuel cell = 60% [22] |
| SOLAR–ELECTRICITY–MEOH–ICE | Solar electricity = zero (Assume) Electrolyser = 0.6 [29] MeOH production = 0.377 (Aspen) | TTW = (considered in efficiency factor) | ICE = 45% [19] |
| WTT Cost Factor | TTW Cost Factor | |||||
|---|---|---|---|---|---|---|
| Marine Fuel | Energy Cost Factor (Aspen) ($/kJ Propulsion Energy) * For Solar Is from Literature [32] | Energy Cost Factor (Aspen) ($/kJ Propulsion Energy) | Fuel Cost ($/kJ Propulsion Energy) Data from Literature, Verified by [11] | Converter (ICE/FC) ($/kW) [11] | Storage Cost ($/kJ LNG Equivalent) [11] | CCS Capital Cost [43] |
| BASE CASE: CRUDE–HFO–ICE | 4.86 × 10⁻⁷ | N.A. | 1.78 × 10⁻⁵ | 1.00 × 10⁻³ | 3.01 × 10⁻⁵ | 0 |
| CRUDE–HFO–ICE–CCS | 4.86 × 10⁻⁷ | 3.03 × 10⁻⁶ | 1.78 × 10⁻⁵ | 1.00 × 10⁻³ | 3.01 × 10⁻⁵ | 5.84 × 10⁻⁶ |
| NG–LNG–ICE–CCS | 1.22 × 10⁻⁶ | 3.03 × 10⁻⁶ | 1.78 × 10⁻⁵ | 1.00 × 10⁻³ | 1.20 × 10⁻⁴ | 5.84 × 10⁻⁶ |
| NG–H2–ICE | 8.68 × 10⁻⁶ | N.A. | 5.56 × 10⁻⁵ | 1.00 × 10⁻³ | 2.41 × 10⁻⁴ | 0 |
| NG–H2–FC | 8.68 × 10⁻⁶ | N.A. | 4.50 × 10⁻⁵ | 1.15 × 10⁻⁴ | 2.41 × 10⁻⁴ | 0 |
| NG–NH3–ICE | 2.40 × 10⁻⁵ | N.A. | 6.22 × 10⁻⁵ | 1.00 × 10⁻³ | 4.01 × 10⁻⁵ | 0 |
| NG–NH3–FC | 2.40 × 10⁻⁵ | N.A. | 5.05 × 10⁻⁵ | 1.15 × 10⁻⁴ | 7.52 × 10⁻⁵ | 0 |
| NG–MEOH–ICE–CCS | 1.35 × 10⁻⁵ | 2.55 × 10⁻⁶ | 3.35 × 10⁻⁵ | 1.00 × 10⁻³ | 4.01 × 10⁻⁵ | 5.84 × 10⁻⁶ |
| NG–ELECTRICITY–EM | 5.05 × 10⁻⁶ | N.A. | 5.01 × 10⁻⁵ | 0 | 3.71 × 10⁻¹ | 0 |
| NG–ELECTRICITY–H2–FC | 5.05 × 10⁻⁶ | N.A. | 1.29 × 10⁻⁴ | 1.15 × 10⁻⁴ | 2.41 × 10⁻⁴ | 0 |
| NG–ELECTRICITY–NH3–FC | 1.96 × 10⁻⁵ | N.A. | 1.34 × 10⁻⁴ | 1.15 × 10⁻⁴ | 7.52 × 10⁻⁵ | 0 |
| ELECTRICITY–MEOH–ICE | 1.31 × 10⁻⁵ | N.A. | 1.37 × 10⁻⁴ | 1.00 × 10⁻³ | 4.01 × 10⁻⁵ | 0 |
| BIOMASS–BIODIESEL –ICE | 4.50 × 10⁻⁸ | N.A. | 3.55 × 10⁻⁵ | 1.00 × 10⁻³ | 3.01 × 10⁻⁵ | 0 |
| BIOMASS–BIO-MEOH –ICE | 8.07 × 10⁻⁶ | N.A. | 3.35 × 10⁻⁵ | 1.00 × 10⁻³ | 4.01 × 10⁻⁵ | 0 |
| SOLAR–ELECTRICITY–EM | 1.11 × 10⁻⁵ [32] | N.A. | 1.20 × 10⁻⁵ | 0 | 3.71 × 10⁻¹ | 0 |
| SOLAR–ELECTRICITY–H2–FC | 1.61 × 10⁻⁵ [32] | N.A. | 5.26 × 10⁻⁵ | 1.15 × 10⁻⁴ | 1.20 × 10⁻⁴ | 0 |
| SOLAR–ELECTRICITY–NH3–FC | 2.56 × 10⁻⁵ [32] | N.A. | 7.87 × 10⁻⁵ | 1.15 × 10⁻⁴ | 7.52 × 10⁻⁵ | 0 |
| SOLAR–ELECTRICITY–MEOH–ICE | 1.92 × 10⁻⁵ [32] | N.A. | 1.46 × 10⁻⁴ | 1.00 × 10⁻³ | 4.01 × 10⁻⁵ | 0 |
Appendix C


References
- Gray, N.; McDonagh, S.; O’Shea, R.; Smyth, B.; Murphy, J.D. Decarbonising ships, planes and trucks: An analysis of suitable low-carbon fuels for the maritime, aviation and haulage sectors. Adv. Appl. Energy 2021, 1, 100008. [Google Scholar] [CrossRef]
- Statkraft. 23 June 2021. Available online: https://www.statkraft.com/newsroom/news-and-stories/archive/2021/hydrogen-deliveries/ (accessed on 2 October 2021).
- Ship Technology. Wartsila and Grieg to Build World’s First Green Ammonia-Fuelled Tanker, Ship Technology. 21 December 2020. Available online: https://www.ship-technology.com/news/wartsila-grieg-first-green-ammonia-fuelled-tanker/#:~:text=Once%20built%2C%20it%20will%20be%20the%20world%E2%80%99s%20first,by%20Zeeds%20%28Zero%20Emission%20Energy%20Distribution%20at%20Sea%29 (accessed on 2 October 2021).
- Hansson, J.; Månsson, S.; Brynolf, S.; Grahn, M. Alternative marine fuels: Prospects based on multi-criteria decision analysis involving Swedish stakeholders. Biomass-Bioenergy 2019, 126, 159–173. [Google Scholar] [CrossRef]
- Deniz, B.Z.C. Environmental and economical assessment of alternative marine fuels. J. Clean. Prod. 2015, 113, 438–449. [Google Scholar] [CrossRef]
- Ren, J.; Liang, H. Measuring the sustainability of marine fuels: A fuzzy groupmulti-criteria decision making approach. Transp. Res. Part D 2017, 54, 12–29. [Google Scholar] [CrossRef]
- Ren, J.; Lützen, M. Selection of sustainable alternative energy source for shipping: Multi-criteria decision making under incomplete information. Renew. Sustain. Energy Rev. 2017, 74, 1003–1019. [Google Scholar] [CrossRef]
- Foretich, A.; Zaimes, G.G.; Hawkins, T.R.; Newes, E. Challenges and opportunities for alternative fuels in the maritime sector. Marit. Transp. Res. 2021, 2, 100033. [Google Scholar] [CrossRef]
- Romano, A.; Yang, Z. Decarbonisation of shipping: A state of the art survey for 2000–2020. Ocean Coast. Manag. 2021, 214, 105936. [Google Scholar] [CrossRef]
- Xing, H.; Stuart, C.; Spence, S.; Chen, H. Alternative fuel options for low carbon maritime transportation: Pathways to 2050. J. Clean. Prod. 2021, 297, 126651. [Google Scholar] [CrossRef]
- DNV.GL. Comparison of Alternative Marine Fuels; DNV GL AS Maritime: Hovik, Viken, Norway, 2019. [Google Scholar]
- ABS. Setting the Course to Low Carbon Shipping; American Bureau of Shipping: Houston, TX, USA, 2019. [Google Scholar]
- Winebrake, J.; Corbett, J.J.; Meyer, P.E. Energy Use and Emissions from Marine Vessels: A Total Fuel Life Cycle Approach. J. Air Waste Manag. Assoc. 2012, 57, 102–110. [Google Scholar] [CrossRef] [PubMed] [Green Version]
- TEAMS. The Total Energy and Emissions Analysis for Marine Systems Model. The Center for Energy Analysis and Policy. Available online: https://www.rit.edu/cla/teams/ (accessed on 19 October 2021).
- Linde. Hydrogen. Available online: https://www.linde-engineering.com/en/hydrogen/index.html (accessed on 23 May 2021).
- ASPEN HYSYS. Natural Gas Plant Model; ASPEN HYSYS: Bedford, UK, 2019. [Google Scholar]
- Aspentech. Aspen Hysys. 2021. Available online: https://www.aspentech.com/en/products/engineering/aspen-hysys (accessed on 6 December 2021).
- SourGas. Amine Types: MEA, DGA, DEA, DIPA, MDEA. 21 February 2016. Available online: https://sourgas.wordpress.com/2016/02/21/amine-types-mea-dga-dea-dipa-mdea/ (accessed on 17 April 2021).
- DNV.GL. Assessment of Selected Alternative Fuels and Technologies; DNV.GL: Viken, Norway, 2019. [Google Scholar]
- The Engineers Post. Difference between Internal and External Combustion Engine. 26 September 2021. Available online: https://www.theengineerspost.com/difference-between-internal-and-external-combustion-engine/#:~:text=The%20internal%20combustion%20engine%20has%20an%20efficiency%20of,of%20the%20external%20combustion%20engine%20is%20relatively%20low (accessed on 26 July 2021).
- Ekwonu, M.C.; Perry, S.; Oyedoh, E.A. Modelling and Simulation of Gas Engines Using Aspen HYSYS. J. Eng. Sci. Technol. Rev. 2013, 6, 1–4. [Google Scholar] [CrossRef]
- Machinery Spaces. Ships Power Generation Equipment & Distribution System. Available online: http://machineryspaces.com/electrical-plant.html (accessed on 27 July 2021).
- Olabode, O.H.; Florence, S.; Rabiu, M.; Gadam, I.S. Linear Modeling of Hydrogen Fuel Cell with Energy and Water By-products at 60% Efficiency Factor. Agric. Environ. 2021, 2, 39–43. [Google Scholar]
- Linde. Ammonia: Linde Supplies Ammonia Plants Using Two Different Process Concepts. Available online: https://www.linde-engineering.com/en/about-linde-engineering/success-stories/industry-partner-in-russia.html (accessed on 22 July 2021).
- Essential Chemical Industry. Ammonia. 18 October 2016. Available online: https://essentialchemicalindustry.org/chemicals/ammonia.html?fbclid=IwAR0zT09j8GEq75xsIaf45VoxKTBIHQJ0NzNFdWtJRh9XJ-d28GBXiijfdVc (accessed on 7 April 2021).
- Steam Cycle Simulation—HYSYS v8.6. 2015. Available online: https://inside.mines.edu/~jjechura/EnergyTech/Boiler_Steam_Cycle_HYSYSv8.6.pdf (accessed on 22 May 2021).
- Greed, G. Aspen HYSYS Lecture 08 Conversion Reactor. Available online: https://www.bing.com/videos/search?q=aspen+hysys+conversion+reactor&&view=detail&mid=4E59C27269350FDAA95C4E59C27269350FDAA95C&&FORM=VRDGAR&ru=/videos/search?q%3Daspen%2Bhysys%2Bconversion%2Breactor%26%26FORM%3DVDVVXX (accessed on 1 May 2020).
- Siemens. Siemens Steam Turbines for Coal-Fired Steam Power Plants (SPP). 2015. Available online: https://assets.siemens-energy.com/siemens/assets/api/uuid:6ace0e54-d187-435c-93c0-10614dc5cbb6/steam-turbines-for-spp-presentation.pdf (accessed on 21 May 2021).
- Storm, K. Combined cycle power plant (1 × 1) labor estimate. Ind. Constr. Estim. Man. 2021, 04887X, 95–159. [Google Scholar]
- Burton, N.A.; Padilla, R.V.; Rose, A.; Habibullah, H. Increasing the efficiency of hydrogen production from solar powered water electrolysis. Renew. Sustain. Energy Rev. 2020, 135, 110255. [Google Scholar] [CrossRef]
- Rafieyan, S.; Bayat, A. Process Simulation of Biodiesel Production from Soybean Oil with Aspen HYSYS: A Comparative Study of two different processes. In Proceedings of the 11th International Chemical Engineering Congress & Exhibition, Fouman, Iran, 15–17 April 2020. [Google Scholar]
- HomeGuide. Solar Panel Cost. Available online: https://homeguide.com/costs/solar-panel-cost (accessed on 1 June 2021).
- Scottish Government. Offshore Wind to Green Hydrogen: Opportunity Assessment. 21 December 2020. Available online: https://www.gov.scot/publications/scottish-offshore-wind-green-hydrogen-opportunity-assessment/pages/5/ (accessed on 27 July 2021).
- SankeyMATIC. Available online: https://www.sankeymatic.com/ (accessed on 1 August 2021).
- McKinlay, C.J.; Turnock, S.R.; Hudson, D.A. Route to zero emission shipping: Hydrogen, ammonia or methanol? Int. J. Hydrogen Energy 2021, 46, 28282–28297. [Google Scholar] [CrossRef]
- Balcombe, P.; Brierley, J.; Lewis, C.; Skatvedt, L.; Speirs, J.; Hawkes, A.; Staffell, I. How to decarbonise international shipping: Options for fuels, technologies and policies. Energy Convers. Manag. 2019, 182, 72–88. [Google Scholar] [CrossRef]
- Chambers, S. Global Methane Pledge to Be Unveiled at COP26 Heaps More Pressure on LNG Fuel Proponents, Slash. 2 November 2021. Available online: https://splash247.com/global-methane-pledge-to-be-unveiled-at-cop26-heaps-more-pressure-on-lng-fuel-proponents/#:~:text=The%20study%20claims%20that%20by%202030%20methane%20slip,50%25%20compared%20with%20a%20first-generation%20low%20pressure%20engine (accessed on 6 December 2021).
- Gilbert, P.; Walsh, C.; Traut, M.; Kesieme, U.; Pazouki, K.; Murphy, A. Assessment of full life-cycle air emissions of alternative shipping fuels. J. Clean. Prod. 2018, 172, 855–866. [Google Scholar] [CrossRef]
- Al-Enazi, A.; Okonkwo, E.C.; Bicer, Y.; Al-Ansari, T. A review of cleaner alternative fuels for maritime transportation. Energy Rep. 2021, 7, 1962–1985. [Google Scholar] [CrossRef]
- Al-Aboosi, F.Y.; El-Halwagi, M.M.; Moore, M.; Nielsen, R.B. Renewable ammonia as an alternative fuel for the shipping industry. Curr. Opin. Chem. Eng. 2021, 31, 100670. [Google Scholar] [CrossRef]
- Atilhan, S.; Park, S.; El-Halwagi, M.M.; Atilhan, M.; Moore, M.; Nielsen, R.B. Green hydrogen as an alternative fuel for the shipping industry. Curr. Opin. Chem. Eng. 2021, 31, 100688. [Google Scholar] [CrossRef]
- Nigen. How to Separate Nitrogen from Air. 22 May 2018. Available online: https://nigen.com/how-separate-nitrogen-from-air-ways-extract-nitrogen/ (accessed on 22 July 2021).
- Akker, J.V.D. Carbon Capture Onboard LNG-Fueled Vessels. Master’s Thesis, Delft University of Technology, Delft, The Netherlands, 2017. [Google Scholar]


 = 10,
= 10,  = 7,
= 7,  = 4).
= 4).
 ≥ 7; 7 >
  > 4;
> 4;  ≤4).
≤4).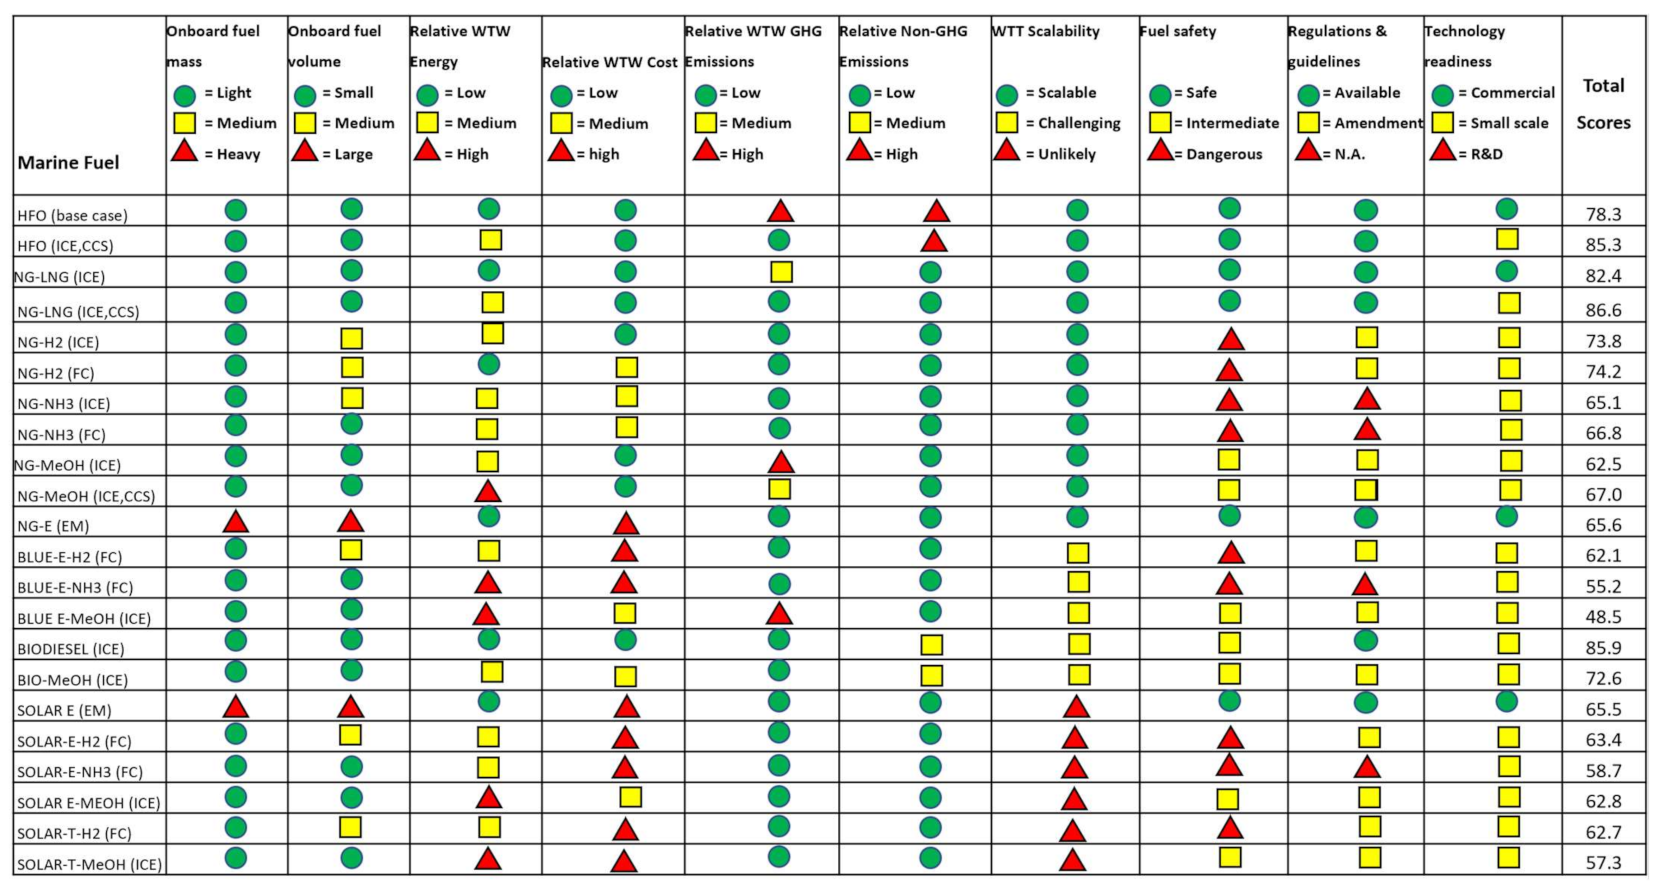
| Marine Fuel Pathways | Abbreviations |
|---|---|
| Pathway 1: Base Case: Crude–HFO–ICE a | HFO (Base case) |
| Pathway 2: Crude–HFO–ICE–CCS | HFO (CCS) |
| Pathway 3: NG–LNG–ICE | LNG |
| Pathway 4: NG–LNG–ICE–CCS | LNG (CCS) |
| Pathway 5: NG–H2–ICE | BLUE H2 |
| Pathway 6: NG–H2–FC | BLUE H2 (FC) |
| Pathway 7: NG–NH3–ICE | BLUE NH3 |
| Pathway 8: NG–NH3–FC | BLUE NH3 (FC) |
| Pathway 9: NG–MeOH–ICE | MEOH |
| Pathway 10: NG–MeOH–ICE–CCS | BLUE MEOH (CCS) |
| Pathway 11: NG–Electricity–EM | NG-E |
| Pathway 12: NG–Electricity–H2–FC b | BLUE E-H2 (FC) |
| Pathway 13: NG–Electricity–NH3–FC b | BLUE E-NH3 (FC) |
| Pathway 14: NG-Electricity–MeOH–ICE b | BLUE E-MEOH |
| Pathway 15: Biomass–Biodiesel–ICE c | BIO-DIESEL |
| Pathway 16: Biomass–Bio-MeOH–ICE c | BIO-MEOH |
| Pathway 17: Solar–Electricity–EM | SOLAR E |
| Pathway 18: Solar–Electricity–H2–FC | SOLAR E-H2 (FC) |
| Pathway 19: Solar–Electricity–NH3–FC | SOLAR E-NH3 (FC) |
| Pathway 20: Solar–Electricity–MeOH–ICE | SOLAR E-MEOH |
| Pathway 21: Solar–Thermochemical–H2-FC | SOLAR T-H2 (FC) |
| Pathway 22: Solar–Thermochemical–MeOH | SOLAR T-MeOH |
| Sources of Database | Aspen Modelling | Literature Review | |
|---|---|---|---|
| Marine Fuel Pathways | References | Energy Database | Cost Database |
| Base Case: Crude–HFO–ICE | [19] | [20] | |
| Crude–HFO–ICE–CCS | [18,19] | [20] | |
| NG–LNG–ICE | [21], | [20] | [11] |
| NG–LNG–ICE–CCS | [18,21] | [20] | |
| NG–H2–ICE | [17,21] | [20] | [11] |
| NG–H2–FC | [17] | [22,23] | [11] |
| NG–NH3–ICE | [21,24,25] | [20] | [11] |
| NG–NH3–FC | [24,25] | [22,23] | |
| NG–MeOH–ICE | [21], | [20] | [11] |
| NG–MeOH–ICE–CCS | [18,21] | [20] | |
| NG–Electricity–EM | [21,26,27,28] | [22,29] | [11] |
| NG–Electricity–H2–FC | [21] | [22,23,30] | |
| NG–Electricity–NH3–FC | [21] | [22,23,29,30] | |
| NG-Electricity–MeOH–ICE | [21] | [20,29,30] | |
| Biomass–Biodiesel –ICE | [31] | [20] | [11] |
| Biomass–Bio-MeOH –ICE | N.A. | [20] | |
| Solar–Electricity–EM | N.A. | [22] | [32] |
| Solar–Electricity–H2–FC | N.A. | [22,23,30,33] | [11,32] |
| Solar–Electricity–NH3–FC | N.A. | [20,23,30] | [11,32] |
| Solar–Electricity–MeOH–ICE | N.A. | [20,30] | [32] |
| Solar–Thermochemical–H2–FC | N.A. | [22,23] | [32] |
| Solar–Thermochemical–MeOH | N.A. | [20] | [32] |
| Marine Fuel Assessment | Weightage (%) | |
|---|---|---|
| Quantitative factors | Relative fuel mass onboard | 7.5% |
| Relative fuel volume onboard | 7.5% | |
| Relative life cycle (WTW) energy | 20% | |
| Relative life cycle (WTW) cost | 20% | |
| Relative WTW GHG emission | 20% | |
| Relative WTW non-GHG emission | 5% | |
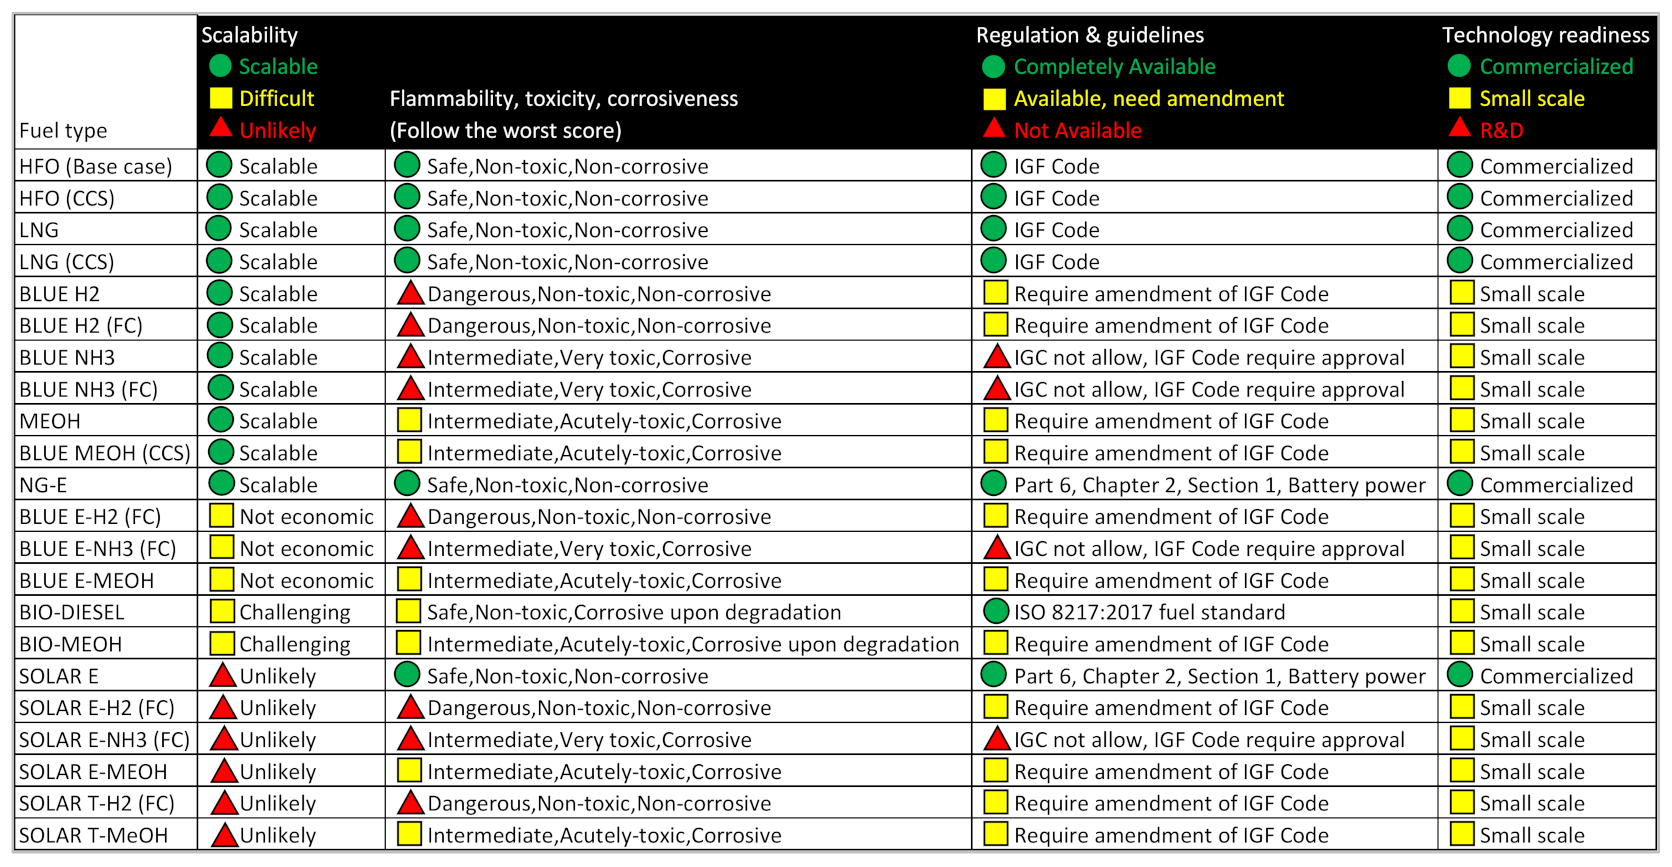
| Qualitative factors | Fuel production scalability | 5% |
| Fuel safety | 5% | |
| Availability of regulations and guidelines | 5% | |
| Technology readiness | 5% |
| Sources of Database |  Score = 10 Score = 10 |  Score = 7 Score = 7 |  Score = 4 Score = 4 |
|---|---|---|---|
| Fuel production scalability | Scalable | Scalable, but challenging | Unlikely |
| Fuel safety | Safe, non-toxic, non-corrosive | Intermediate, acutely toxic, corrosive | Dangerous, very toxic, very corrosive |
| Availability of regulations and guidelines | Available | Require amendment | Not available |
| Technology readiness | Commercialized | Small scale | R&D |
| (a) | ||||||||
|---|---|---|---|---|---|---|---|---|
| Fuel Type | Relative Mass | Relative Volume | Relative WTW Energy | Relative WTW Cost | Relative WTW GHG | Relative NOx | Relative SOx | Relative PM |
| HFO (Base case) | 100% | 100% | 100% | 100% | 100% | 100% | 100% | 100% |
| HFO (CCS) | 122% | 122% | 122% | 118% | 11% | 100% | 100% | 100% |
| LNG | 84% | 191% | 101% | 110% | 92% | 7% | 0% | 4% |
| LNG (CCS) | 103% | 233% | 122% | 129% | 24% | 7% | 0% | 4% |
| BLUE H2 | 35% | 450% | 138% | 306% | 17% | 100% | 0% | 0% |
| BLUE H2 (FC) | 28% | 365% | 112% | 469% | 14% | 0% | 0% | 0% |
| BLUE NH3 | 226% | 368% | 178% | 371% | 34% | 100% | 0% | 0% |
| BLUE NH3 (FC) | 183% | 299% | 145% | 521% | 27% | 0% | 0% | 0% |
| MEOH | 211% | 259% | 177% | 221% | 129% | 19% | 0% | 0% |
| BLUE MEOH (CCS) | 264% | 324% | 222% | 245% | 51% | 19% | 0% | 0% |
| NG-E | 1669% | 814% | 72% | 5304% | 6% | 0% | 0% | 0% |
| BLUE E-H2 (FC) | 28% | 365% | 182% | 585% | 26% | 0% | 0% | 0% |
| BLUE E-NH3 (FC) | 183% | 299% | 211% | 635% | 38% | 0% | 0% | 0% |
| BLUE E-MEOH | 211% | 259% | 261% | 354% | 143% | 19% | 0% | 0% |
| BIO-DIESEL | 112% | 125% | 100% | 190% | 1% | 108% | 11% | 26% |
| BIO-MEOH | 211% | 259% | 134% | 384% | 15% | 108% | 11% | 26% |
| SOLAR E | 1669% | 814% | 47% | 5375% | 0% | 0% | 0% | 0% |
| SOLAR E-H2 (FC) | 28% | 365% | 145% | 717% | 0% | 0% | 0% | 0% |
| SOLAR E-NH3 (FC) | 183% | 299% | 170% | 757% | 0% | 0% | 0% | 0% |
| SOLAR E-MEOH | 211% | 259% | 210% | 522% | 15% | 19% | 0% | 0% |
| SOLAR T-H2 (FC) | 28% | 365% | 156% | 707% | 0% | 0% | 0% | 0% |
| SOLAR T-MeOH | 211% | 259% | 224% | 681% | 15% | 19% | 0% | 0% |
| (b) | ||||||||
| Fuel Type | Fuel Mass Score 1–10 (Heaviest to Lightest) | Fuel Volume Score 1–10 (Small to Large) | WTW Energy Score 1–10 (High Energy Intensity to Low) | WTW Cost Score 1–10 (High Cost to Low) | WTW GHG Emission Score 1–10 (High Emission to Low) | Non-GHG Emission Score Score 1–10 (High Emission to Low) | ||
| HFO (Base case) | 9.6 | 10.0 | 7.8 | 10.0 | 3.7 | 1.2 | ||
| HFO (CCS) | 9.5 | 9.7 | 6.9 | 9.7 | 9.3 | 1.2 | ||
| LNG | 9.7 | 8.9 | 7.8 | 9.9 | 4.2 | 9.7 | ||
| LNG (CCS) | 9.6 | 8.3 | 6.9 | 9.6 | 8.5 | 9.7 | ||
| BLUE H2 | 10.0 | 5.6 | 6.2 | 7.2 | 8.9 | 7.2 | ||
| BLUE H2 (FC) | 10.0 | 6.7 | 7.3 | 4.9 | 9.1 | 10.0 | ||
| BLUE NH3 | 8.9 | 6.6 | 4.5 | 6.3 | 7.9 | 7.2 | ||
| BLUE NH3 (FC) | 9.2 | 7.5 | 5.9 | 4.2 | 8.3 | 10.0 | ||
| MEOH | 9.0 | 8.0 | 4.5 | 8.3 | 1.9 | 9.5 | ||
| BLUE MEOH (CCS) | 8.7 | 7.2 | 2.7 | 8.0 | 6.8 | 9.5 | ||
| NG-E | 1.0 | 1.0 | 9.0 | 1.0 | 9.6 | 10.0 | ||
| BLUE E-H2 (FC) | 10.0 | 6.7 | 4.3 | 3.4 | 8.4 | 10.0 | ||
| BLUE E-NH3 (FC) | 9.2 | 7.5 | 3.1 | 2.7 | 7.6 | 10.0 | ||
| BLUE E-MEOH | 9.0 | 8.0 | 1.0 | 6.5 | 1.0 | 9.5 | ||
| BIO-DIESEL | 9.5 | 9.7 | 7.8 | 8.8 | 9.9 | 5.9 | ||
| BIO-MEOH | 9.0 | 8.0 | 6.3 | 6.1 | 9.0 | 5.9 | ||
| SOLAR E | 1.0 | 1.0 | 10.0 | 1.0 | 10.0 | 10.0 | ||
| SOLAR E-H2 (FC) | 10.0 | 6.7 | 5.9 | 1.5 | 10.0 | 10.0 | ||
| SOLAR E-NH3 (FC) | 9.2 | 7.5 | 4.8 | 1.0 | 10.0 | 10.0 | ||
| SOLAR E-MEOH | 9.0 | 8.0 | 3.1 | 4.2 | 9.1 | 9.5 | ||
| SOLAR T-H2 (FC) | 10.0 | 6.7 | 5.4 | 1.7 | 10.0 | 10.0 | ||
| SOLAR T-MeOH | 9.0 | 8.0 | 2.6 | 2.0 | 9.1 | 9.5 | ||
Publisher’s Note: MDPI stays neutral with regard to jurisdictional claims in published maps and institutional affiliations. |
© 2021 by the authors. Licensee MDPI, Basel, Switzerland. This article is an open access article distributed under the terms and conditions of the Creative Commons Attribution (CC BY) license (https://creativecommons.org/licenses/by/4.0/).
Share and Cite
Law, L.C.; Foscoli, B.; Mastorakos, E.; Evans, S. A Comparison of Alternative Fuels for Shipping in Terms of Lifecycle Energy and Cost. Energies 2021, 14, 8502. https://doi.org/10.3390/en14248502
Law LC, Foscoli B, Mastorakos E, Evans S. A Comparison of Alternative Fuels for Shipping in Terms of Lifecycle Energy and Cost. Energies. 2021; 14(24):8502. https://doi.org/10.3390/en14248502
Chicago/Turabian StyleLaw, Li Chin, Beatrice Foscoli, Epaminondas Mastorakos, and Stephen Evans. 2021. "A Comparison of Alternative Fuels for Shipping in Terms of Lifecycle Energy and Cost" Energies 14, no. 24: 8502. https://doi.org/10.3390/en14248502
APA StyleLaw, L. C., Foscoli, B., Mastorakos, E., & Evans, S. (2021). A Comparison of Alternative Fuels for Shipping in Terms of Lifecycle Energy and Cost. Energies, 14(24), 8502. https://doi.org/10.3390/en14248502