Article

Electricity Generation from Low and Medium Temperature Industrial Excess Heat in the Kraft Pulp and Paper Industry

1
Energy Systems, Department of Management and Engineering, Linköping University, SE-581 83 Linköping, Sweden
2
CIT Industriell Energi AB, Sven Hultins Plats 1, SE-412 58 Gothenburg, Sweden
3
Energy Technology, Department of Space, Earth and Engineering, Chalmers University of Technology, SE-412 96 Gothenburg, Sweden
*
Author to whom correspondence should be addressed.
Energies 2021, 14(24), 8499; https://doi.org/10.3390/en14248499
Submission received: 9 November 2021 / Revised: 10 December 2021 / Accepted: 13 December 2021 / Published: 16 December 2021
(This article belongs to the Special Issue Applications and New Technologies of Waste Heat Recovery)

Abstract

:
The recovery and utilisation of industrial excess heat has been identified as an important contribution for energy efficiency by reducing primary energy demand. Previous works, based on top-down studies for a few sectors, or regional case studies estimated the overall availability of industrial excess heat. A more detailed analysis is required to allow the estimation of potentials for specific heat recovery technologies, particularly regarding excess heat temperature profiles. This work combines process integration methods and regression analysis to obtain cogeneration targets, detailed excess heat temperature profiles and estimations of electricity generation potentials from low and medium temperature excess heat. The work is based on the use of excess heat temperature (XHT) signatures for individual sites and regression analysis using publicly available data, obtaining estimations of the technical potential for electricity generation from low and medium temperature excess heat (60–140 °C) for the whole Swedish kraft pulp and paper industry. The results show a technical potential to increase the electricity production at kraft mills in Sweden by 10 to 13%, depending on the level of process integration considered, and a lower availability of excess heat than previously estimated in studies for the sector. The approach used could be adapted and applied in other sectors and regions, increasing the level of detail at which industrial excess heat estimations are obtained when compared to previous studies.

1. Introduction

In 2018, the Intergovernmental Panel on Climate Change (IPCC) issued a Special Report identifying the impacts of global warming of 1.5 °C above pre-industrial levels [1]. The report calls for immediate action to achieve deep greenhouse gas emissions reductions and to reach net zero emissions by 2050. The European Commission’s 2050 Climate Strategy seeks to achieve this goal and establishes that renewable electricity is the most important single driver for a decarbonised energy system [2]. In addition, the current Swedish Climate Act entered into force in January 2018 with the aim of making Sweden carbon neutral by 2045, and to reduce GHG emissions by 63 percent (1990 baseline) by 2030 [3]. The International Energy Agency (IEA) expects that energy efficiency will contribute to more than 40 percent of the reduction in CO2 emissions by 2040 [4]. Increased recovery and use of industrial excess heat (IEH) has been identified as an important aspect of industrial energy efficiency to be analysed [5,6]. The utilisation of IEH reduces the use of primary energy resources that would otherwise be needed for the production of heat or to supply other energy services [7,8].
Brueckner et al. [9] reviewed and categorised different methods for estimating excess heat availability methods based on their approach (bottom-up or top-down studies), data sources and acquisition (questionnaires, mandatory reports, online platforms) and scale of coverage (local, regional, national, etc.). There are several studies estimating the availability of IEH and recovery potentials at national and regional levels, often resorting to energy and exergy analysis methods. In the UK, for example, McKenna and Norman [10] categorised heat users into broad temperature intervals to quantify heat loads and the excess heat availability at different temperatures for specific sites and provide a spatial distribution. The analysis was based on data from the EU Emissions Trading Scheme together with specific energy use and process data for the most important industrial sectors, covering 90% of the energy intensive industries. A potential recovery of 5.5 to 22% of energy input was reported. Based on these results, Hammond and Norman [11] estimated the technical potential of several heat recovery technologies for use onsite, electricity generation or deliveries to cover external heat demands, finding that 8% of the energy input was technically recoverable as excess heat, most of it as direct heat recovery below 100 °C. Electricity generation was only considered above 100 °C, using ORC technology. Additionally, using results from McKenna and Norman [10] for the UK, Cooper et al. [12], found that only half of the heat rejected by industry could be utilised in district heating (DH) networks due to the distances and heat demand densities found.
Bühler et al. [13] present a geographical mapping of excess heat and heat demands for six regions in the industrial and utility sectors in Denmark to identify their utilisation potentials based on technical and economic feasibility criteria. Heat pumping, direct heat deliveries and ORC electricity production were the utilisation options analysed. Electricity generation considered heat sources between 100 and 350 °C. The results showed that the excess heat temperature and energy prices were the most important parameters for the recovery of excess heat. In two other studies focusing on excess heat utilisation in DH networks and looking at 22 industrial sectors, Bühler et al. [14,15] first found that 5.1% of DH demand in Denmark could be supplied by IEH, either directly or through heat pumping. However, after analysing the temporal match between excess heat and heating demands, as well as economic criteria, 30% of this potential could not be realised. There were also cases in which the availability of excess heat exceeded the demand nearby.
More examples of national studies of industrial excess heat potentials are Brückner et al. [16], based on CO2 emission data reported in the German manufacturing industry, with a coverage of 50% of industrial fuel energy input and results showing an excess heat ratio of 13% of fuel input on a reference temperature of 35 °C. In Norway, Sollesnes and Hegelrund [17] sent questionnaires to 72 industrial companies and discussed utilisation potentials based on the answers, with most excess heat being found in the pulp and paper industry, followed by metals and chemicals. Additionally, using questionnaires, Broberg et al. [18] surveyed 85 large scale industries in two Swedish regions, responsible for 8.5% of the national industrial energy use, and extrapolated the results for excess heat availability for the whole country. The study found about 2TWh of excess heat available for direct use and 21TWh possibly recoverable after heat pumping, which is about 12% of the total energy use in industry in the regions surveyed. In Sweden, IEH is currently responsible for 7.5% of the energy supply for DH networks [19], and Broberg et al. [18] found that the potential for increased use is significant, including for applications other than DH. Other countries with reported potentials are Switzerland [20], China [21], the US [22] and France [23].
A few other studies quantified IEH potentials on a European level. Person et al. [24] used CO2 emission data from the Europe Pollutant Release and Transfer Register (E-PRTR) to assess excess heat volumes from fuel combustion activities and evaluate strategic regions suitable for large-scale DH implementation. The study found that 46% of the excess heat in EU27 are located in the identified regions, corresponding to 31% of the total building heat demands of such regions. This study, however, does not report on temperature levels. An updated atlas for the spatial heat demand distribution was published (see Möller et al. [25]), with preliminary figures for excess heat availability. Naegler et al. [26] estimated the industrial heat demand classified into three temperature levels, which could be used to quantify IEH availability with an approach similar to the one used by McKenna and Norman [10]. Miró et al. [27] present a compilation of excess heat data for 33 different countries and a discussion about the quality of reported data and parameters to check for reliability, and Lu et al. [21] also present a similar compilation, with a particular focus on Chinese excess heat studies.
The pulp and paper industry accounts for about 5% of the total final industrial energy used in IEA member countries [28], and about 51% in Sweden [29], being one of five most energy-intensive industries [30]. Improved energy efficiency and decarbonisation, combined with market challenges, have become a key competitive factor for the sector [31,32]. In Europe, which is responsible for 25.3 and 26.1% of the pulp and paper/board worldwide production, respectively, about 60% of the total fuel consumption of the sector comes from biomass, and 96% of the electricity produced is produced through CHP [33]. Although the IEA recognises positive developments in the sector, it estimates that the sector’s energy use must decline by 0.8% and non-biomass CO2 emissions must decrease by 17% by 2025 to stay within the agency’s 2 °C Scenario (2DS) [34]. While some sub-sectors, such as kraft pulping, are almost entirely decarbonised in many countries (such as Sweden) already, key challenges are instead related to better resource utilization in order to convert a larger share of the wood raw material into useful products that can contribute to decarbonisation in other sectors [35].
A number of studies on heat integration in pulp and paper mills discuss excess heat availability and utilisation options [7,18,36,37,38]. Most often, the utilisation opportunities below 100 °C in these studies include only direct heat deliveries to DH networks. One exception is Broberg Viklund and Johansson [37], who quantified electricity production potentials for ORC technology with heat sources above 80 °C and PCM engines in temperatures below 80 °C. This study, however, was based on questionnaires that reported only a few temperature levels. Studies on the heat integration of pulp and paper mills have also been focusing on process modifications to accommodate larger changes in the pulp and paper industry, analysing biomass gasification, lignin extraction and biorefinery concepts [39,40,41,42].
The literature review presented above showed that excess heat estimations for whole sectors lack a precise description of the temperature levels available for heat recovery and use only rough sector conversion efficiencies. On the other hand, detailed studies of heat integration potentials that include IEH estimations and utilisation options generally use a methodology that can only be applied for a few specific cases or would be too complicated to generalise. These more detailed studies also tend to focus on DH networks and direct heat deliveries, while it has been shown that low heat demand densities or even the inexistence of a heat demand close to the industrial site pose a problem for increased IEH utilisation [11,14]. One other problem is the current business models of heat production in DH systems, with uncertainties arising in relation to pricing, the division of investments and the security of supply in the cooperation between industry and utility companies [43]. For these reasons, the correct estimation of potentials for electricity production from low and medium temperature excess heat is important, in order to present alternatives for IEH utilisation that goes beyond direct heat deliveries to DH networks.
The aim of this paper is to analyse the opportunities for electricity generation with the utilisation of low and medium temperature excess heat (60–140 °C) in the Swedish kraft pulp and paper industry. A heat integration and optimisation methodology to estimate site-specific cogeneration targets (with traditional steam turbines) and excess heat availability is applied to six case studies. The case studies are based on four real mills and process stream data for two simulated mills, for two scenarios of heat integration. In the first scenario, a theoretical heat integration of the industrial process is assessed, while in the second scenario, practical process integration constraints and technical limitations based on typical real mills are considered in the assessment. Based on the results of these two scenarios, the case studies are used in a regression analysis to estimate the electricity production potential using low and medium temperature excess heat at all Swedish kraft mills (both pulp mills and pulp and paper mills, also called integrated mills). This production potential is based on the integration potential of organic Rankine cycles (ORC), taking into consideration real efficiencies in practical applications. The methodology applied has the advantage of estimating site-specific targets as well as allowing for the estimation of the potential for the whole sector in Sweden.

2. Industrial Excess Heat

The definition of IEH varies in different sources. The definition adopted in this paper is the one proposed by the IEA IETS—Annex XV: Industrial Excess Heat Recovery—Technologies and Applications, which states that “excess heat is the heat content of all streams (gas, water, air, etc.) which are discharged from an industrial process at a given moment” [44].
As thermal processes never achieve 100% efficiency and it is impossible to recover all the energy input to a system as useful work, a share of the energy is emitted as heat. The efficiency of a Carnot heat engine cycle is given by Equation (1).
η C a r n o t = 1 ( T c T h )
with Tc and Th, in K, as the temperatures of the heat sink and the heat source, respectively. Equation (1) shows that the efficiency of a Carnot heat engine cycle operating between two temperatures increases if the temperature difference increases and sets the maximum efficiency for a given temperature difference. The same efficiency limitation of a heat engine process in Equation (1) applies to the recovery of IEH as useful work, because the efficiency of IEH recovery has the Carnot cycle efficiency as its theoretical upper bound.
It is important to make a distinction between IEH potentials in terms of the system boundaries of the study. When looking at the potentials for the utilisation of IEH, these can be divided into the following three categories: a theoretical or physical potential, a technical potential and an economically feasible potential [9]. However, if IEH is studied from the perspective of its availability, the concept of avoidable and unavoidable excess heat must be considered. To evaluate this aspect, as introduced by Bendig et al. [45], process integration methods using, for example, pinch analysis are used to obtain the minimum energy requirements of a thermodynamically optimised process. Given that a certain process is thermodynamically optimised, the amount of IEH arising from that process is considered unavoidable. For processes that are not thermodynamically optimised, any difference between the IEH available and the amount that would be available if the process was optimised is considered avoidable excess heat. At this point, discussions arise as to what assumptions are considered in order to obtain the minimum energy requirements of a process, and for a discussion on this, see, for example [46]. A systematic way of handling these assumptions is presented in [47]. In the case of the utilisation potential of IEH, the technical potential is lower than the theoretical potential, whereas when considering the availability of IEH, the technical potential is, in most cases, greater than the theoretical potential that would remain after an optimised process of heat recovery within an existing process. This is the case, because in any real situation, a process will not be integrated to its maximum potential due to practical considerations, e.g., due to costs or other constraints to optimal integration.

2.1. Excess Heat Temperature Intervals

Most studies reporting IEH availability and recovery potentials present the results in an aggregated form in temperature intervals. The temperature intervals in which these potentials are aggregated vary broadly between studies. The reasons for reporting the availability of IEH in this form vary.
Studies based on top-down methods are based on aggregated data available for sectors, countries or regions, and typically lack the necessary detail to estimate the precise temperature levels of the IEH. These studies consider estimations of process conditions and conversion efficiencies that are generalised for entire industrial sectors, based on primary energy use and company size factors. Bottom-up methods make use of data on a process level to build up the excess heat availability for individual sites and sometimes aggregate the results to whole sectors, countries or regions [16]. Data for representative industries are collected. If the methods used to collect the data are detailed enough, more thorough conclusions such as the technical potential are reached [46]. However, bottom-up studies based on, for example, questionnaires and mandatory reports often do not collect process data on a level of detail that is sufficiently complete to understand the excess heat availability at any given temperature. One more factor of relevance is that the studies focus on different industrial sectors or different regions or countries, and these naturally contain industries with diverse production processes at different temperature levels. For example, studies including the iron and steel industry [48,49,50] or the cement industry [51] usually have much higher temperature levels of excess heat to report than studies in the pulp and paper industry [36] or the food industry [52].
As a result, these different studies label the temperature levels as “low”, “medium” or “high” in different ways, sometimes with other complementary levels. As there is not a uniform definition for IEH temperature levels, the studies tend to use the levels suitable for the industry-specific cases. In countries with a cold climate, such as Sweden, much lower temperatures of excess heat than usually considered are of relevance, as there are potential applications at these lower temperatures that are interesting in these regions, such as DH networks. Some of the new technologies under development and being introduced commercially make it possible to recover excess heat at lower temperatures than established technologies; therefore, a more detailed division of temperature intervals below 250 °C becomes necessary in these cases. Table 1 provides a compilation of the division of temperature intervals reported in previous studies on industrial excess heat. The results presented are only for the studies classifying the temperature intervals as low, medium and high. Several other studies use other definitions without characterising the intervals using such nomenclatures.
In this paper, the classification of excess heat temperature intervals presented in Table 2 is used. This division is used to highlight the benefits of technologies that work in temperature ranges below 140 °C. In particular, a division into several temperature intervals below 140 °C is beneficial when evaluating the electricity generation technology considered in this paper, namely ORC, but other excess heat recovery technologies are also applicable in the intervals adopted, see Table 3.

2.2. Identification of Technologies for Electricity Generation from Low and Medium Temperature Excess Heat

In principle, IEH can be used to generate electricity with any existing electricity generation technology, being limited only by the availability of excess heat and its temperature levels. In practice, the amount of excess heat available at individual industrial sites and its corresponding temperatures make current technologies, such as steam Rankine cycles and closed Brayton cycles, unsuitable for application in many sites or already applied at higher temperatures. A compilation of electricity generation technologies using excess heat was made to search for suitable technologies for application in the kraft pulp and paper industry (see Table 3). Based on previous results obtained by the authors in [56], and on previous studies reporting excess heat availability and temperature levels at pulp and paper mills [10,11,18,57], only technologies that work at 140 °C and below were considered for estimating new opportunities for electricity generation in this study. This temperature level was chosen because these studies make it clear that the availability of IEH above 140 °C in pulp and paper mills is very limited, as heat at these temperatures is already utilised to a large extent for CHP electricity generation, for example, in back-pressure steam turbines, and thus only corresponds to a small fraction of the total excess heat available. It is important to note that the integration of conventional electricity generation from back-pressure and low-pressure condensing steam turbines is considered in this study when estimating the availability of excess heat in the mills, as explained in the methods (See Section 4.1). Considering temperatures below 140 °C for IEH recovery and the technology characteristics in Table 3, organic Rankine cycle (ORC), absorption-Rankine cycle, phase change material (PCM) engine, Kalina cycle, CO2-transcritical cycle, thermoelectric generator (TEG) and Stirling cycle are suitable technologies for application in kraft mills. Among the suitable vapour cycles, ORC technology is the most proven commercial technology, with relatively higher efficiencies and the possibility to operate over most of the temperatures under consideration. This technology can also be installed in unit sizes that are compatible with application in pulp and paper mills with different amounts of excess heat available. Due to these cited characteristics, ORC technology was selected to be evaluated as the IEH recovery technology in this study.
Table 3. Technologies for conversion of industrial excess heat. Compiled with information from: [6,37,48,58].
TechnologyWorking
Temperature (°C)
Heat Source PhaseUnit Size (kWel)Electrical
Efficiency (%)
Stage of
Development
Rankine cycle>240Gas, steam0.5–1500 MW47 CondensingCommercial
30 CHP
ORC30–550Gas, liquid5 kW–15 MW5–20Commercial
Absorption Rankine cycle70–170Gas, liquid80–13015Demonstration
PCM25–95Liquid10–10002.5–9Experimental development
Kalina cycle80–180Gas, liquid0.05–12 MW12–17Commercial
CO2
trans-critical
60–540Gas, liquid0.25–80002.5–15Experimental development
TEG150–800Gas, liquid200–8001.5–5Small scale
commercial
TPV1000–1800Gas, liquid-1–2Experimental development
Stirling cycle100–700Gas, liquid100–30013–36Demonstration, commercial

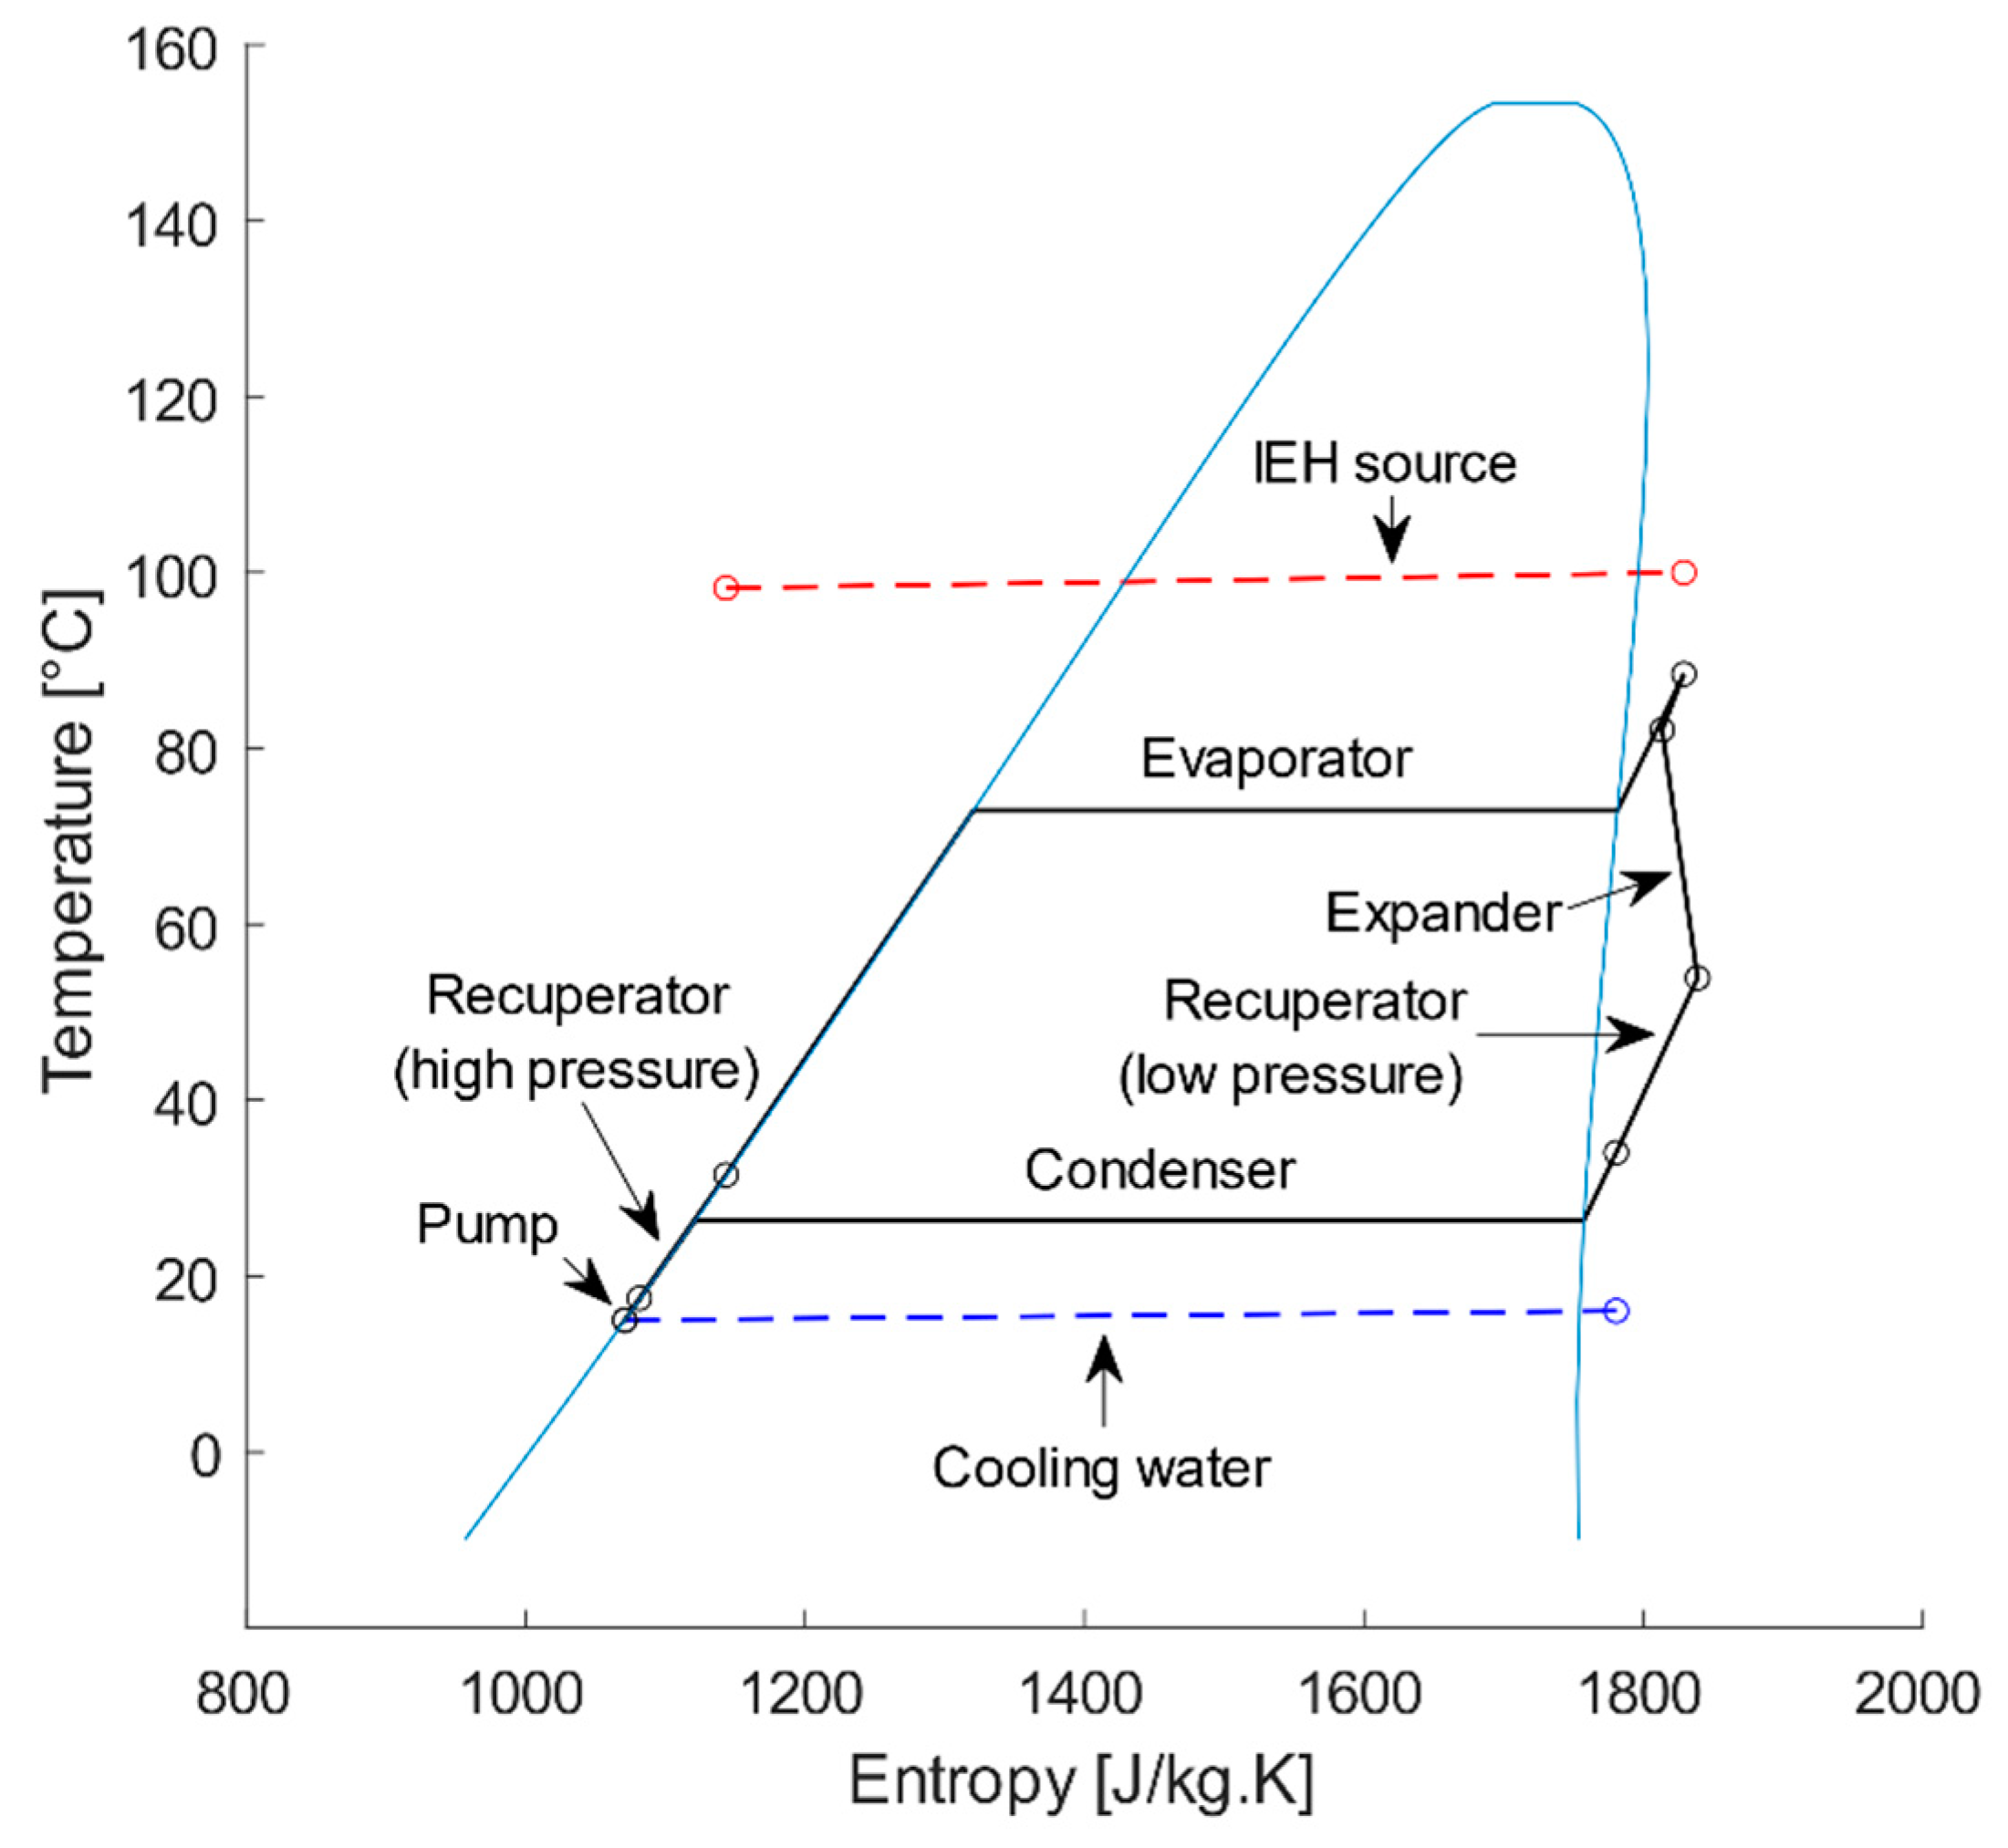
Organic Rankine Cycles (ORC)

Rankine cycles convert heat that is usually converted into electricity into mechanical energy. Rankine cycles, with water as the working medium, are the most used thermodynamic cycle in traditional electricity generation plants. However, the cycle running on water only achieves feasible efficiencies for heat sources above 240 °C [52]. Lower temperatures and the corresponding lower steam pressures require larger equipment, and the heat available at such temperatures is not sufficient for superheating the steam [37,58].
Intense research has been carried out on ORC systems in recent years, including for IEH applications (see, e.g., [51,59,60,61,62]). ORC systems take advantage of organic working fluids that have lower boiling points than water, thus allowing the use of heat sources at lower temperatures with higher efficiencies than if water is used [61]. The choice of organic fluid is application specific, and the options cover a wide range of boiling points. The fluid is usually selected for efficiency maximisation, based on the temperature of the heat source [49], the thermal stability and the boiling point, but also taking into account environmental parameters such as global warming potential, ozone depletion potential and toxicity [63]. Tchanche et al. [64] analysed 31 organic fluids for applications below 90 °C in small scale solar applications, while Saleh et al. [65] studied different cycle configurations applied to 30 organic fluids in geothermal applications below 120 °C. As with other conversion technologies, the conversion efficiency depends on the difference in temperature between the heat source and the heat sink, but also depends on the enthalpy of vaporisation, fluid specific volume, critical temperature and pressure, as well as composition in the case of mixed fluids [59,60,65].
Dickes et al. [66] developed a Matlab-based simulation tool for ORC cycles, ORCmKit. Among a series of options, there is a model for an ORC cycle with an internal heat exchanger (recuperator). Ziviani et al. [67] further developed the simulation tool to include a charge-sensitive analysis of ORC cycles. The tool includes semi-empirical ORC cycle models for the cycle components, calibrated with experimental data. This tool was used and adapted to estimate the ORC cycle characteristics, including the net efficiency of the ORC at the IEH temperature levels considered in this study. Figure 1 presents the T-s diagram of an example ORC cycle using the Matlab tool for IEH recovery at 100 °C, and cooling water temperature at 15 °C. The heat profiles of the IEH source and cooling water are shown, together with the cycle component points for a cycle running on R245fa (see Table 4 for fluid characteristics). R245fa is a common refrigerant for ORC cycles working at the temperature levels analysed. The simulation tool was used to estimate the ORC cycle efficiencies for the IEH temperatures considered.

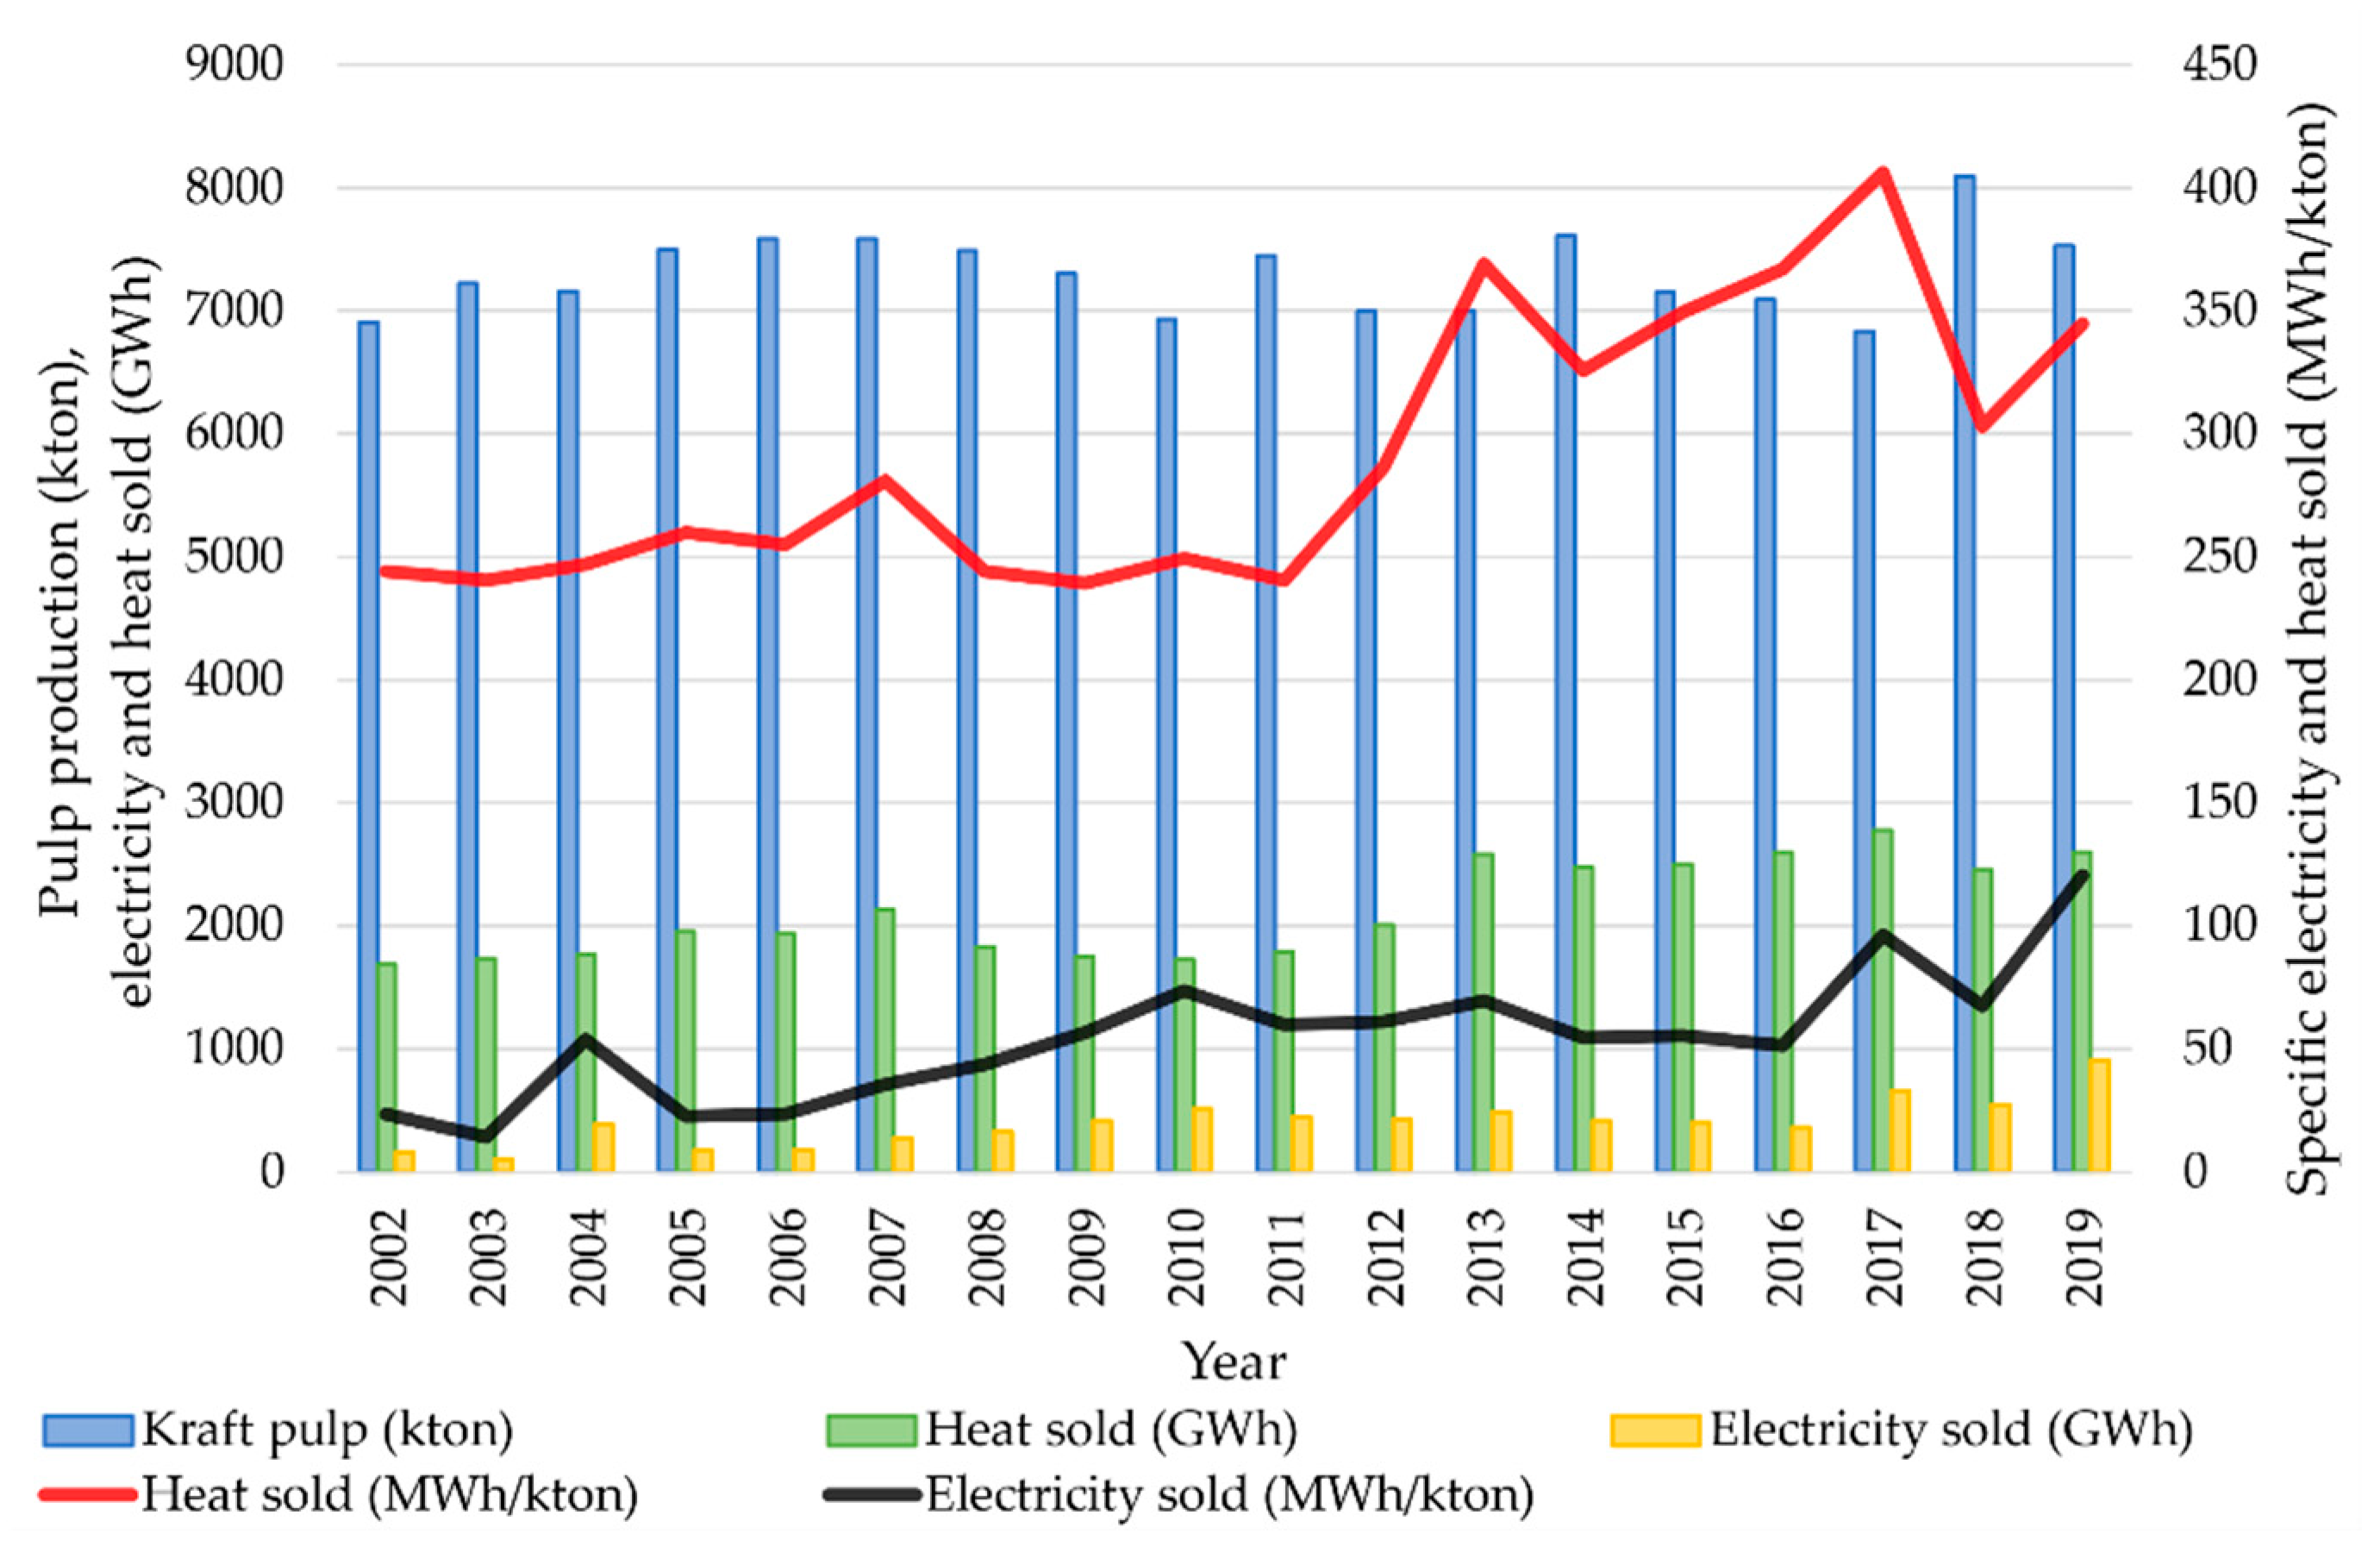
3. Energy Situation in the Swedish Kraft Pulp and Paper Sector
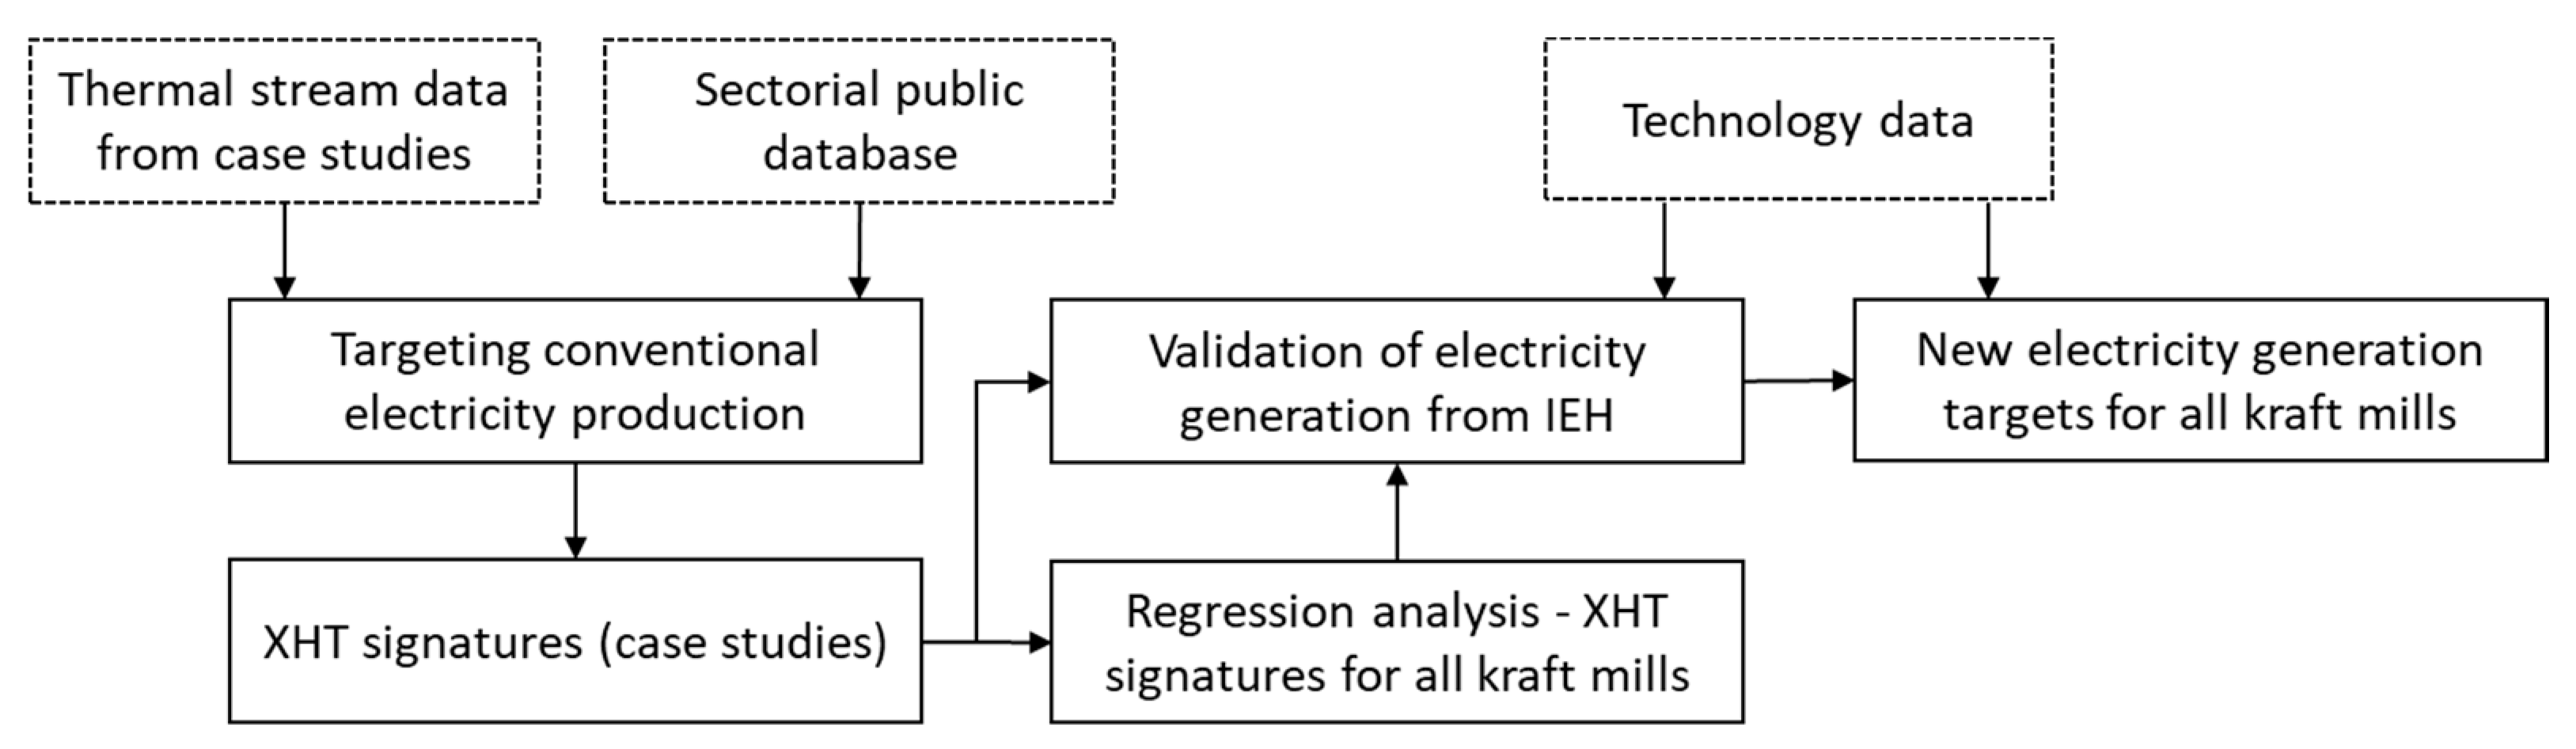
The pulp and paper industry is the largest energy user in the Swedish industrial sector. In 2017, the sector accounted for 50.5% of the final energy use in the industrial sector in Sweden (72.4 TWh out of 143.2 TWh) [68]. There are different types of mills in operation, but 61% of the total pulp production in 2017 in Swedish mills came from kraft mills [69], and Swedish mills accounted for around 31% of European pulp production in 2018 [33]. These mills convert large amounts of biomass feedstock. In the kraft process, a significant fraction of the lignin and hemicellulose content of the incoming biomass raw material leaves the mill digester in a black liquor stream, which is evaporated and burnt for chemical and energy recovery. The energy recovery results in process steam and electricity production that partially supplies the electricity requirements for the mill operation. The renewable electricity certificates system introduced in Sweden in 2003 has contributed to a substantial increase in the production of electricity in pulp and paper mills, since the process runs on biomass [70]. Figure 2 shows the trends in the kraft pulp industry over the past 18 years. While the amount of kraft pulp production has varied by about 18%, heat sales varied by up to 65% and electricity sales by over eight times. Considering the specific values per kiloton of pulp produced, heat and electricity sales show a general upwards trend. While this might indicate increasing energy efficiency over the years, other factors must be considered, e.g., the amount of biofuel used by the mills solely for energy production.
Figure 3 shows the declared amount of electricity produced in pulp and paper mills in Sweden in 2019 in relation to the biofuel used (including black liquor, bark and other wood residues). For the case of kraft mills, there is a clear linear relationship between biofuel usage and electricity production.
It is also common in Sweden for pulp and paper mills to export a certain amount of heat to nearby district heating systems, see Figure 3. However, for this case, the relationship between the amount of heat exported and biofuel usage is less clear.

4. Methods

In this section, the method for evaluating the potential for electricity generation from low and medium temperature excess heat is presented. An overall description is shown in Figure 4. Based on thermal stream data from six case studies and publicly available data for the pulp and paper mill sector in Sweden, targets for conventional electricity generation in steam turbines were obtained. The availability of excess heat remaining after the integration of steam turbine cycles corresponding to these targets was then estimated for each of the case studies. The results from the case studies were used to construct a regression model that was finally applied to estimate the excess heat availability for each kraft mill in Sweden. The regression model was validated against the electricity generation potential found for the case studies. Based on the results of the regression analysis, electricity generation potentials from low and medium temperature excess heat in the whole Swedish Kraft pulp mill sector were obtained.
Previous studies based on pinch analysis in Swedish kraft pulp and paper mills collected detailed process data, which were used in this paper to estimate the excess heat availability from four kraft mills [71,72,73,74]. These mills are two market pulp mills (Södra Cell Värö and SCA Östrand), and two integrated pulp and paper mills (Holmen Iggesund and Billerud-Korsnäs Karlsborg). The reader is referred to the original studies for details on the production process of each mill. Data from the FRAM (Future Resource Adapted Pulp Mill) project, aimed at defining benchmarks for the pulp and paper industry, were extracted for a typical kraft bleached market pulp mill [75] and a typical kraft integrated (pulp and paper) mill [76].
A summary of the data collected for the case studies is shown in Table 5. Most data for pulp and paper production as well as energy usage and export were retrieved from Miljödatabasen from 2002 to 2020 [69], an online database provided by the Swedish Forest Industries Federation, reporting on key operational parameters for most of the pulp and paper mills in the country. Data were retrieved from the database for the same reference year of the study that collected process thermal stream data (see references in Table 5). The mills studied may have undergone substantial revamping and retrofitting since the year when the data were collected. The data for SCA Östrand in particular are representative of an expansion that was planned in 2015. In this case, data were obtained through quotations and interaction with mill process experts, and therefore, may be affected by a larger error compared to the other cases, as the data are not based on actual measurements.

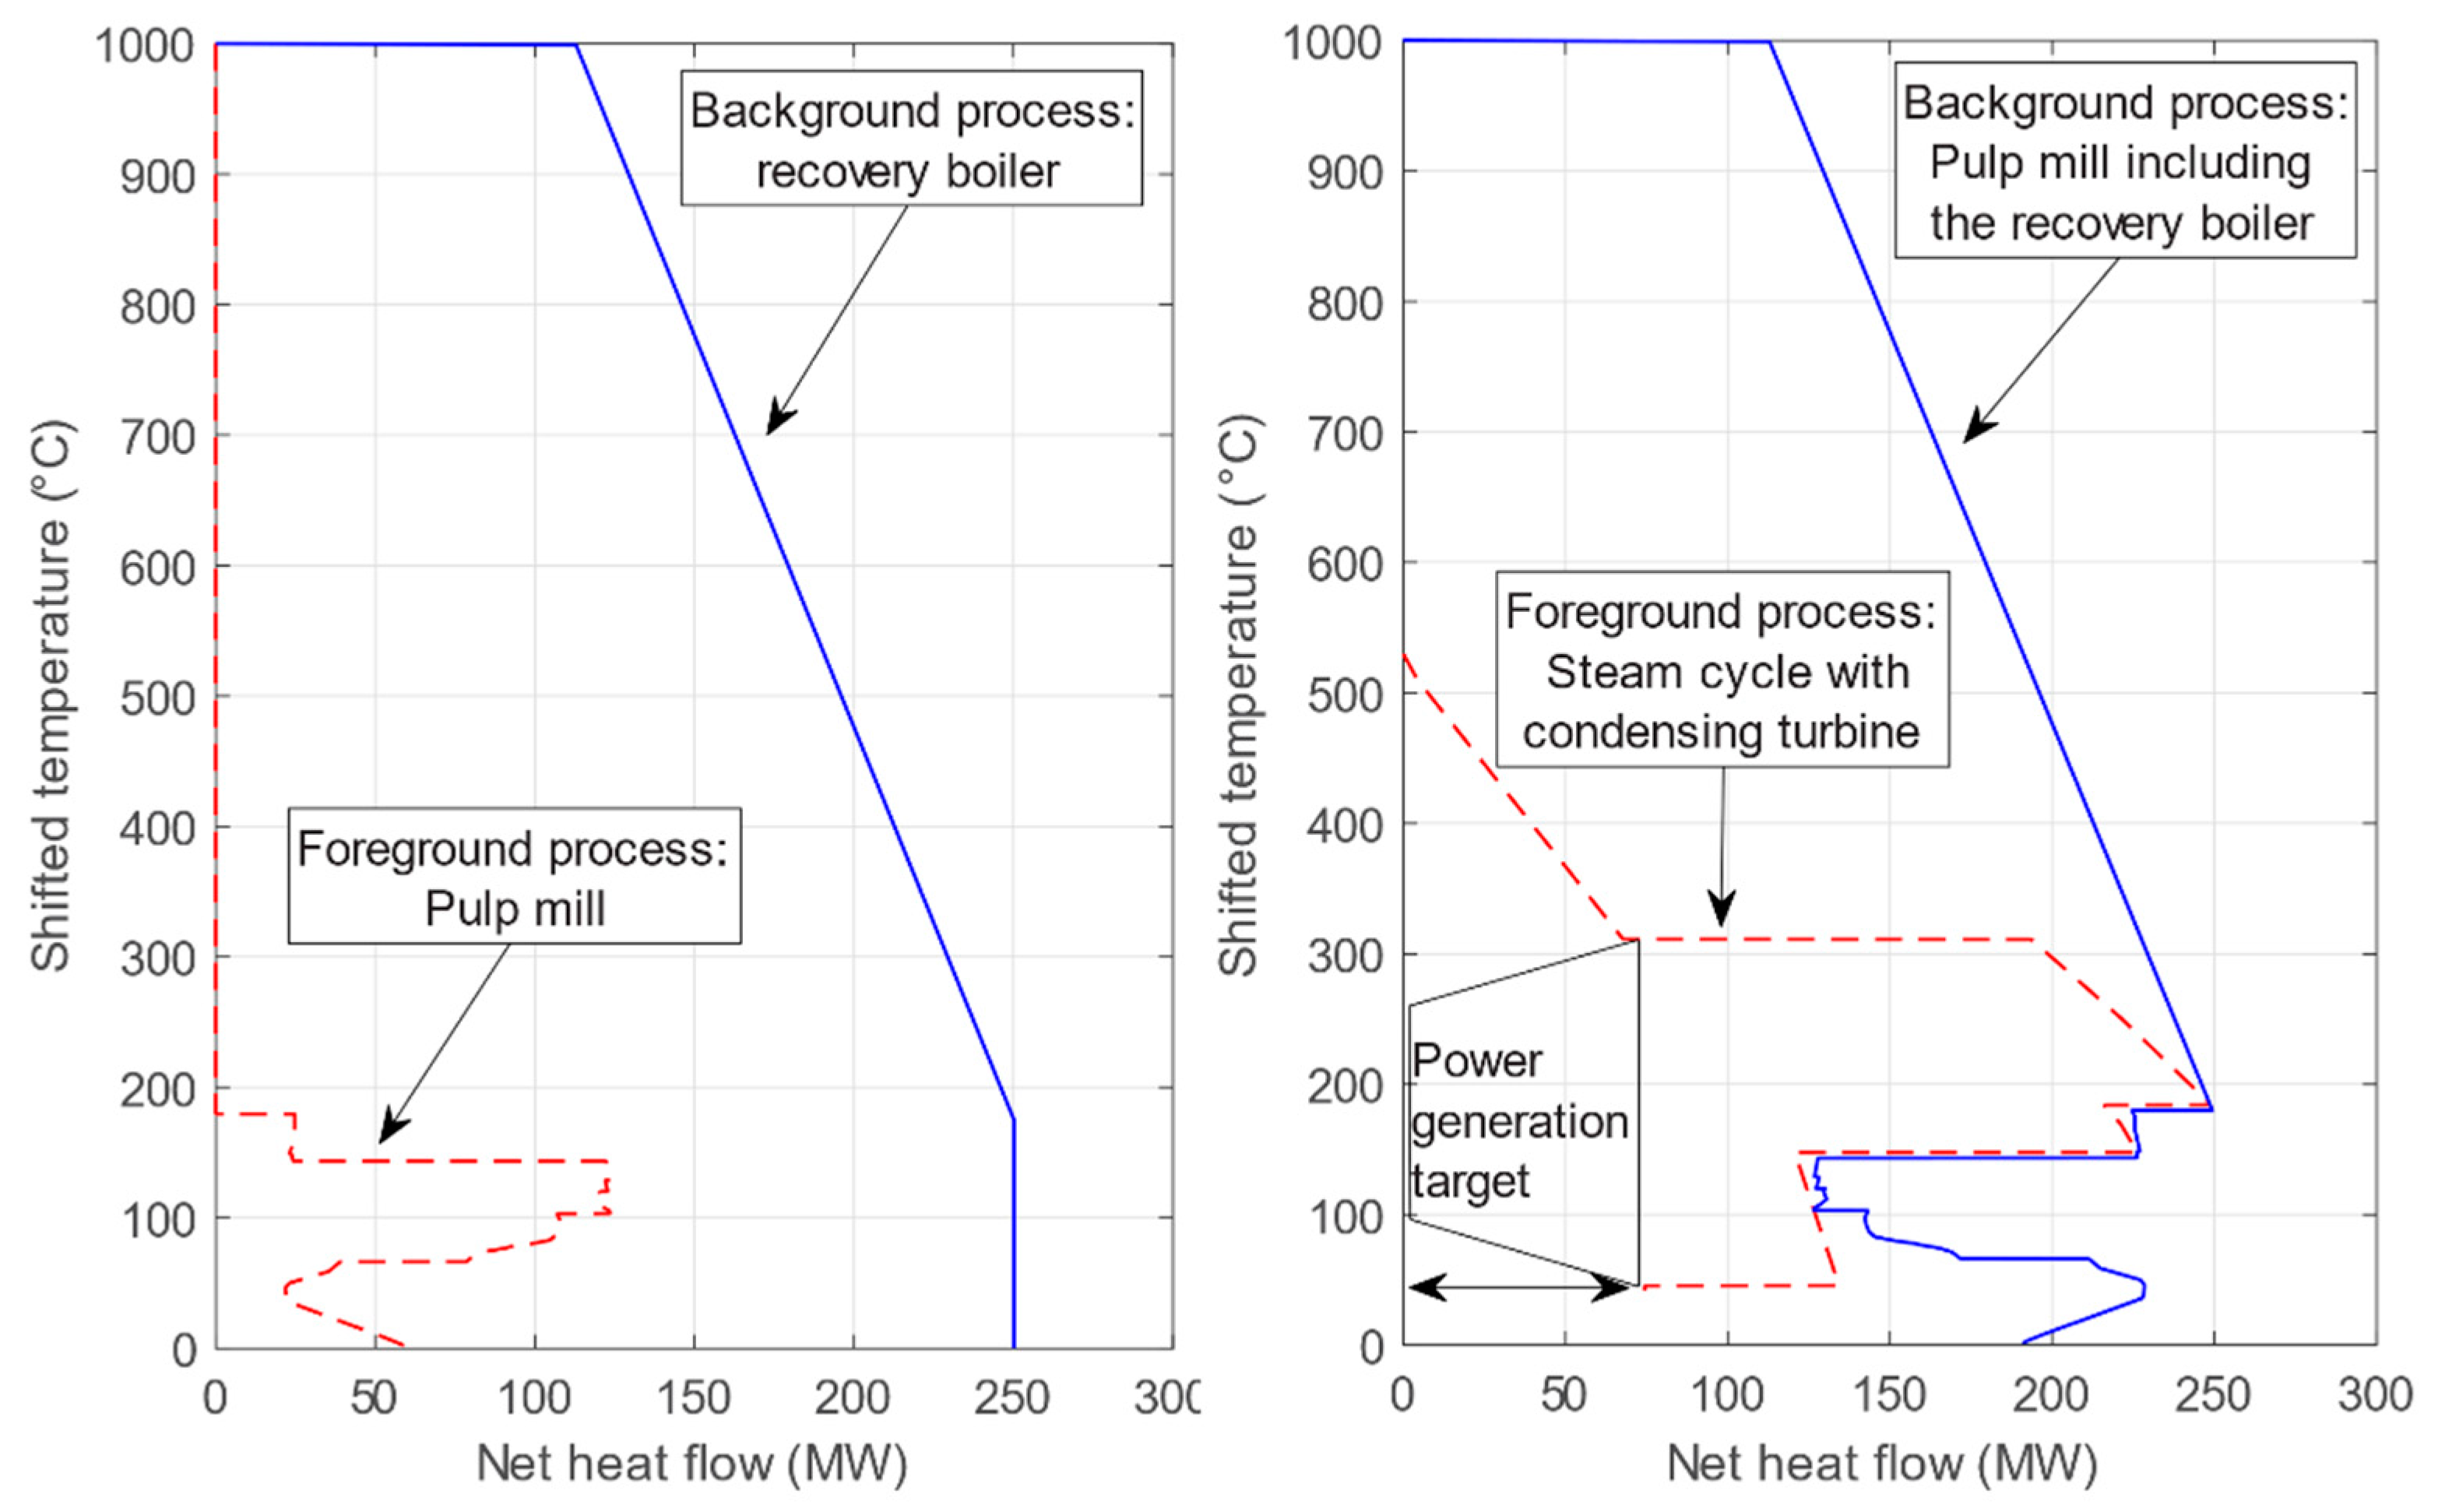
4.1. Targeting of Conventional Electricity Generation and Characterisation of Excess Heat Availability

In kraft pulp mills, black liquor is combusted in a recovery boiler for the recovery of energy and regeneration of cooking chemicals. The steam production is determined by the amount of black liquor being processed, which, in turn, depends on the production rate in the pulp digesters. The recovery boilers are, therefore, regarded as part of the production process and not a utility system. On the other hand, other steam boilers, which, in pulp mills, are mainly fuelled with bark, are regarded as part of the utility system and not as necessary parts of the process itself.
The high-pressure steam produced in the recovery boiler, and possible additional steam boilers (also called power boilers), is distributed around the process site in a steam utility network, which may also be equipped with steam turbines for the combined production of heat and electricity. The fuel energy utilisation in this steam utility system will be maximised if the process steam demand is exactly covered by back-pressure steam from a turbine. In practice, there is usually a mismatch between steam production, steam turbine cycle and process steam demand. Typically, there will either be an excess of steam, providing an opportunity for a condensing turbine stage, or a deficit of steam and, therefore, a need for a direct reduction in boiler steam through let-down valves, thereby by-passing the steam turbine. In the latter case, it might be justified to increase the back-pressure electricity generation, by firing additional fuel in the utility boilers to produce more steam.
To estimate the electricity generation targets from conventional steam cycles and excess heat availability, an energy targeting methodology was used, based on an investigation of heat flows between the constituent processes using pinch analysis tools. The targeting procedure was formulated as a linear programming problem following the combined objective of maximum electricity generation and maximum excess heat recovery, given certain constraints representing the assumptions about the level of heat recovery and fuel use. In principle, a steam cycle was integrated between the available high-temperature combustion heat from the recovery boiler and the heat demand of the production process [47]. Figure 5 shows a graphical representation of this integration between the steam cycle, the process and the recovery boiler, in a background/foreground analysis. This is equivalent to fitting the steam cycle between the different levels of heat available from the recovery boiler and the heat requirements of the process.
Based on the integration of the production process, steam boiler and turbine system, the availability of excess heat was then characterised according to discrete pre-defined temperature intervals. These temperature intervals prioritise the recovery of excess heat at higher temperatures over lower temperature levels according to Carnot-based weight factors (see Table 6). The excess heat temperature profiles were generated following the objective function shown in Equation (2).
m i n i m i z e   f = i = 0 10 ( W F i · x i )
where WFi is the normalised weight factor for temperature interval/level i, and xi is the heat available within the same interval/level i (see Table 6).
The resulting temperature profile is referred to as the excess heat temperature (XHT) signature, as discussed in detail by Svensson et al. [56] and Svensson et al. [47].
The assumptions for the integrated steam cycles heavily affect the estimated availability of excess heat from the mills. In this work, excess heat availability was estimated for two different sets of assumptions: one theoretical scenario representing minimised fuel use and one scenario representing the current utility demands of the process. In accordance with the two sets of assumptions, the following two different XHT signatures were constructed: a theoretical XHT signature and a process cooling XHT signature.
The theoretical XHT signature represents the unavoidable excess heat corresponding to minimised fuel use [45]. This implies assumptions about theoretical, maximum internal process heat energy recovery, assuming a minimum temperature difference of 0 °C for all heat exchangers. This is represented by the process grand composite curve (GCC) with ΔTmin = 0 °C. Furthermore, the steam cycle was sized to avoid additional firing of bark in the power boiler unless required to be able to cover the process heat demand, which means that when the energy content of the steam produced in the recovery boiler is insufficient to cover the process steam demand in combination with maximum back-pressure power generation in the steam turbine cycle, some steam will by-pass the steam cycle and be directly reduced to a lower pressure. State-of-the-art values were assumed for steam boiler outlet conditions, as well as turbine and pump efficiencies. A condensing turbine stage was considered if an excess of low-pressure steam was still available after minimised fuel use and maximised back-pressure electricity generation, but only if the extra power produced by the condensing stage was greater than 10 MW. This limit was set to avoid excessively small turbines that generally fail to meet industrial profitability criteria [79]. Note that the inclusion of a condensing turbine limits the amount of excess heat available as steam, and also reduces the amount of excess heat available from the pulp mill process as heat is used for heating the condensate from the turbine condenser up to feedwater temperature.
The process cooling XHT signature represents the current availability of excess heat from existing process coolers and exhaust streams. In the absence of detailed data about air or water coolers in each mill, the process cooling XHT signature was also estimated using a targeting approach. In this scenario, heat exchange was assumed to be possible with a minimum temperature difference of 5 °C, but layout and operability limitations were also considered. In particular, direct process-to-process heat exchange was assumed to be possible only between a few specified thermal streams such as inlet cold air and outlet hot air in the air driers, while heat recovery between most of the process heat sources and heat sinks was assumed to be accomplished via a secondary warm and hot water system. This system was modelled as thermal loops between 20 and 60 °C, and between 20 and 80 °C, for warm and hot water, respectively. While the pinch analysis provides the heat availability for the overall process (given the constraints mentioned), these thermal loops would, in practice, be primary points of connection of any IEH recovery unit to be integrated into the process. For the process cooling XHT signature, the steam cycle was sized according to reported values of biofuel use in the mills [69]. This was performed by estimating the amount of black liquor obtained from the pulp process in comparison with the declared amount of biofuel use reported by the companies. As discussed earlier, this difference was assumed to be available as bark. Steam values and turbine efficiencies were assumed that represent those of modern mills, but with more moderate values compared to the state-of-the-art assumptions used for theoretical XHT signatures. The assumptions for the estimation of excess heat availability and conventional electricity generation targets are summarised in Table 7.
Figure 6 shows the estimated theoretical XHT signatures for Södra Värö, assuming that a steam cycle with an additional condensing stage is integrated in the process.

4.2. Regression Analysis

After analysing the excess heat availability and obtaining the conventional electricity generation targets for the six case study mills, a linear regression function was postulated to estimate the excess heat availability of each kraft mill in Sweden. In order to obtain as significant a regression as possible, different data available from the online database mentioned previously were tested, and the market pulp (not the total pulp produced) and paper production rates were selected as the most significant for the regression. The linear regression analysis was conducted using Equation (3) for each of the 11 temperature levels that were used to represent the XHT signatures (see Table 6), provided that excess heat availability was estimated at those levels. Constant mill production was assumed, for a mill availability of 92% (7834 h/year), reflecting the process conditions when thermal stream data were collected [75].
Excess   heat   ( GWh / y ) = k + m · Market   Pulp   ( kADt / y ) + n · Paper   ( kADt / y )
The regression functions obtained were then used to calculate the theoretical and process cooling XHT temperatures of each mill in Sweden and were later used to estimate the electricity generation potentials from the low and medium temperature excess heat available at these mills.

4.3. Estimation of Electricity Generation Potentials from Low and Medium Temperature Excess Heat

For the estimation of electricity generation potentials in this study, cooling water was considered to be available at 15 °C. This temperature is consistent with cooling water temperatures available in Sweden even during the summer months; therefore, the estimation of the efficiency gives a lower bound of the real efficiency of the equipment, whereas, during the winter months, the efficiencies would be slightly higher. The net efficiencies of the ORC systems were calculated by using ORCmKit based on this cooling water temperature and other system parameters introduced previously in Section 2.2. The calculated efficiencies are shown in Table 8. The efficiencies calculated and shown in Table 8 are equivalent to those related to the technical potential of IEH utilisation, as discussed in Section 2.
The efficiencies presented in Table 8 show that ORC system efficiencies at 60 °C are much lower than the efficiencies obtained at 100 and 140 °C. As an optimisation problem was run to select the heat recovery temperature from the possible temperature levels, and because the cycle net efficiency increases with temperature, heat recovery at the highest temperature available was prioritised.
In this work, the XHT signatures used for identifying excess heat amounts for low-temperature electricity generation were obtained either through the optimisation targeting approach described in Section 4.1 (for the case study mills) or through the regression analysis described in Section 4.2 (for all Swedish kraft mills). Since the XHT signatures represent potential excess heat utilisation as integrated with a process, considering a specified minimum temperature difference for heat recovery, the estimated amounts of heat available for electricity generation technologies working at different temperature levels could be directly read from an XHT signature curve. As an example, the XHT signature obtained through regression analysis representing the process cooling availability of excess heat for Södra Väro is shown in Figure 7, and illustrates how the heat available for low-temperature electricity generation is read from the curve. The cycle’s actual electricity generation was then calculated based on the estimated amount of heat recovered and the specific efficiencies at each temperature level from Table 8.

5. Results and Analysis

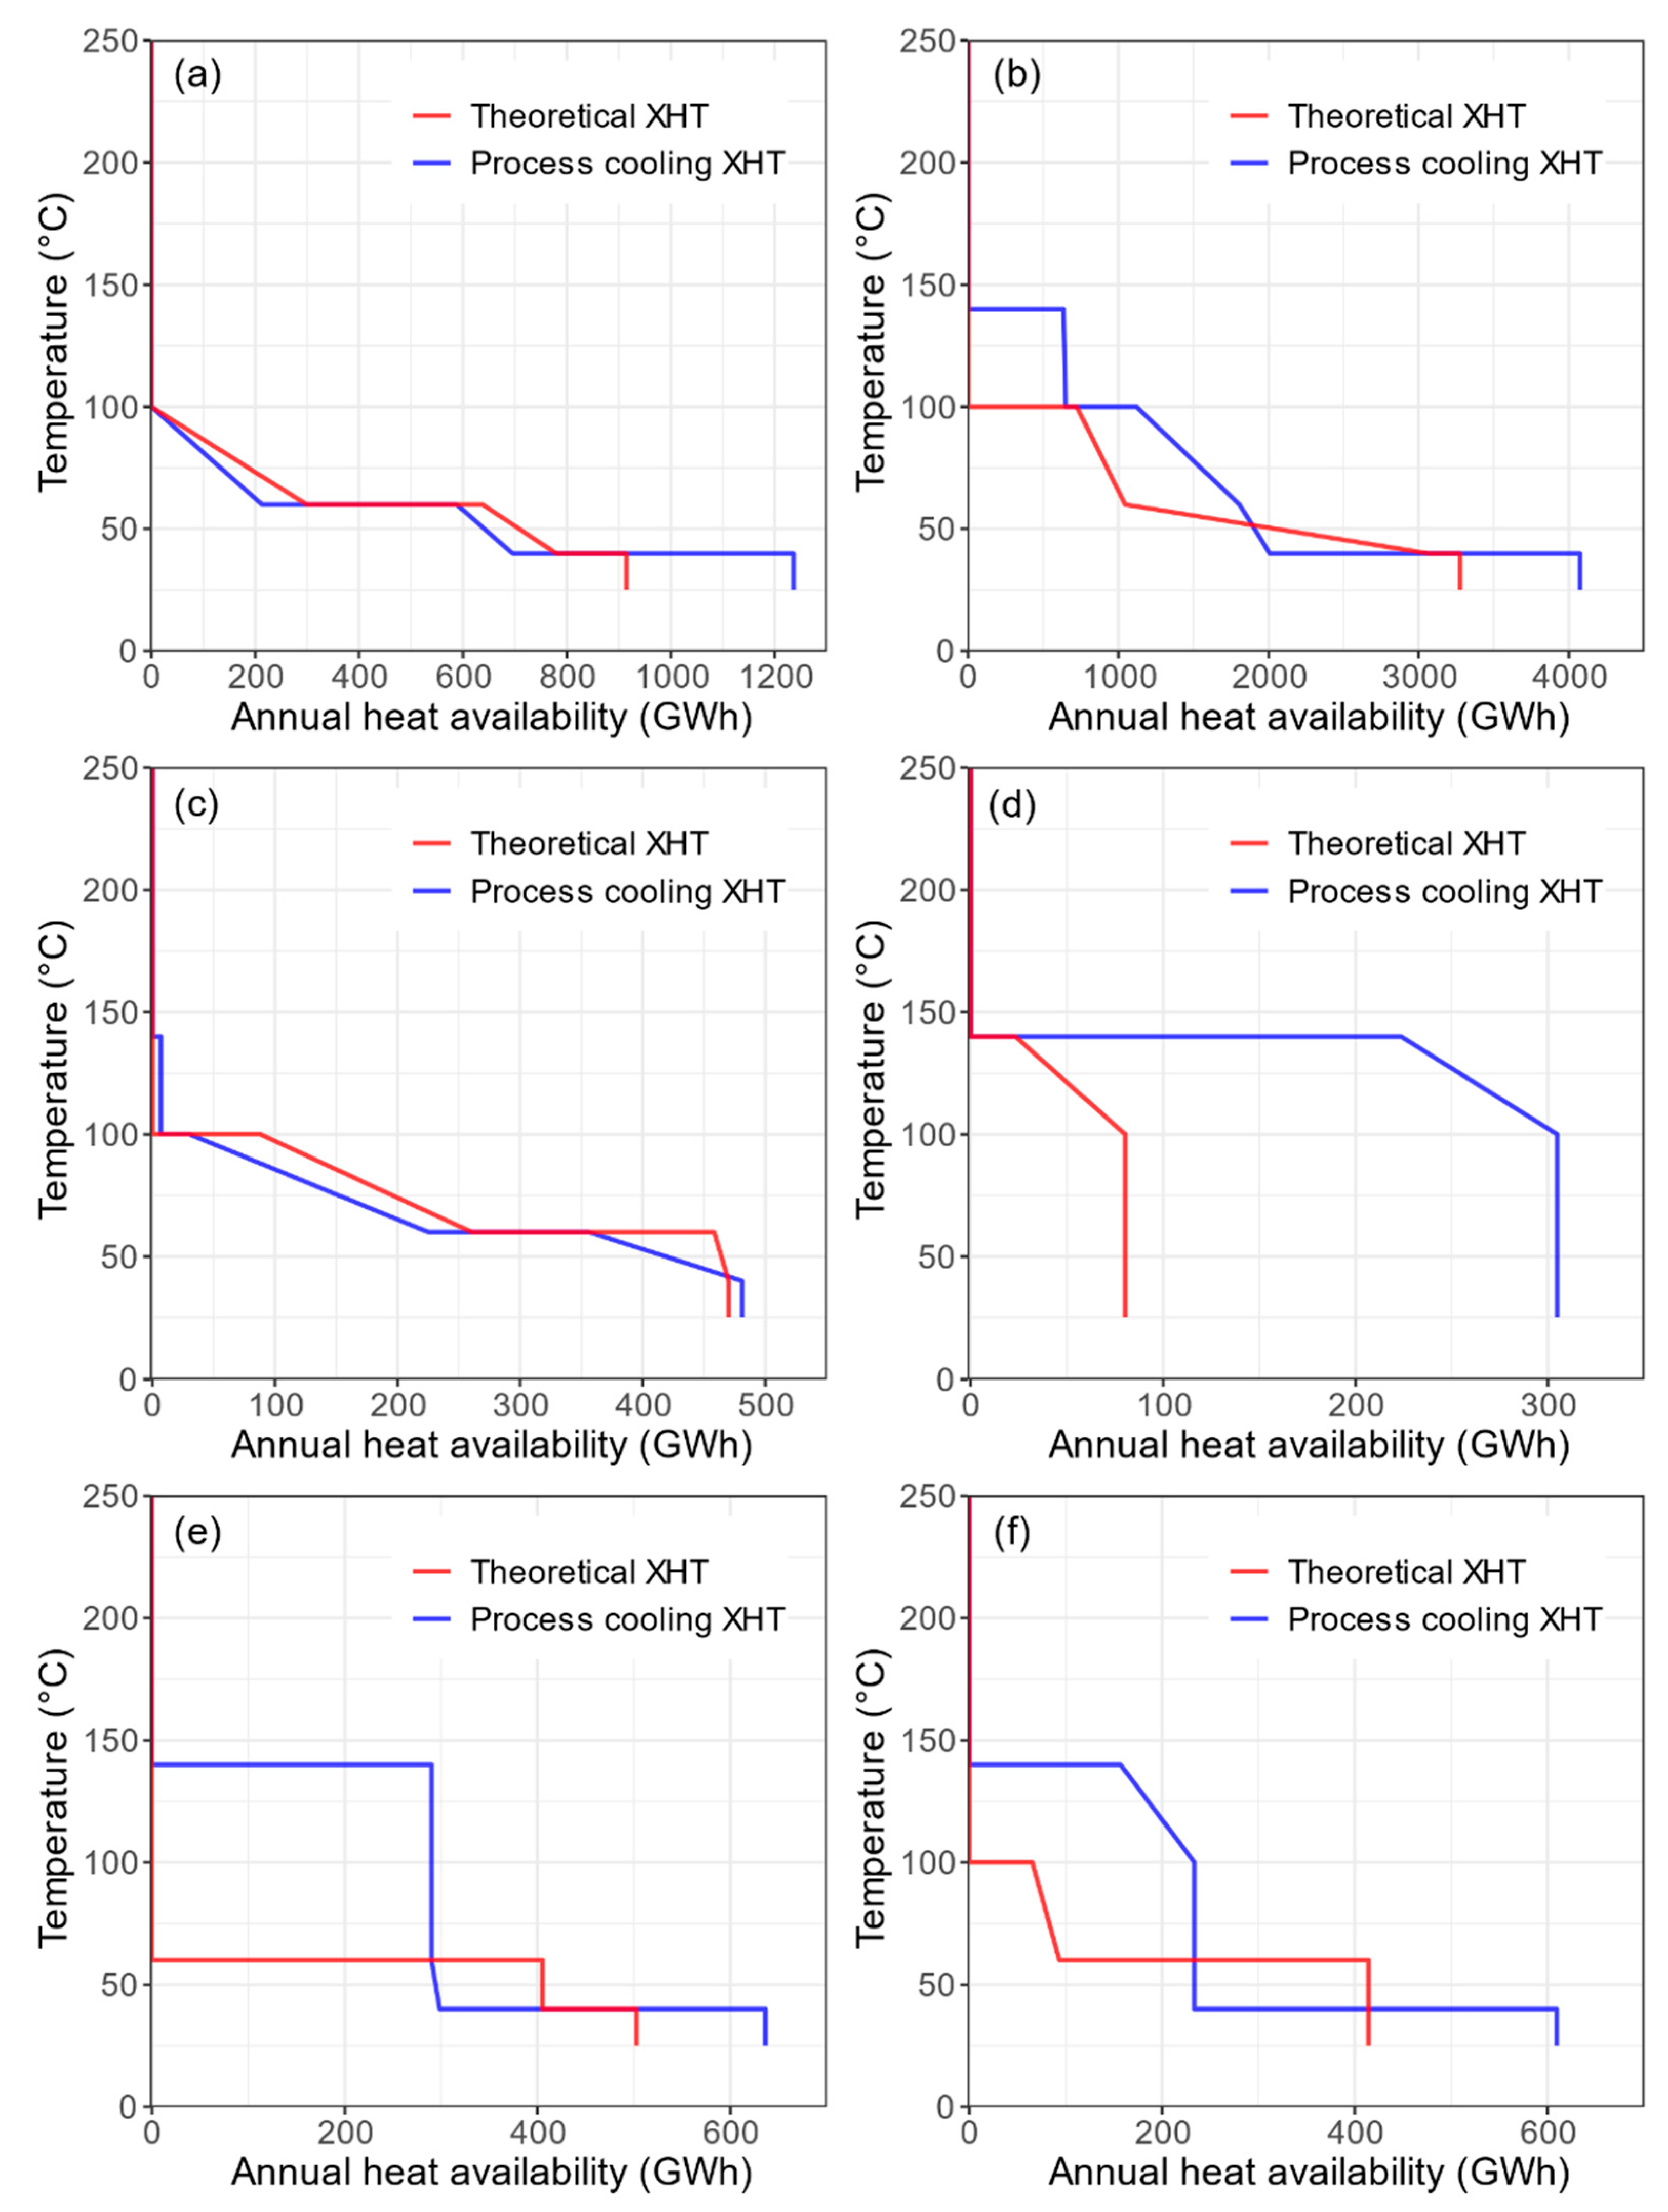
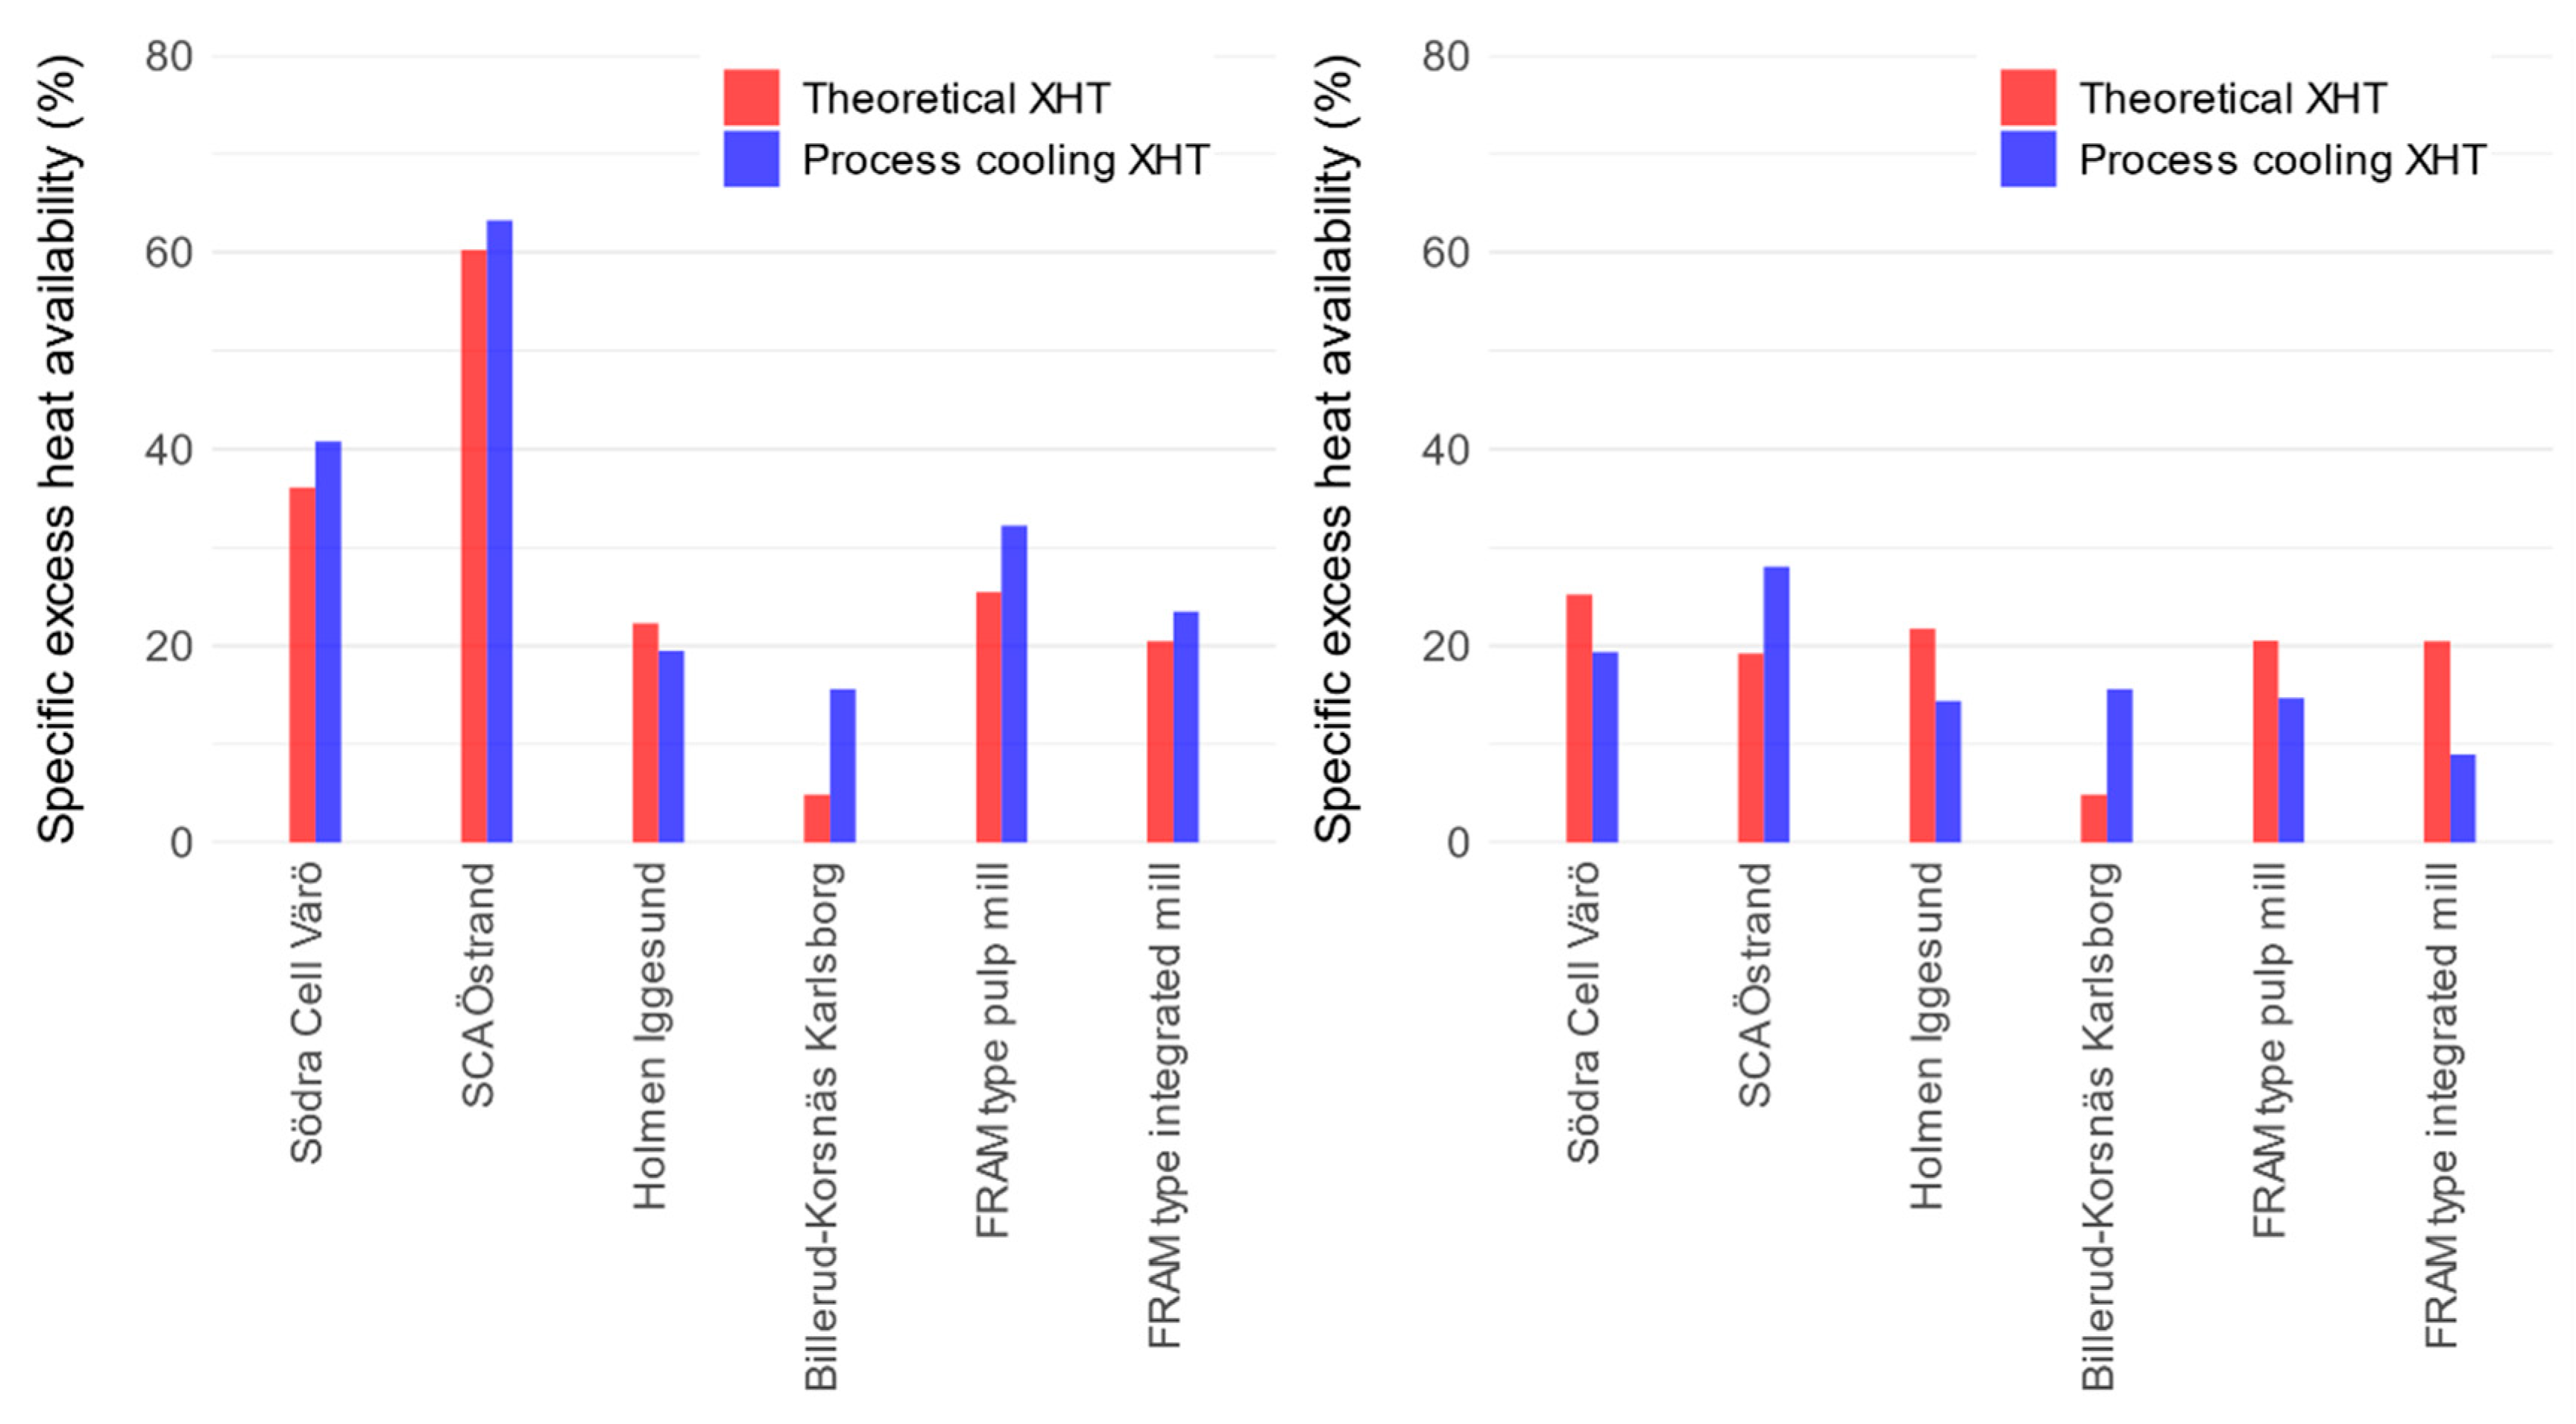
5.1. Excess Heat Availability

Figure 8 presents the estimated theoretical and process cooling XHT signatures together, for each of the six case studies. The excess heat available for the process cooling conditions tends to follow the curve for the theoretical heat integration conditions, except for the Karlsborg case, in which the process cooling XHT signature shows a much larger availability of excess heat. These results also show that the availability of excess heat at high temperatures is limited in kraft pulp mills, with only the Karlsborg case showing a higher availability of latent heat at 140 °C. Overall, the availability of medium to high temperature excess heat tends to be greater for the process cooling condition than for the theoretical heat integration case, due to the increased internal heat recovery in the latter.
To visualise the excess heat availability at different temperature levels as a function of the energy input to the process, Figure 9 presents a comparison between the six mills for the specific excess heat availability compared to the energy input into the process, both for the estimated total excess heat (≥25 °C) and for temperatures >60 °C. Overall, the total availability of excess heat varies significantly between the case studies, but integrated pulp and paper mills have a lower availability of excess heat than market pulp mills, due to the extra energy requirements of the drying process for the paper product. However, the availability of excess heat above 60 °C is much less than the total excess heat available (≥25 °C), being lower than 15% of biofuel energy use for most cases. Above 60 °C, the availability of excess heat in process cooling conditions is much greater than the theoretical scenario. This is an indication that pulp and paper mills can deliver larger amounts of excess heat if running at process cooling conditions, and that these mills are more likely to deliver avoidable excess heat.
In the case of Södra Östrand, the availability of IEH is much greater than for the other mills. This could indicate that modern mills are more likely to deliver larger amounts of excess heat. This case, however, is based on quotations from experts and typical values, and not direct measurements, and there is more uncertainty about these results. The typical FRAM mills show a lower availability of excess heat than the real mills, potentially because a more detailed analysis of the heat demands and heat sources in the process was carried out than what was achievable in the studies of the real mills. For the real mills, there may have been different constraints in the collection of the data for the thermal stream for practical reasons. If that is the case, the theoretical excess heat estimated for the four real mills would likely be overestimated, whereas the process cooling excess heat would be underestimated for the FRAM mills.

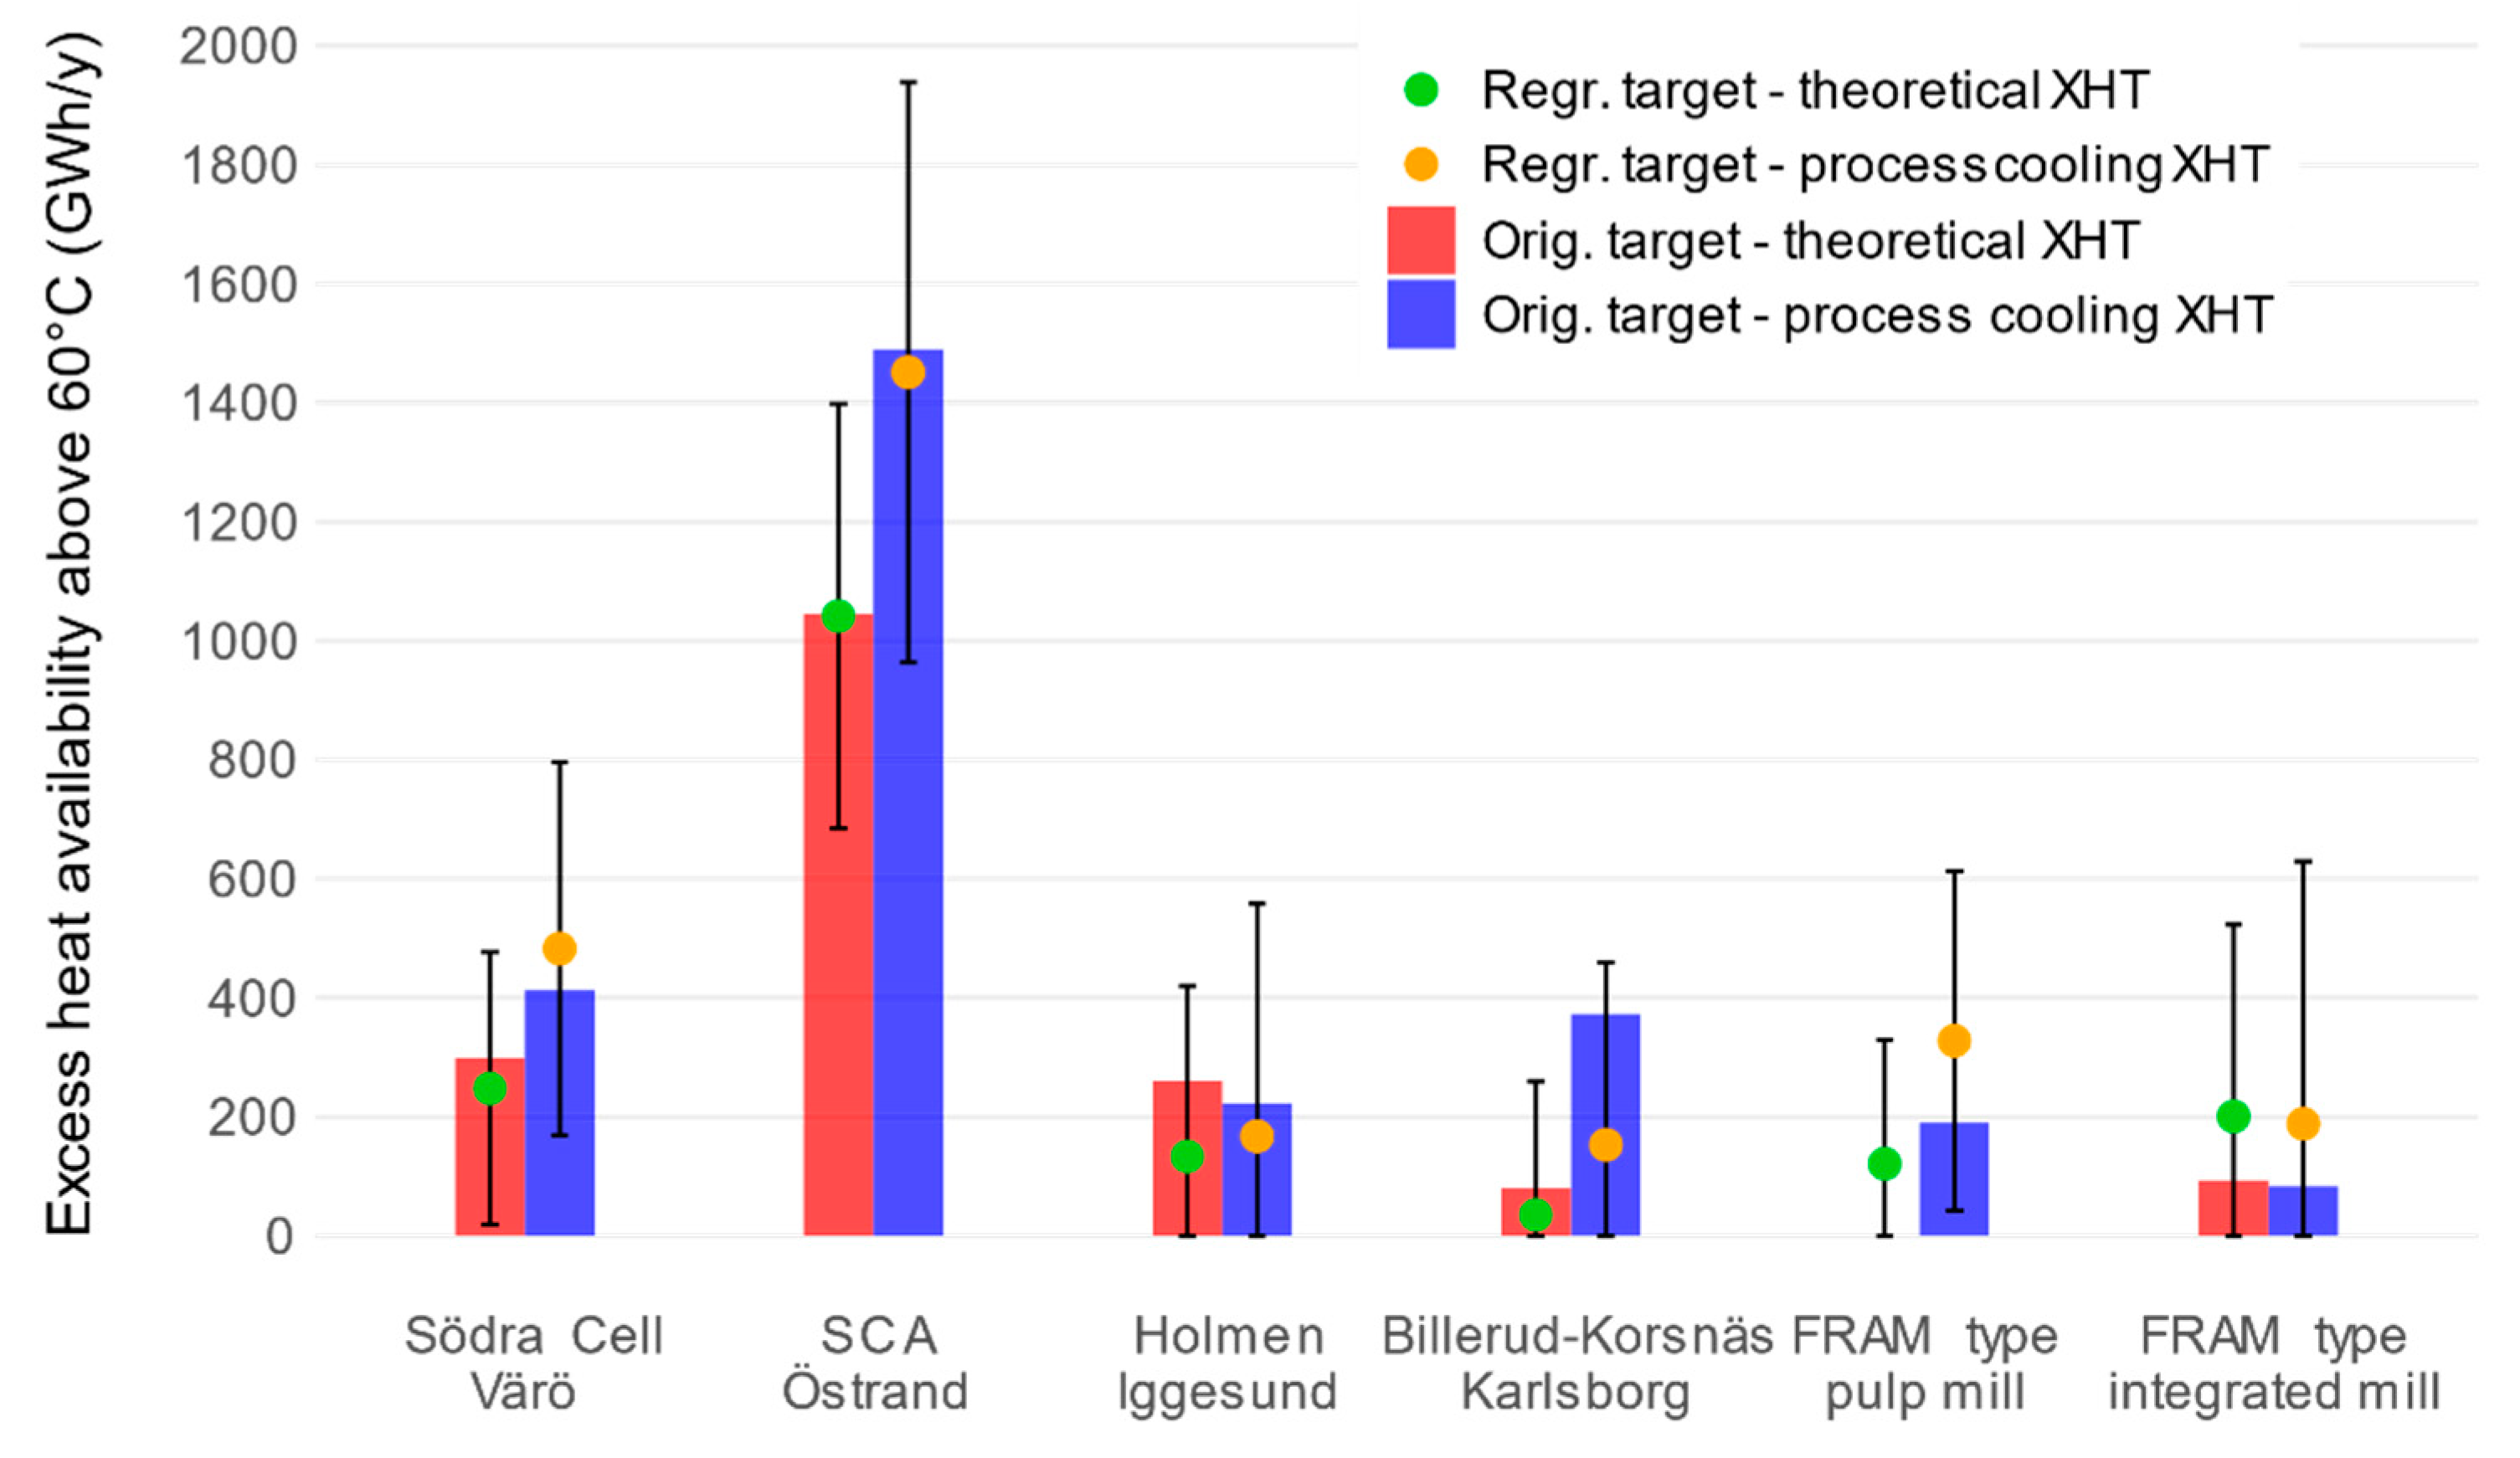
5.2. Regression Analysis for Excess Heat

Figure 10 presents the availability of excess heat above 60 °C together with the results of the linear regression analysis (68% confidence interval) obtained for the six case studies. As the availability of excess heat is lower at this temperature level and varies broadly between the case studies, the confidence intervals associated with the estimates are large (as shown in Figure 10), and become larger for higher temperatures, at temperatures in which heat availability is more limited and differs significantly between the different mills. Complete regression results are available in Table A1 and Table A2 in Appendix A. In general, for the linear regression coefficients calculated for Equation (3) (see Section 4.2), it is noted that the results for the market pulp coefficients (m) are higher than for the paper coefficients (n) (see Table A1 and Table A2), which is consistent with the greater availability of excess heat in market pulp mills than in integrated mills mentioned previously.

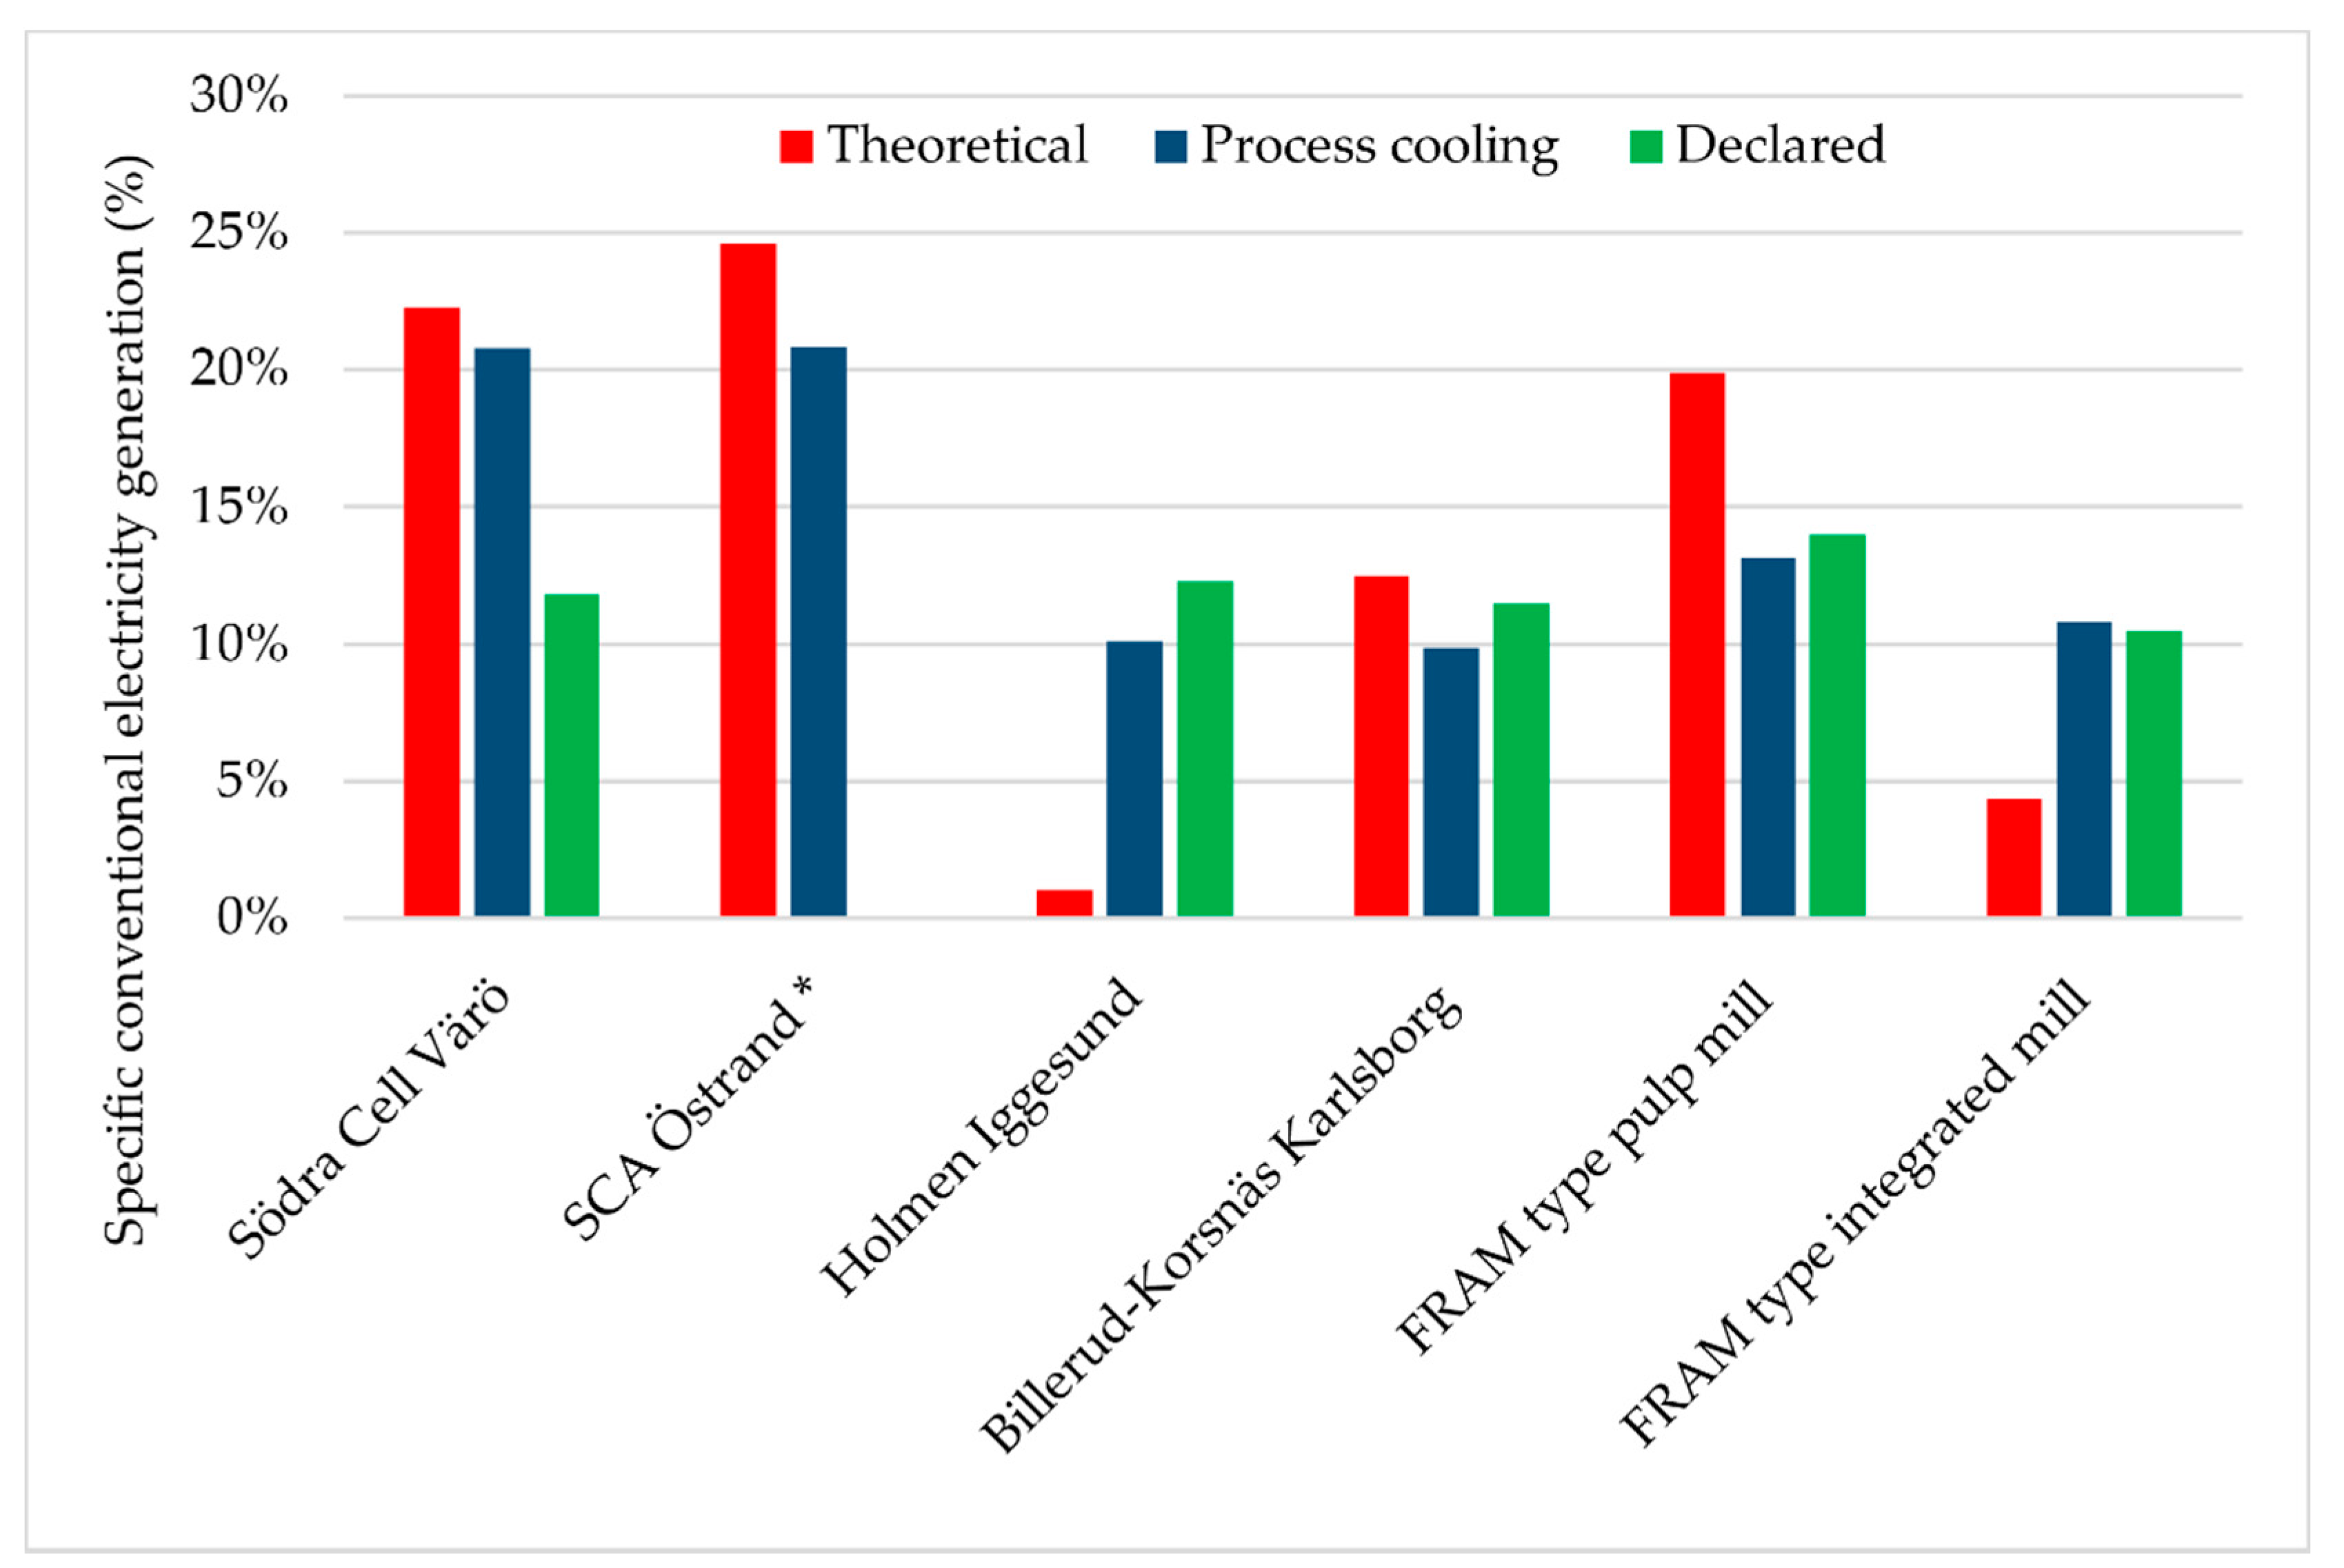
5.3. Low and Medium Temperature Electricity Generation

The estimated low and medium temperature electricity generation from the selected technologies are shown in Table 9 for the IEH availability estimated from the theoretical XHT signatures and in Table 10 for the IEH availability estimated from the process cooling XHT signatures. These results are based on the integration of electricity generation with ORC technology directly from the estimated IEH availability, and not the regression results, which are presented later. The percentage increase in electricity production is calculated based on the integrated steam cycle that was targeted for each mill studied, and for the total for all the mills based on the declared electricity production of each kraft mill in Sweden. The estimation based on the theoretical XHT (Table 9) shows that most mills in the case studies could increase their targeted electricity generation in the range of 3 to 7% in a theoretical scenario where bark use is minimised by typically utilising low- and medium-temperature IEH. The exceptions are Iggesund and the FRAM typical integrated mill, which had relatively low electricity generation targets from conventional back-pressure turbines of 21 and 88 GWh/a, respectively (see Table 9). The adoption of the low and medium temperature electricity generation could theoretically increase the electricity generation by 129% in Iggesund, and by 28% for the FRAM typical integrated mill. These are both integrated mills, which, as mentioned previously, have a smaller availability of high-temperature heat from the recovery boiler to be used for cogeneration in back-pressure turbines. The Iggesund mill was also the integrated mill with the highest availability of excess heat (see Figure 10); therefore, the very high electricity generation potential increase is an expected result. On average, the potential for increasing electricity production in the six case studies is 7%.
The estimation of electricity generation for the process cooling scenario (Table 10) shows less variation in the potential to increase electricity production across the six case studies when compared to the theoretical scenario. In this estimation, the mills have a higher availability of steam due to accounting for bark use, which is partly used to produce electricity in back-pressure and condensing turbines. The higher increase in low and medium temperature electricity generation in the case of Karlsborg is related to the much higher availability of excess heat in the process cooling scenario for this mill, see Figure 8. In the estimation of medium and low temperature electricity generation in the process cooling scenario, the average potential increase in electricity production in the mills is 9%. Note that the references for the increase in electricity generation potential as a percentage are taken individually from the estimated electricity generation potentials from conventional steam cycles, which are much higher in the process cooling scenario than in the theoretical heat integration scenario. In fact, the estimated potential for electricity generation from ORC using IEH in the process cooling scenario is 33% higher than in the theoretical heat integration scenario (254 versus 190 GWh/a, respectively).

5.4. Regression Analysis for Low and Medium Temperature Electricity Generation

Table 11 presents the estimated electricity generation potentials from low and medium temperature excess heat for each temperature level considered, comparing the potentials for the case study mills that were either estimated using their XHT signatures, or estimated using the regression models of their excess heat availability. Table 11 also presents the total potential estimated for all the kraft mills in Sweden using the regression model for the excess heat availability in each mill. A comparison between the estimation based on the actual theoretical XHT signatures and an estimation based on the regressed theoretical XHT signatures for the case studies shows very similar results, and a potential to increase the electricity production in the case study mills by 7% over the power generation targets for integrated steam cycles (see Table 9). When considering the totals for all the mills in Sweden, the regressed values result in a potential increase of 10% in electricity production, probably with an over estimation of the potentials at higher temperatures (ORC100 and ORC140), because of the higher uncertainties at these temperature levels for the regressed excess heat availability. The electricity generation potentials from the regression analysis for each of the mills in the theoretical scenario are shown in Table A3 in Appendix A.
Table 12 presents the results from the regression analysis, but for the process cooling scenario. As with the theoretical scenario, the results for the individual estimation for each temperature level are similar. In the process cooling scenario, the regressions for a few of the smaller integrated mills resulted in negative excess heat in some of the higher temperature intervals. This is a consequence of the very large negative constant coefficients (k) and smaller paper coefficients (n) in the regression functions (see Table A1 and Table A2 in Appendix A). In the temperature intervals with a negative availability of excess heat, no excess heat was added to the XHT signature at that temperature level. The regressed values result in a potential increase of 9% in electricity production. The electricity generation potential from the regression analysis for each of the mills in the process cooling scenario is shown in Table A4 in Appendix A.

6. Discussion

The heat integration analysis was divided in two scenarios. The theoretical heat integration aimed at providing the availability of IEH in kraft pulp and paper mills as a lower bound estimation of the excess heat availability, in what can be considered unavoidable excess heat. Any amount of IEH above the theoretical potential can be considered avoidable excess heat, at least in a thermodynamic sense [45]. To assess the current availability of excess heat in all the Swedish kraft mills, the process cooling heat integration scenario included technical assumptions, such as non-zero ΔTmin driving temperatures for heat exchange, lower steam turbine efficiencies and constraints in heat integration, such as the presence of a secondary warm and hot water system. Additional assumptions had to be made for the process cooling scenario, the most relevant being the estimation of the amount of bark used in the mills. These estimations include uncertainties related to the steam header properties, the different types of raw material used in the pulp process, the load of the mill in relation to the actual production capacity and operating hours, and the quality of the data reported by the companies. Nevertheless, the results should indicate representative values.
The electricity generation targets from conventional steam turbines have a large effect on the availability of excess heat in the mill. Figure 11 compares the electricity generation targets from conventional steam turbines and declared values by the companies in the online database used. When considering the process cooling scenario, the declared generation is close to or exceeds the conventional electricity generation estimated for the mills, except for the case of Södra Cell Värö, which indicates that the assumptions for the process cooling scenario in this study are actually conservative. Note that for SCA Östrand, the estimations were based on a planned reconstruction of the mill and the declared electricity generation figures for the reconstructed mill are currently unavailable.
The specific IEH heat availability found in the six case studies (Figure 9) shows that, for most cases, the excess heat available above 60 °C is lower than 15% of the biofuel energy input into the process. This figure is much lower than broad studies based on basic sector efficiencies. For example, Persson et al. [24] used a figure of 25% recovery potential from the pulp, paper and printing sector for excess heat compatible with district heating (DH) applications. Beer et al. [57] studied energy efficiency in the pulp and paper sector in Germany and reported that excess heat recovery potentials could result in steam savings of 9.3% on average and up to 25%. In another study on pulp and paper mills in Germany, Fleiter et al. [80] reported 21% fuel savings through energy efficiency measures, and although this figure includes other efficiency measures, IEH recovery is regarded as the most important. These studies, however, considered the whole pulp and paper sector, including, e.g., mechanical and recycled pulp, which have very different energy profiles. The differences in excess heat availability are also related to the differences in the scope and limitations of the studies. While it is assumed in this paper that excess low-pressure steam is used in condensing turbines (unless the turbines would be too small), other studies probably include this as excess heat. Finally, kraft pulping is not as prevalent, e.g., in Germany as it is in Sweden. Nevertheless, the results obtained here provide more detail in IEH availability and temperature profiles, which are very useful in analysing the integration opportunities of specific technologies.
The results presented for the electricity generation potentials for the different ORC systems are estimations of the technical potential of the power generation technologies. The estimations for the process cooling scenario represent generation potentials that are probably close to those of the real mills, given the assumptions based on conditions that are normally found in Swedish kraft mills. The results for the theoretical scenario give a lower bound estimation of what could be achieved in terms of electricity generation from low and medium temperature IEH.
This study considered that multiple ORC systems could be installed and operated simultaneously at different temperature levels to maximise the electricity generation from IEH. In an actual implementation, this is unlikely to be the case, and one temperature level with optimal efficiency would be chosen. This is because practical considerations should prevent such arrangements, especially the complexity of installation, considerations relating to investment costs and economic performance. Competition with other heat recovery technologies is another factor to be considered, such as direct heat deliveries to district heating networks, or the integration of heat pumps into the process. In fact, direct heat deliveries from the Swedish pulp and paper industry have increased slightly over the years (see Figure 2), but not all mills have heat demands nearby, highlighting the need to analyse alternative uses for the excess heat in order to increase energy and resource efficiency in industry. One particularly interesting result is that a considerable amount of the electricity generation potential is present at 60 °C, about 50% in the theoretical heat integration scenario and over 30% in the process cooling scenario. This temperature is typically too low to be used in typical Swedish district heating networks.

7. Conclusions

In this paper, a methodology was presented to estimate the feasible technical potential for electricity generation from low and medium temperature industrial excess heat using ORC technology. The methodology is based on an analysis of heat integration opportunities in individual kraft pulp and paper mills, in which the availability of excess heat for individual sites was estimated using detailed excess heat temperature profiles (XHT signatures). The results for individual sites using XHT signatures combined with publicly available data for the pulp and paper sector on a national level made it possible to estimate aggregated results for the whole sector using regression models. Based on such an approach, this work estimated national potentials for electricity generation from low and medium temperature excess heat. A technical potential to increase electricity production in the Swedish kraft pulp and paper industry by 8 to 11% was found, when compared to scenarios that evaluated optimal steam cycle integration under theoretical and process cooling conditions, respectively. The estimations are carried out for different temperature levels, which present a more detailed account of excess heat recovery potentials than other studies aimed at estimating potentials for whole sectors.
The methodology applied in the present work could be adapted for other sectors and regions, increasing the level of detail for excess heat estimations, in order to guide the strategies for recovery and use of excess heat in different regions and industrial sectors. Future work can also build upon this methodology to include economic and system aspects in terms of GHG emissions to obtain economic and feasible potentials for IEH recovery.

Author Contributions

Conceptualization, I.C., E.S., M.W. and S.H.; methodology, I.C. and E.S.; software, I.C. and E.S.; validation, I.C., M.W., E.S. and S.H.; formal analysis, I.C. and E.S.; writing—original draft preparation, I.C. and E.S.; writing—review and editing, M.W. and S.H.; visualization, I.C.; supervision, E.S., M.W. and S.H. All authors have read and agreed to the published version of the manuscript.

Funding

This research was funded by Energimyndigheten (the Swedish Energy Agency), grant number 42222-1.

Acknowledgments

The authors gratefully thank Matteo Morandin for the initial heat integration analysis and ideas in developing this study.

Conflicts of Interest

The authors declare no conflict of interest. The funders had no role in the design of the study; in the collection, analyses, or interpretation of data; in the writing of the manuscript, or in the decision to publish the results.

Appendix A

Table A1. Results for the linear regression of theoretical excess heat availability with their standard deviations (68% confidence interval). The “≥” symbol indicates the excess heat available above the indicated temperature, including the latent heat at that temperature.
Excess Heat Temperaturek (Constant)m (Market Pulp Coeff.)n (Paper Coeff.)
≥140 °C13.31 ± 12.985−0.018 ± 0.023−0.022 ± 0.034
>100 °C46.175 ± 45.046−0.063 ± 0.079−0.078 ± 0.118
≥100 °C−368.99 ± 130.111.172 ± 0.230.966 ± 0.341
>60 °C−402.18 ± 149.671.597 ± 0.2641.191 ± 0.393
≥60 °C−29.998 ± 187.251.248 ± 0.330.879 ± 0.491
>40 °C−1097.5 ± 121.244.606 ± 0.2143.153 ± 0.318
≥40 °C−1087.4 ± 111.34.84 ± 0.1963.106 ± 0.292
>25 °C−1087.4 ± 111.34.84 ± 0.1963.106 ± 0.292
Table A2. Results for the linear regression of process cooling excess heat availability with their standard deviations (68% confidence interval). The “≥” symbol indicates the excess heat available above the indicated temperature, including the latent heat at that temperature.
Excess Heat Temperaturek (Constant)m (Market Pulp Coeff.)n (Paper Coeff.)
≥140 °C−70.686 ± 214.280.731 ± 0.3780.372 ± 0.562
>100 °C−47.636 ± 247.250.711 ± 0.4360.438 ± 0.648
≥100 °C−311.31 ± 294.881.506 ± 0.521.021 ± 0.773
>60 °C−582.35 ± 259.542.569 ± 0.4581.748 ± 0.681
≥60 °C−396.59 ± 143.112.42 ± 0.2521.428 ± 0.375
>40 °C−443.61 ± 194.082.7 ± 0.3421.625 ± 0.509
≥40 °C−1209.4 ± 78.4675.856 ± 0.1383.624 ± 0.206
>25 °C−1209.4 ± 78.4675.856 ± 0.1383.624 ± 0.206
Table A3. Estimated low and medium temperature electricity generation potential for each selected generation technology and each mill, for the theoretical process integration scenario.
Electricity Generation (kW)
MillORC 140ORC 100ORC 60Total Mill (kW)
BillerudKorsnäs, Frövi1113174461333
BillerudKorsnäs, Gruvön2231282405054
BillerudKorsnäs, Karlsborg41010679595
BillerudKorsnäs, Korsnäsverken2055286604920
BillerudKorsnäs, Skärblacka2353570452969
Holmen AB, Iggesund2046494422583
Metsä Board, Husum2283409906383
Mondi Dynäs1071184891345
Munksjö AB, Aspa12212271101557
Munksjö Paper, Billingsfors0209131339
Nordic Paper Bäckhammar1107203981408
Rottneros AB, Vallvik15602121031875
SCA, Munksund39911254565
SCA, Obbola1714519372270
SCA, Östrand30797319010,397
Smurfit Kappa Piteå2058281304871
Stora Enso, Skoghall2022331805340
Södra Cell AB, Mönsterås 2929452017449
Södra Cell AB, Mörrum2703247783028
Södra Cell AB, Värö27461067633876
FRAM type pulp mill269362812836
FRAM type integrated mill21781137203334
Total Sweden (kW)107833,28039,97174,329
Table A4. Estimated low and medium temperature electricity generation potential for each selected generation technology and each mill, for the process cooling integration scenario.
Electricity Generation (kW)
MillORC 140ORC 100ORC 60Total Mill (kW)
BillerudKorsnäs, Frövi5912108811682
BillerudKorsnäs, Gruvön0107824753553
BillerudKorsnäs, Karlsborg85007621612
BillerudKorsnäs, Korsnäsverken0140921013511
BillerudKorsnäs, Skärblacka103946413732876
Holmen AB, Iggesund85441611802451
Metsä Board, Husum035733913748
Mondi Dynäs0351167518
Munksjö AB, Aspa00534534
Munksjö Paper, Billingsfors0000
Nordic Paper Bäckhammar0280365645
Rottneros AB, Vallvik4040203607
SCA, Munksund492137471251
SCA, Obbola70543610362178
SCA, Östrand0039063906
Smurfit Kappa Piteå0154020773617
Stora Enso, Skoghall0135523103664
Södra Cell AB, Mönsterås0039383938
Södra Cell AB, Mörrum113423819843356
Södra Cell AB, Värö087829123790
FRAM type pulp mill133811718483303
FRAM type integrated mill91084213143065
Total Sweden (kW)40,03623,49831,11894,652

References

  1. IPCC. Global Warming of 1.5 °C An IPCC Special Report on the Impacts of Global Warming of 1.5°C above Pre-Industrial Levels and Related Global Greenhouse Gas Emission Pathways, in the Context of Strengthening the Global Response to the Threat of Climate Change, Sustainable Development, and Efforts to Eradicate Poverty; IPCC: Geneva, Switzerland, 2018. [Google Scholar]
  2. European Commission. A Clean Planet for all A European Strategic Long-Term Vision for a Prosperous, Modern, Competitive and Climate Neutral Economy; European Commission: Brussels, Belgium, 2018. [Google Scholar]
  3. Regeringskansliet. Proposal Referred to the Council on Legislation on a Climate Policy Framework for Sweden; Regeringskansliet: Stockholm, Sweden, 2017. [Google Scholar]
  4. International Energy Agency. World Energy Outlook 2017; International Energy Agency: Paris, France, 2017; Volume 637. [Google Scholar] [CrossRef]
  5. Pettersson, K.; Axelsson, E.; Eriksson, L.; Svensson, E.; Berntsson, T.; Harvey, S. Holistic methodological framework for assessing the benefits of delivering industrial excess heat to a district heating network. Int. J. Energy Res. 2020, 44, 2634–2651. [Google Scholar] [CrossRef]
  6. Broberg Viklund, S. Energy efficiency through industrial excess heat recovery—Policy impacts. Energy Effic. 2015, 8, 19–35. [Google Scholar] [CrossRef] [Green Version]
  7. Karlsson, M.; Gebremedhin, A.; Klugman, S.; Henning, D.; Moshfegh, B. Regional energy system optimization—Potential for a regional heat market. Appl. Energy 2009, 86, 441–451. [Google Scholar] [CrossRef]
  8. Sandvall, A.F.; Börjesson, M.; Ekvall, T.; Ahlgren, E.O. Modelling environmental and energy system impacts of large-scale excess heat utilisation—A regional case study. Energy 2015, 79, 68–79. [Google Scholar] [CrossRef] [Green Version]
  9. Brueckner, S.; Miró, L.; Cabeza, L.F.; Pehnt, M.; Laevemann, E. Methods to estimate the industrial waste heat potential of regions—A categorization and literature review. Renew. Sustain. Energy Rev. 2014, 38, 164–171. [Google Scholar] [CrossRef]
  10. McKenna, R.C.; Norman, J.B. Spatial modelling of industrial heat loads and recovery potentials in the UK. Energy Policy 2010, 38, 5878–5891. [Google Scholar] [CrossRef]
  11. Hammond, G.P.; Norman, J.B. Heat recovery opportunities in UK industry. Appl. Energy 2014, 116, 387–397. [Google Scholar] [CrossRef] [Green Version]
  12. Cooper, S.J.G.; Hammond, G.P.; Norman, J.B. Potential for use of heat rejected from industry in district heating networks, Gb perspective. J. Energy Inst. 2016, 89, 57–69. [Google Scholar] [CrossRef]
  13. Bühler, F.; Petrović, S.; Ommen, T.; Holm, F.; Pieper, H.; Elmegaard, B. Identification and Evaluation of Cases for Excess Heat Utilisation Using GIS. Energies 2018, 11, 762. [Google Scholar] [CrossRef] [Green Version]
  14. Bühler, F.; Petrović, S.; Karlsson, K.; Elmegaard, B. Industrial excess heat for district heating in Denmark. Appl. Energy 2017, 205, 991–1001. [Google Scholar] [CrossRef] [Green Version]
  15. Bühler, F.; Petrović, S.; Holm, F.M.; Karlsson, K.; Elmegaard, B. Spatiotemporal and economic analysis of industrial excess heat as a resource for district heating. Energy 2018, 151, 715–728. [Google Scholar] [CrossRef] [Green Version]
  16. Brueckner, S.; Arbter, R.; Pehnt, M.; Laevemann, E. Industrial waste heat potential in Germany—A bottom-up analysis. Energy Effic. 2017, 10, 513–525. [Google Scholar] [CrossRef]
  17. Sollesnes, G.; Helgerud, H.E. Potensialstudie for Utnyttelse av Spillvarme fra Norsk Industri—[Study of the Potentials for the Utilisation of Excess Heat from the Norwegian Industry]; Enova: Trondheim, Norway, 2009. [Google Scholar]
  18. Broberg, S.; Backlund, S.; Karlsson, M.; Thollander, P. Industrial excess heat deliveries to Swedish district heating networks: Drop it like it’s hot. Energy Policy 2012, 51, 332–339. [Google Scholar] [CrossRef] [Green Version]
  19. Energiföretagen Sverige Fjärrvärmestatistik. Available online: https://www.energiforetagen.se/statistik/fjarrvarmestatistik/ (accessed on 1 March 2020).
  20. Zuberi, M.J.S.; Bless, F.; Chambers, J.; Arpagaus, C.; Bertsch, S.S.; Patel, M.K. Excess heat recovery: An invisible energy resource for the Swiss industry sector. Appl. Energy 2018, 228, 390–408. [Google Scholar] [CrossRef]
  21. Lu, H.; Price, L.; Zhang, Q. Capturing the invisible resource: Analysis of waste heat potential in Chinese industry. Appl. Energy 2016, 161, 497–511. [Google Scholar] [CrossRef] [Green Version]
  22. Johnson, I.; Choate, W.T.; Davidson, A. Waste Heat Recovery: Technology and Opportunities in U.S. Industry; BCS Incorporated: Laurel, NJ, USA, 2008. [Google Scholar]
  23. Dupont, M.; Sapora, E. The heat recovery potential in the French industry: Which opportunities for heat pump systems? In Proceedings of the ECEEE 2009 Summer Study, Nice, France, 1–6 June 2009; pp. 1115–1123. [Google Scholar]
  24. Persson, U.; Möller, B.; Werner, S. Heat Roadmap Europe: Identifying strategic heat synergy regions. Energy Policy 2014, 74, 663–681. [Google Scholar] [CrossRef]
  25. Möller, B.; Wiechers, E.; Persson, U.; Grundahl, L.; Connolly, D. Heat Roadmap Europe: Identifying local heat demand and supply areas with a European thermal atlas. Energy 2018, 158, 281–292. [Google Scholar] [CrossRef]
  26. Naegler, T.; Simon, S.; Klein, M.; Gils, H.C. Quantification of the European industrial heat demand by branch and temperature level. Int. J. Energy Res. 2015, 39, 2019–2030. [Google Scholar] [CrossRef] [Green Version]
  27. Miró, L.; Brückner, S.; Cabeza, L.F. Mapping and discussing Industrial Waste Heat (IWH) potentials for different countries. Renew. Sustain. Energy Rev. 2015, 51, 847–855. [Google Scholar] [CrossRef] [Green Version]
  28. Kong, L.; Hasanbeigi, A.; Price, L. Assessment of emerging energy-efficiency technologies for the pulp and paper industry: A technical review. J. Clean. Prod. 2016, 122, 5–28. [Google Scholar] [CrossRef] [Green Version]
  29. Swedish Energy Agency. Energy in Sweden 2015. ET015:8; Energimyndigheten: Eskilstuna, Sweden, 2015. [Google Scholar]
  30. Andersson, E.; Thollander, P. Key performance indicators for energy management in the Swedish pulp and paper industry. Energy Strateg. Rev. 2019, 24, 229–235. [Google Scholar] [CrossRef]
  31. Thollander, P.; Ottosson, M. An energy efficient Swedish pulp and paper industry—Exploring barriers to and driving forces for cost-effective energy efficiency investments. Energy Effic. 2008, 1, 21–34. [Google Scholar] [CrossRef] [Green Version]
  32. Laurijssen, J.; Faaij, A.; Worrell, E. Energy conversion strategies in the European paper industry—A case study in three countries. Appl. Energy 2012, 98, 102–113. [Google Scholar] [CrossRef]
  33. Confederation of European Paper Industries. Key Statistics 2018. European Pulp & Paper Industry; Confederation of European Paper Industries: Brussels, Belgium, 2019. [Google Scholar]
  34. International Energy Agency. Tracking Clean Energy Progress 2016; IEA: Paris, France, 2016. [Google Scholar]
  35. Ericsson, K.; Nilsson, L.J. Climate Innovations in the Paper Industry: Prospects for Decarbonisation; (IMES/EESS Report Series; Volume 110); Miljö- och Energisystem, LTH, Lunds Universitet: Lund, Sweden, 2018. [Google Scholar]
  36. Svensson, I.L.; Jönsson, J.; Berntsson, T.; Moshfegh, B. Excess heat from kraft pulp mills: Trade-offs between internal and external use in the case of Sweden-Part 1: Methodology. Energy Policy 2008, 36, 4178–4185. [Google Scholar] [CrossRef]
  37. Broberg Viklund, S.; Johansson, M.T. Technologies for utilization of industrial excess heat: Potentials for energy recovery and CO2 emission reduction. Energy Convers. Manag. 2014, 77, 369–379. [Google Scholar] [CrossRef] [Green Version]
  38. Amiri, S.; Weinberger, G. Increased cogeneration of renewable electricity through energy cooperation in a Swedish district heating system—A case study. Renew. Energy 2018, 116, 866–877. [Google Scholar] [CrossRef]
  39. Isaksson, J.; Jansson, M.; Åsblad, A.; Berntsson, T. Transportation fuel production from gasified biomass integrated with a pulp and paper mill—Part A: Heat integration and system performance. Energy 2016, 103, 557–571. [Google Scholar] [CrossRef]
  40. Mesfun, S.; Toffolo, A. Integrating the processes of a Kraft pulp and paper mill and its supply chain. Energy Convers. Manag. 2015, 103, 300–310. [Google Scholar] [CrossRef]
  41. Mongkhonsiri, G.; Gani, R.; Malakul, P.; Assabumrungrat, S. Integration of the biorefinery concept for the development of sustainable processes for pulp and paper industry. Comput. Chem. Eng. 2018, 119, 70–84. [Google Scholar] [CrossRef]
  42. Benali, M.; Périn-Levasseur, Z.; Savulescu, L.; Kouisni, L.; Jemaa, N.; Kudra, T.; Paleologou, M. Implementation of lignin-based biorefinery into a Canadian softwood kraft pulp mill: Optimal resources integration and economic viability assessment. Biomass Bioenergy 2014, 67, 473–482. [Google Scholar] [CrossRef]
  43. Päivärinne, S.; Hjelm, O.; Gustafsson, S. Excess heat supply collaborations within the district heating sector: Drivers and barriers. J. Renew. Sustain. Energy 2015, 7, 033117. [Google Scholar] [CrossRef] [Green Version]
  44. International Energy Agency. IEA IETS, Annex XV: Industrial Excess Heat Recovery—Technologies and Applications, Supported by Austria, Canada, Denmark, Germany, Italy, Norway, Portugal, and Sweden, Final Report—Task2; International Energy Agency: Paris, France, 2019. [Google Scholar]
  45. Bendig, M.; Maréchal, F.; Favrat, D. Defining waste heat for industrial processes. Appl. Therm. Eng. 2013, 61, 134–142. [Google Scholar] [CrossRef]
  46. International Energy Agency. IEA IETS, Annex XV: Industrial Excess Heat Recovery Technologies & Applications, Final Report—Task 1; International Energy Agency: Paris, France, 2015. [Google Scholar]
  47. Svensson, E.; Morandin, M.; Harvey, S. Characterization and visualization of industrial excess heat for different levels of on-site process heat recovery. Int. J. Energy Res. 2019, 43, 7988–8003. [Google Scholar] [CrossRef] [Green Version]
  48. Johansson, M.T.; Söderström, M. Options for the Swedish steel industry—Energy efficiency measures and fuel conversion. Energy 2011, 36, 191–198. [Google Scholar] [CrossRef] [Green Version]
  49. Johansson, M.T.; Söderström, M. Electricity generation from low-temperature industrial excess heat—An opportunity for the steel industry. Energy Effic. 2014, 7, 203–215. [Google Scholar] [CrossRef] [Green Version]
  50. Ma, G.Y.; Cai, J.J.; Zeng, W.W.; Dong, H. Analytical research on waste heat recovery and utilization of china’s iron & steel industry. Energy Procedia 2012, 14, 1022–1028. [Google Scholar]
  51. Campana, F.; Bianchi, M.; Branchini, L.; De Pascale, A.; Peretto, A.; Baresi, M.; Fermi, A.; Rossetti, N.; Vescovo, R. ORC waste heat recovery in European energy intensive industries: Energy and GHG savings. Energy Convers. Manag. 2013, 76, 244–252. [Google Scholar] [CrossRef]
  52. Law, R.; Harvey, A.; Reay, D. Opportunities for low-grade heat recovery in the UK food processing industry. Appl. Therm. Eng. 2013, 53, 188–196. [Google Scholar] [CrossRef]
  53. Hirzel, K.S.; Sontag, B.; Rohde, C. Industrielle Abwärmenutzung—Kurzstudie—[Industrial Waste Heat Recovery—Short Study]; Fraunhofer ISI: Karlsruhe, Germany, 2013. [Google Scholar]
  54. DECC. The Potential for Recovering and Using Surplus Heat from Industry Final Report; DECC: London, UK, 2014. [Google Scholar]
  55. Frederiksen, S.; Werner, S. District Heating and Cooling; Studentlitteratur AB: Lund, Sweden, 2013; ISBN 9789144085302. [Google Scholar]
  56. Svensson, E.; Morandin, M.; Cruz, I.; Harvey, S. Availability of excess heat from the Swedish Kraft pulping industry. In Proceedings of the International Sustainable Energy Conference on Renewable Heating and Cooling in Integrated Urban and Industrial Energy Systems, Graz, Austria, 23 March 2018; pp. 697–706. [Google Scholar]
  57. De Beer, J.; Worrell, E.; Blok, K. Long-term energy-efficiency improvements in the paper and board industry. Energy 1998, 23, 21–42. [Google Scholar] [CrossRef]
  58. US Energy Information Administration. Cost and Performance Characteristics of New Generating Technologies, Annual Energy Outlook 2018; US Energy Information Administration: Washington, DC, USA, 2017; pp. 1–3.
  59. Quoilin, S.; Declaye, S.; Tchanche, B.F.; Lemort, V. Thermo-economic optimization of waste heat recovery Organic Rankine Cycles. Appl. Therm. Eng. 2011, 31, 2885–2893. [Google Scholar] [CrossRef] [Green Version]
  60. Liu, B.T.; Chien, K.H.; Wang, C.C. Effect of working fluids on organic Rankine cycle for waste heat recovery. Energy 2004, 29, 1207–1217. [Google Scholar] [CrossRef]
  61. Dai, Y.; Wang, J.; Gao, L. Parametric optimization and comparative study of organic Rankine cycle (ORC) for low grade waste heat recovery. Energy Convers. Manag. 2009, 50, 576–582. [Google Scholar] [CrossRef]
  62. Wei, D.; Lu, X.; Lu, Z.; Gu, J. Performance analysis and optimization of organic Rankine cycle (ORC) for waste heat recovery. Energy Convers. Manag. 2007, 48, 1113–1119. [Google Scholar] [CrossRef]
  63. Oluleye, G.; Jobson, M.; Smith, R.; Perry, S.J. Evaluating the potential of process sites for waste heat recovery. Appl. Energy 2016, 161, 627–646. [Google Scholar] [CrossRef]
  64. Tchanche, B.F.; Papadakis, G.; Lambrinos, G.; Frangoudakis, A. Fluid selection for a low-temperature solar organic Rankine cycle. Appl. Therm. Eng. 2009, 29, 2468–2476. [Google Scholar] [CrossRef] [Green Version]
  65. Saleh, B.; Koglbauer, G.; Wendland, M.; Fischer, J. Working fluids for low-temperature organic Rankine cycles. Energy 2007, 32, 1210–1221. [Google Scholar] [CrossRef]
  66. Dickes, R.; Ziviani, D.; de Paepe, M.; van den Broek, M.; Quoilin, S.; Lemort, V. ORCmKit: An open-source library for organic Rankine cycle modelling and analysis. In Proceedings of the 29th International Conference on Efficiency, Cost, Optimization, Simulation and Environmental Impact of Energy Systems, Portorož, Slovenia, 19–23 June 2016. [Google Scholar]
  67. Ziviani, D.; Woodland, B.J.; Georges, E.; Groll, E.A.; Braun, J.E.; Horton, W.T.; Van den Broek, M.; De Paepe, M. Development and a Validation of a Charge Sensitive Organic Rankine Cycle (ORC) Simulation Tool. Energies 2016, 9, 389. [Google Scholar] [CrossRef] [Green Version]
  68. Swedish Energy Agency. Energy in Sweden 2020, An Overview. ET 2020:11; Energimyndigheten: Eskilstuna, Sweden, 2020. [Google Scholar]
  69. Skogsindustrierna Miljödatabasen 2002–2020. Available online: https://miljodatabas.skogsindustrierna.org (accessed on 13 June 2021).
  70. Ericsson, K.; Nilsson, L.J.; Nilsson, M. New energy strategies in the Swedish pulp and paper industry-The role of national and EU climate and energy policies. Energy Policy 2011, 39, 1439–1449. [Google Scholar] [CrossRef]
  71. Bood, J.; Nilsson, L. Energy Analysis of Hemicellulose Extraction at a Softwood Kraft Pulp Mill—Case Study of Södra Cell Värö; Chalmers University of Technology: Gothenburg, Sweden, 2013. [Google Scholar]
  72. Ahlström, J.; Benzon, M. Design of the Heat Recovery Systems at the Reconstructed Pulp Mill Östrand. Master’s Thesis, Chalmers University of Technology, Gothenburg, Sweden, 2015. [Google Scholar]
  73. Isaksson, J.; Åsblad, A.; Berntsson, T. Influence of dryer type on the performance of a biomass gasification combined cycle co-located with an integrated pulp and paper mill. Biomass Bioenergy 2013, 59, 336–347. [Google Scholar] [CrossRef]
  74. Eriksson, L.; Hermansson, S. Pinch Analysis of Billerud Karlsborg, a Partly Integrated Pulp and Paper Mill. Master’s Thesis, Chalmers University of Technology, Gothenburg, Sweden, 2010. [Google Scholar]
  75. Delin, L.; Berglin, N.; Lundström, A.; Samuelsson, Å.; Backlund, B.; Sivard, Å. Bleached Market Kraft Pulp Mill—Reference and Type Mill; FRAM Report No 09; FRAM R&D Program: Stockholm, Sweden, 2005. [Google Scholar]
  76. Delin, L.; Berglin, N.; Eriksson, T.; Andersson, R.; Samuelsson, Å.; Lundström, A.; Backlund, B. Integrated Fine Paper Mill; FRAM Report No 10; FRAM R&D Program: Stockholm, Sweden, 2005. [Google Scholar]
  77. Axelsson, E.; Marcus, O.; Berntsson, T. Heat integration opportunities in average Scandinavian kraft pulp mills: Pinch analyses of model mills. Nord. Pulp Pap. Res. J. 2006, 21, 466–475. [Google Scholar] [CrossRef]
  78. Axelsson, E.; Berntsson, T. Heat integration opportunities in an average Scandinavian fine paper mill: Model study and comparison with a market pulp mill. Tappi J. 2008, 7, 19–25. [Google Scholar]
  79. Svensson, E.; Edland, R.; Langner, C.; Harvey, S. Assessing the value of a diversified by-product portfolio to allow for increased production flexibility in pulp mills. Nord. Pulp Pap. Res. J. 2020, 35, 533–558. [Google Scholar] [CrossRef]
  80. Fleiter, T.; Fehrenbach, D.; Worrell, E.; Eichhammer, W. Energy efficiency in the German pulp and paper industry—A model-based assessment of saving potentials. Energy 2012, 40, 84–99. [Google Scholar] [CrossRef]
Figure 1. ORC cycle simulation using the ORCmKit simulation tool [66], adapted to the operating conditions for IEH recovery at 100 °C, as an example.
Energies 14 08499 g001
Figure 2. Total kraft pulp production, heat and electricity sales, together with specific heat and electricity sales for the years 2002 to 2020 [69].
Energies 14 08499 g002
Figure 3. (Left): declared electricity production vs. biofuel use in Swedish mills in 2019. (Right): declared sold excess heat vs. biofuel use in Swedish mills in 2019. Compiled with data from [69].
Energies 14 08499 g003
Figure 4. Overview of the method to obtain the availability of industrial excess heat and calculating the electricity generation potentials.
Energies 14 08499 g004
Figure 5. Integration of a steam turbine cycle with the pulp mill process using heat from the recovery boiler. (Left): Heat availability from the recovery boiler shown as a background process, and heat demand from the pulp mill shown as a foreground process. (Right): Back-pressure and condensing turbine operation shown as a foreground process and heat from the recovery boiler plus process heat pulp mill demand as a background process.
Energies 14 08499 g005
Figure 6. Estimated theoretical XHT signature for the Södra Värö pulp mill, based on the net cooling demand represented by the GCC of the integrated pulp mill process, recovery boiler and steam cycle.
Energies 14 08499 g006
Figure 7. Estimation of excess heat recovered by the ORC at each temperature level. The XHT signature (red line) represents the potential IEH recovery integrated with the process, and at each temperature level, the ORC system evaporator temperature is selected to recover the heat available.
Energies 14 08499 g007
Figure 8. Theoretical and process cooling XHT signatures considering annual IEH availability (operating for 7834 h/year in steady state operation and with seasonal variations ignored): (a) Södra Värö; (b) SCA Östrand; (c) Holmen Iggesund; (d) Billerud-Korsnäs Karlsborg; (e) FRAM typical pulp mill; (f) FRAM typical integrated mill.
Energies 14 08499 g008
Figure 9. Estimated specific excess heat availability, as a percentage of excess heat compared to total declared biofuel usage above 25 °C (left) and above 60 °C (right) in the six studied kraft mills.
Energies 14 08499 g009
Figure 10. Estimated and regressed results (68% confidence intervals) for the availability of excess heat above 60 °C for the six kraft mills.
Energies 14 08499 g010
Figure 11. Specific conventional steam turbine electricity generation estimated in this study and declared values from [69]. Percentages shown as ratio of electricity production and biofuel usage. * The estimation for Östrand was based on quotations for a planned reconstructed mill, which only entered operation recently. Declared electricity generation after the reconstruction is currently unavailable.
Energies 14 08499 g011
Table 1. Classification of IEH temperature intervals in different studies.
SourceLowMediumHigh
Brüeckner et al. [9]<100 °C100–400 °C>400 °C
Hirzel et al. [53]<150 °C150–500 °C>500 °C
DECC [54]<250 °C250–500 °C>500 °C
Johnson et al. [22]<230 °C230–650 °C>650 °C
Ma et al. [50]<150 °C150–500 °C>500 °C
Frederiksen and Werner [55]<100 °C100–400 °C>400 °C
Svensson et al. [36]40–60 °C100 °C
Johansson and Söderström [49]<230 °C
Table 2. Temperature intervals and nomenclature considered in this study.
Excess Heat CategoryTemperature Range
Very high temperature>250 °C
High temperature≥140–250 °C
Medium temperature≥100–140 °C
Low temperature≥60–100 °C
Very low temperature≥40–60 °C
Extremely low temperature≥25–40 °C
Table 4. Selected working fluid for ORC application.
Working FluidT Critical (°C)P Critical (MPa)Boiling Point (°C)
R245fa153.93.65115.3
Table 5. Overview of kraft mill study cases. Data taken from Miljödatabasen [69] and the respective studies, with the exception of the FRAM mills [75,76].
MillSödra Cell VäröSCA ÖstrandHolmen
Iggesund
Billerud-Korsnäs KarlsborgFRAM Type Pulp MillFRAM Type
Integrated Mill
Pulp prod. (kt/y)419900 (+95)347272327385
Market pulp (kt/y)419900 (+95)501513270
Paper/board (kt/y)003811510512
Biofuel (GWh/y)3035n/a2327195219752594
Fossil fuel (GWh/y)31n/a664800
El. prod. (GWh/y)358n/a303224259270
Sold heat (GWh/y)91n/a----
Data year201220152013200920062008
Data sourceMostly
measurements
Quotations and modelsMostly
measurements
Mostly
measurements
FRAM
models
FRAM
models
Mill typeMarket pulpMarket pulpIntegratedIntegratedMarket pulpIntegrated
Process thermal data referenceBood and
Nilsson [71]
Ahlström and Benzon [72]Isaksson et al. [73]Eriksson and
Hermansson [74]
Axelsson et al. [77] Axelsson and Berntsson [78]
Table 6. Categories of excess heat according to temperature levels, average Carnot factors and normalised weight factors for optimisation. Tamb = 273.15 K and TIEH is the temperature of the excess heat.
Excess Heat CategoryTemperature RangeHeat Enthalpy Notation (xi)Average Carnot
Factor (1-TAmb/TIEH)
Normalised Weight Factor (WF)
Very high temperature500–250 °Cx100.5623−6.71
250–250 °Cx90.4779−5.70
High temperature250–140 °Cx80.4084−4.87
140–140 °Cx70.3389−4.04
Medium temperature140–100 °Cx60.3034−3.62
100–100 °Cx50.2680−3.20
Low temperature100–60 °Cx40.2240−2.67
60–60 °Cx30.1801−2.15
Very low temperature60–40 °Cx20.1539−1.84
40–40 °Cx10.1277−1.52
Extremely low temperature40–25 °Cx00.0839−1
Table 7. Assumptions for the heat integration study.
Theoretical XHTProcess Cooling XHT
Black liquor useful energy6.046 MWh/ADt pulp6.046 MWh/ADt pulp
Bark 1-Total biofuel–black liquor
ΔTmin0 °C5 °C
High-pressure steam conditions100 bar, 530 °C80 bar, 480 °C
Turbine isentropic efficienciesBack-pressure: 0.85
Condensing: 0.9
Back-pressure: 0.75
Condensing: 0.85
Condenser pressure0.1 bar0.1 bar
Additional steam production-16 bar
Secondary heating system-20 to 60 °C and 20 to 80 °C
1 The amount of bark used to obtain the Process cooling XHT is the difference between total biofuel input and the black liquor resulting from the pulp process.
Table 8. Organic Rankine cycle calculated net efficiencies at each industrial excess heat temperature level.
IEH Temperature (°C)ORC Efficiency (R245fa)
600.058
1000.072
1400.086
Table 9. Estimated annual electricity generation potential from low and medium temperature industrial excess heat in the six case studies for the theoretical heat integration scenario.
Electricity Generation (GWh/a)
Temperature LevelSödra Cell VäröSCA ÖstrandHolmen IggesundBillerud-Korsnäs KarlsborgFRAM Type Pulp MillFRAM Type Integrated MillTotal (Cases)
ORC 6037192102420121
ORC 100052640567
ORC 1400002002
Total (mill)37712862425190
Integrated steam cycle565134021205393882612
Increase in electricity production 17%5%129%3%6%28%7%
1 The reference electricity production for calculating the increase in production is the integrated steam cycle targeted for each mill in the scenario considered.
Table 10. Estimated annual electricity generation potential from low and medium temperature industrial excess heat in the six case studies for the process cooling heat integration scenario.
Electricity Generation (GWh/a)
Temperature LevelSödra Cell VäröSCA ÖstrandHolmen IggesundBillerud-Korsnäs KarlsborgFRAM Type Pulp MillFRAM Type Integrated MillTotal (Cases)
ORC 6034401900093
ORC 100035260648
ORC 1400551192513113
Total (mill)3412921252519254
Integrated steam cycle63113422501922602812956
Increase in electricity production 15%10%8%13%10%7%9%
1 The reference electricity production for calculating the increase in production is the integrated steam cycle targeted for each mill in the scenario considered.
Table 11. Comparison between estimated electricity generation potentials and regressed potentials, plus total generation potentials for all kraft mills in Sweden (theoretical scenario).
Temperature LevelEstimated Total,
Case Studies (GWh/a)
Regressed Total,
Case Studies (GWh/a)
Regressed Total,
All Swedish Kraft Mills (GWh/a)
ORC 60121103275
ORC 1006780251
ORC 140228
Total (mills)190185534
% increase7%7%10%
Table 12. Comparison between estimated electricity generation potentials and regressed potentials, plus total generation potentials for all kraft mills in Sweden (process cooling scenario).
Temperature LevelEstimated Total,
Case Studies (GWh/a)
Regressed Total,
Case Studies (GWh/a)
Regressed Total,
All Swedish Kraft Mills (GWh/a)
ORC 6093100224
ORC 1004859177
ORC 140113119289
Total (mills)254278690
% increase9%9%13%
Publisher’s Note: MDPI stays neutral with regard to jurisdictional claims in published maps and institutional affiliations.

