
Standard Test Methods for Rating of Solar Reflectance of Built-Up Surfaces and Potential Use of Satellite Remote Sensors


Abstract
:1. Introduction
2. Standard Test Methods and Instruments for Solar Reflectance Measurement
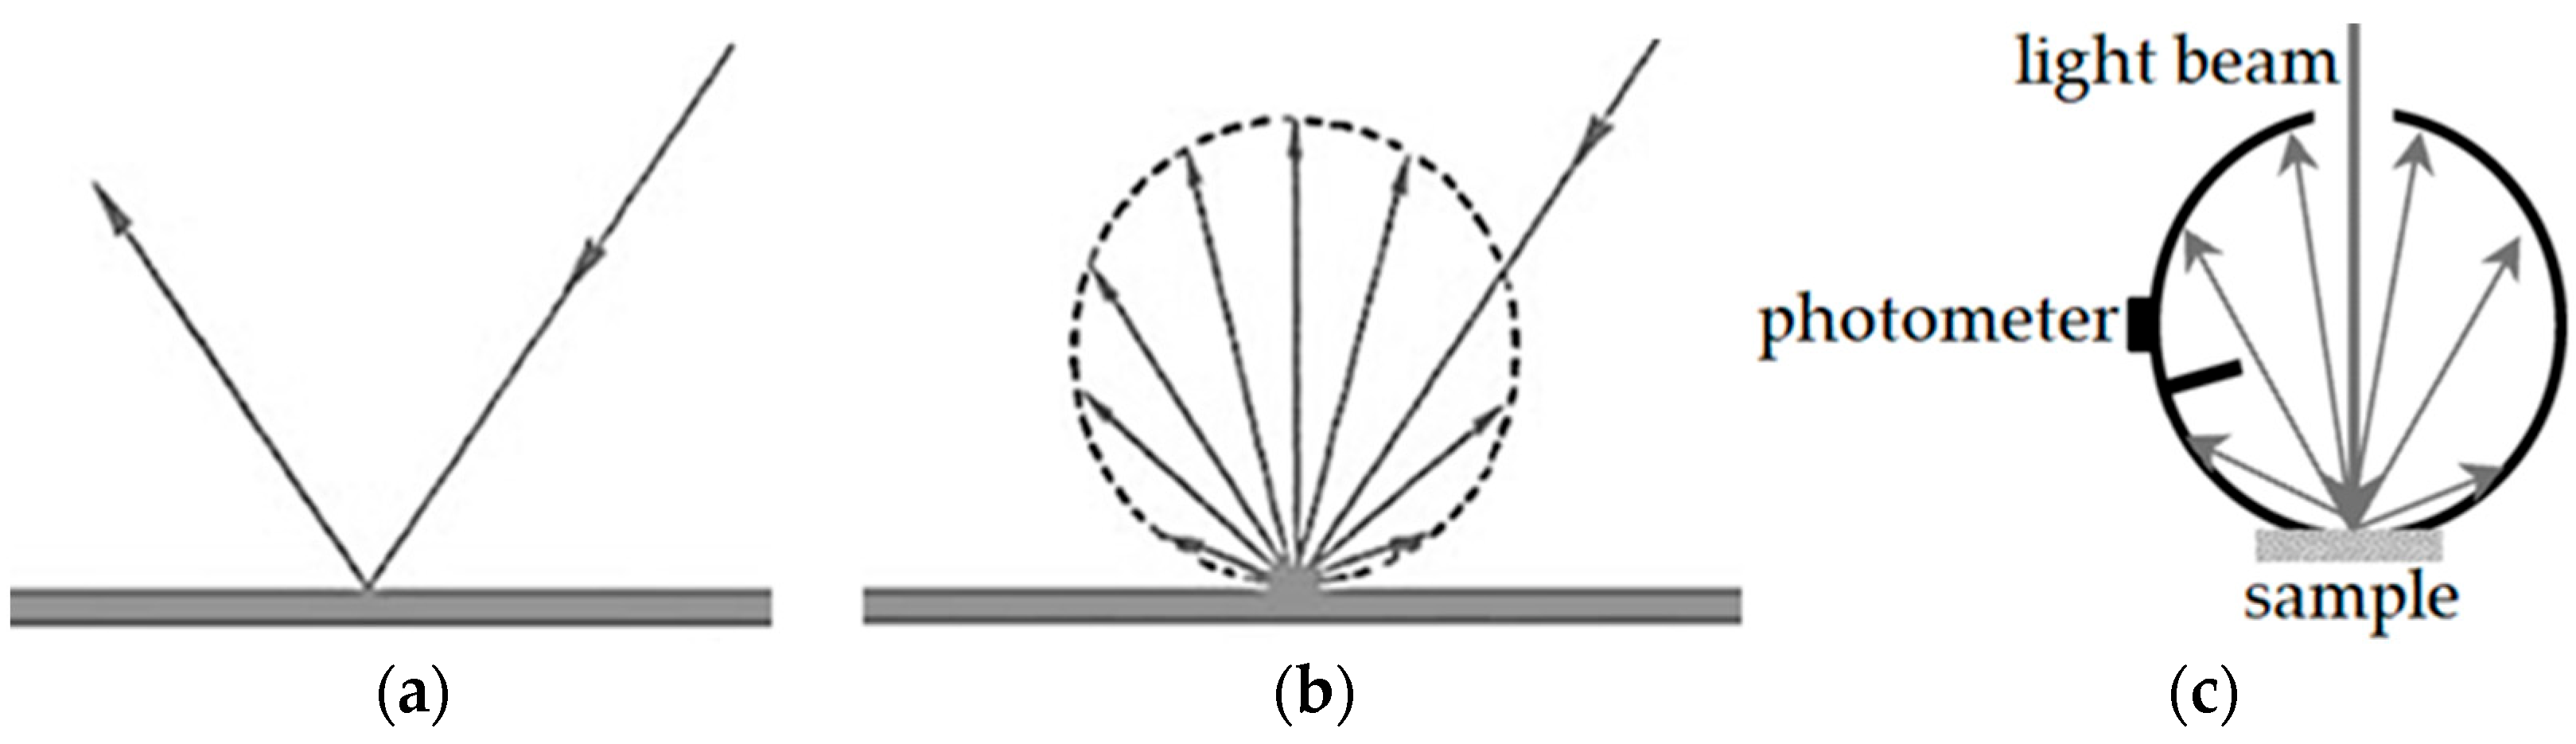
2.1. Spectrophotometer
- -
- beam normal or direct normal, i.e., the solar flux coming from a solid angle covering the sun’s disk and reaching a surface perpendicular to the axis of the above-mentioned solid angle;
- -
- direct—from the sun’s disk onto a surface with a given inclination and orientation;
- -
- direct and circumsolar—which includes the direct radiation scattered by the atmosphere so that it seems to come from an area of the sky immediately adjacent to the sun’s disk, whose aperture is related to the aerosol optical depth [36];
- -
- diffuse—over the entire hemisphere facing the earth surface (excluded direct); and
- -
- global—which includes direct and diffuse.
2.2. Solar Reflectometer
2.3. Pyranometer
2.4. Non-Standard Test Methods for Advanced Solar-Reflective Materials
2.5. Accessory Measurement of Thermal Emittance and Calculation of the Solar Reflectance Index (SRI)
3. Solar Reflectance from Satellite Data
4. Exploratory Comparison of Field and Satellite Measurements
4.1. Test Area and Ground Measurement
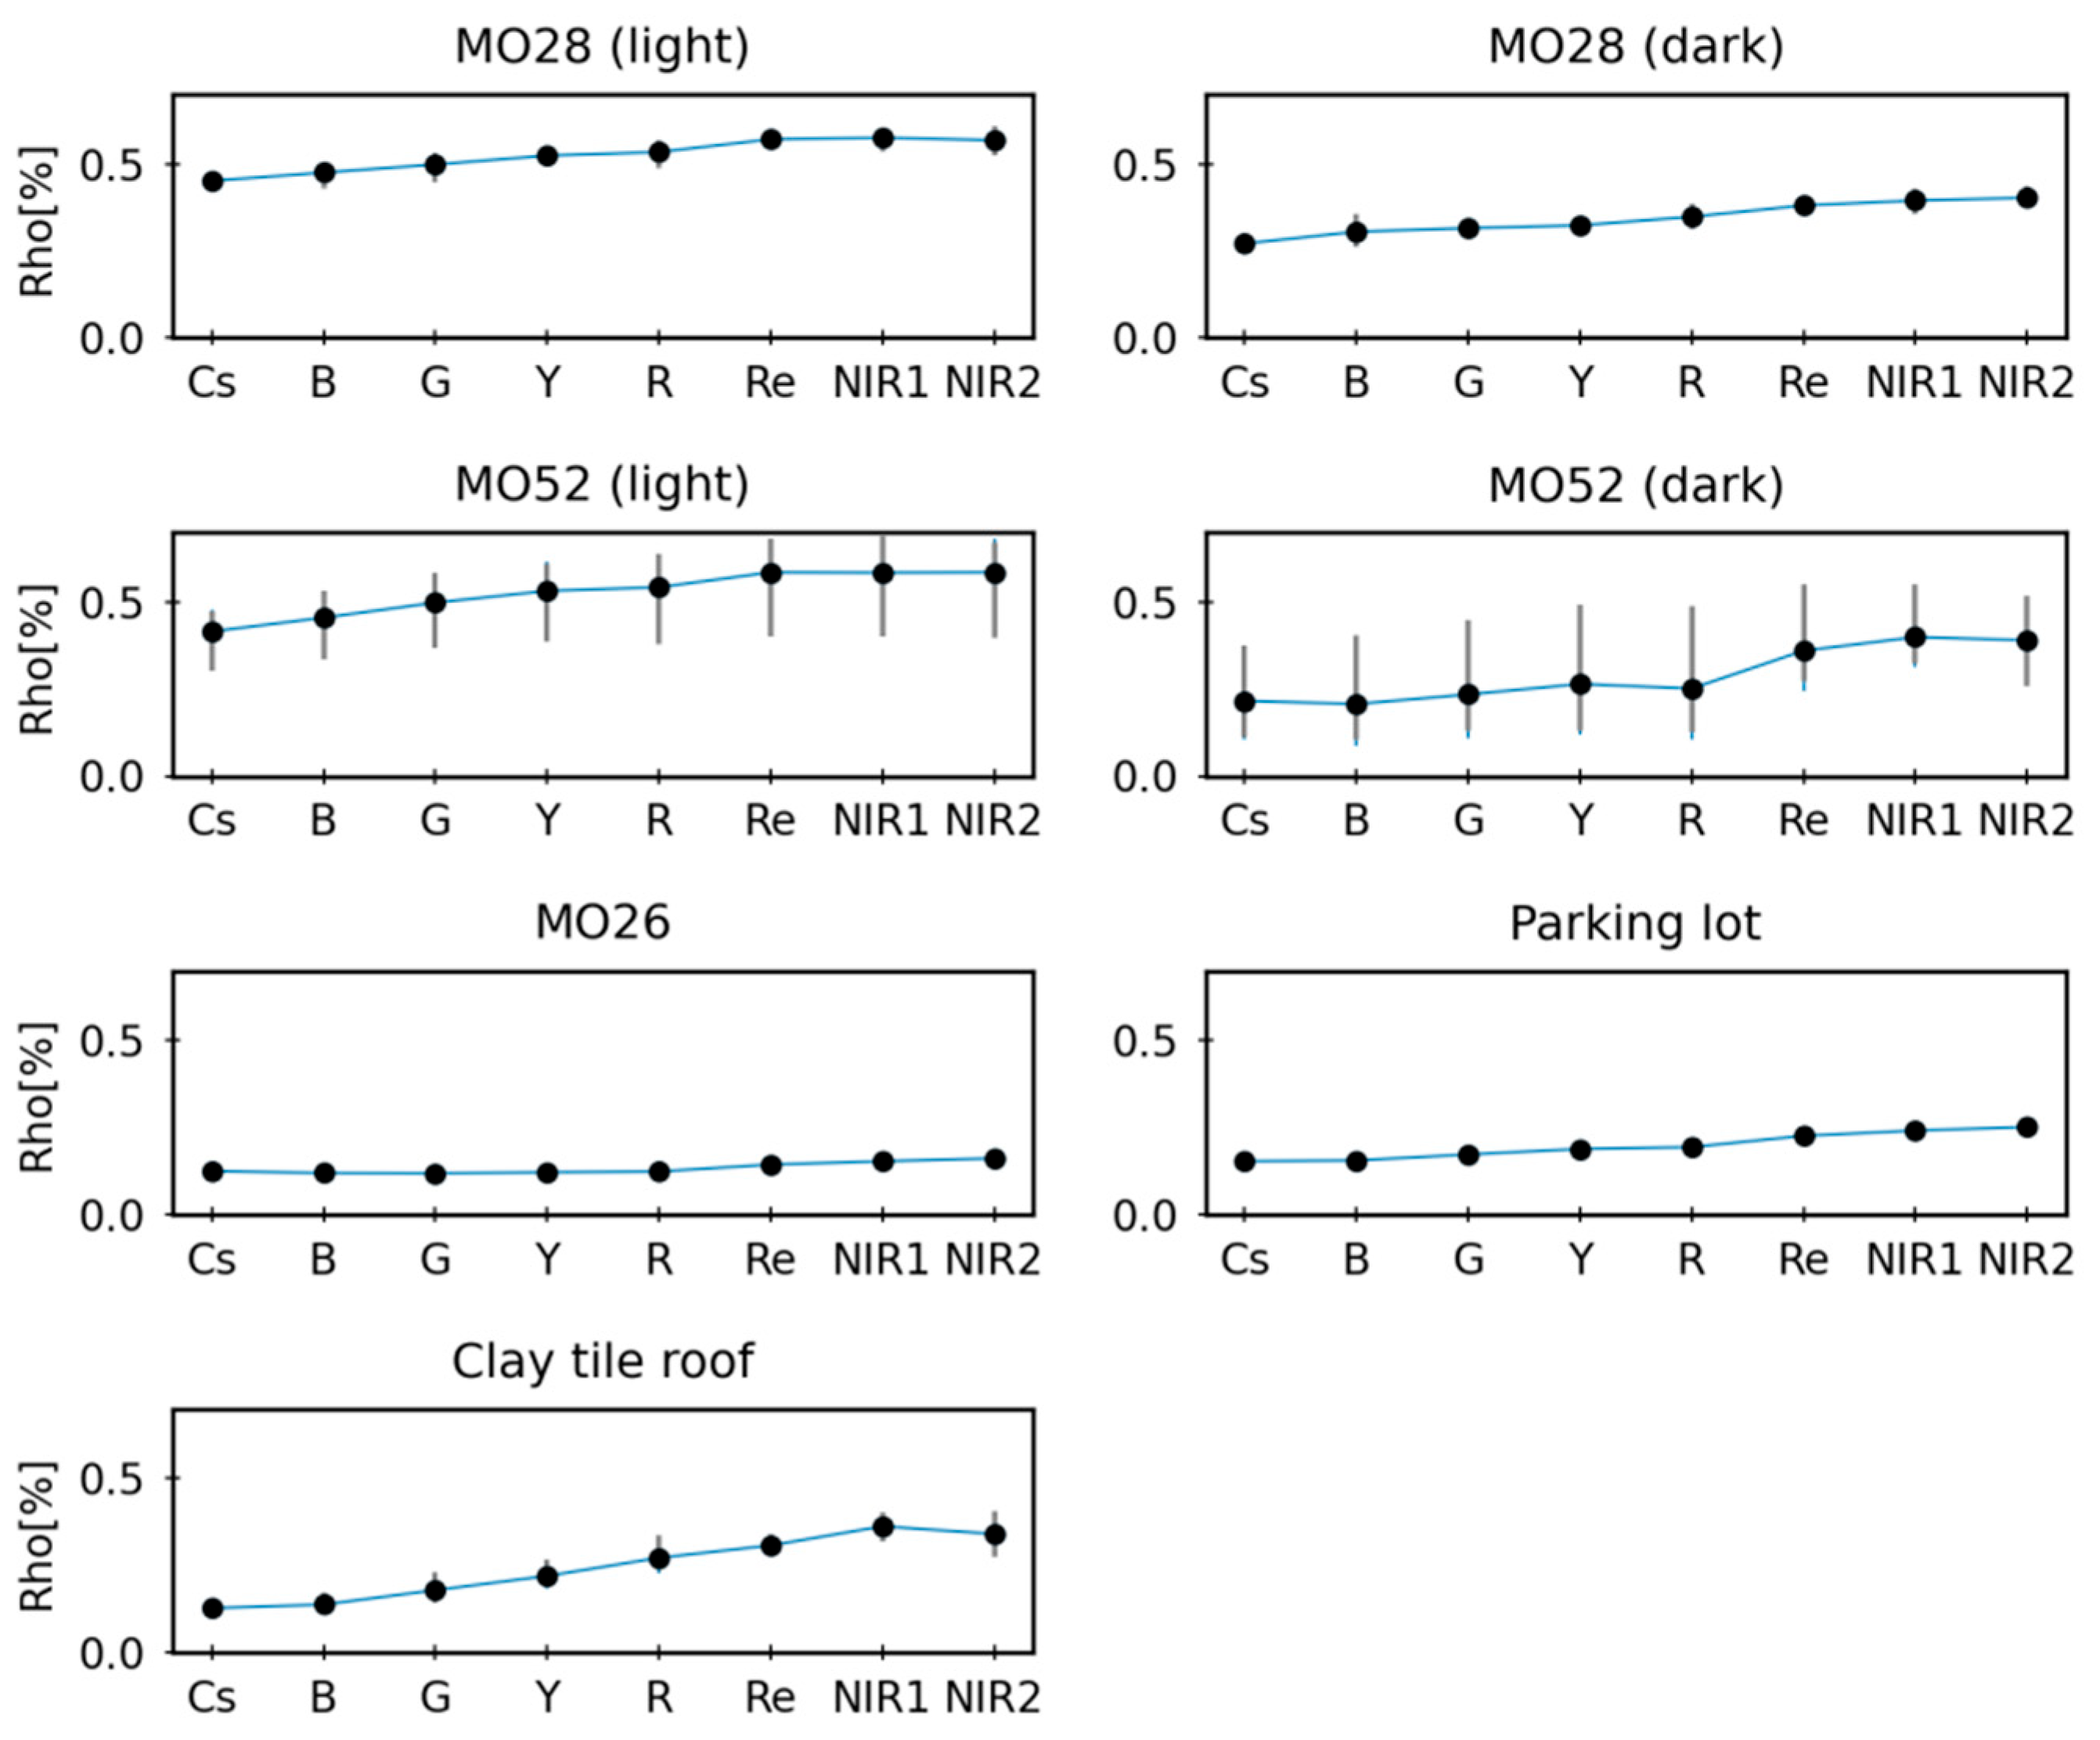
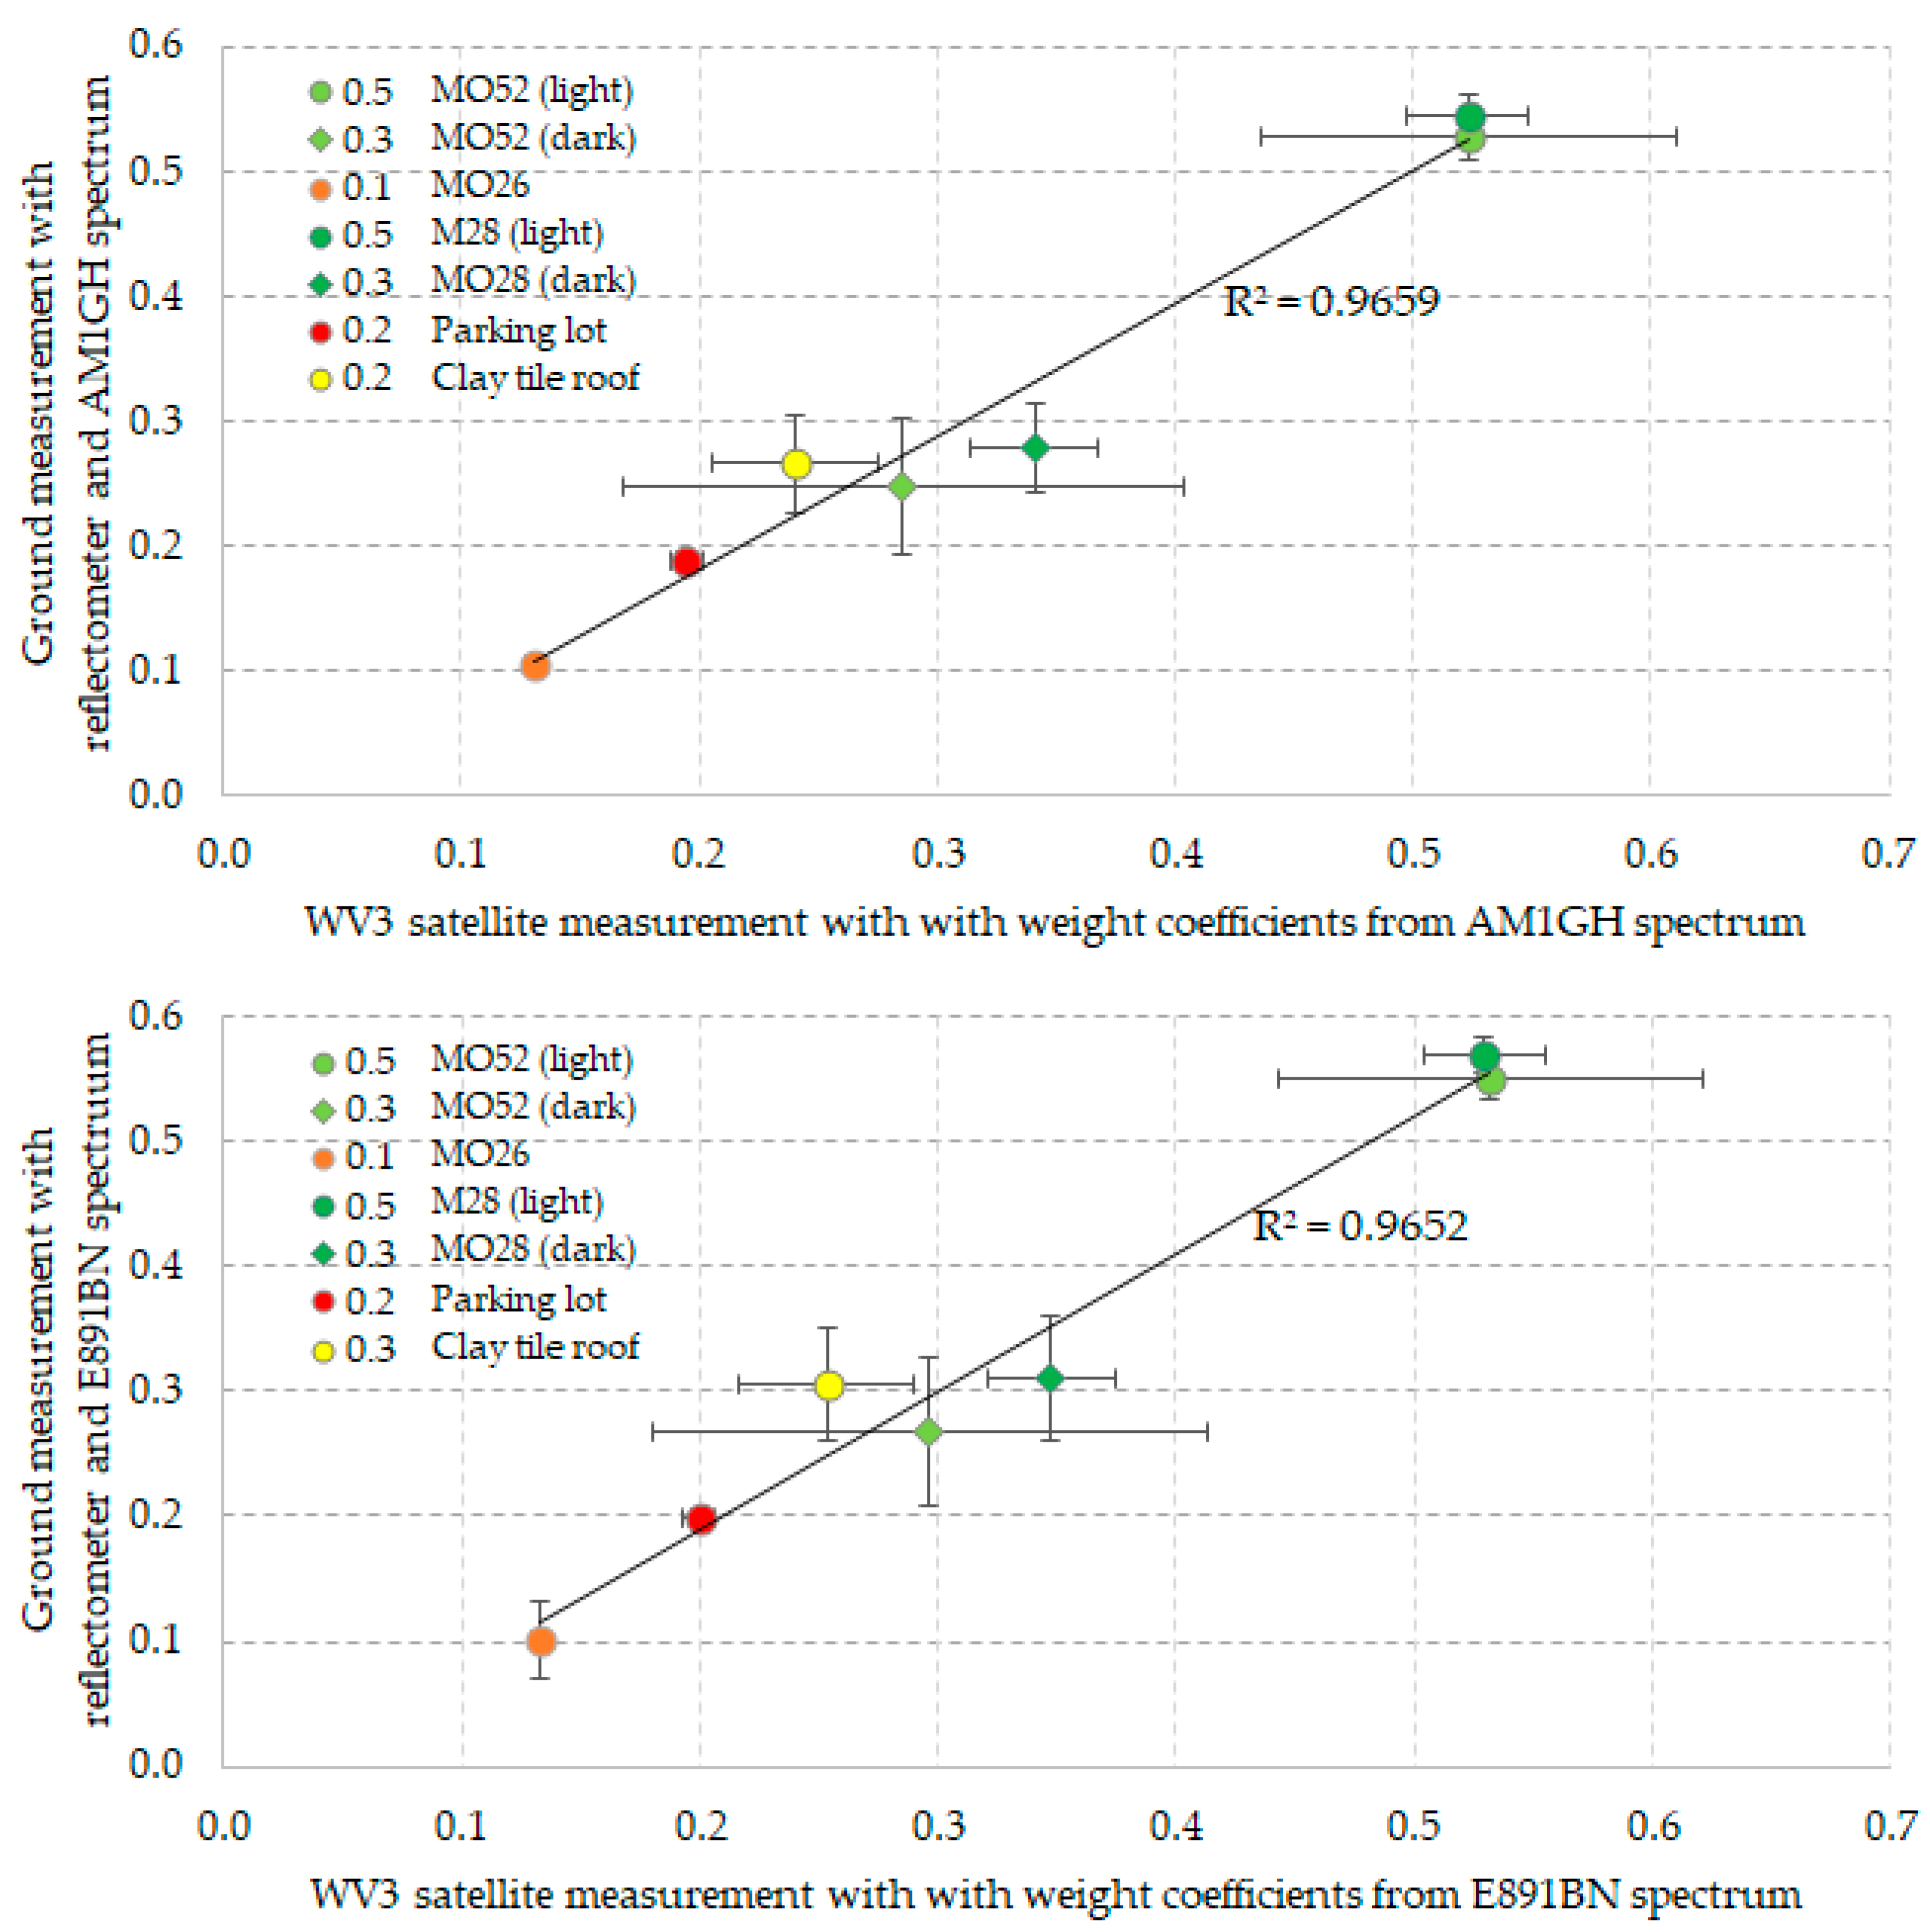
4.2. Satellite Measurements
5. Concluding Remarks
Author Contributions
Funding
Conflicts of Interest
Abbreviations
| Greek and Mixed Symbols | |
| Δλ | wavelength interval (nm or μm) |
| ε | thermal emittance (0 < ε < 1)) |
| θ | solar zenith angle (rad) |
| Λ | spectral range over which the albedo is calculated |
| λ | wavelength (nm or μm) |
| ρλ | measured spectral reflectance (0 < ρλ < 1)) |
| ρsol | solar reflectance (0 < ρsol < 1)) |
| σ0 | Stefan–Boltzmann constant (5.67·10−8 W/(m2K4)) |
| φ | azimuth angle between the direction of illumination and that of observation (rad) |
| Latin Symbols | |
| hc | convection heat transfer coefficient W/(m2K)) |
| Iλ | solar irradiance in a given waveband (W/(m2nm)) |
| Isol,λ | spectral irradiance of the sun at the earth surface (W/(m2nm) |
| R | hemispherical bidirectional reflectance distribution function |
| T | temperature (K) |
| Tb | temperature of a black reference surface (K) |
| Tair | atmospheric air temperature (K) |
| Ts | surface temperature at certain conditions (K) |
| Tsky | sky temperature (K) |
| Tw | temperature of a white reference surface (K) |
| wλ | weight coefficient in a given waveband |
| Acronyms and Chemical Formulas | |
| AM1GH | Air Mass 1 Global Horizontal solar spectrum |
| ANSI | American National Standards Institute |
| AOI | Area of Interest |
| ASHRAE | American Society of Heating, Refrigerating and Air-Conditioning Engineers |
| ASTM | American Society for Testing and Materials |
| BaSO4 | Barium Sulfate |
| BOA | Bottom Of Atmosphere |
| CRRC | Cool Roof Rating Council |
| E891BN | Air Mass 1.5 Beam Normal solar spectrum from ASTM E891 |
| ECRC | European Cool Roof Council |
| IECC | International Energy Conservation Code |
| IES | Illuminating Engineering Society |
| LEED | Leadership in Energy and Environmental Design |
| MgO | Magnesium Oxide |
| NIR | Near Infrared Spectral range |
| NIST | National Institute of Standards and Technology |
| NBS | National Bureau of Standards |
| Pan | Panchromatic Spectral Region |
| PTFE | Polytetrafluoroethylene |
| SRI | Solar Reflectance Index |
| SWIR | Short Wave Infrared Spectral range |
| TOA | Top Of Atmosphere |
| TIR | Thermal Infrared Spectral range |
| UV | Ultraviolet Spectral range |
| Vis | Visible Spectral range |
| WRF | Weather Research and Forecasting |
| WV3 | WorldView 3 |
References
- Akbari, H.; Pomerantz, M.; Taha, H. Cool surfaces and shade trees to reduce energy use and improve air quality in urban areas. Sol. Energy 2001, 70, 295–310. [Google Scholar] [CrossRef]
- Akbari, H.; Cartalis, C.; Kolokotsa, D.; Muscio, A.; Pisello, A.L.; Rossi, F.; Santamouris, M.; Synnefa, A.; Wong, N.H.; Zinzi, M. Local climate change and urban heat island mitigation techniques—The state of the art. J. Civ. Eng. Manag. 2016, 22, 1–16. [Google Scholar] [CrossRef] [Green Version]
- Synnefa, A.; Santamouris, M.; Akbari, H. Estimating the effect of using cool coatings on energy loads and thermal comfort in residential buildings in various climatic conditions. Energy Build. 2007, 39, 1167–1174. [Google Scholar] [CrossRef]
- Levinson, R.; Berdahl, P.; Akbari, H. Solar spectral optical properties of pigments—Part II: Survey of common colorants. Sol. Energy Mat. Sol. Cells 2005, 89, 351–389. [Google Scholar] [CrossRef]
- Synnefa, A.; Santamouris, M.; Apostolakis, K. On the development, optical properties and thermal performance of cool colored coatings for the urban environment. Sol. Energy 2007, 81, 488–497. [Google Scholar] [CrossRef]
- Santamouris, M. Using cool pavements as a mitigation strategy to fight urban heat island—A review of the actual developments. Renew. Sustain. Energy Rev. 2013, 26, 224–240. [Google Scholar] [CrossRef]
- Santamouris, M.; Synnefa, A.; Karlessi, T. Using advanced cool materials in the urban built environment to mitigate heat islands and improve thermal comfort conditions. Sol. Energy 2011, 85, 3085–3102. [Google Scholar] [CrossRef]
- Pisello, A.L. State of the art on the development of cool coatings for buildings and cities. Sol. Energy 2017, 144, 660–680. [Google Scholar] [CrossRef]
- Rossi, F.; Castellani, B.; Presciutti, A.; Morini, E.; Anderini, E.; Filipponi, M.; Nicolini, A. Experimental evaluation of urban heat island mitigation potential of retro-reflective pavement in urban canyons. Energy Build. 2016, 126, 340–352. [Google Scholar] [CrossRef]
- Levinson, R.; Chen, S.; Slack, J.; Goudey, H.; Harima, T.; Berdahl, P. Design, characterization, and fabrication of solar-retroreflective cool-wall materials. Sol. Energy Mat. Sol. Cells 2020, 206, 110117. [Google Scholar] [CrossRef] [Green Version]
- Karlessi, T.; Santamouris, M.; Apostolakis, K.; Synnefa, A.; Livada, I. Development and testing of thermochromic coatings for buildings and urban structures. Sol. Energy 2009, 83, 538–551. [Google Scholar] [CrossRef]
- Garshasbi, S.; Huang, S.; Valenta, J.; Santamouris, M. Can quantum dots help to mitigate urban overheating? An experimental and modelling study. Sol. Energy 2020, 206, 308–316. [Google Scholar] [CrossRef]
- ASTM E1980-11 (Reapproved 2019), Standard Practice for Calculating Solar Reflectance Index of Horizontal and Low-Sloped Opaque Surfaces; ASTM International: West Conshohocken, PA, USA, 2019.
- Muscio, A. The Solar Reflectance Index as a Tool to Forecast the Heat Released to the Urban Environment: Potentiality and Assessment Issues. Climate 2018, 6, 12. [Google Scholar] [CrossRef] [Green Version]
- Cool Roof Rating Council. Product Rating Program Manual CRRC-1; Cool Roof Rating Council: Portland, OR, USA, 2021; Available online: https://coolroofs.org (accessed on 1 August 2021).
- Cool Roof Rating Council. ANSI/CRRC S100 (2021)—Standard Test Methods for Determining Radiative Properties of Materials; Cool Roof Rating Council: Portland, OR, USA, 2021; Available online: https://coolroofs.org (accessed on 1 August 2021).
- European Cool Roof Council. Product Rating Program; European Cool Roof Council: Brussels, Belgium, 2020; Available online: https://coolroofcouncil.eu (accessed on 1 August 2021).
- California Energy Commission. 2019 Building Energy Efficiency Standards—Title 24; California Energy Commission: Sacramento, CA, USA, 2019. Available online: www.energy.ca.gov/title24 (accessed on 1 August 2021).
- International Code Council. 2021 International Energy Conservation Code; International Code Council: Washington, DC, USA, 2021; Available online: https://codes.iccsafe.org (accessed on 1 August 2021).
- ASHRAE. ANSI/ASHRAE/IES Standard 90.1-2019—Energy Standard for Buildings Except Low-Rise Residential Buildings; ASHRAE: Atlanta, GA, USA, 2019; Available online: https://www.ashrae.org/technical-resources/bookstore/standard-90-1 (accessed on 1 August 2021).
- U.S. Green Building Council. LEED v4.1; U.S. Green Building Council: Washington, DC, USA, 2021; Available online: www.usgbc.org/leed (accessed on 1 August 2021).
- Ge, J.; Levinson, R. The Advancement of Cool Roof Standards in China from 2010 to 2015; LBNL-1007007; Lawrence Berkeley National Laboratory, University of California: Berkeley, CA, USA, 2016. [Google Scholar]
- Berdahl, P.; Akbari, H.; Levinson, R.; Miller, W.A. Weathering of roofing materials—An overview. Constr. Build. Mat. 2008, 22, 423–433. [Google Scholar] [CrossRef] [Green Version]
- Sleiman, M.; Kirchstetter, T.W.; Berdahl, P.; Gilbert, H.E.; Quelen, S.; Marlot, L.; Preble, C.V.; Chen, S.; Montalbano, A.; Rosseler, O.; et al. Soiling of building envelope surfaces and its effect on solar reflectance—Part II: Development of an accelerated aging method for roofing materials. Sol. Energy Mater. Sol. Cells 2014, 122, 271–281. [Google Scholar] [CrossRef]
- ASTM D7897-18—Standard Practice for Laboratory Soiling and Weathering of Roofing Materials to Simulate Effects of Natural Exposure on Solar Reflectance and Thermal Emittance; ASTM International: West Conshohocken, PA, USA, 2018.
- Paolini, R.; Terraneo, G.; Ferrari, C.; Sleiman, M.; Muscio, A.; Metrangolo, P.; Poli, T.; Destaillats, H.; Zinzi, M.; Levinson, R. Effects of soiling and weathering on the albedo of building envelope materials: Lessons learned from natural exposure in two European cities and tuning of a laboratory simulation practice. Sol. Energy Mat. Sol. Cells 2020, 205, 110264. [Google Scholar] [CrossRef] [Green Version]
- Ban-Weiss, G.A.; Woods, J.; Levinson, R. Using remote sensing to quantify albedo of roofs in seven California cities, Part 1: Methods. Sol. Energy 2015, 115, 777–790. [Google Scholar] [CrossRef] [Green Version]
- Heiden, U.; Heldens, W.; Roessner, S.; Segl, K.; Esch, T.; Mueller, A. Urban structure type characterization using hyperspectral remote sensing and height information. Landsc. Urban Plan. 2012, 105, 361–375. [Google Scholar] [CrossRef]
- Despini, F.; Ferrari, C.; Bigi, A.; Libbra, A.; Teggi, S.; Muscio, A.; Ghermandi, G. Correlation between remote sensing data and ground based measurements for solar reflectance retrieving. Energy Build. 2016, 114, 227–233. [Google Scholar] [CrossRef]
- Ban-Weiss, G.A.; Woods, J.; Millstein, D.; Levinson, R. Using remote sensing to quantify albedo of roofs in seven California cities, Part 2: Results and application to climate modeling. Sol. Energy 2015, 115, 791–805. [Google Scholar] [CrossRef] [Green Version]
- Franch, B.; Vermote, E.F.; Claverie, M. Intercomparison of Landsat albedo retrieval techniques and evaluation against in situ measurements across the US SURFRAD network. Remote Sens. Environ. 2014, 152, 627–637. [Google Scholar] [CrossRef]
- Despini, F.; Ferrari, C.; Santunione, G.; Tommasone, S.; Muscio, A.; Teggi, S. Urban surfaces analysis with remote sensing data for the evaluation of UHI mitigation scenarios. Urban Clim. 2021, 35, 100761. [Google Scholar] [CrossRef]
- Modest, M. Radiative Heat Transfer; Academic Press: New York, NY, USA, 2013; p. 76. [Google Scholar]
- Labsphere Inc. Optical-Grade Spectralon Reflectance Material (Spectralon Datasheet); Labsphere Inc.: Sutton, NH, USA, 2019; Available online: https://www.labsphere.com/site/assets/files/1827/pb-13021-000_rev_03_og_spectralon-1.pdf (accessed on 27 August 2021).
- ASTM E903-20, Standard Test Method for Solar Absorptance, Reflectance, and Transmittance of Materials Using Integrating Spheres; ASTM International: West Conshohocken, PA, USA, 2020.
- ASTM E772-15—Standard Terminology of Solar Energy Conversion; ASTM International: West Conshohocken, PA, USA, 2015.
- Lind, M.A.; Pettit, R.B.; Masterson, K.D. The sensitivity of solar transmittance, reflectance and absorptance to selected averaging procedures and solar irradiance distribution. Trans. ASME J. Sol. Energy Eng. 1960, 102, 34–40. [Google Scholar] [CrossRef]
- ASTM E891-87 (Reapproved 1992)—Tables for Terrestrial Direct Normal Solar Spectral Irradiance Tables for Air Mass 1.5 (Withdrawn 1999); ASTM International: West Conshohocken, PA, USA, 1992.
- ASTM G173-03 (Reapproved 2020)—Standard Tables for Reference Solar Spectral Irradiances: Direct Normal and Hemispherical on Tilted Surface; ASTM International: West Conshohocken, PA, USA, 2020.
- Levinson, R.; Akbari, H.; Berdahl, P. Measuring solar reflectance—Part I: Defining a metric that accurately predicts solar heat gain. Sol. Energy 2010, 84, 1717–1744. [Google Scholar] [CrossRef] [Green Version]
- Levinson, R.; Akbari, H.; Berdahl, P. Measuring solar reflectance—Part II: Review of practical methods. Sol. Energy 2010, 84, 1745–1759. [Google Scholar] [CrossRef] [Green Version]
- EN 410:2011—Glass in Building—Determination of Luminous and Solar Characteristics of Glazing; European Committee for Standardization (CEN): Brussels, Belgium, 2011.
- Ferrari, C.; Libbra, A.; Muscio, A.; Cristina Siligardi, C. Influence of the irradiance spectrum on solar reflectance measurements. Adv. Build. Energy Res. 2013, 7, 244–253. [Google Scholar] [CrossRef]
- ASTM C1549-16—Standard Test Method for Determination of Solar Reflectance Near Ambient Temperature Using a Portable Solar Reflectometer; ASTM International: West Conshohocken, PA, USA, 2016.
- NREL—National Renewable Energy Laboratory. SMARTS: Simple Model of the Atmospheric Radiative Transfer of Sunshine. Available online: https://www.nrel.gov/grid/solar-resource/smarts.html (accessed on 1 August 2021).
- Petrie, T.W.; Desjarlais, A.O.; Robertson, R.H.; Parker, D.S. Comparison of techniques for in situ nondamaging measurement of solar reflectances of low-slope roof membranes. Int. J. Thermophys. 2001, 22, 1613–1628. [Google Scholar] [CrossRef]
- Devices & Services, Co. D&S Technical Note 82-1—Solar Spectrum Reflectometer Updates and Design Modifications; Devices & Services Co.: Dallas, TX, USA, 1981; Available online: https://www.devicesandservices.com/TechNotes/TN82-1.pdf (accessed on 1 August 2021).
- Devices & Services, Co. D&S Technical Note 79-16—The Solar Spectrum Reflectometer; Devices & Services Co.: Dallas, TX, USA, 1979; Available online: https://www.devicesandservices.com/TechNotes/TN79-16.pdf (accessed on 1 August 2021).
- Levinson, R.; Chen, S.; Berdahl, P.; Rosado, P.; Medina, L.A. Reflectometer measurement of roofing aggregate albedo. Sol. Energy 2014, 100, 159–171. [Google Scholar] [CrossRef]
- Hooshangi, H.R.; Akbari, H.; Touchaei, A.G. Measuring solar reflectance of variegated flat roofing materials using quasi-Monte Carlo method. Energy Build. 2016, 114, 234–240. [Google Scholar] [CrossRef]
- Devices & Services, Co. D&S Technical Note 08-1—Model SSR-ER—Solar Reflectance Measurements of Irregular Surfaces; Devices & Services Co.: Dallas, TX, USA, 2008; Available online: https://www.devicesandservices.com/TechNotes/TN08-1.pdf (accessed on 1 August 2021).
- Devices & Services, Co. D&S Technical Note 09-2—A Proposed Correction to Reflectance Measurements of Profiled Surfaces; Devices & Services Co.: Dallas, TX, USA, 2009; Available online: https://www.devicesandservices.com/TechNotes/TN09-2.pdf (accessed on 1 August 2021).
- Levinson, R.; Egolf, M.; Chen, S.; Berdahl, P. Experimental comparison of pyranometer, reflectometer, and spectrophotometer methods for the measurement of roofing product albedo. Sol. Energy 2020, 206, 826–847. [Google Scholar] [CrossRef]
- Devices & Services, Co. D&S Technical Note 11-1—SSR-ER Reflectance Measurements for Large Radius Cylindrical Surfaces; Devices & Services Co.: Dallas, TX, USA, 2011; Available online: https://www.devicesandservices.com/TechNotes/TN11-1.pdf (accessed on 1 August 2021).
- Devices & Services, Co. Solar Spectrum Reflectometer Model SSR-ER Version 6—Specifications Sheet; Devices & Services Co.: Dallas, TX, USA, 2021; Available online: https://www.devicesandservices.com/SSR%20Version%206%20Spec%20Sheet.pdf (accessed on 1 August 2021).
- Devices & Services, Co. D&S Technical Note 09-1—Solar Spectrum Reflectometer Version 6.0; Devices & Services Co.: Dallas, TX, USA, 2009; Available online: https://www.devicesandservices.com/TechNotes/TN09-1.pdf (accessed on 1 August 2021).
- ASTM E1918-16—Standard Test Method for Measuring Solar Reflectance of Horizontal and Low-Sloped Surfaces in the Field; ASTM International: West Conshohocken, PA, USA, 2016.
- Akbari, H.; Levinson, L.; Stern, S. Procedure for measuring the solar reflectance of flat or curved roofing assemblies. Sol. Energy 2008, 82, 648–655. [Google Scholar] [CrossRef] [Green Version]
- Qin, Y.; He, H. A new simplified method for measuring the albedo of limited extent targets. Sol. Energy 2017, 157, 1047–1055. [Google Scholar] [CrossRef]
- Akbari, H.; Touchaei, A.G. Modeling and labeling heterogeneous directional reflective roofing materials. Sol. Energy Mat. Sol. Cells 2014, 124, 192–210. [Google Scholar] [CrossRef]
- Yuan, J.; Emura, K.; Farnham, C. A method to measure retro-reflectance and durability of retro-reflective materials for building outer walls. J. Build. Phys. 2015, 38, 500–516. [Google Scholar] [CrossRef]
- Yuan, J.; Farnham, C.; Emura, K. A study on the accuracy of determining the retroreflectance of retro-reflective material by heat balance. Sol. Energy 2015, 122, 419–428. [Google Scholar] [CrossRef]
- Yuan, J.; Emura, K.; Farnham, C.; Sakai, H. Application of glass beads as retro-reflective facades for urban heat island mitigation: Experimental investigation and simulation analysis. Build. Environ. 2016, 105, 140–152. [Google Scholar] [CrossRef]
- Yuan, J.; Emura, K.; Sakai, H.; Farnham, C.; Lu, S. Optical analysis of glass bead retroreflective materials for urban heat island mitigation. Sol. Energy 2016, 132, 203–213. [Google Scholar] [CrossRef]
- Harima, T.; Nagahama, T. Evaluation methods for retroreflectors and quantitative analysis of near-infrared upward reflective solar control window film—Part I: Theory. Sol. Energy 2017, 148, 177–192. [Google Scholar] [CrossRef]
- Harima, T.; Nagahama, T. Evaluation methods for retroreflectors and quantitative analysis of near-infrared upward reflective solar control window film—Part II: Optical properties evaluation and verification results. Sol. Energy 2017, 148, 164–176. [Google Scholar] [CrossRef]
- Rossi, F.; Pisello, A.L.; Nicolini, A.; Filipponi, M.; Palombo, M. Analysis of retro-reflective surfaces for urban heat island mitigation: A new analytical model. Appl. Energy 2014, 114, 621–631. [Google Scholar] [CrossRef]
- Rossi, F.; Castellani, B.; Presciutti, A.; Morini, E.; Filipponi, M.; Nicolini, A.; Santamouris, M. Retroreflective façades for urban heat island mitigation: Experimental investigation and energy evaluations. Appl. Energy 2015, 145, 8–20. [Google Scholar] [CrossRef]
- Morini, E.; Castellani, B.; Presciutti, A.; Filipponi, M.; Nicolini, A.; Rossi, F. Optic-energy performance improvement of exterior paints for buildings. Energy Build. 2017, 139, 690–701. [Google Scholar] [CrossRef]
- Levinson, R.; Chen, S.; Ferrari, C.; Berdahl, P.; Slack, J. Methods and instrumentation to measure the effective solar reflectance of fluorescent cool surfaces. Energy Build. 2017, 152, 752–765. [Google Scholar] [CrossRef] [Green Version]
- ASTM C1371-15—Standard Test Method for Determination of Emittance of Materials Near Room Temperature Using Portable Emissometers; ASTM International: West Conshohocken, PA, USA, 2015.
- Devices & Services, Co. , D&S Technical Note 10-2—Slide Method for High Emittance Materials with Low Thermal Conductivity; Devices & Services Co.: Dallas, TX, USA, 2010; Available online: https://www.devicesandservices.com/TechNotes/TN10-2.pdf (accessed on 1 August 2021).
- EN 15976:2011—Flexible Sheets for Waterproofing—Determination of Emissivity, 2011; European Committee for Standardization (CEN): Brussels, Belgium, 2011.
- Voogt, J.; Oke, T. Thermal remote sensing of urban climates. Remote Sens. Environ. 2003, 86, 370–384. [Google Scholar] [CrossRef]
- Brivio, P.A.; Lechi, G.; Zilioli, E. Principi e Metodi di Telerilevamento, 1st ed.; Cittàstudi Edizioni: Torino, Italy, 2006. [Google Scholar]
- Baldinelli, G.; Bonafoni, S.; Anniballe, R.; Presciutti, A.; Gioli, B.; Magliulo, V. Spaceborne detection of roof and impervious surface albedo: Potentialities and comparison with airborne thermography measurements. Sol. Energy 2015, 113, 281–294. [Google Scholar] [CrossRef]
- Sliuzas, R.; Kuffer, M.; Masser, I. The spatial and temporal nature of urban objects. In Remote Sensing and Digital Image Processing; Rashed, T., Jurgens, C., Eds.; Springer: Dordrecht, The Netherlands, 2010; pp. 67–84. [Google Scholar]
- Welch, R. Spatial resolution requirements for urban studies. Int. J. Remote Sens. 1982, 3, 139–146. [Google Scholar] [CrossRef]
- Jensen, J.; Cowen, D. Remote sensing of urban suburban infrastructure and socio-economic attributes. Photogramm. Eng. Remote Sens. 1999, 65, 611–622. [Google Scholar]
- Herold, M.; Gardner, M.E.; Roberts, D.A. Spectral resolution requirements for mapping urban areas. IEEE Trans. Geosci. Remote Sens. 2003, 41, 1907–1919. [Google Scholar] [CrossRef] [Green Version]
- Herold, M.; Roberts, D.A.; Gardner, M.E.; Dennison, P.E. Spectrometry for urban area remote sensing—Development and analysis of a spectral library from 350 to 2400 nm. Remote Sens. Environ. 2004, 91, 304–319. [Google Scholar] [CrossRef]
- Brest, C.L.; Goward, S.N. Deriving surface albedo measurements from narrow band satellite data. Int. J. Remote Sens. 1987, 8, 351–367. [Google Scholar] [CrossRef]
- Liang, S. Narrowband to broadband conversions of land surface albedo I: Algorithms. Remote Sens. Environ. 2001, 76, 213–238. [Google Scholar] [CrossRef]
- Silva, B.B.D.; Braga, A.C.; Braga, C.C.; de Oliveira, L.M.; Montenegro, S.M.; Barbosa, B. Procedures for calculation of the albedo with OLI-Landsat 8 images: Application to the Brazilian semi-arid. Rev. Bras. De Eng. Agríc. Ambient. 2016, 20, 3–8. [Google Scholar] [CrossRef] [Green Version]
- Liang, S.; Shuey, C.J.; Russ, A.L.; Fang, H.; Chen, M.; Walthall, C.L.; Daughtry, C.S.T.; Hunt, R., Jr. Narrowband to broadband conversions of land surface albedo: II. Validation. Remote Sens. Environ. 2003, 84, 25–41. [Google Scholar] [CrossRef]
- Menenti, M.; Bastiaanssen, W.G.M.; van Eick, D. Determination of Surface Hemispherical Reflectance with Thematic Mapper Data. Remote Sens. 1989, 28, 327–337. [Google Scholar] [CrossRef]
- Akdim, N.; Alfieri, S.M.; Habib, A.; Choukri, A.; Cheruiyot, E.; Labbassi, K.; Menenti, M. Monitoring of irrigation schemes by remote sensing: Phenology versus retrieval of biophysical variables. Remote Sens. 2014, 6, 5815–5851. [Google Scholar] [CrossRef] [Green Version]
- Kaplan, S.; Galletti, C.S.; Chow, W.T.L.; Myint, S.W. First order approximation of Broadband Directional Albedo with High Resolution Quickbird Imagery: A case study for arid urban areas. GIScience Remote Sens. 2016, 53, 303–319. [Google Scholar] [CrossRef]
- Kuester, M. Radiometric Use of WorldView-3 Imagery; Tech. Note; DigitalGlobe: Longmont, CO, USA, 2016; p. 12. [Google Scholar]
- Mogili, U.R.; Deepak, B.B.V.L. Review on application of drone systems in precision agriculture. Procedia Comput. Sci. 2018, 133, 502–509. [Google Scholar] [CrossRef]
- Fawcett, D.; Panigada, C.; Tagliabue, G.; Boschetti, M.; Celesti, M.; Evdokimov, A.; Biriukova, K.; Colombo, R.; Miglietta, F.; Rascher, U.; et al. Multi-Scale Evaluation of Drone-Based Multispectral Surface Reflectance and Vegetation Indices in Operational Conditions. Remote Sens. 2020, 12, 514. [Google Scholar] [CrossRef] [Green Version]
- Park, H.G.; Yun, J.P.; Kim, M.Y.; Jeong, S.H. Multichannel Object Detection for Detecting Suspected Trees with Pine Wilt Disease Using Multispectral Drone Imagery. IEEE J. Sel. Top. Appl. Earth Obs. Remote Sens. 2021, 14, 8350–8358. [Google Scholar] [CrossRef]
- Viljanen, N.; Honkavaara, E.; Näsi, R.; Hakala, T.; Niemeläinen, O.; Kaivosoja, J. A novel machine learning method for estimating biomass of grass swards using a photogrammetric canopy height model, images and vegetation indices captured by a drone. Agriculture 2018, 8, 70. [Google Scholar] [CrossRef] [Green Version]
- Chabot, D.; Dillon, C.; Shemrock, A.; Weissflog, N.; Sager, E.P. An object-based image analysis workflow for monitoring shallow-water aquatic vegetation in multispectral drone imagery. ISPRS Int. J. Geo-Inf. 2018, 7, 294. [Google Scholar] [CrossRef] [Green Version]
- Tóth, V.Z.; Grósz, J.; Ladányi, M.; Jung, A. A new lake algae detection method supported by a drone-based multispectral camera. Lakes Reserv. Res. Manag. 2021, 26, e12377. [Google Scholar] [CrossRef]


| Solar Spectrum | Source of Data | UV/is/NIR Energy Content (%) |
|---|---|---|
| Air mass 1 global horizontal irradiance, clear sky | EN 410:2011 [42] | 6.5/45.0/48.5 |
| Air mass 1 global horizontal irradiance (AM1GH), clear sky | NREL SMARTS 2.9.5 [45] | 6.5/45.0/48.5 |
| Air mass 1.5 global irradiance on a 37° tilt south facing surface, clear sky | ASTM G173-03(2020) [39] | 4.5/43.5/52.0 |
| Air mass 1.5 direct normal+circumsolar irradiance, clear sky | ASTM G173-03(2020) [39] | 3.3/42.2/54.5 |
| Air mass 1.5 beam normal irradiance, hazy sky | ASTM E897-87(1992) [38] | 2.8/39.2/58.0 |
| Sensor | Revisit Period | Swath Width (km) | Band Name | Spectral Range (nm) | Spatial Resolution (m) |
|---|---|---|---|---|---|
| IKONOS-2 | 3 days | 11.3 | Pan | 445–900 | 1 |
| Blue | 445–516 | ||||
| Green | 505–595 | 3.2 | |||
| Red | 632–698 | ||||
| Near-IR | 757–853 | ||||
| QuickBird | 3–4 days | 14.9–16.8 | Pan | 445–900 | 0.61 |
| Blue | 430–545 | 2.44 | |||
| Green | 466–620 | ||||
| Red | 590–710 | ||||
| Near-IR | 715–918 | ||||
| Geoeye-1 | 2–3 days | 15 | Pan | 450–900 | 0.41 |
| Blue | 450–520 | 1.65 | |||
| Green | 520–600 | ||||
| Red | 620–690 | ||||
| Near-IR | 760–900 | ||||
| World-View3 | <1 day | 13.1 | Pan | 450–800 | 0.3 |
| Coastal | 400–450 | 1.24 | |||
| Blue | 450–510 | ||||
| Green | 510–580 | ||||
| Yellow | 585–625 | ||||
| Red | 630–690 | ||||
| Red Edge | 705–745 | ||||
| Near-IR1 | 770–895 | ||||
| Near-IR2 | 860–1040 | ||||
| 8 SWIR bands | 1195–2365 | 7.5 |
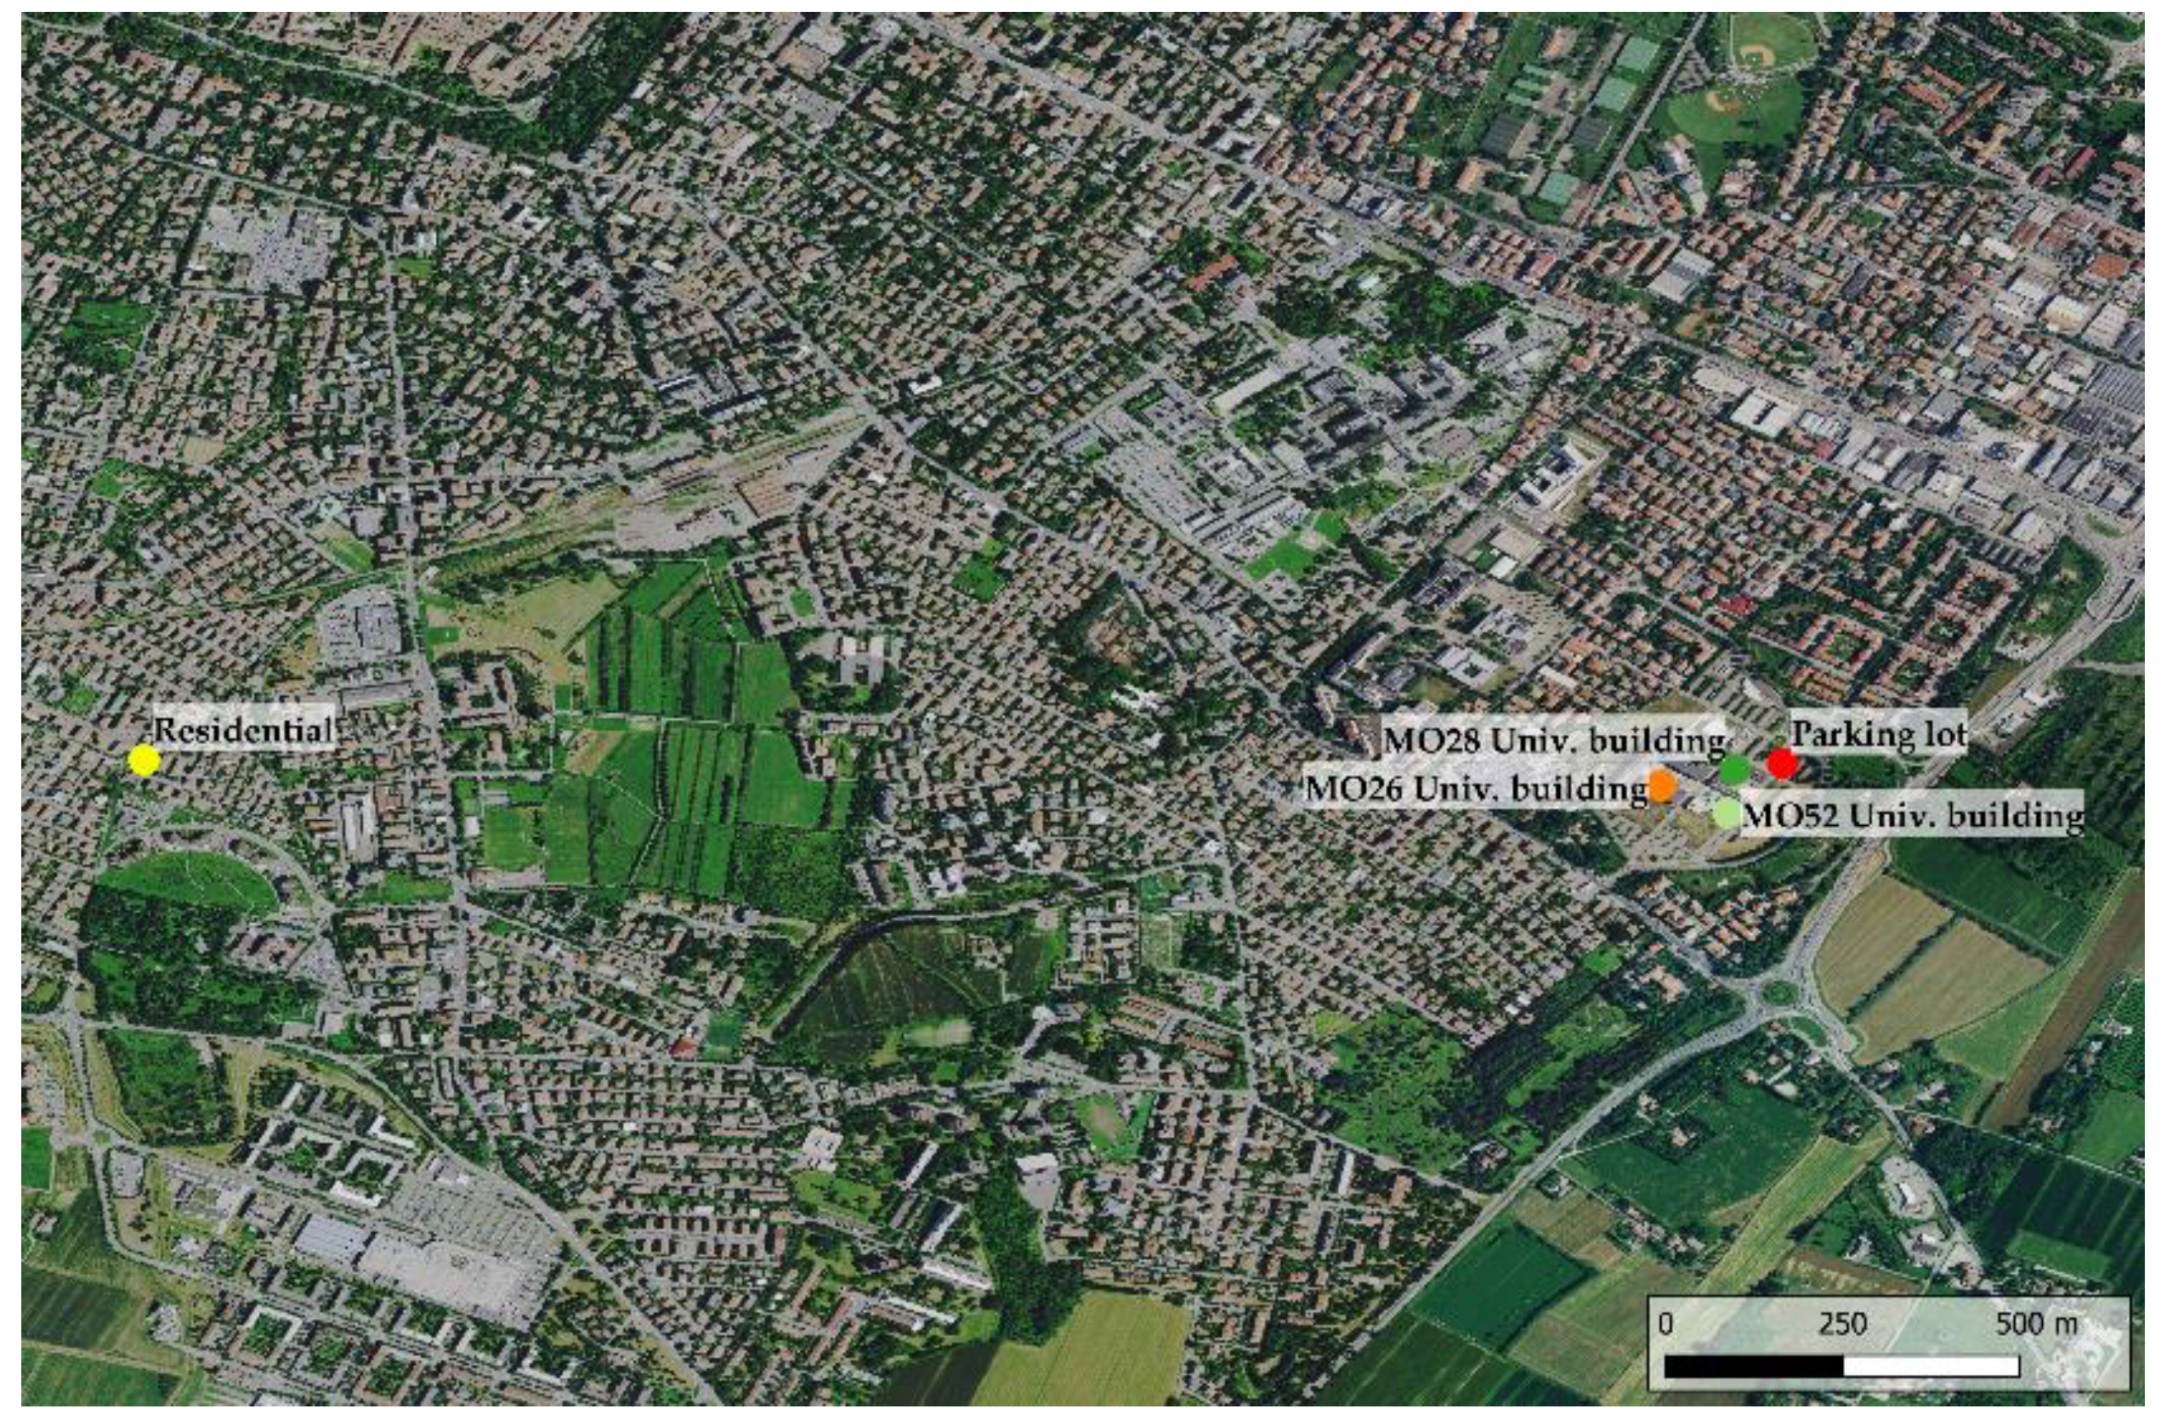
| Label | Type of Roof | Color Code on the Map |
|---|---|---|
| MO26 Univ. building | Bitumen | Orange |
| MO28 Univ. building | Factory-applied coating | Dark green |
| MO52 Univ. building | Factory-applied coating | Light green |
| Parking lot | Asphalt | Red |
| Residential | Clay roof tile | Yellow |
| Sensor | Center Wavelength (nm) | Effective Bandwidth (µm) | GAIN | OFFSET | Abscalfactor (µm) |
|---|---|---|---|---|---|
| Panchromatic | 649.4 | 0.2896 | 0.923 | −1.700 | 0.039426 |
| Coastal Blue | 427.4 | 0.0405 | 0.863 | −7.154 | 0.014329 |
| Blue | 481.9 | 0.0540 | 0.905 | −4.189 | 0.011608 |
| Green | 547.1 | 0.0618 | 0.907 | −3.287 | 0.008857 |
| Yellow | 604.3 | 0.0381 | 0.938 | −1.816 | 0.006843 |
| Red | 660.1 | 0.0585 | 0.945 | −1.350 | 0.010200 |
| Red edge | 722.7 | 0.0387 | 0.980 | −2.617 | 0.006220 |
| Near-IR1 | 824.0 | 0.1004 | 0.982 | −3.752 | 0.011797 |
| Near-IR2 | 913.6 | 0.0889 | 0.954 | −1.507 | 0.010638 |
| Sensor | Reference Irradiance | Sensor Wavebands (nm) | Weight Coefficients | |||
|---|---|---|---|---|---|---|
| (W/(m2μm)) | from | to | Thuilier [89] | AM1GH [45] | E891BN [38] | |
| Coastal Blue | 1757.89 | 400 | 450 | 0.145 | 0.095 | 0.067 |
| Blue | 2004.61 | 450 | 510 | 0.166 | 0.157 | 0.128 |
| Green | 1830.18 | 510 | 580 | 0.151 | 0.166 | 0.156 |
| Yellow | 1712.07 | 585 | 625 | 0.141 | 0.100 | 0.101 |
| Red | 1535.33 | 630 | 690 | 0.127 | 0.136 | 0.143 |
| Red edge | 1348.08 | 705 | 745 | 0.111 | 0.103 | 0.116 |
| Near-IR1 | 1055.94 | 770 | 895 | 0.087 | 0.162 | 0.193 |
| Near-IR2 | 858.77 | 860 | 1040 | 0.071 | 0.081 | 0.096 |
| Ground Measurements | Satellite Measurements | ||||
|---|---|---|---|---|---|
| AM1GH | E891BN | Thuilier [89] | AM1GH | E891BN | |
| MO52 (light) | 0.527 | 0.551 | 0.513 | 0.523 | 0.532 |
| MO52 (dark) | 0.247 | 0.267 | 0.273 | 0.286 | 0.296 |
| MO26 | 0.104 | 0.101 | 0.128 | 0.131 | 0.133 |
| MO28 (light) | 0.545 | 0.569 | 0.515 | 0.523 | 0.530 |
| MO28 (dark) | 0.279 | 0.311 | 0.333 | 0.341 | 0.348 |
| Parking lot | 0.187 | 0.198 | 0.188 | 0.195 | 0.200 |
| Clay tile roof | 0.266 | 0.305 | 0.224 | 0.240 | 0.253 |
Publisher’s Note: MDPI stays neutral with regard to jurisdictional claims in published maps and institutional affiliations. |
© 2021 by the authors. Licensee MDPI, Basel, Switzerland. This article is an open access article distributed under the terms and conditions of the Creative Commons Attribution (CC BY) license (https://creativecommons.org/licenses/by/4.0/).
Share and Cite
Costanzini, S.; Ferrari, C.; Despini, F.; Muscio, A. Standard Test Methods for Rating of Solar Reflectance of Built-Up Surfaces and Potential Use of Satellite Remote Sensors. Energies 2021, 14, 6626. https://doi.org/10.3390/en14206626
Costanzini S, Ferrari C, Despini F, Muscio A. Standard Test Methods for Rating of Solar Reflectance of Built-Up Surfaces and Potential Use of Satellite Remote Sensors. Energies. 2021; 14(20):6626. https://doi.org/10.3390/en14206626
Chicago/Turabian StyleCostanzini, Sofia, Chiara Ferrari, Francesca Despini, and Alberto Muscio. 2021. "Standard Test Methods for Rating of Solar Reflectance of Built-Up Surfaces and Potential Use of Satellite Remote Sensors" Energies 14, no. 20: 6626. https://doi.org/10.3390/en14206626
APA StyleCostanzini, S., Ferrari, C., Despini, F., & Muscio, A. (2021). Standard Test Methods for Rating of Solar Reflectance of Built-Up Surfaces and Potential Use of Satellite Remote Sensors. Energies, 14(20), 6626. https://doi.org/10.3390/en14206626