Article

Use of CO2 to Cure Steel Slag and Gypsum-Based Material

1
School of Civil and Resource Engineering, University of Science and Technology Beijing, Beijing 100083, China
2
Key Laboratory of Resource-Oriented Treatment of Industrial Pollutants, Beijing 100083, China
*
Author to whom correspondence should be addressed.
Energies 2021, 14(16), 5174; https://doi.org/10.3390/en14165174
Submission received: 9 July 2021 / Revised: 11 August 2021 / Accepted: 19 August 2021 / Published: 21 August 2021
(This article belongs to the Special Issue Advances in CO2 Mitigation in Energy and the Environment)

Abstract

:
To improve the utilization of steel slag (SS) in CO2 capture and making building materials, the paper mainly discussed the effects of desulphurization gypsum (DG) and w/s ratio on strength development and CO2 capture capability of high Al content SS. It showed that 10 wt% DG enhanced the strength of hydration-curing SS by 262% at 28 days. Similarly, adding 6 wt% DG in carbonation-curing SS contributed to increases in strength and CO2 uptake by 283% and 33.54%, reaching 42.68 MPa and 19.12%, respectively. Strength decreases and CO2 uptake increases with w/s. Microanalysis (QXRD, SEM-EDS, TG-DTG, FTIR, XPS, and MIP) revealed that the main hydration products of SS were C-S-H gel and C4AH13, which transformed to ettringite with DG addition. The carbonation products were mainly calcite and aragonite. Additionally, the amount of aragonite, mechanically weaker than calcite, decreased and calcite increased significantly when DG was added in carbonation-curing samples, providing a denser structure and higher strength than those without DG. Furthermore, high Al 2p binding energies revealed the formation of monocarboaluminate in the DG-added carbonation samples, corresponding to higher CO2 uptake. This study provides guidance for the preparation of SS-DG carbide building materials.

1. Introduction

Owing to climate change and its effects on humans and their environment, there is an urgent need to reduce greenhouse gas emissions [1,2,3,4]. Mineral carbonation describes the reaction of Ca and Mg-silicate minerals with atmospheric CO2, which leads to the precipitation of carbonates. Mineral carbonation is thought to be a permanent form of CO2 capture due to the high stability of formed carbonates [4]. However, natural Ca and Mg-silicate minerals tend to have low carbon reactivity so that requires high temperature and high CO2 pressure, which consumes relatively large amounts of energy and releases relatively large amounts of CO2 into the atmosphere [4]. Therefore, it is extremely important to find energy saving and environmentally friendly methods to absorb CO2.
In recent years, the carbon curing treatment on alkaline industrial wastes has been developed greatly for building materials making and CO2 capture. In the studies, CO2 concentration and pressure, temperature, relative humidity, reaction duration, w/s (water/solid mass ratio), additive, and particle size of carbon capture feedstock are influencing factors [5]. Due to the high reactivity of solid wastes and for energy saving purposes, room temperature is mostly used in the studies. Recycled concrete aggregates [6], blast furnace slag [7], fly ash [8], and steel slag [9] are several main CO2 capture feedstocks. Most of the research revealed that carbon curing helped enhance the mechanical properties of the samples and their resistance to the environment [10].
Steel slag (SS), produced during the steel manufacturing process, is considered an ideal feedstock for CO2 sequestration owing to its high carbon reactivity, high CaO content (30–60%), and high output (more than 100 million tons per year in China) [10,11,12,13,14,15,16]. However, the current utilization rate of SS in China is only 29.5% [3,17], and its stockpiled amount reached 1.8 billion tons at the end of 2018 in China. Based on previous studies on the carbonation of SS, dicalcium silicates (C2S) and tricalcium silicates (C3S) are the most important components to undergo the reaction in SS. The C2S and C3S can react with H2O to form calcium–silicate–hydrate (C-S-H gel) (Figure 1). Therefore, SS is sometimes used as a cementitious material [4]. However, SS has a lower hydration reactivity than the cement due to its larger particle size and more stable crystal structure resulting from its slow cooling rate during the production process. In addition, the presence of free lime (f-CaO) and magnesium oxide (f-MgO) in SS may result in volume instability [17,18]. Many studies have shown that hydration–carbonation-cured SS samples have greater compressive strength performance and CO2 capture capabilities than do purely hydration-cured SS samples [5,19,20,21]. CaCO3 tends to precipitate from the carbonation of C-S-H gel and portlandite (Figure 1), and the carbonation of free oxides improves volume stability [13,14]. Therefore, using metallurgical industrial flue gas to cure SS and produce building materials (Figure 1) is an excellent way to consume SS, absorb CO2, and reduce cement production.
For SS with a high aluminum content (5–10%), the reactions of calcium–aluminum minerals such as tricalcium aluminate (C3A) and mayenite (C12A7) are worth studying. However, little attention has been paid to these minerals. It has been found that gypsum is an effective activator for calcium–aluminum in SS. Our previous study has shown positive effects of DG in the carbonation of press-shaped SS [10]. It was found that gypsum slightly promoted carbon absorption and increased the strength of SS via the formation of ettringite in hydration reactions and consequent calcite and monocarboaluminate formation in carbonation reactions. In addition, it was noted that the promotion effect was limited by generally low relative humidity in the chamber and low water addition to the samples. Therefore, it is worth studying the role of DG in hydration–carbonation-cured SS with a high w/s ratio.
SS has a relatively complex mineral composition, making it difficult to analyze the reaction mechanisms. Monocarboaluminate (C3A·CaCO3·11H2O), a possible hydration or carbonation product in SS, is hard to distinguish using certain traditional methods such as XRD and TG due to the peak overlap with other minerals. Dubina et al. [22] successfully used Al 2p binding energy and Ca/C X-ray photoelectron spectroscopy (XPS) results to verify the existence of monocarboaluminate after carbonation of hydrated cubic C3A. XPS is a powerful method for providing reliable information on reaction mechanisms. However, to the best of our knowledge, very few reports are available on the XPS characteristics of SS carbonation.
In this study, the strength, CO2 uptake, and carbonation depth of hydrated and carbonated SS with and without the addition of DG were studied. In addition, microanalysis methods such as quantitative X-ray diffraction (QXRD), scanning electron microscopy–energy dispersive spectrometry (SEM–EDS), thermogravimetry (TG-DTG), Fourier transform infrared spectroscopy (FTIR), mercury intrusion porosimetry (MIP), and X-ray photoelectron spectroscopy (XPS) were used to determine the chemical and microstructural characteristics of the samples.

2. Materials and Methods
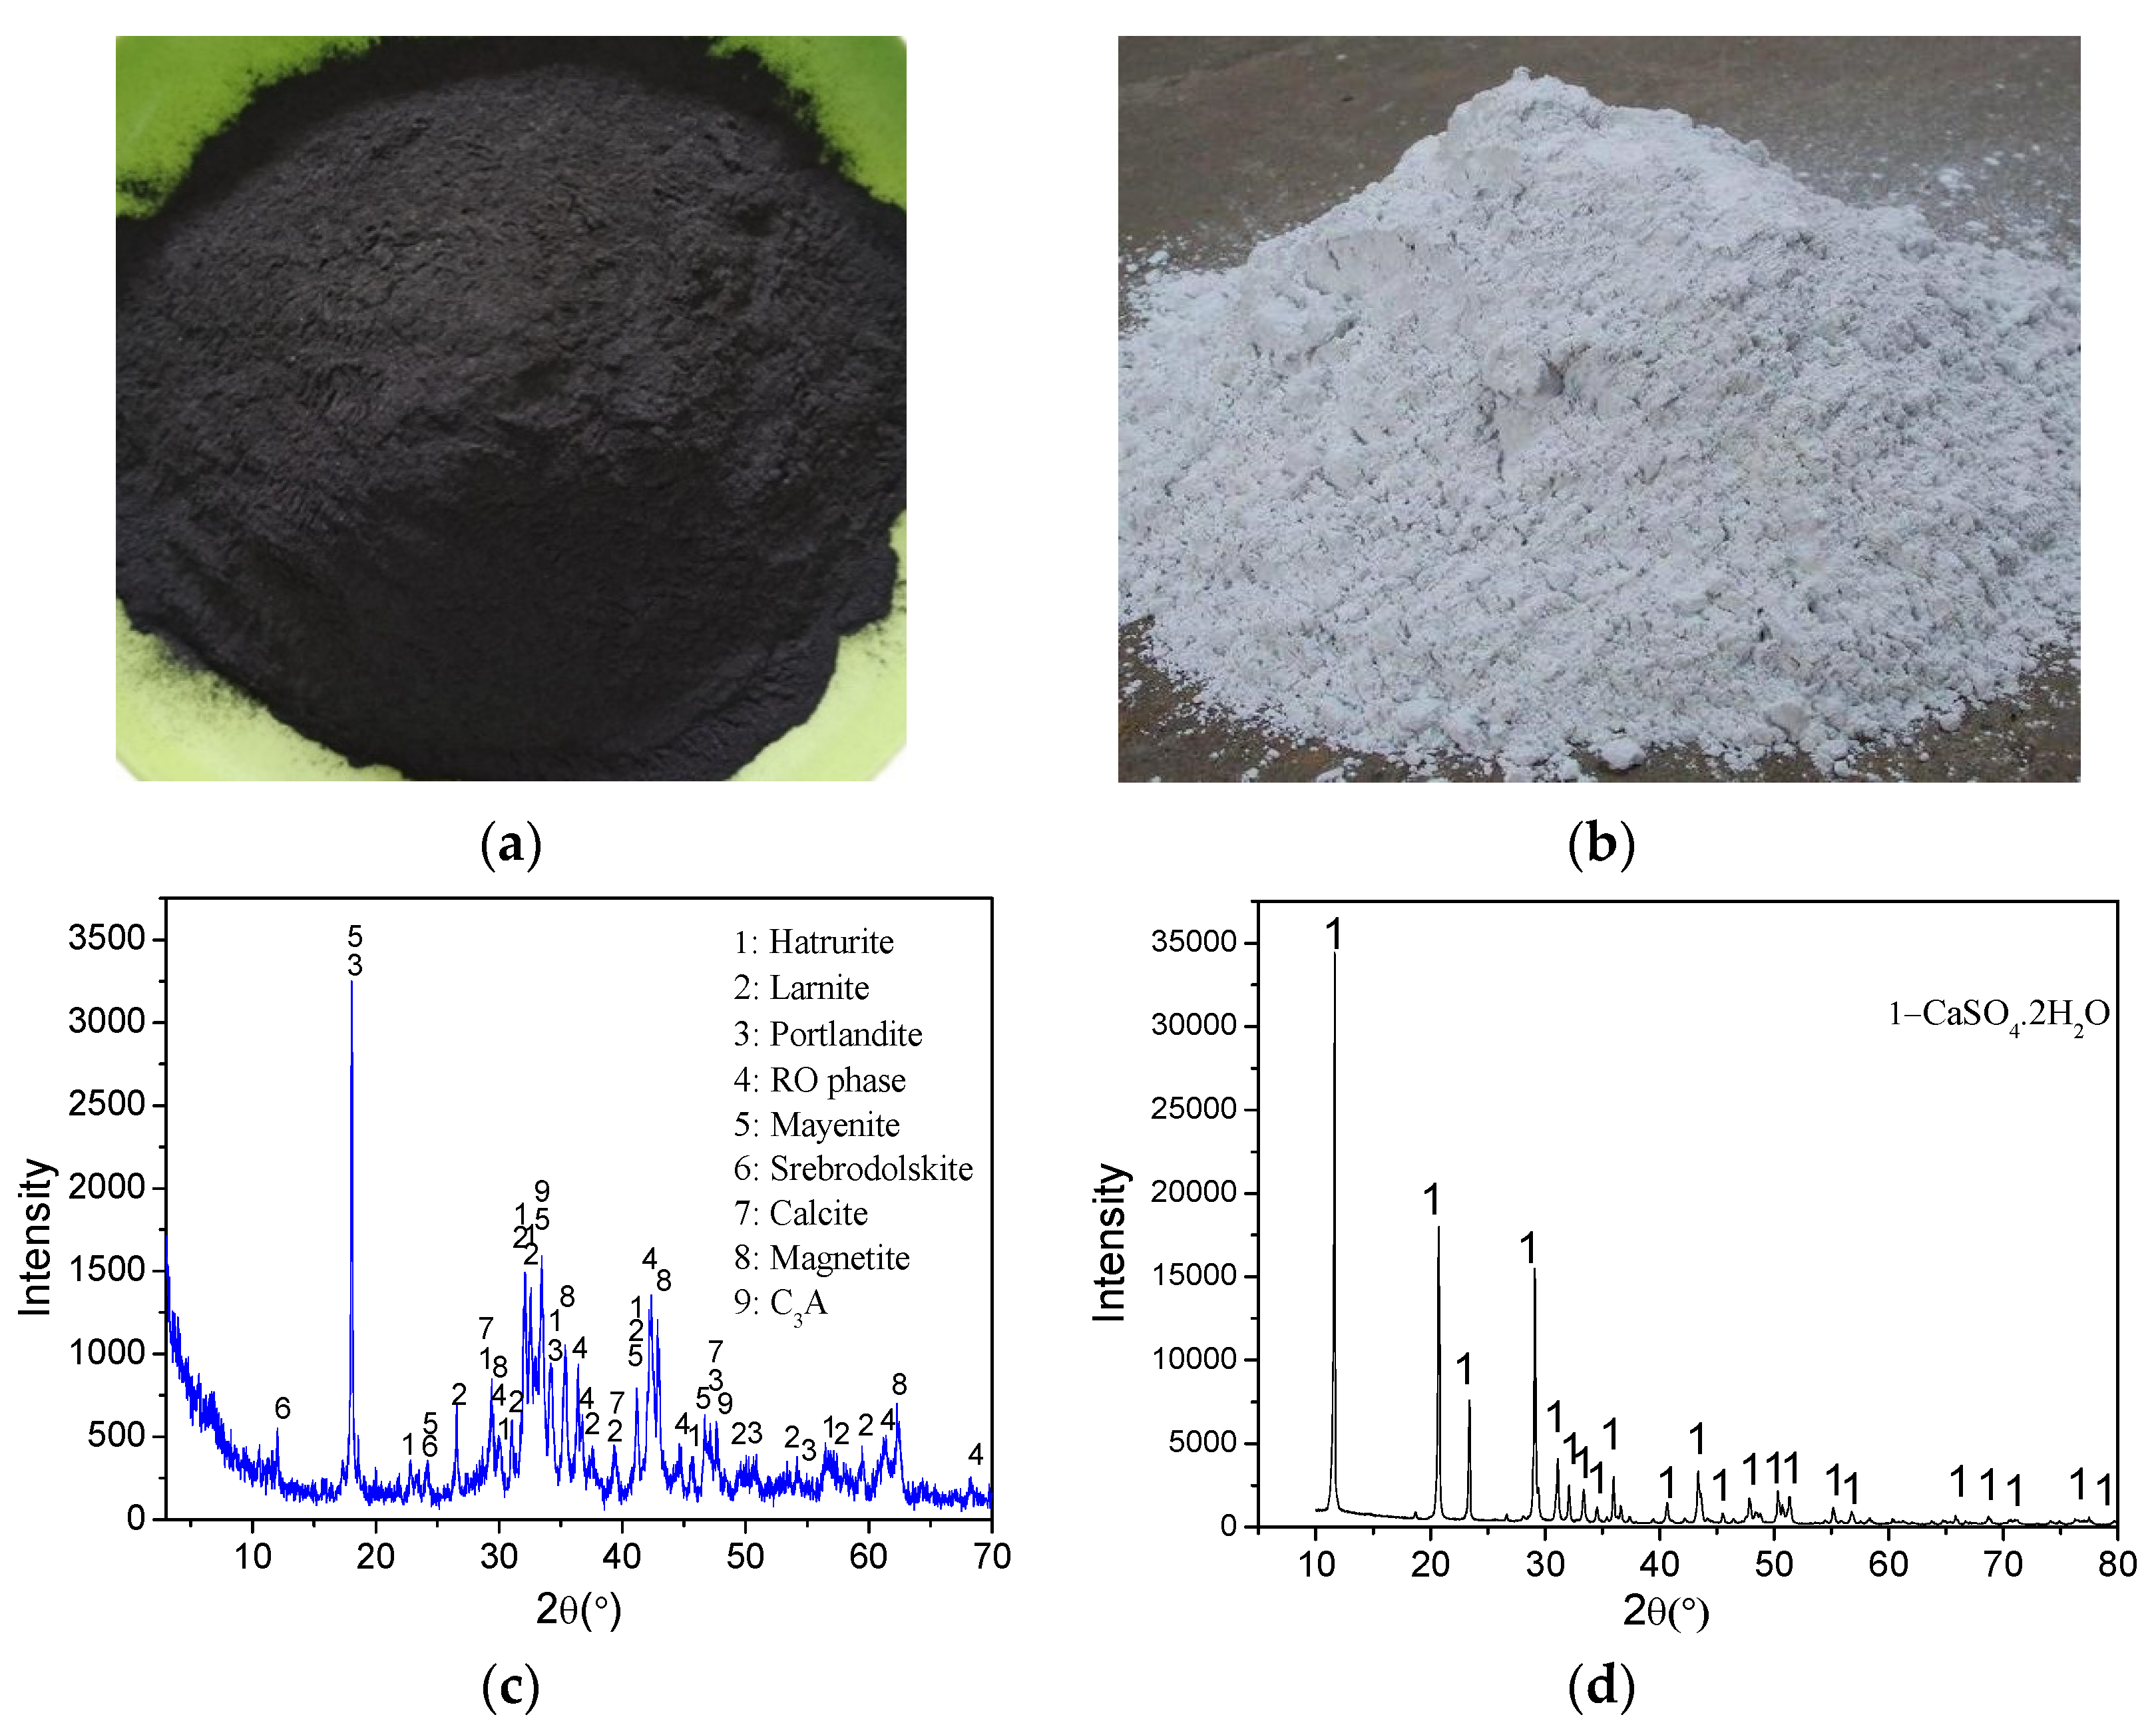
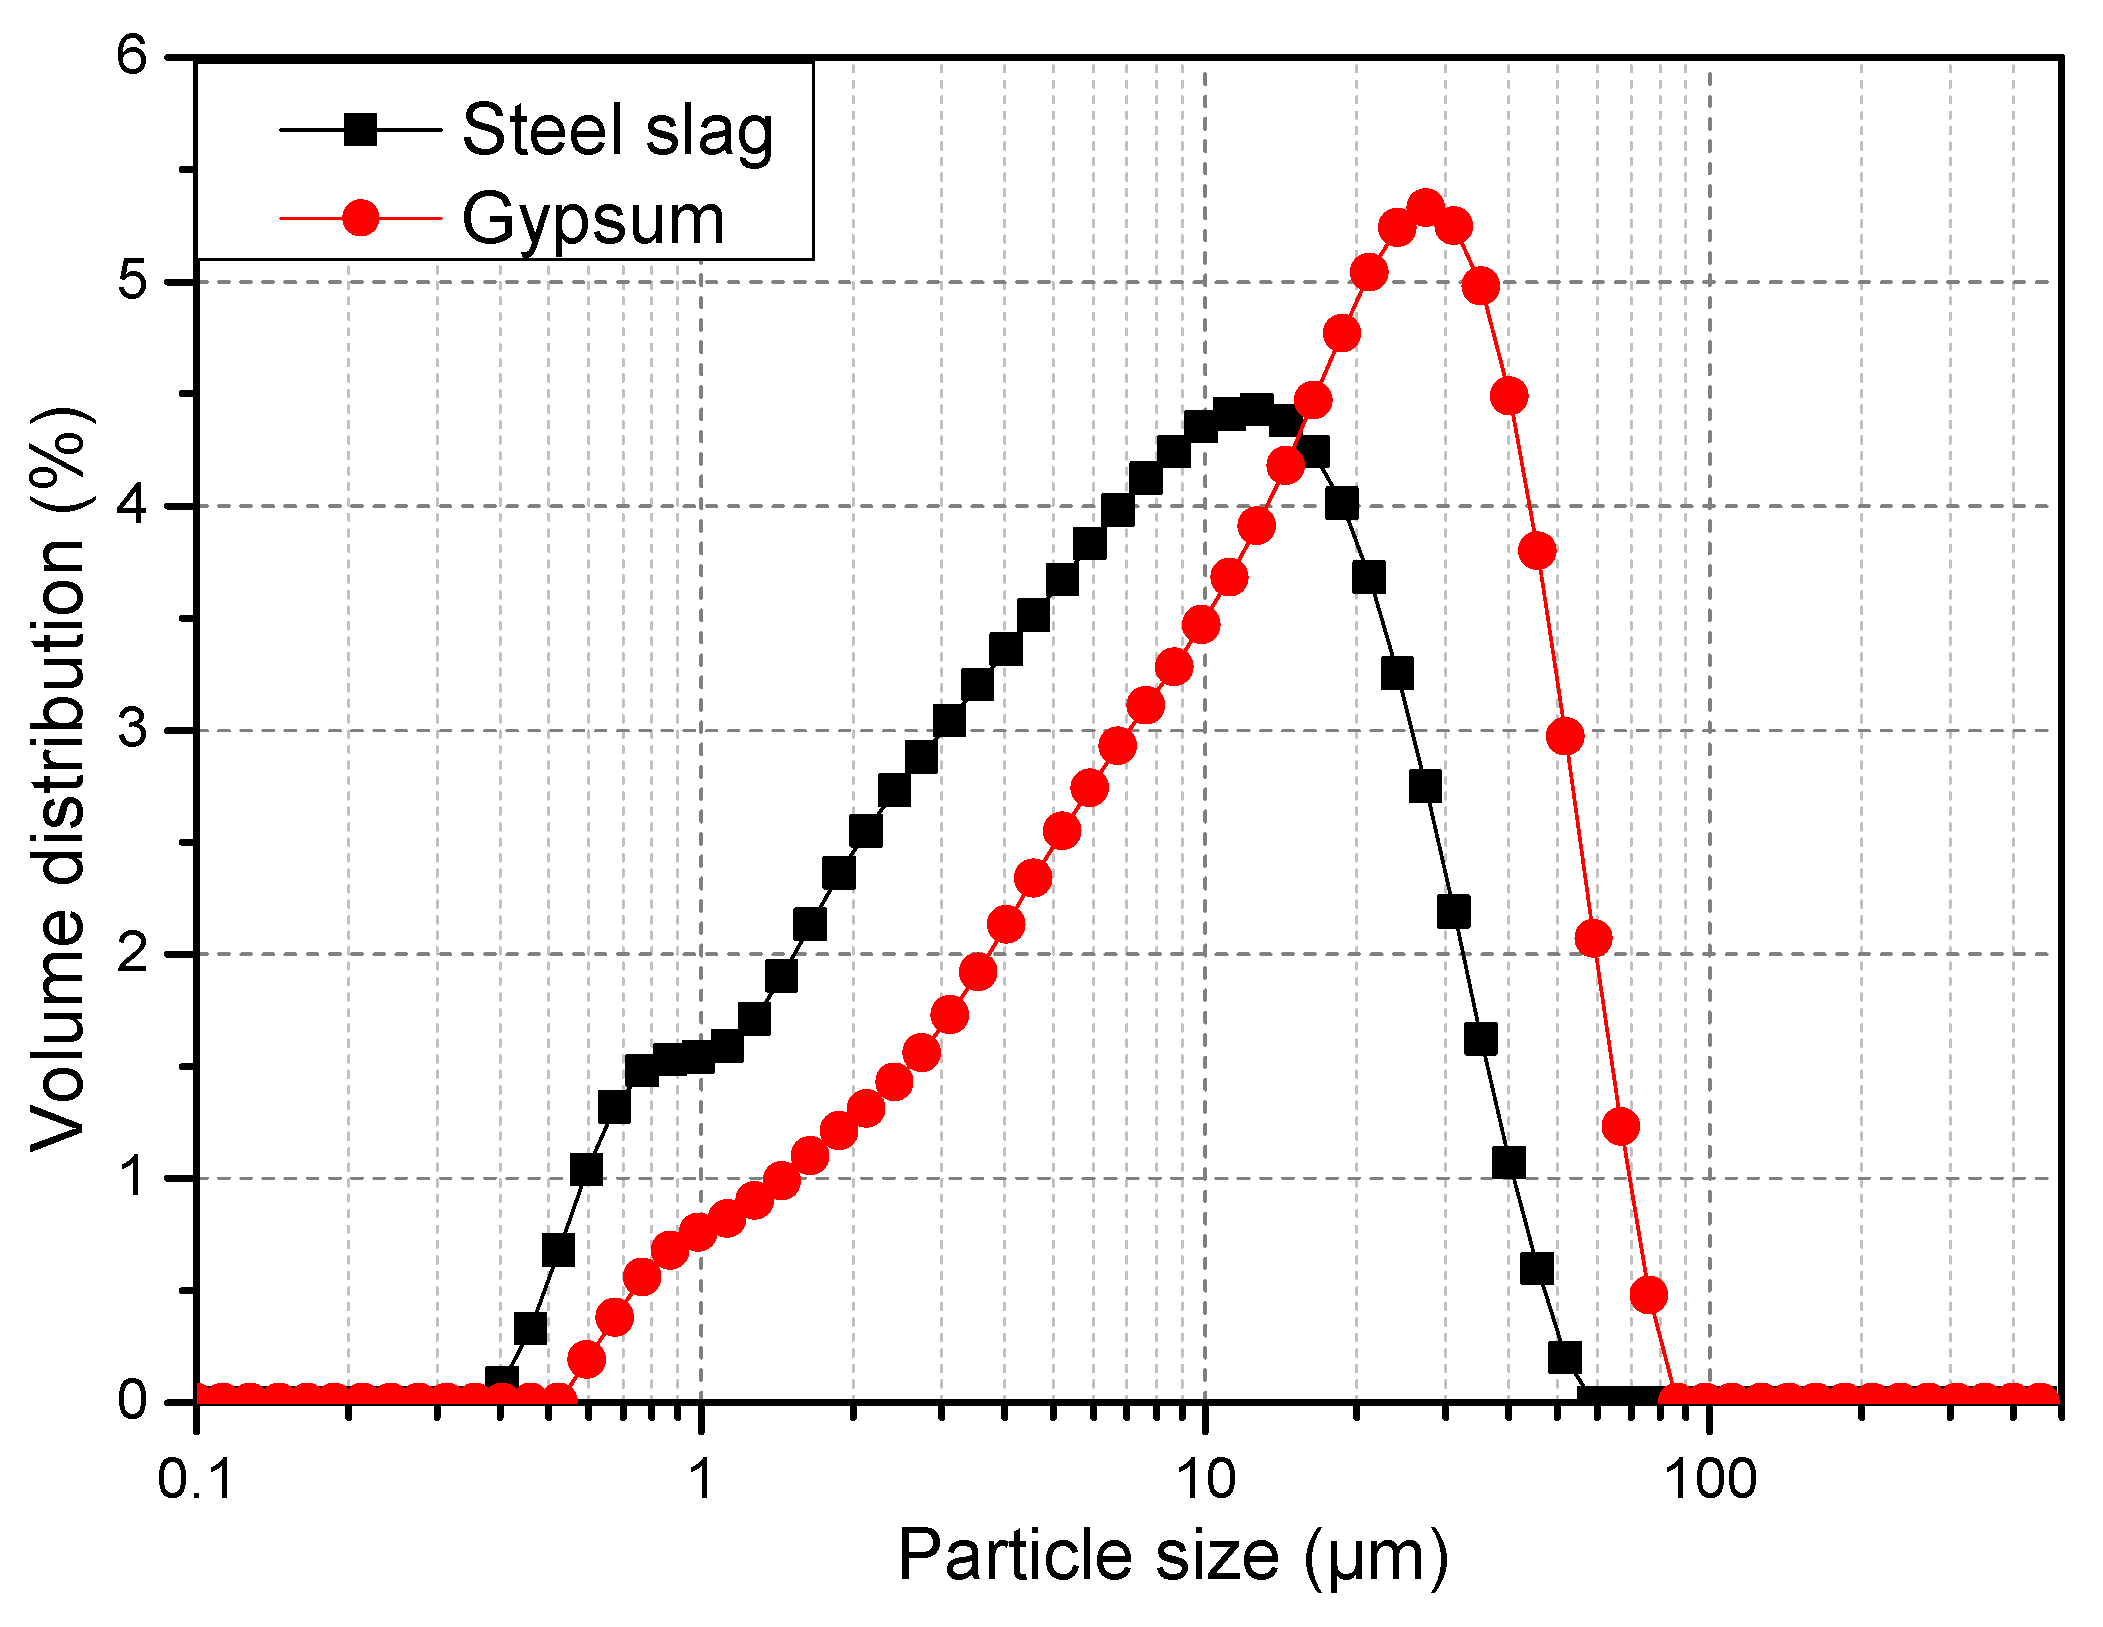
2.1. Materials

The SS used in this study, with a specific surface area of 460 m2/kg, was obtained from Anshan Iron and Steel Co. Ltd., Anshan, China. DG was provided by Jintaicheng Environmental Resources Co., Ltd. (Baoding, China). X-ray fluorescence and carbon/sulfur analyses were used to determine the chemical compositions of the SS and DG. The Mineral compositions of the samples and raw materials were characterized using a Rigaku UltimaIV X-ray diffractometer with CuKα radiation (40 kV, 40 mA). Data were collected from 3 to 70° (2θ) in the step-scanning mode (FT1.5s) with a step size of 0.02°. Furthermore, the Rietveld refinement was conducted using TOPAS software (ver. 5.0, Bruker AXS GmbH) for quantitative X-ray diffraction (QXRD) analysis on the SS. It should be noted that the QXRD results are related barely to the crystalline components of the sample. Table 1 shows the chemical and mineral compositions of the SS and DG. Figure 2 indicates images and the XRD pattern for the SS and DG. The crystalline phases of the SS mainly contain larnite (Ca2SiO5), hatrurite (Ca3SiO5), mayenite (Ca12Al14O33), portlandite (Ca(OH)2), RO phase (solid solution of CaO, MgO, FeO, and MnO) [10,23,24], calcite (CaCO3), srebrodolskite (Ca2Fe2O5), magnetite (Fe3O4), and C3A (Ca3AlO6). The DG used in this study, with the main component of DG (CaSO4·2H2O), is a by-product of the steel manufacturing process. Figure 3 shows the particle size distributions (PSDs) of the SS and DG, showing that the Dv(50) values of the SS and DG were 7.52 and 16.5 μm, respectively.

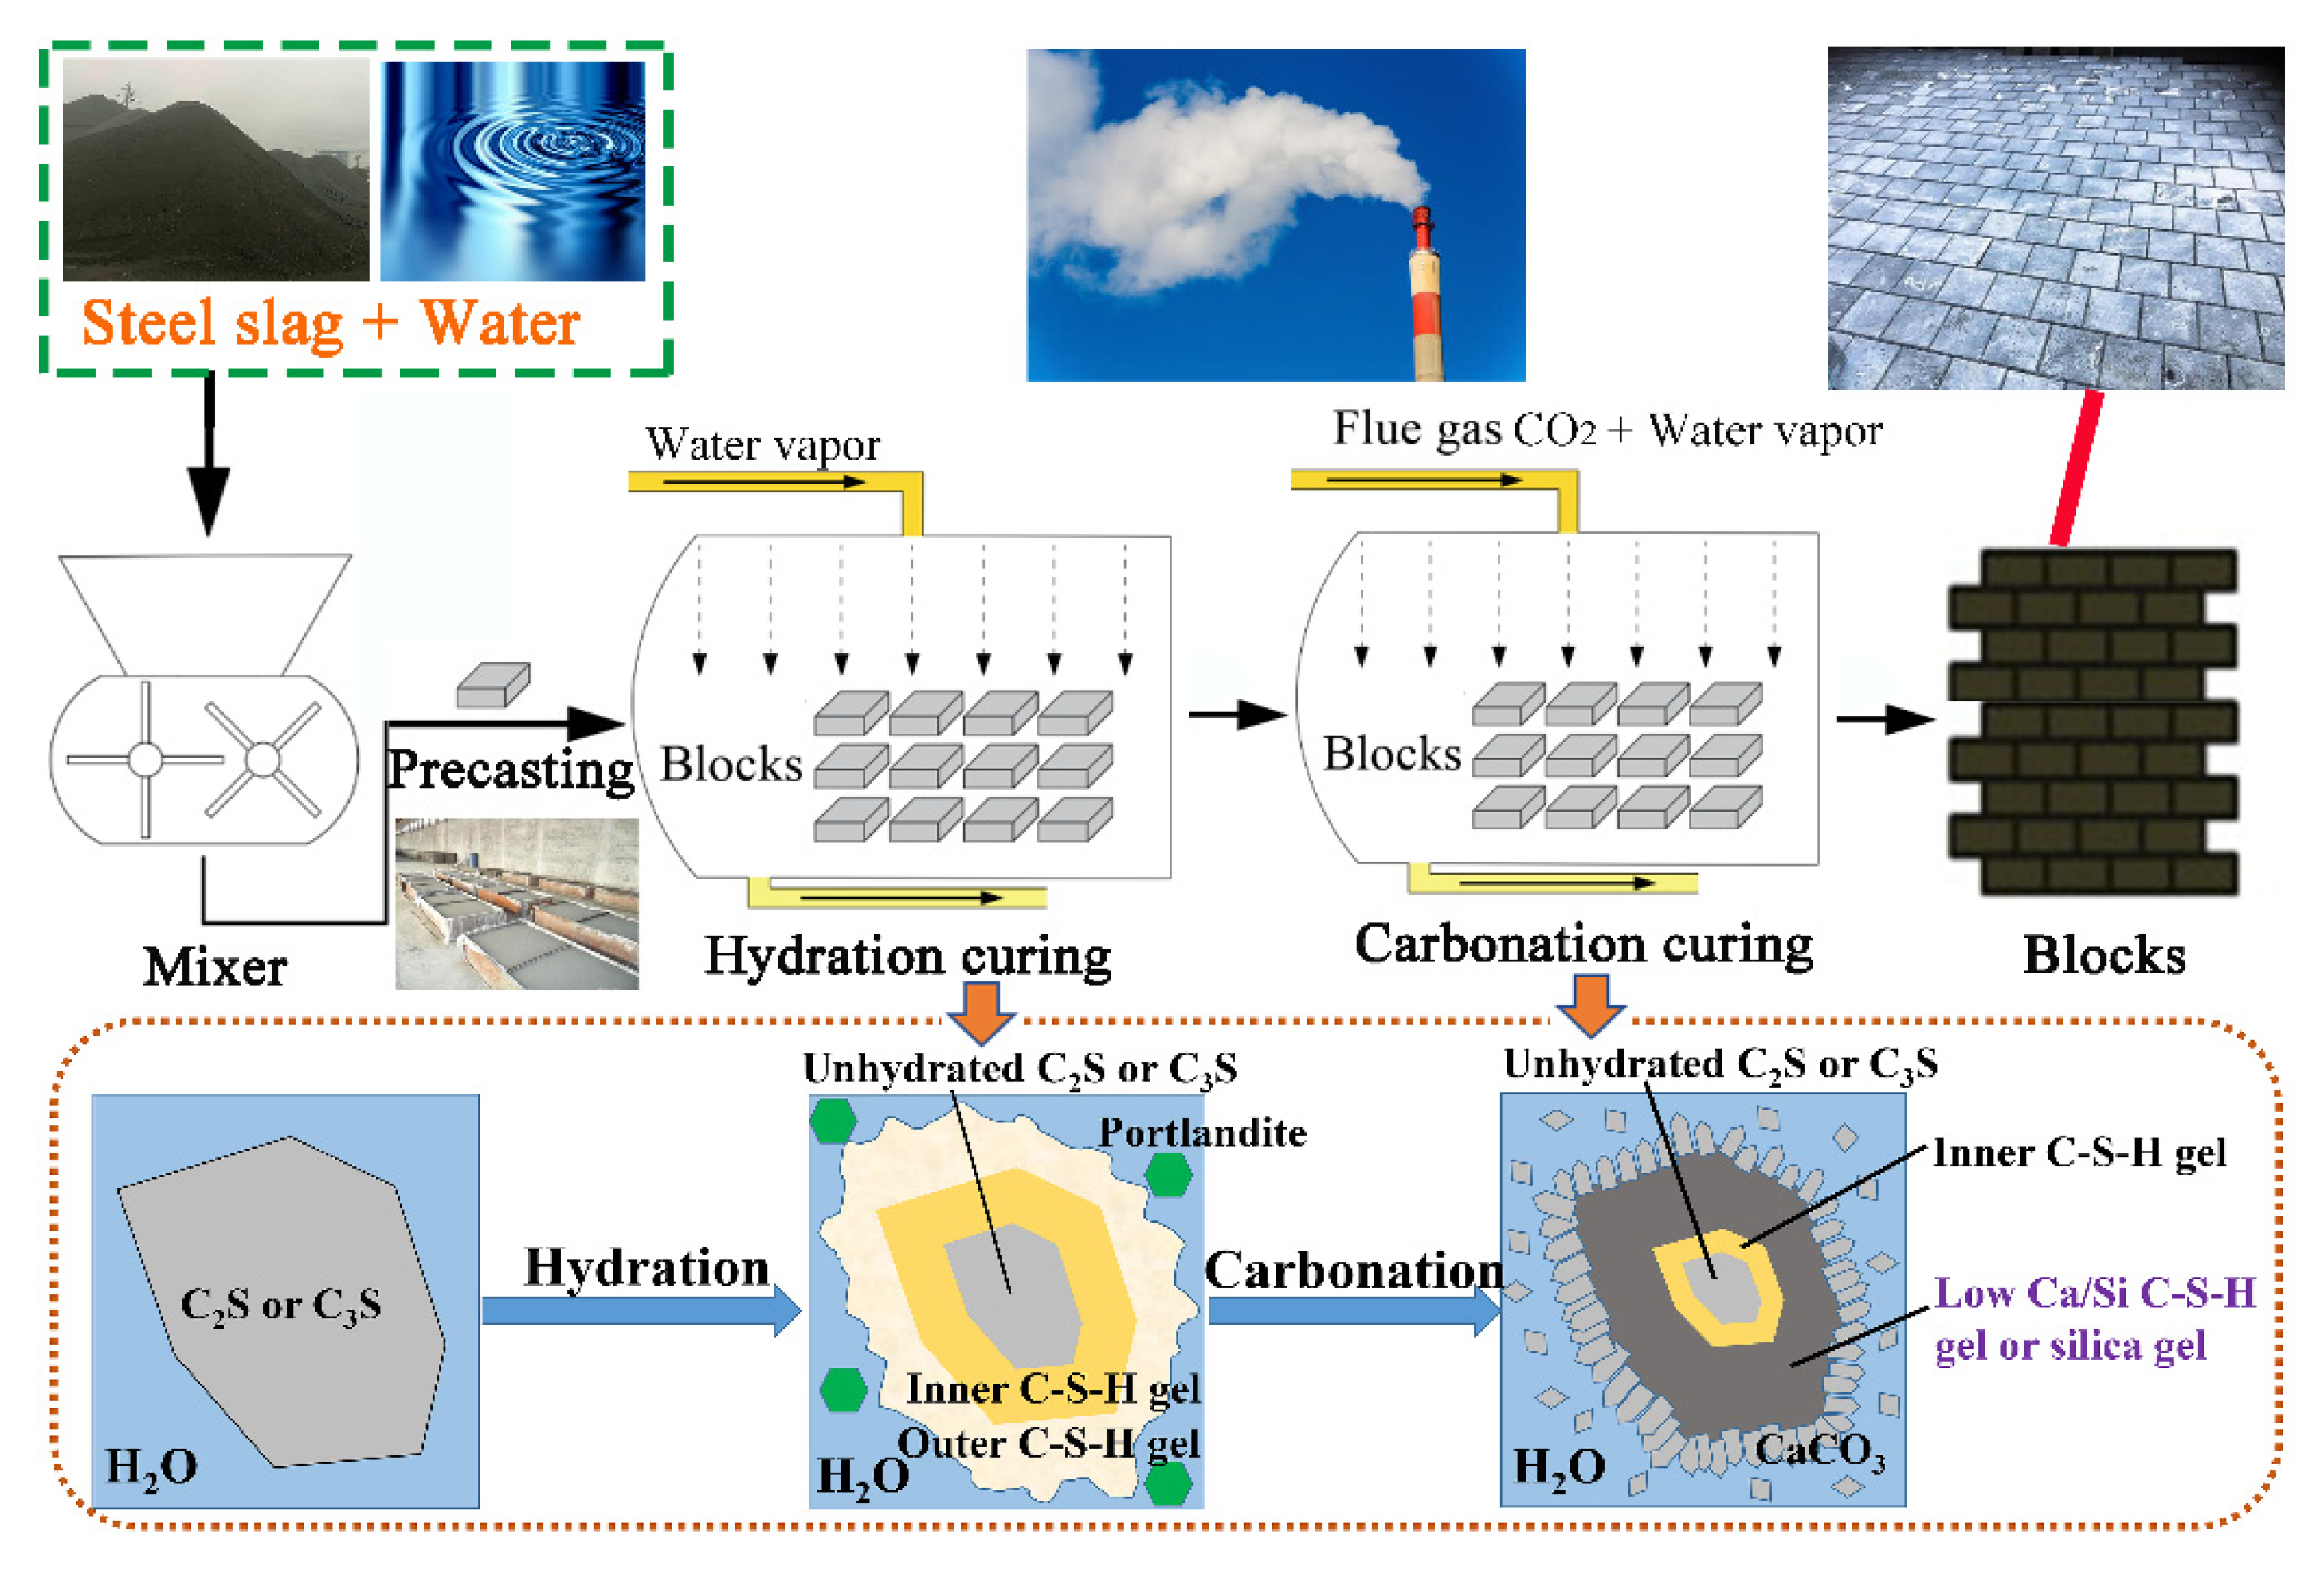
2.2. Sample Preparation

The SS, DG, and water were firstly weighed according to the mass ratio listed in Table 2. Afterwards, they were fully mechanically mixed using a NJ-160A paste mixer for 5 min at a rate of 60 rpm to make the mixture. The prepared mixture was then poured into covered triplicate molds with dimensions of 30 × 30 × 50 mm. Afterwards, the paste-filled molds were placed in a standard cement curing chamber (with a temperature of 20 ± 3 °C, relative humidity of 95 ± 5% inside) for hardening. One day later, the samples were demolded for subsequent cure (air cure or carbon cure as listed in Table 2).
Immediately after demolding, the air-curing samples (U1, U4, and U7) were put back into the standard cement chamber to achieve further hydration and air curing. “U” means un-carbonated here. While the carbon-curing samples (C1–C9) were placed inside a carbonation chamber (with a temperature of 20 ± 3 °C, a relative humidity of 70 ± 2%, and a CO2 concentration of 20 ± 3 vol% inside). After curing durations of 1, 3, 7, 14, 28, and 60 days, the samples were brought out and subjected to mechanical and microstructural tests.

2.3. Testing

The compressive strength of the paste samples was measured based on the Chinese Standard GB/T17671-1999. A digital hydraulic pressure testing machine (YES-300, Changchun, China) was operated on the paste samples at a loading rate of 2.5 KN/s. Carbonation depth was determined by spraying a phenolphthalein indicator on the cross-section of the samples. The solution appears pink in fresh zones but shows as colorless in carbonated zones. The compressive strength and the carbonation depth at each curing age were determined by calculating the mean value of three tests. The paste was cut into smaller pieces and immersed in anhydrous alcohol to cease hydration for subsequent analysis.
For the carbon content test, XRD, TG-DTG, FTIR, and XPS test, dried powder was provided by crushing and grinding the paste and drying.
A carbon/sulfur combustion analyzer (EMIA-820 V, Horiba) was used for measuring the total carbon contents of the samples. CO2initial and CO2final are the CO2 contents of the samples calculated from the total carbon contents. CO2 uptake was calculated using Equation (1):
C O 2 u p t a k e = ( C O 2 f i n a l C O 2 i n i t i a l 100 C O 2 f i n a l ) · 100
XRD, SEM-EDS, TG-DTG, FTIR, MIP, and XPS were conducted to analyze the reaction mechanisms and microstructures of the samples. The XRD and QXRD analyses were conducted using the method described in Section 2.1. For SEM-EDS observation, paste pieces were cut into thin even samples and fixed to the objective holder using conductive tape, before gold powder was sprayed on them. SEM observation of samples was conducted using a SUPRA 55 Scanning Electron Microscope (University of Science and Technology, Beijing, China). TG-DTG was carried out using a NETZSCH STA 449F3 at a heating rate of 10 °C/min and at temperatures ranging from 50 to 1000 °C. Argon was used in the TG test. Additionally, a NEXUS670 FTIR infrared spectrometer was used for FTIR analysis with the wave number ranging from 400 to 4000 cm−1 and the resolution of 3 cm−1. The instrument used for XPS test was a Thermo Scientific Escalab 250Xi. In the test, a Shirley background was assumed in all cases. Spectra were calibrated using the adventitious hydrocarbon peak at 284.8 eV binding energy (BE). Paste pieces were cut into smaller samples with a size of less than 1 cm for the MIP test. The MIP analysis was conducted to determine the porosity and pore size distributions of the samples using an Autopore IV 9500 (micromeritics).

3. Results

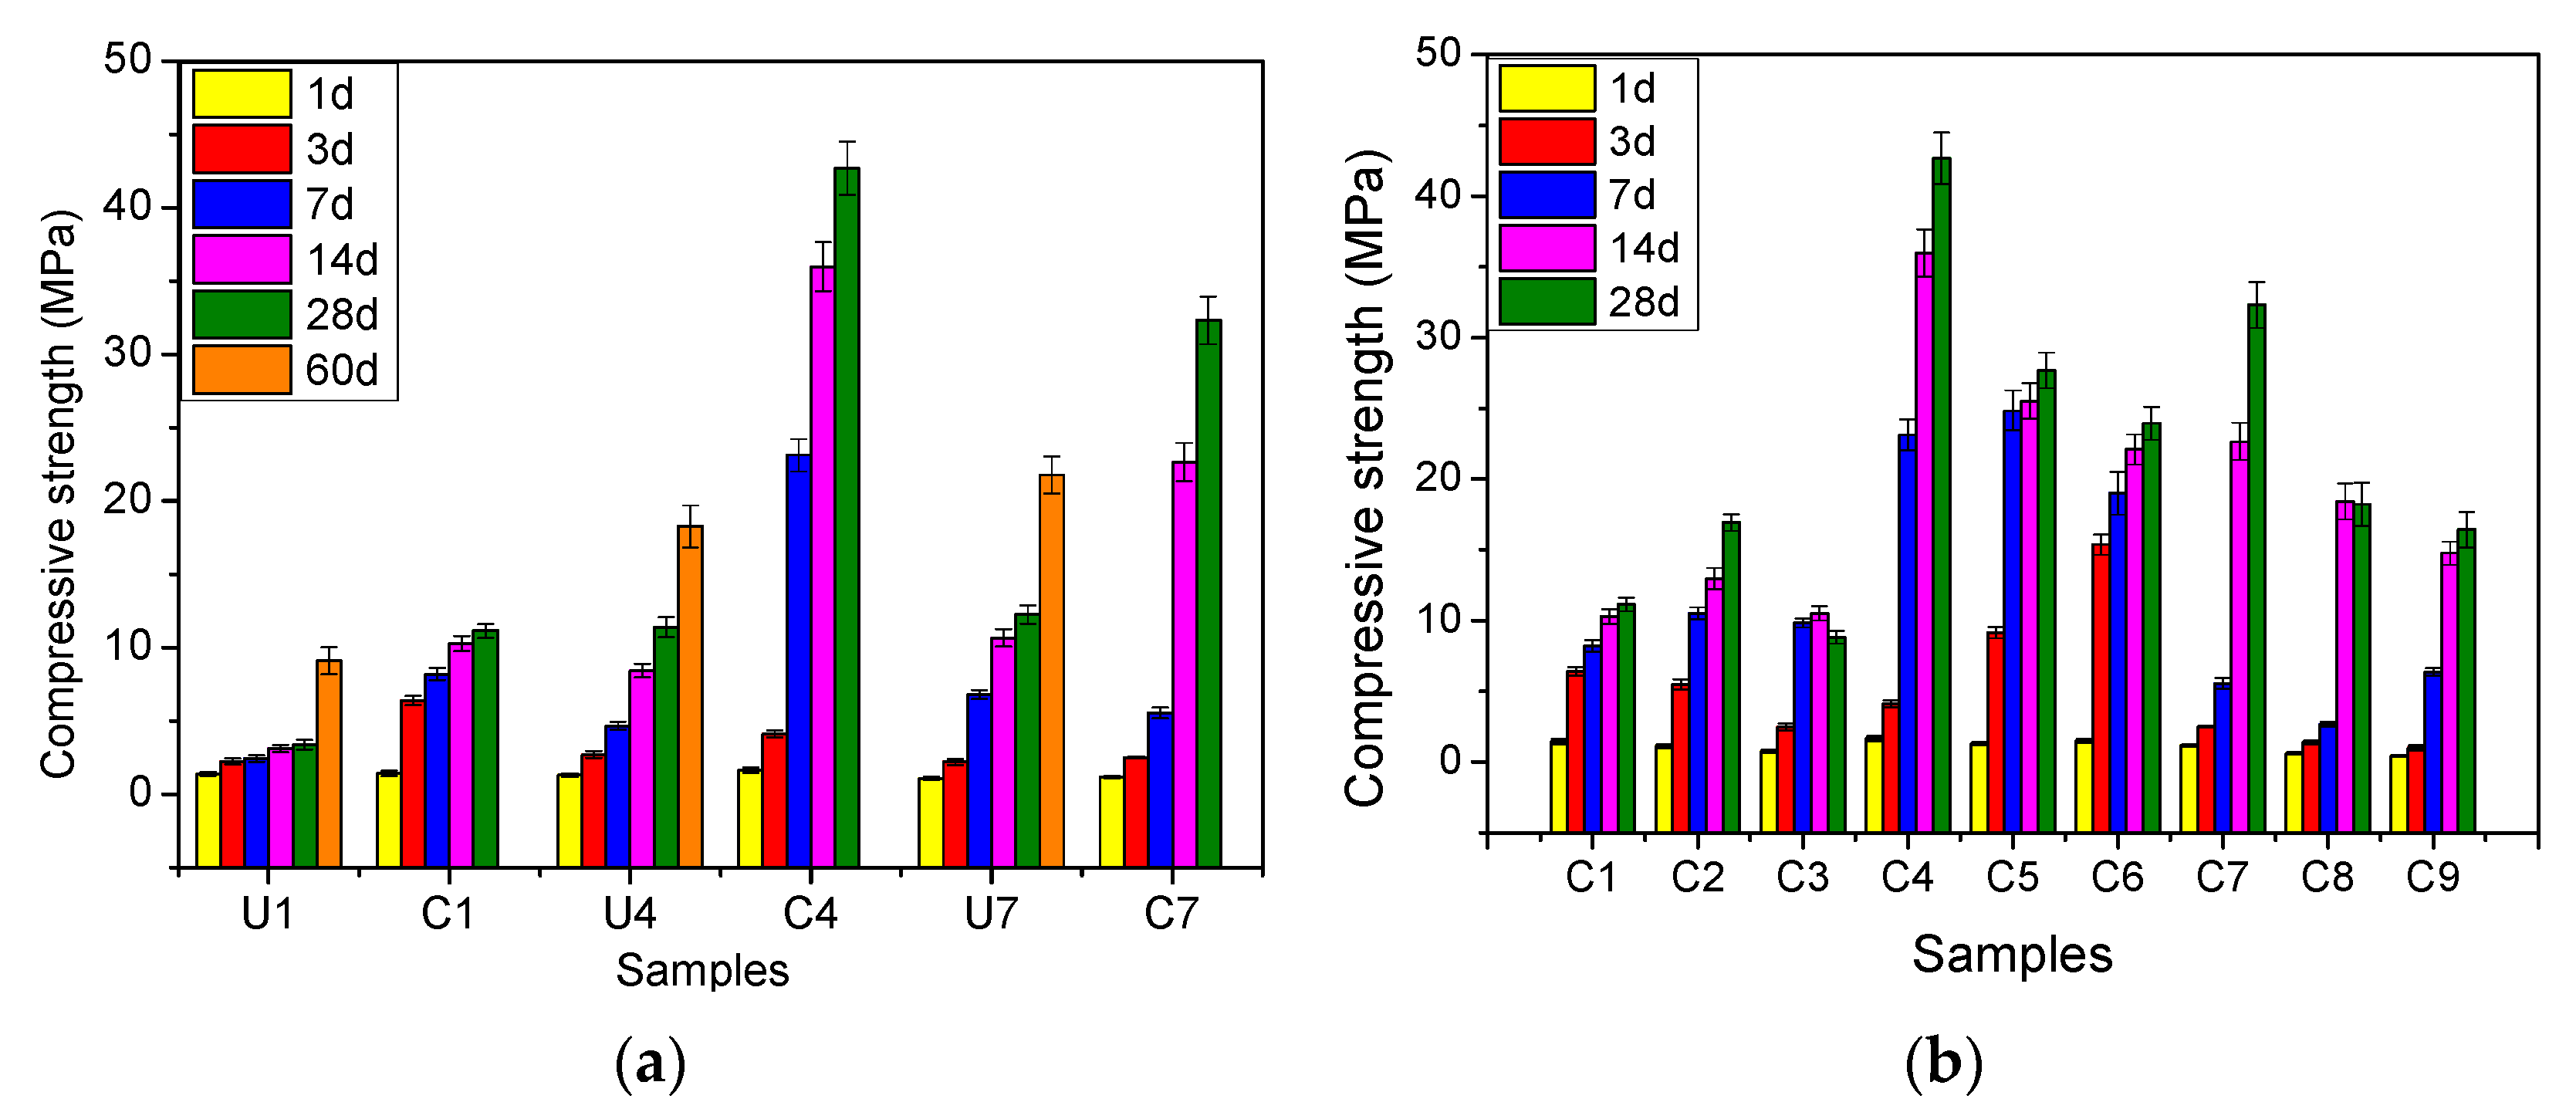
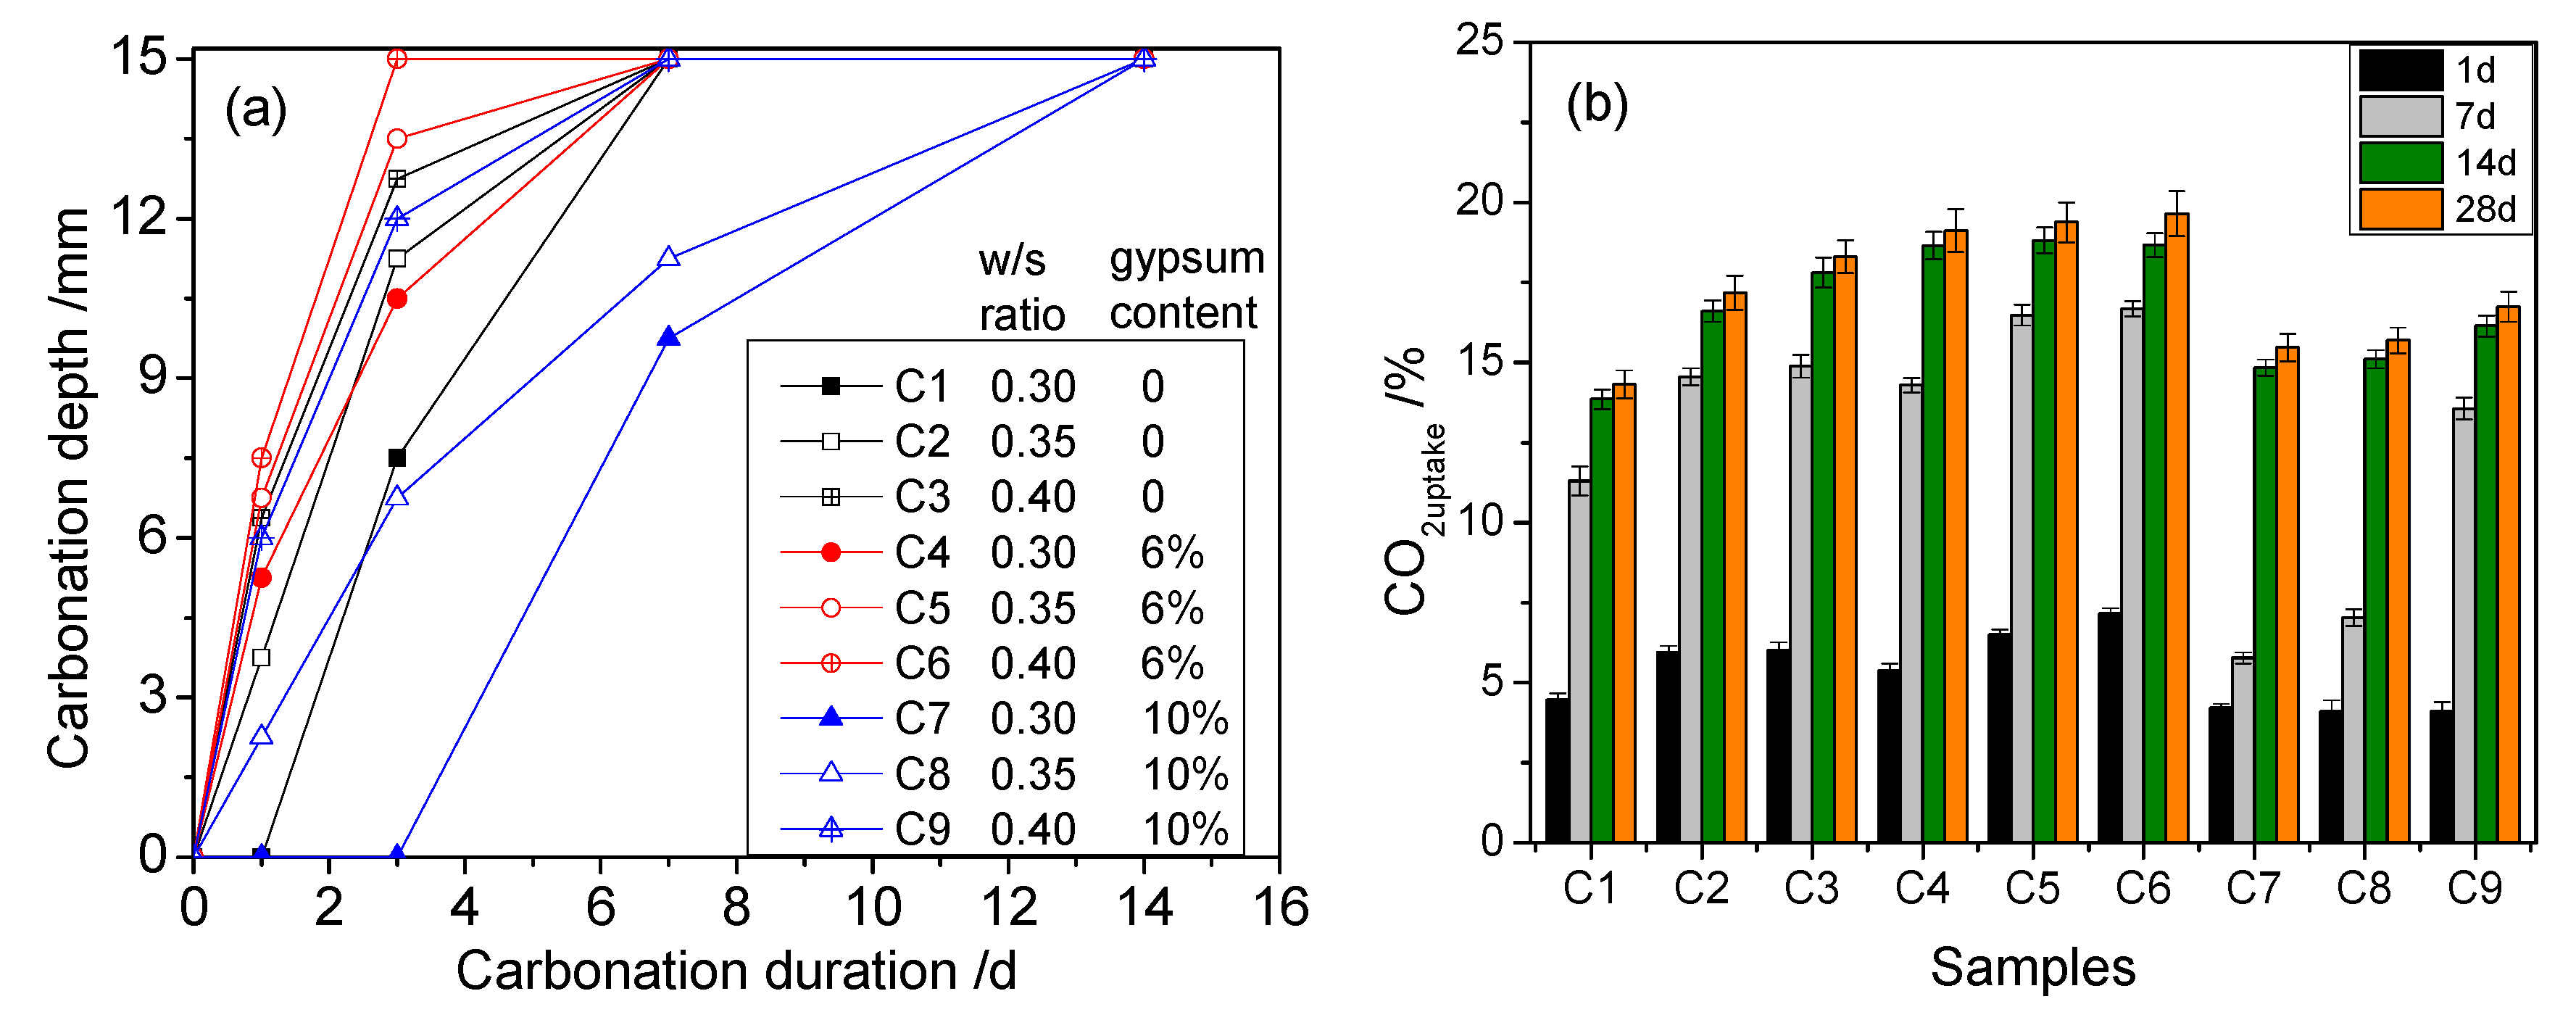
3.1. Strength and CO2 Uptake
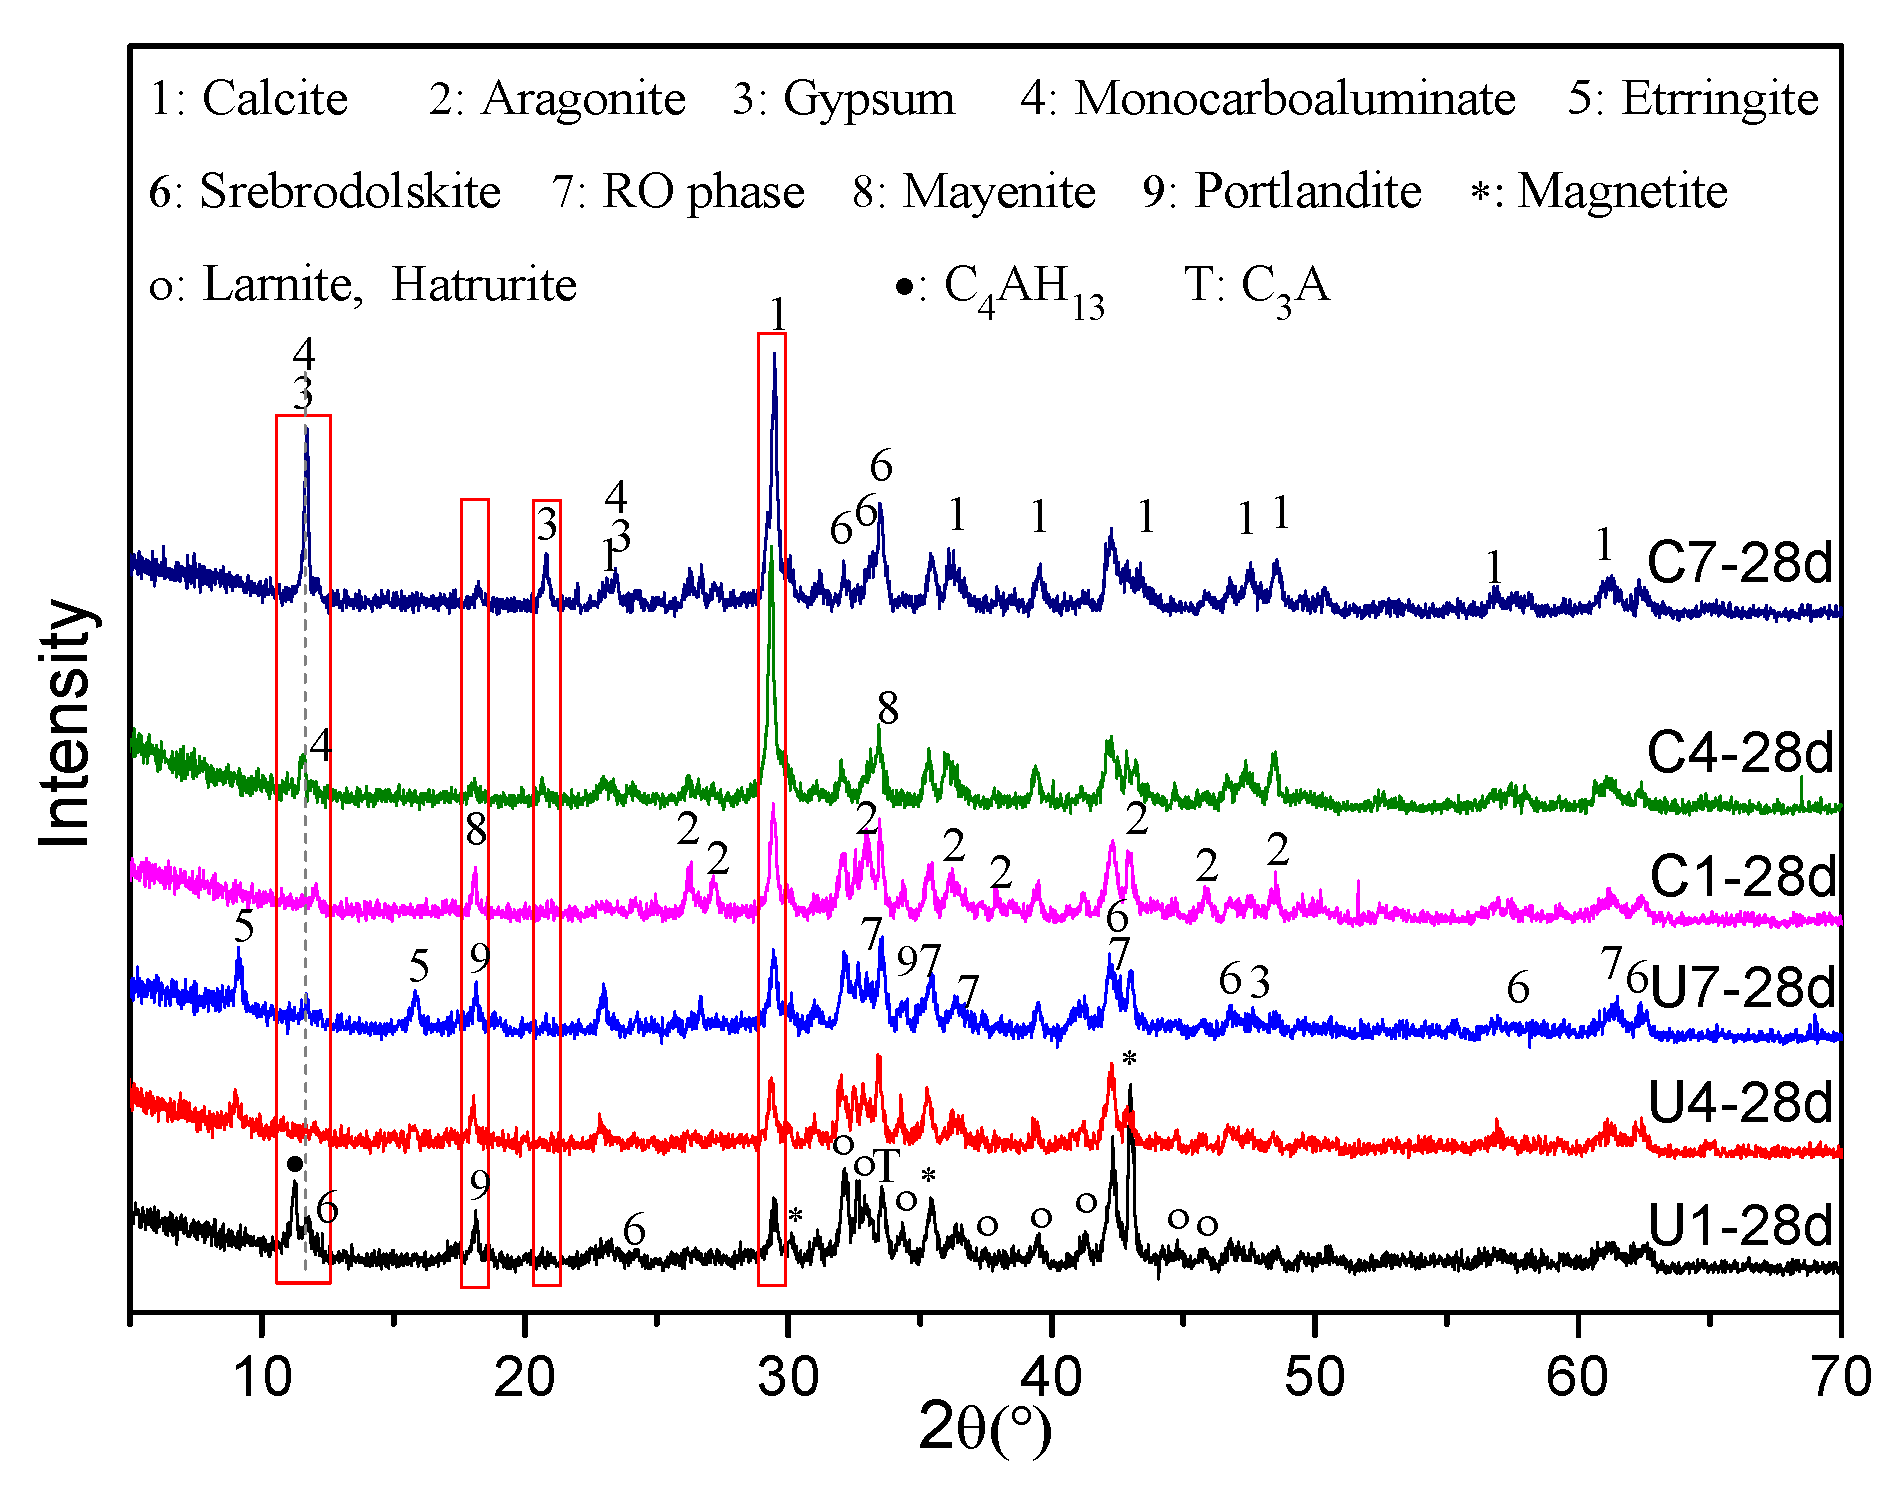
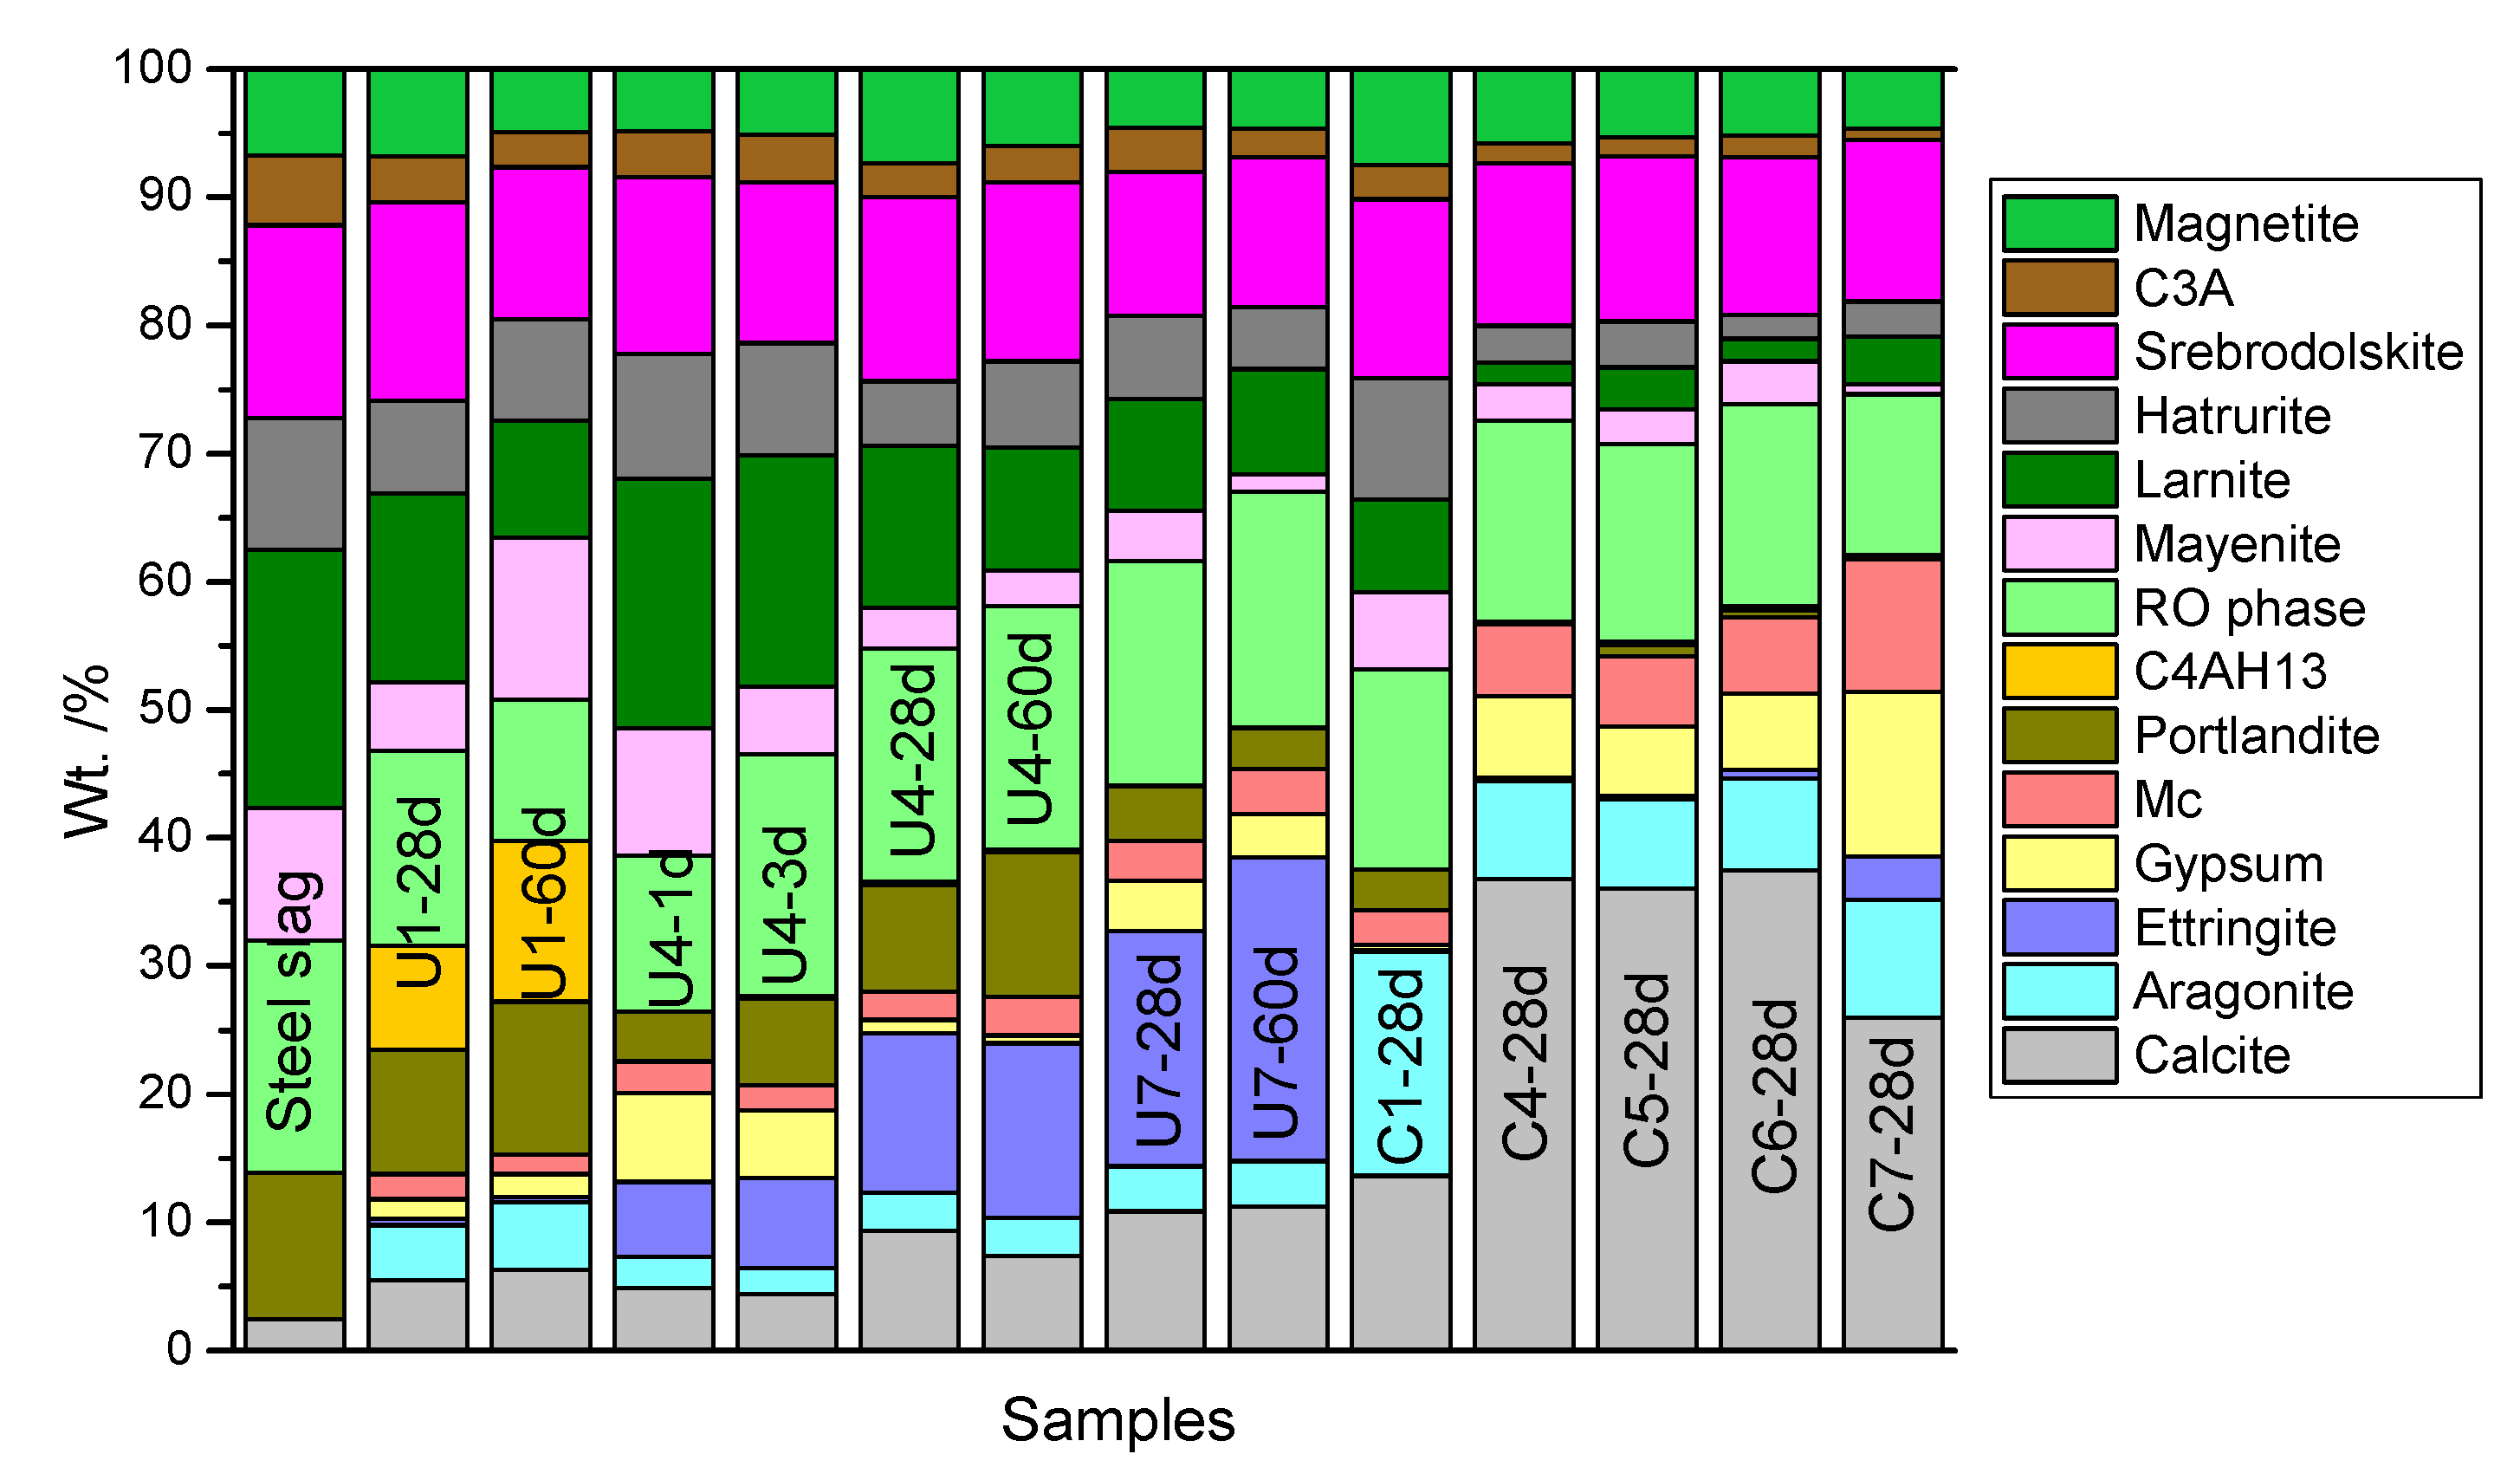
Figure 4 shows the compressive strength results for the samples. In general, the strength of almost all samples increased with the curing age. It is also obvious that the non-carbonated samples (U1, U4, and U7) tended to have much lower strengths than the corresponding hydration-carbonation-cured samples (C1, C4, and C7) at the same curing ages. The 60-days hydration curing contributed less to strength enhancement than did 28-days carbonation curing. These results indicate that carbonation curing significantly promoted the sample strength. The strengths of U4 and U7 tended to be greater than that of U1, especially in the later stages, indicating the positive effect of DG on the hydration-curing sample strength.
Moreover, the hydration–carbonation-cured samples with a DG addition of 6% (C4–C6) showed higher strengths than did samples with a DG addition of 10% (C7–C9) and samples without DG (C1–C3). With a curing time of less than 14 days, C1–C3 showed higher strengths than did C7–C9. This situation changed after 14-days curing, at which point the samples with 10% DG showed greater strengths than did those without DG.
Generally, carbonation-cured samples with high w/s ratios tended to have lower strengths. Among C1–C9, C4, whose DG addition was 6% and w/s ratio was 0.3, showed the highest strength, with unconfined compressive strength (UCS) values of 35.98 and 42.68 MPa for 14- and 28-days carbonation curing, respectively.
Additionally, the carbonation depth and CO2 uptake of the samples increased with the carbonation curing age (Figure 5). All of the samples reached a maximum carbonation depth of 15 mm at 14-days curing (Figure 5a), which is in line with the fact that the CO2 uptakes of the 14-days cured samples were close to those of the 28-days cured samples (Figure 5b), indicating that the carbonation reaction was nearly complete within 14 days. Similar to the strength results, samples with a DG addition of 6% (C4–C6) showed the highest CO2 uptake and greatest carbonation depths. However, a 10% DG addition had negative effects on strength, carbonation depth, and CO2 uptake. Furthermore, samples with a higher w/s ratio showed relatively high CO2 uptake and carbonation depths.

3.2. XRD Analysis

The XRD patterns in Figure 6 show the mineral components of U1, U4, U7, C1, C4, and C7 on Day 28. Since the main peaks of DG and monocarboaluminate overlap in the XRD pattern, retrieved QXRD was used to determine their amounts in the samples. QXRD analysis results for some of the samples can be seen in Figure S1 in Supplementary Material. Figure 7 shows the outcome of QXRD analysis using the Rietveld refinement method. Based on qualitative and quantitative XRD analysis results, it is evident that the amounts of some relatively stable minerals in the SS, such as srebrodolskite (C2F), magnetite (Fe3O4), and the RO phase, remained almost stable during hydration and carbonation curing. However, the percentages of larnite (C2S), hatrurite (C3S), portlandite (Ca(OH)2), tricalcium aluminate (C3A), and mayenite (C12A7) decreased over time, indicating the high reactivity of these minerals. The main hydration crystal products in the hydrated SS (U1) were C4AH13 and portlandite. It is commonly known in the cement field that C-(A-)S-H gel is a common hydration product. However, it is amorphous and cannot be determined via the XRD analysis. The main carbonation products of the samples without DG addition were calcite and aragonite (C1-28d). Based on a comparison of the U4 and U1 samples, the addition of DG clearly promoted the formation of ettringite (C3A·3CaSO4·32H2O) during the hydration reaction, whereas ettringite almost disappeared after 28 days of accelerated carbonation. Accordingly, calcite, aragonite, and monocarboaluminate (C3A·CaCO3·11H2O) became the main products after carbonation curing. DG may have stimulated the reactivity of C3A and mayenite. The aforementioned XRD results explain why the C4-28d sample exhibited more CO2 uptake than did the C1-28d sample (Figure 5).

3.3. SEM–EDS Analysis

Figure 8 shows the SEM-EDS results for the hydrated and carbonated samples. Large amounts of ettringite and C-(A-)S-H gel can be easily seen in the U4-28 d sample (Figure 8a). These two components are reported to be the main supports for cement strength gain via their intertwining within the material. SS has similar minerals to cement but has much lower strength owing to the lower reaction activation and lower content of active minerals in SS (resulting from differences in the resource and production processes vs. cement). Figure 8b reveals the main carbonation products, i.e., low-Ca/Si C-(A-)S-H gel and calcite. Calcite is the main carbonation product and was precipitated across all of the samples, which is in line with the XRD results. The carbonated C-(A-)S-H gel was looser than was observed prior to carbonation since the Ca in the gel became separated out and carbonated into calcite. The 28-days carbonation-cured C1 sample showed the formation of sheaf-like aragonite (Figure 8c,d) [25].

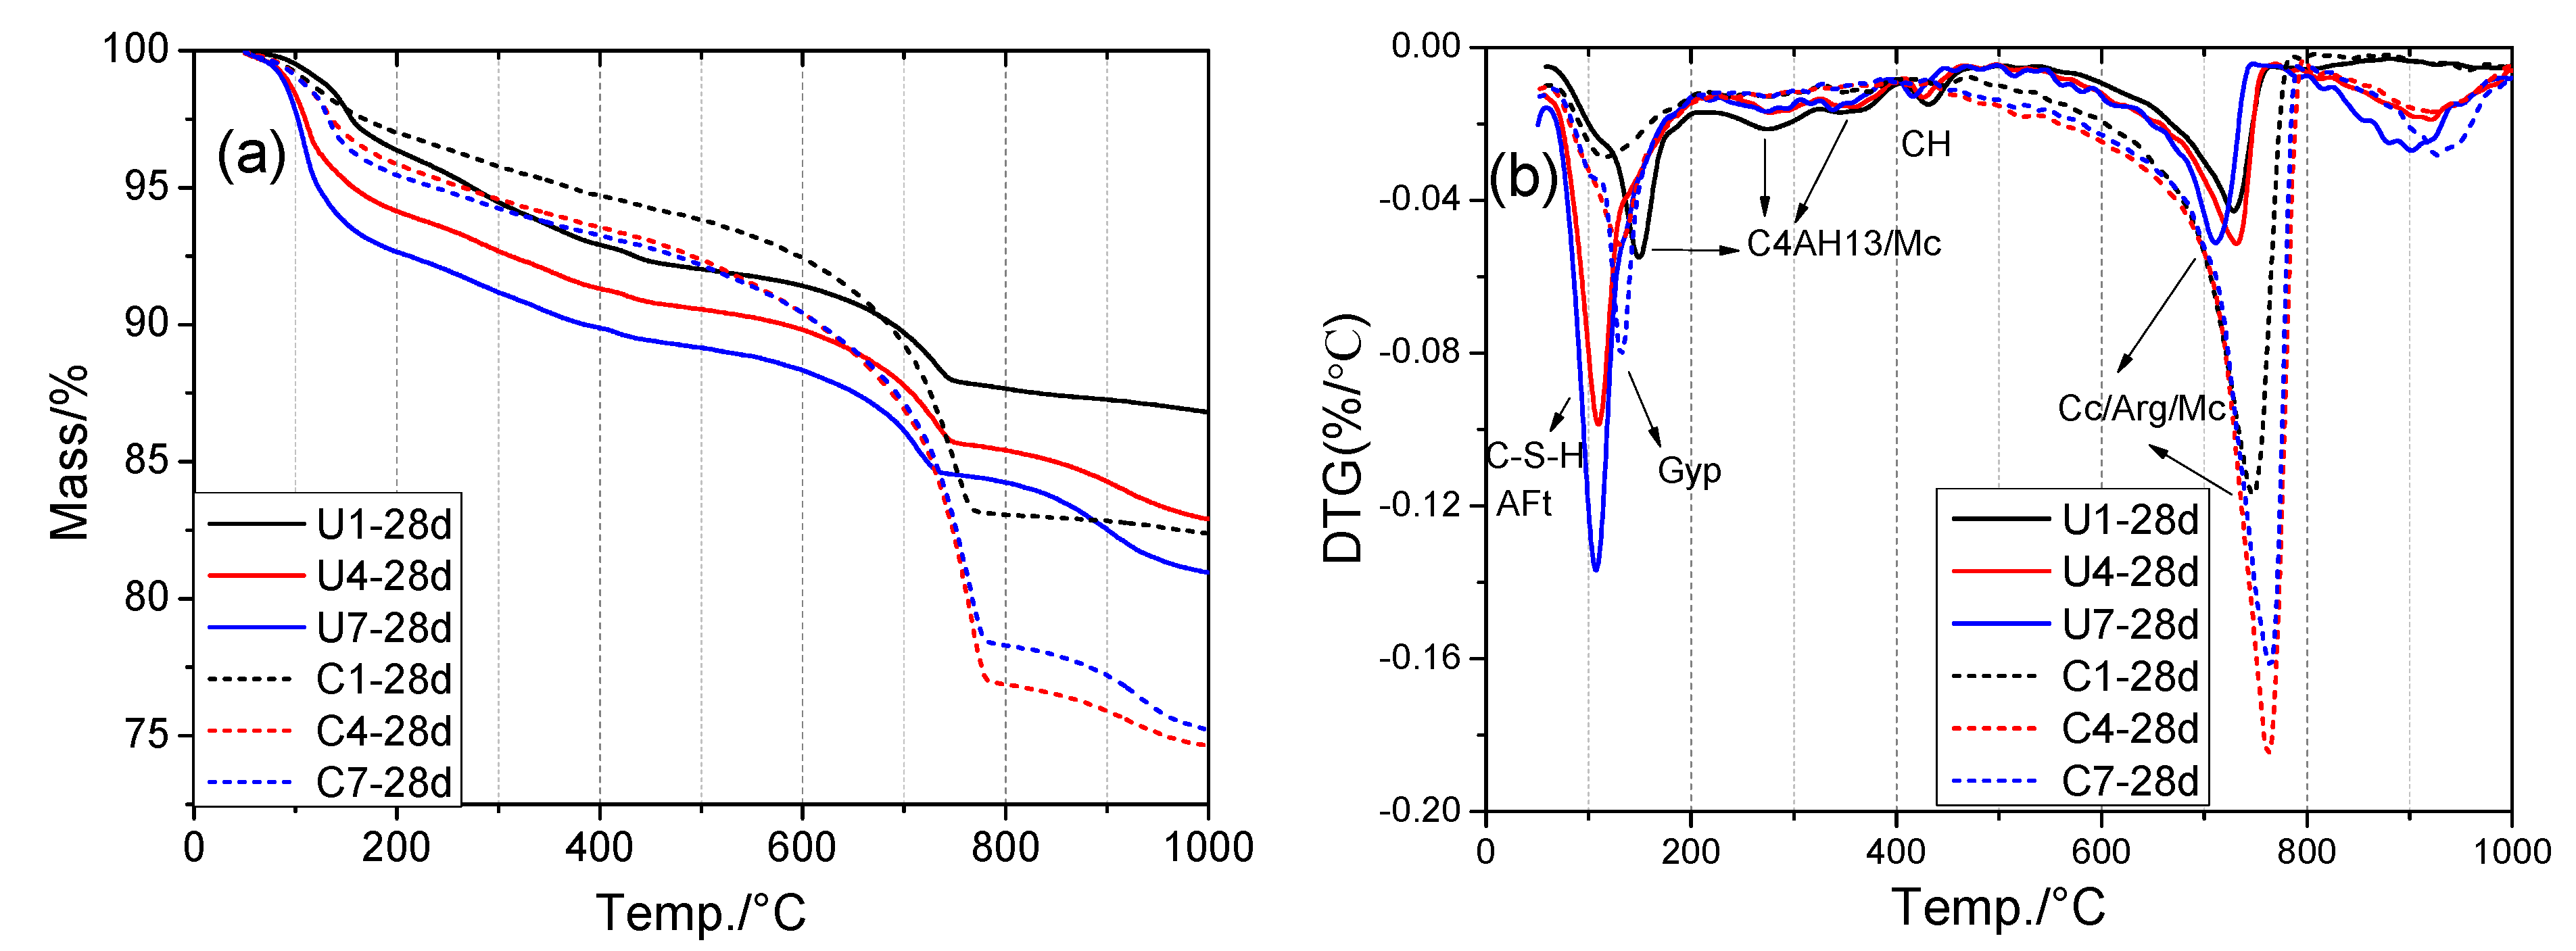
3.4. TG-DTG Analysis

Thermogravimetric analysis (TGA) is an important method for analyzing hydration and carbonation products. The TG-DTG results of the samples hydration- or carbonation-cured for 28 days are shown in Figure 9. The evaporation of interlayer water and hydroxyl groups in the products occurred at temperature ranges of <240 and 240–500 °C, respectively. Specifically, (i) C-(A)-S-H gel and ettringite lost interlayer water at around 100 °C; (ii) the dehydration of DG can be observed at around 140 °C; (iii) the interlayer H2O loss and dehydroxylation of AFm-phase C4AH13 and Mc occurred in the temperature ranges 60–200 and 200–400 °C [26], respectively; (iv) portlandite decomposed at around 450 °C; and (v) mass loss at 500–800 °C was mainly associated with the decarbonation of carbonates such as calcite, aragonite, and Mc [27].
Figure 9b shows DTG results that can be used to differentiate mass loss in the products. Combining the QXRD and DTG results, the amounts of C-S-H gel and ettringite (AFt) can be clearly seen to have increased, whereas the amount of C4AH13 decreased with the addition of DG. Therefore, DG may prevent the formation of C4AH13 from mayenite or C3A hydration. In the presence of DG, ettringite is more likely to be formed in a hydration environment. However, after accelerated carbonation-curing, the mass losses of ettringite, C-(A)-S-H gel, portlandite, and C4AH13 decreased significantly, whereas those of the carbonates (calcite, aragonite, and Mc) increased. CO2 losses from C4 and C7 were much higher than that of C1, indicating that the addition of DG can enhance the carbonation reactivity of SS. In addition, C4, with a lower addition of DG than C7, showed a higher CO2 mass loss than did C7 between 500 and 800 °C, which is in line with the CO2 uptake and QXRD results. DG reacted with mayenite and C3A to form ettringite in U4 and U7 via the hydration reaction, whereas it was formed during carbonation in C4 and C7. This explains why a small amount of DG was needed to promote hydration and carbonation in the carbonation-cured samples.
To distinguish aragonite from calcite, the FTIR analysis was applied as the results shown in Figure S2 and Table S1 in Supplementary File. In relation to the C−O characteristic absorption bands in CO32−, there were some differences observed between calcite (mainly at around 1478 and 857 cm−1) and aragonite (mainly at around 1418 and 873 cm−1) [28]. Based on the relatively high intensities at 1478 and 857 cm−1 in the C1 sample (Figure S2), it is readily apparent that C1-28d contained more aragonite than did the other samples.
Furthermore, the XPS analysis was conducted to further explore the mechanisms, as shown in Figure S3. Al 2p spectra for the specimens are shown in Figure S3b. In the SS, C12A7 and C3A were the most important sources of aluminum. From the work of Dubina [29,30], the binding energy of alumina (73.47 eV) is typical of AlO4 tetrahedra. The C-A-H phases and monocarboaluminate have Al 2p binding energies of around 74.30 eV. Comans reported that the Al 2p binding energy of ettringite is 73.9 eV [31]. Hydration curing helped significantly increase the Al 2p binding energy to around 74 eV (U1, U4, and U7) by forming the hydration products C4AH13 and ettringite. From Figure S3b, an increase in Al 2p binding energy was observed, resulting from carbonation exposure; the reasons for this may be (i) the higher Al 2p binding energy value of monocarboaluminate as compared with ettringite and (ii) carbonation-curing promotion of C3A and mayenite consumption. From the XRD patterns, the characteristic peaks of C4AH13 and ettringite almost disappeared after carbonation curing. Therefore, it is very likely that monocarboaluminate was formed during CO2 exposure, contributing to the high Al 2p binding energy.

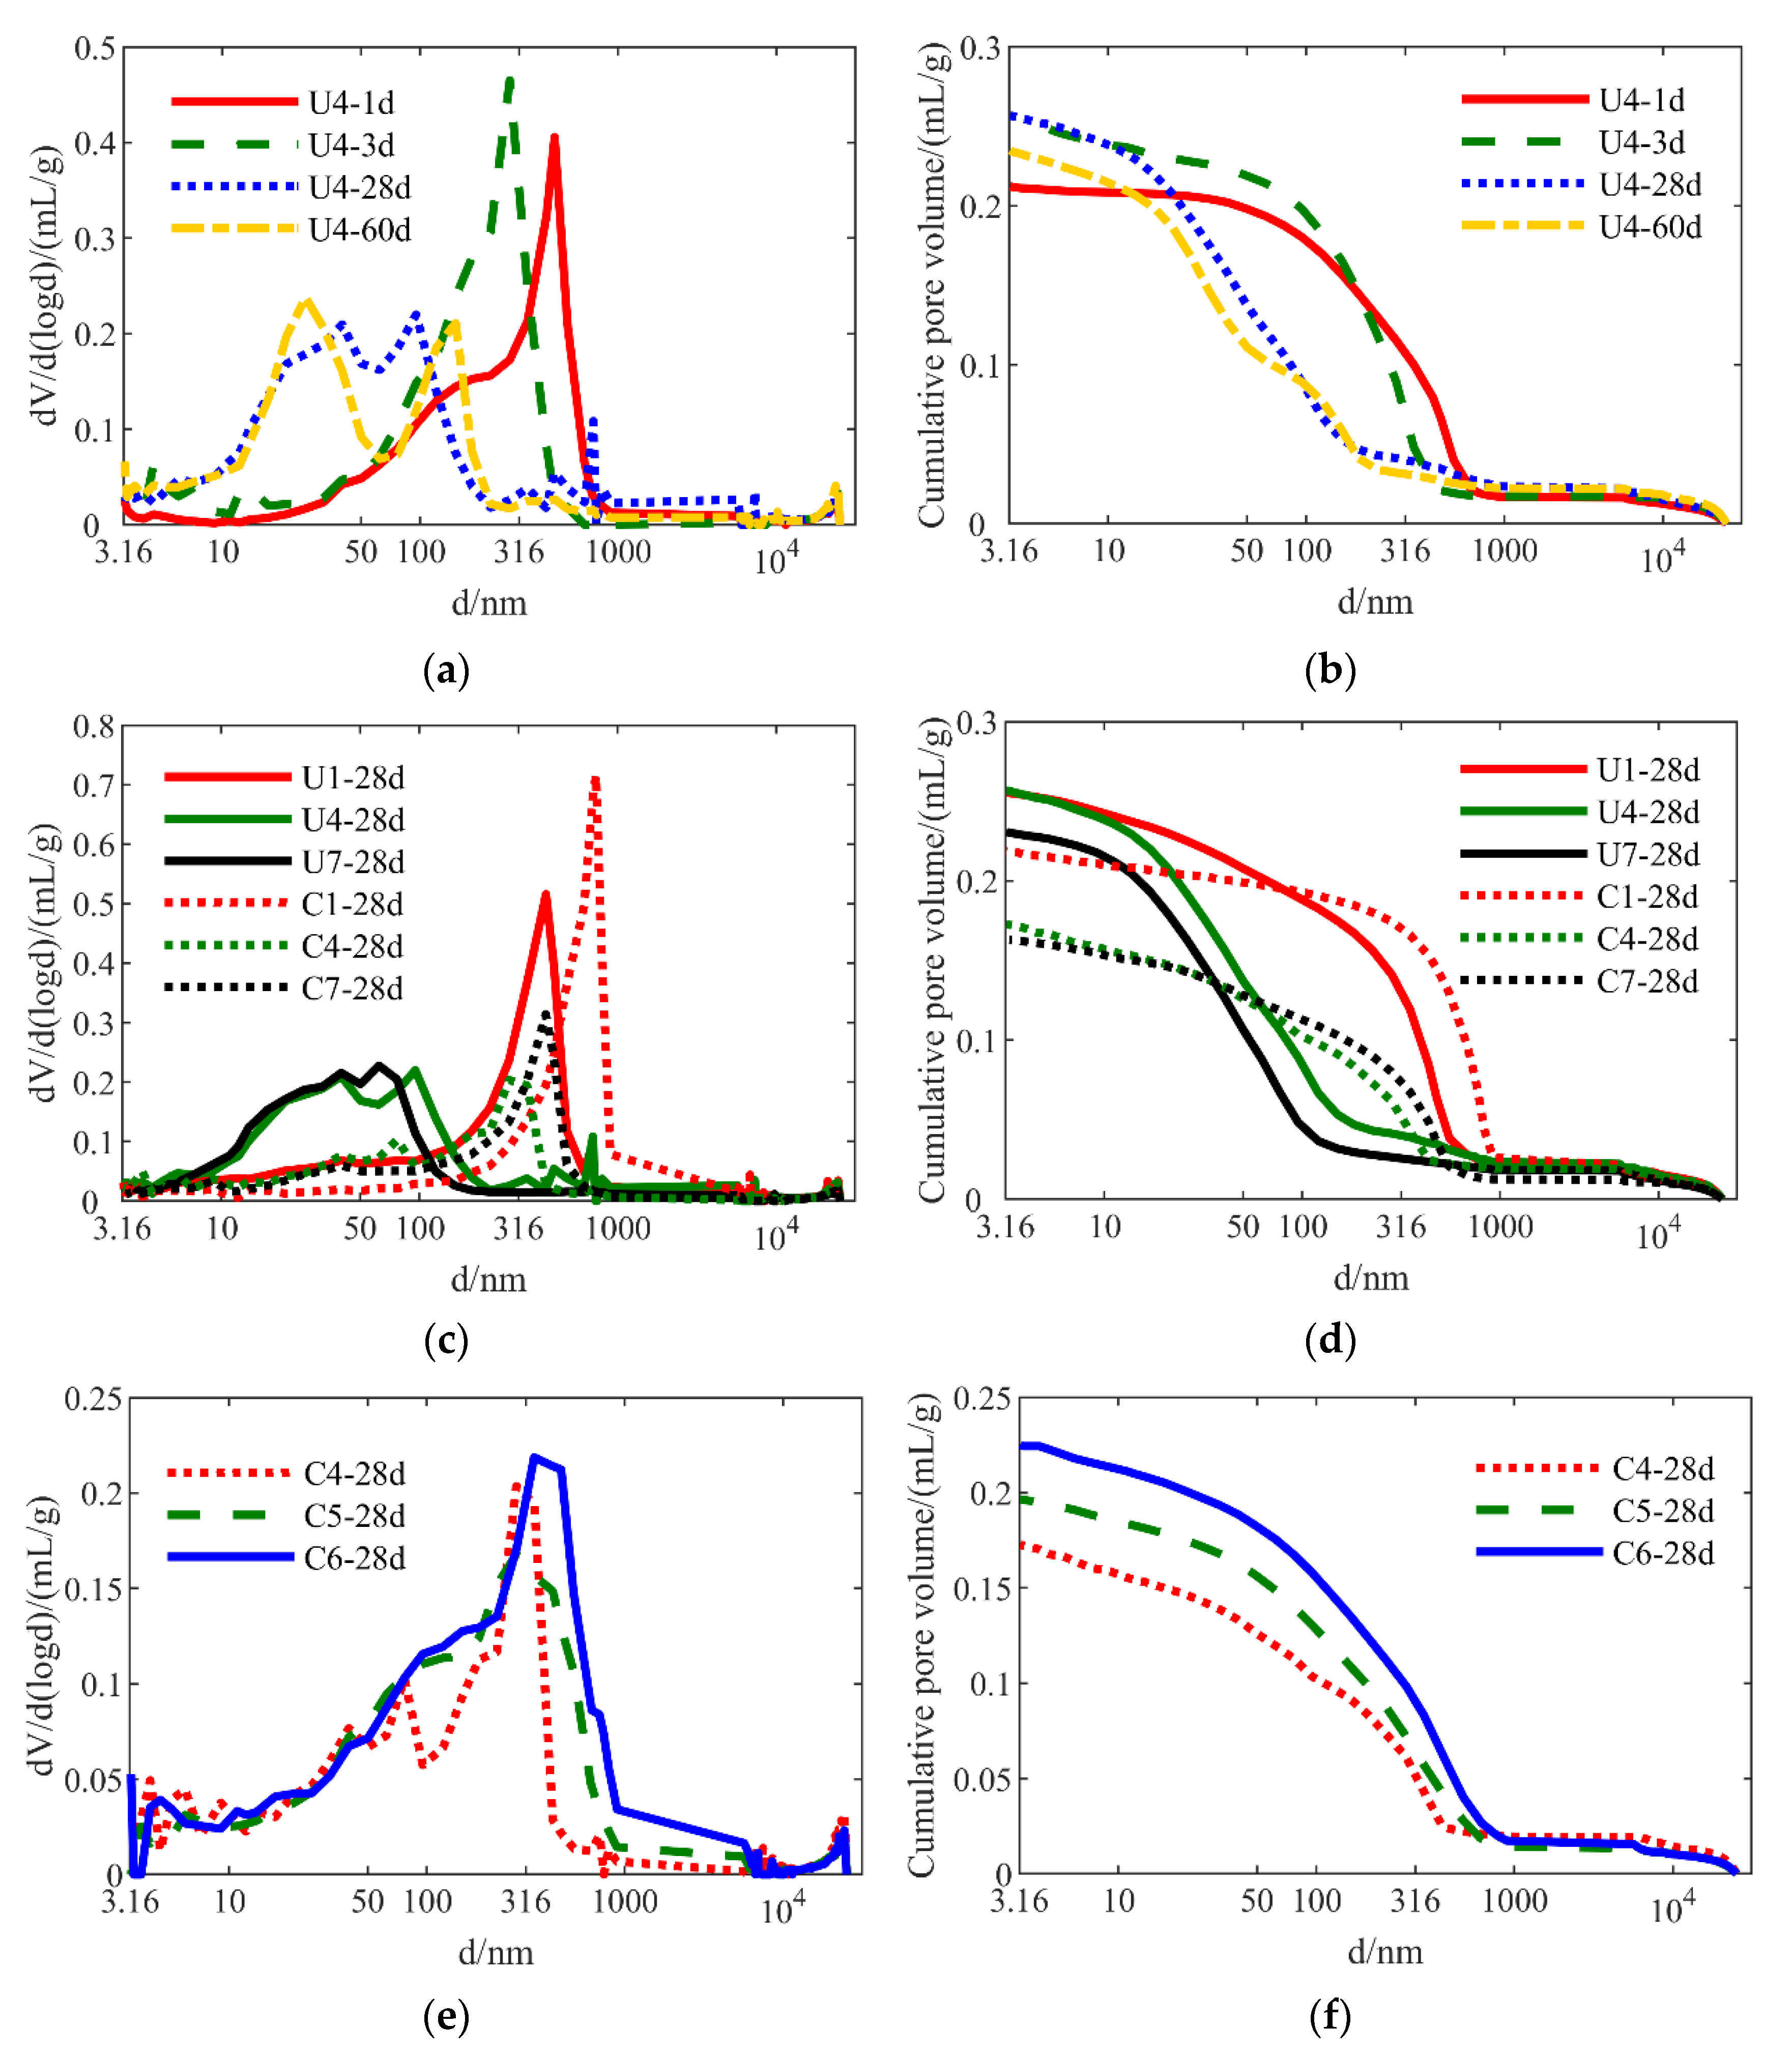
3.5. Pore Structure Analysis
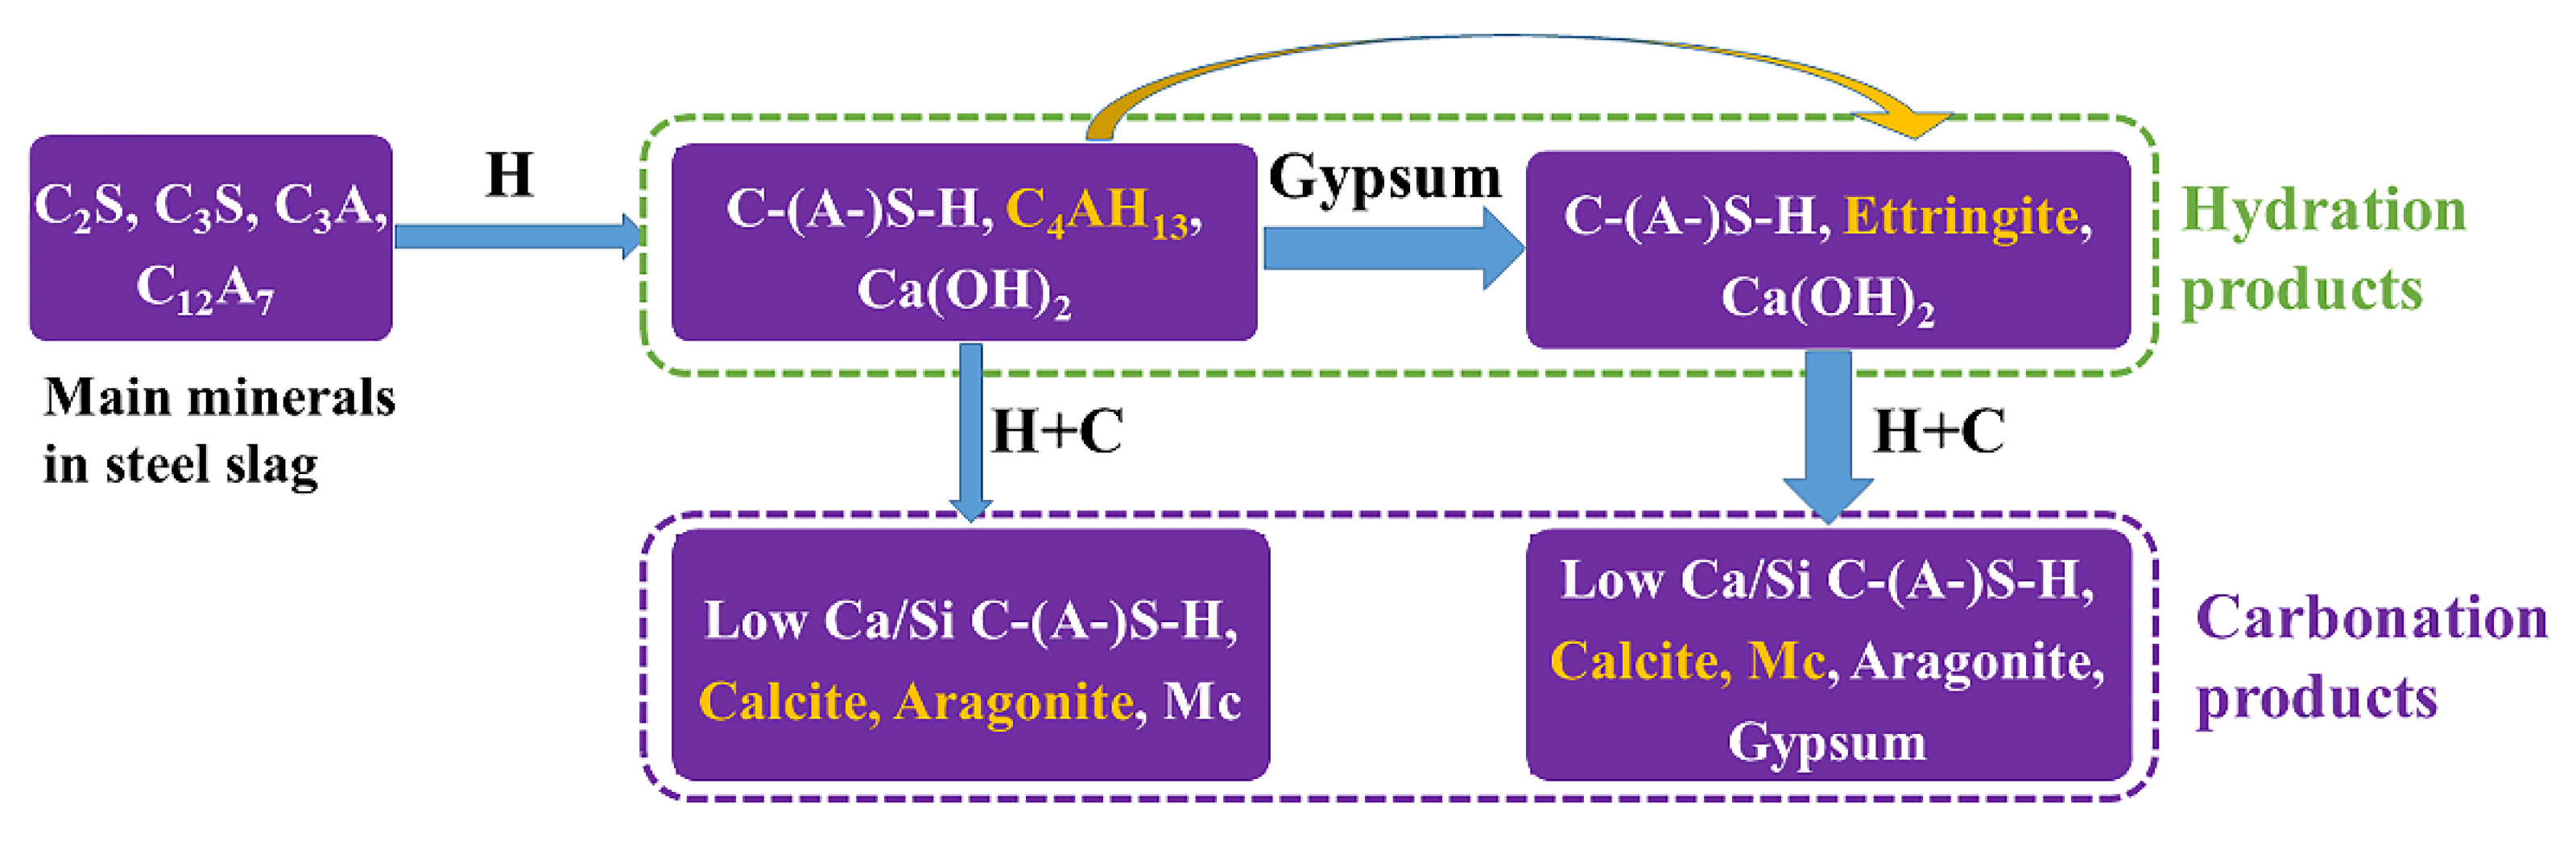
The influence of different parameters on the pore structures of the hydration- and carbonation-cured samples based on the MIP method is shown in Figure 10. From Figure 10a,b, the pore size generally decreased as hydration time increased, indicating that the microstructure became denser due to hydration. This is consistent with the increase in strength with hydration time (Figure 4). In particular, the interlayer distances of C-S-H gels are close to 1 nm [32,33,34] and could not be determined based on the MIP results, whereas the pore size of the C-S-H gels is between 2.5 and 10 nm. From Figure 10a, the pore size of the C-S-H gels was between 3.16 to 10 nm, gradually increasing from 1 to 60 days, indicating that the gels were generated with the increased curing time. Moreover, the micropores ranged in size from 10 to 100 nm, relating to the inter-granular pores of hydration products such as C-S-H and ettringite. From Figure 10a, this size range of inter-granular pores significantly increased as the curing time increased, with the larger pores (100–1000 nm) gradually disappearing. Figure 10b indicates that the cumulative pore volume declined with time (except for U4-1d, the strength of which was only 1.30 MPa (Figure 4). This extremely low strength may have been a result of operation errors in the MIP tests.
Samples U1, U4, and U7 contained DG in the proportions of 0, 6, and 10 wt.%, respectively. Compared with U4 and U7, Figure 10c indicates that U1 had more macropores (100–1000 nm) in the hydration pore distribution at 28 days. However, the U4 and U7 samples contained more micropores (10–100 nm) in their structure than did U1. This result shows that DG promoted the densification of the hydration system. Figure 10d shows that U1 and U4 exhibited similar cumulative pore volumes, both of which were greater than that of U7, indicating that a gypsum content of 10% had a positive effect in terms of minimizing the pore volume and thus enhancing the strength of the hydration samples.
From Figure 10c, the C1-28d and C4-28d samples contained fewer small pores (<100 nm) and more large pores (100–1000 nm) compared with U1-28d and U4-28d, respectively. Although the overall pore size increased after accelerated carbonation, it is evident from Figure 10d that the total pore volume significantly decreased. The formed carbonation products such as calcite, aragonite, and monocarboaluminate may have participated in large pores, decreasing the pore volume. This result indicates that carbonation-cured samples had a denser structure than did the hydration-cured samples.
Figure 10c also shows that the relative magnitude of small pores (<100 nm) follows the order C4 > C7 > C1, whereas the sequence for larger pores (100–1000 nm) follows the order C1 > C7 > C4. This result indicates that C4 had the tightest structure among the three samples, which is consistent with the highest strength of the C4 sample. Samples C4 and C7 had similar cumulative pore volumes (Figure 10d) that were much lower than that of the C1 sample.
Samples C4, C5, and C6 had w/s ratios of 0.3, 0.35, and 0.4, respectively. Figure 10e shows that the cumulative pore volume of the samples significantly decreased with an increase in w/s ratio, following the order C6 > C5 > C4. This indicates that more water resulted in more macropores.

4. Discussion

4.1. Impact of Curing Age on Hydration-Cured Pastes

Figure 4 shows that compressive strength of pastes U1, U4, and U7 increase with the curing duration. From MIP results of U4 (Figure 10a,b), hydration curing promoted the transition from large pores to micropores and reinforced the densification of the microstructure, mainly resulting from the intertwining of C-S-H gel and ettringite or C4AH13. DTG (Figure 9) results are in great line with the existence of these hydration products. Their increasing amount with hydration curing ages were also verified by the QXRD results (Figure 7). In a word, the intertwining of the increasing hydration products and decreasing pore volumes contributed to increases in density and strength.

4.2. Impact of DG on Hydration-Cured Pastes

The strengths of U4 and U7 tended to be greater than that of U1, especially in the later stages, indicating the positive effect of DG on the hydration-curing sample strength (Figure 4). Figure 10c,d indicatess that DG promoted the densification of the hydration system. In terms of the chemical reaction, gypsum may have reacted with C3A and mayenite (C12A7) in the SS to form ettringite (XRD results; Figure 6 and Figure 7), which intertwined with the C-S-H gels to produce a more stable structure and smaller pores (SEM image; Figure 8a). The TG results (Figure 9) also indicate many more hydration products (C-S-H gel and ettringite) in U4 and U7 than in U1. This is consistent with the 28-days UCS results in Figure 4, in which the UCS of U1-28d, U4-28d, and U7-28d were 3.38, 11.39, and 12.25 MPa, respectively.

4.3. Impact of Accelerated Carbonation Curing on Pastes

Figure 4 shows the significant influence of carbonation in promoting UCS. The reason for the increase in large pores after carbonation curing may be that the hydration products in U1 and U4 (mostly C-S-H gel, C4AH13, and/or ettringite) had high carbon reactivity and were readily consumed in the carbonation environment. The C-S-H gel is prone to reaction with CO2 to form calcite and low-Ca/Si C-S-H gel or silica gel. In this process, the C-S-H gel loses much water and its structure is broken up to some extent, producing large pores.
One reason for the increasing UCS is the low pore volume after carbonation (Figure 10d). Another reason might be the difference in nanoindentation modulus and hardness between the hydration products and carbonation products. The nanoindentation modulus and hardness of CaCO3 are 38.9 ± 12.1 GPa and 1.79 ± 0.63 GPa, respectively. They are both higher than the values for the hydration product C-S-H (18.2 ± 4.2 GPa and 0.45 ± 0.14 GPa, respectively, for low-density C-S-H; 29.1 ± 4.0 GPa and 0.83 ± 0.18 GPa, respectively, for high-density C-S-H) [35]. The two aforementioned reasons explain why the strength of the carbonated samples was much greater than that of the hydrated samples.

4.4. Impact of DG on the Carbonation-Cured Sample

Figure 10c shows that among C1, C4, and C7, C4 had the tightest structure among the three samples, which is consistent with the highest strength of the C4 sample in Figure 4.
Figure 11 shows the hydration and carbonation mechanisms of the SS in the presence and absence of DG. The reasons for increasing strength in the presence of DG are as follows:
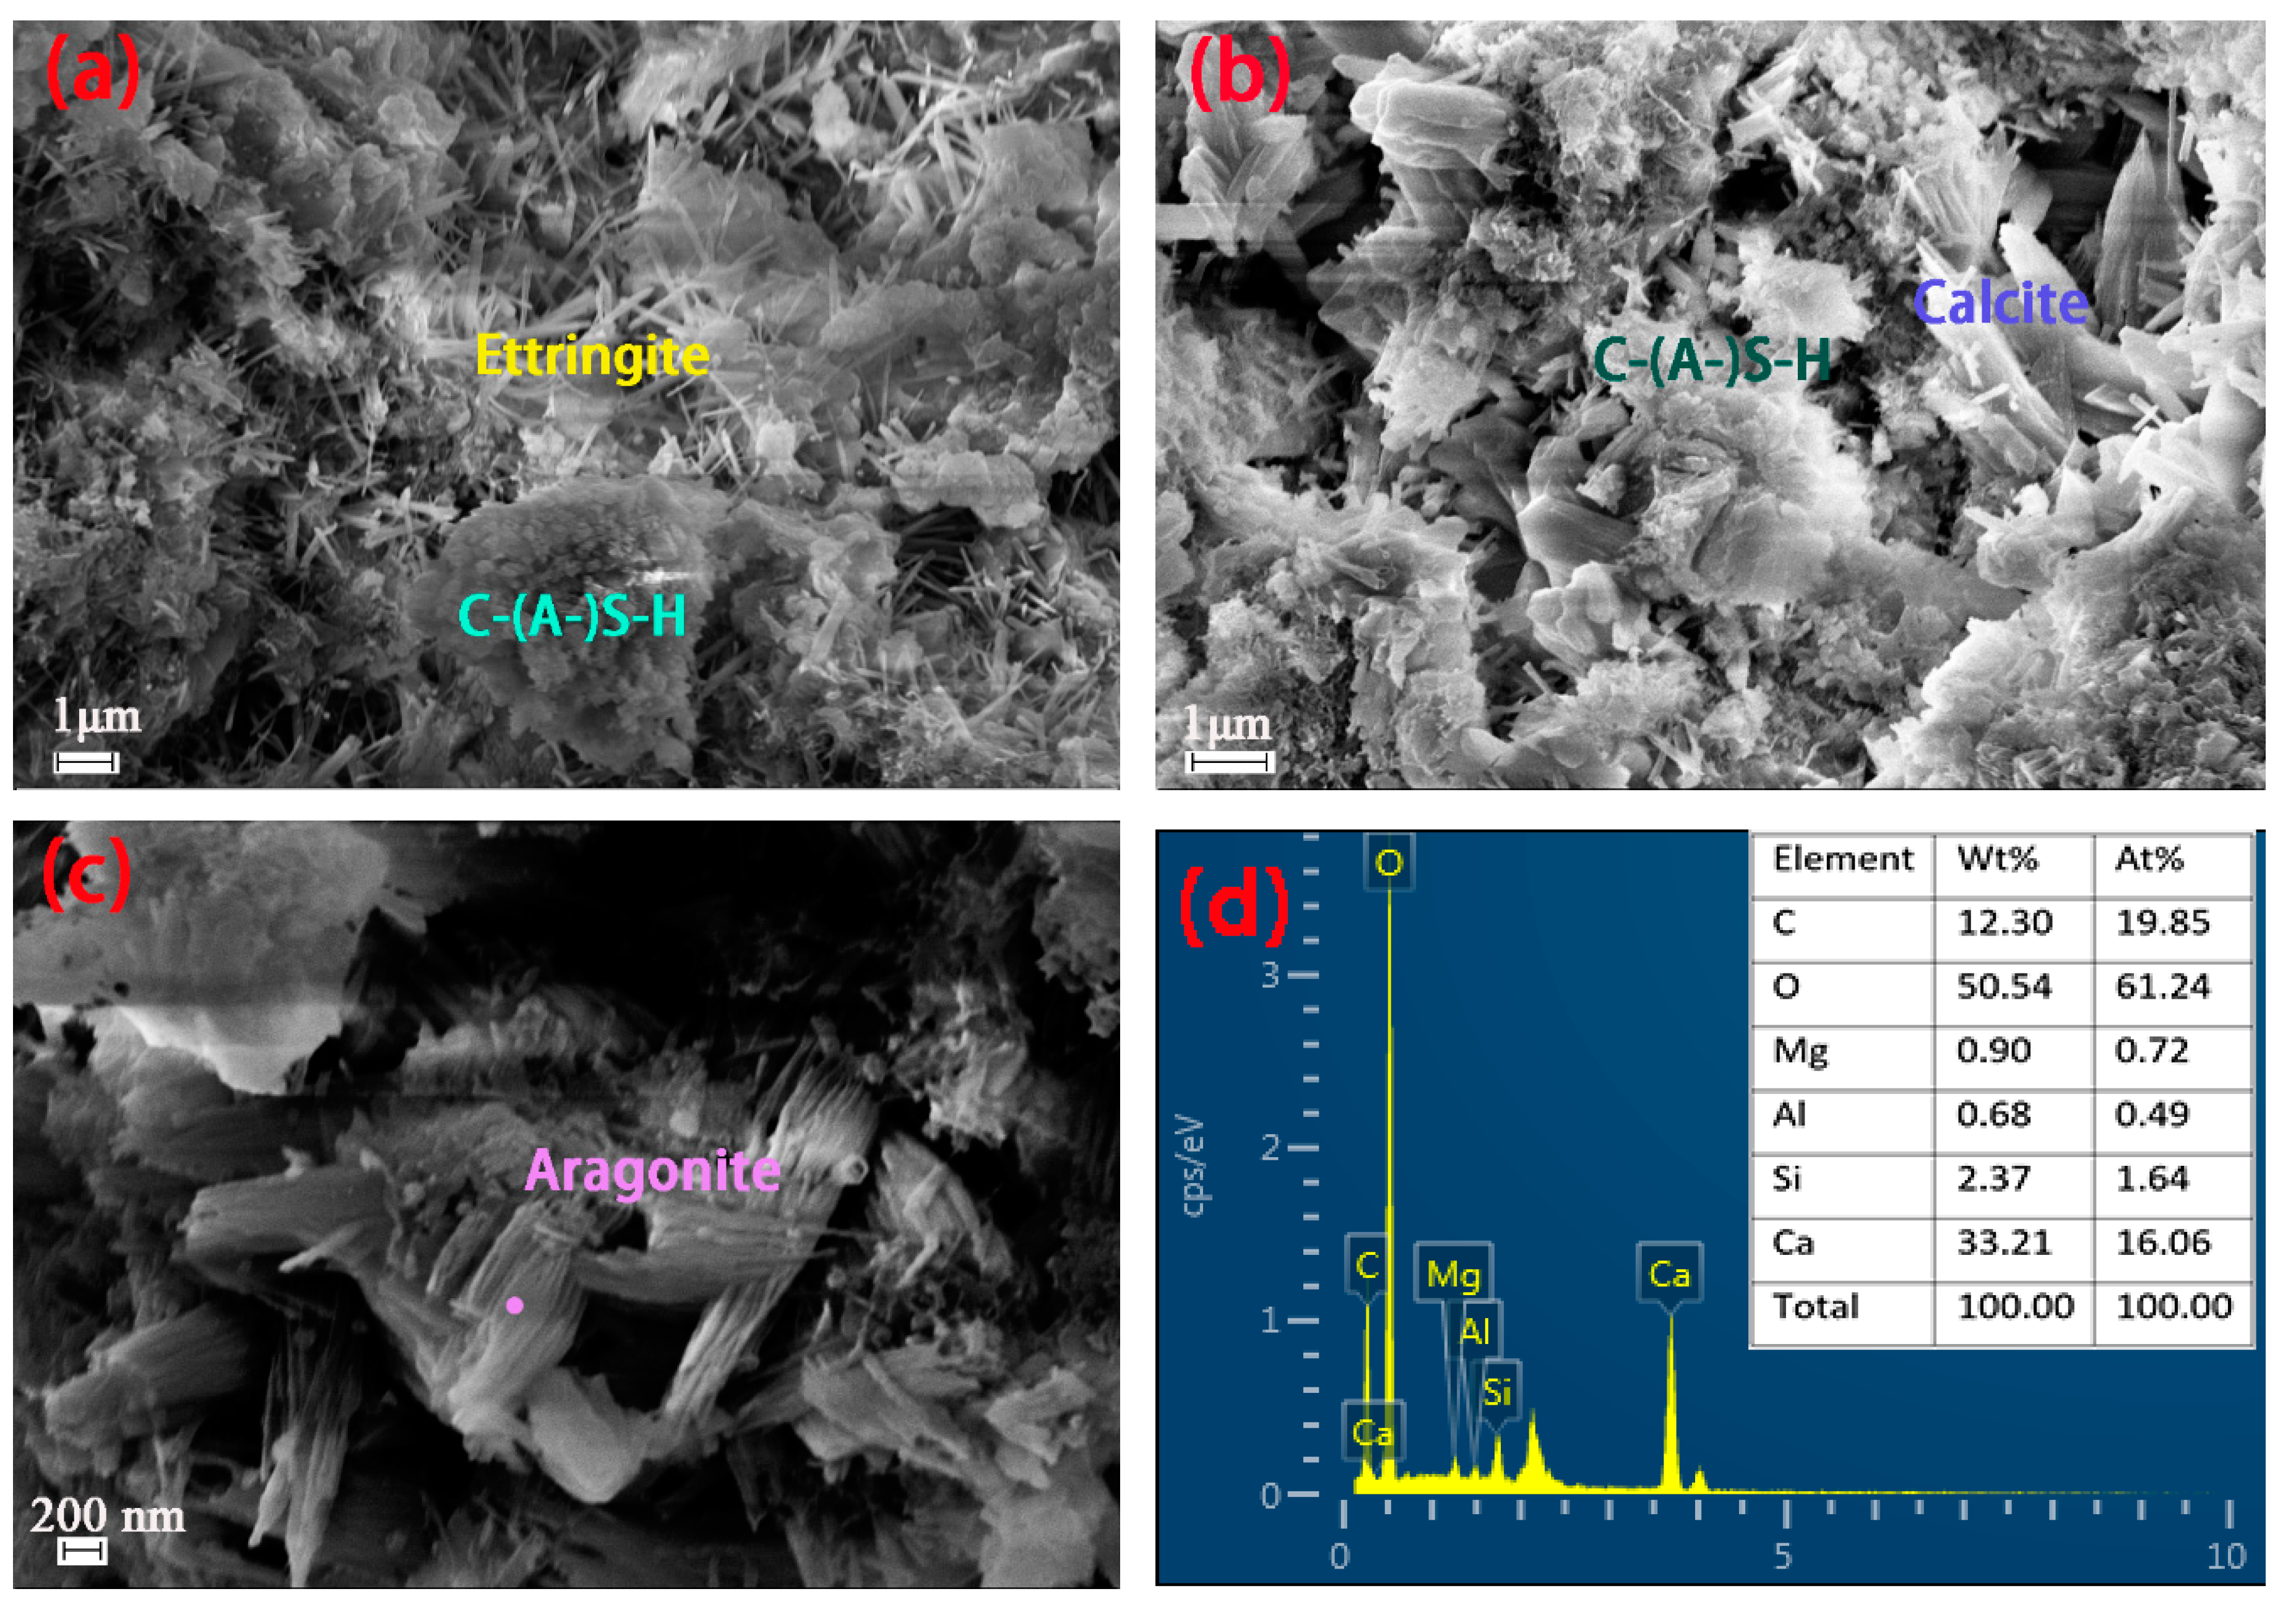
  • The formation of ettringite during hydration helps considerably decrease the pore volume, providing a denser matrix for carbonation (Figure 10c,d).
  • Aragonite, which was formed abundantly in the C1 sample (Figure 6 and Figure 7, and Figure S2), has weaker physical characteristics when compared with calcite, making C1 relatively weak. The elastic modulus values of calcite and aragonite have been reported as 6–41 GPa and 2–34 GPa, respectively [36]. Calcite is also more stable than aragonite.
  • Monocarboaluminate (Mc), mainly forms in DG-containing carbonated samples, fills large pores, and might contribute to the increased strength.
Although C7 had a relatively high DG content, it had a relatively loose structure and relatively low strength, possibly since gypsum was re-released into the system during the ettringite carbonation process (Figure 6 and Figure 9). Therefore, less gypsum is needed in carbonation-cured SS blocks than in hydration-cured SS.
The appropriate addition of DG (6 wt% in this study) increased not only the strength of carbonation-cured samples but also the CO2 uptake of the samples. In other words, DG helped markedly in activating the carbon reactivity of SS. The main minerals that were activated are very likely to be C3A and mayenite, which readily react with gypsum to form ettringite with very low solubility (Ksp = 10−111.6). This result is in line with the QXRD results (Figure 7), SEM images (Figure 8), and TG results (Figure 9).

4.5. Impact of w/s Ratio on Carbonation Curing Blocks

The UCS values of C4-28d, C5-28d, and C6-28d were 42.68, 27.68, and 23.93 MPa, respectively. The strength results show a negative relationship with the w/s ratio, which is in agreement with the pore analysis results (Figure 10e,f). A high w/s ratio has a negative effect on the hydration strength of cement-based materials owing to a loosening of structure [37,38]. In this study, the low strength can be attributed to the loose structure of the samples resulting from their high water contents. When it comes to the CO2 uptake, it is clear from Figure 5 that a higher w/s ratio led to higher CO2 uptake in the samples. The reasons might be: (1) A looser structure led to a higher CO2 diffusion rate; (2) a higher amount of water promoted the diffusion of ions such as Ca2+, OH, and CO32−, thus promoting the carbonation reactions.

5. Conclusions

The effects of carbonation curing, DG addition, and w/s ratio on UCS and CO2 uptake, as well as the chemical composition and microstructure, of hydration- or carbonation-cured SS blocks were investigated in this study. The following conclusions can be drawn:
  • Hydration curing promotes the transition of macropores into micropores and the densification of microstructure. The increasing amounts of hydration products, i.e., C-S-H gel, C4AH13, and ettringite, as well as their intertwining, are the main contributors. The addition of DG (within 10 wt%) helps increase the UCS of hydration-cured SS samples mainly through the formation of ettringite, resulting from hydration reactions between C3A, mayenite, and gypsum.
  • Carbonated samples tend to have denser structures and higher strengths than hydrated samples, although the proportion of small pores in the matrix decreased after carbonation.
  • Compared with hydration-cured samples, less DG is required in carbonation-cured SS blocks since gypsum is re-released into the system during the ettringite carbonation process. For carbonation-cured samples, 6 wt% DG yielded the tightest structure, highest strength, and highest CO2 uptake among the three DG contents tested.
  • For carbonated samples, a higher w/s ratio results in lower UCS but higher CO2 capture. When the w/s ratio was 0.3, the DG content was 6 wt%. A 28-days carbonation-cured SS reached a CO2 uptake of 19.12%, and a UCS value of 42.68 MPa, which meets the strength requirement for blocks.

Supplementary Materials

The following are available online at https://www.mdpi.com/article/10.3390/en14165174/s1. Figure S1: QXRD analysis results for (a) U4-28d; (b) C4-28d; (c) C7-28d; Figure S2: Results of FTIR analysis at 28 d; Figure S3: XPS analysis results of samples: (a) Si 2p, (b) Al 2p, (c) S 2p.

Author Contributions

Conceptualization, methodology, formal analysis, writing—original draft, X.W.; Supervision, resources, project administration, W.N.; Writing—review and editing, project administration, validation, J.L. and S.Z.; Writing—review and editing, supervision, K.L.; Writing—review and editing, resources, funding acquisition, W.H. All authors have read and agreed to the published version of the manuscript.

Funding

This research was funded by the National Key Research and Development Program of China (2018YFC1900604), China Scholarship Council (201906460050), and the National Natural Science Foundation of China (52004021).

Institutional Review Board Statement

Not applicable.

Informed Consent Statement

Not applicable.

Data Availability Statement

The data that support the findings of this study are available from the corresponding author, upon reasonable request.

Acknowledgments

We especially want to thank Mei Zhang for the support in carbon content measurement. We also want to thank the editor and reviewers for their careful work and thoughtful suggestions that have helped improve this paper substantially.

Conflicts of Interest

The authors declare no conflict of interest. The funders have no role in the design of the study; in the collection, analyses, or interpretation of data; in the writing of the manuscript, or in the decision to publish the result.

References

  1. Wang, J.; Xu, H.; Xu, D.; Du, P.; Zhou, Z.; Yuan, L.; Cheng, X. Accelerated carbonation of hardened cement pastes: Influence of porosity. Constr. Build. Mater. 2019, 225, 159–169. [Google Scholar] [CrossRef]
  2. Pan, S.Y.; Chang, E.E.; Chiang, P.C. CO2 capture by accelerated carbonation of alkaline wastes: A review on its principles and applications. Aerosol Air Qual. Res. 2012, 12, 770–791. [Google Scholar] [CrossRef]
  3. den Elzen, M.; Meinshausen, M. Meeting the EU 2 °C climate target: Global and regional emission implications. Clim. Policy 2006, 6, 545–564. [Google Scholar] [CrossRef]
  4. Ukwattage, N.L.; Ranjith, P.G.; Li, X. Steel-making slag for mineral sequestration of carbon dioxide by accelerated carbonation. Meas. J. Int. Meas. Confed. 2017, 97, 15–22. [Google Scholar] [CrossRef]
  5. Song, Q.; Guo, M.Z.; Wang, L.; Ling, T.C. Use of Steel Slag as Sustainable Construction Materials: A Review of Accelerated Carbonation Treatment. Available online: https://n.ustb.edu.cn/https/77726476706e69737468656265737421e7e056d234336155700b8ca891472636a6d29e640e/science/article/pii/S0921344921003499 (accessed on 9 August 2021).
  6. Pu, Y.; Li, L.; Wang, Q.; Shi, X.; Luan, C.; Zhang, G.; Fu, L.; El-Fatah Abomohra, A. Accelerated Carbonation Technology for Enhanced Treatment of Recycled Concrete Aggregates: A State-of-the-Art Review. Available online: https://n.ustb.edu.cn/https/77726476706e69737468656265737421e7e056d234336155700b8ca891472636a6d29e640e/science/article/pii/S0950061821004311 (accessed on 9 August 2021).
  7. Xiong, Y.; Aldahri, T.; Liu, W.; Chu, G.; Zhang, G.; Luo, D.; Yue, H.; Liang, B.; Li, C. Simultaneous preparation of TiO2 and ammonium alum, and microporous SiO2 during the mineral carbonation of titanium-bearing blast furnace slag. Chin. J. Chem. Eng. 2020, 28, 2256–2266. [Google Scholar] [CrossRef]
  8. Monasterio-Guillot, L.; Alvarez-Lloret, P.; Ibañez-Velasco, A.; Fernandez-Martinez, A.; Ruiz-Agudo, E.; Rodriguez-Navarro, C. CO2 sequestration and simultaneous zeolite production by carbonation of coal fly ash: Impact on the trapping of toxic elements. J. CO2 Util. 2020, 40, 101263. [Google Scholar] [CrossRef]
  9. Wang, X.; Ni, W.; Li, J.; Zhang, S.; Hitch, M.; Pascual, R. Carbonation of steel slag and gypsum for building materials and associated reaction mechanisms. Cem. Concr. Res. 2019, 125, 105893. [Google Scholar] [CrossRef]
  10. Zhang, D.; Ghouleh, Z.; Shao, Y. Review on Carbonation Curing of Cement-Based Materials. Available online: https://n.ustb.edu.cn/https/77726476706e69737468656265737421e7e056d234336155700b8ca891472636a6d29e640e/science/article/pii/S2212982017302524 (accessed on 9 August 2021).
  11. Huijgen, W.J.J.; Comans, R.N.J.; Witkamp, G.J. Cost evaluation of CO2 sequestration by aqueous mineral carbonation. Energy Convers. Manag. 2007, 48, 1923–1935. [Google Scholar] [CrossRef] [Green Version]
  12. Huijgen, W.J.J.; Witkamp, G.J.; Comans, R.N.J. Mineral CO2 sequestration by steel slag carbonation. Environ. Sci. Technol. 2005, 39, 9676–9682. [Google Scholar] [CrossRef]
  13. Yu, J.; Wang, K. Study on characteristics of steel slag for CO2 capture. Energy Fuels 2011, 25, 5483–5492. [Google Scholar] [CrossRef]
  14. Chang, E.E.; Pan, S.Y.; Chen, Y.H.; Chu, H.W.; Wang, C.F.; Chiang, P.C. CO2 sequestration by carbonation of steelmaking slags in an autoclave reactor. J. Hazard. Mater. 2011, 195, 107–114. [Google Scholar] [CrossRef]
  15. Palacios, M.; Puertas, F. Effect of carbonation on alkali-activated slag paste. J. Am. Ceram. Soc. 2006, 89, 3211–3221. [Google Scholar] [CrossRef]
  16. Sun, Y.; Yao, M.S.; Zhang, J.P.; Yang, G. Indirect CO2 mineral sequestration by steelmaking slag with NH4Cl as leaching solution. Chem. Eng. J. 2011, 173, 437–445. [Google Scholar] [CrossRef]
  17. Jiang, Y.; Ling, T.C.; Shi, C.; Pan, S.Y. Characteristics of steel slags and their use in cement and concrete—A review. Resour. Conserv. Recycl. 2018, 136, 187–197. [Google Scholar] [CrossRef]
  18. Fisher, L.V.; Barron, A.R. The recycling and reuse of steelmaking slags—A review. Resour. Conserv. Recycl. 2019, 146, 244–255. [Google Scholar] [CrossRef] [Green Version]
  19. Ghouleh, Z.; Guthrie, R.I.L.; Shao, Y. High-strength KOBM steel slag binder activated by carbonation. Constr. Build. Mater. 2015, 99, 175–183. [Google Scholar] [CrossRef]
  20. Quaghebeur, M.; Nielsen, P.; Horckmans, L.; Van Mechelen, D. Accelerated carbonation of steel slag compacts: Development of high-strength construction materials. Front. Energy Res. 2015, 3, 52. [Google Scholar] [CrossRef]
  21. Liu, G.; Schollbach, K.; van der Laan, S.; Tang, P.; Florea, M.V.A.; Brouwers, H.J.H. Recycling and utilization of high volume converter steel slag into CO2 activated mortars—The role of slag particle size. Resour. Conserv. Recycl. 2020, 160, 104883. [Google Scholar] [CrossRef]
  22. Dubina, E.; Plank, J.; Black, L. Impact of water vapour and carbon dioxide on surface composition of C3A polymorphs studied by X-ray photoelectron spectroscopy. Cem. Concr. Res. 2015, 73, 36–41. [Google Scholar] [CrossRef]
  23. Zhang, Y.; Zhang, S.; Ni, W.; Yan, Q.; Gao, W.; Li, Y. Immobilisation of high-arsenic-containing tailings by using metallurgical slag-cementing materials. Chemosphere 2019, 223, 117–123. [Google Scholar] [CrossRef]
  24. Kong, Y.; Wang, P.; Liu, S. Microwave pre-curing of Portland cement-steel slag powder composite for its hydration properties. Constr. Build. Mater. 2018, 189, 1093–1104. [Google Scholar] [CrossRef]
  25. Du, Y.P.; Chang, H.H.; Yang, S.Y.; Huang, S.J.; Tsai, Y.J.; Huang, J.J.T.; Chan, J.C.C. Study of binding interaction between Pif80 protein fragment and aragonite. Sci. Rep. 2016, 6, 1–10. [Google Scholar] [CrossRef]
  26. Scrivener, K.; Snellings, R.; Lothenbach, B. (Eds.) A Practical Guide to Microstructural Analysis of Cementitious Materials; CRC Press: Boca Raton, FL, USA, 2018. [Google Scholar]
  27. Chang, J.; Xiong, C.; Zhang, Y.; Wang, D. Foaming characteristics and microstructure of aerated steel slag block prepared by accelerated carbonation. Constr. Build. Mater. 2019, 209, 222–233. [Google Scholar] [CrossRef]
  28. Jovanovski, G.; Stefov, V.; Šoptrajanov, B.; Boev, B. Minerals from Macedonia. IV. Discrimination between some carbonate minerals by FTIR spectroscopy. Neues Jahrb. Mineral. Abh. 2002, 177, 241–253. [Google Scholar] [CrossRef]
  29. Dubina, E.; Black, L.; Sieber, R.; Plank, J. Interaction of water vapour with anhydrous cement minerals. Adv. Appl. Ceram. 2010, 109, 260–268. [Google Scholar] [CrossRef]
  30. Dubina, E.; Sieber, R.; Plank, J.; Black, L. Effects of pre-hydration on hydraulic properties on Portland cement and synthetic clinker phases. In Proceedings of the Cement and Concrete Science, Manchester, UK, 15–16 September 2008. [Google Scholar]
  31. Comans, R.N.J.; Eighmy, T.T.; Shaw, E.L. Reference spectra for environmentally important secondary minerals: Ettringite (Ca6Al2(SO4)3(OH)1226H2O) by XPS. Surf. Sci. Spectra 1996, 4, 150–156. [Google Scholar] [CrossRef]
  32. Muller, A.C.A.; Scrivener, K.L. A reassessment of mercury intrusion porosimetry by comparison with 1H NMR relaxometry. Cem. Concr. Res. 2017, 100, 350–360. [Google Scholar] [CrossRef]
  33. Pizzol, V.D.; Mendes, L.M.; Frezzatti, L.; Savastano, H.; Tonoli, G.H.D. Effect of accelerated carbonation on the microstructure and physical properties of hybrid fiber-cement composites. Miner. Eng. 2014, 59, 101–106. [Google Scholar] [CrossRef]
  34. Omikrine Metalssi, O.; Aït-Mokhtar, A.; Turcry, P.; Ruot, B. Consequences of carbonation on microstructure and drying shrinkage of a mortar with cellulose ether. Constr. Build. Mater. 2012, 34, 218–225. [Google Scholar] [CrossRef]
  35. Constantinides, G.; Ulm, F.J. The nanogranular nature of C-S-H. J. Mech. Phys. Solids 2007, 55, 64–90. [Google Scholar] [CrossRef]
  36. Ševčík, R.; Šašek, P.; Viani, A. Physical and nanomechanical properties of the synthetic anhydrous crystalline CaCO3 polymorphs: Vaterite, aragonite and calcite. J. Mater. Sci. 2018, 53, 4022–4033. [Google Scholar] [CrossRef]
  37. Yang, J.; Wang, F.; He, X.; Su, Y. Pore structure of affected zone around saturated and large superabsorbent polymers in cement paste. Cem. Concr. Compos. 2019, 97, 54–67. [Google Scholar] [CrossRef]
  38. Bodor, E.E.; Skalny, J.; Brunauer, S.; Hagymassy, J.; Yudenfreund, M. Pore structures of hydrated calcium silicates and portland cements by nitrogen adsorption. J. Colloid Interface Sci. 1970, 34, 560–570. [Google Scholar] [CrossRef]
Figure 1. Hydration and in situ flue gas carbonation curing of SS for building materials, together with known reaction mechanisms.
Energies 14 05174 g001
Figure 2. Images of SS (a) and DG (b) used in the study, and X-ray diffraction patterns for the SS (c) and DG (d).
Energies 14 05174 g002
Figure 3. Particle size distributions of the SS and DG.
Energies 14 05174 g003
Figure 4. Compressive strength results. (a) Comparison between the air-cured and carbon-cured samples, (b) all of the carbon-cured samples.
Energies 14 05174 g004
Figure 5. Carbonation depth (a) and CO2 uptake (b) results of samples.
Energies 14 05174 g005
Figure 6. XRD patterns of the samples after 28 days of curing.
Energies 14 05174 g006
Figure 7. QXRD mineral analysis result for samples (Mc: Monocarboaluminate).
Energies 14 05174 g007
Figure 8. SEM images of the U4 (a), C4 (b), and C1 (c) samples at 28 days of curing. (d) EDS result for the point shown in (c).
Energies 14 05174 g008
Figure 9. TG–DTG analysis of samples: (a) TG, (b) DTG (Cc: Calcite; Arg: Aragonite; Gyp: Gypsum; AFt: Ettringite; CH: Portlandite; Mc: Monocarboaluminate).
Energies 14 05174 g009
Figure 10. PSD curves and cumulative pore volume curves of the hydration-cured and carbonation-cured samples; (a,b): U4 at different curing ages; (c,d): U1, U4, U7, C1, C4, and C7 at 28 days; (e,f): C4, C5, and C6 at 28 days.
Energies 14 05174 g010
Figure 11. Hydration and carbonation mechanisms of SS in the presence and absence of DG (H: Hydration; C: Carbonation).
Energies 14 05174 g011
Table 1. Chemical compositions of the SS and DG (wt%).
Chemical
Compositions
SSGypsumMineral
Compositions
Chemical
Formula
SS
CaO44.7848.06LarniteCa2SiO420.18
Fe2O322.430.58RO phase(Fe, Mg, Mn)O18.13
SiO215.282.95SrebrodolskiteCa2Fe2O515.09
MgO7.041.48PortlanditeCa(OH)214.31
Al2O35.701.18MayeniteCa12Al14O3310.31
MnO1.931.18HatruriteCa3SiO510.27
P2O51.000.03MagnesiteMgCO36.30
TiO20.860.39C3ACa3Al2O53.00
SO30.3043.57CalciteCaCO32.41
V2O50.20--
Cr2O30.17--
Others0.280.58
Total C0.8650.737
Table 2. Mix proportions and curing conditions of the samples.
SampleCuring ConditionDG/s (wt%)SS/s (wt%)w/s Mass Ratio
U1Air-curing01000.30
U4Air-curing6940.30
U7Air-curing10900.30
C1Carbon-curing01000.30
C2Carbon-curing01000.35
C3Carbon-curing01000.40
C4Carbon-curing6940.30
C5Carbon-curing6940.35
C6Carbon-curing6940.40
C7Carbon-curing10900.30
C8Carbon-curing10900.35
C9Carbon-curing10900.40
Note: W/s mass ratio means water/solid mass ratio; s means solid (DG + SS).
Publisher’s Note: MDPI stays neutral with regard to jurisdictional claims in published maps and institutional affiliations.

