Article

Analysis of Changes in Natural Gas Physical Flows for Europe via Ukraine in 2020

Faculty of Mining, Geology and Petroleum Engineering, University of Zagreb, Pierottijeva 6, 10000 Zagreb, Croatia
*
Author to whom correspondence should be addressed.
Energies 2021, 14(16), 5175; https://doi.org/10.3390/en14165175
Submission received: 19 July 2021 / Revised: 9 August 2021 / Accepted: 20 August 2021 / Published: 21 August 2021
(This article belongs to the Special Issue Advances in Natural Gas Engineering)

Abstract

:
The main objective of the paper was comparative analyses of natural gas quantities delivered through the existing pipeline capacities in the last decade and new pipeline capacities for the prediction of possible future flows of gas import to Europe. Changes in physical flows have been influenced by European energy strategies that became green oriented resulting with a high amount of non-utilized transmission capacities. The research findings have shown that there is a significant decrease observed in transit of Russian gas through Ukraine in 2020 than previously. Concerning the high increase of LNG import to Europe in the same year, the start of operation of TurkStream, planned start of operation of Nord stream 2, authors project the gradual decrease of transit of Russian gas through Ukraine until the year 2025 with the total stop of transit of Russian gas until the year 2030. The change of supply routes will be also under the economic influence of low gas prices and coal and gas fuel switch until 2030 in the West EU, and after 2030 in the South Eastern European region. In the short-term period transit system for natural gas from Russia via Ukraine will be necessary for supplementing coal with natural gas in the energy mix.

1. Introduction

Complex business and political relations of the Russian Federation and European Union strongly impact activities on the European gas market [1,2,3]. Russia as one of the world’s largest producers and exporters of natural gas experiences significant challenges in maintaining and increasing its natural gas export volumes [4,5]. The pipeline transmission of natural gas from its main production region in Eurasia, the Russian Federation, to its main consumption region, the European Union, is always somehow the central, starting, and ending point of these relations [6,7]. Pipeline transmission of natural gas has been and still is the cheapest way to deliver natural gas over shorter distances from standard production areas to standard consumption areas in the world and there has been very few counterarguments or studies that show differently, hence, major delivery routes via underground pipelines, regardless to growing LNG market shares, will stay similar in the next decade [8,9,10]. Major market movements can be expected only due to large demand or supply disruptions at the global markets, where the price of this commodity on organized markets can reach its peak levels, and therefore, make LNG more competitive in comparison to natural gas delivered by pipelines from the Russian Federation [11,12].
The majority of Russian gas has been delivered to Europe in the last century via pipelines that were built during the former Soviet Union (USSR) era. After the dissolution of the USSR, part of the pipelines belonged to states that were not in direct control of the Russian Federation anymore. Among these states, the majority of the pipeline network belonged to the Republic of Ukraine [13]. That meant that, after some time, Russian Federation needed to somehow negotiate terms under which the commodity will be transmitted from the eastern border of Ukraine to the western border of Ukraine where it would be offtaken from Gazprom by one of the European partners [14,15,16]. Gazprom, as Russian major natural gas producer and supplier has clearly announced its strategic goals which include integrated development of gas transmission system synchronized with expansion of production and storage facilities, implementation of various projects for natural gas export, renovation of existing transport network, preparation of new customers for natural gas reception, construction of new natural gas transport capacities, and diversification of supply routes [17].
As history has shown, these negotiations are every couple of years, the kick start point of game changing events in the world and especially European, Ukrainian, and Russian political and economic relations [7,18,19]. It should be pointed out that analysis by Rodríguez-Fernandez et al. [20] highlighted that security of supply barely improved in the EU-27 between 2005 and 2010, resulting in increased vulnerability to supply interruption risks, but currently it is more on the flexibility side of the supply than it is a security of supply anymore. This paper will show an overview of the last big transmission dispute in 2009, right before the signing of the last 10-year agreement between Russia and Ukraine. Furthermore, the paper analyses the Ukrainian transmission system and bypass pipelines, Nord Stream, Nord Stream 2, and TurkStream. The main research hypothesis is to show that the EU was fully prepared for the potential full cut-off of transit of “Russian gas” via Ukraine from 1 January 2020. To reach the hypothesis authors have put a few research questions. The first one is to which extent will the geopolitical and energy map of Europe change after the full release of North Stream capacity? The second one is what can be concluded after analyzing the historical Russian–Ukrainian disputes and cut-offs of flows via Ukraine and how to use Ukrainian 30 bcm storage facilities to decrease the shortage risk? The third question search for the answer what are the potential outcomes and reality after North Stream 2 and TurkStream are fully operable in terms of security of supply for Europe and survival of the Ukrainian transmission system in its current form? Finally, what do the latest political agreements such as the 2021 Biden–Merkel agreement changes and brings to the involved parties?

2. Historical Deliveries of Natural Gas through Ukraine

Analysis of historical data with evaluated annual flows and peak demands along with Ukrainian storage injections directly indicates the trend and correlation between physical flows of natural gas and trilateral geopolitical relations between the Russian Federation, EU, and Ukraine. Authors consider that with comparing figures of the EU demand for natural gas, its future projections versus the overall supply capacity of physical pipelines and LNG terminals it has been clearly indicated that the Russian Federation has strongly diversified their supplier position with more than sufficient capacity of physical delivery routes.
With further analysis of historical usage of Ukrainian storage facilities and its benefit for the security of supply of EU countries via re-export, the case of injections of natural gas to Ukrainian storage in 2019/2020 clearly indicates the correlation between physical flows, storage injections, and geopolitical stability in this region. However, regardless of the geopolitics, Ukrainian storage capacity amounting to approximately 32 bcm annually can and should be evaluated as a strong and unavoidable factor in Europe energy stability where authors advise increased awareness about the matter.
The main reason why there is so highly developed network of pipelines in Ukraine, besides obvious geographical position on the border of central European countries, is that almost 30% of entire USSR gas during the 1960s and the 1970s of the 20th century was produced in Ukraine, which had a central position in USSR gas industry for decades. During the 1950s gas fields in western Ukraine were the most important in the entire USSR. The production of natural gas from these fields accounted for almost half of the production of the entire Soviet Union, which amounted to about 5–6 billion cubic meters. The peak of production was reached in the late 1960s of the last century, when production from these fields was about 12–13 bcm annually. With such significant production, Ukraine held a leading position in the Soviet Union in terms of natural gas production during the 1960s. The biggest production was in 1975 and amounted to 68.7 bcm, and since then it has gradually decreased until it reached 16–18 bcm annually during the 1990s [13,21].
After the 1980s, the Ukrainian gas transmission system was developed as an export pipeline for Russian gas to Europe. The first Dolyna-Uzhhorod-Western Border gas pipeline became operational in 1967 and was the first phase of the Bratstvo (Brotherhood) pipeline system. Following the development of the gas transportation system in Ukraine, in 1978 the Soyuz gas pipeline was built, which is considered as the first Soviet gas pipeline for the export of natural gas. Subsequently, the Urengoy-Pomary-Uzhhorod was developed in 1983 together with the Progress gas pipeline (Yamburg-Western border) pipeline in 1988. In addition to the above-mentioned gas pipelines, from the end of the 1980s until 2001, the Yelets-Kremenchuk-Ananyiv-Tiraspol-Izmail gas pipeline was developed [22,23].
The significance of the Ukrainian transmission pipelines in natural gas deliveries to Europe over the last decades has been pointed out in Table 1 that shows the import and export capacities of the Ukrainian pipeline network and interconnections, physical deliveries in the period from the year 2009 to the year 2018 and EU 28 demand of natural gas. The result is clear: a ten-year average of almost twenty percent of EU 28 demand was transported from Russia to Europe via Ukraine (Table 1). The most interesting fact is that transmission has continued also in the years after the Ukrainian state owned Naftogaz completely stopped buying natural gas from Gazprom and turned to European trading companies. All this leads to a conclusion that all included sides were benefiting from the deal: Russian federation with the selling of their main export product, Ukraine monetizing state assets for transmission of gas, and European consumers having secured and trustworthy route for its main transitional “clean” hydrocarbon fuel: natural gas [24,25,26].

3. Technical Description of Ukraine Transmission System

Ukrainian gas transmission network consists of more than 37 thousand kilometers of pipelines with 12 entry points from the Russian Federation, Belarus, Poland, Slovakia, and Hungary and 7 main exit points to Russia, Poland, Slovakia, Hungary, Romania, and Moldova (Figure 1, Table 2). Its technical annual entry capacity is approximately 308 billion cubic meters (bcm), and its technical exit capacity is 178 bcm of natural gas. Compared to EU 28 needs for natural gas in the last ten years, which is an average of 458.10 bcm annually, it can be concluded that Ukraine has all the necessary capacitates to provide shipping of almost 40% of Europe’s natural gas demand [13,28].

4. Transmission Dispute in 2009

The dispute over the transport of natural gas between the Russian Federation and Ukraine in January 2009 is certainly the most serious dispute of its kind [6,30,31,32]. Due to the failure to reach an agreement on tariffs for the transport of natural gas through Ukraine to Europe before the previous tariffs expired, the Russian Federation suspended gas exports on 1 January 2009. Natural gas exports were drastically reduced for 16 EU members and Moldova on January 6th, while on January 7th they were completely suspended [33,34]. Exports were re-established for Ukraine and other European countries after the signing of two new ten-year contracts on January 20th. The areas most affected by the crisis were the countries in the Balkans, where it was not possible to heat households in some areas [19,20,35]. In addition, significant economic problems have emerged in Hungary and Slovakia [36,37]. This crisis has had far-reaching consequences for transport systems and the security of natural gas supply in Europe. Russia’s reputation as a safe supplier of natural gas and Ukraine’s reputation as a transit country for natural gas supplies have been severely damaged. This has prompted European countries to consider diversifying natural gas supply routes [19].
Aftermath in a geopolitical sense is summed up by Bocse [38] where she concluded that Russia stopped exporting natural gas to Ukraine in January 2006 and that Ukraine kept 15 percent of the gas in gas pipelines destined for EU members. Gas retention has affected gas supply in Hungary, Austria, Romania, France, and Poland. Disputes over Ukraine’s debt for natural gas supplies are one of the main reasons for the halt in gas exports in January 2009. During those two weeks of suspension of natural gas supplies, Europe experienced one of the most serious energy supply crises that indicated the need to reduce energy dependence on Russia.
The development of the Energy Union concept includes proposals from several interested parties and important documents such as the European Commission, former European Commission President Jean-Claude Juncker, former European Council President Donald Tusk, and comparative analyzes for four EU members representing different energy policies and energy mixes (Germany, France, Poland, and Norway). All these proposals were considered and evaluated according to three dimensions of energy policy, which include security of supply, affordability of energy, and sustainability of growth. The new Vice President of the European Commission, Maroš Šefčović, who was in charge of adopting the new climate policy, proposed his own five dimensions for assessing energy policies (security, solidarity and trust, internal energy market, energy efficiency, decarbonization of the economy, and research, innovation, and competitiveness His commitment and perseverance to Donald Tusk’s initial idea of an Energy Union and a common platform for natural gas trading was met with great resistance from several organizations in the gas sector, and so far Tusk’s idea of breaking Russia’s gas monopoly has not been realized [39].

5. Ukrainian Transmission Bypass Projects

5.1. Nord Stream and Nord Stream 2 projects

In order to develop an additional route for the transport of Russian gas to Europe, construction of the Nord Stream gas pipeline system began in April 2010. This pipeline system was designed as a twin underwater gas pipeline that runs through the Baltic Sea from the city of Vyborg in Russia to Lubmin near the city of Greifswald in Germany [40,41]. The pipeline was built and is operated by Nord Stream AG and passes through the Exclusive Economic Zones of Russia, Finland, Sweden, Denmark, and Germany, as well as the territorial waters of Russia, Denmark, and Germany. This twin gas pipeline is the most direct connection between Russia’s large gas reserves and the European Union’s energy market. The length of this pipeline is 1224 km with a capacity to transport 55 bcm of natural gas per year. As mentioned earlier, the construction of Line 1 began in April 2010 and was completed in June 2011. The transport of natural gas through this line started in mid-November 2011. Construction of Line 2 began in May 2011 and was completed in April 2012. This line is laid parallel to Line 1 and the transport of natural gas through the same began in October 2012 [42]. In addition to the already completed Nord Stream project, the Nord Stream 2 gas pipeline is currently under construction, which is very similar to Nord Stream in its characteristics. This pipeline runs a very similar route as Nord Stream, only with the difference of the starting point from Russia, which in this case is the Ust-Luga, located 110 km west of St. Petersburg [43,44]. The laying of this gas pipeline began in September 2018, and most of the gas pipelines have been placed on the seabed. The capacity of this gas pipeline, as well as Nord Stream, is 55 bcm per year, and after the completion, the total capacity of both pipelines will be 110 bcm per year [45,46,47].

5.2. TurkStream Project

In addition to transporting large quantities of Russian gas to the northern part of Europe via the Nord Stream and Nord Stream 2 pipelines, the TurkStream gas pipeline was put into operation earlier this year in order to provide reliable energy supplies for Turkey, South, and Southeast Europe. This is also an underwater gas pipeline that runs through the Black Sea from the city of Anapa in southwestern Russia to the town of Kiyikoy in western Turkey. This 930 km long gas pipeline consists of two lines with a total capacity of 31.5 bcm per year. Each of the two lines has a capacity of 15.75 bcm per year and the first line is intended for the delivery of gas to Turkey, while the second line is intended for the transit of gas to southern and southeastern Europe through Turkish territory [48,49]. Following the cancelation of the South Stream project in 2014, this pipeline has become an alternative to bringing Russian gas to Turkey and Southeast Europe. Moreover, the construction of this pipeline further strengthens the strategic importance of Turkey as a country that connects the two continents and contributes to Turkey’s goal to become an international physical hub and transit corridor for natural gas [50,51,52].

5.3. What Happens after Projects Are Fully Operative?

Nord Stream currently operates in full capacity and Nord Stream 2 is being postponed every now and then, with often changes of construction operators and other service providers, mainly due to political issues such as embargoes banning European and American companies to work on the project. Once the Nord Stream 2 is completed, the total capacity of both pipelines will be 110 bcm per year. TurkStream has been opened in January 2020 and operates only in an estimated half of capacity which doubles from 15.75 to 31.5 bcm per year after and if the second pipe becomes operative. Cumulative, that means that two projects that are just to be operational, will increase supply capacity of non-Ukraine transit routes, bringing the commodity to Germany and Turkey as Europe main consumers of Russian gas along with Italy, potentially, additional 141.5 bcm annually which rises Ukraine concern about monopoly issues and using these project as political tools. From the current “time of view”, Russia has already invested the necessary funds into the projects and has diversified its supplier position and strengthen its shipper position in order to be able to choose which route of delivery is more convenient for use. At the same time, Ukraine is, without any prejudges, forced to change a huge number of internal organizations, including the transmission system itself, which own current organization and operation are questionable without transit quantities from Russia. On the other hand, Sauvageot [53] suggested that the suitability of full use of Nord Stream and the construction of a downsized version of South Stream are not sufficiently taken into account despite the advantages in terms of energy security and price competitiveness in the future. In the end, Ukraine’s western supply corridor delivers the majority of gas to Slovakia, Austria, and Italy, and southern Ukraine supply corridor was delivering the majority of gas to Romania, Bulgaria, and Turkey. At the same time, Nord Stream 2 will deliver gas to Germany, after which will flow to Austria, Italy, and the Czech Republic, and Slovakia, and TurkStream has already cut Romanian transit for Turkey from 1 January 2020. Stulberg [6] suggested that with the development of the Southern Gas Corridor, Gazprom’s social capital (goodwill, knowledge sharing, and collective understanding) would be greatly challenged. Unlike Gazprom, Azerbaijan’s national energy company SOCAR has significant social capital in the sub-region despite the fact that the projection of delivered natural gas volumes is quite small. Most of this capital comes from corporate connections and trustworthy connections with prominent Italian companies. In the end, is not it logical for Russia to start with utilization of its new pipelines as soon as possible opposite to pay large amounts of money for transit to third parties?

6. EU Gas Storages Injections in Summer 2019

European Gas Shipper’s Preparation for Potential Cut-Off of Russian Transit via Ukraine after 1 January 2020

As the expiration time of the old transit contract between Russia and Ukraine was approaching, all European shippers were preparing for different scenarios to ensure the security of supply for winter 2020/2021 for their portfolios. The most reasonable actions were to maximally diversify their purchase and to inject as much natural gas in underground gas storages, with some reasonable and sustainable economic benefit. How close did exactly was Ukraine from transit cut-off can be concluded from data regarding stored gas in European and Ukrainian storages in the summer of 2019 which represent the absolute historical peak record of the amount of gas stored in EU and Ukraine gas storages. According to the aggregated gas storage inventory publication by GIE, the peak of stored amounts of gas in summer 2019 in EU 28 + Ukraine storages was on 27 October 2019 amounting total of 1312.087 TWh or approximately 134.31 bcm (Figure 2).
Reports have shown that historically gas storages were filled to the highest level on April 1st in 2019. Reported data have shown 614 TWh of injected gas. This is actually less injected gas than the year before when these levels amounted to 695 TWh, but when starting levels of gas in storages (prior to injection period) are compared, it was 447 TWh in 2019 versus 190 TWh in 2018 so it could be concluded that 2019 was a record high.
In terms of absolute volumes of natural gas in the storages of each country in the European Union, most of the stored gas was placed in Germany, France, Italy, and Netherland. When observing the relative availability of free storage volume on October 1st, as shown in Figure 3, it can be concluded that the storage volume at the EU level was over 97 percent of the technical storage capacity.

7. Discussion—Changes in Total Physical Transit via Ukraine in 2020

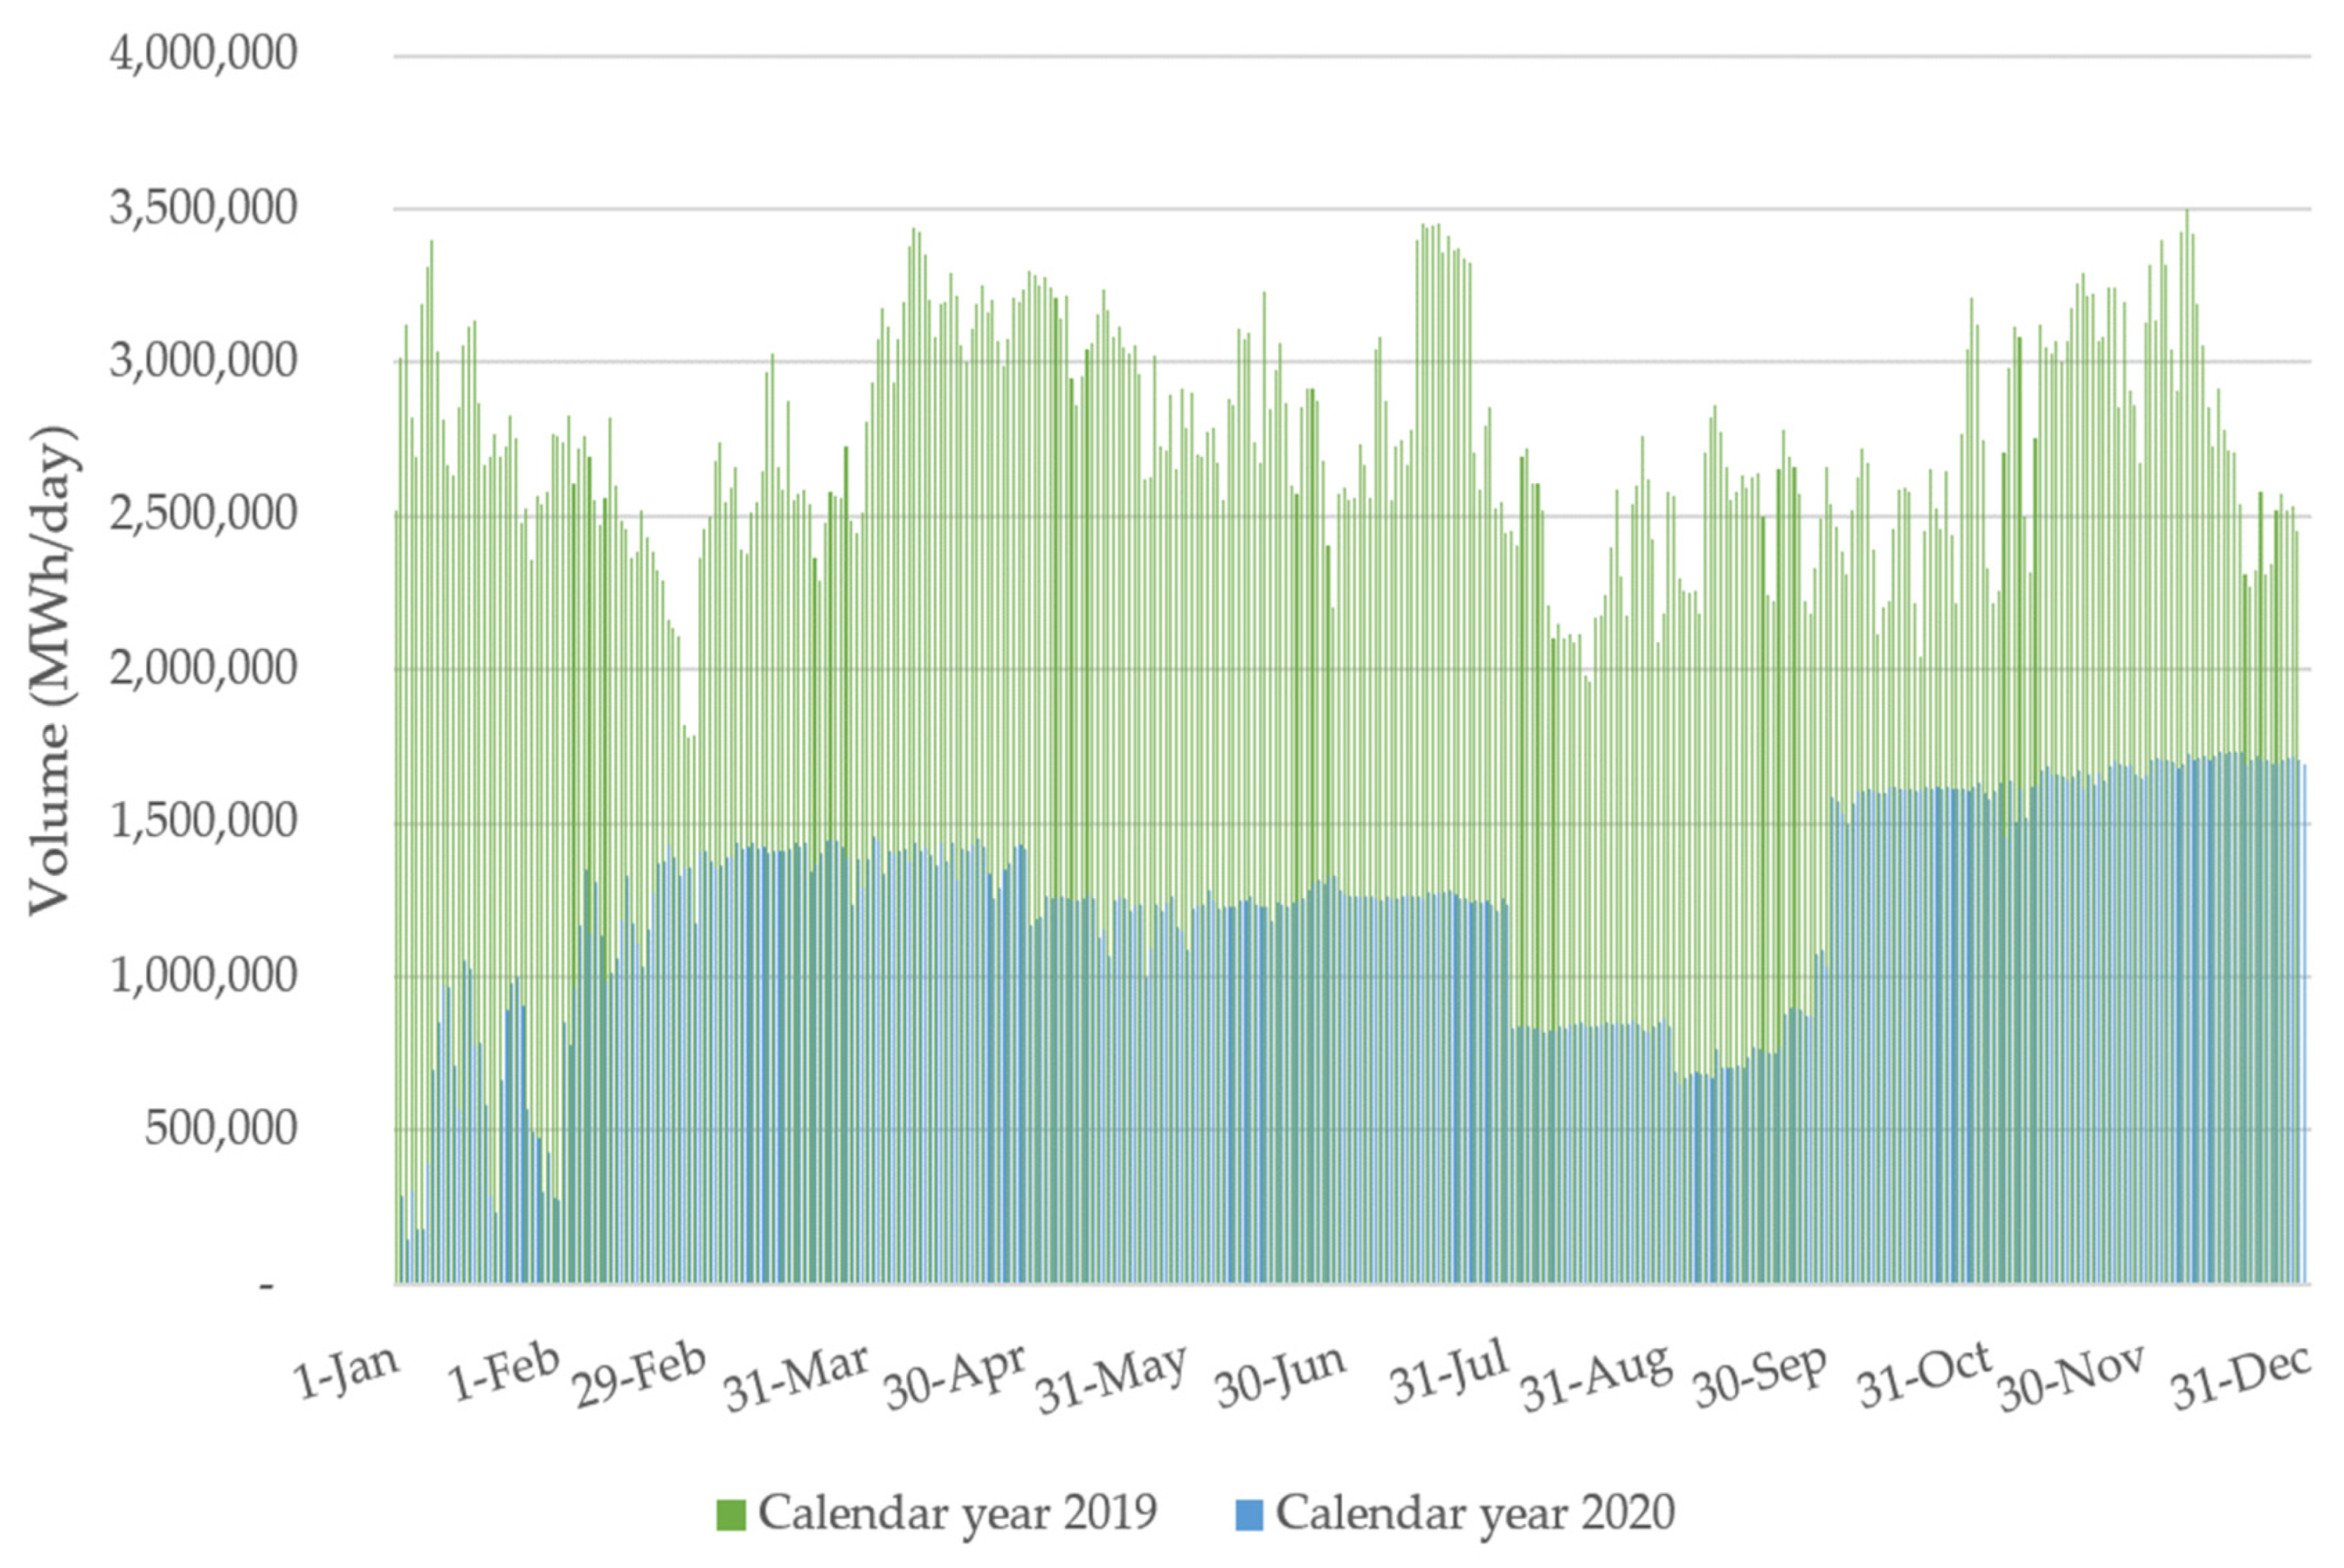
In March 2020, the Gas Transmission system operator (TSO) of Ukraine provided transportation of 4.6 bcm of natural gas to the EU and Moldova. This is 18% more than the previous month and 36% or 2.6 bcm less than the same month year before. As a result of twelve months of 2020, gas transit through the Ukrainian gas transport system amounted to 42.83 bcm. That is 54.8% less than in the same period last year. Transit volumes decreased by twice compared to the average annual value for 2014–2019. However, since the beginning of 2020, transit capacities from the Russian Federation are fully paid by Gazprom for the specified period under the new transit contract and are equal to 65 bcm per year (or 0.178 bcm per day). Additionally, in the first quarter of this year, a new short-haul service was launched from the new Ukrainian TSO. It enables customers to order gas transit between EU countries through the Ukrainian transmission system. In March, Gas TSO of Ukraine had already transited the first volumes of gas on the Hungary-Slovakia route. In total, January–March 2020, 9.8 bcm of gas was transited in the western direction. That is 7.2 bcm or 42% less than the results of the same period a year earlier (Figure 4). In the Southern (Balkan) direction, the transit has decreased by 70% to 1.2 bcm of gas since the beginning of 2020. In particular, the transit to Romania via gas metering station (GMS) Orlovka amounted to 0.3 bcm which represents a 90% of decrease, to Moldova 0.9 bcm which is a 10% decrease. The decrease in transit volumes through the Trans-Balkan corridor is largely due to the launch of the TurkStream pipeline [56].
So far, due to the transit agreement between the Russian Federation and the Republic of Ukraine, the Ukrainian side has been paid according to full ship or pay deal where the Russian side has been obliged to either ship or pay the full amount for transmission of 65 bcm of natural gas for 2020, and 40 bcm annually for the period of 2021–2024. The deal also included the payment of USD 2.918 billion in compensation that Gazprom is required to pay to the Ukrainian side. The payment of this compensation closed the arbitration processes between Gazprom and Ukraine side from December 2017 and February 2019, for which a final decision has not yet been made. Furthermore, all Gazprom‘s assets, funds, and monetary funds were released and future claims to contracts signed in January 2009 were prevented. After the release of the information on contract signing, there were no major market movements visible, and none of the major reporting and commodity trading news portals have referred to the deal as a long-waited relief. Meaning that the capacities of bypass interconnections and capacities in western Ukrainian gas storages were sufficient to cover the EU demand. Comparative analyses of monthly and quarterly physical flows on exit points from the transmission system of Ukraine in 2019 and 2020 are shown in Table 3, Table 4, Table 5 and Table 6.

7.1. Ukraine to Poland Interconnector Flows Analysis—Drozdovichi: Ukraine to Poland Interconnection

The Polish transmission system is connected with German, Belarus, and Czech transmission systems from which Germany and the Czech Republic are being supplied physically with natural gas from Poland. Both mentioned countries have a highly diversified supply of natural gas, local underground storage facilities, and reverse flow interconnections. When observing the historical physical flows of the Ukrainian–Polish interconnection, it is visible a stable annual flow of approximately 3.8 bcm of natural gas with an even growth rate from 2014 up to 2017 (Table 7). However, analysis of 2020 versus 2019 physical flow data shows a decrease of almost 28% in delivered natural gas when comparing the 41 969.48 GWh delivered in 2019 to only 30 281.72 GWh delivered in 2020.

7.2. Ukraine to Slovakia Interconnector Flows Analysis: Velke Kausany—Ukraine to Slovakia Interconnection

Velke Kapusany has been and still is the major European import interconnection for natural gas from Ukraine. The slovakian transmission system is neighboring Czech, Austrian and Hungarian ones, and most of the natural gas imported on Velke Kapusany is being transported further to Baumgarten hub in Austria, ending via Tarvisio interconnection on the highly demandable Italian market. Historical annual peaks between 55 and 57 bcm of imported natural gas on Velke Kapusany are not likely going to be seen anytime more (Table 8). 2020 quantities have shown a decrease of almost 38% in comparison to 2019.

7.3. Ukraine to Hungary Interconnector Flows Analysis: Beregovo—Ukraine to Hungary Interconnection

Flow at Beregovo interconnection was mostly increasing in the last 5 years (Table 9), and this year it was the one with the least reduced transmission over the evaluated period. Its quarterly decrease from 25,890.82 GWh in Q1 2019 to 17,825.04 GWh in Q1 2020 ends with a 31.15% lower result. The result of such a decrease is due to the fact that it is likely that only Hungary, Croatia, and Serbia are partially purchasing natural gas over the Beregovo interconnection and the sufficient amount of natural gas in oversized Hungarian underground storages. Further change is possible in near future, with announced interconnections between Bulgaria, Serbia, and Hungary which are going to be supplied via the TurkStream route. There would be no surprises when Beregovo interconnection would be more in use to ship gas to Ukraine from Hungary, than vice versa. End of the year result has increased this number even further where a total of 70.121 TWh of natural gas was injected from the Ukrainian to the Hungarian system. That counts for a decrease of 55.12% on a year to year basis.

7.4. Ukraine to Romania Interconnector Flows Analysis: Isaccea/Orlovka—Ukraine to Romania Interconnection

The last interconnection in this analysis is also “the first victim” of previously mentioned Ukraine bypass projects and is an excellent benchmark for observation and conclusions for the future of Ukrainian transmission of Russian gas towards its buyers in Europe (Table 10). Isaccea/Orlovka interconnection, historically bringing Russian gas to Romania, Bulgaria, Greece, Moldova, and biggest regional customer, Turkey, has been totally shut down at the start of January 2020. Total shipped and imported quantity decrease in comparison to the same period in 2019 values 94.77% decrease in January, 90.72% in February, 96.11% in March, and a total decrease of 94.29% in Q1 2020. Romania as an almost net exporter rather than an importer of natural gas is covered, but from January 2020, imported Russian natural gas for Turkey, Bulgaria, and Greece is not passing any more through Ukraine but via TurkStream. The total annual comparison of flows ends with such results: flow on Isaccea in 2019 equal to 106.877 GWh and flow in 2020 equal to 7235.93 GWh. A total decrease of 92.73 %.
Transmission of Russian gas via Ukraine was stabilized during the rest of 2020, especially in the last quarter of 2020 and aftermath in certain quantities until the full operability of Nord Stream 2 project will not be familiar. Ukraine being a large market of natural gas itself, with import demand between 10 and 15 bcm annually and with more than 30 bcm of storage capacities, will still exist on the European natural gas map as an important factor, but will have to be ready for fast changes of the entire national gas market and potentially highly prepared for the increase of its own production. According to the Ukrainian government, the shale gas field Yuzivska contains approximately 86 to 100 bcm of natural gas. The optimistic scenario drawn up before the armed conflict in eastern Ukraine predicted the production of 0.58 bcm annually by 2030, effectively doubling Ukrainian gas production from 2011. Ukrainian tariff systems will be under strong impact of full implementation of European legislation in order to maintain its geostrategic transmission position [58].
Transmission of gas via Ukraine strongly depends on the transmission tariffs that are published on yearly basis by the new Ukrainian TSO, but the tariff system needs to be changed due to European energy policy. Transparent information on transmission tariffs gives the opportunity to choose economically reasonable route, at least partially, by European shippers. New innovative ideas, such as the “short-haul project” presented by the new TSO of Ukraine “TSOUA” which enables network users to transport gas between European countries (Poland, Slovakia, Hungary, and, in future, Romania) through the territory of Ukraine at low cost and higher utilization and storing of gas for EU traders, is the most probable future business model for Ukrainian gas market.
However, the main question lies in future European demand for natural gas. In case of further decrease of natural gas demand that has been predicted according to all projections for Europe as the only continent with a decrease in demand, and abandonment of natural gas as green fuel will leave huge amounts of unutilized pipelines, interconnections, and storages in any case. A fast transitional period towards renewable production of energy in Europe without hydrocarbons will lead to strong energy decarbonization that will certainly result with, and countries’ economies and TSO’s in a never-ending business model of transmission tariff reduction and adjustment in order to sustain at least a minimum of profitability for existing gas infrastructures. Further development of the COVID-19 pandemic and consequently economic crises will give the main direction towards European energy trends. If the European economy strongly adopts decarbonization trends it will certainly influence on fast gas consumption decrease, but in case the European economy will use natural gas instead of renewables for fuel switching from coal it will slow gas consumption decrease and give a new perspective to not only Ukrainian but also to other existing gas systems in the European region.

7.5. Impact of Lower Transit through Ukraine to EU Purchase Bargaining Position

Observation of the provided data, along with the current further development trend of non-solved disputes such as Nord Stream 2 or capacities booking after TurkStream suggests that the period until 2025 will face a slow gradual decrease of transit of Russian gas through Ukraine. Sziklai et al. [59] conclude in their paper, published in 2020, how the potential impact of low prices of natural gas delivered through Nord stream 2 benefits will never reach eastern Europe who will have to seek its cheaper gas through Ukrainian or Turkish route. In which case, the ground is left for third, nonstandard big suppliers of natural gas to find their own place on the market, such as Iran, Azerbaijan, Romania with its increased production, and Turkey with its increased production, which would completely close any opportunity to see Ukraine as a transit route, au cotrair, Ukraine is facing a potential role of the last in chain buyer. Sziklai et al. [59] in their paper think alike, were suggesting that the best alternative for diversifying supply from Russian gas is to connect Central Asian gas fields with the European market. The Southern Gas Corridor consists of three individual pipelines: the South Caucasus Pipeline (SCP), the Trans-Anatolian Natural Gas Pipeline (TANAP), and the Trans-Adriatic Pipeline (TAP). The purpose of this gas corridor is to connect significant quantities of natural gas in Central Asia with Turkey and the EU, transporting it through Georgia, Turkey, Greece, and Albania to Italy. The SCP connects the Shah Deniz gas field through Georgia with the eastern part of Turkey. The pipeline from eastern Turkey to the border with Greece is called TANAP and has a current capacity of 16 bcm annually although the capacity of the SCP is 25 bcm annually. Given the significant consumption of natural gas in Turkey but also the higher capacity of the SCP, the capacity of TANAP is planned to increase to 22 bcm annually. With this increase in TANAP capacity and the commissioning of TurkStream, TAP will certainly not be left without quantities that could be transported through it. Turkstream will also supply the Tesla pipeline which in turn is planned to link the Black Sea with the Baumgarten gas hub in Austria. The Ionian Adriatic Pipeline (IAP) would connect TAP with the new LNG terminal in Krk, Croatia. Sure, the diversification of potential supply routes is present, as well as diversified suppliers in each route, which will leave SEE with sufficient alternatives to Russian gas.

7.6. Energy Policy Issues and Implications of North Stream 2

The authors intend to indicate in this paper the duration of the Russian Ukrainian conflict and the connected losses which are hardly quantitatively measured in a way which could satisfy all involved parties. In a geopolitical aspect the authors want to impose that the solution to the dispute is close and to evaluate the aftermath of the issue with changed, new setup: Turkish stream is built and fully operable, Nord Stream 2 is built and fully operable, Ukraine has opened its transmission and storage systems to the EU shippers and brought its legislation as close to the European one under the 3rd energy package, and United states are hitting historical records with natural gas imports to Europe.
The Crimea annexation and independence referendums, as well as the so-called Republics of Donetsk and Luhansk, is country integrity and highly political mater and by authors it is has never played a role in the subject of this paper, especially if evaluated that the physical transmission of the gas has continued in all the years of the conflicts from Russian federation through Ukraine to third parties/countries even though the natural gas export from Russia and its transit to Ukraine has been in the background of all political disputes between Russia and Ukraine. The US Administration has always pointed this out as the main reason for the disputes and posed sanctions to Nord Stream 2 project development during the Trump administration. The Biden administration after Biden–Merkel agreement which is not known in detail have stressed out that sanctions will not prevent Nord Stream 2 from being realized but on the other hand, they pointed out that US Administration will not tolerate geopolitical use of Nord Stream 2 operation. This will certainly be an issue of German energy policy towards Ukraine and Russia.
Development and improvements of the Ukrainian energy sector in the last five years has shown thorough preparation of Ukrainian national companies for all outcome scenarios as it has been clear that some adjustments and improvements on several levels were necessary. Opening of the storage capacities for European traders, redefining of its legislation that regulates the energy sector according to requirements of EU 3rd energy package, contracts and correlation with the Energy community, offering of short-haul tariffs product and customs-free storage called “customs warehouse product” as well as publishing of all important data and legislation in English language along with Russian and Ukrainian language clearly indicate the position which Ukraine has took. When it comes to the Nord Stream 2, Ukraine, Poland, and the USA see it as a political tool and a clear threat to their security of supply. They oppose the deepening dependence on one source, one route, and one supplier in the EU. Certainly, Ukraine and their allies will continue to work on solutions, which will allow them to mitigate the geopolitical impact of the Nord Stream 2 in the terms of an increase in gas prices in Central and Eastern Europe.
Russia communicates Nord Stream 2 project as a commercial project that meets the interests of Russia and Germany, and by putting the project into operation, additional the shortest diversification of gas supply routes is ensured for Gazprom. The finalization of Nord Stream 2 construction, now imminent, marks the success of Russia’s strategy of minimizing the risks of third country transit and brings bigger insecurity for the energy position of Ukraine as a transit country. Moreover, it brings Germany to position more dependent on Russian supplies and changing its position to gas supplier to Ukraine which will certainly have negative economic influences for Ukraine and positive on Germany.

7.7. Impact of European Green Deal on Natural Gas Demand

The development of natural gas supply also needs to be analyzed in the context of the new green oriented strategy of the European Union. According to Communication from the EU Commission concerning 2030 climate ambition, Europe has set a new climate plan. The fact that global average temperature increased by 1.1 °C above preindustrial levels by 2019 has triggered more ambitious climate targets [60]. Therefore, the EU Commission has made the European Green Deal the top political priority, with the aim of transforming the EU into an environmentally friendly, sustainable but also competitive economy that will achieve climate neutrality by 2050 [61]. On the other hand, global human, economic, and environmental systems are experiencing a health crisis with an unprecedented socioeconomic impact. Both climate and health crisis must not worsen another and therefore postponing climate action was not an option for the European Union. Both crises are influencing the natural gas supply. Due to the relatively mild winter of 2019/2020, the need for heating decreased by 5% across the main consumption regions if compared to the year before. Demand for gas in the residential and commercial sectors decreased by 3% during the first quarter of 2020 [62]. Natural gas demand in Europe in the first half of 2020 decreased by 8% or 19 bcm due to the impact of the COVID-19 pandemic, mild winter, and the high share of renewable energy sources in electricity generation. Despite a significant decline, demand for natural gas remained higher than in 2014 and 2015 when the demand for natural gas was at a record low in the last two decades due to the reduced use of natural gas in the heating sector and the generation of electricity. As mentioned earlier gas demand in Europe was already on low levels due to mild winter and the high share of renewable energy sources in electricity generation. As a result, gas demand decreased by 10% year on year in January and by 3% in February [62].
The European economic response to COVID-19 offers an opportunity to accelerate the transition to a climate neutral economy continuing fair energy transition with more than 1.8 trillion euros funds for it. With the use of these funds, goal of the EU is to achieve carbon neutrality along with the economic growth. In 2019, harmful greenhouse gas emissions in the EU were reduced by approximately 25% when compared to 1990. In the same period, economic growth of as much as 62% was achieved, which clearly proves the possibility of successfully combating climate change with the sustainability of economic development [60]. Currently, the European Commission is proposing to change the guidelines for achieving climate neutrality by 2050 in the form of the European Climate Law, which would continue to support these climate goals along with increasing the long-term sustainability and competitiveness of renewable energy sources and a significant positive impact on recovery from COVID-19 crisis. Due to the crisis and lockdowns caused by the COVID-19 pandemic in 2020, significant reductions in greenhouse gas emission were achieved, but this emission are also expected to increase to some extent as a result of the recovery of the European economy [60]. Therefore, natural gas supply and gas infrastructure will be significantly important in the post COVID-19 economic recovery. According to European Commission estimates, during the recovery of the European economy (2020–2030) investments in energy projects will have to increase significantly compared to the last decade. This increase is estimated at around EUR 350 billion more than in the last decade to meet the 2030 climate targets [60].
The increased climate ambition in all energy and industrial sectors and households can have a positive impact on the economic development of the EU. Especially, this will be important in countries where there is still space for increasing economy’s performance. Since, EU countries, sectors, and households start the transition towards climate neutrality from different points, a proposed more ambitious climate target will be challenging in countries with a higher greenhouse gas emissions which are mostly result of higher share of fossil fuels in the energy mix, lower GDP per capita, and higher energy intensity. Some carbon intensive sectors and regions will undergo substantial transformations. Due to the energy transition, the EU’s energy system will become more secure and resilient. The natural gas market in Europe has faced volatile prices and supply disruption and a majority of the European supply of natural gas is covered by imports. Higher share of renewable energy sources in the EU will help reduce this exposure thereby increasing the security of supply. Decreasing natural gas imports would on the other hand save on the import value significantly by 2050, but concerning the need for COVID-19 recovery, it would not start before 2030.
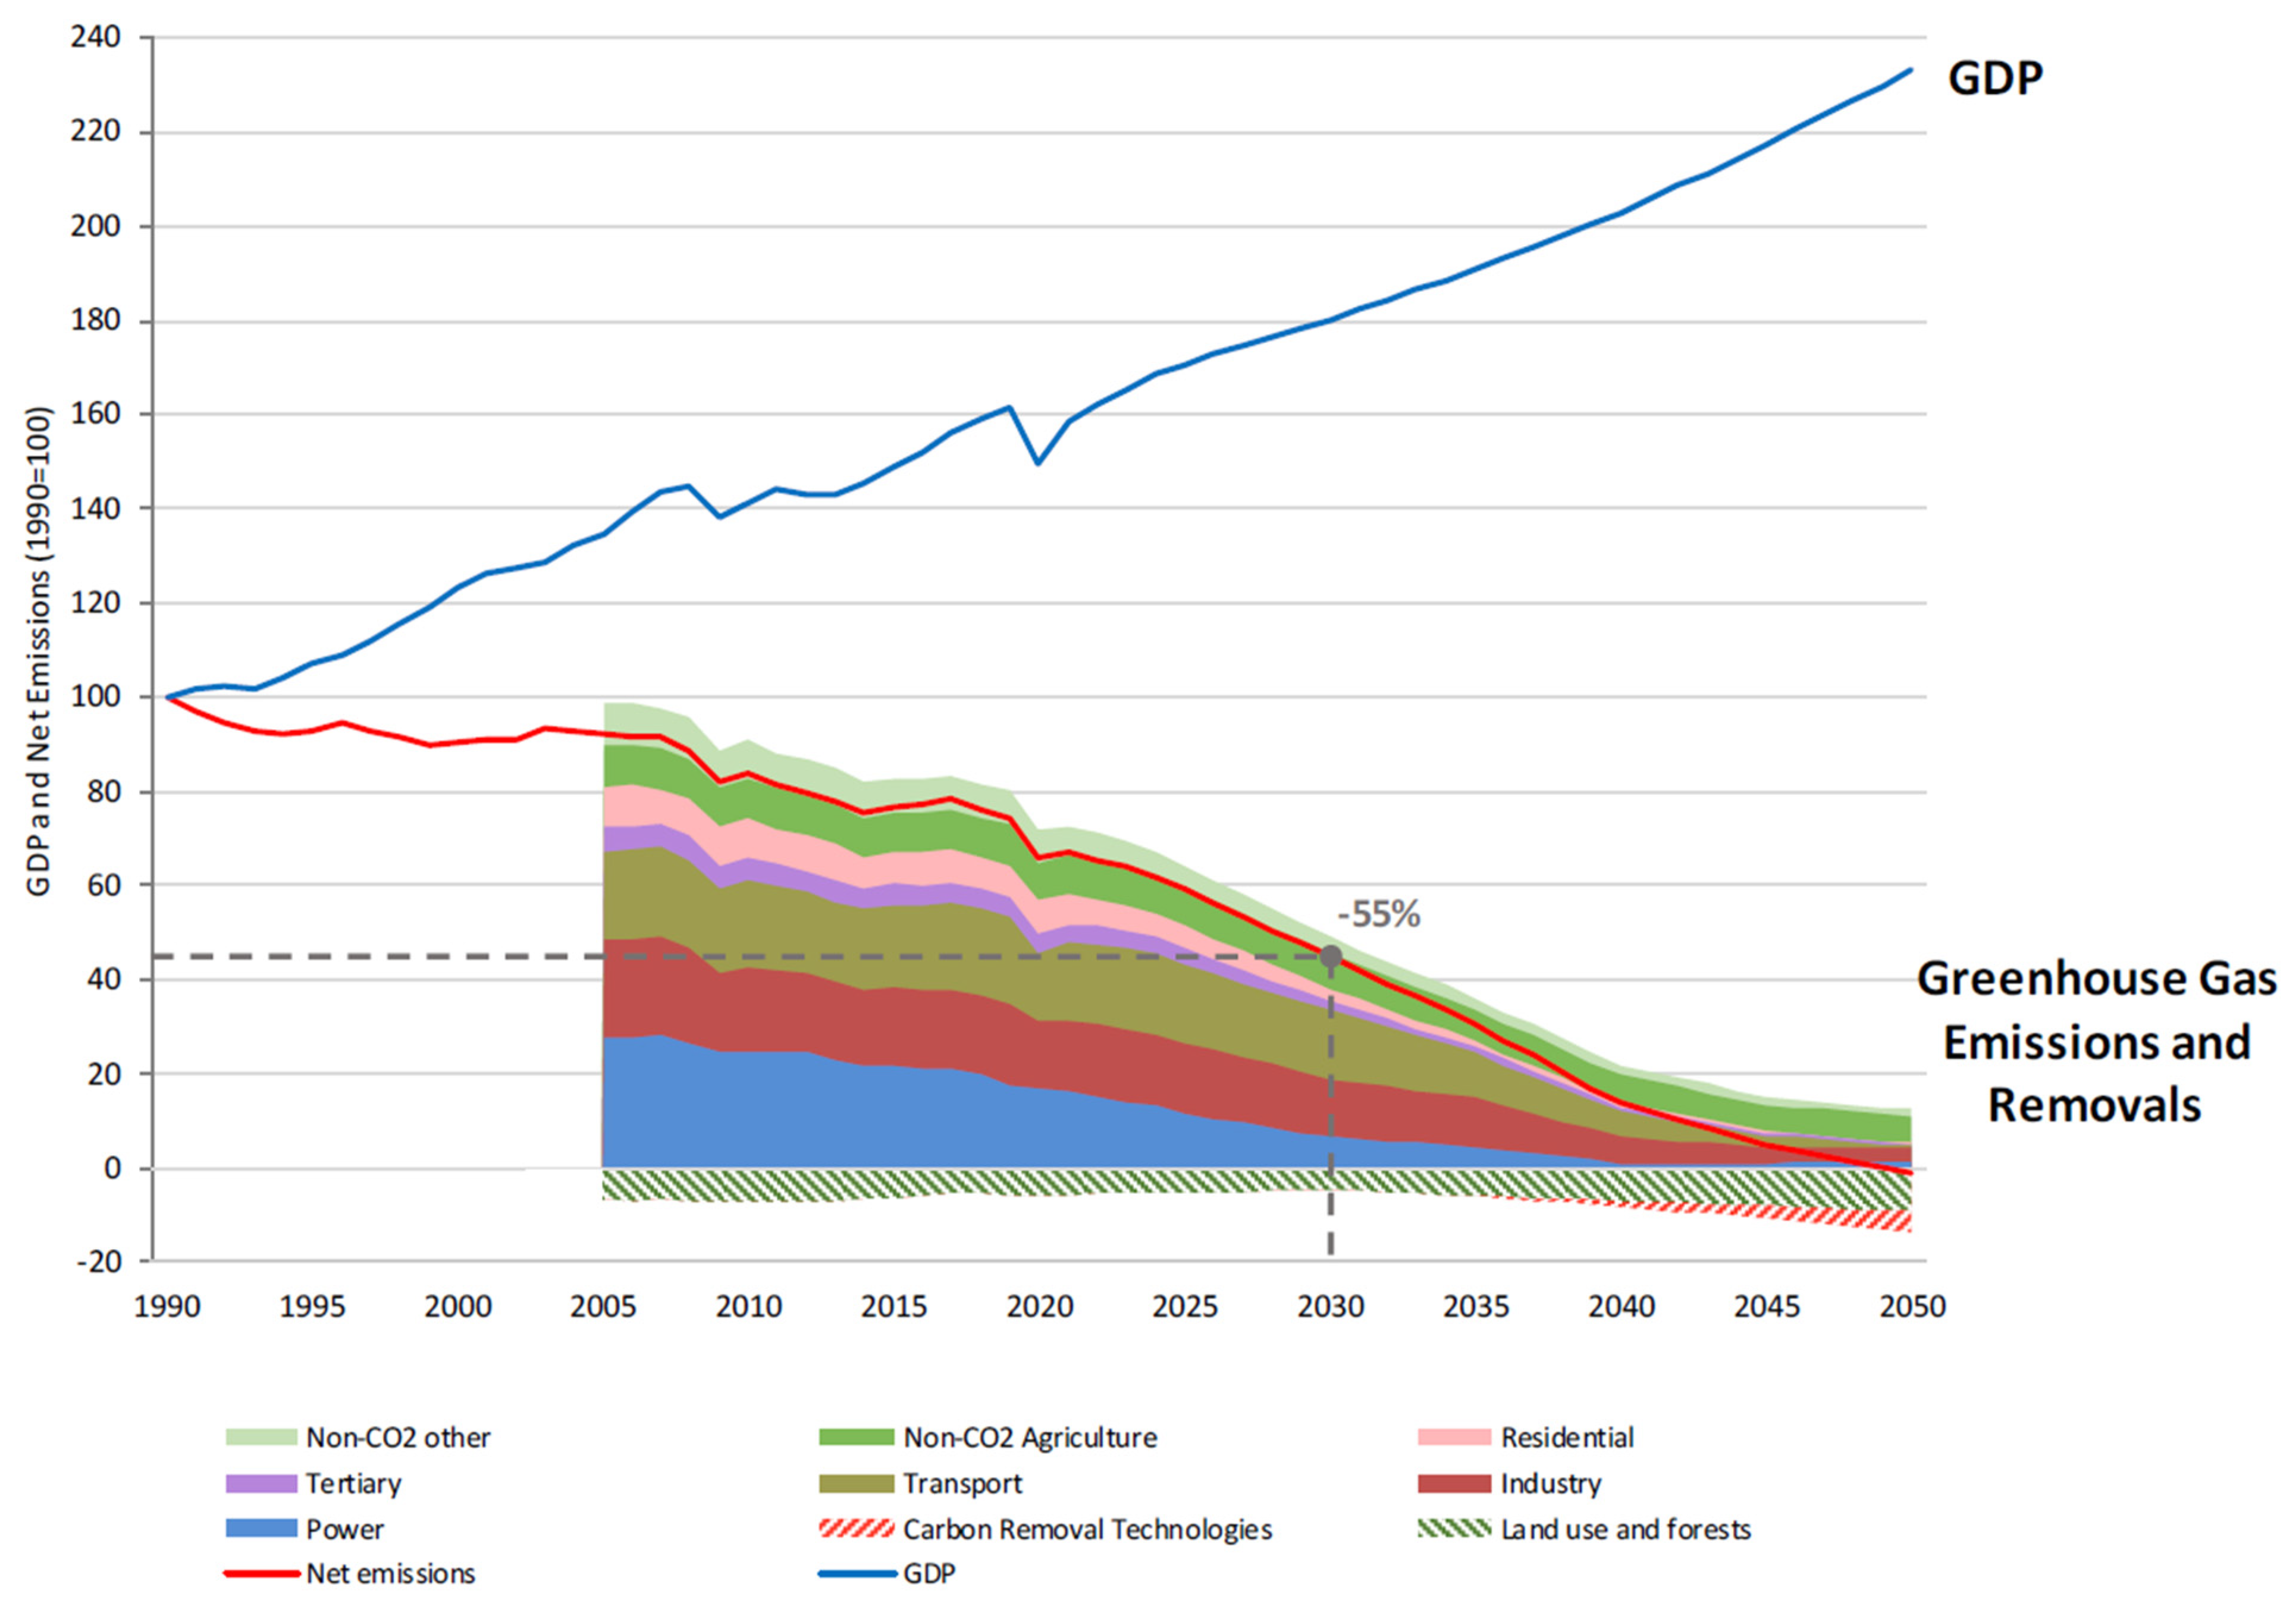
As can be seen in the graph (Figure 5), achieving a 55% reduction in greenhouse gas emissions will require the implementation of various measures to achieve climate neutrality in all sectors. Greenhouse gas emissions from the use of fossil fuels but also from fugitive emissions in the life cycle of their use are responsible for as much as 75% of total EU greenhouse gas emissions. The large presence or high use of fossil fuels in the EU energy mix indicates the need for a significant increase in the share of renewable energy sources. The European Commission estimates that the production of electricity from renewable energy sources must double, from today is 32% to approximately 65% or more in order to achieve set goals [60]. This emphasizes the importance of energy infrastructure along with the natural gas transport sector in the transition to a climate neutral economy. In the circumstances where the renewable energy will become the most cost-effective source for power generation, the energy system integration and energy storage will give additional importance to natural gas infrastructure.
There are three main courses of action for achieving target emission reduction. The first course of action is certainly the Emission Trading System Directive, which sets a limit on greenhouse gas emissions for large industrial energy consumers, the electricity production sector, and the aviation sector. The second course is the Effort Sharing Regulation with binding amounts attributed to emissions for remaining greenhouse gas emissions, and the third course of action is the application of land use, land-use change, and forestry (LULUCF) in order to reduce greenhouse gas emissions. In addition to the above, strict energy legislation and policies will certainly have a major role in achieving the ambitious climate targets for 2030 and progressive reduction of emission towards climate neutrality in 2050. This will enable governments to act swiftly. Consequently, coal and natural gas fuel switch is expected in this decade, and gas transmission system with sufficient import capacity will have significant importance during this decade. In this case, natural gas supply from Russia via Ukraine transit route will certainly keep its role in the first half of this decade. Poland, for example, will need additional amounts of natural gas due to the coal-gas fuel switch but it needs to be stressed that natural gas has been omitted from European Taxonomy meaning that all projects that include natural gas will not be eligible for EU support funding. In the case of prolongation of coal-gas fuel switch, it will have a negative environmental impact, but if it will impact the increasing of RES that the environmental consequences will be positive.

7.8. Impact of LNG Import on Pipeline Transit in Europe

According to the US Department of Energy and the Energy Information Administration, US exports of LNG continued to grow in the first six months of 2021 representing an increase of 42%, compared with the same period in 2020. Due to the pandemic during the summer months of 2020, US LNG exports fell to record lows, but they set record highs by the end of 2020. US LNG exports increased in the first half of 2021 as international natural gas and LNG spot prices increased in Asia and Europe due to cold weather and increasing demand. Rising global LNG demand after COVID-19 restrictions began to ease, as well as continuous unplanned outages at LNG export facilities in several countries (including Australia, Malaysia, Nigeria, Algeria, Norway, and Trinidad and Tobago), also resulted in increased US LNG exports. Natural gas demand at the beginning of 2021 continued to rise due to low post-winter inventories and high natural gas prices and especially higher demand for more flexible LNG supplies as is the case with the US cargoes. European underground storage capacities were filled at a low level after a cold winter. Even though, European natural gas spot prices have historically been lower than prices in Asia, in 2021 European natural gas prices are following Asia’s spot LNG prices closely attracting flexible global shipments. The US Henry Hub natural gas benchmark and US LNG spot market prices in 2021 have been lower than prices for international natural gas and spot LNG. This price difference resulted in record exports volumes. US LNG exports also increased because of new export units added in 2020 that increased total US LNG export capacity. Similar to 2020, Asia further remained the top destination for US LNG exports with 46% of the total and was followed by Europe with a share of 37% and increased exports to Latin America [63].
Yermakov and Sharples [64] have investigated the development of Russian LNG and its impact on Russian pipeline trades. It is obvious that LNG trade has developed significantly from the beginning of the 21st century and that substantially changed global gas markets. They conclude that the volume of inter-continental gas trade has grown, the contracts have become flexible with destination-free clausulae, the number of portfolio players increased, infrastructure has been developed for re-export cargoes from import terminals, and the share of spot trades increased allowing an increase of flexibility of deliveries. All that influenced the dominance of conventional, oil-indexed, long-term gas contracts with a specified destination. It is expected that the development and growth of LNG facilities will continue, with the share of LNG in the global gas trade that will equal the share of pipeline trade by the end of the next decade [64]. Europe has sufficient regasification capacity and specifically, the EU has liquid traded markets with price-determined ability to attract LNG shipments. Therefore, for Russia, LNG represents a threat to its firm position as the main gas exporter. Yermakov and Sharples [64] also indicated that the Russian authorities appear to acknowledge that the state-controlled gas giant, Gazprom, does not have the flexibility and expertise to develop Russian LNG potential and therefore focused on Novatek with significant financial and political state support. Novatek expansion with LNG started with the Yamal LNG in 2017 and continued with Arctic LNG 2 that is planned to start operating from 2023 to 2026 in a few stages. The plans for Russia include the export of 80–140 million tonnes per annum (mtpa) in the early 2030s bringing Russia among the top exporters alongside the USA, Qatar, and Australia. Russia’s LNG ambitions have increased in 2021 according to the publication of its official long-term LNG development plan according to Yermakov and Sharples [64]. With the five terminals in operation or under construction, seven “probable or possible” projects are mentioned that could rise LNG production to mentioned 140 mtpa and additional seven speculative terminals with a huge additional probable capacity (127–143 mtpa). It is obvious that all these projects will not be realized, but it illustrates Russian ambitions concerning LNG market share in it will certainly compete with Russian pipeline exports especially to North-West Europe and will consequently diminish Gazprom’s market share. In the case that Russia attempts to limit the deliveries of its LNG to Europe, this could help the global LNG competitors with their bigger shares in Europe, therefore the pipeline shipments are the better subject to limitation for controlling the market than LNG due to its global market dimension.

8. Conclusions

Expanded use of EU ETS, energy efficiency and energy strategy, instruments supporting sustainable mobility, transport circular economy, and different policies will play an important role in achieving the goals of the European Green Deal, but also in meeting the set goals for reducing emissions by 2030 and achieving climate neutrality by 2050. This will substantially change the perspective towards natural gas and will consequently influence the natural gas supply and the whole European gas transmission system. The change will be under the influence of the coal and gas fuel switch until 2030 in the West European Members and after 2030 also in the South-Eastern European region. In this short-term period, the natural gas system will be necessary for supplementing coal with natural gas in the energy mix. In the long-term until 2050 gas transmission systems will decrease their use substantially according to Green Deal targets but will still maintain the role of energy storage and balancing with the majority of renewables in the energy mix. In the context of plentiful pipeline and LNG import capacity, economic bounce-back may not necessarily equate to long-term gas demand recovery. During the first half of the 2010s, slow economic recovery and high gas prices were the reason for low gas demand in the European industrial sector, and the main factor that was significantly lower demand in the power sector where gas could not compete with coal due to low coal and carbon prices on one side and on the other side the rise of non-market based renewable capacity.
At the beginning of the 2020 decade, low gas prices and favorable coal/gas price spread can contribute to increasing gas demand in the first half of this decade. Concerning North Stream 2 approvals, TurkStream operating and new LNG regasification capacity coming to market (Croatia LNG), European hub prices are expected to stay lower than the year before, but the simple impact of the new import capacity cannot be evaluated without COVID-19 economic impact. A decrease in gas prices is evident as TTF day-ahead prices falling below 3 EUR/MWh in May (that was a direct impact of the pandemic situation). The continuation of the import of Russian gas via Ukraine based on the new agreement, therefore, has prevented the price spike due to transit interruption and made some free storage capacities that are also decreasing gas prices. Natural gas demand can even increase additionally if more accelerated coal phase-out occurs in the next few years. Coal phase out can be the result of economic reasons due to post COVID-19 low gas prices or a direct result of implementing Green Deal emission reduction targets into governmental decisions of EU Member states. However, this increase in gas demand, as it was previously mentioned, would only be for a few years and natural gas demand in Europe should not expect to recover for much longer than 2030 depending on natural gas share in the national energy mix and declining ration which will depend on each national energy policy. How fast natural gas demand will decline would mostly depend on the duration of the COVID-19 crisis, economic recovery measures and implementation of environmental policies, and sufficient funds for environmental initiatives. If short-term national energy strategy will be directed towards economic recovery rather than faster decarbonization measures, then natural gas demand will certainly decrease in the next period. In other circumstances where renewables are overtaking the power sector in the next few years, the gas demand may stay at the current level for short before it starts to decline irretrievably.
Analyses of the current new situation of natural gas supply at the western Ukrainian interconnections have shown that there has been a significant decline in the physical flow of natural gas at exit points from Ukraine to the EU in 2020. Taking into account the high increase in LNG imports to Europe, the start of TurkStream, and the planned start of Nord Stream 2, authors project a gradual reduction in transit of Russian gas through Ukraine by 2025 with a complete halt of transit by 2030. Gradual reduction i.e., halt of transit of Russian gas means that all markets in Southeast Europe and Ukraine will face thorough changes in their natural gas purchase politics and routes.
This paper also answers the research questions that the authors raised at the beginning of the paper. The first question was related to the extent of change of the geopolitical and energy map of Europe after the full release of North Stream 2 capacity and the conclusion is that there will be the inevitable loss after the full release of North Stream 2 capacity will occur in fee for transmission for Ukraine and for Ukraine transmission corridor position. Second, analysis of the historical Russian—Ukrainian disputes and cut-offs of flows via Ukraine and the possibility of use of Ukrainian 30 bcm storage facilities to decrease the shortage risk have shown that the EU should intensify and make further development of projects for mutual storage system usage with Ukraine as well as increase short-term capacity on interconnections with Ukraine on Polish, Slovakian, and Hungarian borders. Furthermore, the potential outcomes and reality after North Stream 2 and Turkish stream are fully operable in terms of security of supply for Europe indicate that the Ukrainian side will face the need for many technical and operational changes in its internal transmission and storage system functioning and that this has already started since this is necessary for the survival of Ukrainian transmission system. What is more, the last conclusion refers to the latest political agreement such as the Biden–Merkel agreement in 2021 that paves the way for the final settlement of the elaborated situation with North Stream 2 for all parties. Germany has agreed on taking necessary measures and attention towards the wellbeing of the Ukrainian side in exchange for the American green light so that by the end of 2021 first gas molecules can be delivered via the most controversial geopolitical energy project in the past ten years.

Author Contributions

F.B.: Conceptualization, Formal analysis, Investigation, Data Curation, Writing—Original Draft, Writing—Review & Editing, Visualization; D.K.S.: Conceptualization, Investigation, Writing—Original Draft, Writing—Review & Editing, Supervision; I.S.: Conceptualization, Formal analysis, Investigation, Writing—original draft, Writing—review & editing, Visualization; I.I.: Conceptualization, Investigation, Writing—Original Draft, Data Curation, Writing—review & editing. All authors have read and agreed to the published version of the manuscript.

Funding

This research received no external funding.

Institutional Review Board Statement

Not applicable.

Informed Consent Statement

Not applicable.

Data Availability Statement

Not applicable.

Acknowledgments

Not applicable.

Conflicts of Interest

The authors declare no conflict of interest.

References

  1. Nagayama, D.; Horita, M. A network game analysis of strategic interactions in the international trade of Russian natural gas through Ukraine and Belarus. Energy Econ. 2014, 43, 89–101. [Google Scholar] [CrossRef]
  2. Mitrova, T.; Boersma, T.; Galkina, A. Some future scenarios of Russian natural gas in Europe. Energy Strategy Rev. 2016, 11–12, 19–28. [Google Scholar] [CrossRef]
  3. Lee, Y. Interdependence, issue importance, and the 2009 Russia-Ukraine gas conflict. Energy Policy 2017, 102, 199–209. [Google Scholar] [CrossRef]
  4. Sharples, J.D. The Shifting Geopolitics of Russia’s Natural Gas Exports and Their Impact on EU-Russia Gas Relations. Geopolitics 2016, 21, 880–912. [Google Scholar] [CrossRef]
  5. Kutcherov, V.; Morgunova, M.; Bessel, V.; Lopatin, A. Russian natural gas exports: An analysis of challenges and opportunities. Energy Strategy Rev. 2020, 30, 100511. [Google Scholar] [CrossRef]
  6. Stulberg, A.N. Natural gas and the Russia-Ukraine crisis: Strategic restraint and the emerging Europe-Eurasia gas network. Energy Res. Soc. Sci. 2017, 24, 71–85. [Google Scholar] [CrossRef]
  7. Lochner, S. Modeling the European natural gas market during the 2009 Russian-Ukrainian gas conflict: Ex-post simulation and analysis. J. Nat. Gas. Sci. Eng. 2011, 3, 241–348. [Google Scholar] [CrossRef]
  8. Bittante, A.; Jokinen, R.; Pettersson, F.; Saxén, H. Optimization of LNG Supply Chain. Comput. Aided Chem. Eng. 2015, 37, 779–784. [Google Scholar] [CrossRef]
  9. Najibi, H.; Rezaei, R.; Javanmardi, J.; Nasrifar, K.; Moshfeghian, M. Economic evaluation of natural gas transportation from Iran’s South-Pars gas field to market. Appl. Therm. Eng. 2009, 29, 2009–2015. [Google Scholar] [CrossRef]
  10. Adamu, A. Using Natural Gas to Meet Latent Energy Demand in Nigeria and Deliver Economic Advantage. Ph.D. Thesis, Nile University of Nigeria, Abuja, Nigeria, 2016. [Google Scholar]
  11. Natural Gas World, Pipeline Gas versus LNG-Increasing Competition in Europe and Asia. 2020. Available online: https://www.naturalgasworld.com/pipeline-gas-versus-lng-increasing-competition-in-europe-and-asia-ggp-73560 (accessed on 2 February 2021).
  12. Richman, J.; Ayyılmaz, N. Can the US and Europe contain Russian power in the European energy market? A game theoretic approach. Energy Strategy Rev. 2019, 26, 100393. [Google Scholar] [CrossRef]
  13. Pirani, S. Ukraine’s Gas. Sector; Oxford Institute for Energy Studies: Oxford, UK, 2007. [Google Scholar]
  14. Pirani, S.; Sharples, J. The Russia-Ukraine Gas Transit Deal: Opening a New Chapter; Oxford Institute for Energy Studies: Oxford, UK, 2020; Volume 64. [Google Scholar]
  15. Pirani, S.; Sharples, J.; Yafimava, K.; Yermakov, V. Implications of the Russia-Ukraine Gas. Transit. Deal for Alternative Pipeline Routes and the Ukrainian and European Markets; Oxford Institute for Energy Studies: Oxford, UK, 2020; Volume 65. [Google Scholar]
  16. Dickel, R.; Hassanzadeh, E.; Henderson, J.; Honoré, A.; El-Katiri, L.; Pirani, S.; Rogers, H.; Stern, J.; Yafimava, K. Reducing European Dependence on Russian Gas: Distinguishing Natural Gas. Security from Geopolitics; Oxford Institute for Energy Studies: Oxford, UK, 2014. [Google Scholar]
  17. Gazprom, Strategy. 2020. Available online: https://www.gazprom.com/about/strategy/ (accessed on 21 November 2020).
  18. Newnham, R.E. Pipeline politics: Russian energy sanctions and the 2010 Ukrainian elections. J. Eurasian Stud. 2013, 4, 115–122. [Google Scholar] [CrossRef] [Green Version]
  19. Pirani, S.; Stern, J.; Yafimava, K. The Russo-Ukrainian Gas. Dispute of January 2009: A Comprehensive Assessment; Oxford Institute for Energy Studies: Oxford, UK, 2009. [Google Scholar]
  20. Rodríguez-Fernández, L.; Carvajal, A.B.F.; Ruiz-Gómez, L.M. Evolution of European Union’s energy security in gas supply during Russia–Ukraine gas crises (2006–2009). Energy Strategy Rev. 2020, 30, 100518. [Google Scholar] [CrossRef]
  21. Naftogaz Group, History of Oil and Gas Industry. 2020. Available online: http://www.naftogaz.com/www/3/nakweben.nsf/0/69CDD708EEFC16B4C22570D8003432CC (accessed on 3 February 2020).
  22. Naftogaz Europe, Remarkable Events in Ukraine’s Oil-Gas Industry. 2014. Available online: https://naftogaz-europe.com/subcategory/en/NaftogazHistory (accessed on 3 November 2020).
  23. TSOUA-Gas Transmission System Operator of Ukraine, History. 2020. Available online: https://tsoua.com/en/about-us/history/ (accessed on 4 November 2020).
  24. Maltby, T. European Union energy policy integration: A case of European Commission policy entrepreneurship and increasing supranationalism. Energy Policy 2013, 55, 435–444. [Google Scholar] [CrossRef] [PubMed] [Green Version]
  25. Jirušek, M. The attitude of the Visegrad Group Countries towards Russian Infrastructural Projects in the gas sector. Energy Policy 2020, 139, 111340. [Google Scholar] [CrossRef]
  26. Aoun, M.C.; Pešut, D.; Matosović, M.; Bošnjak, R.; Deane, P.; Glynn, J.; Gallachoir, B.O.; Nagy, S.; Badouard, T.; Desbrosses, N.; et al. Chapter 11-Gas Security of Supply in the European Union. In Europe’s Energy Transition; Academic Press: Cambridge, MA, USA, 2017; pp. 67–78. [Google Scholar] [CrossRef]
  27. Naftogaz-Ukrtransgaz, Business Information. 2019. Available online: http://utg.ua/en/ (accessed on 20 July 2020).
  28. International Energy Charter, Cross Border Pipelines. 2015. Available online: https://www.energycharter.org/what-we-do/trade-and-transit/cross-border-pipelines/ (accessed on 7 December 2020).
  29. TSOUA-Gas Transmission System Operator of Ukraine, Key Facts. 2020. Available online: https://tsoua.com/en/about-us/key-facts/ (accessed on 14 September 2020).
  30. Le Coq, C.; Paltseva, E. Assessing gas transit risks: Russia vs. the EU. Energy Policy 2012, 42, 642–650. [Google Scholar] [CrossRef] [Green Version]
  31. Flouri, M.; Karakosta, C.; Kladouchou, C.; Psarras, J. How does a natural gas supply interruption affect the EU gas security? A Monte Carlo simulation. Renew. Sustain. Energy Rev. 2015, 44, 785–796. [Google Scholar] [CrossRef]
  32. Rodríguez-Gómez, N.; Zaccarelli, N.; Bolado-Lavín, R. European ability to cope with a gas crisis. Comparison between 2009 and 2014. Energy Policy 2016, 97, 461–474. [Google Scholar] [CrossRef]
  33. Van de Graaf, T.; Colgan, J.D. Russian gas games or well-oiled conflict? Energy security and the 2014 Ukraine crisis. Energy Res. Soc. Sci. 2017, 24, 59–64. [Google Scholar] [CrossRef] [Green Version]
  34. Vahtra, P. Energy security in Europe in the aftermath of 2009 Russia-Ukraine gas crisis. In The EU-Russia Gas Connection: Pipes, Politics and Problems; Electronic Publications of Pan-European Institute 8/2009: Turku, Finland, 2009. [Google Scholar]
  35. Hafner, M.; Bigano, A. Russia-Ukraine-Europe Gas. Crisis of January 2009: Causes, Lessons Learned and Strategies for Europe, Policy Brief; Fondazione Eni Enrico Mattei: Milano, Italy, 2009. [Google Scholar]
  36. Skalamera, M. The Ukraine Crisis: The Neglected Gas Factor. Orbis 2015, 59, 398–410. [Google Scholar] [CrossRef]
  37. Bilgin, M. Geopolitics of European natural gas demand: Supplies from Russia, Caspian and the Middle East. Energy Policy 2009, 37, 4482–4492. [Google Scholar] [CrossRef]
  38. Bocse, A.M. From the United States with shale gas: Ukraine, energy securitization, and the reshaping of transatlantic energy relations. Energy Res. Soc. Sci. 2020, 69, 101553. [Google Scholar] [CrossRef]
  39. Szulecki, K.; Fischer, S.; Gullberg, A.T.; Sartor, O. Shaping the ‘Energy Union’: Between national positions and governance innovation in EU energy and climate policy. Clim. Policy 2016, 16, 548–567. [Google Scholar] [CrossRef] [Green Version]
  40. Kostianoy, A.G.; Lavrova, O.Y.; Mityagina, M.I.; Solovyov, D.M. Satellite Monitoring of the Nord Stream Gas Pipeline Construction in the Gulf of Finland. In Oil Pollution in the Baltic Sea, The Handbook of Environmental Chemistry; Kostianoy, A., Lavrova, O., Eds.; Springer: Berlin/Heidelberg, Germany, 2012. [Google Scholar]
  41. Nord Stream, Nord Stream-The Pipeline. 2020. Available online: https://www.nord-stream.com/the-project/pipeline/ (accessed on 20 July 2020).
  42. Gazprom, Gas Pipeline Nord Stream, The Gas Pipeline Directly Connecting Russia and Europe. 2020. Available online: https://www.gazprom.com/projects/nord-stream/ (accessed on 21 July 2020).
  43. Gazprom, Gas Pipeline Nord Stream 2, A New Export Gas Pipeline Running from Russia to Europe across the Baltic Sea. 2020. Available online: https://www.gazprom.com/projects/nord-stream2/ (accessed on 21 July 2020).
  44. Nord Stream 2, Nord Stream 2-Construction. 2020. Available online: https://www.nord-stream2.com/construction/overview/ (accessed on 24 July 2020).
  45. Lidskog, R.; Elander, I. Sweden and the Baltic Sea pipeline: Between ecology and economy. Mar. Policy 2012, 36, 333–338. [Google Scholar] [CrossRef]
  46. OilField Wiki, Nord Stream. 2020. Available online: http://www.oilfieldwiki.com/wiki/Nord_Stream (accessed on 24 July 2020).
  47. Jonter, T.; Viktorov, I. Energy and Security in the Baltic Sea Region: Research Papers in International Relations; Edita Västra Aros: Stockholm, Sweden, 2011. [Google Scholar]
  48. TurkStream, Project-The TurkStream Pipeline. 2020. Available online: http://www.turkstream.info/project/ (accessed on 27 July 2020).
  49. Gazprom, Gas Pipeline TurkStream, Gas exports to Turkey and Southern and Southeastern Europe. 2020. Available online: https://www.gazprom.com/projects/turk-stream/ (accessed on 27 July 2020).
  50. Austvik, O.G.; Rzayeva, G. Turkey in the geopolitics of energy. Energy Policy 2017, 107, 539–547. [Google Scholar] [CrossRef]
  51. Guo, F.-F.; Huang, C.-F.; Wu, X.-L. Strategic analysis on the construction of new energy corridor China–Pakistan–Iran–Turkey. Energy Rep. 2019, 5, 828–841. [Google Scholar] [CrossRef]
  52. Pulhan, A.; Yorucu, V.; Evcan, N.S. Global energy market dynamics and natural gas development in the Eastern Mediterranean region. Util. Policy 2020, 64, 101040. [Google Scholar] [CrossRef]
  53. Sauvageot, E.P. Between Russia as producer and Ukraine as a transit country: EU dilemma of interdependence and energy security. Energy Policy 2020, 145, 111699. [Google Scholar] [CrossRef]
  54. AGSI+, Storage Data. 2020. Available online: https://agsi.gie.eu/#/ (accessed on 3 July 2020).
  55. ENTSOG. Winter Supply Outlook-2019/2020; ENTSOG AISBL: Brussels, Belgium, 2019. [Google Scholar]
  56. TSOUA-Gas Transmission System Operator of Ukraine, Operational Daily Data. 2020. Available online: https://tsoua.com/prozorist/operatyvni-dobovi-dani/ (accessed on 16 July 2020).
  57. ENTSOG-Transparency Platform (TP), Transparency Platform-Points Map. 2021. Available online: https://transparency.entsog.eu/#/map?loadBalancingZones=false (accessed on 5 January 2021).
  58. San-Akca, B.; Sever, S.D.; Yilmaz, S. Does natural gas fuel civil war? Rethinking energy security, international relations, and fossil-fuel conflict. Energy Res. Soc. Sci. 2020, 70, 101690. [Google Scholar] [CrossRef]
  59. Sziklai, B.R.; Kóczy, L.A.; Csercsik, D. The impact of Nord Stream 2 on the European gas market bargaining positions. Energy Policy 2020, 144, 111692. [Google Scholar] [CrossRef]
  60. European Commission. Communication from the Commission to the European Parliament, the Council, the European Economic and Social Committee and the Committee of the Regions-Stepping up Europe’s 2030 Climate Ambition: Investing in a Climate-Neutral Future for the Benefit of Our People; Publications Office of the European Union: Brussels, Belgium, 2020. [Google Scholar]
  61. European Commission. A European Green Deal. 2020. Available online: https://ec.europa.eu/info/strategy/priorities-2019-2024/european-green-deal_en (accessed on 22 November 2020).
  62. Honoré, A. Natural Gas. Demand in Europe: The Impacts of COVID-19 and Other Influences in 2020; Oxford Institute for Energy Studies: Oxford, UK, 2020. [Google Scholar]
  63. Smith, S. US Sees Record LNG Export Growth, Energy Information Administration, LNG Industry. 2021. Available online: https://www.lngindustry.com/special-reports/28072021/eia-us-sees-record-lng-export-growth/ (accessed on 22 July 2021).
  64. Yermakov, V.; Sharples, J. A Phantom Menace: Is Russian LNG a Threat to Russia’s Pipeline Gas. in Europe? OIES Paper 171; Oxford Institute of Energy Studies: Oxford, UK, 2021. [Google Scholar]
Figure 1. Geographical scheme of Ukraine gas pipeline system [28].
Energies 14 05175 g001
Figure 2. Daily amounts of natural gas in EU 28 storages from 2011 to 2019 [54].
Energies 14 05175 g002
Figure 3. Gas in storages—summer season [55].
Energies 14 05175 g003
Figure 4. Comparison of total physical flows at transmission system of Republic of Ukraine exit point in year 2019 versus year 2020 according to reporting via the ENTSO-G transparency portal [57].
Energies 14 05175 g004
Figure 5. Comparison of total physical flows at transmission system of Republic of Ukraine exit point in year 2019 versus year 2020 according to reporting via ENTSO-G transparency portal [57].
Energies 14 05175 g005
Table 1. Ukraine interconnection points overview from year 2009 to 2018 [27].
DirectionInterconnection PointFrom or to StateTechnical Capacity (bcm/ann)Measured Annual Flow (bcm/ann)
2009201020112012201320142015201620172018
Entry to UkraineKobrynBelarus28.902.003.103.503.103.402.602.10---
MozyrBelarus6.005.404.304.003.302.800.502.40---
SudzhaRussia107.5077.6083.8083.0072.1071.0047.3045.4057.0066.2062.40
ValuikyRussia25.508.6011.109.509.4010.507.407.507.106.605.70
SerebriankaRussia13.00-0.105.101.001.300.90----
PysarivkaRussia48.5019.4024.0024.0021.1015.2013.1012.8016.5019.2016.40
SokharnivkaRussia46.008.103.704.404.405.704.003.001.601.602.30
ProkhorivkaRussia3.300.803.302.801.900.901.10----
PlatoveRussia5.300.700.901.000.700.700.60----
DrozdovychiPoland2.10---0.101.000.900.101.001.300.70
UzghorodSlovakia15.50-----3.609.709.109.906.50
BerehoveHungary6.20----1.100.600.501.002.803.40
Exit from UkraineDrozdovychiPoland5.002.803.404.003.803.903.503.704.504.704.00
ProkhorivkaRussia32.50----------
UzghorodSlovakia92.6065.2067.9070.6051.8053.5031.4037.8048.8053.5049.30
BerehoveHungary13.207.907.105.905.706.406.505.906.7011.7011.80
TekoveRomania4.500.300.300.700.300.20--0.800.700.70
OleksiivkaMoldova3.503.003.203.103.102.402.802.903.002.702.90
OrlivkaRomania26.8016.6016.7019.9019.6019.6018.0016.7018.5020.2018.10
Total entry307.80122.60134.30137.30117.10113.6082.6083.5093.30107.6097.40
Total exit178.1095.8098.60104.2084.3086.0062.2067.0082.3093.5086.80
EU 28 gas demand-484.5521.3471459.1451.2401.7418.7449.3465.7458.5
Table 2. Basic technical parameters of Ukrainian transmission pipeline network [27,29].
ParameterValueMeasure Unit
Length of gas pipelines37,600.18km
main pipeline (high pressure)22,007.47km
branch pipeline13,123.53km
gas distribution pipeline1469.18km
Compressor stations73.00number
Installed compressor stations power5496.00MW
Table 3. Comparative analysis of monthly and quarterly physical flows on exit point from transmission system of Ukraine Beregovo in 2019 and 2020 [57].
Beregovo—Ukraine to Hungary 2019 (GWh)2020 (GWh)Change Trend (%)
January8088.983473.08−57.06%
February8732.516537.57−25.14%
March9069.337814.39−13.84%
Q1 SUM25,890.8217,825.04−31.15%
April 15,148.978355.39−44.85%
May17,198.662305.40−86.60%
June16,978.162499.34−85.28%
Q2 SUM49,325.7913,160.13−73.32%
July16,322.114295.86−73.68%
August15,856.673505.37−77.89%
September15,499.683761.52−75.73%
Q3 SUM47,678.4711,562.76−75.75%
October9325.488282.22−11.19%
November10,684.798789.29−17.74%
December13,338.2010,502.16−21.26%
Q4 SUM33,348.4727,573.68−17.32%
GRAND SUM156,243.5470,121.60−55.12%
Table 4. Comparative analysis of monthly and quarterly physical flows on exit point from transmission system of Ukraine Velke Kapusany in 2019 and 2020 [57].
Velke Kapusany—Ukraine to Slovakia2019 (GWh)2020 (GWh)Change Trend (%)
January48,881.2414,800.74−69.72%
February41,004.1527,694.02−32.46%
March51,694.6935,180.06−31.95%
Q1 SUM141,580.0877,674.82−45.14%
April56,547.9333,410.37−40.92%
May57,567.2034,904.40−39.37%
June49,768.5634,858.88−29.96%
Q2 SUM163,883.69103,173.66−37.04%
July54,735.6634,241.19−37.44%
August37,751.6921,895.99−42.00%
September44,638.2218,963.64−57.52%
Q3 SUM137,125.5775,100.82−45.23%
October49,136.3240,654.27−17.26%
November57,355.3638,864.61−32.24%
December54,047.7140,857.94−24.40%
Q4 SUM160,539.40120,376.82−25.02%
GRAND SUM603,128.73376,326.12−37.60%
Table 5. Comparative analysis of monthly and quarterly physical flows on exit point from transmission system of Ukraine Drozdovichi in 2019 and 2020 [57].
Drozdovichi—Ukraine to Poland 2019 (GWh)2020 (GWh)Change Trend (%)
January3184.992427.02−23.80%
February3025.121484.12−50.94%
March3343.301984.22−40.65%
Q1 SUM9553.415895.37−38.29%
April 3139.511903.52−39.37%
May4007.321763.24−56.00%
June3127.924058.7629.76%
Q2 SUM10,274.767725.53−24.81%
July4383.482700.40−38.40%
August3217.012493.22−22.50%
September3221.401615.44−49.85%
Q3 SUM10,821.896809.06−37.08%
October3293.253037.83−7.76%
November4438.483298.43−25.69%
December3587.713515.50−2.01%
Q4 SUM11,319.439851.76−12.97%
GRAND SUM41,969.4830,281.72−27.85%
Table 6. Comparative analysis of monthly and quarterly physical flows on exit point from transmission system of Ukraine Isaccea in 2019 and 2020 [57].
Isaccea—Ukraine to Romania2019 (GWh)2020 (GWh)Change Trend (%)
January13,284.64-−100.00%
February7772.81793.94−89.79%
March7874.25332.61−95.78%
Q1 SUM28,931.701126.54−96.11%
April9538.9977.97−99.18%
May7780.10167.61−97.85%
June7163.42281.73−96.07%
Q2 SUM24,482.51527.31−97.85%
July8037.09426.89−94.69%
August8029.36620.85−92.27%
September5848.49813.13−86.10%
Q3 SUM21,914.941860.87−91.51%
October8280.98652.75−92.12%
November7742.091475.98−80.94%
December8247.461592.48−80.69%
Q4 SUM24 270.543721.21−84.67%
GRAND SUM99,599.697235.93−92.73%
Table 7. Historical annual physical flow from Ukraine to Poland on Drozdovichi interconnection [57].
YearAnnual Flow (GWh)
201436,255
201539,029
201648,122
201749,724
201842,597
201941,955
202030,281
Table 8. Historical annual physical flow from Ukraine to Slovakia on Velke Kapusany interconnection [57].
YearAnnual Flow (GWh)
2014330,573
2015400,999
2016516,946
2017565,166
2018517,589
2019601,505
2020376,326
Table 9. Historical annual physical flow from Ukraine to Hungary on Beregovo interconnection [57].
YearAnnual Flow (GWh)
201468,599
201563,092
201670,963
2017123,228
2018127,458
2019148,106
202070,121
Table 10. Historical annual physical flow from Ukraine to Romania on Isaccea interconnection [57].
YearAnnual Flow (GWh)
2014229,589
2015177,056
2016196,975
2017212,700
2018189,339
2019106,877
20207235
Publisher’s Note: MDPI stays neutral with regard to jurisdictional claims in published maps and institutional affiliations.

