1. Introduction
Oil and natural-gas productions involve drilling wells into the reservoir, and the success of this operation depends, among other factors, on the efficiency of the drilling fluid used. The drilling process is carried out using a drill bit connected to a long drill pipe sequence [
1,
2,
3,
4,
5]. Applying a downward force and rotation to the drill bit, it crushes the rock into small cuttings, and with the action of the drilling fluid that circulates from the surface through the drill pipe onto the drill bit’s face, these cuttings are brought up to the surface [
1,
6,
7].
In addition to removing these cuttings, drilling fluids perform essential functions such as cooling and lubricating the drill bit, stabilizing formation pressures, and allowing an adequate geological-formation evaluation. Regarding the wellbore walls, the drilling fluids reduce the friction between the drill pipe and the wellbore walls and form a low-permeability film (filter cake) to prevent or mitigate the invasion of the filtrate into the rock formation [
8,
9]. According to Civan [
9], mud fines and filtrates are prone to invade and damage the near-wellbore formations. The drilling fluid should also prevent or minimize the swelling of hydratable clays from the formation. These functions make drilling fluids indispensable to the oil industry [
10,
11,
12,
13].
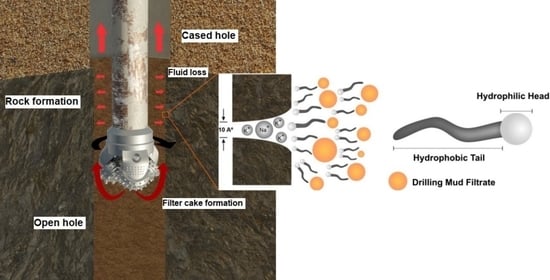
Two of the main problems and challenges related to drilling activity are the fluid loss and gradual increase in the filter cake that can cause damages to the wells and increase the drilling cost. Generally, these two problems coincide in the drilling activity. The fluid loss will cause severe damage to the formation and the particle size distribution on the lost material, the latter being one of the essential factors in fluid-loss control and protecting the formation [
10,
14,
15]. Hence, a suitable drilling practice involves controlling the drilling-fluid filtration, whereas an inadequate design may be associated with borehole instability, excessive torque and drag, pressure-differential sticking, and, as mentioned before, formation damage [
16]. The control of drilling-fluid filtration characteristics includes managing the filtrate volume per unit area and unit time and the quality of the resulting filter cake formed in the wellbore [
17].
The filter cake’s formation on the wellbore walls is an essential parameter in fluid loss, so the drilling fluid should form a thin, impermeable filter layer that presents excellent sealing properties. Simultaneously, this filter cake is expected to minimize fluid permeation and drilling solids in the formation and withstand a high unbalanced differential pressure [
11,
18]. Microemulsion-based drilling fluids directly contribute to an efficient formation of this filter cake, as there is a significant reduction in the tensions between the drilling fluid and the wellbore surface, so the fluid loss is minimized [
19,
20,
21].
Microemulsions were first observed by Schulman [
22] and Winsor [
23] and were extensively researched between the 1970s and 1980s, motivated by two oil crises in 1973 and 1979, respectively [
24]. These structures are macroscopically isotropic mixtures composed of at least one hydrophilic, one hydrophobic, and one amphiphilic component, and they are both thermodynamically stable and transparent [
25,
26]. Thus, they can be defined as high-aggregation systems in which water and oil are homogeneously mixed due to amphiphilic substances called surfactants [
27]. In general, microemulsions are an excellent option to replace non-aqueous drilling fluids, as they present considerable thermal stability, reduced costs, and exemplary performance in different types of formation. Another critical advantage presented by microemulsions is their environmentally friendly status, as they are based on non-damaging components.
The use of surfactants in water-based drilling fluids is already known in the literature. For instance, nonionic surfactants such as Tween 80/ZnO nanoparticles [
28] and 2-hexadecyloxyethnol [
29] have been applied in water-based drilling fluids to enhance their rheological properties, lubricity, and clay-inhibition behavior. The nonionic surfactant Tween 80 increases the drilling fluid’s viscosity and provides clay-swelling inhibition and coating characteristics, improving rheology, filtrate loss, lubricious property, and clay-inhibition behavior of water-based drilling fluids.
Drilling fluid properties may be modified by the use of nanocomposite additives, such as TiO
2/ Polyacrylamide (PAM), through the polymerization of acrylamide monomer in the presence of high-hydrophilic–lipophilic-balance (HLB) surfactants, such as sodium dodecyl sulfate and Tween 80, obtaining lower filter-cake thickness and fluid loss as it increases the surfactant concentration [
30]. The performance of drilling fluids may also be affected by the formulation of the kind of surfactant (nonionic or ionic) [
31], especially a nonionic surfactant, which presents a higher HLB, as it provides low filtrate loss and filter-cake thickness. The same sort of performance was achieved when the nonionic surfactant Span 80 [
32] and other additives were used to synthesize core-shell nanocomposites to replace the traditionally applied CaCO
3 as a bridging agent, resulting in higher performance in filter-cake thickness and fluid-loss control.
Alongside the various other applications of nanomaterials, such as enhanced oil recovery, wettability alteration, and interfacial-tension reduction (IFT) between reservoir fluids, they are being used in work to improve rheological properties, filtration loss, and viscosity, among other things [
33,
34,
35]. TiO
2 nanoparticles-bentonite (TNBT) nanocomposites are also used to improve the properties of drilling fluids, especially concerning fluid loss and filter cake. They act directly to improve the fluid’s lubricity (0.24 to 0.28) [
36], as do microemulsions, which also provide good lubricity coefficients in drilling fluids (0.12 to 0.20) [
35], lower filter-cake thickness, and stabilization of the wellbore [
35,
37]. They also may improve clay- and shale-swelling inhibition for water-based fluids. The clay swelling may cause an increase in viscosity due to the expansion of bentonite in water, which increases the drilling fluid’s viscosity. Therefore, microemulsions can reduce water intake in the pores.
The nonionic surfactant Ultranex NP100, used in this work, presents excellent emulsifying properties, like TW80. NP100 has a hydrophilic head that can attract toward a clay surface, thus coating it, and a hydrophobic tail that can repel water molecules, which are both of the most frequent characteristics of potential shale inhibitors [
38]. However, NP100 has been used not as an additive for water-based drilling fluid (WBDF) but as the continuous phase per se, with an aqueous phase composed of water-glycerol and low-cost vegetable oil as an oil phase. Microemulsion-based drilling fluids are considered low-cost, environmentally friendly, and present excellent thermal properties, providing low filtrate volume and filter-cake thickness.
Microemulsion-based drilling fluids present certain advantages over conventional drilling fluids. They have been used due to their reduced costs, stabilization when facing various formation types, and reduced environmental damage [
39,
40,
41,
42]. Considering the microemulsion-based drilling fluids formed by a nonionic surfactant, an aqueous phase, an oil phase, and additives, this work aims to study the influences of the NP100 surfactant (nonionic and biodegradable) and pine oil (vegetable oil) on the formation of the filter cake and filtrate volume, in order to obtain environmentally acceptable drilling fluids.
2. Materials and Methods
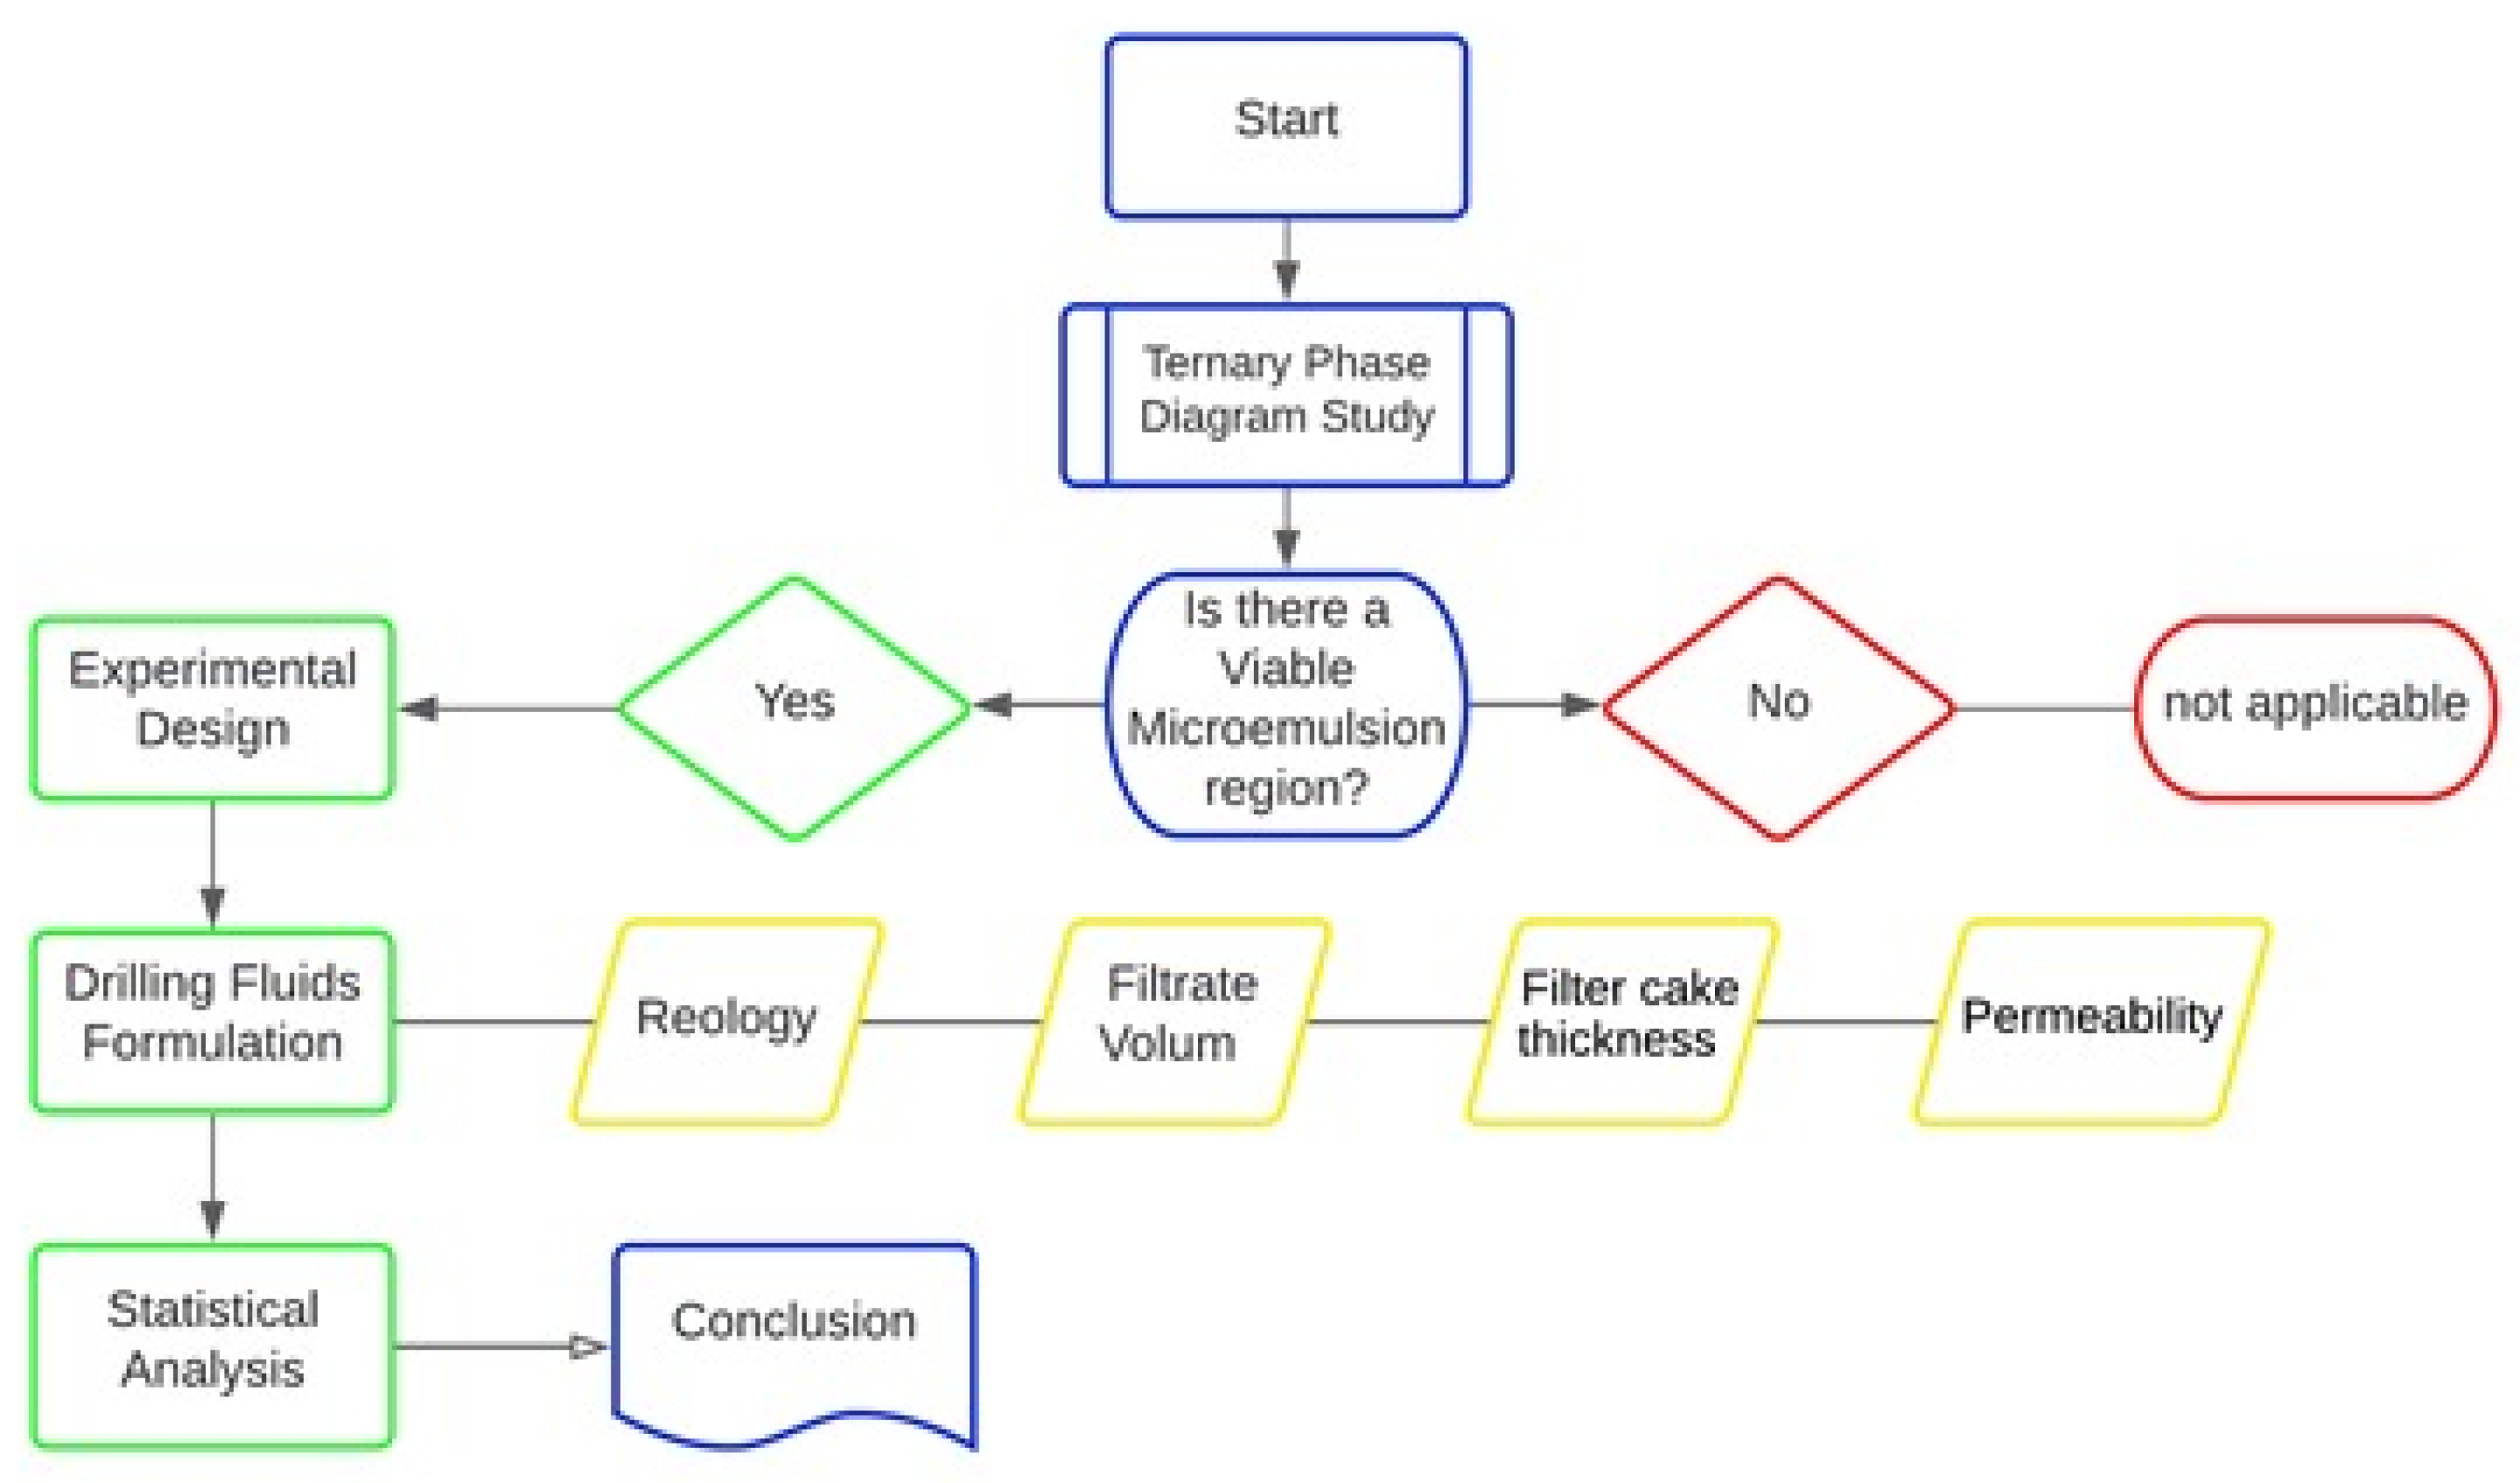
An experimental flowchart and step-by-step procedures for conducting the laboratory work of the present study are illustrated in
Figure 1. The work can be divided as such: (i) A brief description of the ternary phase diagram along with the components that make up the microemulsion (nonionic surfactant NP100, pine oil, and water-glycerol solution) to determine the area of interest. This step is of fundamental importance to prepare the drilling fluids. Experimental planning was adopted to investigate the desirable region, and the 12 drilling fluids design (4 in factorial points, 4 in axial points, and 4 in central points) was determined. However, the experimental design is presented in detail only in the results. (ii) An introduction to the basic methodology for examining the drilling fluids and all the tests in which the formulated fluids were submitted: rheology, filtrate volume, and filter-cake thickness and permeability. (iii) The results for all fluids formulated within the experimental design. (iv) A statistical analysis based on the obtained results.
2.1. Ternary Phase Diagram
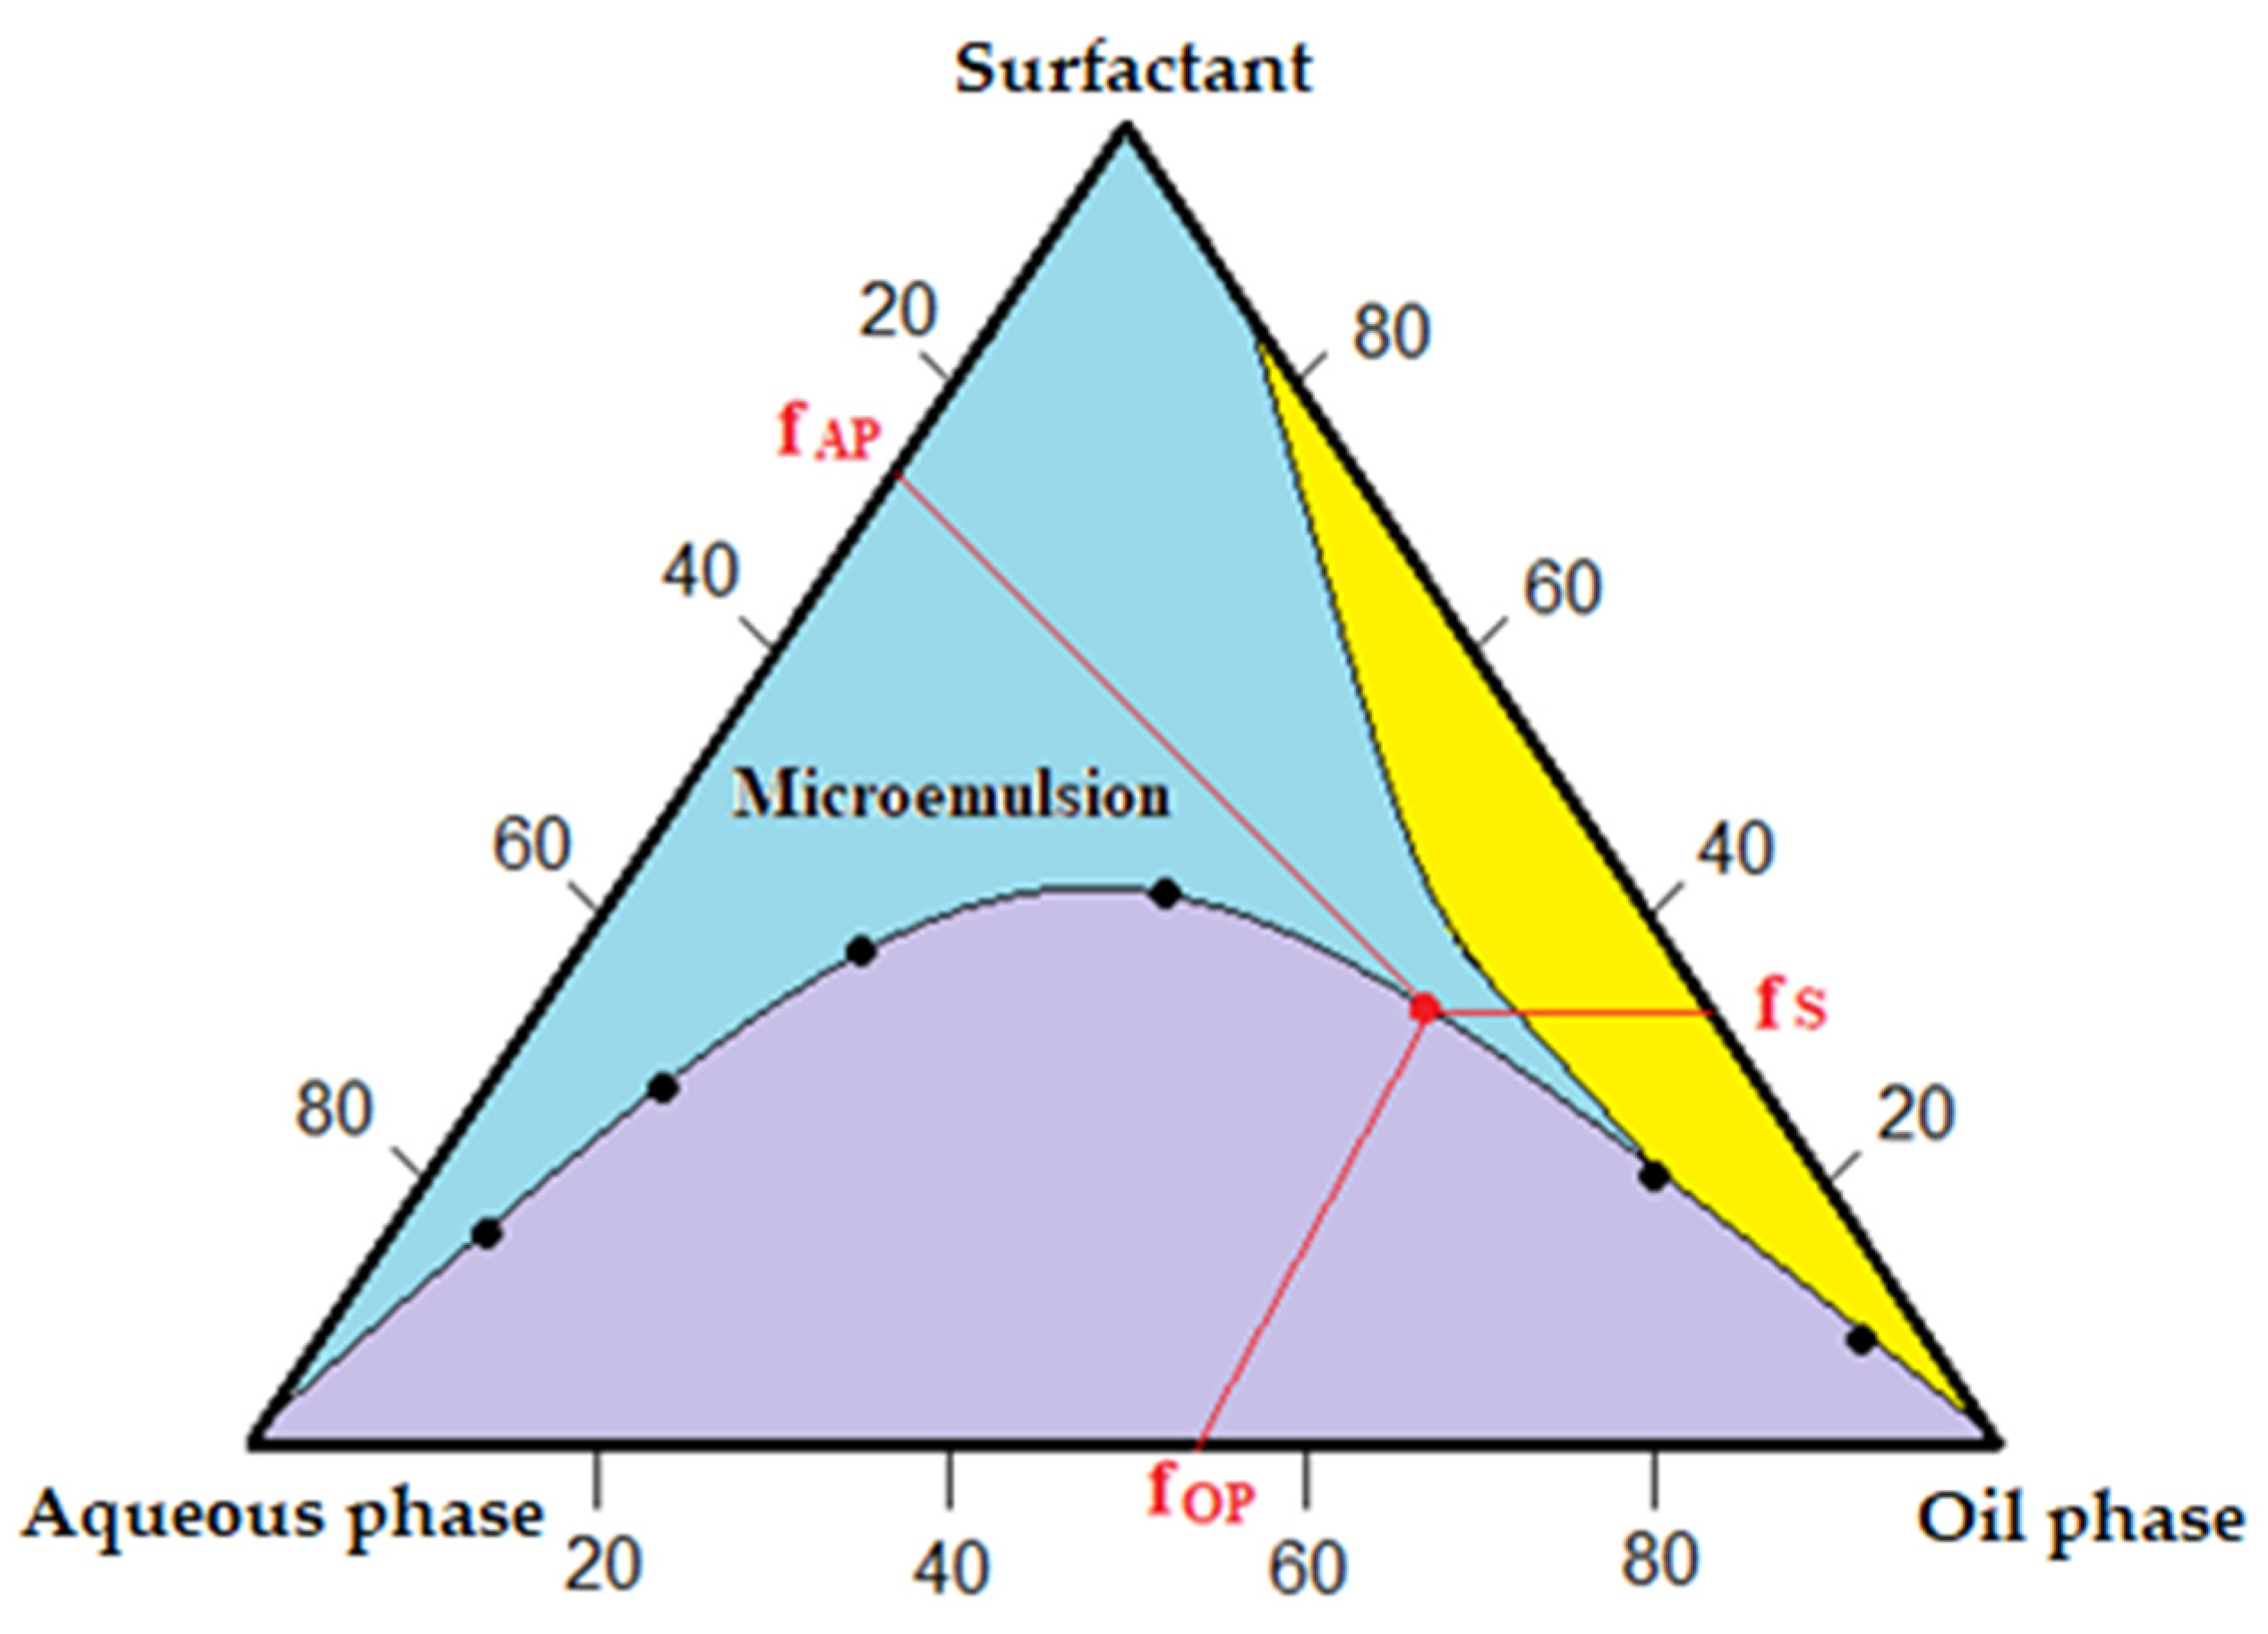
The ternary phase diagram (
Figure 2) was created by plotting the mass fractions of 3 components (surfactant, aqueous phase, and oil phase) corresponding to the region’s point within the diagram. The mass fractions f
S, f
AP, and f
PO in the diagram were calculated by mass balance from the masses of each component obtained experimentally through the titration methodology. The titration consisted of fixing two component’s mass ratios and titrating a third component to reach a monophasic ternary mixture (blue region). The diagram indicates that the microemulsion region (Winsor IV or WIV) was reached.
The region below the solubility curve (region in lilac) corresponds to a 3-component mixture with 2 or 3 phases. The mixture with 2 phases in this lilac region can be an oil-in-water (O/W) microemulsion in equilibrium with the excess oil phase (Winsor I or WI) or a water-in-oil (W/O) microemulsion in equilibrium with excess aqueous phase (Winsor II or WII). The presence of 3 phases corresponds to a microemulsion in equilibrium with an excess in the aqueous and oil phases (Winsor III or WIII). The yellow region corresponds to a partial miscibility between the surfactant and the oil phase. The three components’ mass ratio has not yet been sufficient to form a microemulsion.
A 2k factorial design was used in the microemulsion area with four center points (central composite design) and axial points. Twelve microemulsion points were defined and used later in the drilling fluids’ formulation, when the influences of NP100 surfactant and pine oil on the filtrate volume and the formed filter-cake thickness were investigated.
2.2. Drilling Fluid Formulation
Initially, 12 drilling fluids were experimentally prepared. All drilling fluids presented in their composition the exact amounts of solid additives indicated in
Table 1. The formulated drilling fluids only slightly differ from the microemulsion studied, composed of the surfactant NP100, pine oil, and the water-glycerol solution. The additives were included in the microemulsion at 10 min intervals, under intense agitation of 17,000 rpm, using a Hamilton Beach Fann Model HMD200 mixer (Hamilton Beach, Richmond, VA, USA).
2.3. Rheological Study
The drilling fluids were stirred for 5 min after 24 h from their preparation at 55 °C. Subsequently, the apparent-viscosity and plastic-viscosity parameters were determined. The apparent viscosity was calculated by dividing the reading at 600 rpm by 2, and the plastic viscosity by subtracting the reading at 600 rpm from the reading at 300 rpm. The rheological experiments were carried out in a Fann Model 35-A viscometer (from Hamilton Beach, Glen Allen, VA, USA) according to API RP 13B-1 (American Petroleum Institute Recommended practice), 2017 [
43].
After the fluid-loss tests, the filtrate’s viscosity for each fluid was evaluated using the Brookfield rheometer model DVIII ultra and a spindle-CP52 (Middleboro, MA, USA). The rheometer, coupled with a thermostatic bath and a computer, read the filtrate’s viscosities at 30 °C and 55 °C. The measurements were obtained automatically at each temperature, varying only the rotation speed. The Rheocalc Software provided, in tables, the viscosity readings.
2.4. Filtrate Volume
The filtrate volume was obtained through API fluid-loss test in an API filter press, in which a constant pressure of 100 psi was applied for 30 min with compressed air at room temperature, according to the standard API RP 13B-1 [
43]. In total, 250 mL of the drilling fluid was used for the test. After 30 min, the filtrate volume was obtained. The test’s obtained values were used to apply the central composite design (CCD) and response surface methodology with the filtrate volume (F
V) as the response variable.
2.5. Filter-Cake Thickness and Permeability
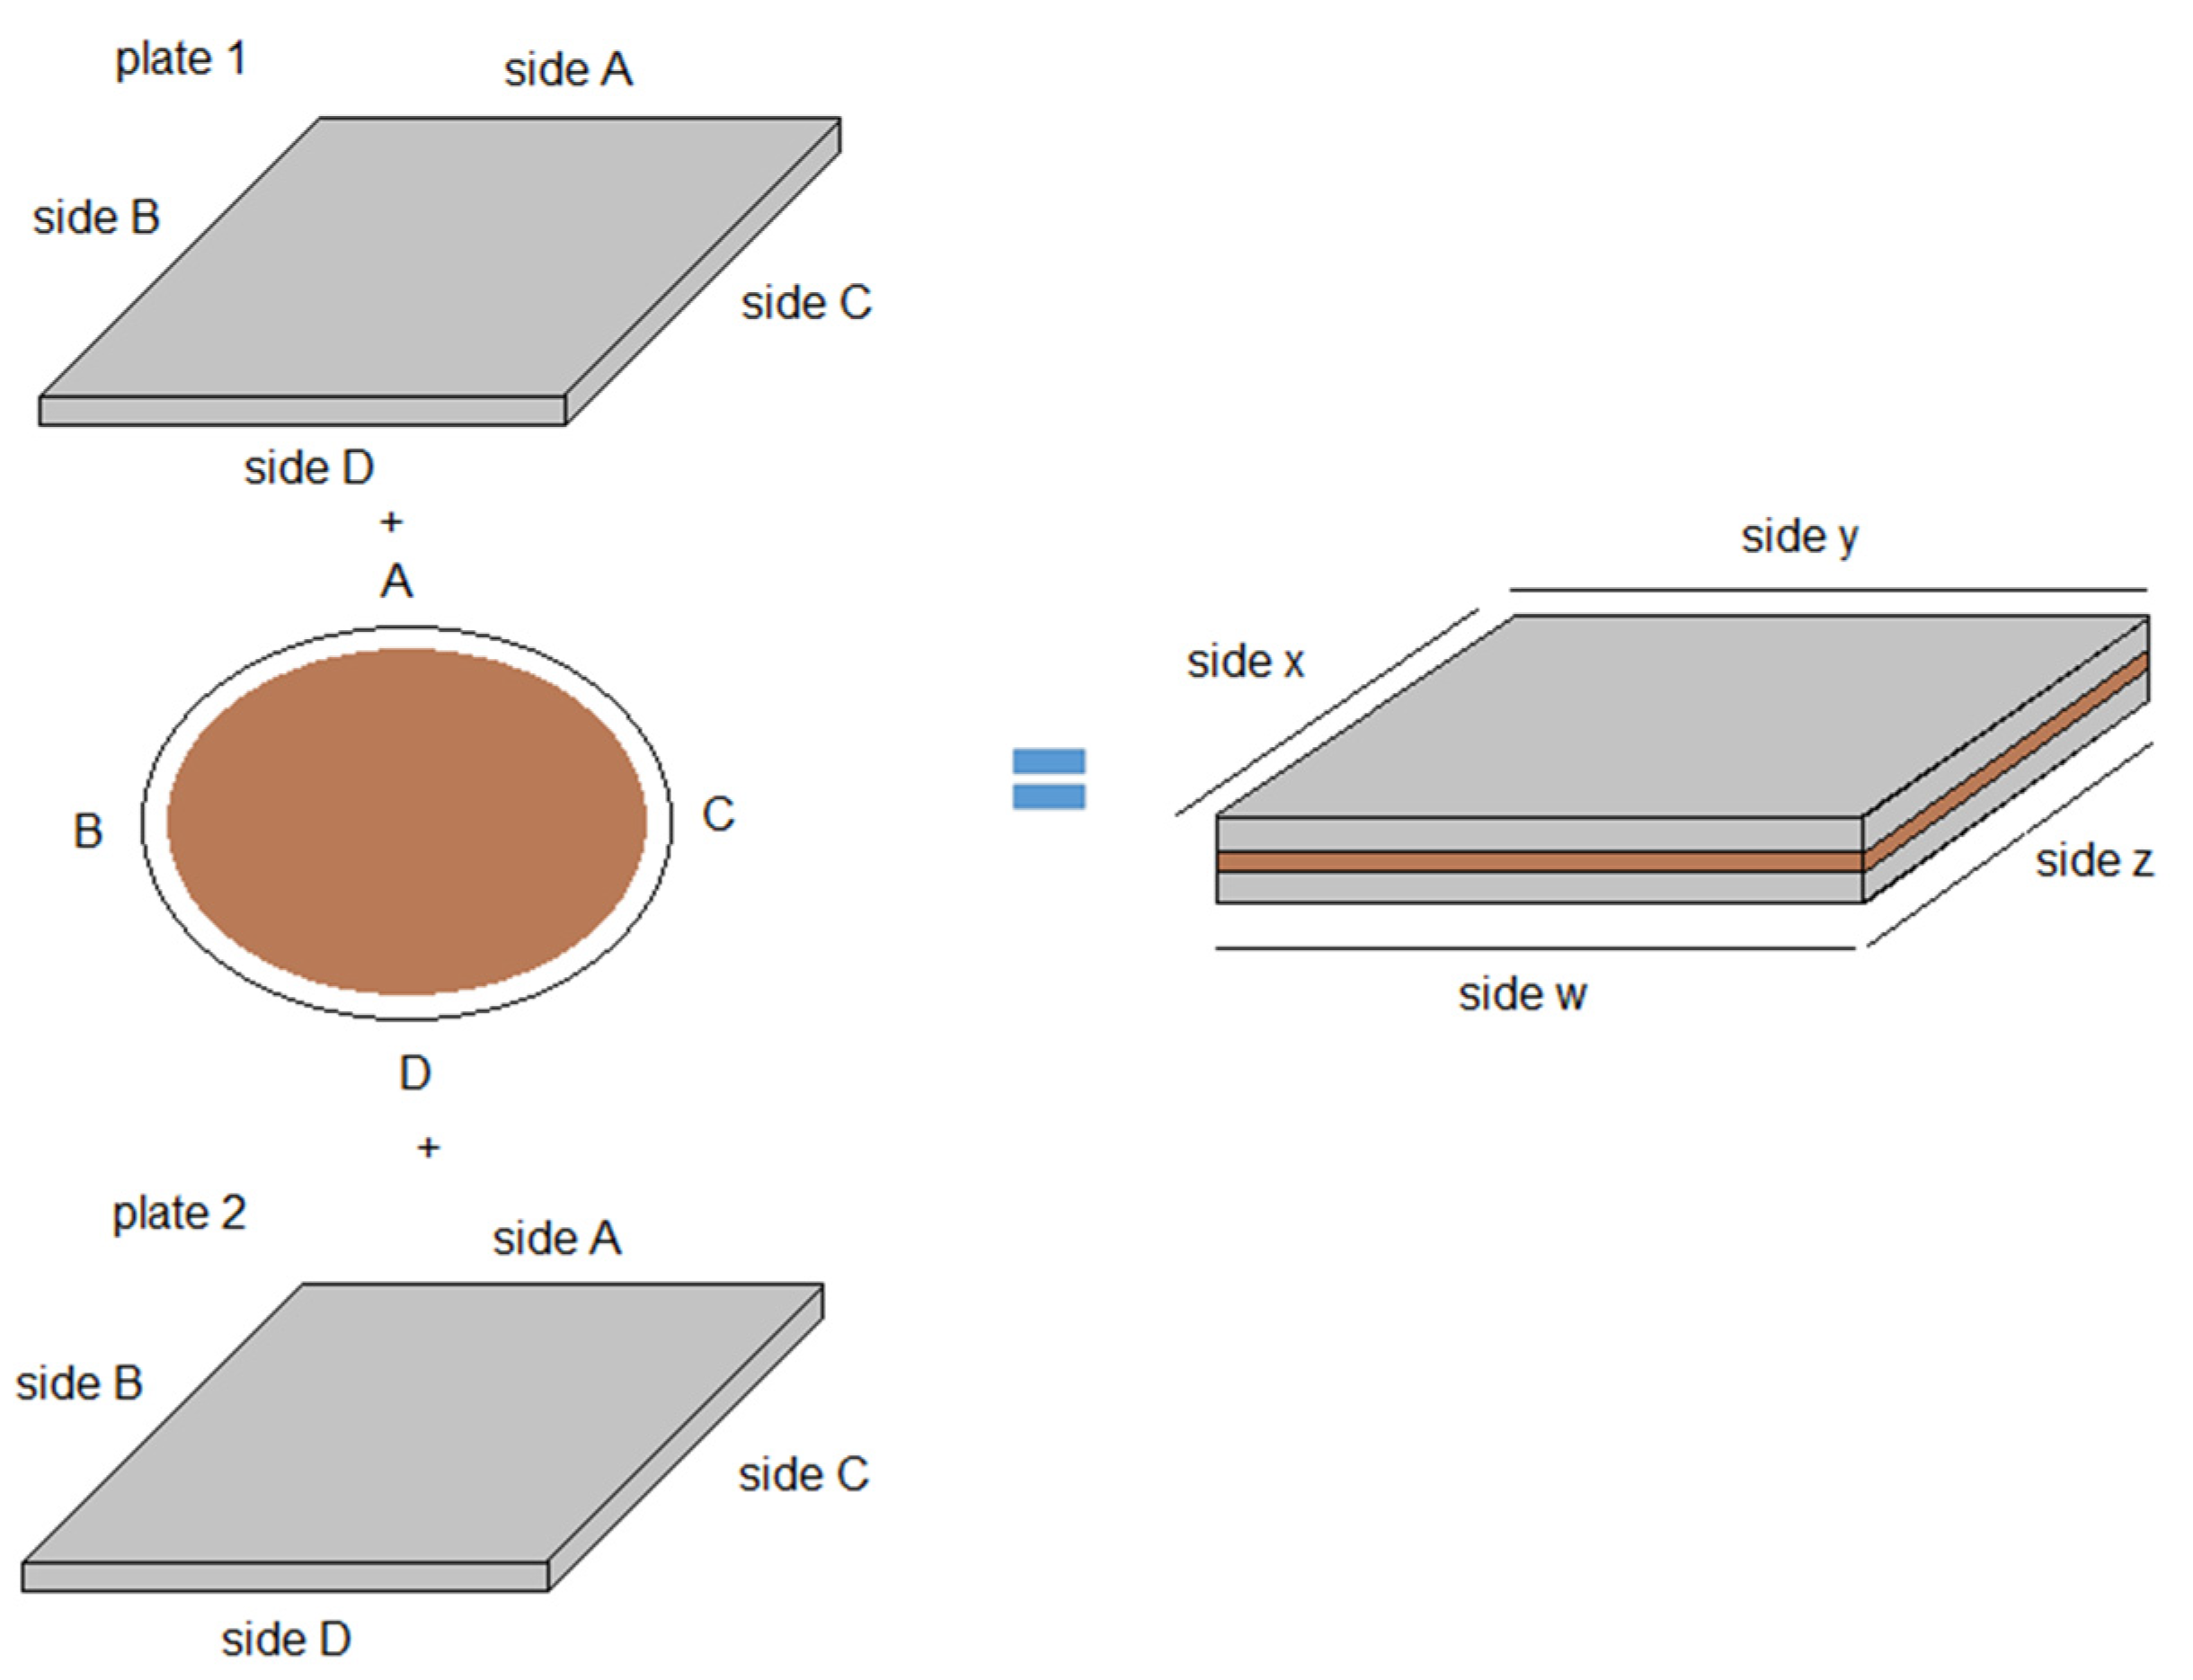
After the API fluid-loss tests, the filter medium—Whatman filter papers—was removed, and the filter-cake thickness (thkns) formed during the test was measured. Initially, the plates’ thicknesses (sides A, B, C, and D) were measured using a caliper (
Figure 3).
Subsequently, the filter paper with the filter cake was placed between the two glass plates, and the thicknesses of the x, y, z, and w sides were measured. It was subtracted from the thickness of the y side, the sum of the side A’s thicknesses of plates 1 and 2, and the filter paper’s thickness, resulting in the filter-cake thickness on side A. This procedure was repeated for the other three sides (B, C, and D), and then the final filter cake’s thickness was calculated by the arithmetic mean of sides A, B, C, and D.
The filter cake’s permeability was then calculated using Darcy’s equation [
44] for 100 psi and 30 min conditions [
43], resulting in Equation (1):
where k is the permeability (mD); Q
f is the filtrate volume (mL); ε is the filter-cake thickness (mm); and μ is the filtrate’s viscosity (cP) at 30 °C and 55 °C.
3. Results and Discussion
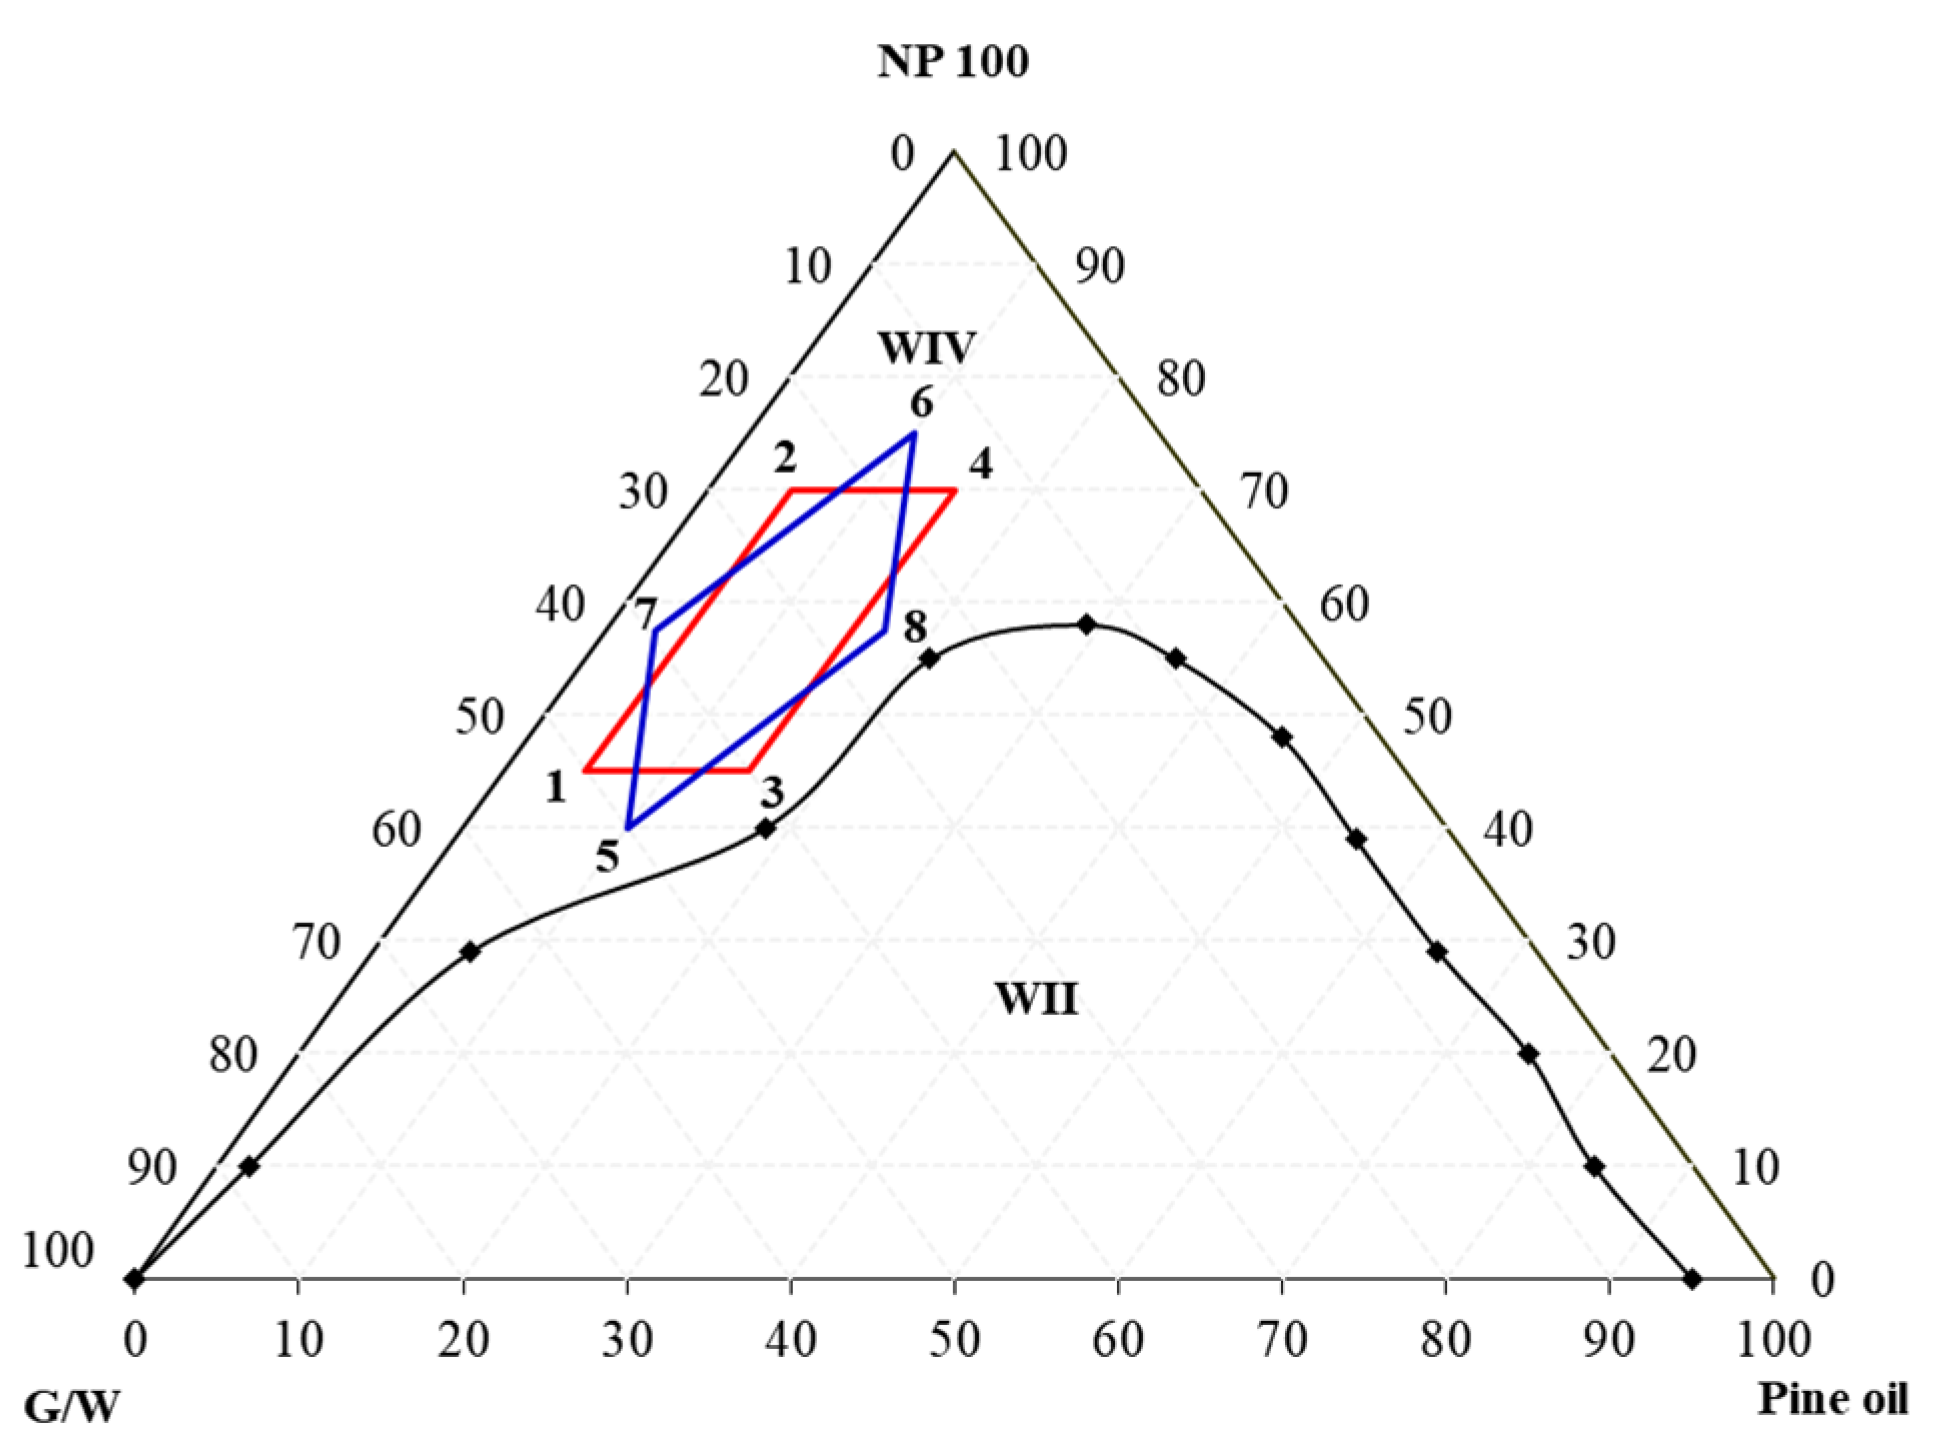
Figure 4 shows the factorial points (rectangle in red) chosen at random, and the axial points (rectangle in blue) obtained with the factorial design method, considering the value of α, for two factors of 1.41. Central Composite Rotational Design (CCRD) was used for experimental design.
In this specific experimental design, there are 12 points, which were distributed into: factorial points, axial points (+α) and (−α), and central points (0). The factorial points correspond to levels (+1) and (−1). These levels indicate the highest and lowest values assumed by the independent variables. They are considered the basic levels and delimit the area in which the experimental model can be applied. The axial points are points that allow the estimation of quadratic terms in the model. These points allow the factorial design to be transformed into a composite central response surface design. The center points are repeated points represented by (0) and, when added to an experimental design, make it possible to identify if there is inflection (curvature) in the adjustment of the data.
Table 2 shows the 12 microemulsion points in real and coded values of the surfactant (NP100), pine-oil, and aqueous-phase (water-glycerol) concentrations.
3.1. Rheological Study
Table 3 presents the plastic-viscosity and apparent-viscosity data.
Based on [
43], the viscosity values obtained are in accordance with Petrobras N-2604 (1998), established by the American Petroleum Institute, whereby drilling fluids should present apparent and plastic viscosities greater than 15.0 cP and 4.0 cP, respectively. Furthermore, it can be said that the viscosity values (above 100 cP) are mainly due to the presence of glycerol and NP100 surfactant in significant quantities.
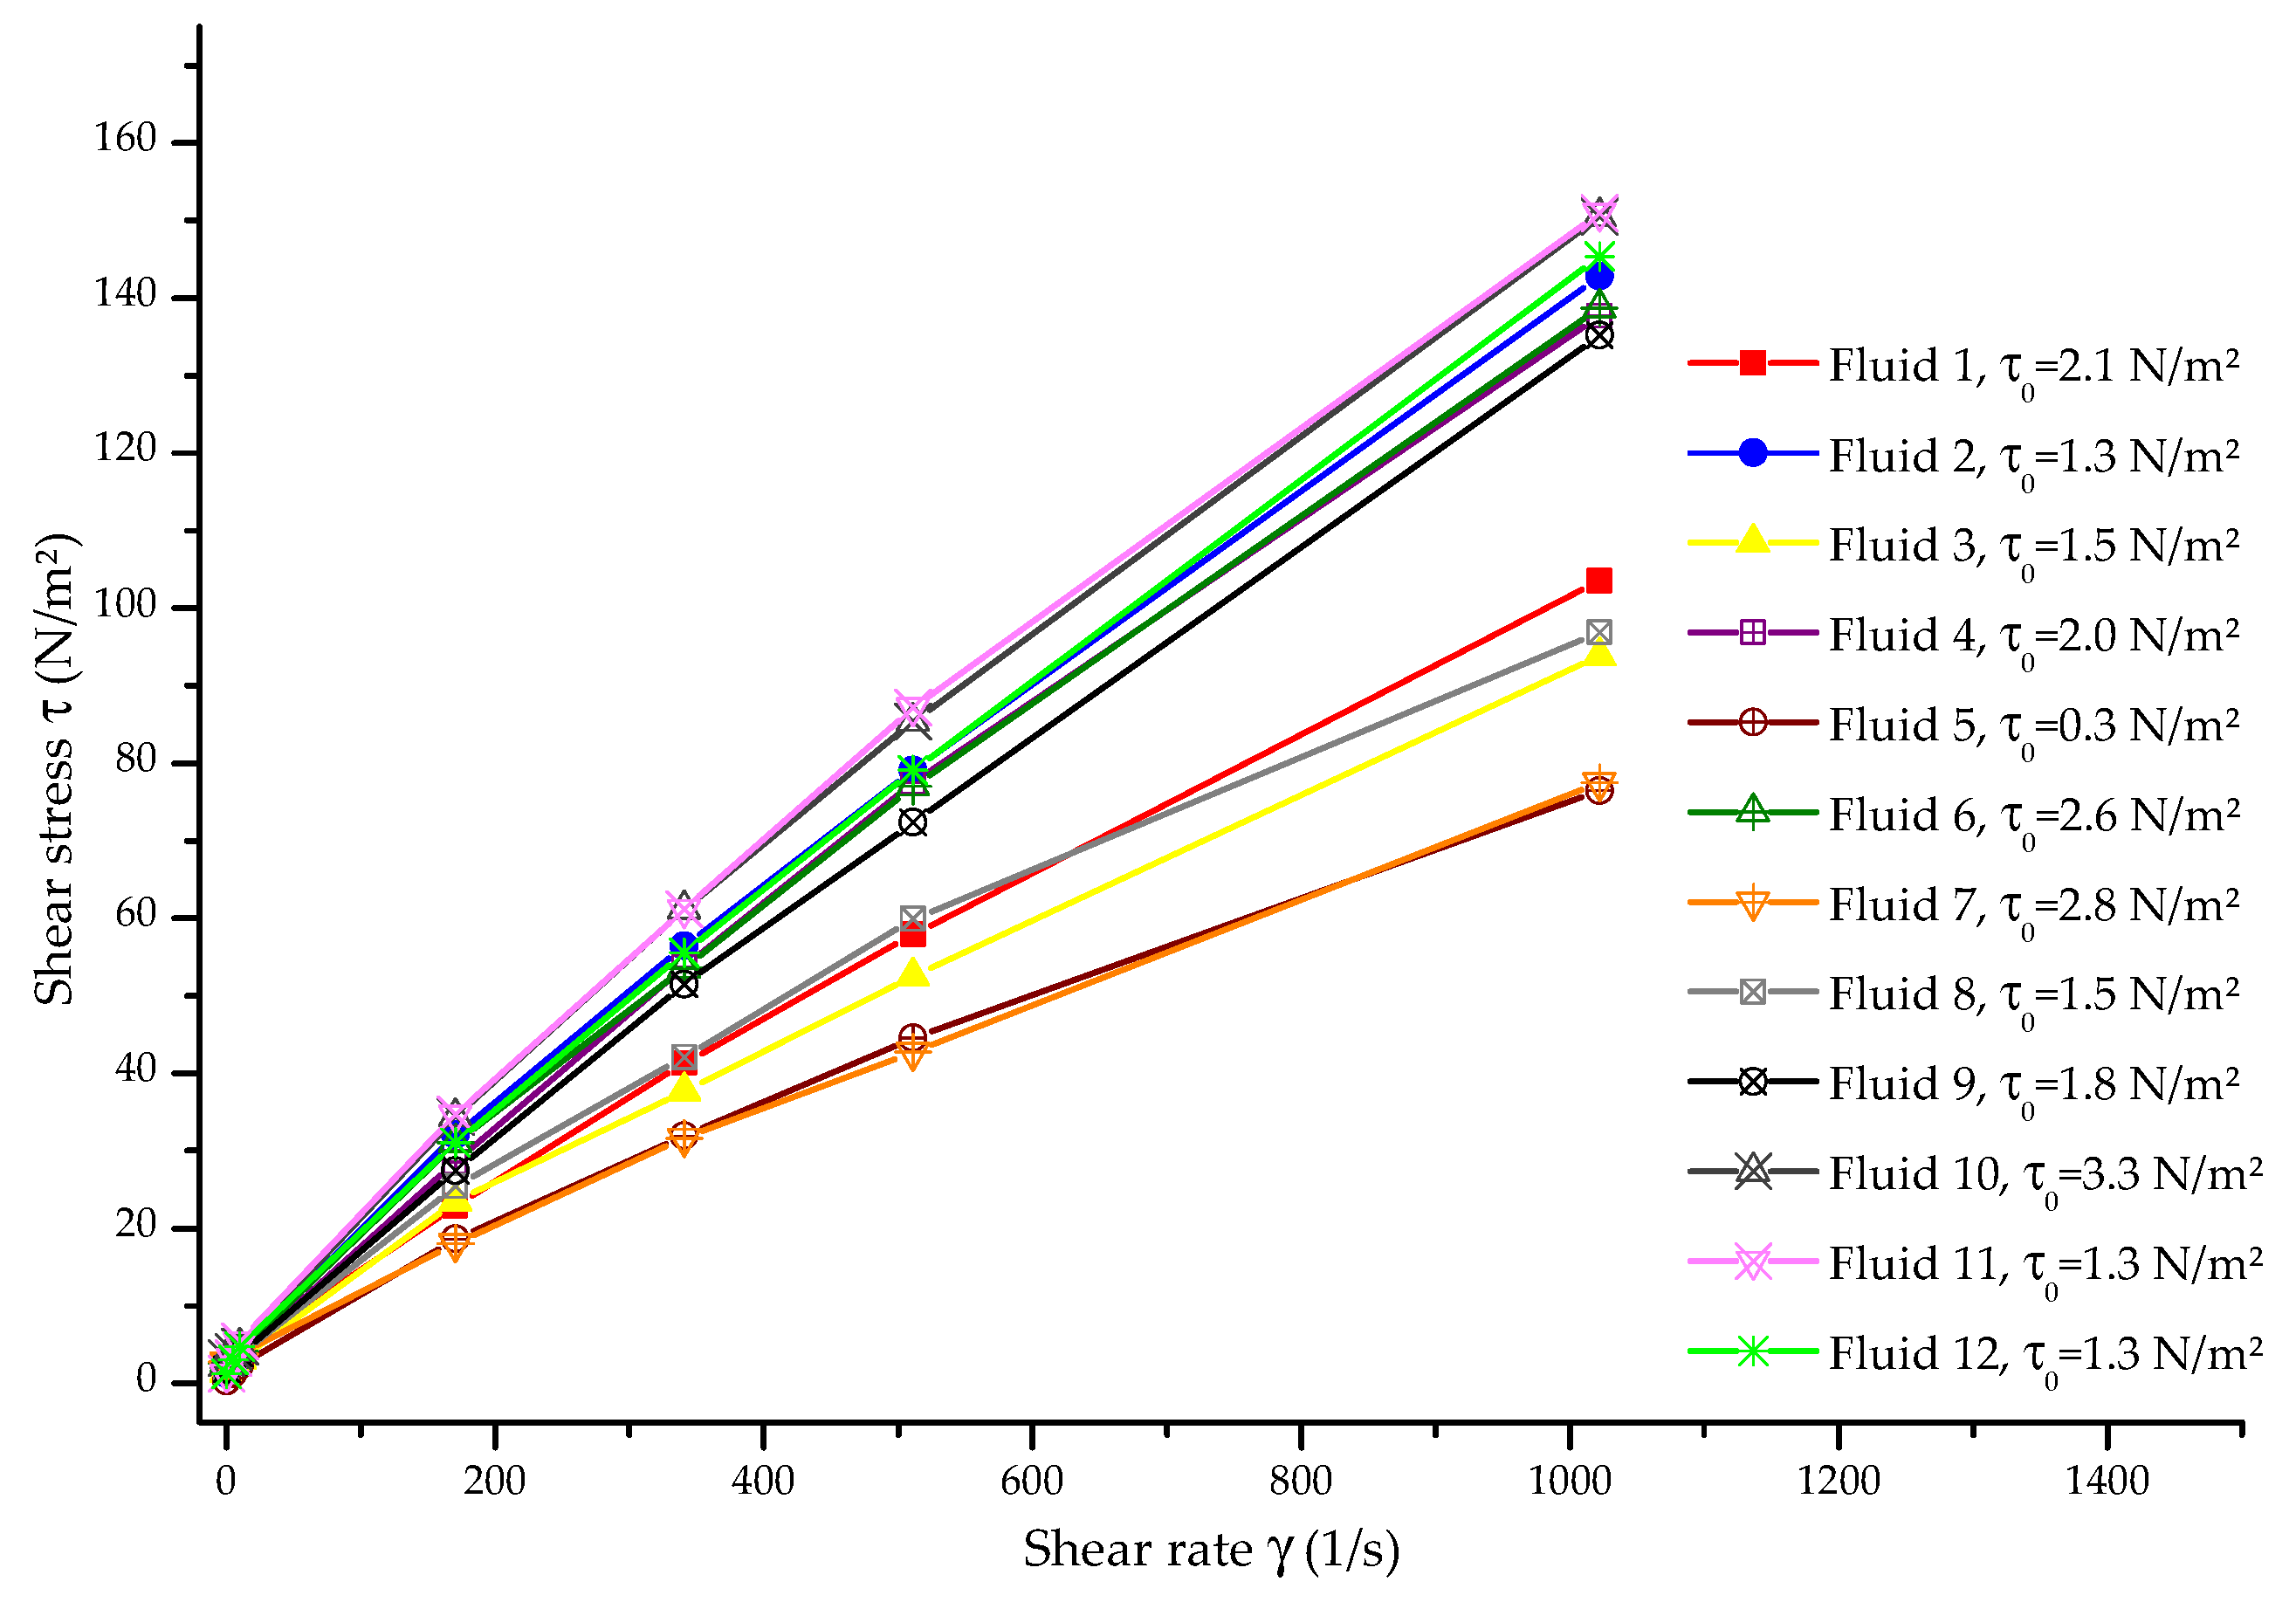
The drilling fluids were classified according to the Herschel–Bulkley model. The drilling fluids that follow this model have a solid structure below the yield stress, with very high viscosity and considerable initial resistance to flow. All drilling fluids had initial shear stress different from zero, and when reaching the limit yield stress, the fluid-structure broke, and a drop in viscosity could be observed. As the standard Fann-type viscometer does not take readings below 5.1 s
−1 [
45], an interpolation was performed to obtain the low-shear-yield point, τ
0.
Figure 5 shows the flow curves for each drilling fluid along with their τ
0.
According to
Figure 5, it is observed that for the same shear rate value (e.g., 500 s
−1), the shear stress values increased for some fluids. Thus, the same behavior was verified for fluids 5 and 7; 1, 3, and 8; and 2, 4, 6, and central points (9, 10, 11, and 12). The highest shear stress values were obtained for the fluids with the highest amounts of surfactant (2, 4, 6, and central points) (
Table 2), as well as with the highest PV values (
Table 3), probably due to long molecular chains of the NP100 that increased viscosity, as similarly verified in the study by Aftab et al. [
28]. Fluids 1, 3, and 8 had intermediate shear stress values but with lower PV values. In this case, the fact that the amount of water in the fluid was more significant than that of oil, even with moderate amounts of surfactant, reduced the viscosity. Nonetheless, the microemulsion’s stability was maintained. Fluids 5 and 7, with similar amounts of surfactant and water in their formulations, had lower shear stress values. Still, due to a significant amount of surfactant in these formulations, the PV was also high.
3.2. Filtrate Volume
Table 4 presents the obtained filtrate-volume (F
V) values. It is observed that all of them are less than 15 mL, following [
43], established by the American Petroleum Institute.
Analyzing
Table 4, as the surfactant or pine-oil mass fraction increases, there is also an increase in the filtrate volume, with the oil phase being the most influential component. This may occur because the NP100 surfactant has a hydrophilic–lipophilic balance (HLB) equal to 13, is more soluble in water, and, consequently, less soluble in the oil phase. As a result, it favors the formulated drilling-fluid solid particles’ interaction with the aqueous phase (microemulsion O/W). Thus, it is expected that drilling fluids with less oil phase in their composition present a lower fluid loss.
Murtaza et al. [
46] studied the behavior of filtrate loss using quaternary ammonium dicationic surfactant with phenyl linker to minimize clay-swelling problems, severely affecting wellbore stability and obtaining an increase in the average filtrate volume, reaching 19, 10 mL and 18 mL. These data are consistent with the found results, in which the filtrate volume increases with the addition of NP100 surfactant to the microemulsion composition. However, it is worth noting that the highest filtrate-volume value obtained is still acceptable and within the norms.
Paul and Adewale [
47] used Zirconium (IV) oxide (ZRO
2) nanoparticles as additives for WBDM and had average values of 5 mL at 27 °C. In this work, in terms of filtrate volume, the microemulsified base per se provided similar values. With the significant increase in temperature (120 °C), [
46] averaged 12 mL for the filtrate volume, indicating that the drilling fluids remained within API standards. It can be considered that microemulsified bases are thermally stable, and it is expected that similar results may be obtained under HPHT (high pressure high temperature) conditions, as they remain stable/homogeneous above 55 °C, which is the average temperature of some oil reservoirs [
19,
35,
41].
3.3. Filter-Cake Thickness and Permeability
In order to calculate the permeability, the mud filtrate’s viscosity was measured at 30 °C and 55 °C.
Table 5 presents the resulting viscosity of the filtrate at both temperatures and the thickness and permeability of the filter cake.
From
Table 5, it is possible to understand that as the surfactant or pine-oil mass fraction increases, there is also an increase in the filter-cake thickness, with the surfactant being the most influential component. The tests corresponding to fluids 1, 2, 3, 5, and 7 provided lower thickness values than the other tests. This result is consistent with the filtrate volumes obtained (
Table 4) since the surfactant interaction with the aqueous phase reduced the fluid loss and favored the formation of a thinner filter cake.
The desirable filter cake for drilling activities should be as thin and waterproof as possible. The thicknesses obtained can be considered acceptable, as they presented low values similar to those obtained by Bageri et al. [
18]. An average of 1.4 mm was obtained by [
46], who studied the addition of the quaternary ammonium dicationic surfactant. The results obtained are within the expected values for discarding operational problems in the wellbore, suggesting that the average thickness obtained in this work is acceptable.
All drilling fluids showed good permeability results. These results can be compared to [
7], who obtained an average of 0.026 mD. At the highest temperature (55 °C), the average permeability is even lower, implying good permeability performance of the fluids formulated at the well’s operating temperature. All values obtained are considered adequate by [
48].
3.4. Statistical Analysis: Filtrate Volume
Table 6 presents the effects of the regression statistics on the filtrate volume as a response variable.
According to
Table 6, the factors were statistically significant, except for the surfactant interaction with pine oil (Surf × PO = 2.57 × 10
−1), since the
p-value must be less than 0.05. The R
2 value was 0.936. Equation (2) presents the obtained model for the filtrate volume in coded variables.
In order to use the real concentration values X
1 and X
2, shown in
Table 2, it is necessary to use the equation for converting real variables to coded variables. It is important to note that the model obtained is found in coded variables (Surf and PO). Therefore, Equations (3) and (4) give the conversion equations for surfactant and pine oil.
Table 7 presents the ANOVA (Analyses of Variance) results for the model obtained from the filtrate volume.
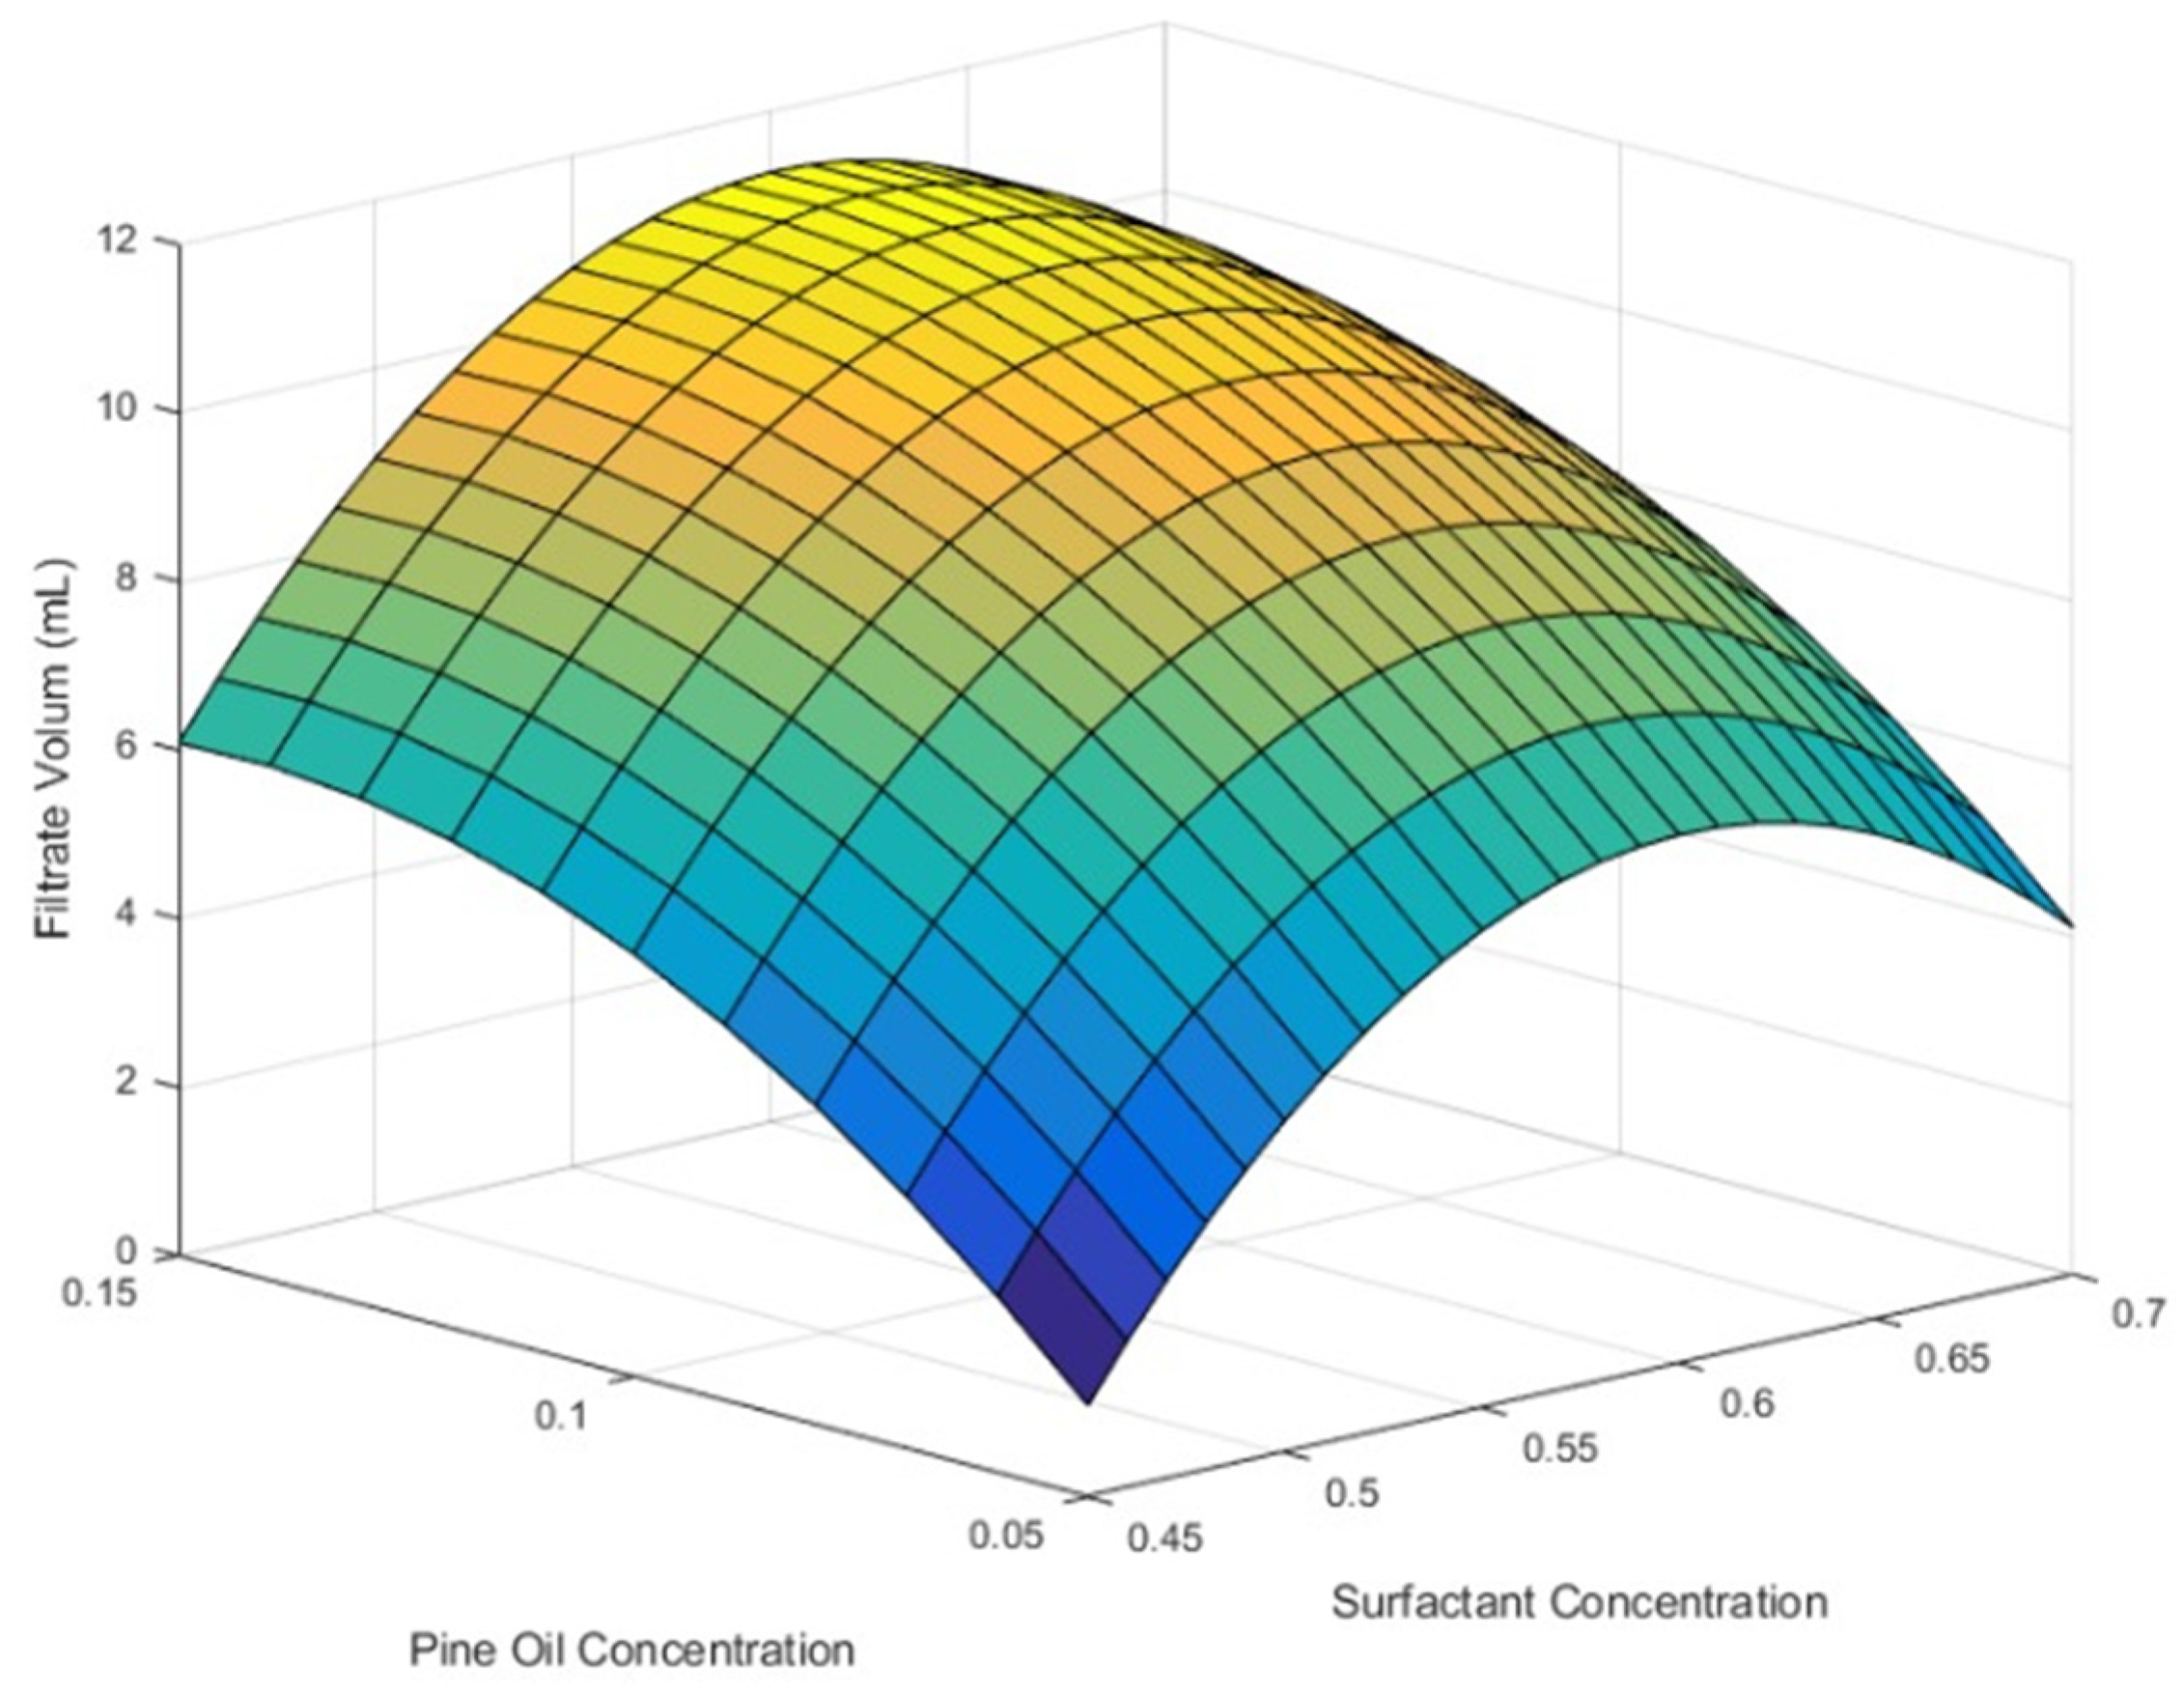
For a 95% confidence interval (α = 0.05), the theoretical F value was compared with the model’s calculated F value. Theoretical F value was determined considering the model’s degrees of freedom and the residual as 4 and 6, respectively. The theoretical F value was 4.53. Since the calculated F value (23.05) is greater than the theoretical F, it verifies the model’s statistical significance. The response surface obtained for the filtrate-volume model is shown in
Figure 6.
It can be seen in
Figure 6 that the filtrate volume increases as the concentrations of pine oil and surfactant approach the central point. This region corresponds to the maximum concentration of pine oil and a medium concentration of surfactant: approximately 57.5% surfactant, 15% oil phase, and 27.5% aqueous phase. Conversely, the lowest filtrate volume corresponds to approximately 45% surfactant, 5% pine oil, and 50% aqueous phase.
3.5. Statistical Analysis: Filter-Cake Thickness
Table 8 presents the results of the effects with the regression statistics for thickness as the response variable.
It was found that the mass-fraction-quadratic terms of the surfactant and the pine oil were not significant, as the p-value was greater than 0.05. In addition, the model’s R
2 value was 0.94, thus indicating that the data adjusted satisfactorily to the model. Equation (5) presents the thickness model in coded variables.
Similarly to the filtrate-volume model, it is necessary to use Equations (4) and (5) to convert the real values into coded ones.
Table 9 presents the ANOVA results for the model obtained from the thickness.
The model’s F-value was calculated disregarding the quadratic terms, which were not significant. The degrees of freedom of the model and the residues were 3 and 6, respectively. The theoretical F value is 4.76. The calculated F value (30.67) being higher than the theoretical F, showing the model’s statistical significance.
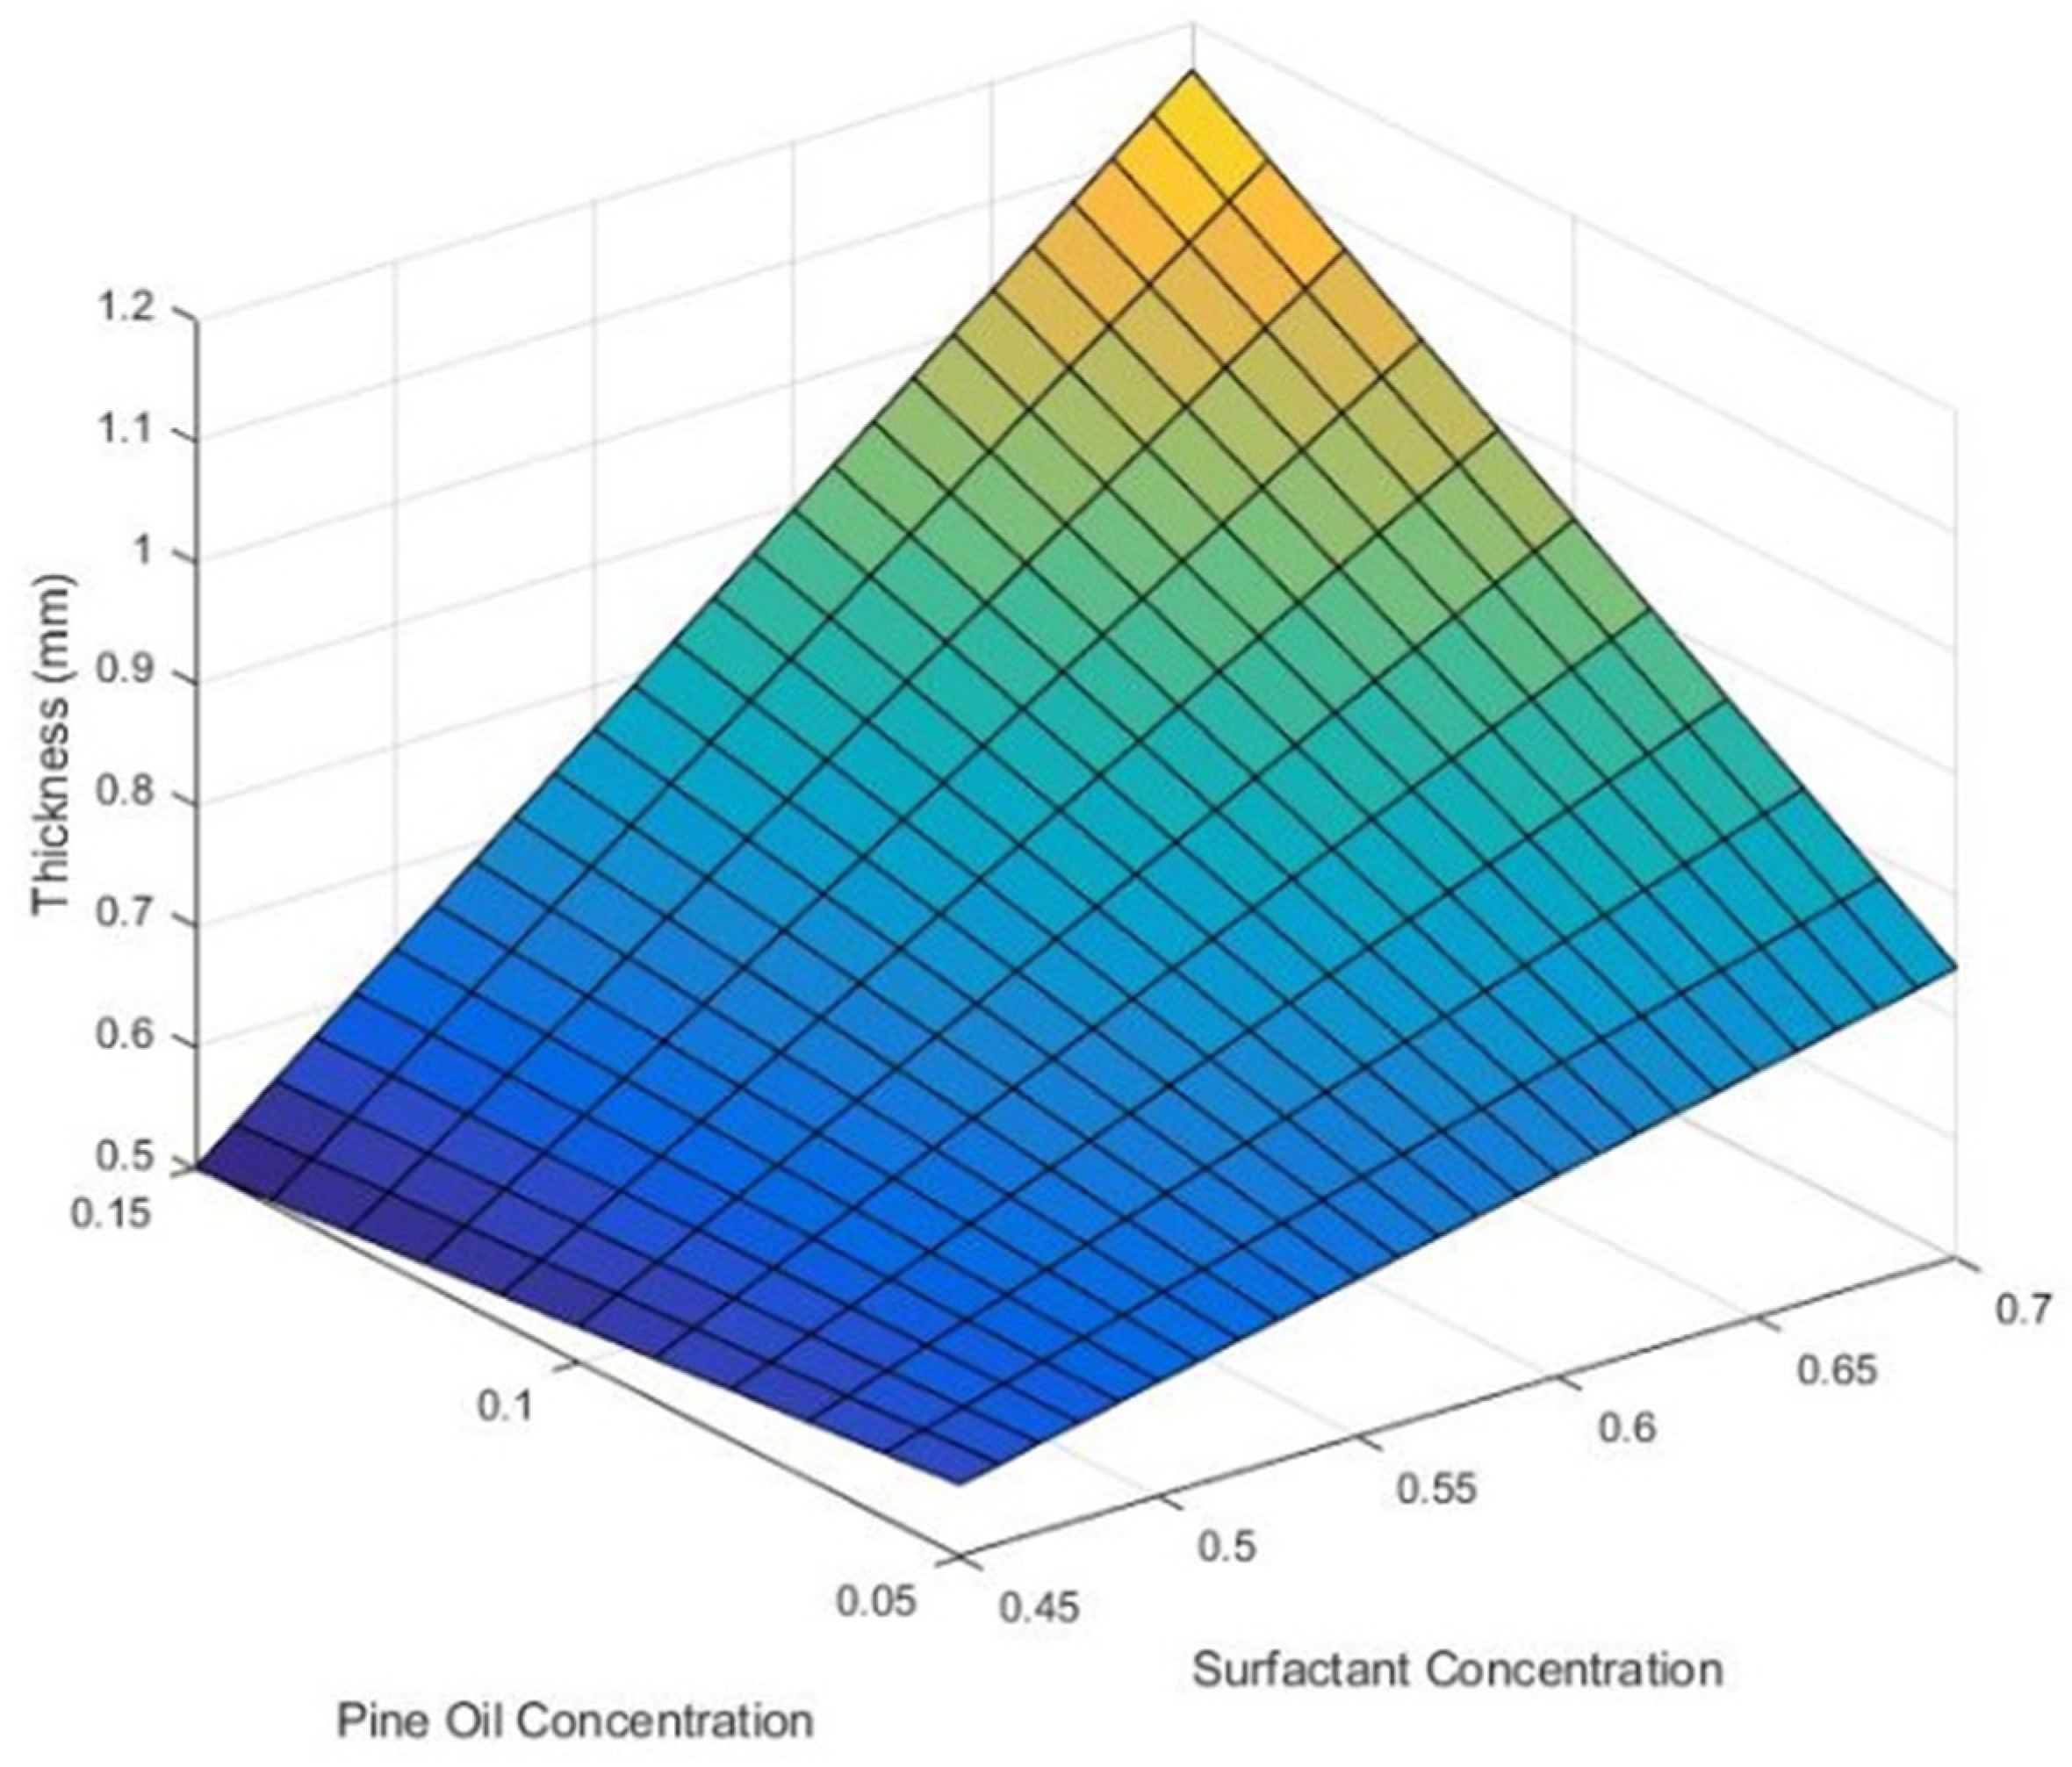
The response surface obtained for the thickness model is shown in
Figure 7.
It can be seen from
Figure 7 that the surfactant’s influence on the filter-cake thickness is greater than the pine oil’s influence. This is because the maximum point corresponds to 70% surfactant, 15% pine oil, and 15% aqueous phase, while the minimum is obtained in approximately 45% surfactant, 15% pine oil, and 40% aqueous phase.
3.6. Model Interpretation
Taking the response surfaces (
Figure 6 and
Figure 7) and comparing them, it is possible to see that the minimum points are divergent. However, the models provide adequate information to determine the best operating condition.
The point with 45% surfactant, 15% pine oil, and 40% aqueous phase minimizes the filter-cake thickness and produces filtrate-volume values close to 6 mL. On the other hand, the point with 45% surfactant, 5% pine oil, and 50% aqueous phase does not minimize the thickness but provides a low value (<0.6 mm) and minimizes the filtrate-volume value (<2 mL). The best operational point minimizes the filtrate volume, as it will provide a good thickness value and ensure that drilling fluids formulated in this condition present less risk of differential sticking and fluid loss.
According to the experimental models obtained, the best performance of the microemulsified system (NP100/Pine Oil/Water-Glycerol) occurs with a smaller composition of surfactant or pine oil, which implies that the aqueous phase is in abundance in the system; and these results are consistent with the hydrophilic nature of the NP100 surfactant. Therefore, a dilution in water in these drilling fluids should favor the microemulsified system’s interaction, expecting promising results for the filtrate volume and filter-cake thickness.
It is still possible to state that compositions on the right side of
Figure 3, that is, high compositions of pine oil and surfactant, will result in drilling fluids that will not meet the minimum specifications. This fact is due to the hydrophilic character of the NP100 surfactant will result in an unstable microemulsion system


