
Production Profile of Farms and Methane and Nitrous Oxide Emissions


Abstract
1. Introduction
2. Methodology
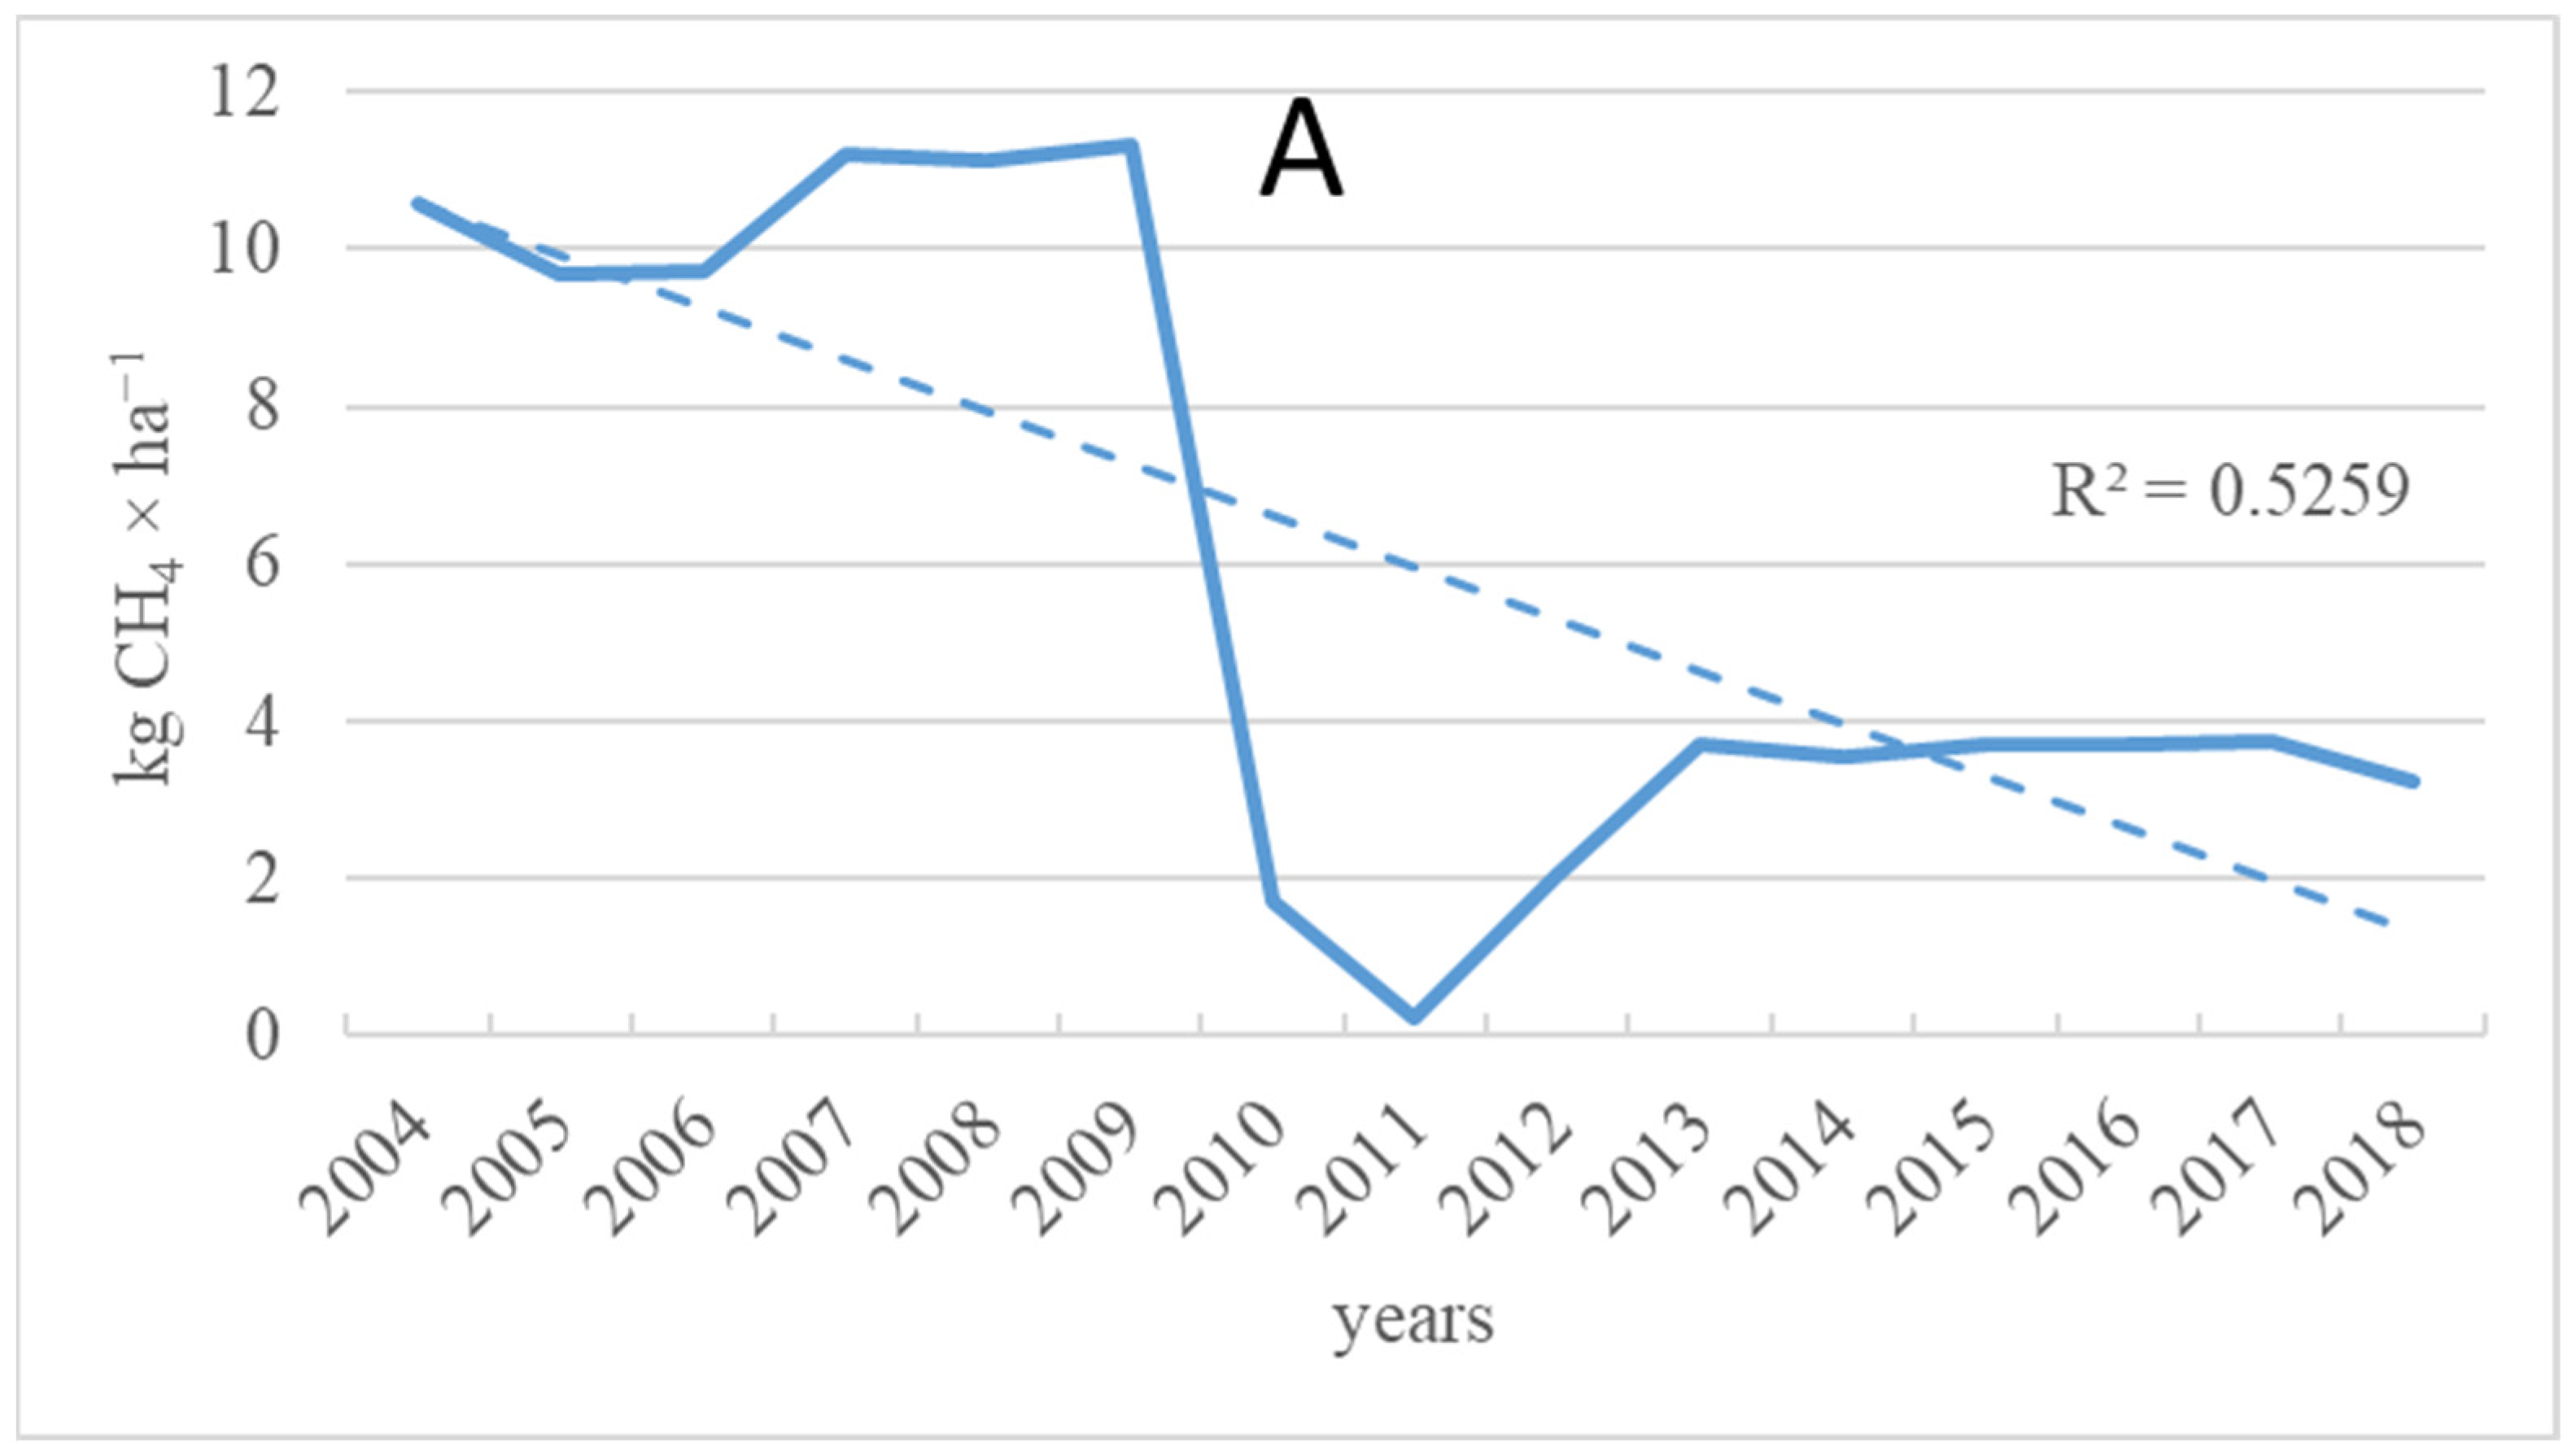
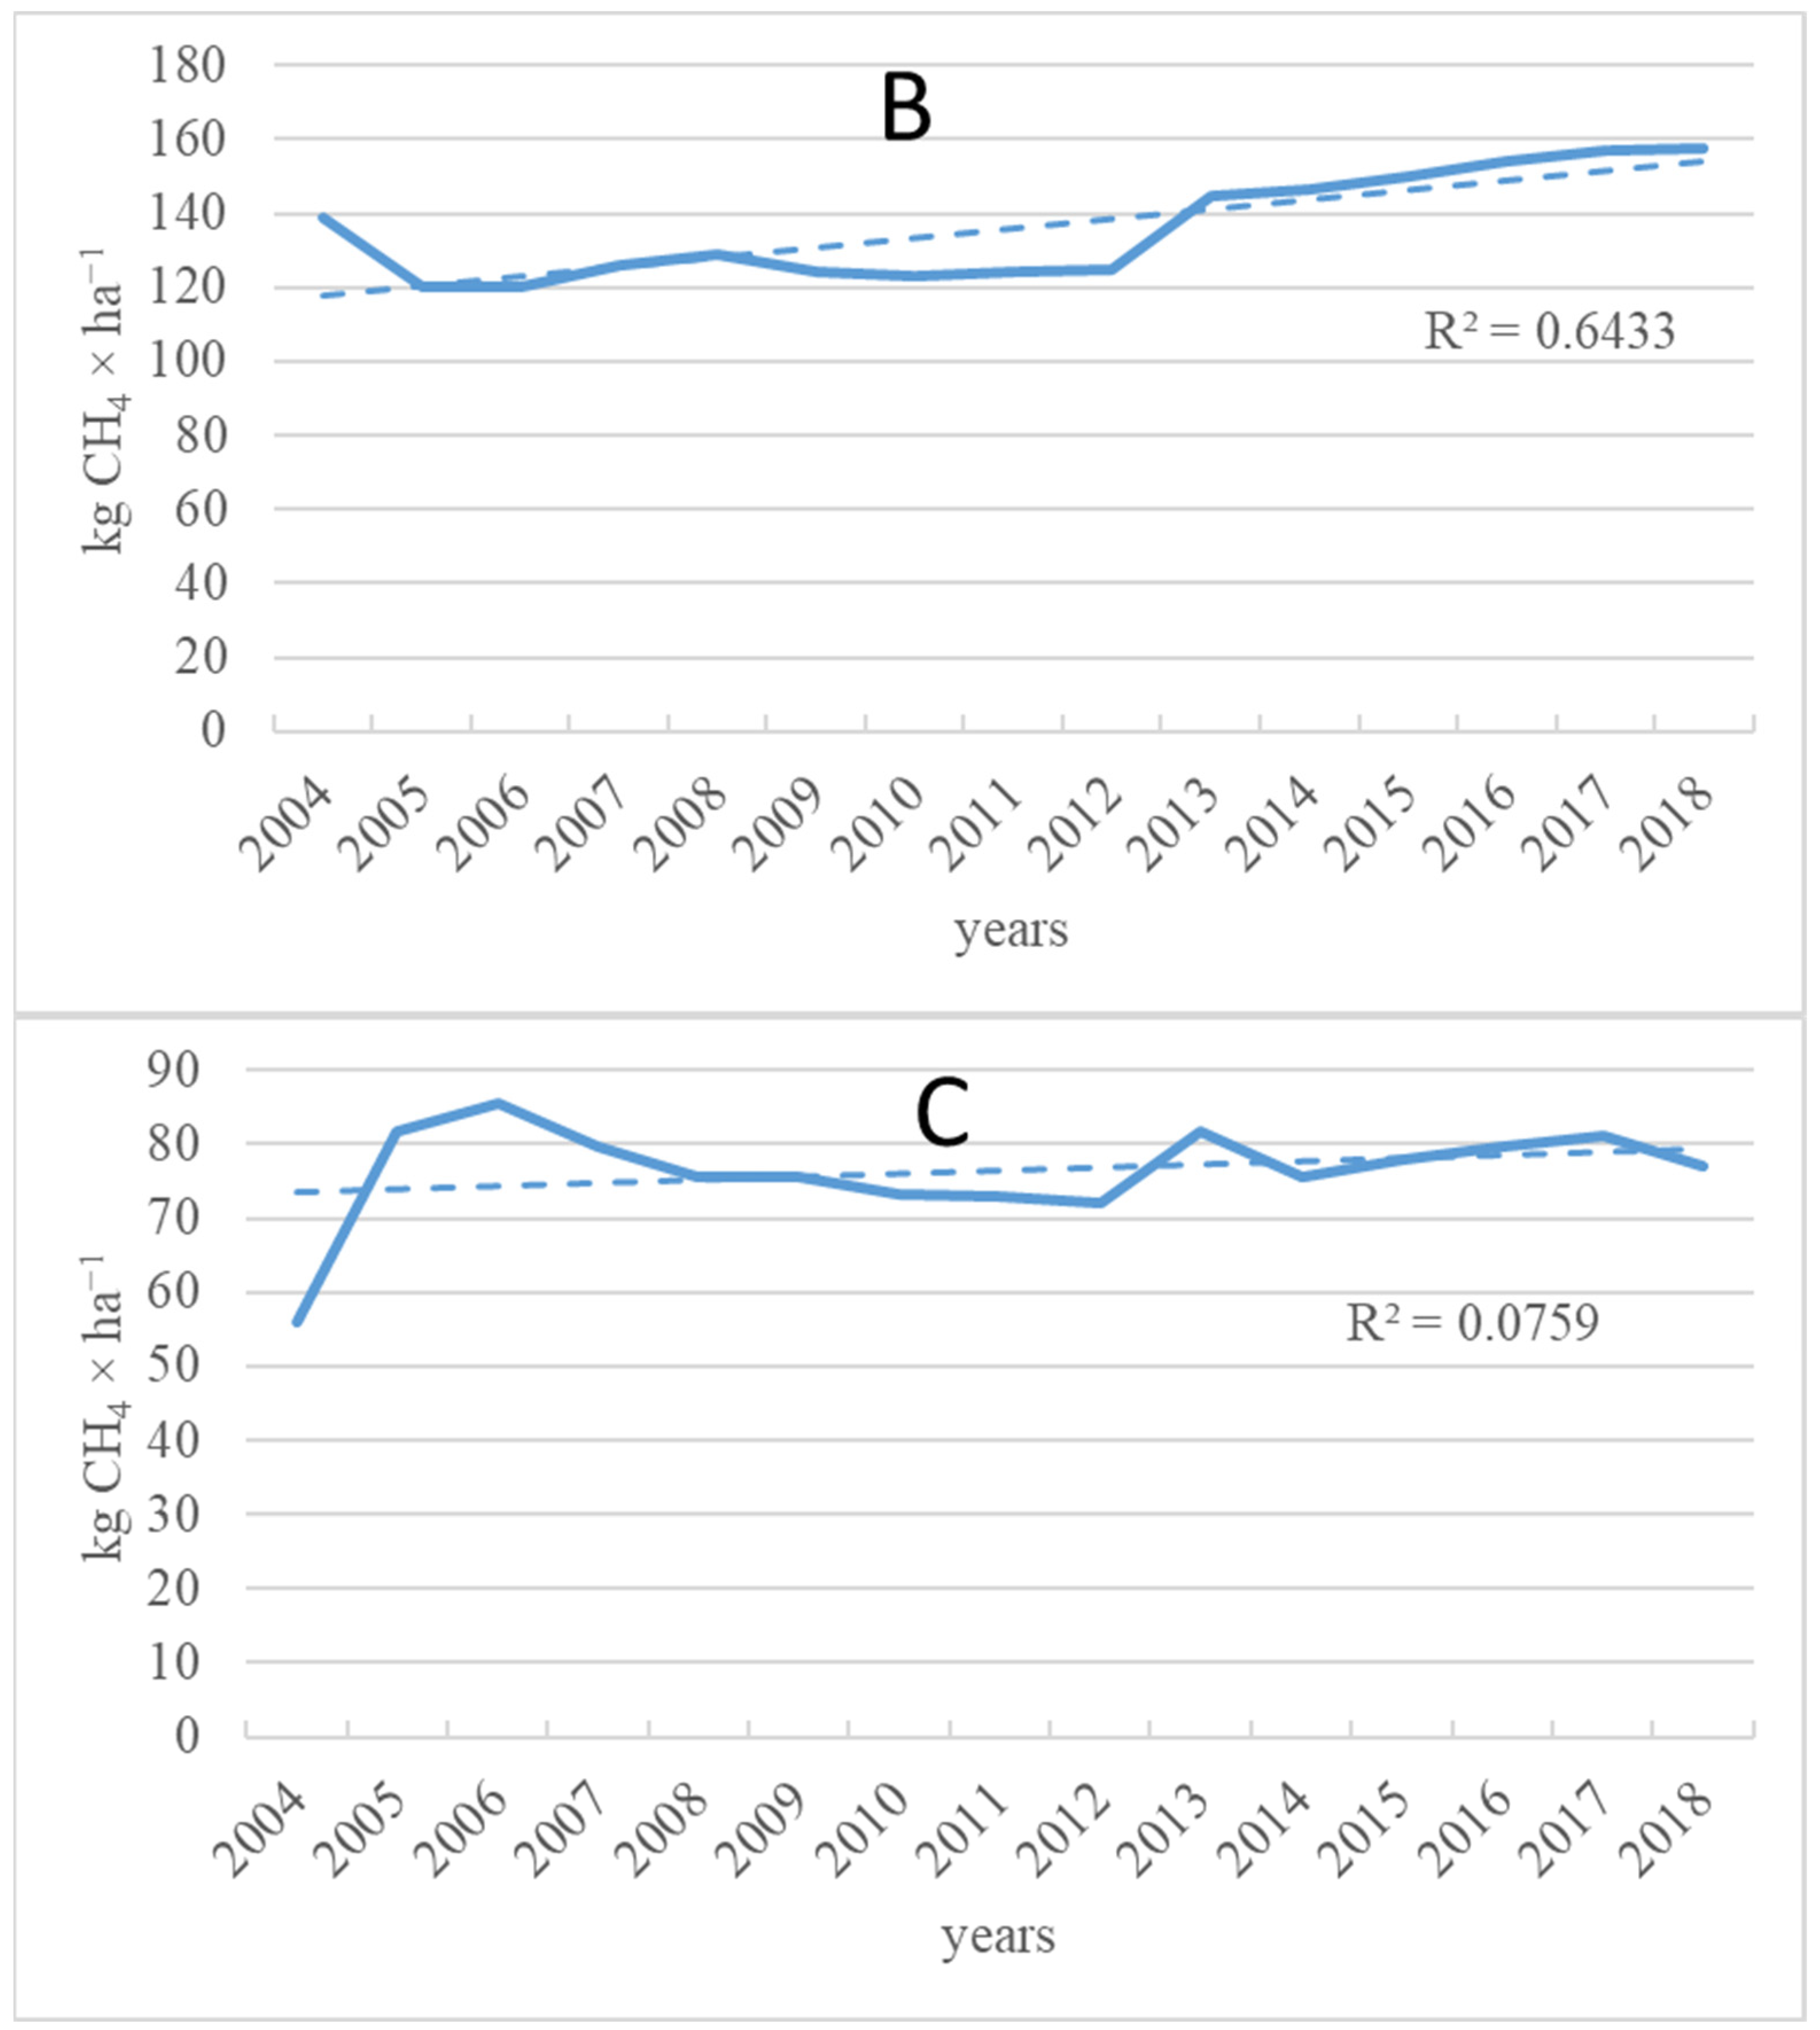
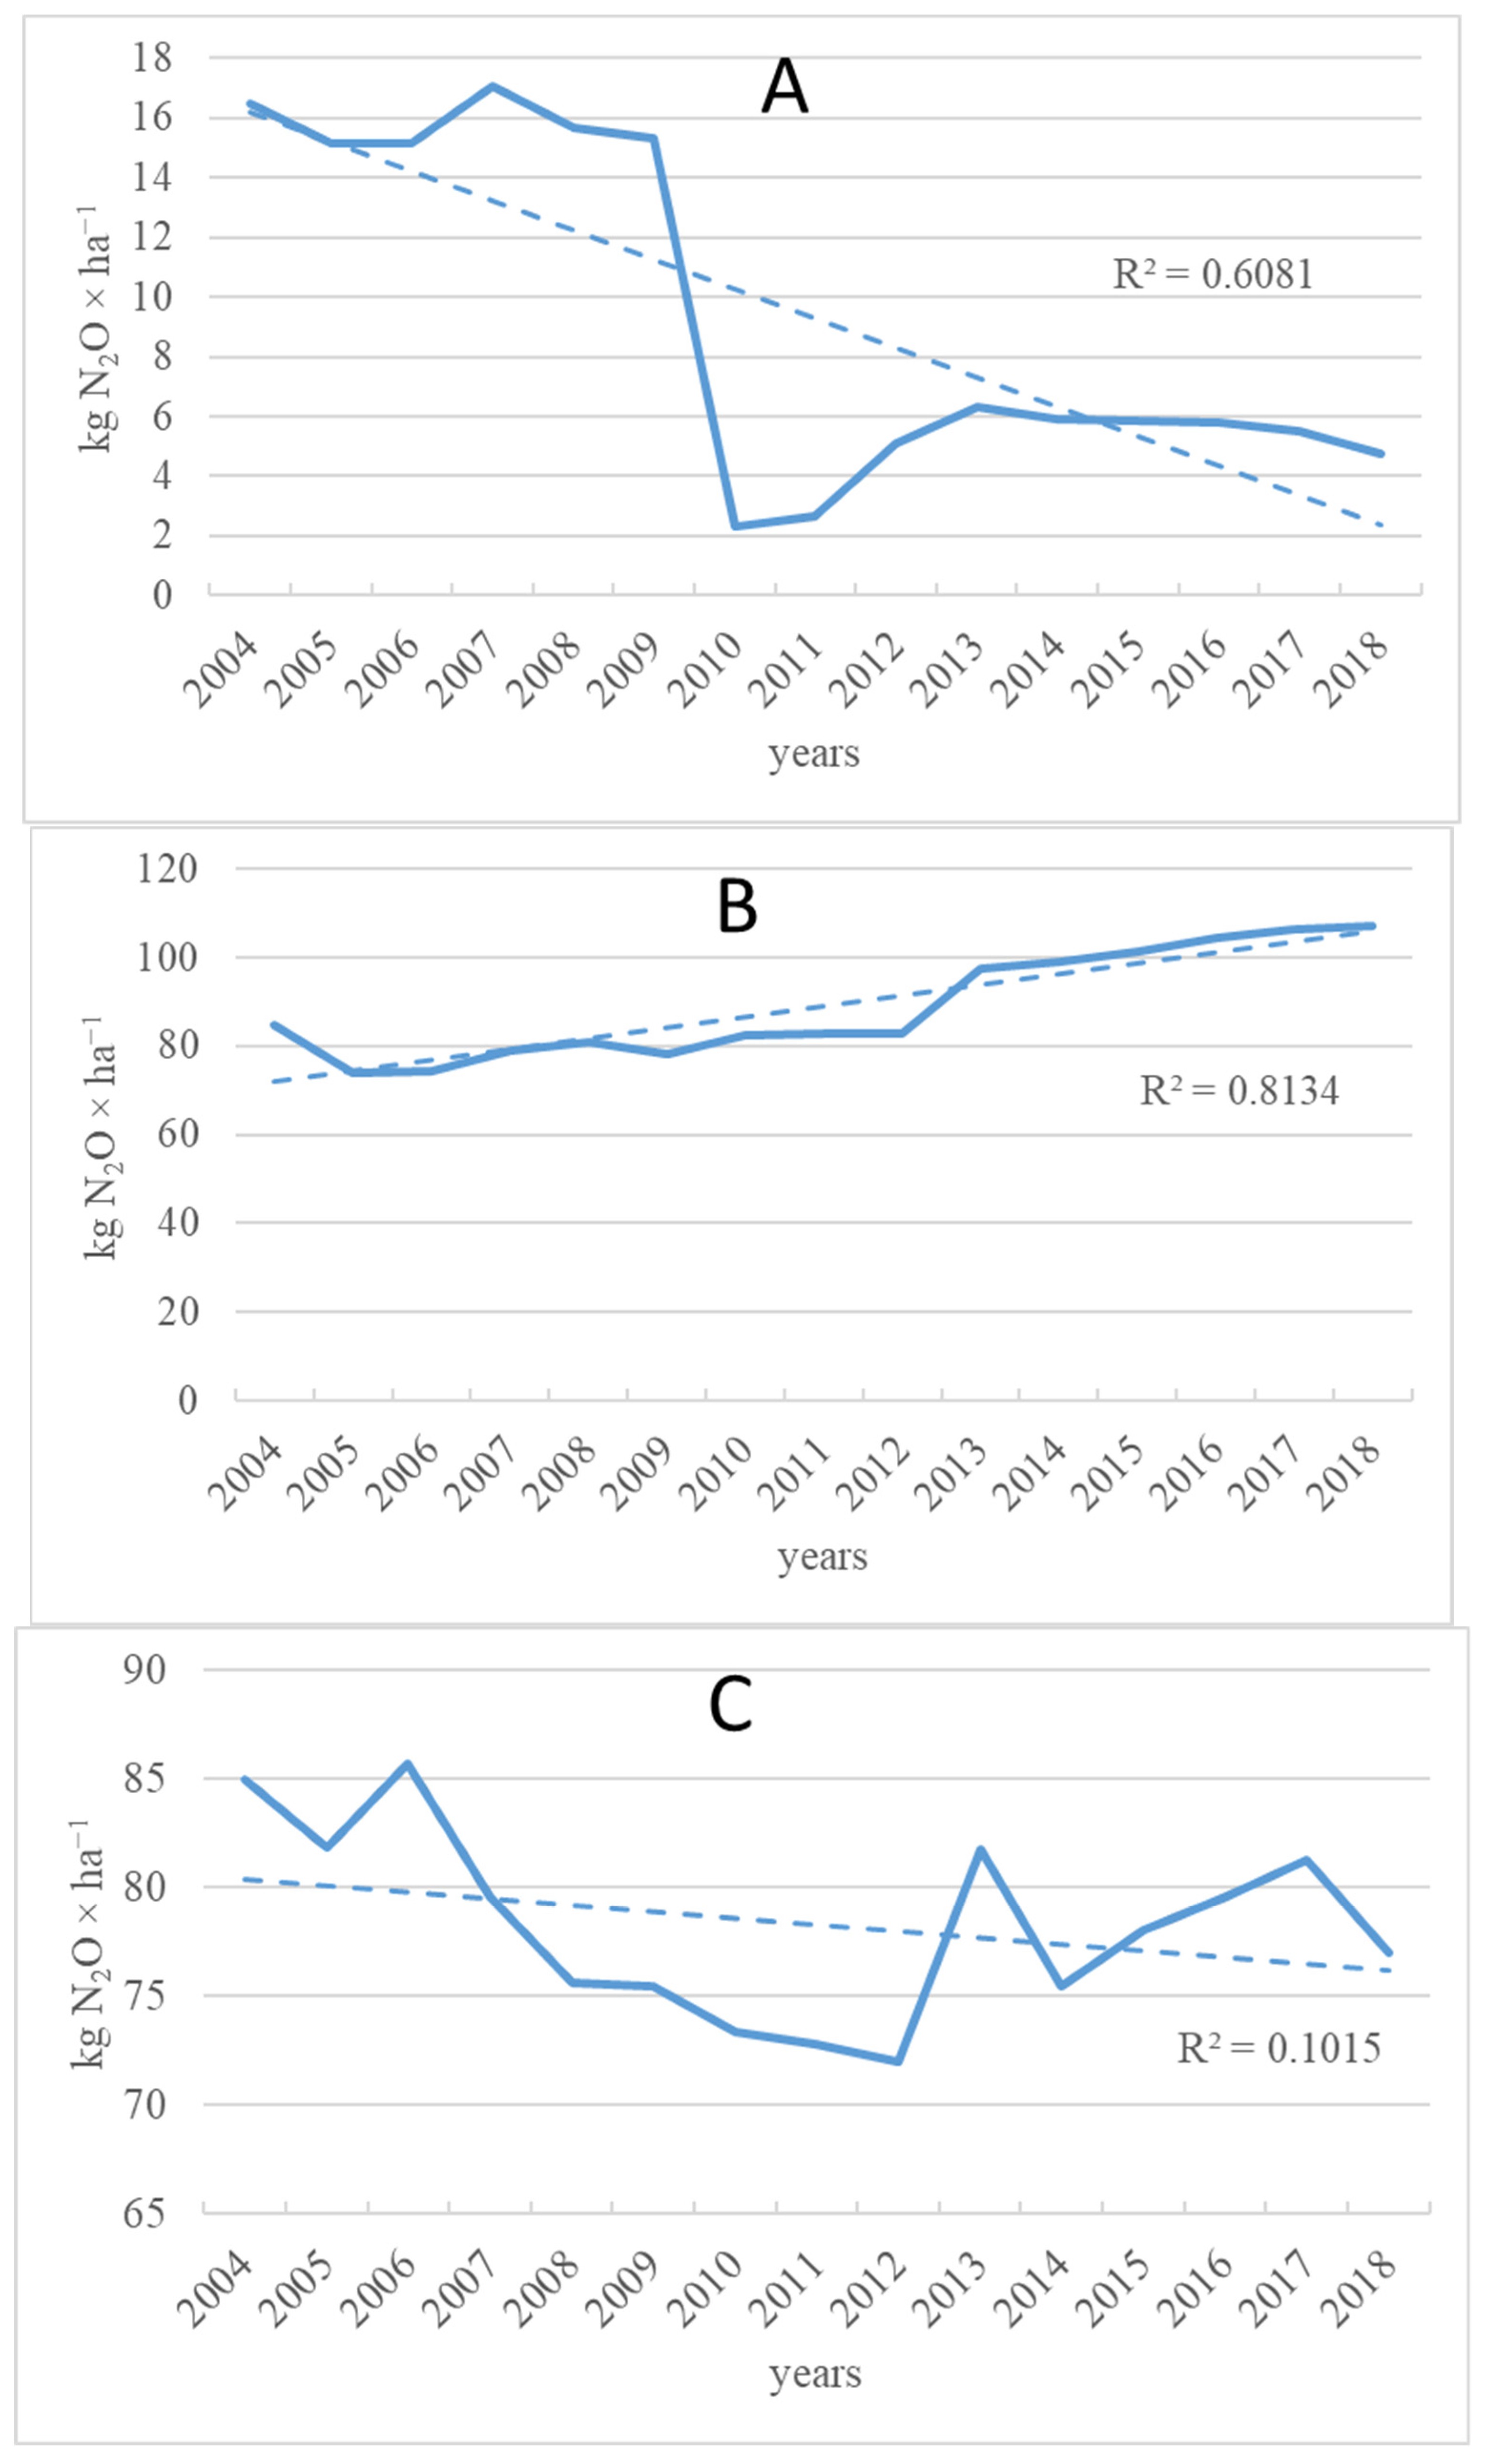
3. Results
4. Discussion and Conclusions
5. Limitations
Author Contributions
Funding
Data Availability Statement
Conflicts of Interest
Appendix A

| Specification | Year | ||||||||||||||
|---|---|---|---|---|---|---|---|---|---|---|---|---|---|---|---|
| 2004 | 2005 | 2006 | 2007 | 2008 | 2009 | 2010 | 2011 | 2012 | 2013 | 2014 | 2015 | 2016 | 2017 | 2018 | |
| Field crops | 2573 | 2650 | 2622 | 2800 | 3241 | 3287 | 2047 | 2177 | 2303 | 3215 | 3342 | 3411 | 3893 | 4049 | 4263 |
| Milk | 785 | 895 | 877 | 817 | 891 | 952 | 2319 | 2271 | 2302 | 2652 | 2735 | 2782 | 2749 | 2659 | 2539 |
| Mixed | 4937 | 4614 | 4430 | 4470 | 4288 | 3967 | 3862 | 3785 | 3517 | 4282 | 4083 | 3942 | 3446 | 3352 | 3193 |
| Specification | Average | Min. | Max. | SD |
|---|---|---|---|---|
| Field Crops | ||||
| Utilized agricultural area (ha) | 30.51 | 22.90 | 40.70 | 10.38 |
| Total livestock unit (LU) | 2.42 | 1.20 | 4.00 | 1.22 |
| Total output (PLN) | 128,122.07 | 77,603.00 | 261,535.00 | 54,478.53 |
| Total inputs (PLN) | 110,920.67 | 64,499.00 | 204,878.00 | 43,201.69 |
| Fertilizers (PLN) | 21,068.53 | 10.157.00 | 43.319.00 | 10,469.06 |
| Energy (PLN) | 13,366.07 | 7222.00 | 27,537.00 | 6218.51 |
| Total intermediate consumption (PLN) | 76,011.67 | 44,856.00 | 143,873.00 | 30,406.09 |
| Total inputs (PLN ha−1) | 3593.80 | 2647.00 | 4092.00 | 514.65 |
| Land productivity (PLN ha−1) | 4117.87 | 3117.00 | 5158.00 | 514.65 |
| Farm net value added (PLN AWU−1) | 34,984.33 | 15,352.00 | 73,098.00 | 17,023.93 |
| Family farm income (PLN) | 46,797.33 | 21,135.00 | 113,721.00 | 28,032.23 |
| Family farm income (PLN ha−1) | 1442.53 | 849.00 | 2243.00 | 372.45 |
| Milk | ||||
| Utilized agricultural area (ha) | 19.13 | 12.90 | 22.50 | 2.96 |
| Total livestock unit (LU) | 20.17 | 14.10 | 27.00, | 4.50 |
| Total output (PLN) | 115,330.67 | 60,928.00 | 175,076.00 | 30,940.41 |
| Total inputs (PLN) | 88,252.33 | 42,916.00 | 129,854.00 | 30,940.41 |
| Fertilizers (PLN) | 7914.53 | 3748.00 | 11,778.00 | 3043.14 |
| Energy (PLN) | 9342.87 | 4315.00 | 13,013.00 | 3264.85 |
| Total intermediate consumption (PLN) | 65,534.33 | 31,653.00 | 97,070.00 | 22,908.43 |
| Total inputs (PLN ha−1) | 4468.67 | 2869.00 | 5771.00 | 1006.58 |
| Land productivity (PLN ha−1) | 5873.73 | 4185.00 | 7832.00 | 1236.60 |
| Farm net value added (PLN·AWU−1) | 29,603.73 | 12,874.00 | 49,893.00 | 11,186.76 |
| Family farm income (PLN) | 48,952.87 | 20,069.00 | 85,401.00 | 19,971.13 |
| Family farm income (PLN ha−1) | 2480.40 | 1342.00 | 3917.00 | 714.25 |
| Mixed | ||||
| Utilized agricultural area (ha) | 16.83 | 14.80 | 19.90 | 1.32 |
| Total livestock unit (LU) | 12.47 | 10.90 | 14.30 | 1.09 |
| Total output (PLN) | 82,903.47 | 63,110.00 | 117,397.00 | 17,700.99 |
| Total inputs (PLN) | 77,282.40 | 50,150.00 | 114,631.00 | 20,966.41 |
| Fertilizers (PLN) | 7583.80 | 4612.00 | 11,363.00 | 2310.94 |
| Energy (PLN) | 7747.00 | 4724.00 | 12,142.00 | 2085.39 |
| Total intermediate consumption (PLN) | 57,296.93 | 37,961.00 | 85,167.00 | 14,988.95 |
| Total inputs (PLN ha−1) | 4598.40 | 3254.00 | 6163.00 | 944.21 |
| Land productivity (PLN ha−1) | 4890.93 | 3802.00 | 6312.00 | 734.48 |
| Farm net value added (PLN·AWU−1) | 17,554.33 | 10,344.00 | 22,836.00 | 4079.47 |
| Family farm income (PLN) | 22,283.53 | 14,696.00 | 31,387.00 | 5290.34 |
| Family farm income (PLN ha−1) | 1325.73 | 969.00 | 1949.00 | 313.05 |
| Rotated Component Matrix. | ||
|---|---|---|
| Indicators | Component | |
| 1 | 2 | |
| X1—Number of farms | 0.845 | 0.450 |
| X2—Utilized agricultural area (ha) | 0.912 | 0.360 |
| X3—Total livestock (LU) | 0.717 | 0.688 |
| X4—Total output (PLN) | 0.837 | 0.531 |
| X5—Total inputs (PLN) | 0.864 | 0.493 |
| X6—Fertilizers (PLN) | 0.828 | 0.538 |
| X7—Energy (PLN) | 0.944 | 0.299 |
| X8—Total intermediate consumption (PLN) | 0.866 | 0.491 |
| X9—Total inputs (PLN ha−1) | 0.824 | 0.530 |
| X10—Land productivity (PLN ha−1) | 0.764 | 0.574 |
| X11—Farm net value added (PLN AWU−1) | 0.774 | 0.537 |
| X12—Family farm income (PLN) | 0.759 | 0.566 |
| X13—Family farm income (PLN ha−1) | 0.669 | 0.570 |
| Z1—Dairy cattle CH4 | 0.656 | 0.742 |
| Z2—Dairy cattle N2O | 0.656 | 0.742 |
| Z3—Other cattle CH4 | 0.756 | 0.642 |
| Z4—Other cattle N2O | 0.759 | 0.639 |
| Z7—Total emissions CH4 (kg y−1) | 0.713 | 0.692 |
| Z8—Emissions CH4 (kg ha−1) | 0.268 | 0.954 |
| Z9—Total emissions N2O (kg y−1) | 0.729 | 0.676 |
| Z10—Emissions N2O (kg ha−1) | 0.461 | 0.880 |
| Total variance explained—rotation sums of squared loadings | ||
| Total | 12.052 | 8.035 |
| % of variance | 57.388 | 38.264 |
| Cumulative % | 57.388 | 95.652 |
| Extraction Method: Principal Component Analysis. Rotation Method: Varimax with Kaiser Normalization. | ||
| Rotated Component Matrix | |||
|---|---|---|---|
| Indicators | Component | ||
| 1 | 2 | 3 | |
| X1—Number of farms | −0.281 | −0.711 | 0.625 |
| X2—Utilized agricultural area (ha) | −0.346 | 0.927 | −0.066 |
| X3—Total livestock (LU) | 0.861 | −0.294 | −0.412 |
| X4—Total output (PLN) | −0.315 | 0.933 | 0.155 |
| X5—Total inputs (PLN) | −0.405 | 0.878 | 0.224 |
| X6—Mineral fertilizers (PLN) | −0.447 | 0.850 | 0.224 |
| X7—Energy (PLN) | −0.329 | 0.921 | 0.148 |
| X8—Total intermediate consumption (PLN) | −0.372 | 0.895 | 0.209 |
| X9—Total inputs (PLN ha−1) | −0.409 | 0.129 | 0.885 |
| X10—Land productivity (PLN·ha−1) | −0.246 | 0.490 | 0.766 |
| X11—Farm net value added (PLN AWU−1) | −0.427 | 0.868 | 0.226 |
| X12—Family farm income (PLN) | −0.297 | 0.939 | 0.112 |
| X13—Family farm income (PLN·ha−1) | −0.297 | 0.760 | 0.445 |
| Z1—Dairy cattle CH4 | 0.849 | −0.214 | −0.469 |
| Z1—Dairy cattle N2O | 0.849 | −0.214 | −0.469 |
| Z3—Other cattle CH4 | 0.915 | −0.308 | 0.029 |
| Z4—Other cattle N2O | 0.915 | −0.308 | 0.029 |
| Z5—Pigs CH4 | 0.728 | −0.364 | −0.518 |
| Z6—Pigs N2O | 0.797 | −0.327 | −0.436 |
| Z7—Total emissions CH4 (kg·y−1) | 0.861 | −0.395 | −0.251 |
| Z8—Emissions CH4 (kg·ha−1) | 0.850 | −0.472 | −0.214 |
| Z9—Total emissions N2O (kg·y−1) | 0.864 | −0.345 | −0.359 |
| Z10—Emissions N2O (kg ha−1) | 0.866 | −0.408 | −0.270 |
| Total variance explained—rotation sums of squared loadings | |||
| Total | 9.473 | 9.117 | 3.597 |
| % of variance | 41.188 | 39.641 | 15.638 |
| Cumulative % | 41.188 | 80.829 | 96.466 |
| Extraction Method: Principal Component Analysis. Rotation Method: Varimax with Kaiser Normalization. | |||
| Rotated Component Matrix | ||||
|---|---|---|---|---|
| Indicators | Component | |||
| 1 | 2 | 3 | 4 | |
| X1—Number of farms | −0.566 | 0.626 | −0.235 | −0.385 |
| X2—Utilized agricultural area (ha) | 0.887 | −0.007 | −0.031 | 0.367 |
| X3—Total livestock (LU) | 0.554 | 0.573 | −0.403 | 0.413 |
| X4—Total output (PLN) | 0.959 | −0.048 | 0.265 | 0.047 |
| X5—Total inputs (PLN) | 0.976 | −0.123 | 0.102 | 0.108 |
| X6—Fertilizers (PLN) | 0.962 | −0.197 | 0.078 | 0.076 |
| X7—Energy (PLN) | 0.906 | −0.047 | 0.348 | 0.000 |
| X8—Total intermediate consumption (PLN) | 0.975 | −0.103 | 0.130 | 0.089 |
| X9—Total inputs (PLN ha−1) | 0.895 | −0.227 | 0.290 | −0.024 |
| X10—Land productivity (PLN·ha−1) | 0.876 | −0.095 | 0.408 | −0.117 |
| X11—Farm net value added (PLN AWU−1) | 0.648 | −0.268 | 0.662 | 0.212 |
| X12—Family farm income (PLN) | 0.270 | −0.246 | 0.908 | 0.081 |
| X13—Family farm income (PLN·ha−1) | −0.011 | −0.265 | 0.946 | −0.018 |
| Z1—Dairy cattle CH4 | −0.481 | 0.778 | −0.293 | −0.133 |
| Z2—Dairy cattle N2O | −0.481 | 0.778 | −0.293 | −0.133 |
| Z3—Other cattle CH4 | 0.859 | −0.328 | −0.130 | 0.347 |
| Z4—Other cattle N2O | 0.859 | −0.328 | −0.130 | 0.347 |
| Z5—Pigs CH4 | −0.025 | 0.969 | −0.049 | 0.141 |
| Z6—Pigs N2O | −0.021 | 0.963 | −0.053 | 0.142 |
| Z7—Total emissions CH4 (kg y−1) | 0.810 | 0.169 | −0.360 | 0.382 |
| Z8—Emissions CH4 (kg ha−1) | 0.174 | 0.178 | 0.121 | 0.845 |
| Z9—Total emissions N2O (kg·y−1) | 0.750 | 0.436 | −0.249 | 0.412 |
| Z10—Emissions N2O (kg·ha−1) | −0.014 | 0.769 | −0.413 | 0.153 |
| Total variance explained—rotation sums of squared loadings | ||||
| Total | 11.231 | 5.187 | 3.439 | 1.917 |
| % of variance | 48.831 | 22.551 | 14.954 | 8.333 |
| Cumulative % | 48.831 | 71.382 | 86.336 | 94.669 |
| Extraction Method: Principal Component Analysis. Rotation Method: Varimax with Kaiser Normalization. | ||||
| Variables | X1 | X2 | X3 | X4 | X5 | X6 | X7 | X8 | X9 | X10 | X11 | X12 | X13 | Z1 | Z2 | Z3 | Z4 | Z5 | Z6 | Z7 | Z8 | Z9 | Z10 |
|---|---|---|---|---|---|---|---|---|---|---|---|---|---|---|---|---|---|---|---|---|---|---|---|
| X1. | 1.000 | −0.598 | −0.293 | −0.470 | −0.364 | −0.338 | −0.462 | −0.397 | 0.570 | 0.186 | −0.351 | −0.508 | −0.191 | −0.375 | −0.375 | −0.015 | −0.015 | −0.269 | −0.261 | −0.115 | −0.038 | −0.226 | −0.122 |
| X2 | −0.598 | 1.000 | −0.544 | 0.964 | 0.949 | 0.931 | 0.960 | 0.951 | 0.203 | 0.456 | 0.935 | 0.965 | 0.752 | −0.459 | −0.458 | −0.574 | −0.574 | −0.579 | −0.577 | −0.652 | −0.717 | −0.603 | −0.670 |
| X3 | −0.293 | −0.544 | 1.000 | −0.611 | −0.699 | −0.729 | −0.613 | −0.669 | −0.753 | −0.667 | −0.720 | −0.582 | −0.661 | 0.990 | 0.990 | 0.866 | 0.866 | 0.945 | 0.962 | 0.951 | 0.955 | 0.994 | 0.976 |
| X4 | −0.470 | 0.964 | −0.611 | 1.000 | 0.984 | 0.972 | 0.987 | 0.987 | 0.385 | 0.659 | 0.978 | 0.988 | 0.861 | −0536 | −0.536 | −0.575 | −0.575 | −0.645 | −0.624 | −0.676 | −0.739 | −0.649 | −0.691 |
| X5 | −0.364 | 0.949 | −0.699 | 0.984 | 1.000 | 0.993 | 0.989 | 0.998 | 0.492 | 0.674 | 0.975 | 0.959 | 0.843 | −0.632 | −0.632 | −0.611 | −0.611 | −0.739 | −0.724 | −0.763 | −0.812 | −0.734 | −0.775 |
| X6 | −0.338 | 0.931 | −0.729 | 0.972 | 0.993 | 1.000 | 0.980 | 0.993 | 0.515 | 0.676 | 0.967 | 0.942 | 0.829 | −0.667 | −0.667 | −0.650 | −0.650 | −0.743 | −0.743 | −0.781 | −0.835 | −0.755 | −0.796 |
| X7 | −0.462 | 0.960 | −0.613 | 0.987 | 0.989 | 0.980 | 1.000 | 0.994 | 0.404 | 0.625 | 0.962 | 0.966 | 0.826 | −0.541 | −0.541 | −0.567 | −0.567 | −0.647 | −0.626 | −0.700 | −0.756 | −0.651 | −0.703 |
| X8 | −0.397 | 0.951 | −0.669 | 0.987 | 0.998 | 0.993 | 0.994 | 1.000 | 0.473 | 0.668 | 0.970 | 0.960 | 0.837 | −0.600 | −0.600 | −0.592 | −0.592 | −0.708 | −0.692 | −0.739 | −0.790 | −0.704 | −0.747 |
| X9 | 0.570 | 0.203 | −0.753 | 0.385 | 0.492 | 0.515 | 0.404 | 0.473 | 1.000 | 0.828 | 0.469 | 0.321 | 0.565 | −0.786 | −0.786 | −0.379 | −0.379 | −0.795 | −0.755 | −0.642 | −0.608 | −0.710 | −0.648 |
| X10 | 0.186 | 0.456 | −0.667 | 0.659 | 0.674 | 0.676 | 0.625 | 0.668 | 0.828 | 1.000 | 0.706 | 0.625 | 0.852 | −0.664 | −0.664 | −0.437 | −0.437 | −0.704 | −0.638 | −0.593 | −0.597 | −0.641 | −0.589 |
| X11 | −0.351 | 0.935 | −0.720 | 0.978 | 0.975 | 0.967 | 0.962 | 0.970 | 0.469 | 0.706 | 1.000 | 0.981 | 0.919 | −0.662 | −0.662 | −0.657 | −0.657 | −0.744 | −0.719 | −0.751 | −0.814 | −0.753 | −0.785 |
| X12 | −0.508 | 0.965 | −0.582 | 0.988 | 0.959 | 0.942 | 0.966 | 0.960 | 0.321 | 0.625 | 0.981 | 1.000 | 0.886 | −0.512 | −0.512 | −0.565 | −0.565 | −0.619 | −0.587 | −0.637 | −0.711 | −0.625 | −0.669 |
| X13 | −0.191 | 0.752 | −0.661 | 0.861 | 0.843 | 0.829 | 0.826 | 0.837 | 0.565 | 0.852 | 0.919 | 0.886 | 1.000 | −0.639 | −0.639 | −0.547 | −0.547 | −0.701 | −0.629 | −0.643 | −0.695 | −0.676 | −0.676 |
| Z1 | −0.375 | −0.459 | 0.990 | −0.536 | −0.632 | −0.667 | −0.541 | −0.600 | −0.786 | −0.664 | −0.662 | −0.512 | −0.639 | 1.000 | 1.000 | 0.826 | 0.826 | 0.929 | 0.951 | 0.917 | 0.920 | 0.975 | 0.951 |
| Z2 | −0.375 | −0.458 | 0.990 | −0.536 | −0.632 | −0.667 | −0.541 | −0.600 | −0.786 | −0.664 | −0.662 | −0.512 | −0.639 | 1.000 | 1.000 | 0.826 | 0.826 | 0.929 | 0.951 | 0.917 | 0.920 | 0.975 | 0.951 |
| Z3 | −0.015 | −0.574 | 0.866 | −0.575 | −0.611 | −0.650 | −0.567 | −0.592 | −0.379 | −0.437 | −0.657 | −0.565 | −0.547 | 0.826 | 0.826 | 1.000 | 1.000 | 0.719 | 0.766 | 0.890 | 0.910 | 0.873 | 0.885 |
| Z4 | −0.015 | −0.574 | 0.866 | −0.575 | −0.611 | −0.650 | −0.567 | −0.592 | −0.379 | −0.437 | −0.657 | −0.565 | −0.547 | 0.826 | 0.826 | 1.000 | 1.000 | 0.719 | 0.766 | 0.890 | 0.910 | 0.873 | 0.885 |
| Z5 | −0.269 | −0.579 | 0.945 | −0.645 | −0.739 | −0.743 | −0.647 | −0.708 | −0.795 | −0.704 | −0.744 | −0.619 | −0.701 | 0.929 | 0.929 | 0.719 | 0.719 | 1.000 | 0.961 | 0.910 | 0.898 | 0.954 | 0.935 |
| Z6 | −0.261 | −0.577 | 0.962 | −0.624 | −0.724 | −0.743 | −0.626 | −0.692 | −0.755 | −0.638 | −0.719 | −0.587 | −0.629 | 0.951 | 0.951 | 0.766 | 0.766 | 0.961 | 1.000 | 0.925 | 0.924 | 0.968 | 0.957 |
| Z7 | −0.115 | −0.652 | 0.951 | −0.676 | −0.763 | −0.781 | −0.700 | −0.739 | −0.642 | −0.593 | −0.751 | −0.637 | −0.643 | 0.917 | 0.917 | 0.890 | 0.890 | 0.910 | 0.925 | 1.000 | 0.987 | 0.967 | 0.979 |
| Z8 | −0.038 | −0.717 | 0.955 | −0.739 | −0.812 | −0.835 | −0.756 | −0.790 | −0.608 | −0.597 | −0.814 | −0.711 | −0.695 | 0.920 | 0.920 | 0.910 | 0.910 | 0.898 | 0.924 | 0.987 | 1.000 | 0.971 | 0.989 |
| Z9 | −0.226 | −0.603 | 0.994 | −0.649 | −0.734 | −0.755 | −0.651 | −0.70 4 | −0.710 | −0.641 | −0.753 | −0.625 | −0.676 | 0.975 | 0.975 | 0.873 | 0.873 | 0.954 | 0.968 | 0.967 | 0.971 | 1.000 | 0.991 |
| Z10 | −0.122 | −0.670 | 0.976 | −0.691 | −0.775 | −0.796 | −0.703 | −0.747 | −0.648 | −0.589 | −0.785 | −0.669 | −0.676 | 0.951 | 0.951 | 0.885 | 0.885 | 0.935 | 0.957 | 0.979 | 0.989 | 0.991 | 1.000 |
| Variables | X1 | X2 | X3 | X4 | X5 | X6 | X7 | X8 | X9 | X10 | X11 | X12 | X13 | Z1 | Z2 | Z3 | Z4 | Z7 | Z8 | Z9 | Z10 |
|---|---|---|---|---|---|---|---|---|---|---|---|---|---|---|---|---|---|---|---|---|---|
| X1 | 1.000 | 0.942 | 0.929 | 0.921 | 0.964 | 0.964 | 0.952 | 0.958 | 0.947 | 0.866 | 0.830 | 0.830 | 0.731 | 0.880 | 0.880 | 0.953 | 0.954 | 0.923 | 0.675 | 0.934 | 0.811 |
| X2 | 0.942 | 1.000 | 0.922 | 0.934 | 0.971 | 0.953 | 0.957 | 0.968 | 0.931 | 0.850 | 0.872 | 0.867 | 0.766 | 0.889 | 0.889 | 0.940 | 0.941 | 0.921 | 0.573 | 0.928 | 0.733 |
| X3 | 0.929 | 0.922 | 1.000 | 0.951 | 0.963 | 0.969 | 0.880 | 0.961 | 0.951 | 0.909 | 0.901 | 0.910 | 0.833 | 0.993 | 0.993 | 0.997 | 0.997 | 1.000 | 0.844 | 1.000 | 0.937 |
| X4 | 0.921 | 0.934 | 0.951 | 1.000 | 0.975 | 0.963 | 0.946 | 0.979 | 0.966 | 0.981 | 0.970 | 0.972 | 0.918 | 0.934 | 0.934 | 0.958 | 0.959 | 0.951 | 0.731 | 0.955 | 0.847 |
| X5 | 0.964 | 0.971 | 0.963 | 0.975 | 1.000 | 0.994 | 0.971 | 0.999 | 0.990 | 0.927 | 0.903 | 0.905 | 0.814 | 0.934 | 0.934 | 0.977 | 0.978 | 0.962 | 0.709 | 0.968 | 0.841 |
| X6 | 0.964 | 0.953 | 0.969 | 0.963 | 0.994 | 1.000 | 0.953 | 0.993 | 0.991 | 0.918 | 0.885 | 0.890 | 0.800 | 0.944 | 0.944 | 0.981 | 0.981 | 0.968 | 0.746 | 0.973 | 0.867 |
| X7 | 0.952 | 0.957 | 0.880 | 0.946 | 0.971 | 0.953 | 1.000 | 0.973 | 0.957 | 0.898 | 0.865 | 0.862 | 0.771 | 0.833 | 0.833 | 0.907 | 0.909 | 0.877 | 0.555 | 0.888 | 0.712 |
| X8 | 0.958 | 0.968 | 0.961 | 0.979 | 0.999 | 0.993 | 0.973 | 1.000 | 0.991 | 0.935 | 0.908 | 0.911 | 0.824 | 0.934 | 0.933 | 0.973 | 0.974 | 0.959 | 0.708 | 0.965 | 0.838 |
| X9 | 0.947 | 0.931 | 0.951 | 0.966 | 0.990 | 0.991 | 0.957 | 0.991 | 1.000 | 0.938 | 0.882 | 0.888 | 0.804 | 0.926 | 0.926 | 0.963 | 0.964 | 0.950 | 0.748 | 0.956 | 0.863 |
| X10 | 0.866 | 0.850 | 0.909 | 0.981 | 0.927 | 0.918 | 0.898 | 0.935 | 0.938 | 1.000 | 0.963 | 0.969 | 0.943 | 0.898 | 0.898 | 0.912 | 0.913 | 0.910 | 0.764 | 0.912 | 0.853 |
| X11 | 0.830 | 0.872 | 0.901 | 0.970 | 0.903 | 0.885 | 0.865 | 0.908 | 0.882 | 0.963 | 1.000 | 0.998 | 0.979 | 0.896 | 0.896 | 0.900 | 0.901 | 0.902 | 0.700 | 0.903 | 0.802 |
| X12 | 0.830 | 0.867 | 0.910 | 0.972 | 0.905 | 0.890 | 0.862 | 0.911 | 0.888 | 0.969 | 0.998 | 1.000 | 0.981 | 0.908 | 0.908 | 0.906 | 0.907 | 0.911 | 0.725 | 0.911 | 0.821 |
| X13 | 0.731 | 0.766 | 0.833 | 0.918 | 0.814 | 0.800 | 0.771 | 0.824 | 0.804 | 0.943 | 0.979 | 0.981 | 1.000 | 0.841 | 0.842 | 0.823 | 0.824 | 0.836 | 0.700 | 0.834 | 0.774 |
| Z1 | 0.880 | 0.889 | 0.993 | 0.934 | 0.934 | 0.944 | 0.833 | 0.934 | 0.926 | 0.898 | 0.896 | 0.908 | 0.841 | 1.000 | 1.000 | 0.981 | 0.980 | 0.995 | 0.872 | 0.991 | 0.949 |
| Z2 | 0.880 | 0.889 | 0.993 | 0.934 | 0.934 | 0.944 | 0.833 | 0.933 | 0.926 | 0.898 | 0.896 | 0.908 | 0.842 | 1.000 | 1.000 | 0.981 | 0.980 | 0.994 | 0.872 | 0.991 | 0.949 |
| Z3 | 0.953 | 0.940 | 0.997 | 0.958 | 0.977 | 0.981 | 0.907 | 0.973 | 0.963 | 0.912 | 0.900 | 0.906 | 0.823 | 0.981 | 0.981 | 1.000 | 1.000 | 0.996 | 0.815 | 0.998 | 0.920 |
| Z4 | 0.954 | 0.941 | 0.997 | 0.959 | 0.978 | 0.981 | 0.909 | 0.974 | 0.964 | 0.913 | 0.901 | 0.907 | 0.824 | 0.980 | 0.980 | 1.000 | 1.000 | 0.995 | 0.813 | 0.998 | 0.918 |
| Z7 | 0.923 | 0.921 | 1.000 | 0.951 | 0.962 | 0.968 | 0.877 | 0.959 | 0.950 | 0.910 | 0.902 | 0.911 | 0.836 | 0.995 | 0.994 | 0.996 | 0.995 | 1.000 | 0.846 | 1.000 | 0.938 |
| Z8 | 0.675 | 0.573 | 0.844 | 0.731 | 0.709 | 0.746 | 0.555 | 0.708 | 0.748 | 0.764 | 0.700 | 0.725 | 0.700 | 0.872 | 0.872 | 0.815 | 0.813 | 0.846 | 1.000 | 0.836 | 0.977 |
| Z9 | 0.934 | 0.928 | 1.000 | 0.955 | 0.968 | 0.973 | 0.888 | 0.965 | 0.956 | 0.912 | 0.903 | 0.911 | 0.834 | 0.991 | 0.991 | 0.998 | 0.998 | 1.000 | 0.836 | 1.000 | 0.932 |
| Z10 | 0.811 | 0.733 | 0.937 | 0.847 | 0.841 | 0.867 | 0.712 | 0.838 | 0.863 | 0.853 | 0.802 | 0.821 | 0.774 | 0.949 | 0.949 | 0.920 | 0.918 | 0.938 | 0.977 | 0.932 | 1.000 |
| Variables | X1 | X2 | X3 | X4 | X5 | X6 | X7 | X8 | X9 | X10 | X11 | X12 | X13 | Z1 | Z2 | Z3 | Z4 | Z5 | Z6 | Z7 | Z8 | Z9 | Z10 |
|---|---|---|---|---|---|---|---|---|---|---|---|---|---|---|---|---|---|---|---|---|---|---|---|
| X1 | 1.000 | −0.666 | −0.054 | −0.645 | −0.675 | −0.702 | −0.596 | −0.661 | −0.675 | −0.581 | −0.784 | −0.584 | −0.398 | 0.882 | 0.882 | −0.804 | −0.804 | 0.557 | 0.546 | −0.428 | −0.235 | −0.274 | 0.521 |
| X2 | −0.666 | 1.000 | 0.667 | 0.853 | 0.904 | 0.886 | 0.827 | 0.897 | 0.751 | 0.671 | 0.630 | 0.247 | −0.061 | −0.454 | −0.454 | 0.879 | 0.879 | 0.046 | 0.055 | 0.862 | 0.431 | 0.822 | −0.059 |
| X3 | −0.054 | 0.667 | 1.000 | 0.414 | 0.462 | 0.400 | 0.316 | 0.456 | 0.218 | 0.203 | 0.046 | −0.297 | −0.524 | 0.257 | 0.257 | 0.494 | 0.494 | 0.614 | 0.616 | 0.872 | 0.436 | 0.949 | 0.666 |
| X4 | −0.645 | 0.853 | 0.414 | 1.000 | 0.975 | 0.956 | 0.963 | 0.982 | 0.942 | 0.958 | 0.820 | 0.514 | 0.253 | −0.576 | −0.576 | 0.822 | 0.822 | −0.087 | −0.086 | 0.695 | 0.243 | 0.648 | −0.147 |
| X5 | −0.675 | 0.904 | 0.462 | 0.975 | 1.000 | 0.991 | 0.945 | 0.999 | 0.939 | 0.897 | 0.744 | 0.379 | 0.100 | −0.605 | −0.605 | 0.891 | 0.891 | −0.135 | −0.133 | 0.762 | 0.293 | 0.685 | −0.160 |
| X6 | −0.702 | 0.886 | 0.400 | 0.956 | 0.991 | 1.000 | 0.935 | 0.987 | 0.938 | 0.884 | 0.722 | 0.360 | 0.088 | −0.661 | −0.661 | 0.890 | 0.890 | −0.195 | −0.189 | 0.719 | 0.254 | 0.634 | −0.218 |
| X7 | −0.596 | 0.827 | 0.316 | 0.963 | 0.945 | 0.935 | 1.000 | 0.955 | 0.926 | 0.923 | 0.804 | 0.542 | 0.292 | −0.562 | −0.562 | 0.719 | 0.719 | −0.078 | −0.075 | 0.572 | 0.261 | 0.549 | −0.285 |
| X8 | −0.661 | 0.897 | 0.456 | 0.982 | 0.999 | 0.987 | 0.955 | 1.000 | 0.941 | 0.910 | 0.752 | 0.397 | 0.121 | −0.588 | −0.588 | 0.872 | 0.872 | −0.124 | −0.122 | 0.750 | 0.290 | 0.677 | −0.163 |
| X9 | −0.675 | 0.751 | 0.218 | 0.942 | 0.939 | 0.938 | 0.926 | 0.941 | 1.000 | 0.940 | 0.807 | 0.532 | 0.309 | −0.694 | −0.694 | 0.786 | 0.786 | −0.265 | −0.262 | 0.555 | 0.198 | 0.474 | −0.305 |
| X10 | −0.581 | 0.671 | 0.203 | 0.958 | 0.897 | 0.884 | 0.923 | 0.910 | 0.940 | 1.000 | 0.837 | 0.614 | 0.411 | −0.602 | −0.602 | 0.698 | 0.698 | −0.172 | −0.175 | 0.508 | 0.123 | 0.460 | −0.206 |
| X11 | −0.784 | 0.630 | 0.046 | 0.820 | 0.744 | 0.722 | 0.804 | 0.752 | 0.807 | 0.837 | 1.000 | 0.886 | 0.713 | −0.735 | −0.735 | 0.649 | 0.649 | −0.289 | −0.289 | 0.348 | 0.272 | 0.306 | −0.423 |
| X12 | −0.584 | 0.247 | −0.297 | 0.514 | 0.379 | 0.360 | 0.542 | 0.397 | 0.532 | 0.614 | 0.886 | 1.000 | 0.951 | −0.587 | −0.587 | 0.242 | 0.242 | −0.287 | −0.287 | −0.088 | 0.106 | −0.079 | −0.525 |
| X13 | −0.398 | −0.061 | −0.524 | 0.253 | 0.100 | 0.088 | 0.292 | 0.121 | 0.309 | 0.411 | 0713 | 0.951 | 1.000 | −0.471 | −0.471 | −0.028 | −0.028 | −0.319 | −0.322 | −0.370 | −0.014 | −0.349 | −0.537 |
| Z1 | 0.882 | −0.454 | 0.257 | −0.576 | −0.605 | −0.661 | −0.562 | −0.588 | −0.694 | −0.602 | −0.735 | −0.587 | −0.471 | 1.000 | 1.000 | −0.682 | −0.682 | 0.727 | 0.718 | −0.176 | −0.074 | −0.013 | 0.659 |
| Z2 | 0.882 | −0.454 | 0.257 | −0.576 | −0.605 | −0.661 | −0.562 | −0.588 | −0.694 | −0.602 | −0.73 5 | −0.587 | −0.471 | 1.000 | 1.000 | −0.682 | −0.682 | 0.727 | 0.718 | −0.176 | −0.074 | −0.013 | 0.659 |
| Z3 | −0.804 | 0.879 | 0.494 | 0.822 | 0.891 | 0.890 | 0.719 | 0.872 | 0.786 | 0.698 | 0.649 | 0.242 | −0.028 | −0.682 | −0.682 | 1.000 | 1.000 | −0.291 | −0.285 | 0.838 | 0.326 | 0.690 | −0.108 |
| Z4 | −0.804 | 0.879 | 0.494 | 0.822 | 0.891 | 0.890 | 0.719 | 0.872 | 0.786 | 0.698 | 0.649 | 0.242 | −0.028 | −0.682 | −0.682 | 1.000 | 1.000 | −0.291 | −0.285 | 0.838 | 0.326 | 0.690 | −0.108 |
| Z5 | 0.557 | 0.046 | 0.614 | −0.087 | −0.135 | −0.195 | −0.078 | −0.124 | −0.265 | −0.172 | −0.289 | −0.287 | −0.319 | 0.727 | 0.727 | −0.291 | −0.291 | 1.000 | 0.999 | 0.188 | 0.259 | 0.480 | 0.768 |
| Z6 | 0.546 | 0.055 | 0.616 | −0.086 | −0.133 | −0.189 | −0.075 | −0.122 | −0.262 | −0.175 | −0.289 | −0.287 | −0.322 | 0.718 | 0.718 | −0.285 | −0.285 | 0.999 | 1.000 | 0.191 | 0.251 | 0.484 | 0.761 |
| Z7 | −0.428 | 0.862 | 0.872 | 0.695 | 0.762 | 0.719 | 0.572 | 0.750 | 0.555 | 0.508 | 0.348 | −0.088 | −0.370 | −0.176 | −0.176 | 0.838 | 0.838 | 0.188 | 0.191 | 1.000 | 0.405 | 0.941 | 0.359 |
| Z8 | −0.235 | 0.431 | 0.436 | 0.243 | 0.293 | 0.254 | 0.261 | 0.290 | 0.198 | 0.123 | 0.272 | 0.106 | −0.014 | −0.074 | −0.074 | 0.326 | 0.326 | 0.259 | 0.251 | 0.405 | 1.000 | 0.473 | 0.150 |
| Z9 | −0.274 | 0.822 | 0.949 | 0.648 | 0.685 | 0.634 | 0.549 | 0.677 | 0.474 | 0.460 | 0.306 | −0.079 | −0.349 | −0.013 | −0.013 | 0.690 | 0.690 | 0.480 | 0.484 | 0.941 | 0.473 | 1.000 | 0.519 |
| Z10 | 0.521 | −0.059 | 0.666 | −0.147 | −0.160 | −0.218 | −0.285 | −0.163 | −0.305 | −0.206 | −0.423 | −0.525 | −0.537 | 0.659 | 0.659 | −0.108 | −0.108 | 0.768 | 0.761 | 0.359 | 0.150 | 0.519 | 1.000 |
References
- Raport 2020. Polska Na Drodze Zrównoważonego Rozwoju. GUS, Warszawa, Poland. 2020. Available online: https://raportsdg.stat.gov.pl/2020/cel13.html (accessed on 15 January 2021).
- Emisja Gazów Cieplarnianych. Wybrane Zagadnienia Dotyczące Emisji CO2 w Polsce. Opracowanie Tematyczne OT-683; Kancelaria Senatu: Warszawa, Poland, 2020. Available online: https://www.senat.gov.pl/gfx/senat/pl/senatopracowania/192/plik/ot-683.pdf (accessed on 15 January 2021).
- Dziennik Ustaw. Protokół z Kioto do Ramowej Konwencji Narodów Zjednoczonych w Sprawie Zmian Klimatu Sporządzony w Kioto Dnia 11 Grudnia 1997 r. (Dz. U. 2005, nr 203, poz. 1683). Available online: http://isap.sejm.gov.pl/isap.nsf/DocDetails.xsp?id=wdu20052031684 (accessed on 15 January 2021).
- Emmerling, C.; Krein, A.; Junk, J. Meta-Analysis of Strategies to Reduce NH3 Emissions from Slurries in European Agriculture and Consequences from Greenhouse Gas Emissions. Agronomy 2020, 10, 1633. [Google Scholar] [CrossRef]
- Nowakowicz-Dębek, B.; Wlazło, Ł.; Szymula, A.; Ossowski, M.; Kasela, M.; Chmielowiec-Korzeniowska, A.; Bis-Wencel, H. Estimating Methane Emissions from a Dairy Farm Using a Computer Program. Atmosphere 2020, 11, 803. [Google Scholar] [CrossRef]
- Tongwane, M.I.; Moeletsi, M.E. A review of greenhouse gas emissions from the agriculture sector in Africa. Agric. Syst. 2018, 166, 124–134. [Google Scholar] [CrossRef]
- Wiśniewski, P. Ocena wielkości emisji gazów cieplarnianych ze źródeł rolniczych na poziomie lokalnym w Polsce. Rocz. Ochr. Sr. 2018, 20, 1811–1829. [Google Scholar]
- Gradziuk, P.; Gradziuk, B. Gospodarka niskoemisyjna–nowe wyzwanie dla gmin wiejskich. Wieś I Rolnictwo 2016, 1, 105–126. [Google Scholar] [CrossRef]
- Zdeb, M. Redukcja Emisji Metanu i Węglowodorów Aromatycznych ze Składowisk Odpadów w Biofiltrze–Badania Polowe. Rocz. Ochr. Srodowiska 2015, 17, 1053–1073. Available online: https://ros.edu.pl/images/roczniki/2015/063_ROS_V17_R2015.pdf (accessed on 13 March 2021).
- Rokicki, T.; Koszela, G.; Ochnio, I.; Golonko, M.; Zak, A.; Szczepaniuk, E.K.; Szczepaniuk, H.; Perkowska, A. Greenhouse Gas Emissions by Agriculture in EU Countries. Rocz. Ochr. Srodowiska 2020, 22, 809–824. Available online: http://ros.edu.pl/index.php?option=com_content&view=article&id=862:057-ros-v22-r2020&catid=62&lang=pl&Itemid=299 (accessed on 13 March 2021).
- Kassenberg, A.; Świrkula, E. Polska Niskoemisyjna, Od Idei Do Działania; Instytut na rzecz Ekorozwoju: Warszawa, Poland, 2015. [Google Scholar]
- Krajowy Raport Inwentaryzacyjny. Inwentaryzacja Gazów Cieplarnianych w Polsce dla lat 1988–2018; KOBiZE: Warszawa, Poland, 2020; Available online: https://www.kobize.pl/uploads/materialy/materialy_do_pobrania/krajowa_inwentaryzacja_emisji/NIR_2020_raport_syntetyczny_PL.pdf (accessed on 17 January 2021).
- Krupin, V. Redukcja Emisji Gazów Cieplarnianych z Sektora Polskiego Rolnictwa: Misja Wykonalna? In Go2′50 Klimat Społeczeństwo Gospodarka; IOŚ−PIB: Warsaw, Poland, 2020; Volume 1, pp. 74–79. Available online: https://kobize.pl/uploads/materialy/materialy_do_pobrania/aktualnosci/2020/GO250/publikator_PL_finalna_web.pdf (accessed on 15 February 2021).
- Rebolledo-Leiva, R.; Angulo-Meza, L.; Iriarte, A.; Gonzalez-Araya, M.C. Joint carbo footprint assessment and data envelopment analysis for the reduction of greenhouse gas emissions in agriculture production. Sci. Total Environ. 2017, 594, 346. [Google Scholar] [CrossRef]
- Garnier, J.; Le Noe, J.; Marescaux, A.; Sanz-Cobena, A.; Lassaletta, L.; Silvestre, M.; Thieu, V.; Billen, G. Long-term changes in grennhouse gas emission from French agriculture and livestock (1852–2014): From traditional agriculture to conventional intensive systems. Sci. Total Environ. 2019, 660, 1486–1501. [Google Scholar] [CrossRef]
- Sanz-Cobena, A.; Lassoletta, L.; Aguilera, E.; de Prado, A.; Garnier, J.; Billen, G.; Iglesias, A.; Sanchez, B.; Guardia, G.; Abalos, D. Strategies for greenhouse gas emissions mitigation in Mediterranean agriculture: A review. Agric. Ecosyst. Environ. 2017, 238, 5–24. [Google Scholar] [CrossRef]
- Gao, J.; Hou, H.; Zhai, Y.; Woodward, A.; Vardoulakis, S.; Kovats, S.; Wilkinson, P.; Li, L.; Song, X.; Xu, L.; et al. Greenhouse gas emissions reduction in deifferent economic sectors: Mitigation measures, health co-benefits, knowledge gaps and policy implications. Environ. Pollut. 2018, 240, 683–698. [Google Scholar] [CrossRef] [PubMed]
- Khan, M.T.; Ali, Q.; Ashfag, M. The nexus between greenhouse gas emission, electricity production, renewable energy and agriculture in Pakistan. Renew. Energy 2018, 118, 437–451. [Google Scholar] [CrossRef]
- Zafeiriou, E.; Mallidis, I.; Galanopoulas, K.; Arabatzis, G. Greenhouse Gas Emissions and Economic Performance in EU Agriculture; AnEmpirical Study in a Non-Linear Framework. Sustainability 2018, 10, 3837. [Google Scholar] [CrossRef]
- Kastratovic, R. Impact of foreign direct investment on greenhouse gas emissions in agriculture of developing countries. Aust. J. Agric. Resour. Econ. 2019, 63, 620–642. [Google Scholar] [CrossRef]
- Wąs, A.; Kobus, P.; Krupin, V.; Witajewski-Baltvilks, J.; Cygiel, M. Ocena Wpływu Polityki Klimatycznej Na Sector Polskich Gospodarstw Rolnych; Centrum Analiz Klimatyczno-Energetycznych: Warszawa, Poland, 2020. [Google Scholar]
- Castoldi, N.; Bechini, L. Intergated sustainability assesment of cropping systems with agro-ecological and economic indicators in northern Italy. Eur. J. Agron. 2010, 32, 59–72. [Google Scholar] [CrossRef]
- Belanger, V.; Vanasse, A.; Parent, D.; Allard, G.; Pellerin, D. Delta: An integrated indicato–based self-assessment tool for the evaluation of dairy farms sustainability in Quebec Canada. Agroecol. Sustain. Food Syst. 2015, 39, 1022–1046. [Google Scholar] [CrossRef]
- Escribano, A.J.; Gaspar, J.P.; Mesias, F.J.D.; Moreno, A.F.P.; Escribano, M. A sustainability assesment of organic and conventional beef cattle farms in agroforestry system: The case of the “dehesa” rangelands. ITEA Inf. Tec. Econ. Agrar. 2014, 110, 343–367. Available online: http://bazy.pb.edu.pl:2101/full_record.do?product=UA&search_mode=GeneralSearch&qid=11&SID=W2Wfvl6B (accessed on 30 January 2021).
- Paracchini, M.L.; Bulgheroni, C.; Borreani, G.; Tabacco, E.; Banterle, A.; Bertoni, D.; Rossi, G.; Parolo, G.; Origgi, R.; De Paola, C. A diagnostics system to assess sustainability at a farm level: The SOSTARE model. Agric. Syst. 2015, 133, 35–53. [Google Scholar] [CrossRef]
- Koloszko-Chomentowska, Z.; Zukovskis, J.; Gargasas, A. Ecological and economic sustainability of Polish and Lithuanian agricultural holdings specializing in animal production. In Proceedings of the 8th International Scientific Conference Rural Development Bioeconomy Challenges, Aleksandras Stulginskis University, Kaunas, Lithuania, 23–24 November 2017; pp. 1103–1107. [Google Scholar] [CrossRef]
- Prus, P. Sustainable farming production and its impact on the natural environment–case study based on a selected group of farms. In Proceedings of the International Scientific Conference Rural Development Bioeconomy Challenges, Kaunas, Lithuania, 23–24 November 2017; pp. 1280–1285. [Google Scholar] [CrossRef]
- Polski FADN. Available online: https://fadn.pl/publikacje/wyniki-standardowe-2/wyniki-standardowe-srednie-wazone/ (accessed on 20 January 2021).
- Wilk, W. Wykorzystanie Danych Statystycznych i Wyników Rachunkowości Rolnej do Oceny Wpływu Rolnictwa na Środowisko w Ujęciu Makro- i Mikroekonomicznym; Studia I Raporty IUNG-PIB; Instytut Uprawy Nawożenia i Gleboznawstwa—Państwowy Instytut Badawcz: Pulawy, Poland, 2007; Volume 4, pp. 59–67. [Google Scholar] [CrossRef]
- Piekut, K.; Machnacki, M. Ocena ekologiczno-ekonomiczna gospodarstw rolnych na podstawie danych FADN. Woda-Środowisko-Obszary Wiejskie 2011, 11, 203–219. [Google Scholar]
- Syp, A.; Osuch, D. Szacowanie Emisji Gazów Cieplarnianych na Podstawie Danych FADN; Studia i Raporty IUNG-PIB. 2017, Volume 52, pp. 69–82. Available online: http://www.iung.pl/sir/zeszyt52_6.pdf (accessed on 21 January 2021).
- IPCC 2006. Guidelines for National Greenhouse Gas Inventories. The Institute for Global Environmental Strategies (IGES) for the IPCC. Available online: https://www.ipcc.ch/report/2006-ipcc-guidelines-for-national-greenhouse-gas-inventories/ (accessed on 20 January 2021).
- KOBiZE Krajowy Raport Inwentaryzacyjny. Inwentaryzacja Gazów Cieplarnianych W Polsce Dla Lat 1988-2016; IOŚ-PIB: Warszawa, Poland, 2018; Available online: https://www.kobize.pl/uploads/materialy/materialy_do_pobrania/krajowa_inwentaryzacja_emisji/NIR_2018_raport_syntetyczny_PL.pdf (accessed on 20 January 2021).
- Ji, E.S.; Park, K.-H. Methane and nitrous oxide emissions from livestock agriculture in 16 local administrative districts of Korea. Asian-Australas. J. Anim. Sci. 2012, 25, 1768–1774. [Google Scholar] [CrossRef]
- Yue, Q.; Xu, X.; Hiller, J.; Cheng, K.; Pan, G. Mitigating greenhouse gas emissions in agriculture: From farm production to food consumption. J. Clean. Prod. 2017, 149, 1011–1019. [Google Scholar] [CrossRef]
- Wysocka-Czubaszek, A.; Czubaszek, R.; Roj-Rojewski, S.; Banaszuk, P. Methane and Nitrous Oxide Emissions from Agriculture on a Regional Scale. J. Ecol. Eng. 2018, 19, 206–217. [Google Scholar] [CrossRef]
- Dick, J.; Smith, R.; Lilly, A.; Moxey, A.; Booth, J.; Campbell, C.; Coulter, D. Calculating Farm Scale Greenhouse Gas Emissions; University of Aberdeen, The Macaulay Institute, Carbon Plan, Pareto Consulting, SAOS Ltd.: Scotland, UK, 2008. [Google Scholar]
- Fereniec, J. Ekonomika I Organizacja Rolnictwa; Key Text: Warszawa, Poland, 1999. [Google Scholar]
- GUS. Rocznik Statystyczny Rolnictwa Z Lat 2007–2019; GUS: Warszawa, Poland, 2020. [Google Scholar]
- Jasińska, E. Indywidualne Gospodarstwa Rolne W Świetle Danych Rachunkowych Z Lat 1952-2001; IERiGŻ-PIB: Warszawa, Poland, 2008. [Google Scholar]
- Seber, W.G.A. Multivariate Observations; John Wiley & Sons: New York, NY, USA, 1984. [Google Scholar]
- Morrison, D. Wielowymiarowa Analiza Statystyczna; PWN: Warszawa, Poland, 1990. [Google Scholar]
- Carlson, K.M.; Gerber, J.S.; Mueller, N.D.; Herrero, M.; MacDonald, G.K.; Brauman, K.A.; Havlik, P.; O’Connell, C.S.; Johnson, J.A.; Saatchi, S.; et al. Grenhouse Gas Emissions Intensity of Global Croplands. Nat. Clim. Chang. 2017, 7, 63–68. [Google Scholar] [CrossRef]
- Poore, J.; Nemecek, T. Reducing food’s environment al imacts through producers and consumer. Science 2018, 360, 987–992. [Google Scholar] [CrossRef]
- Wu, H.; Huang, H.; Tang, J.; Chen, W.; He, Y. Net greenhouse gas emissions from agriculture in China: Estimation, spatial correlation and convergence. Sustainability 2019, 11, 4817. [Google Scholar] [CrossRef]
- Jarosz, Z.; Faber, A. Analiza przestrzennego zróżnicowania emisji podtlenku azotu z gruntów ornych w Polsce. Studia i Raporty IUNG-PIB. 2017, Volume 52, pp. 57–68. Available online: http://iung.pl/images/wyd/pib/zesz52.pdf (accessed on 20 March 2021).
- Casey, J.W.; Holden, N.M. Analysis of greenhouse gas emissions from the average Irish milk production system. Agric. Syst. 2015, 86, 97–114. [Google Scholar] [CrossRef]
- Dimitrov, D.D.; Wang, J. Geographic Inventory Framework for estimating spatial pattern of methane and nitrous oxide emissions from agriculture in Alberta, Canada. Environ. Dev. 2019, 32, 100461. [Google Scholar] [CrossRef]
- Ren, C.; Liu, S.; van Grinsven, H.; Reis, S.; Jin, S.; Liu, H.; Gu, B. The impact of farm size on agricultural sustainability. J. Clean. Prod. 2019, 220, 357–367. [Google Scholar] [CrossRef]
- Blandford, D.; Gaasland, I.; Vardal, E. Extensification versus Intensification in Reducing Greenhouse Gas Emissionsin Agriculture: Insights from Norway. Eurochoices 2013, 12, 4–9. [Google Scholar] [CrossRef]
- Ariva, J.; Viira, A.H.; Poldaru, R.; Roots, J. Medium-run projections for greenhouse gas emissions: Arising from agriculture: The case of milk production in Estonia. Agric. Food Sci. 2015, 24, 300–312. [Google Scholar] [CrossRef]
- Grainger, C.; Bauchemin, K.A. Can enteric methane emissions from ruminants be lowered without lowering their production? Anim. Feed. Sci. Technol. 2011, 167, 308–320. [Google Scholar] [CrossRef]
- Hoglund-Isaksson, L.; Gomez-Sanabria, A.; Klimont, Z.; Rafaj, P.; Schopp, W. Technical potentials and costs for reducing global anthropogenic methane emissions in the 2050 timeframe–results from the GAINS model. Environ. Res. Commun. 2020, 2. [Google Scholar] [CrossRef]
- Ocko, I.B.; Sun, T.; Shindell, D.; Oppenheimer, M.; Hristov, A.N.; Pacala, S.W.; Mauzerall, D.L.; Xu, Y.; Hamburg, S.P. Acting rapidly to deploy readily available methane mitigation measures by sector can immediately slow global warming. Environ. Res. Lett. 2021, 16, 054042. Available online: https://iopscience.iop.org/article/10.1088/1748-9326/abf9c8/pdf (accessed on 30 May 2021). [CrossRef]
- Koloszko-Chomentowska, Z. Influence of the Common Agricultural Policy on the development of family agricultural farms in the Podlaskie Province. Econ. Reg. Stud. 2018, 11, 51–68. Available online: http://www.ers.edu.pl/OJS/index.php/erspl/article/view/340/335 (accessed on 10 March 2021). [CrossRef][Green Version]
- Some, T.E.; Mbaye, A.A.; Barbier, B. Greenhouse Gas Emission Reduction in Agriculture: Trade-off ot Win-Win Situation for Small Farmers in the Sudanian Area of Burkina Faso? Afr. Dev. Rev. Rev. Afr. Dev. 2017, 29 (Suppl. 2), 163–178. [Google Scholar] [CrossRef]


| A–Field Crops | B–Milk | C–Mixed | ||||
|---|---|---|---|---|---|---|
| Specification | Average | Standard Deviation | Average | Standard Deviation | Average | Standard Deviation |
| Economic Indicators | ||||||
| X1—Number of farms | 3058.20 | 680.01 | 1881.67 | 870.35 | 4011.20 | 500.67 |
| X2—Utilized agricultural area (ha) | 30.51 | 10.38 | 19.13 | 2.96 | 16.83 | 1.32 |
| X3—Total livestock unit (LU) | 2.42 | 1.22 | 20.17 | 4.50 | 12.47 | 1.09 |
| X4—Total output (PLN) | 128,122.07 | 54,478.53 | 115,330.67 | 38,910.40 | 82,903.47 | 17,700.99 |
| X5—Total inputs (PLN) | 110,920.67 | 43,201.69 | 88,252.33 | 30,940.41 | 77,282.40 | 20,966.41 |
| X6—Fertilizers (PLN) | 21,068.53 | 10,469.06 | 7914.53 | 3043.14 | 7583.80 | 2310.94 |
| X7—Energy (PLN) | 13,366.07 | 6218.51 | 9342.87 | 3264.85 | 7747.00 | 2085.39 |
| X8—Total intermediate consumption (PLN) | 76,011.67 | 30,406.09 | 65,534.33 | 22,908.43 | 57,296.93 | 14,988.95 |
| X9—Total inputs (PLN ha−1) | 3593.80 | 503.97 | 4468.67 | 1006.58 | 4598.40 | 944.21 |
| X10—Land productivity (PLN ha−1) | 4117.87 | 514.65 | 5873.73 | 1236.60 | 4890.93 | 734.48 |
| X11—Farm net value added (PLN AWU−1) | 34,984.33 | 17,023.93 | 29,603.73 | 11,186.76 | 17,554.33 | 4079.47 |
| X12—Family farm income (PLN) | 46,797.33 | 28,032.23 | 48,952.87 | 19,791.13 | 22,283.53 | 5290.34 |
| X13—Family farm income (PLN·ha−1) | 1442.53 | 372.45 | 2480.40 | 714.25 | 1325.73 | 313.05 |
| Indicators of GHG sources | ||||||
| Z1—Dairy cattle CH4 (kg y−1) | 55.16 | 42.16 | 1825.33 | 287.15 | 337.35 | 65.07 |
| Z2—Dairy cattle N2O (kg y−1) | 28.95 | 22.13 | 958.11 | 150.87 | 177.05 | 34.15 |
| Z3—Other cattle CH4 (kg·y−1) | 86.67 | 28.41 | 797.43 | 326.89 | 446.06 | 133.44 |
| Z4—Other cattle N2O (kg y−1) | 83.58 | 27.39 | 769.60 | 315.28 | 430.13 | 128.67 |
| Z5—Pigs CH4 (kg y−1) | 19.49 | 12.33 | - | - | 107.41 | 10.86 |
| Z6—Pigs N2O (kg y−1) | 123.37 | 76.15 | - | - | 709.30 | 71.78 |
| Z7—Total emissions CH4(kg y−1) | 154.07 | 86.20 | 2622.75 | 611.07 | 890.82 | 102.46 |
| Z8—emissions CH4 (kg ha−1) | 5.96 | 4.07 | 135.94 | 14.25 | 76.37 | 6.80 |
| Z9—total emissions N2O (kg y−1) | 239.89 | 116.65 | 1727.71 | 464.10 | 1317.15 | 122.23 |
| Z10—emissions N2O (kg ha−1) | 9.27 | 5.65 | 89.04 | 12.15 | 78.30 | 4.26 |
Publisher’s Note: MDPI stays neutral with regard to jurisdictional claims in published maps and institutional affiliations. |
© 2021 by the authors. Licensee MDPI, Basel, Switzerland. This article is an open access article distributed under the terms and conditions of the Creative Commons Attribution (CC BY) license (https://creativecommons.org/licenses/by/4.0/).
Share and Cite
Koloszko-Chomentowska, Z.; Sieczko, L.; Trochimczuk, R. Production Profile of Farms and Methane and Nitrous Oxide Emissions. Energies 2021, 14, 4904. https://doi.org/10.3390/en14164904
Koloszko-Chomentowska Z, Sieczko L, Trochimczuk R. Production Profile of Farms and Methane and Nitrous Oxide Emissions. Energies. 2021; 14(16):4904. https://doi.org/10.3390/en14164904
Chicago/Turabian StyleKoloszko-Chomentowska, Zofia, Leszek Sieczko, and Roman Trochimczuk. 2021. "Production Profile of Farms and Methane and Nitrous Oxide Emissions" Energies 14, no. 16: 4904. https://doi.org/10.3390/en14164904
APA StyleKoloszko-Chomentowska, Z., Sieczko, L., & Trochimczuk, R. (2021). Production Profile of Farms and Methane and Nitrous Oxide Emissions. Energies, 14(16), 4904. https://doi.org/10.3390/en14164904