1. Introduction
The current standard of living of mankind is possible thanks to the exploitation of natural capital on an unprecedented scale, which causes increasing interference in the state of the planet and uncertainty about its future [
1]. Natural resource mismanagement leads to climate change and limitations in the biological productivity of the land [
2,
3,
4,
5]. In the history of mankind, there have been many cases of degradation of regional ecosystems as a result of human activity. One of them was “ecological suicide”, the so-called Fertile Crescent that 12,000 years ago was the cradle of cities, empires, and great civilizations in the Middle East. The Fertile Crescent is a belt of more fertile lands, shaped like a great crescent, stretching from Egypt, through Palestine and Syria, to Mesopotamia. It extended from Memphis in the Nile Valley to Ur in southern Mesopotamia, including Syria and Canaan, the steppe between the mountain range of Asia Minor and the Syrian Desert. It is the geographic cradle of the great civilizations of the ancient Near East. Thanks to favorable conditions, the first agricultural areas were created here (around 10,000 BC). During the Neolithic revolution, wheat, millet, and barley were grown here. As man domesticated new species of plants and animals, legumes, figs, and grapevines began to be cultivated. Later, the civilizations of Mesopotamia and Ancient Egypt developed [
6]. As a result of human activity, this area has become a dry, desert terrain, economically and socially backward. In the 21st century, humans are causing ecosystem destruction on a global scale, i.e., they will not be able to move to areas with favorable living conditions, as did the ancestors from the Fertile Crescent. According to Diamond [
7], the societies that committed inadvertent “ecological suicide” were among the most developed and complex of their time. Currently, the most developed economies are experiencing trends based on the economic cult of economic growth and the consumption of goods and services, which are produced based on resources obtained from the environment. The appropriate counterbalance may be sustainable development [
8,
9,
10,
11,
12], the condition of which is shaping the relations between the economy, society, and the environment in such a way that will not affect the ability of the environment to provide its services in the future. It is also important to treat environmental issues from a supranational and global perspective, treating the earth’s ecosystem as a common good [
13,
14]. A contradiction of such an idea is, for example, the transfer of energy-intensive and “environmentally dirty” production by rich (pseudo-sustainable) countries to other parts of the globe. A significant problem is also the uneven distribution of natural resources, especially minerals, which are the main sources of energy. It is very dangerous to be in a situation where several countries have a good whose consumption can no longer be excluded. International raw material and energy dependencies are becoming an element of pressure and may be the cause of socio-economic crises.
The technological nature of human existence is dependent on external energy sources, which has become the condition of every civilization and the driving force behind every action. According to the Goban-Class [
15], “without matter, there is nothing, without energy everything is stationary”. This confirms the contemporary dependence of mankind on energy, which determines economic growth, living standards, and can also be a source of international conflicts [
16,
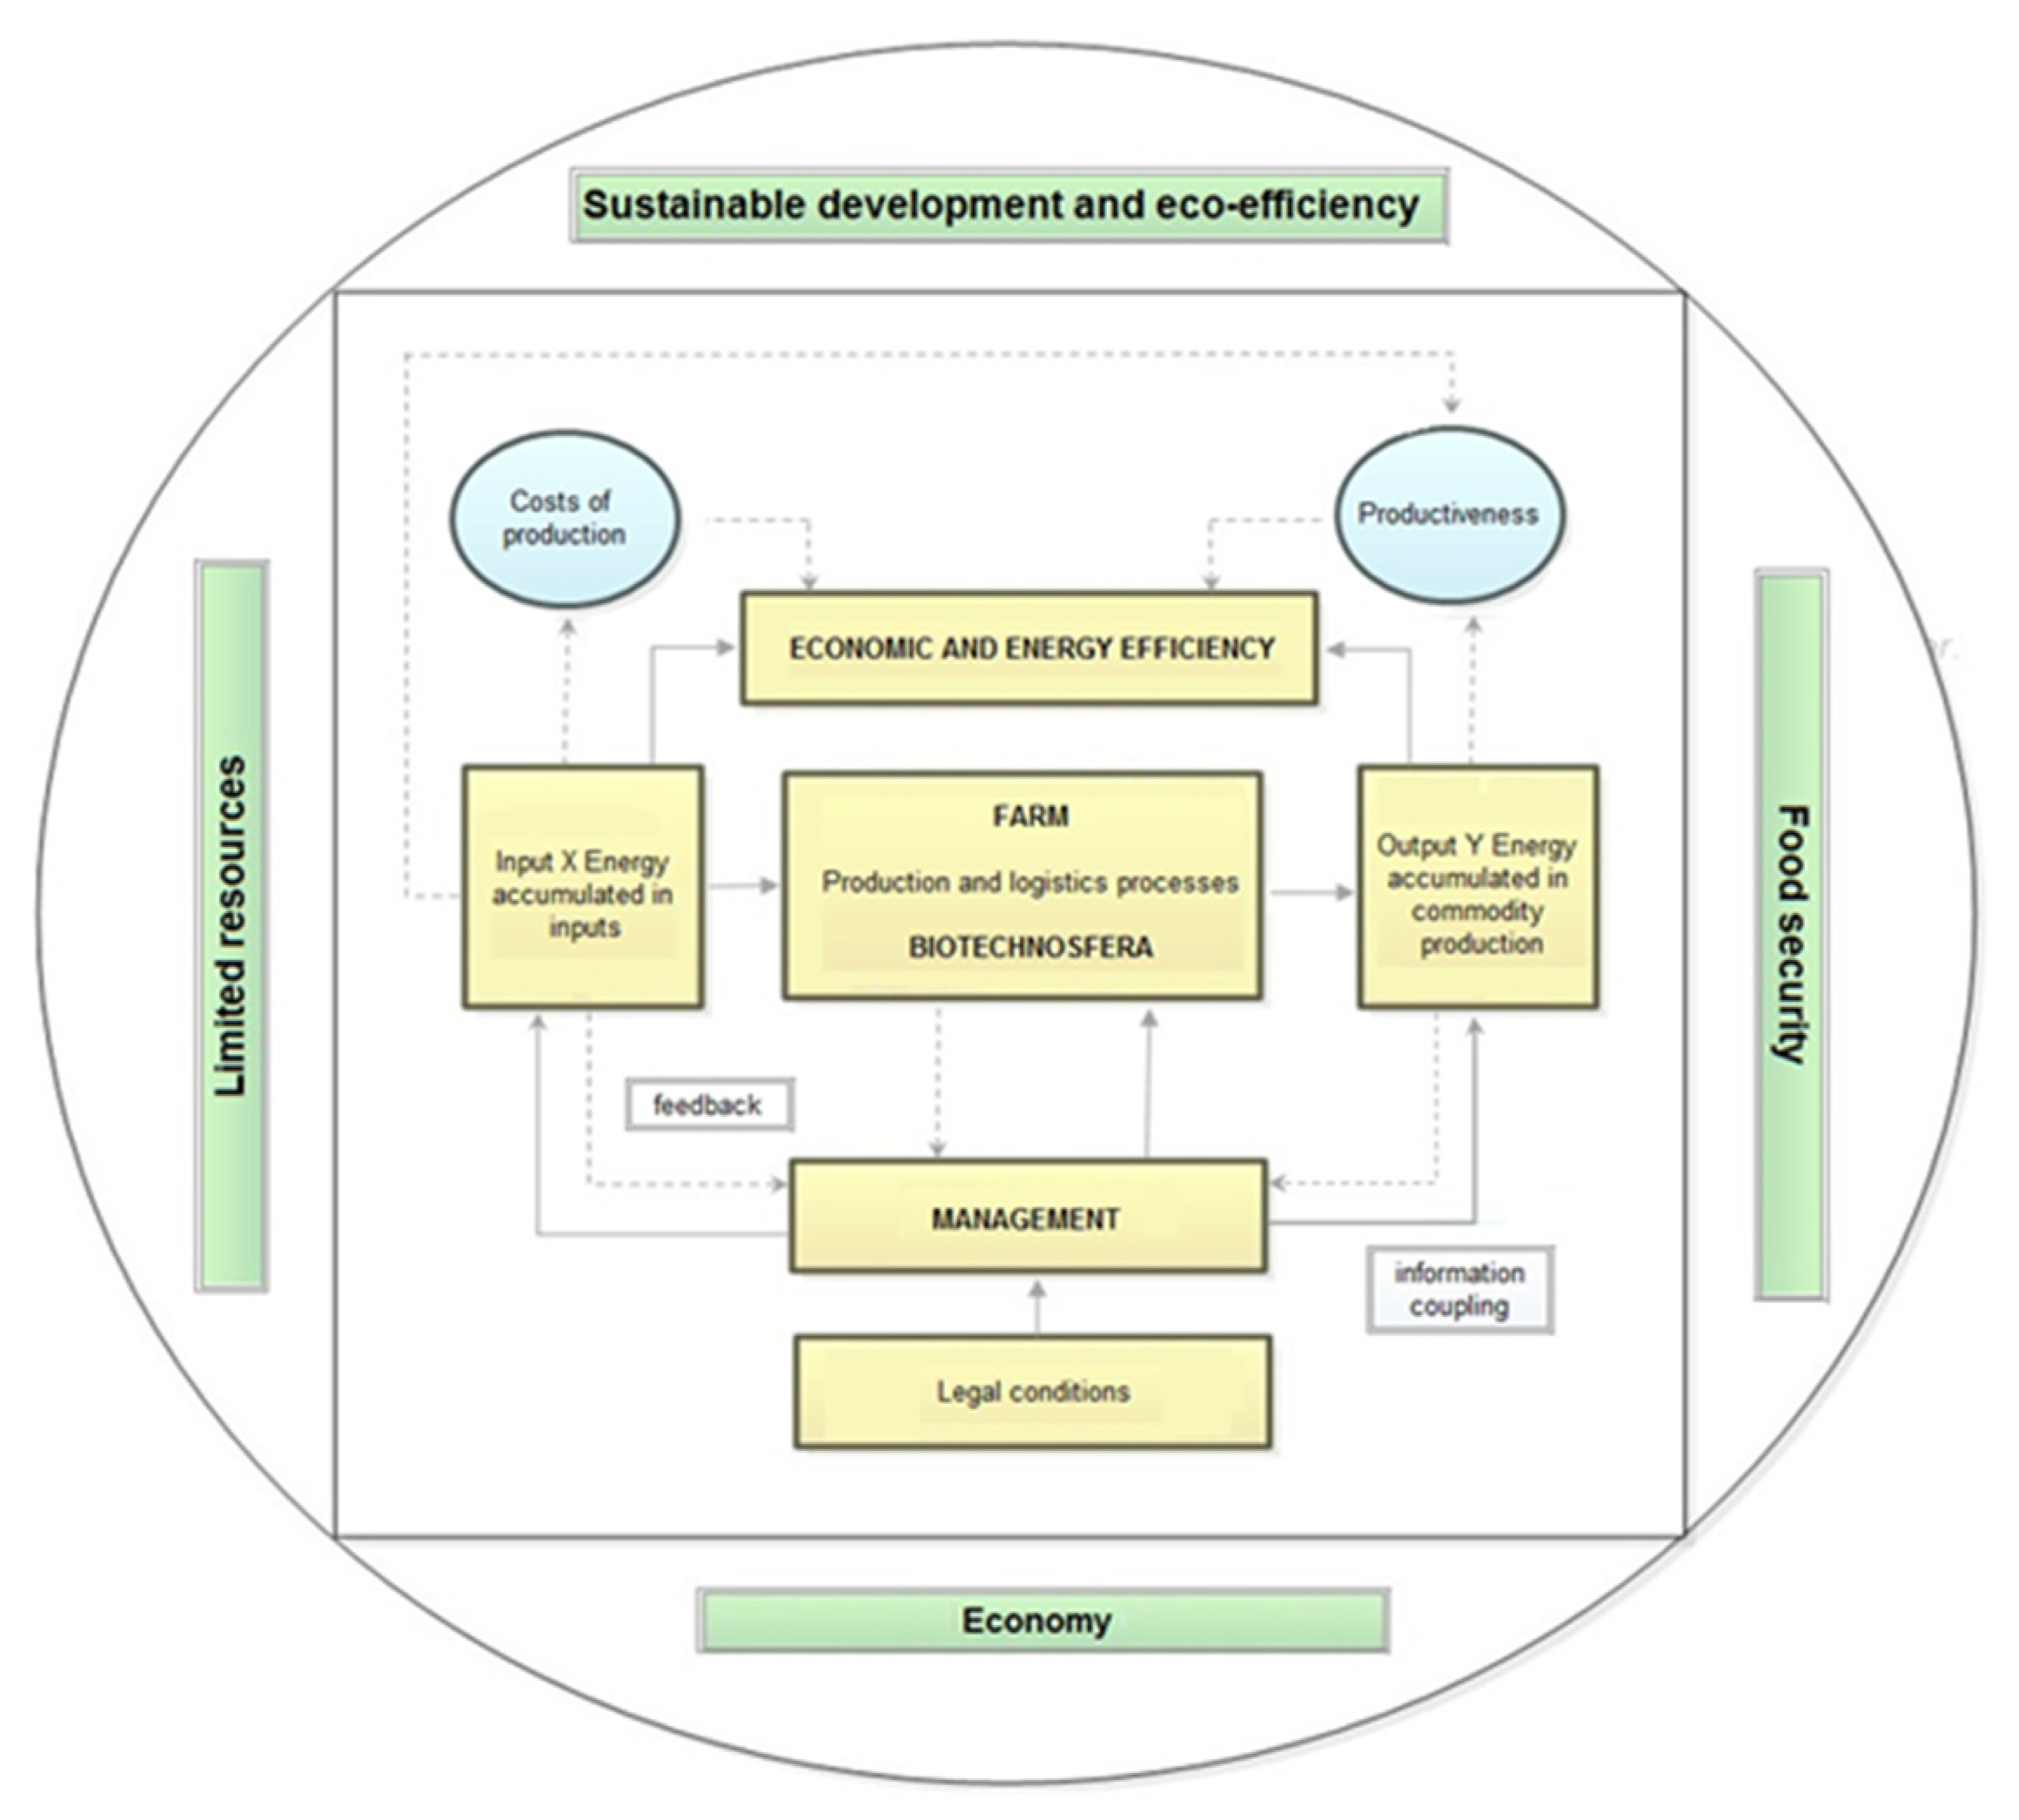
17]. One of the main problems is the limited energy sources, especially non-renewable ones. Therefore, there is a need for proper management, taking into account the needs of the present and future generations of the Earth’s inhabitants [
18] (
Figure 1).
Another problem is the negative impact on the environment of the processes of obtaining energy from non-renewable sources. The main disadvantage is the high greenhouse gas emissions and interference with the ecosystem of conventional energy [
19]. Climate change and any negative environmental effects are the results of a simplified understanding of management processes, i.e., assuming economic effects as the basis for development, without taking into account external costs. Performing an assessment solely using the classical measurement of economic efficiency turned out to be the wrong approach, providing inadequate information from the point of view of sustainable development. Economically efficient facilities are not always environmentally efficient. Due to the existing conflict of economic and environmental goals, it seems necessary to search for measures that would include both economic and environmental elements in their structure. The above doubts were one of the main reasons for researching the presented study. Another premise is the dependence of the world economy and its growth on limited natural resources and the growing energy demand. Moreover, there is a need to improve energy efficiency and reduce greenhouse gas emissions on a micro- and macro-scale [
20]. Thus, the improvement of energy efficiency becomes the goal to which all activities aimed at reducing the energy consumption needed by the economy to produce products and services are subordinated.
A significant consumer of energy is modern agriculture, which, especially in developed countries, is fully dependent on external non-renewable energy sources. In the 20th century, when the world population increased 3.7 times and the inhabited area increased by about 40%, the energy input increased from 0.1 to almost 13 EJ. As a result, in 2000, on average, about 90 times more energy was used per hectare of arable land than in 1900. In 1900, gross global plant production (before losses in storage and distribution) was little more than the average human food demand, meaning that a large proportion of humanity had little or no nutrition, and the share of the harvest that could be used for feeding the animals was minimal. Increased energy inputs allowed the basic varieties to reach their full potential, which increased yields [
21].
The use of means of production of industrial origin meant the introduction of a new source to agriculture—fossil raw materials, which was initiated by the use of solid fuels. Increasing energy resources increased production effects, in particular in plant production. Today, agriculture draws energy from two sources: biospheric resources and fossil resources, which correspond to two types of power—natural and industrial.
Agriculture using only natural sources of energy was a system with relatively high input processing efficiency. The production effects were not high, but the energy expenditure was also small. As the use of fossil fuel energy increases, the unit of energy expended yields less and less product revenue, which is a direct result of the law of diminishing returns. In addition, the increasing consumption of fossil fuels means an increase in greenhouse gas emissions from agriculture and an increasingly negative impact on the natural environment.
In agricultural activity, energy as a production input may determine the profitability of agricultural production, which in turn may affect the level of investments in farms aimed at improving production systems. It can be assumed that measures leading to the improvement of energy efficiency in agriculture and, consequently, to the reduction of production costs, are necessary both from an economic and environmental point of view by reducing GHG (greenhouse gas) emissions [
22,
23,
24]. The discussion about energy use in agriculture most often focuses on direct energy consumption [
25,
26,
27,
28,
29]. It is worth noting, however, that 50% or more of total energy consumption is due to the production of nitrogen fertilizers or other activities that indirectly affect the number of energy inputs [
30,
31]. Different agricultural production systems under different environmental conditions show different energy consumption and energy-saving potential. Therefore, the energy needs of agriculture depend on the nature of individual production processes, and agricultural production is very diverse both in terms of inputs and final products. Depending on the production direction, the processes of conversion of energy accumulated in inputs into energy accumulated in commodity products have different natures and relationships, hence the main objective of this research was to identify economic and energy efficiency in agriculture depending on the type and scale of production.
The research is an original contribution of the authors in the area of analyses of economic and energy efficiency. The proposed index is a measure that combines both economic data and technical data on energy consumption. The innovative approach consists in implementing the EROI (energy return on invested) method in agricultural research and treating the farm as a system that converts energy invested into commodity energy useful for humans in the form of food products. Recognizing that the most important task of agriculture is to feed humanity, a methodology was proposed to evaluate farms in terms of their efficiency and conversion of energy invested into commodity energy. Bearing in mind the negative impact of agriculture on the environment, inter alia through the consumption of non-renewable energy sources, the research results provide information on which farms generate energy surpluses and which of them do it at the lowest cost. The results of the research fill the gap in this respect because in the area of agriculture, the analyses conducted concern either only economic efficiency or only energy efficiency.
2. Materials and Methods
The research used the economic and energy efficiency index (
EEEI, used for research on farms). The main theoretical assumption of the indicator is to treat a farm as a system that uses energy accumulated in inputs necessary for production, and on the other hand, a system that supplies energy contained in products sold, both of plant and animal origin (
Figure 2). Based on Gołębiewska [
32], a systemic approach was applied. The inputs “reaching” the farm are transformed in the production process into effects that “leave” the system. What “enters” the system (for example as raw material) is transformed within the system (farm) and leaves the system at the output (as products). The energy entering the system is energy that is purposefully invested by humans (the calculation does not include the energy provided by the sun and used by plants in photosynthesis), while the energy leaving the system is commodity energy (energy contained in animals and vegetable products) useful to consumers. This approach allows the assessment of the effectiveness, including economic, of conversion of invested energy into commodity energy.
One of the goals of the work was, inter alia, diagnosing in which types of farming and on what scale of production the ratio of commodity energy to invested energy is the highest. Farms produce very diverse products that provide human living energy. While only a few dozen years ago the basis for the evaluation of a given production was the economic account, nowadays, it is necessary to include the environmental account. Humanity must very precisely produce food, paying attention to the lowest possible consumption of resources, including energy. Man needs a certain amount of protein and energy to live and work. The challenge is therefore to develop an optimal structure of food products produced with minimal energy inputs. The conducted research is the first step, where the purpose is to obtain information on which farms will provide more energy for the consumer than they use in the production process. The next step was to identify farms where the energy surplus is the least expensive. For this purpose, the following economic and energy efficiency index (
EEEI) was constructed:
where:
EEEI—economic and energy efficiency index,
Gp—the weight or quantity of the individual products sold,
Qj—the amount of energy contained in individual products sold (
Table 1),
Gr—the weight or number of individual inputs,
Qi—the amount of energy contained in individual inputs (
Table 2),
TPC—total production costs (EUR).
SE—surplus energy (MJ),
CE—commodity energy (energy included in sold production) (MJ),
IE—invested energy (energy accumulated in direct and indirect inputs used in the production process) (MJ).
Eec—energy from energy carriers (fuels, electricity) (MJ),
Ell—energy equivalent to live labor (MJ),
Eaf—energy contained in artificial fertilizers (MJ),
Epf—energy contained in purchased feed (MJ),
Epa—energy contained in animals from purchase (MJ).
For empirical research in the field of economic and energy efficiency of farms, data from the Polish FADN (Farm Accountancy Data Network) for 2016, from the entire territory of Poland, were used. The FADN operating in Poland is part of the European system, operating since 1965, based on the Regulation of the Council of 15 June 1965 setting up a network for the collection of accountancy data on the incomes and business operation of agricultural holdings in the European Economic Community [
36]. Data in FADN are collected in the management accounting convention. The FADN database is economic and organizational. It is now the most complete source of information on the situation of agricultural holdings. The identical principles of operation of the FADN system throughout the EU make the results comparable for all EU countries. The obtained data are used both for decision-making by EU bodies, monitoring the effects of these activities, and scientists dealing with the economics and organization of agriculture. Participation in the FADN system is voluntary. Farmers participating in the research write down every economic event that took place on their farm, in a special book, then agricultural advisors transfer them to the system [
24]. When selecting the research objects, the purposeful selection method was used—the results were adopted according to the set of classification coefficients “SO 2013”. To eliminate the influence of the production structure and economic power on the results of the analyses, all calculations were performed using the division of farms into production types and economic size classes. The production type is defined as the share of standard outputs (SO) from particular production lines in the total value of standard production of a given farm. Two threshold values apply to the type of farming formula. Farms in which the share of one direction of plant or livestock production exceeds 2/3 of SO are called specialist farms. Farms where the share of any of the directions does not exceed 1/3 of the SO are defined as “mixed”, i.e., combining animal and plant production (multidirectional) [
37]. The economic size of farms is determined by the sum of standard outputs from all agricultural activities occurring on a given farm. Standard output (SO) is the five-year average value obtained from one hectare of a given type of crop production or, in the case of livestock production, from one head, in the production conditions average for a given region [
38]. For analytical purposes, farms classified into 5 types of farming were selected following the FADN methodology:
Specializing in the cultivation of cereals, oilseeds, and protein crops for seeds,
Specializing in pig farming,
Specializing in dairy cattle breeding,
Specializing in slaughter cattle breeding,
Specializing in the cultivation of fruit trees and shrubs.
The division of the researched farms into 3 economic size classes in each type was adopted, considering the economic size of the farm as a criterion for grouping:
Small (8000 ≤ EUR ˂ 25,000)—marked as economic size class I,
Average (25,000 ≤ EUR ˂ 50,000)—marked as economic size class II,
Big (≥50,000 EUR)—marked as economic size class III.
The surveyed population is 6261 farms. The most numerous group were farms specializing in dairy cattle breeding (2742 farms) and farms specializing in cereal cultivation (2036 farms). Taking into account the economic size classes, the share of farms in individual classes was very similar: 2143 in economic size class I, 2077 in economic size class II, and 2041 in economic size class III. Due to the type of farming and the economic size class of classified farms, the largest group in the study were medium-sized farms specializing in dairy cattle production (1165 farms).
The paper presents only selected production and economic indicators, which allowed for the characteristics of the examined objects in terms of assets involved, costs incurred, or effects of the activity. The selection of the presented data also resulted from their impact on economic and energy efficiency.
All the researched farms conducted their activities using land resources, which the greater they were, the higher the economic size (
Table 3). The greatest amount of arable land was found on cereal farms—approximately 62 ha on average. However, the ownership structure of the land used is interesting, including the ratio of leased land to own use.
Among the analyzed types of farming, the largest amount of land was leased by farms specializing in cereal crops, which constituted approximately 32% of the total area of agricultural land in these farms. Farms with this type of production, working out by far the smallest direct surplus per hectare, are forced to increase their area more intensively to achieve acceptable income than farms with other types of production. Farms specializing in the cultivation of fruit trees and shrubs used the lease to the least extent, which is largely due to the specificity of production based on long-term plantings and significant related investments. The duration of the lease is usually limited to 5 years, which is a disadvantage in this case. It was found that with the increase in the scale of production, the share of leased agricultural land in each type of farm increases. This process was most dynamic in the pigs’ type.
It was assumed that the number of tractors may also affect the efficiency considered in the study—fuel consumption is one of the main energy inputs in agriculture. It was found that farms specializing in the cultivation of fruit trees and shrubs were characterized by significantly higher than average equipment with tractors—on average almost 15 pieces per 100 ha of UAA (Utilized Agricultural Area). The reasons can be found in the large number of agrotechnical and agro logistic works carried out at the same time, which determines the need to have many low-power tractors. The use of large and efficient machines is also problematic, as in the case of cereal production, where on average 2.4 tractors are used per 100 ha of agricultural land. A negative correlation was observed between the production scale and the number of tractors per 100 ha of UAA.
One component of the invested energy is labor input. In the studied objects, they were the highest in fruit-growing farms—on average 19.17 AWU (Annual Work Unit) per 100 ha of UAA, and the smallest in farms specializing in the cultivation of cereals, oilseeds, and protein crops for seeds—on average 2.49 AWU per 100 ha of UAA. The level of labor inputs decreases with increasing economic size. Clear differences in the labor intensity of extreme types of farming are a consequence of the specificity of production and the possibility of using efficient machines and work automation, which should translate into savings in energy inputs.
Fixed assets include agricultural land, farm buildings, forest plantings, and machinery and equipment, as well as livestock animals (
Table 4). For the calculation of the invested energy, energy accumulated in machines and devices as well as in buildings and structures was taken into account, as an indirect input. Taking these components into account gives grounds to believe that the conducted analyses have the features of a drawn calculus. Therefore, it was considered justified to present the significance of selected components of fixed assets and indicators of technical equipment for land and work in the researched farms.
The share of fixed assets in total assets was at a similar level in all types. The highest level of the indicator was recorded in small horticultural farms (91.01%), and the lowest in large farms specializing in slaughter cattle (83.05%).
When analyzing the structure of fixed assets, clear differences in individual types were observed. In the case of buildings, their share in fixed assets ranged from 7.82% in the largest cereal farms to almost 30% in farms specialized in rearing pigs from economic size class I. It should be added that pig farms had the highest index in all economic size classes. Therefore, these farms have the greatest negative impact of buildings and structures on the energy invested. This indicator decreases along with an increase in the economic size of farms. For buildings, it was assumed that the value of energy, which is the expenditure in a given year, constitutes 2.5% of the total energy accumulated in this fixed asset—following the principles of calculating depreciation for buildings and structures.
The researched farms were characterized by a very high share of machines and devices in the structure of fixed assets (18% on average). The differences between the individual types of farming were slight. The farms specializing in rearing cattle for slaughter were characterized by a lower index than the average. It was also found that the share of machines and devices in fixed assets increases with the increase in the scale of production. In the case of machines and devices, it was assumed that the value of energy, which is an input in a given year, constitutes 14% of the total energy accumulated in this fixed asset—following the principles of calculating depreciation for machines and devices.
A measure closely related to the value of buildings and machinery and equipment is the technical equipment of the land, which achieved the lowest value in large farms specializing in cereal cultivation (EUR 1699.99 per ha of UAA), while the highest value in small horticultural farms (EUR 6928.13 per ha of UAA), which is determined by the production technology appropriate for horticultural farms, where specialized buildings and structures (cold stores, etc.), as well as machines and devices, are required.
The study also counted the technical equipment of work, which in the studied group of farms is very diverse and ranges from EUR 28,609.24 per AWU in the smallest dairy farms, up to EUR 115,269.42 per AWU on cereal farms from economic size class III. Along with the increase in the economic size of farms, there is an increase in the technical equipment of work. The factor strongly affecting the level of this indicator is the number of people working on the farm, which is several times higher on dairy farms than on cereal farms.
3. Results
During the analyses, attention was also paid to economic effects (
Table 5). One of the measures used for such calculations is economic labor productivity, which increases with the increase in the economic size of the researched farms, except farms specializing in the cultivation of fruit trees and shrubs. Average economic labor productivity for fruit farms is several times lower than in other types of production. The differences deepen with the increase in the scale of production. In every economy size class, cereal farms are the leader.
The land profitability index is the ratio of income from an agricultural holding to the UAA. It allows for the assessment of land use efficiency as one of the production factors. The highest profitability of land was characterized by large farms specializing in pig farming (EUR 1009.66 per ha of UAA) and small farms specializing in the cultivation of fruit trees and shrubs (EUR 930.67 per ha of UAA). The lowest values of this indicator were recorded for both small, medium-sized, and large farms specializing in the cultivation of cereals (approximately EUR 387.17 per ha of UAA), which use employees more effectively than the cultivated land. It is worth adding that cereal farms require relatively the largest amount of energy to be invested to earn EUR 1.00 of income—on average 87.68, which is a result 2.5 times worse than in farms of the slaughter cattle type.
The factor having a significant impact on the cost-intensity of the researched farms was energy costs (engine fuels, electricity, heating fuels). However, their impact on direct costs was varied (
Table 6). By far the highest share of energy costs in direct costs was recorded in fruit-tree and shrub-type farms, which results from the specificity of production in these facilities. The dependence of this variable on the economic value was identified—with the increase in the scale of production, the share of energy costs in direct costs decreases. This relationship was most clearly visible in pig farms. Fruit farms were also characterized by the highest energy costs per hectare of UAA—on average EUR 210.89. The results of research on the structure of energy costs, which depended on the type of agricultural production, are interesting. For example, the cost of electricity was much more important for fruit and pig farms (on average over 30% share in energy costs) than for cereals (6.75%). Apart from the farm types of cereals and slaughter cattle, no clear correlation was found between the share and the economic size. In the case of the costs of propellants, their highest share in the energy costs is held by farms in the types of cereals and slaughter cattle—about 90%. The importance of individual energy sources depends on the needs of individual types of farming, resulting from the number of works and activities specific to a given production.
Invested energy is one of the key elements of the proposed economic and energy efficiency index. Therefore, it is important to recognize the impact of individual energy inputs on their amount. The structure of the energy invested is shown in
Table 7. Mineral fertilizers, direct energy carriers (engine fuels, electricity, heating fuels), as well as machines and devices, had the greatest share. The energy inputs accumulated in buildings (this is a consequence of the adopted methodology of calculation—2.5% of the total expenditure, which corresponds to the methodology of depreciation) and the energy contained in the equivalent of live labor had a marginal impact. In the case of fertilizers, their dominant share was in the energy invested in cereal farms—75% on average. In this area, it is possible to seek efficiency improvement by reducing the most energy-consuming inputs. Direct energy carriers had the highest share in fruit farms, which results from the course and specificity of production in these facilities. Additionally, the share of machines and devices in shaping the invested energy was the highest in these farms.
Concerning fertilizers, buildings, and live labor, it can be argued that along with the increase in the scale of production, the share of energy inputs in the invested energy decreases.
One of the objectives of the work was to calculate the EROI, i.e., the ratio of commodity energy to invested energy. Invested energy is energy accumulated in inputs used in the production process, while commodity energy is energy accumulated in sold products. The index should therefore be above 1, otherwise, it means that more energy has been invested than obtained in the production process. From an economic and environmental point of view, any activity should generate energy surpluses. In the researched farms, only the production of cereals and pigs generated such a surplus, regardless of the production scale (
Table 8). Additionally, the smallest farms specialized in milk production recorded the indicator above 1. The greatest losses of energy were recorded in farms specialized in the production of slaughter cattle and fruit from economic size class III. It was found that with the increase in the production scale, the EROI index decreased. This is the result of a disproportionate increase in commodity energy in relation to the increasing energy inputs accumulated, among others in mineral fertilizers and larger, more advanced machines and devices used in farms with a larger production scale.
When analyzing the economic and energy efficiency separately and comparing their course, different relations between them depending on the type and scale of production were observed (
Figure 3). It was found that farms with the highest energy efficiency (cereals) are characterized by the lowest economic efficiency, while the opposite was true for farms specialized in fruit production. It is worth adding that farms of the slaughter cattle type achieved the lowest values for both types of efficiency. The reaction of the examined efficiencies to changes in the production scale was also interesting. There was no common trend in this respect for the researched types of agricultural production. In pigs and dairy cattle farms, energy efficiency decreased and economic efficiency increased as the scale increased. The situation was quite different in fruit farms, where the growing production volume had negative effects on both economic and energy efficiency. In the case of cereals and slaughter cattle, the scale of production had a slightly positive impact on the economic effects per hectare of UAA, while in the case of energy efficiency, the direction of the trend cannot be clearly stated.
The last stage of the research was to calculate the economic and energy efficiency according to the proposed methodology (
Figure 4). The highest ratio was achieved by farms specialized in cereal production—on average they generated 26.60 MJ of energy surplus per EUR 1.00 of costs. The result above zero was also achieved by pig producers and the smallest dairy farms.
In the group of effective farms (index above zero), the most effective farms were those with the smallest production scale. Therefore, it can be concluded that in the case of economic and energy efficiency, there are decreasing scale effects.
4. Discussion
Energy analysis, as an independent research approach, was first used in the early 1970s [
39]. An impulse for research towards energy analyses was the work of Georgescu-Roegen “The entropy law and the economic process” [
40] from 1971. Such analyses require combining biological and technical knowledge with economic knowledge [
41,
42,
43]. It is not very easy, and therefore, no appropriate, uniform methodological foundations have yet been developed in energy analyses [
44,
45,
46]. Previous studies usually focused on economic or energy efficiency, treating them separately. This approach was also most often used in agriculture. Energy efficiency indicators are used to evaluate various agricultural systems as well as production methods (ecological, conventional) [
47,
48,
49,
50,
51]. According to Risoud [
52] and the methodology developed in her work, the energy efficiency of a farm is defined as the following ratio: gross energy of useful products/non-renewable energies used to produce them. Research in the field of energy consumption and efficiency of its use was conducted in particular concerning selected crops or breeding. The energy and economic analysis of wheat cultivation in Bangladesh were carried out by Rahman and Hasan [
53], and the rice production on farms in Iran by Pishgar-Komleh et al. [
54]. In their opinion, mainly, large farms (more than 1 ha) had better management and were more successful in energy use and economic performance. Heidari et al. in their research determined the efficiency of energy use (EUE) for the production of broilers [
55]. Energy consumption and energy efficiency for a representative crop (Flemish Farm Accountancy Data Network, FADN) of specialized dairy, arable, and pig farms in Flanders were determined by Meul et al. [
56]. The most energy-efficient dairy and pig farms were intensive farms, which combined a high production with low energy use, and which possessed a gross value added per production unit comparable to, or even higher than the average.
Energy efficiency, yield efficiency, and labor requirements in the production of maize, wheat, potatoes, and apples were determined for organic (without synthetic fertilizers and pesticides) and conventional agricultural technologies in the studies of Pimentel et al. [
57]. For all four crops, the labor input per unit of yield was higher for organic systems compared to conventional production. Similar studies for the comparison of cultivation systems (conventional, organic, and integrated) were carried out by the Italian research team of Falcone et al. [
58]. The energy efficiency and economic effects of the main cultivation methods (conventional, organic, and integrated) of clementine’s crops in Calabria (South Italy) were assessed by a combined use of the Life Cycle Energy Assessment (LCEA) approach and economic analysis. The economic efficiency of energy from clementine production was higher compared to the other two farming systems.
Keummel et al. [
59] proposed, for example, a system of agricultural production combining food and energy production, which could be a step towards the development of sustainable agriculture. The purpose of introducing such a system would be to reduce the positive balance of carbon dioxide emissions by agriculture, which contributes to climate change. This goal would be achieved by replacing the use of energy from fossil fuels with energy from biofuels produced in mandatory separate areas within farms. In this way, the emission of carbon dioxide from fossil fuels would be significantly reduced and, additionally, the absorption of carbon dioxide from the atmosphere by crops could increase. These studies show that such a system would be economically acceptable both from the point of view of the farmer and the society. Introducing biofuel production on a local scale would have benefits not only in terms of energy and climate, but also reducing carbon dioxide emissions was estimated by the authors at the equivalent of EUR 300/ha of external benefits.
It is worth paying attention to the research of Alluvione and co-authors [
60]. These researchers analyzed energy consumption and efficiency in three farming systems: low-cost, integrated, EU-compliant, and traditional-conventional. It was found that in the first two systems, the efficiency of energy use increases by 32.7% and 31.4% respectively, while maintaining similar results in terms of net energy. In the area of research on efficiency, the study by Uzal [
61] deserves attention, where the energy efficiency of milk production was compared on two farms. In the first, dairy cattle were reared in a free-stall housing system, in the second—in a loose housing system. It was found that in both cases, the highest percentage of energy inputs came from feed and the electricity consumed. Total energy consumption per hectare was lower on loose housing system farms. In the research by Gronroos et al. [
24], the energy consumption of traditional and organic milk and rye bread production in Finland was examined. Basic energy consumption in traditional milk production was 6.4 GJ per 1000 L of milk and 4.4 GJ in organic production. In the case of the production of rye bread, it was 15.3 and 13.3 GJ respectively, per 1000 kg of rye bread. Renewable energy use ranged from 7% to 16%, with a slightly higher percentage for organic farming.
An interesting approach to energy productivity in agriculture was presented by Uhlin [
62], questioning the statements widely described in the earlier literature that to reverse the downward trend in energy productivity in Swedish agriculture, energy inputs from fossil fuels should be reduced. The author claims that the emphasis should be placed not on the reduction of the use of fossil fuels, but on the development of the use of energy from renewable sources, e.g., solar energy, as this approach offers many more benefits than just reducing energy inputs. In research and policymaking, technical development and modern technologies used in agriculture should not be overlooked
One of the methods of assessing effectiveness is Data Envelopment Analysis (DEA). Using this method, Ghali et al. [
63] assessed the efficiency of the use of energy resources in French farms. Results show that disentangling energy resources from the rest of intermediate consumption highlights energy use excess, which is masked when considering intermediate consumption as a whole. Using DEA, Mohammadi et al. [
64] assessed the energy efficiency of farmers, to find efficient and inefficient ones and to identify the wasteful uses of energy in kiwifruit production. Chemical fertilizers and chemical energy were the main inefficient consuming inputs.
An important research problem is also the relation between the energy obtained and the energy put into the production process. Many scientists in recent years have undertaken such research, among them Kuesters and Lammel [
65], who in 1989–1997 analyzed the aforementioned relationship for winter wheat and sugar beet. It was found that the ratio of energy obtained to energy input was highest in the case of low-intensity crops, which means that extensive cultivation methods are preferred. However, with these production methods, low yields are obtained, and hence also low energy efficiency, therefore the authors additionally extended the analysis to include the net energy balance. The results were similar.
A similar aim of the research was adopted by Moitzi and his team [
26], who verified energy consumption and energy efficiency in selected farms in Slovakia, Romania, Serbia, and Austria. It was found, inter alia, that the intensity of the use of production factors, i.e., fuel, seeds, fertilizers, and pesticides, affects the energy efficiency of plant production. The main analyzed index: energy generated for energy inputs, in the case of winter wheat cultivation was 5.6, with the range from 4.8 to 7.1.
This article proposed a combination of energy efficiency, economic efficiency, and EROI index, and the development of the
EEEI economic and energy efficiency index (used for research on farms). The main theoretical assumption for the development of the indicator is to treat a farm as a system that uses energy accumulated in inputs necessary for production and as a system supplying energy contained in sold products of both plant and animal origin. Based on Gołębiewska [
32], a systemic approach was applied. The inputs “reaching” the farm are transformed in the production process into effects that “leave” the system. What “enters” the system (for example as raw material) is transformed within the system (farm) and leaves the system at the output (as products). The energy entering the system is energy that is purposefully invested by humans (the calculation does not include the energy provided by the sun and used by plants in photosynthesis), while the energy leaving the system is commodity energy (energy contained in animals and vegetable products) useful to consumers. This approach allows the assessment of the effectiveness, including economic, of conversion of invested energy into commodity energy.
Recognizing that it is necessary to introduce a coherent environmental and energy policy in agriculture, the Common Agricultural Policy should be shaped differently, extending it with measures promoting the economical use of energy sources. Combining self-exclusive goals, i.e., economic and energy efficiency, requires regulation and support. Food production should use energy efficiently and carefully manage natural resources, and this requires a different policy than the current CAP of the EU. In the context of the current needs in the field of environmental protection and eco-efficiency, the obtained research results may be the basis for considering changes in the agricultural policy and its evolution towards supporting farms with the highest economic and energy efficiency. Using the proposed measure, it is possible to search for the best farms, and also within individual types and through the system of payments for these producers, encourage farmers to apply the most beneficial and energy-saving practices and activities. Farms that will be effective in terms of energy management will also emit relatively less GHG, which will have an impact on lower costs related to the planned fees for the GHG emissions.
To further develop research in the field of economic and energy efficiency, using the developed methodology, comparative analyses should be conducted between individual EU countries and a recommendation should be developed concerning in which regions of Europe particular production directions should be developed due to energy efficiency. Moreover, to deepen the analysis and identify the reasons for the differences in the indicator, a questionnaire survey among farmers is needed.


 ,
, 


