
Analysis of Dynamic Characteristics and Power Losses of High Speed on/off Valve with Pre-Existing Control Algorithm

 ,
,
Abstract
:1. Introduction
2. The Mathematical Model of the HSV
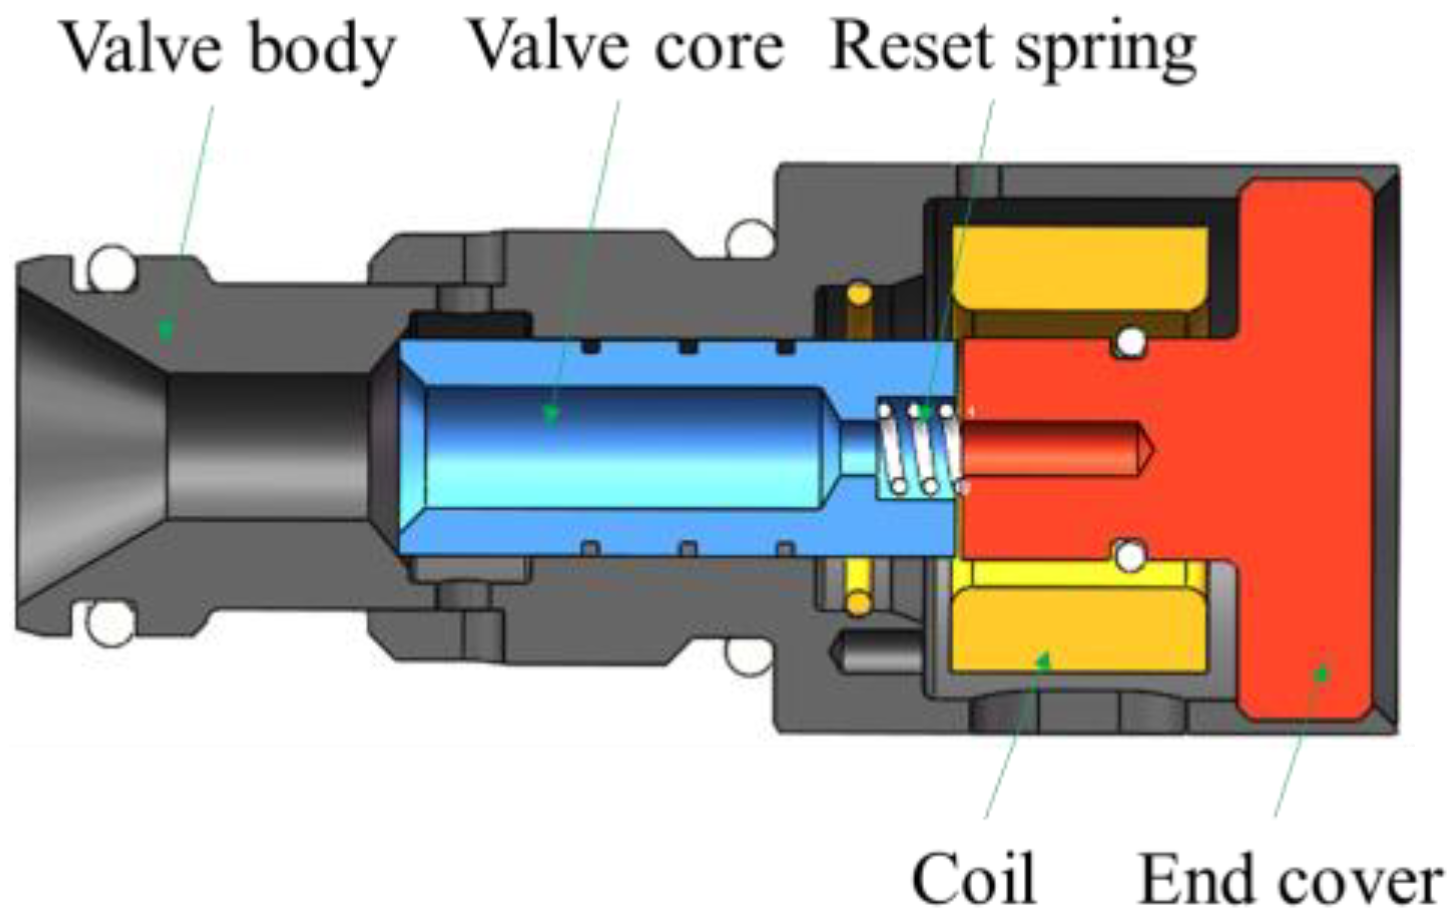
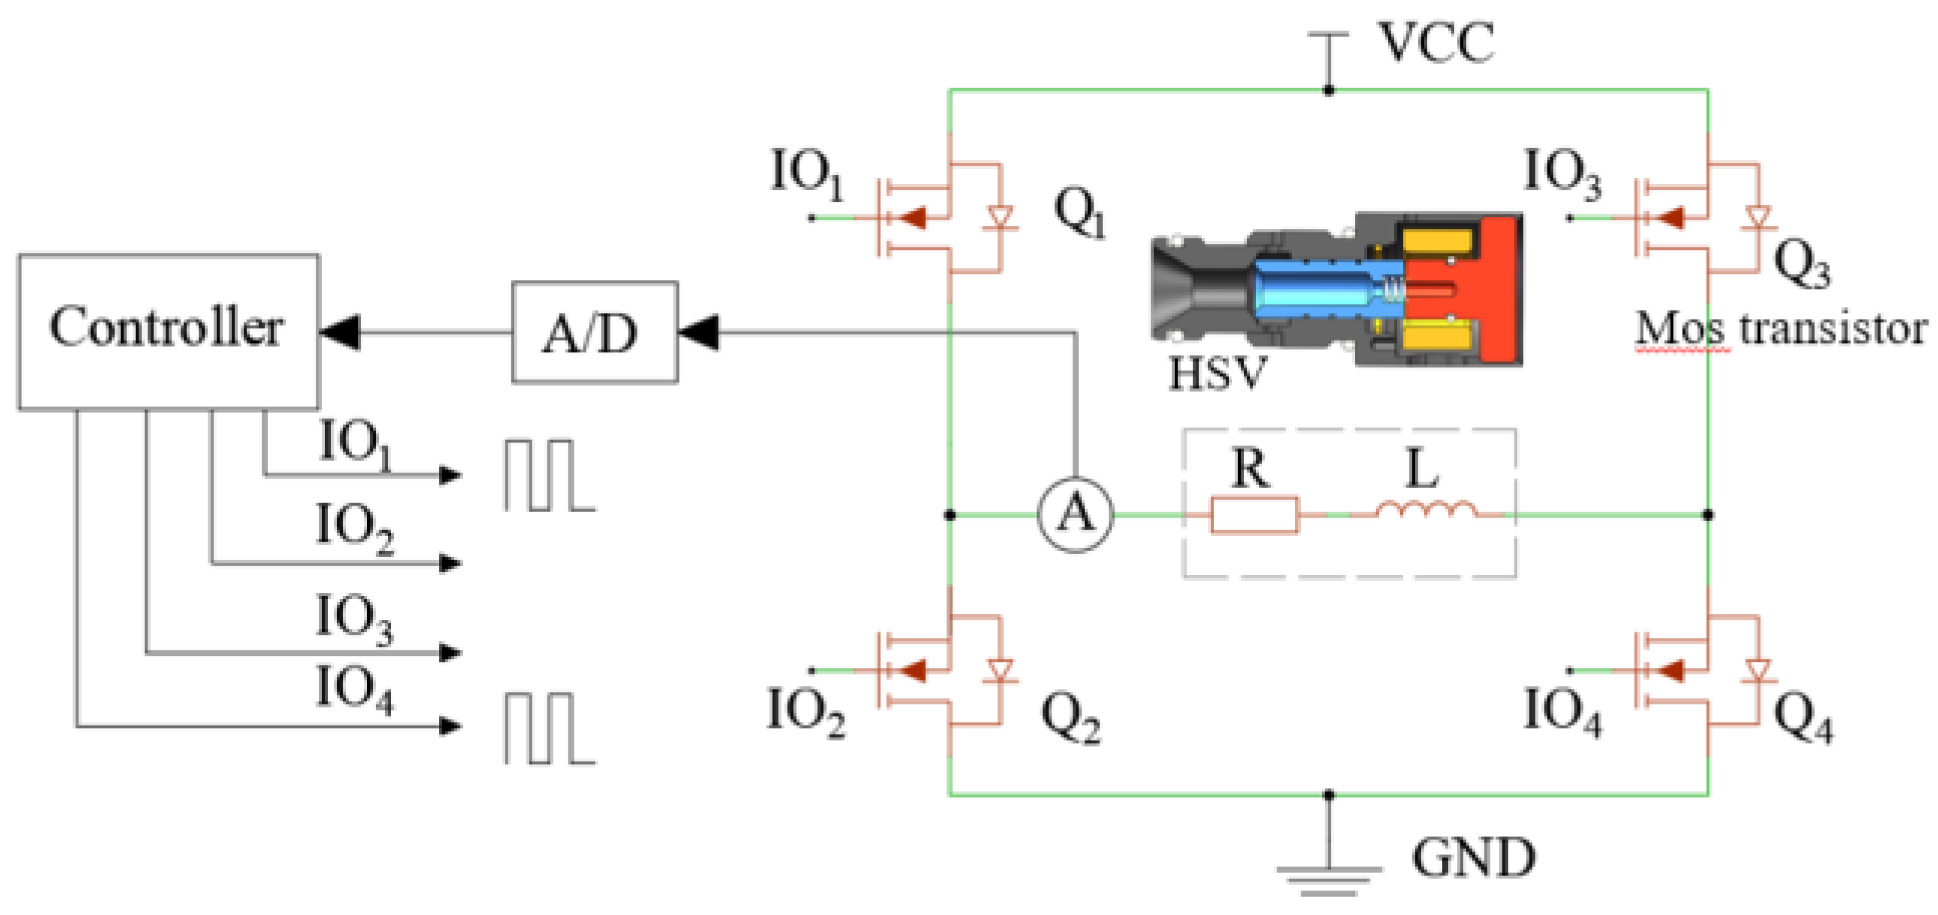
2.1. Structure and Operating Principle of the HSV
2.2. The Motion Characteristic Model of the HSV
2.3. The Energy and Temperature Field Model of the HSV
3. Simulation Results and Analysis
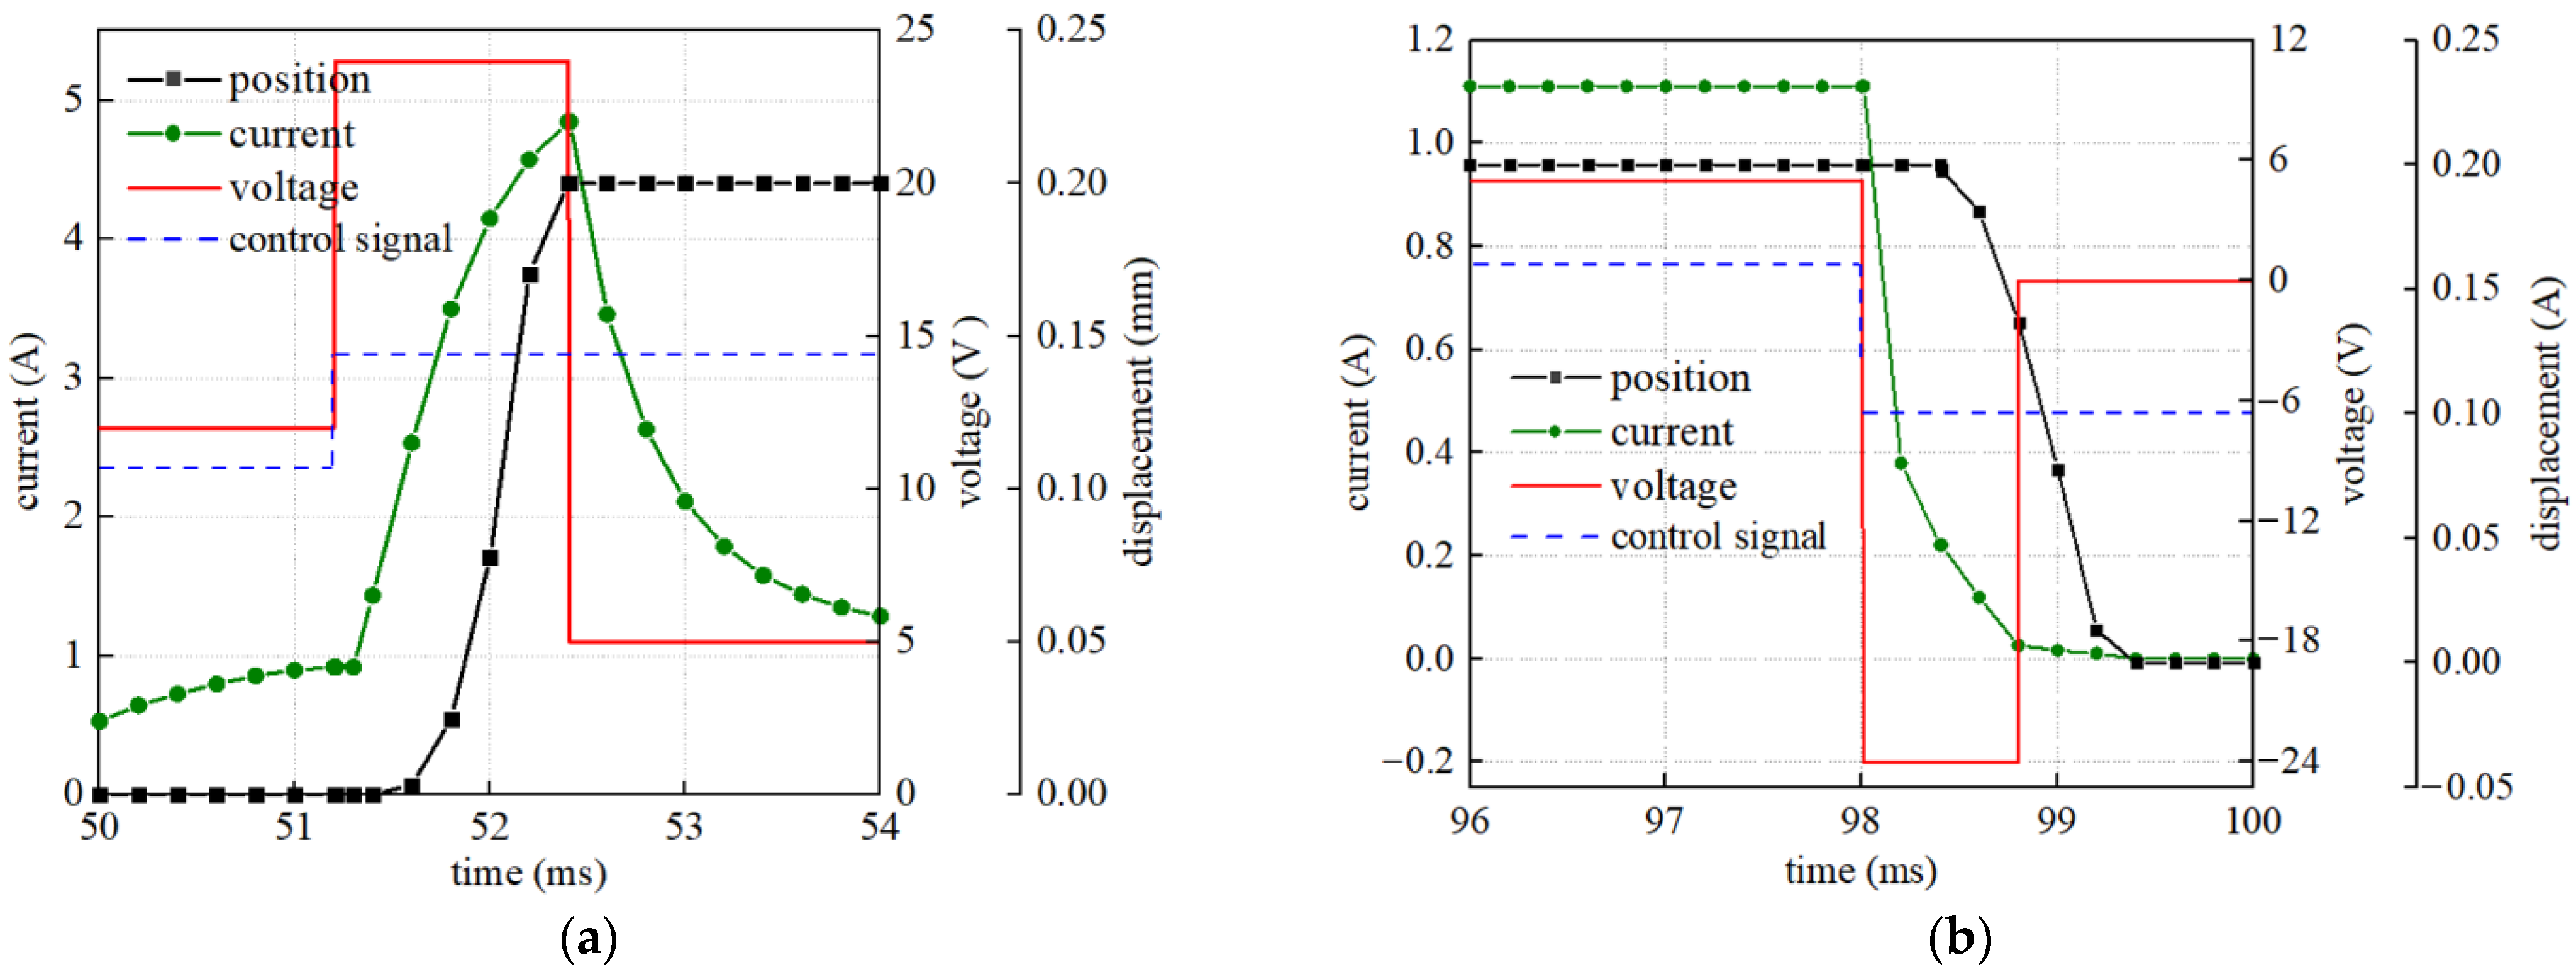
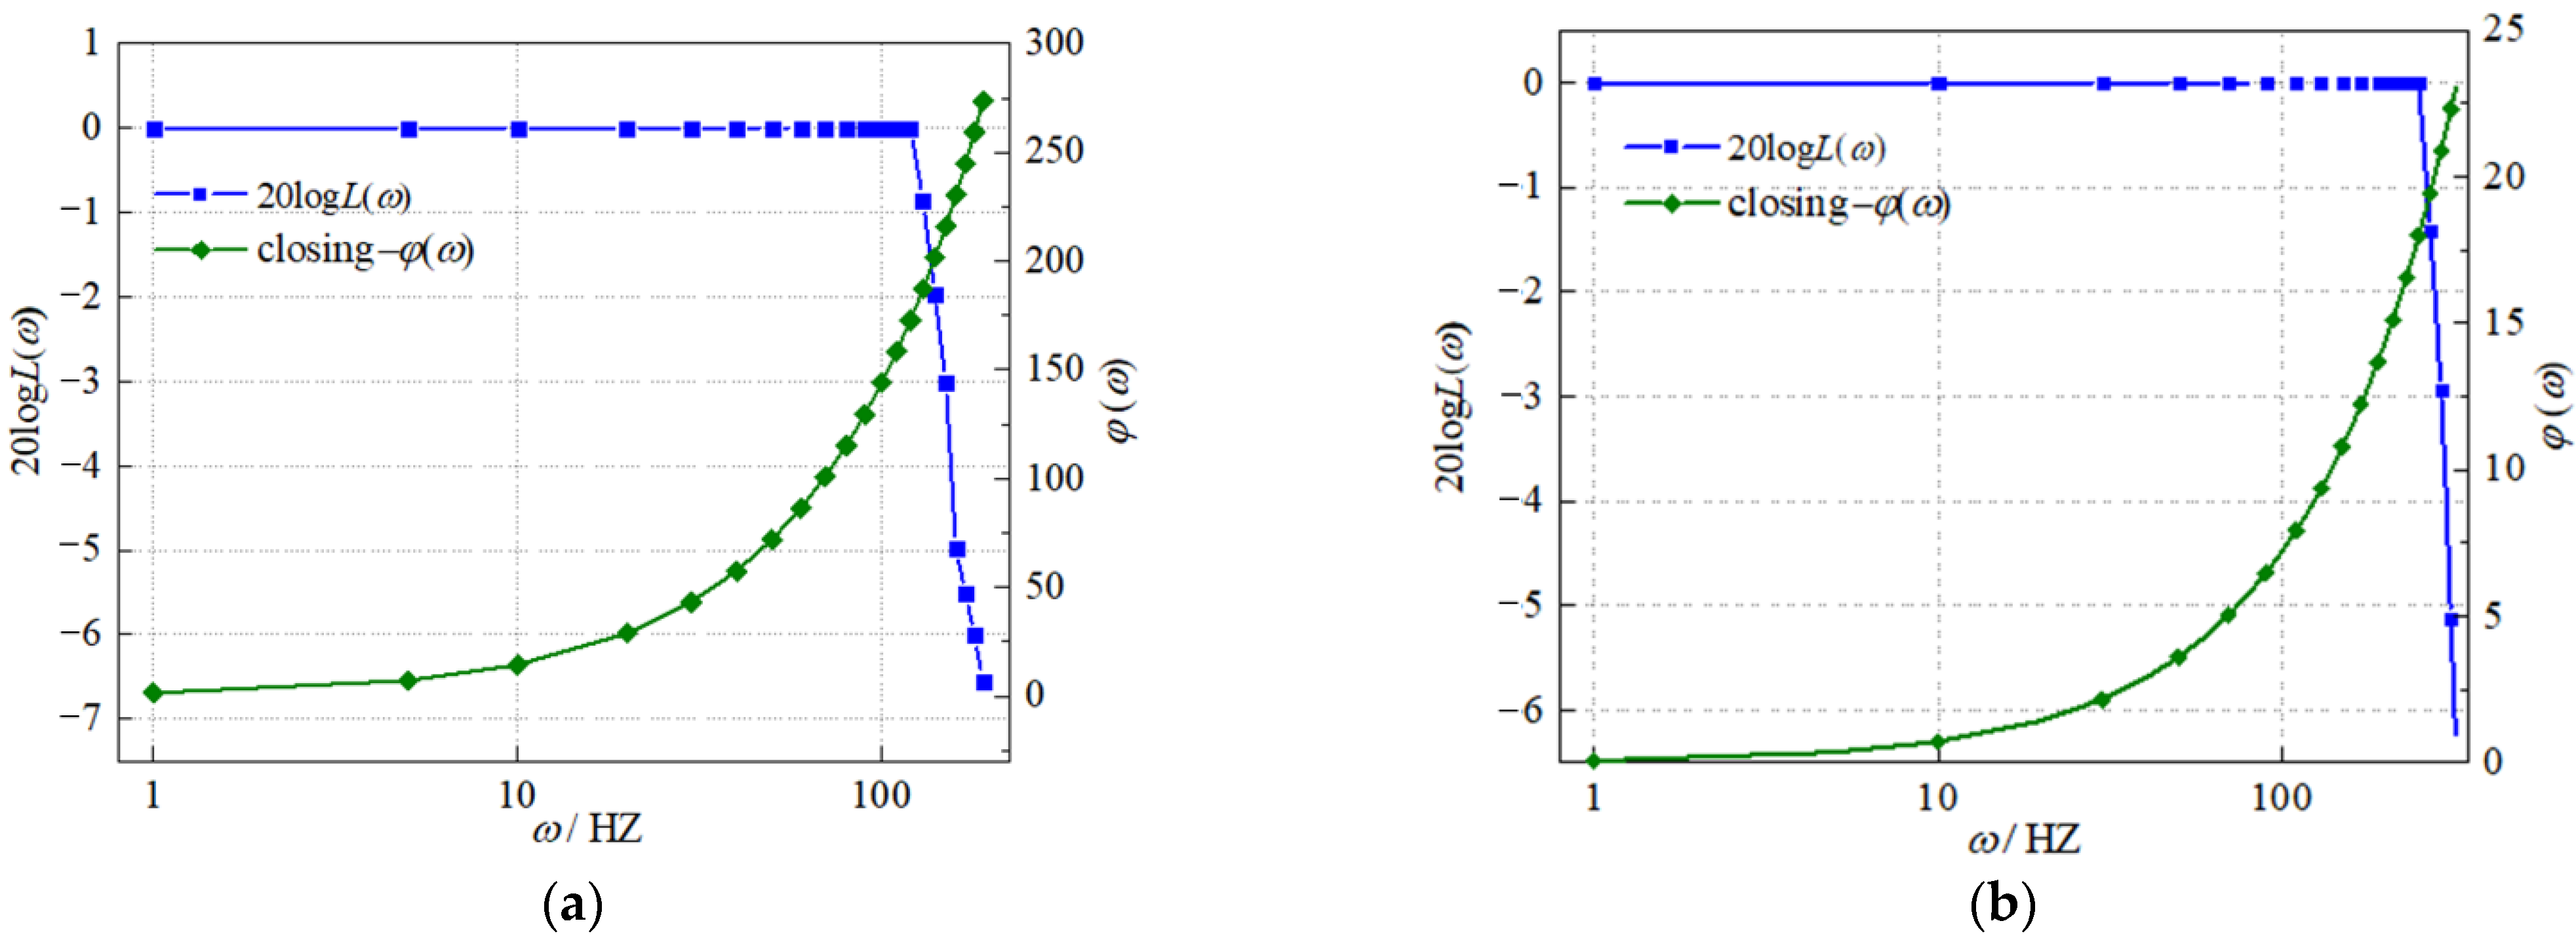
3.1. Simulation Analysis of Dynamic Characteristics of the HSV
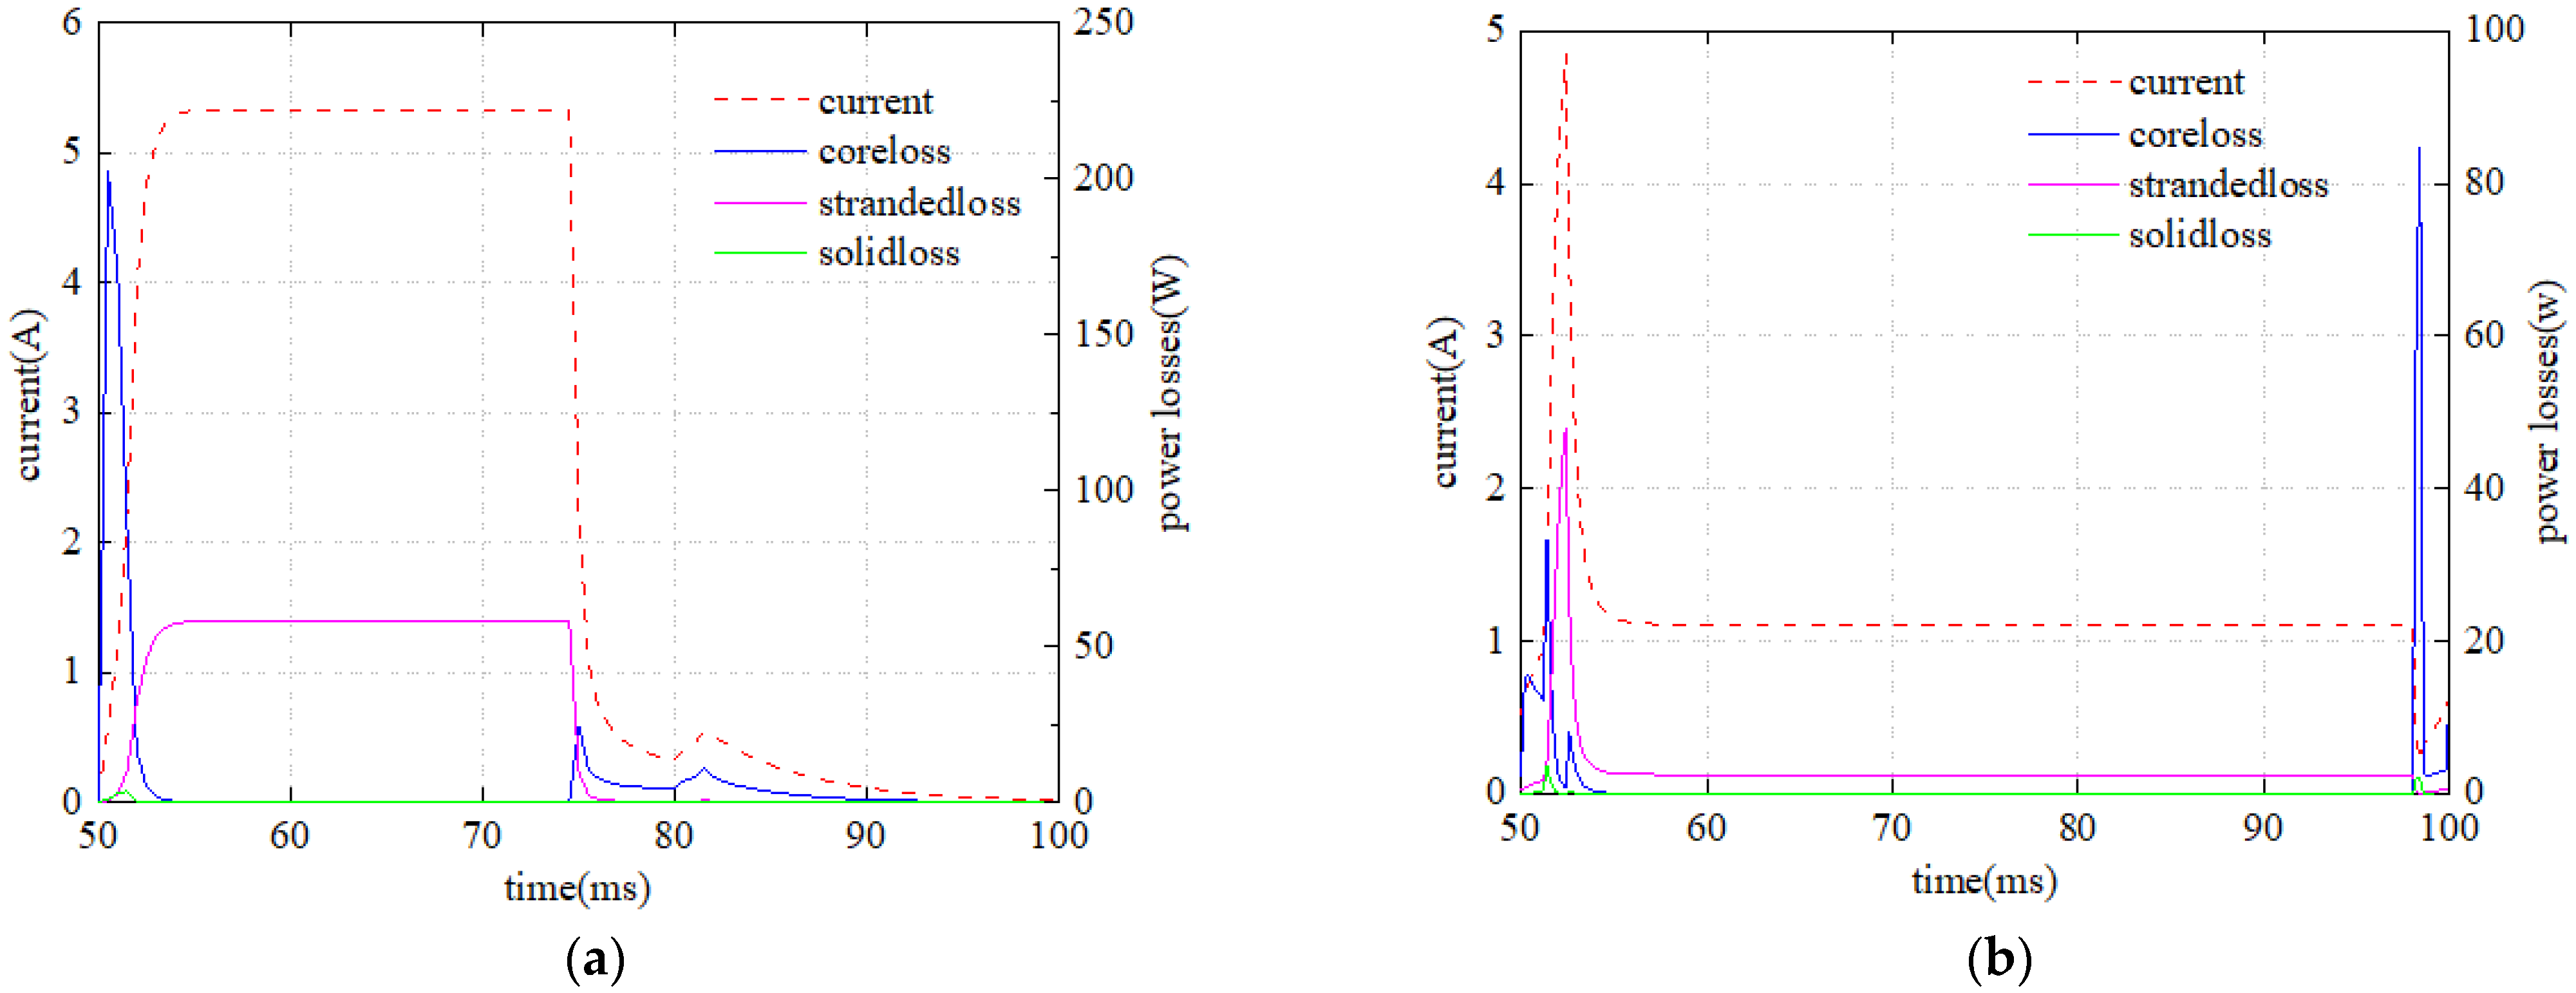
3.2. Simulation Analysis of Energy Characteristics of the HSV
4. Experimental Results and Analysis
5. Conclusions
- (1)
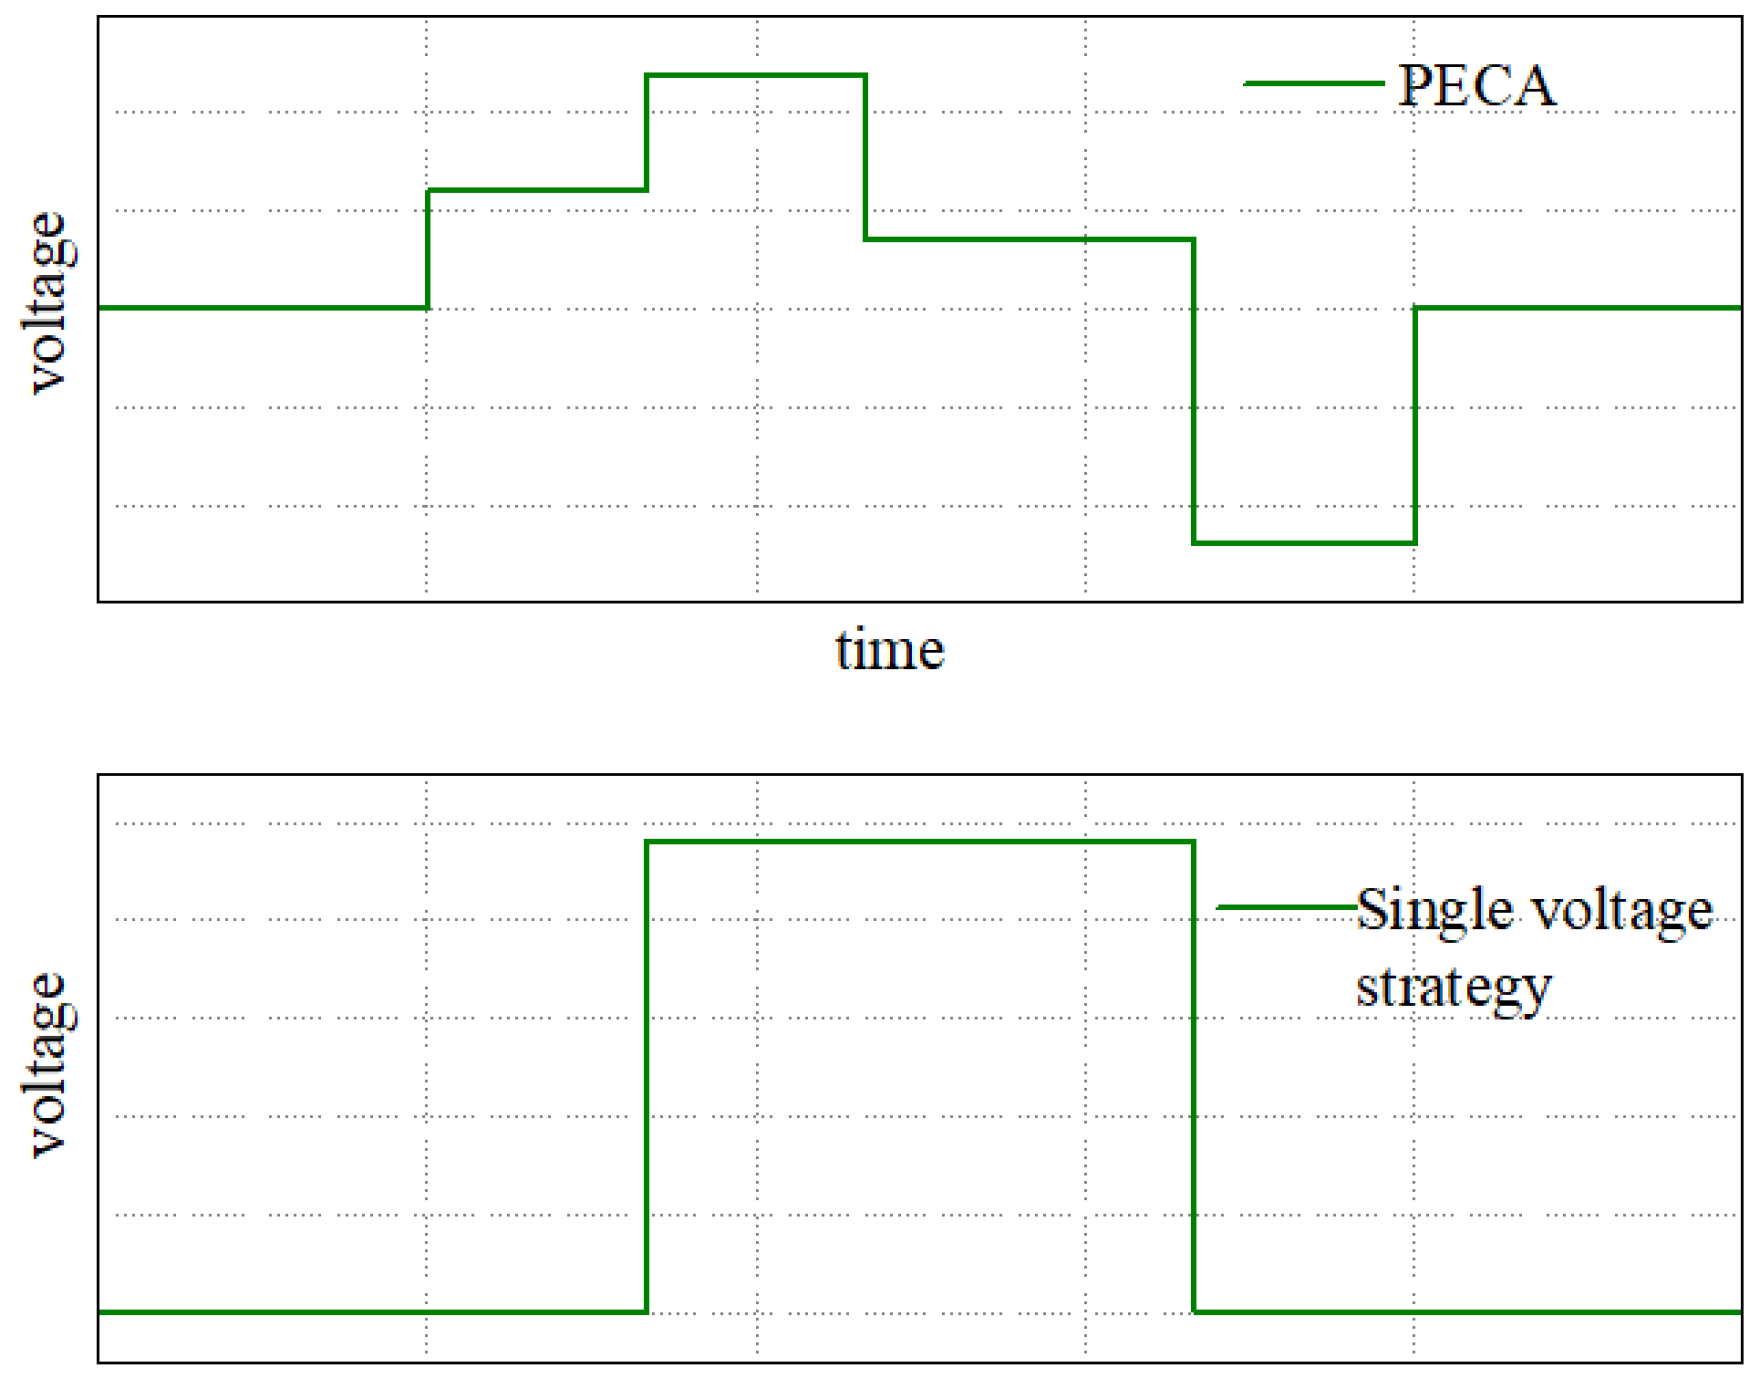
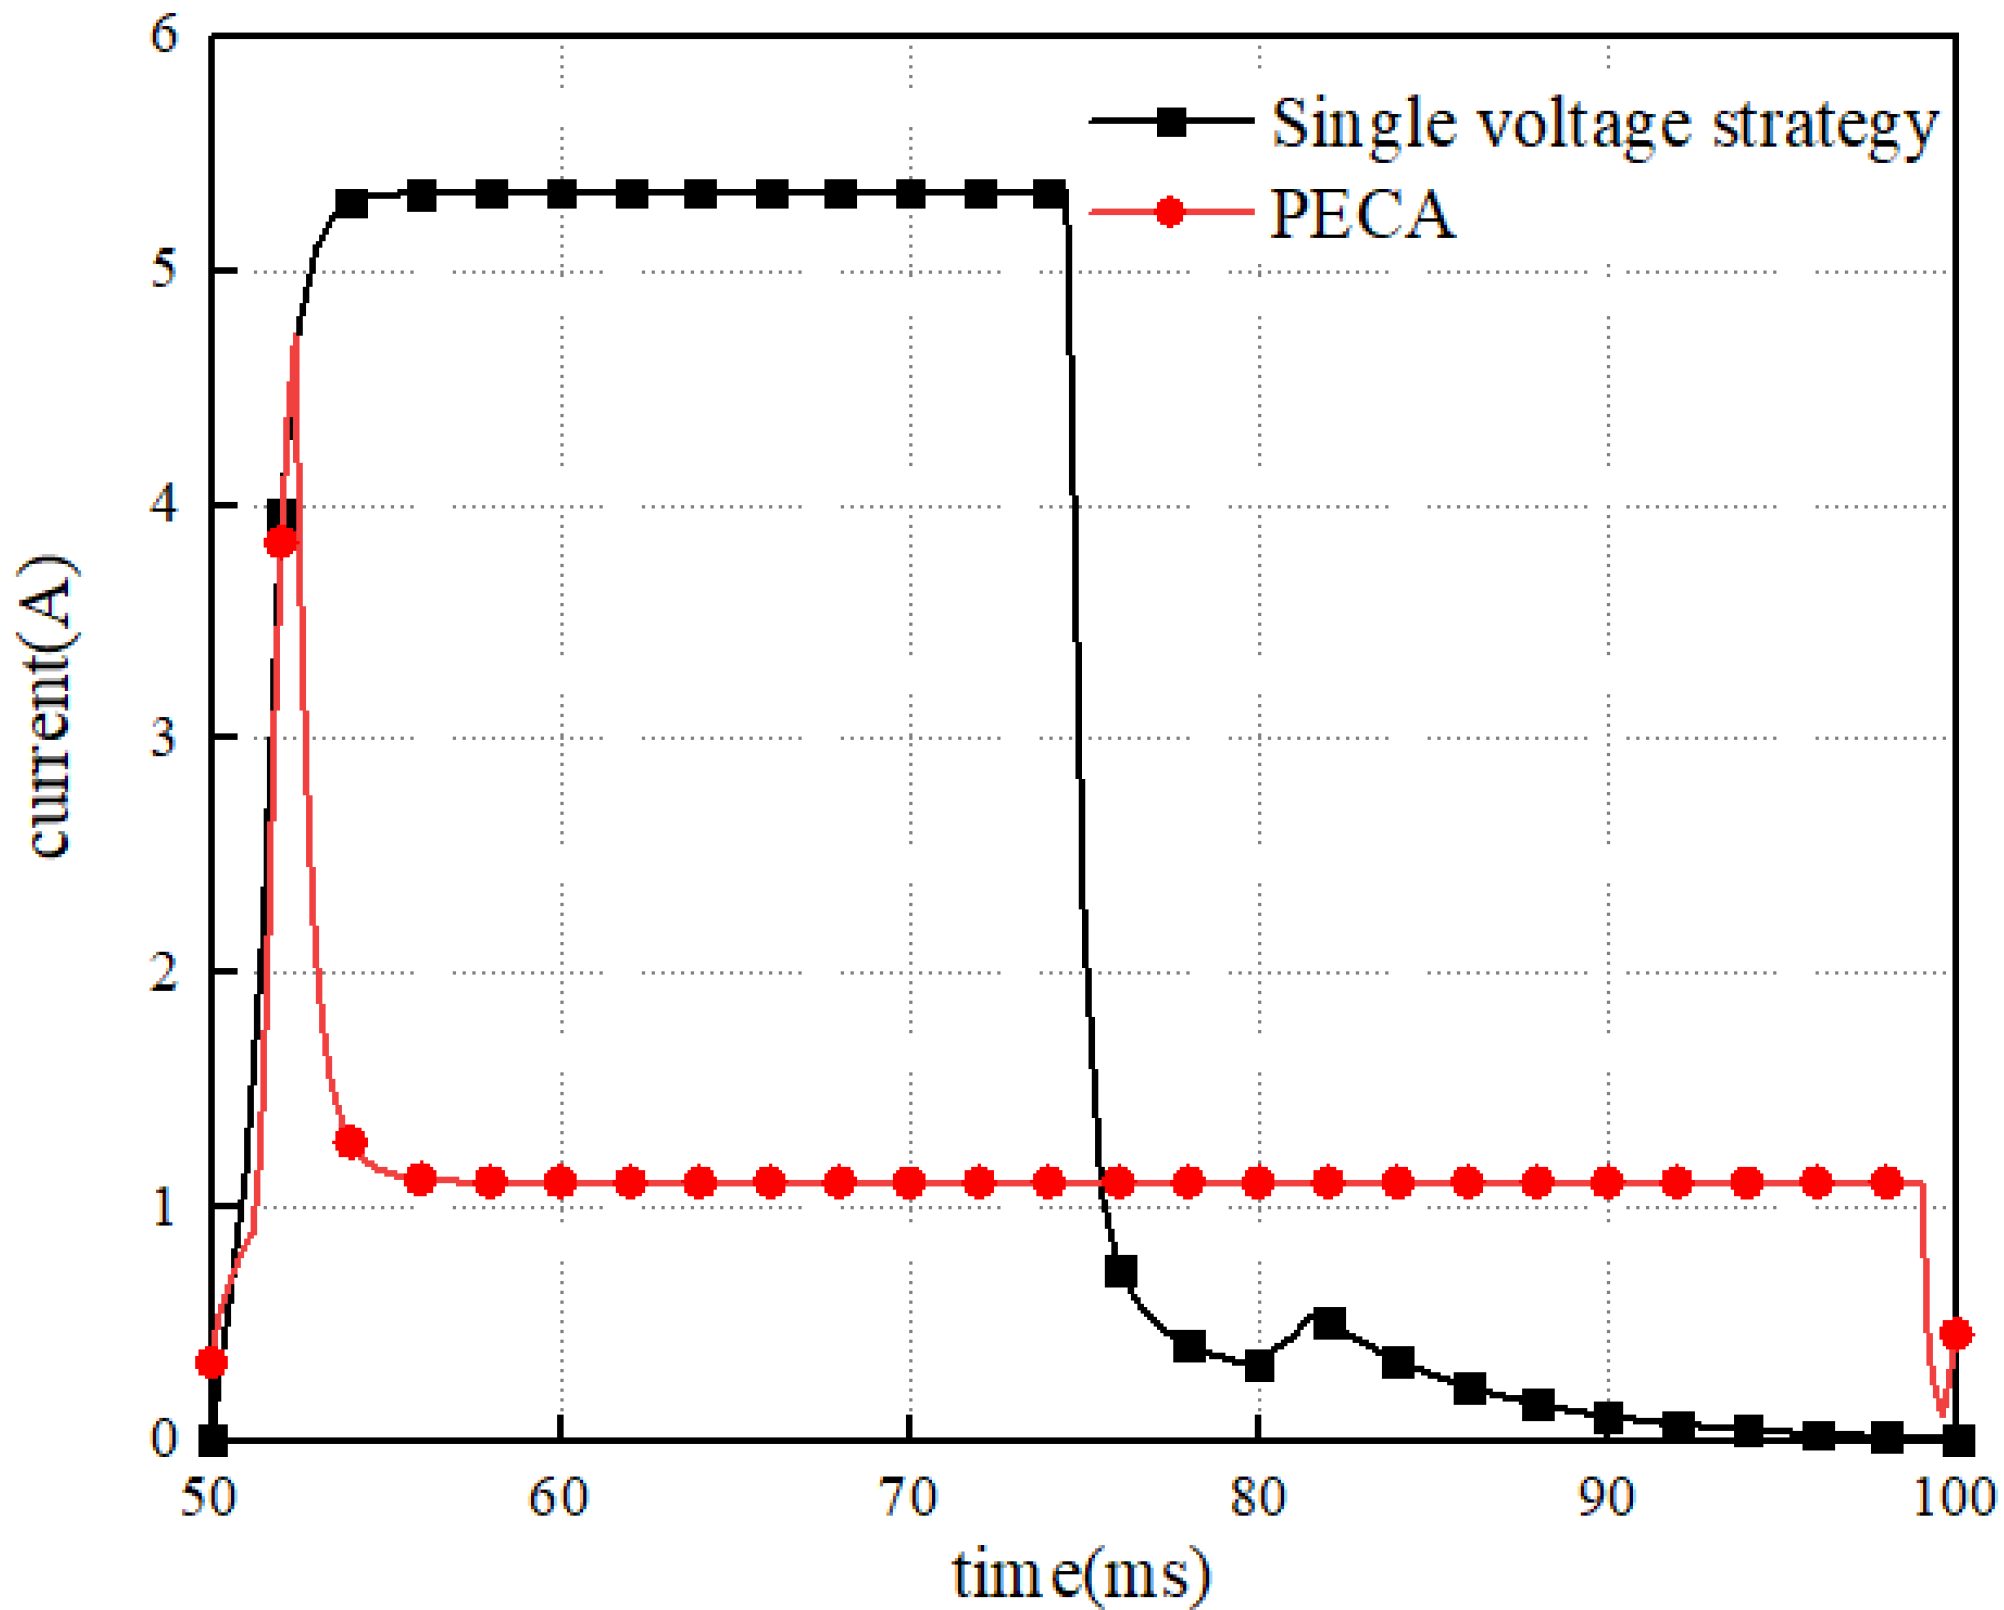
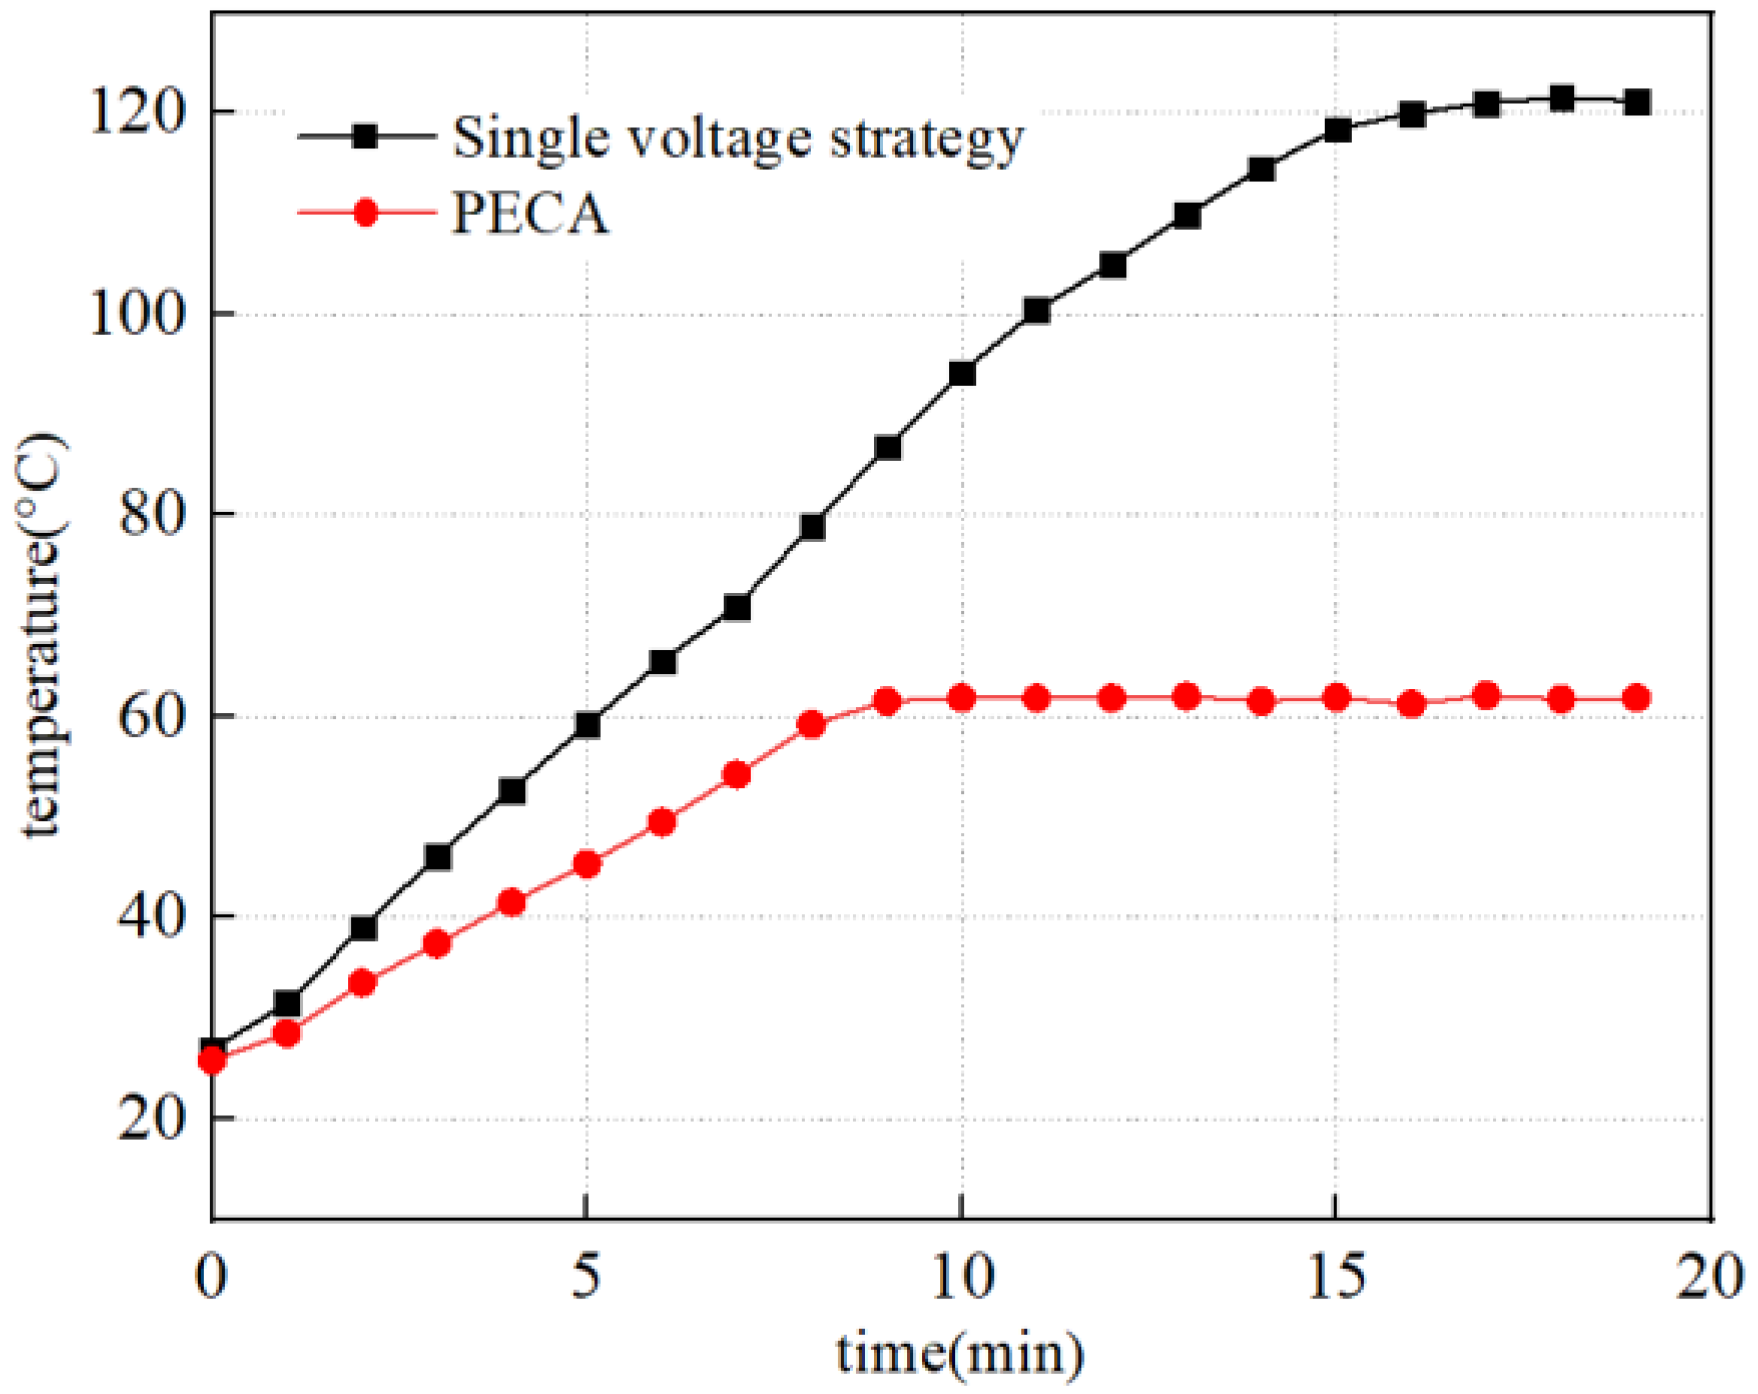
- The PECA proposed in this paper can effectively improve the dynamic characteristics of the HSV, reducing the opening time by 29.4% and closing time by 59.6%. In addition, the PECA extends the range of the controllable frequency of the HSV by 108%.
- (2)
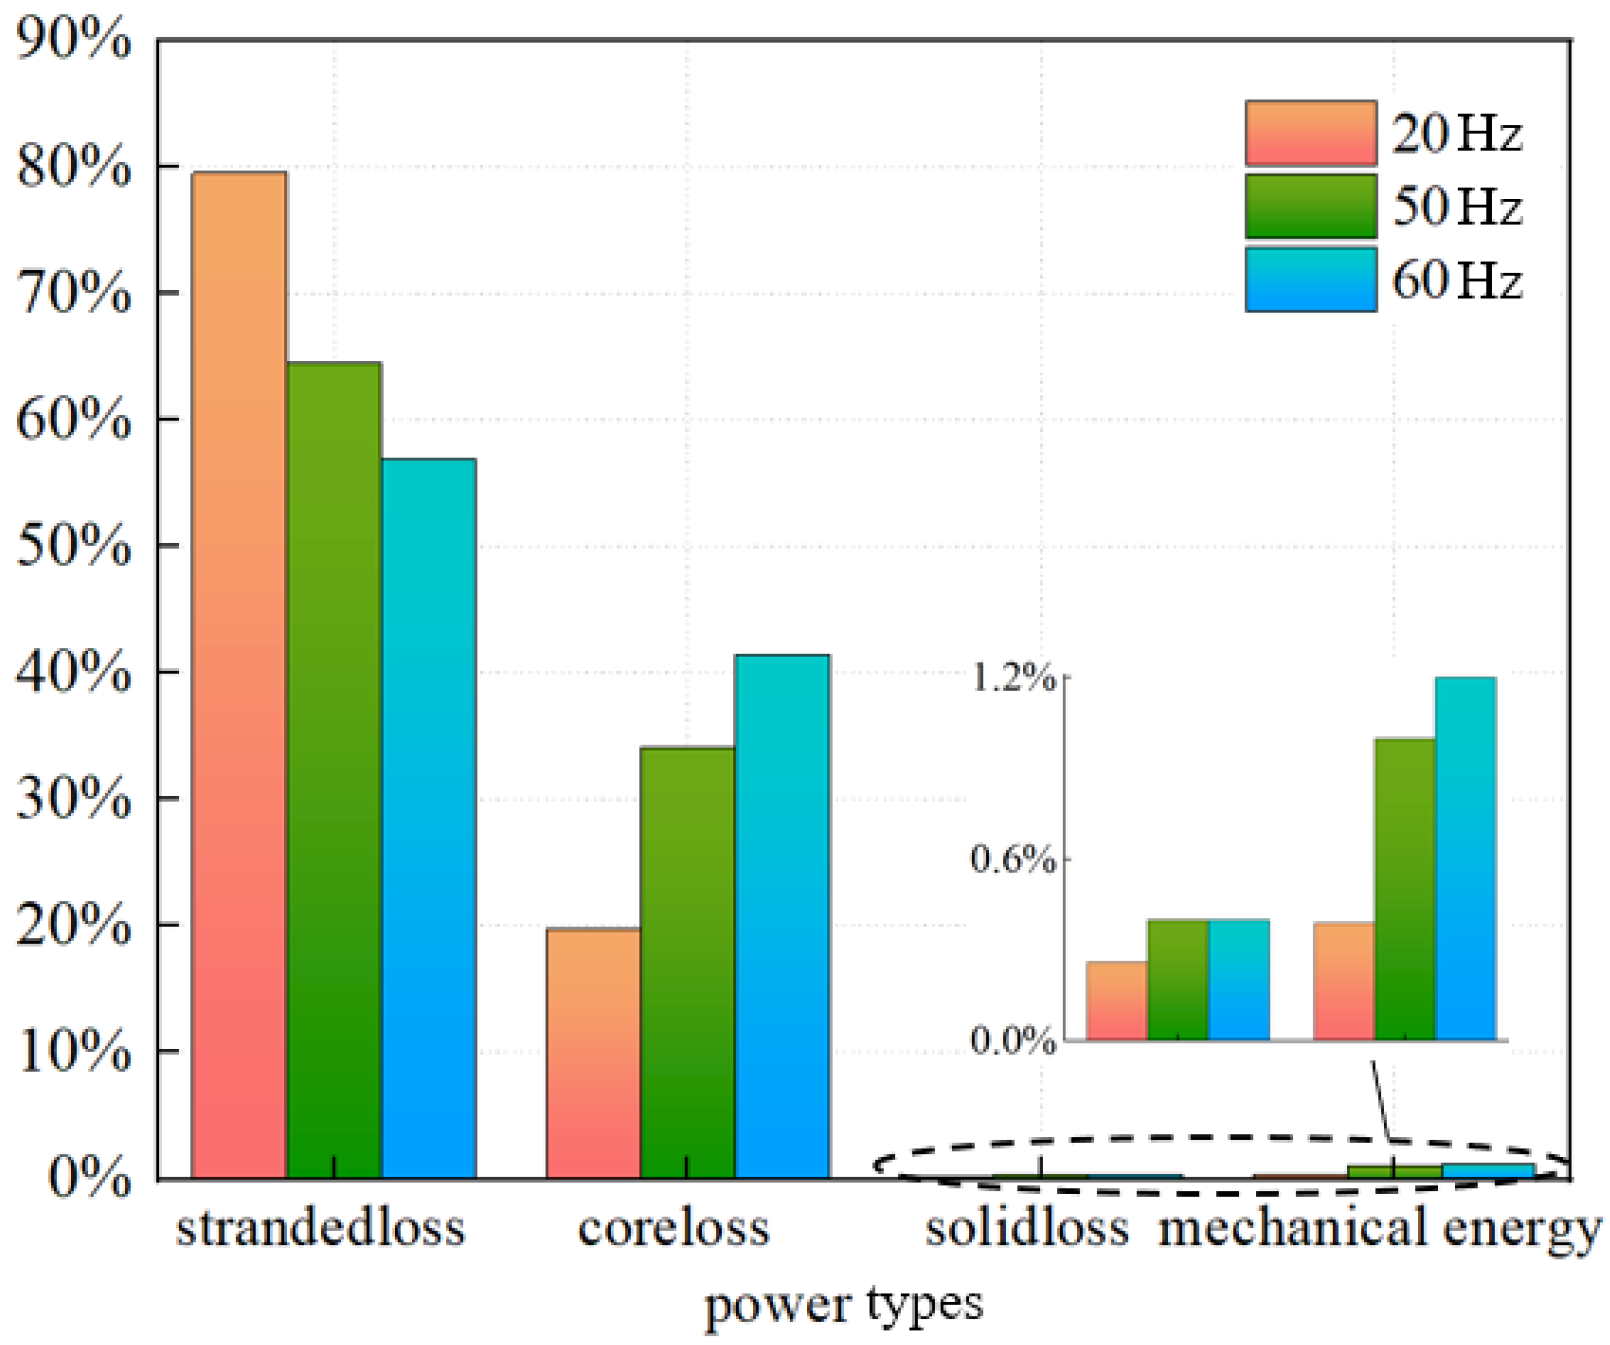
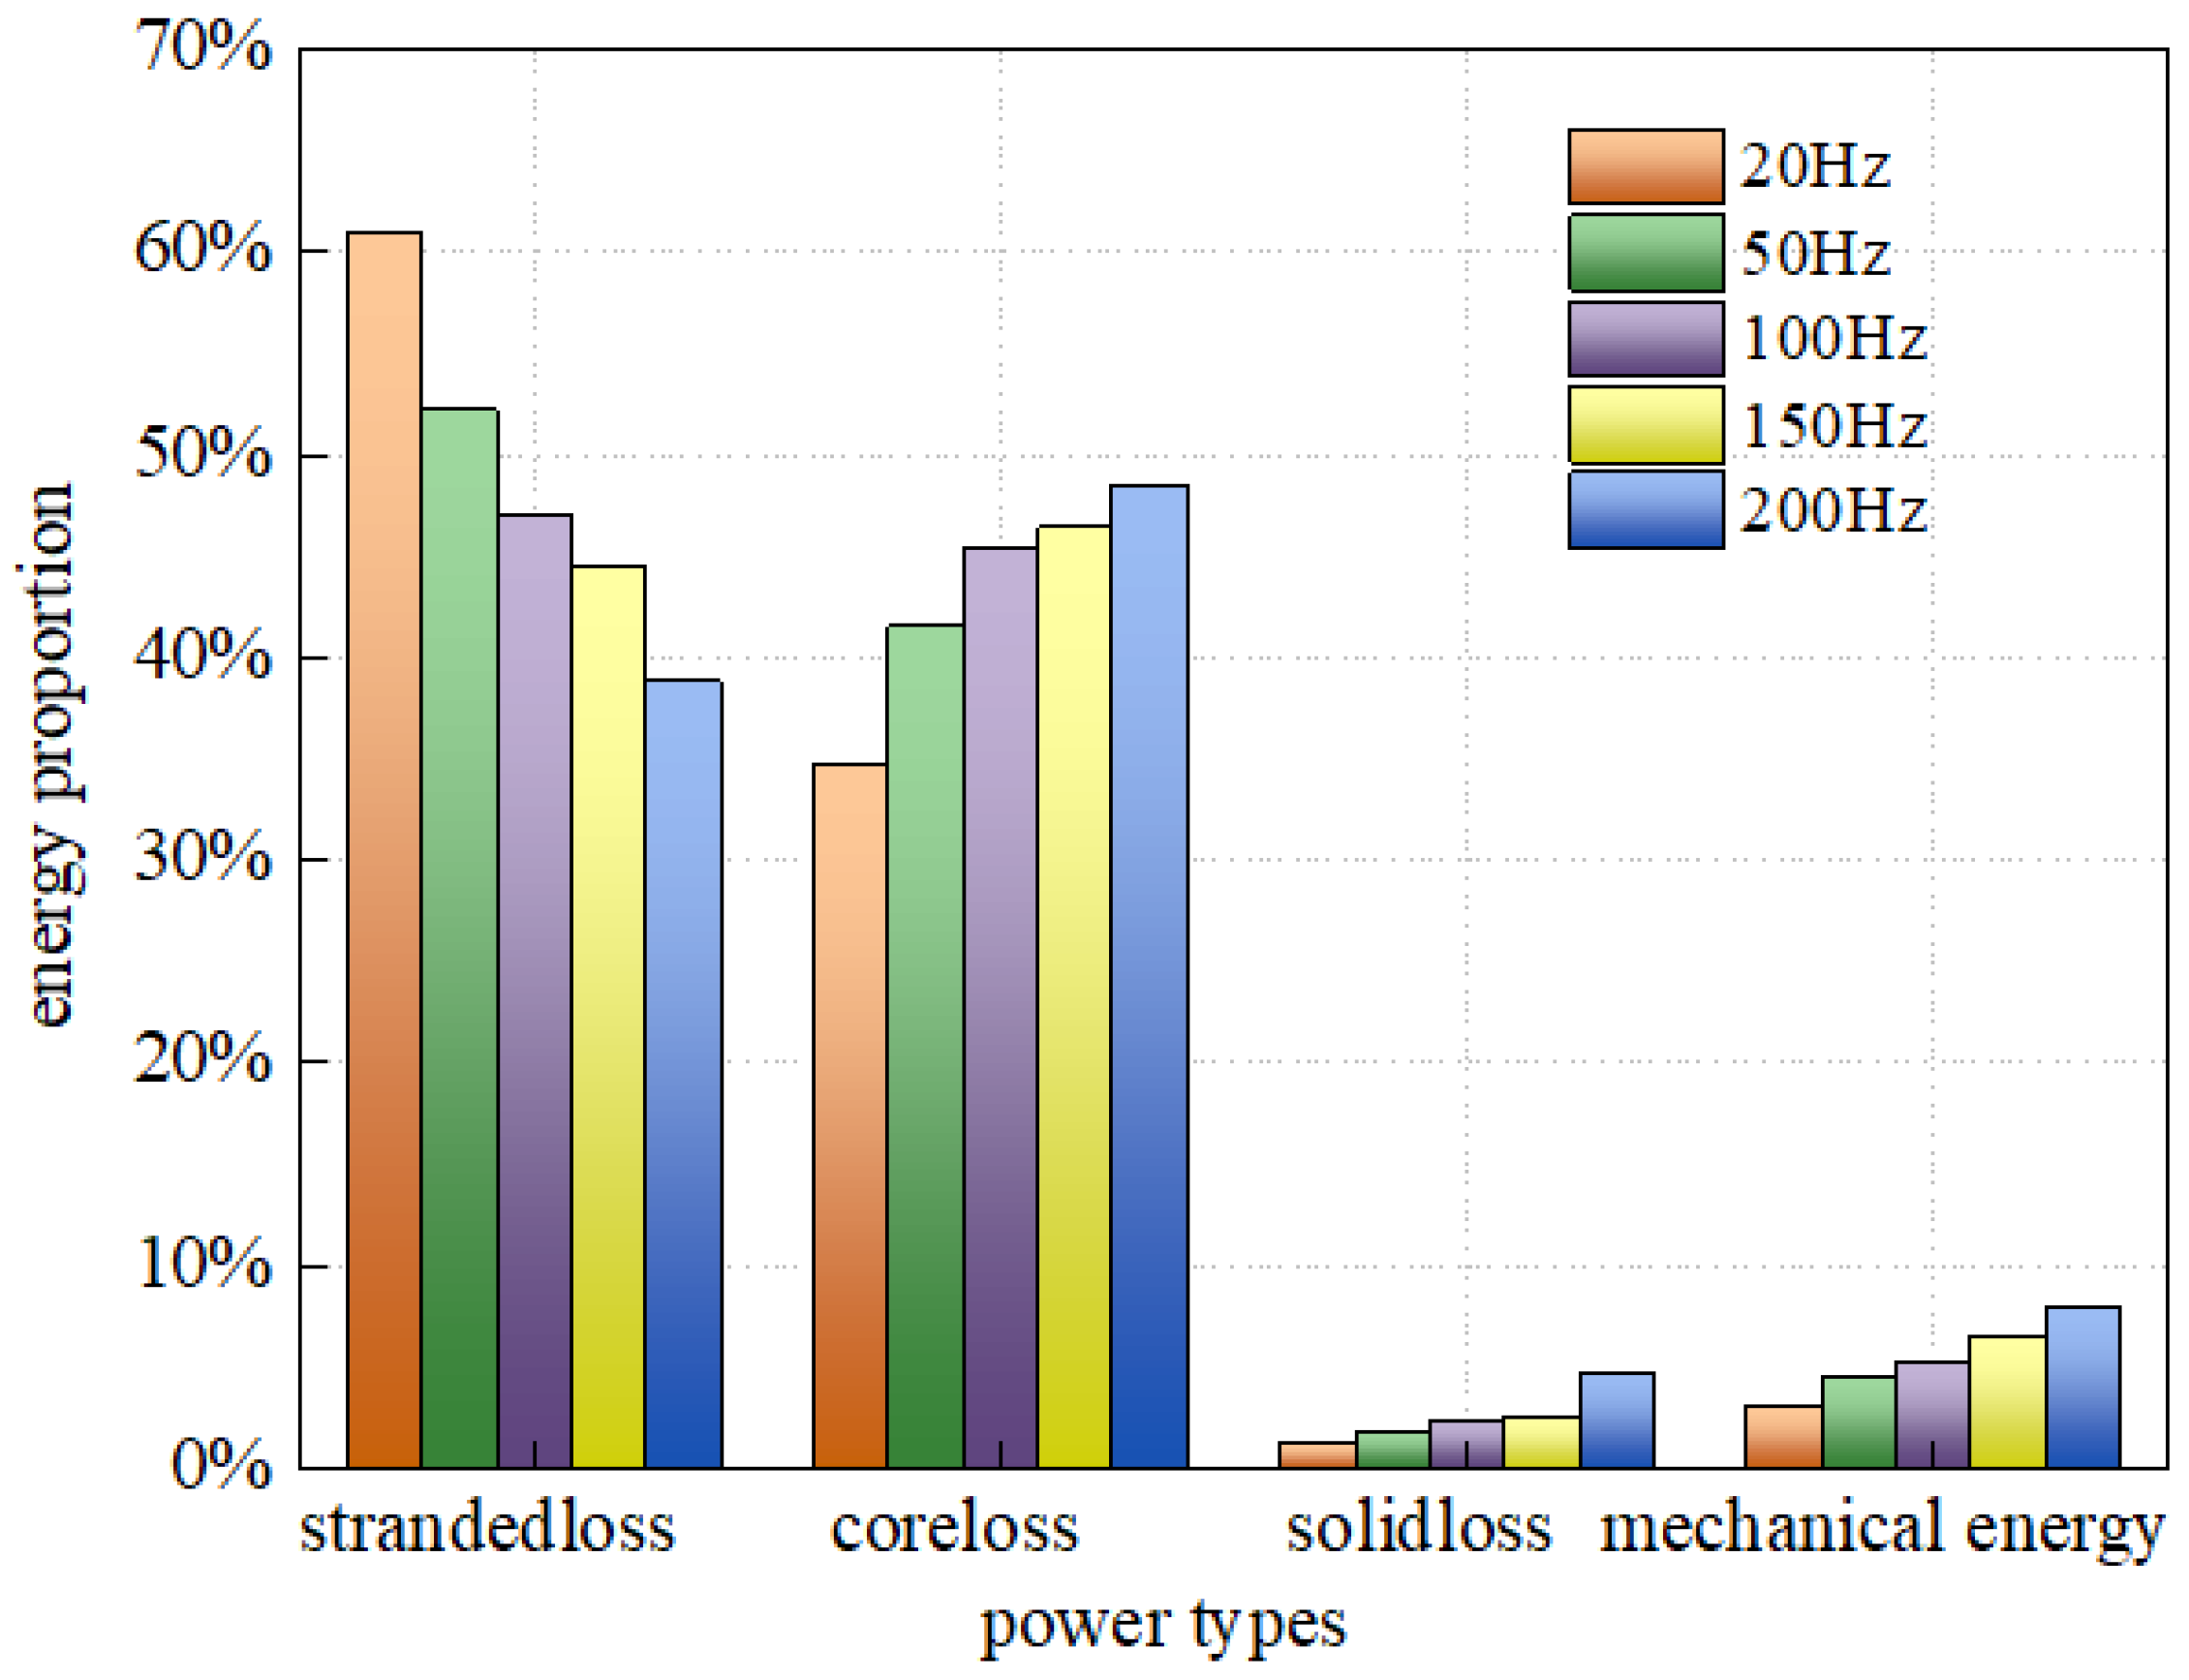
- The stranded loss ratio is the largest in the HSV. The stranded loss will decrease with the increase in the operating frequency, while the core loss, solid loss and mechanical energy will increase.
- (3)
- The PECA can significantly increase the energy conversion rate of the HSV from 1.2% to 7.9%.
Author Contributions
Funding
Institutional Review Board Statement
Informed Consent Statement
Data Availability Statement
Acknowledgments
Conflicts of Interest
References
- Cheong, K.H.; Doihara, R.; Shimada, T.; Terao, Y. Gravimetric system using high-speed double switching valves for low liquid flow rates. Meas. Sci. Technol. 2018, 29, 75304–75317. [Google Scholar] [CrossRef]
- Jinlong, D.; Jiashun, S.; Cong, L.; Tianbiao, Y. Research of Pneumatic Polishing Force Control System Based on High Speed On/off with PWM Controlling. Robot. Comput. Integr. Manuf. 2021, 70, 102133–102146. [Google Scholar]
- Jiao, Z.X.; Zhang, H.; Shang, Y.X.; Liu, X.C.; Wu, S. A power-by-wire aircraft brake system based on high-speed on-off valves. Aerosp. Sci. Technol. 2020, 106, 106177–106186. [Google Scholar] [CrossRef]
- Qiu, H.Y.; Su, Q. Simulation Research of Hydraulic Stepper Drive Technology Based on High Speed On/Off Valves and Miniature Plunger Cylinders. Micromachines 2021, 12, 438. [Google Scholar] [CrossRef]
- Shi, H.; Liu, Z.Y.; Wang, H.T. Design and performance analysis of hydraulic switching valve driven by magnetic shape memory alloy. Advances in Mechanical Engineering 2021, 13, 1–15. [Google Scholar] [CrossRef]
- Mahato, A.C.; Ghoshal, S.K. Energy-saving strategies on power hydraulic system: An overview. Proc. Inst. Mech. Eng. Part I J. Syst. Control Eng. 2021, 235, 147–169. [Google Scholar] [CrossRef]
- Yin, X.Q.; Feng, Z.J. Analysis and Research on Energy Saving of Hydraulic Power Unit. In Materials Science, Energy Technology and Power Engineering Iii; You, Z., Xiao, J., Tan, Z., Eds.; AIP Publishing LLC: Melville, NY, USA, 2019; Volume 2154. [Google Scholar]
- Cai, S.N.; Jiao, Y.; Xu, C.T.; Liang, Y.; Qin, R. Energy-saving Driver Circuit of High-speed Solenoid Valve Based on Soft-switch Technology. In Proceedings of the 2nd International Conference on Instrumentation and Measurement, Computer, Communication and Control (IMCCC), Harbin, China, 8–10 December 2012; pp. 598–601. [Google Scholar]
- Li, P.X.; Su, M.; Zhang, D.B. Iop. Response characteristic of high-speed on/off valve with double voltage driving circuit. In Proceedings of the 2nd International Conference on Design, Materials, and Manufacturing, Beijing, China, 23–25 June 2017; Volume 220, pp. 1757–8981. [Google Scholar]
- Lee, I.Y. Switching response improvement of a high speed On/Off solenoid valve by using a 3 power source type valve driving circuit. In Proceedings of the IEEE International Conference on Industrial Technology, Bombay, India, 15–17 December 2006; pp. 2179–2184. [Google Scholar]
- Zhong, Q.; Xie, G.; Wang, X.L.; Li, Y.; Yang, H.; Zhang, B.; Chen, B. Performance Analysis of High Speed on/off Valve by Multi-voltages Compound Excitation. J. Mech. Eng. 2021, 57, 191–201. [Google Scholar]
- Zhong, Q.; Zhang, B.; Yang, H.Y.; Ma, J.E.; Fung, R.F. Performance analysis of a high-speed on/off valve based on an intelligent pulse-width modulation control. Adv. Mech. Eng. 2017, 9, 1687814017733247. [Google Scholar] [CrossRef]
- Zhong, Q.; He, X.J.; Li, Y.B.; Zang, B.; Yang, H.; Chen, B. Research on Control Algorithm for High-speed on/off Valves that Adaptive to Supply Pressure Changes. J. Mech. Eng. 2021, 57, 224–235. [Google Scholar]
- Tan, C.; Li, B.; Ge, W.Q. Thermal Quantitative Analysis and Design Method of Bistable Permanent Magnet Actuators Based on Multiphysics Methodology. IEEE Trans. Ind. Electron. 2020, 67, 7727–7735. [Google Scholar] [CrossRef]
- Cheng, Q.; Zhang, Z.D.; Xie, N.L. Power losses and dynamic response analysis of ultra-high speed solenoid injector within different driven strategies. Appl. Therm. Eng. 2015, 91, 611–621. [Google Scholar] [CrossRef]
- Zhao, J.; Wang, M.; Wang, Z.; Grekhov, L.; Qiu, T.; Ma, X. Different boost voltage effects on the dynamic response and energy losses of high-speed solenoid valves. Appl. Therm. Eng. 2017, 123, 1494–1503. [Google Scholar] [CrossRef]
- Zhao, J.H.; Yue, P.F.; Grekhov, L.; Ma, X.Z. Hold current effects on the power losses of high-speed solenoid valve for com-mon-rail injector. Appl. Therm. Eng. 2018, 128, 1579–1587. [Google Scholar] [CrossRef]
- Pfister, P.D.; Perriard, Y. Very-high-speed slotless permanent-magnet motors: Analytical modeling, optimization, design, and torque measurement methods. IEEE Trans. Ind. Electron. 2010, 57, 296–303. [Google Scholar] [CrossRef]
- Bracikowski, N.; Hecquet, M.; Brochet, P.; Shirinskii, S.V. Multiphysics modeling of a permanent magnet synchro-nous machine by using lumped models. IEEE Trans. Ind. Electron. 2012, 59, 2426–2437. [Google Scholar] [CrossRef]
- Yi, W.; Dan, M.I.; Staton, D. Ultrafast steady-state multiphysics model for PM and synchronous reluctance ma-chines. IEEE Trans. Ind. Appl. 2015, 51, 3639–3646. [Google Scholar]
- Grobler, A.J.; Holm, S.R.; Schoor, G.V. Empirical parameter identification for a hybrid thermal model of a high speed permanent magnet synchronous machin. IEEE Trans. Ind. Electron. 2018, 65, 1616–1625. [Google Scholar] [CrossRef]
- Shi, H.; Gong, G.F.; Yang, H.Y.; Mei, X.S. Energy Saving Analysis of Segment Positioning in Shield Tunneling Machine. J. Cent. South Univ. 2014, 21, 4526–4536. [Google Scholar] [CrossRef]
- Sun, X.; Cheng, M. Thermal analysis and cooling system design of dual mechanical port machine for wind power application. IEEE Trans. Ind. Electron. 2013, 60, 1724–1733. [Google Scholar] [CrossRef]
- Liu, Y.F.; Mao, M.C.; Xu, X.Y.; Shi, G. Multi-physics coupled thermo-mechanics analysis of a hydraulic solenoid valve. In Proceedings of the International Conference on Mechatronics and Industrial Informatics (ICMII 2013), Guangtzhou, China, 23–24 March 2013; Volume 321–324, pp. 102–107. [Google Scholar]
- Fang, W.M.; Cheng, L.L.; Fu, X.; Zhou, H.; Yang, H.Y. Investigation on steady-state flow force of spool valve with U-grooves. J Zhejiang Univ. (China) 2010, 44, 574–580. [Google Scholar]
- Ansoft Maxwell 2019 User’s Manual, Ver.19.0 Design Reference; ANSYS, Inc. ANSYS Europe: Canonsburg, PA, USA, 2017; Available online: https://ansyshelp.ansys.com (accessed on 10 June 2021).
- Bertotti, G. General properties of power losses in soft ferromagnetic materials. IEEE Trans. Magn. 1988, 24, 621–630. [Google Scholar] [CrossRef]
- Lombardi, L.; Raimondo, R.; Antonini, G. Electrothermal formulation of the partial element equivalent circuit method. Int. J. Numer. Model. Electron. Netw. Devices Fields 2018, 31, e2253. [Google Scholar] [CrossRef]


| Single Voltage | PECA | |
|---|---|---|
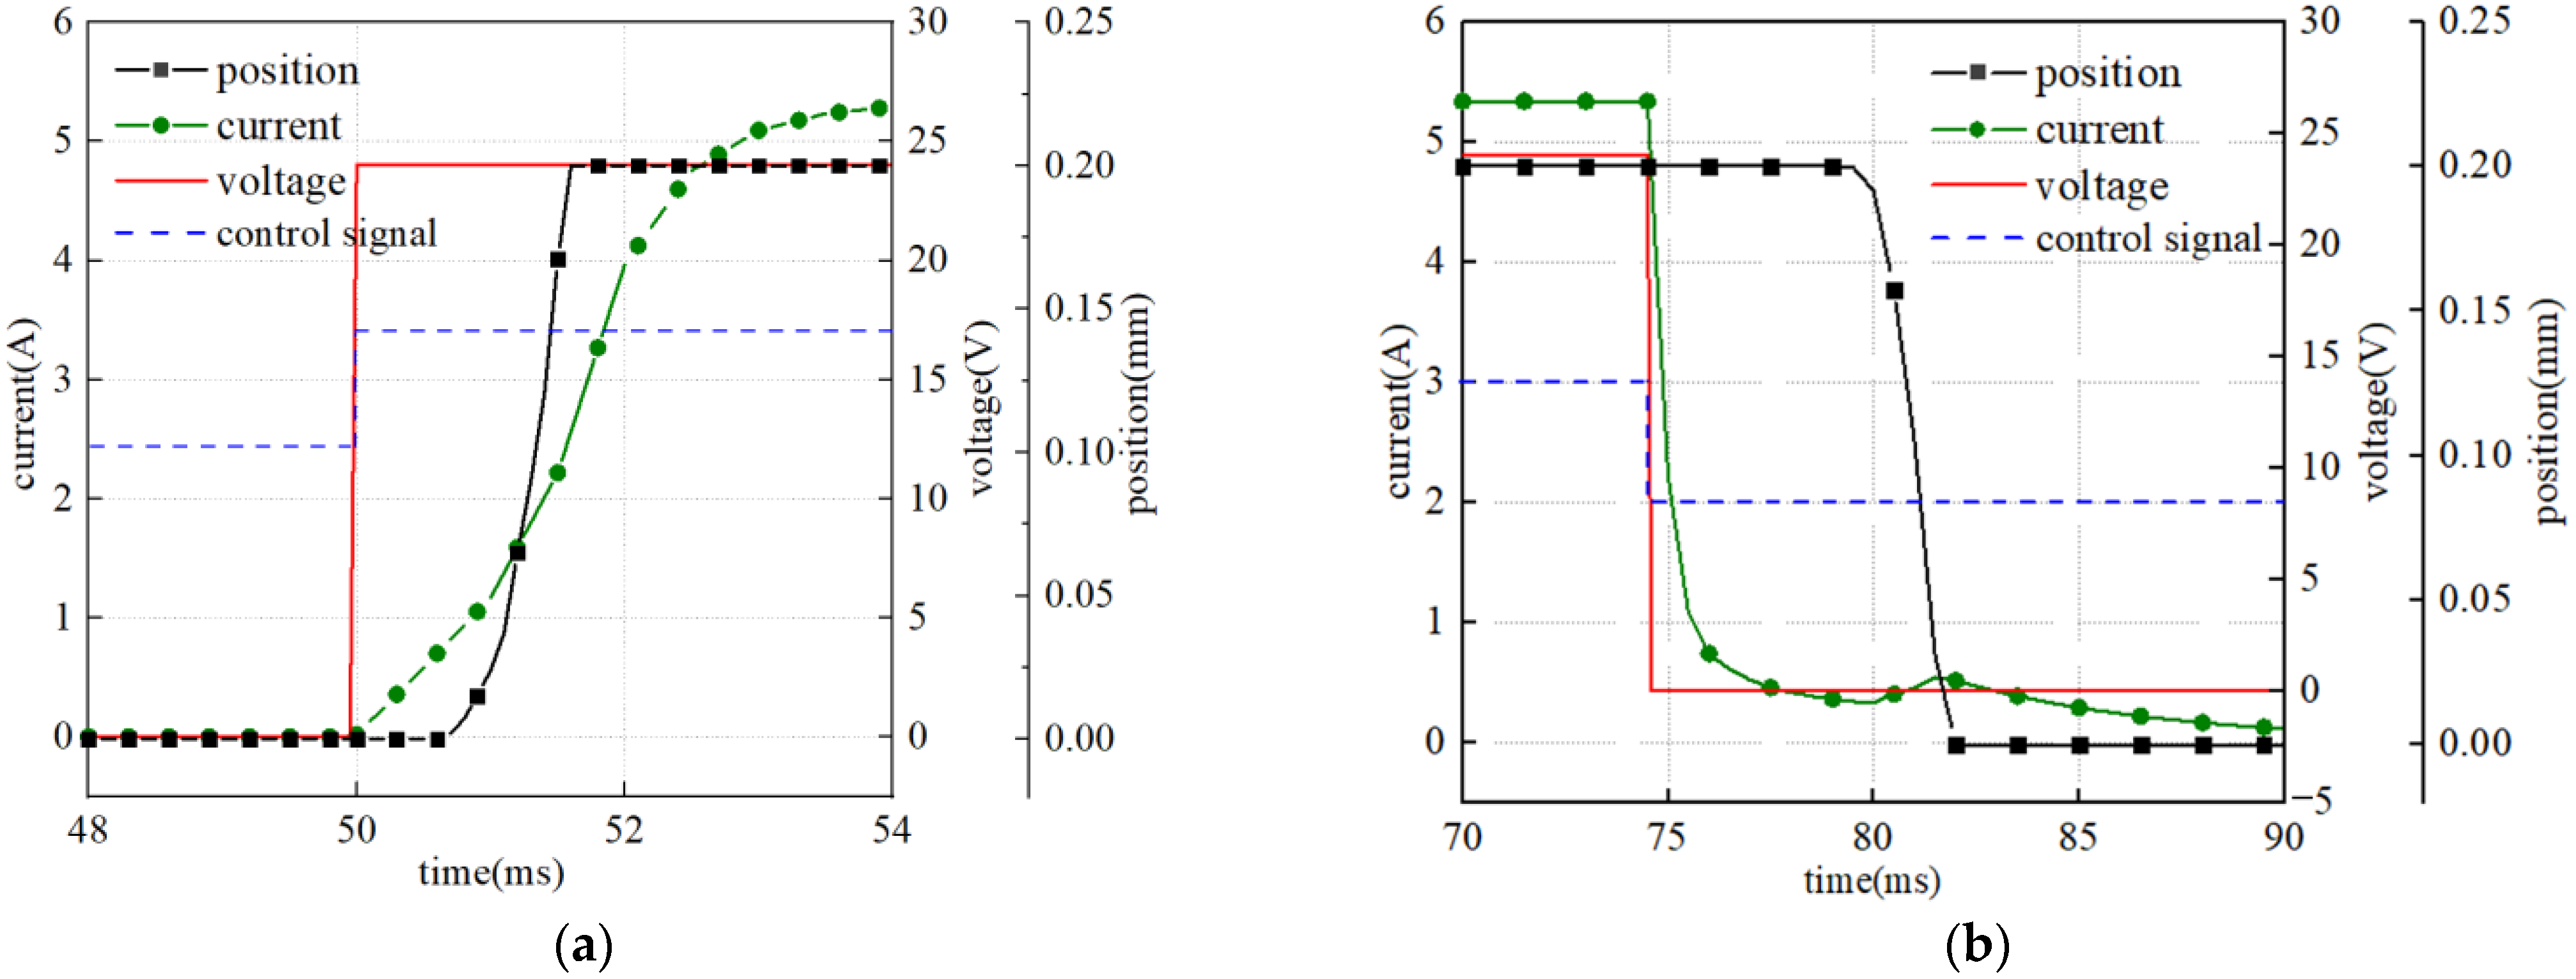
| ODT (ms) | 0.6 | 0.1 |
| OMT (ms) | 1.1 | 1.1 |
| CDT (ms) | 4.6 | 0.5 |
| CMT (ms) | 2.4 | 1.4 |
Publisher’s Note: MDPI stays neutral with regard to jurisdictional claims in published maps and institutional affiliations. |
© 2021 by the authors. Licensee MDPI, Basel, Switzerland. This article is an open access article distributed under the terms and conditions of the Creative Commons Attribution (CC BY) license (https://creativecommons.org/licenses/by/4.0/).
Share and Cite
Zhong, Q.; Wang, X.; Xie, G.; Yang, H.; Yu, C.; Xu, E.; Li, Y. Analysis of Dynamic Characteristics and Power Losses of High Speed on/off Valve with Pre-Existing Control Algorithm. Energies 2021, 14, 4901. https://doi.org/10.3390/en14164901
Zhong Q, Wang X, Xie G, Yang H, Yu C, Xu E, Li Y. Analysis of Dynamic Characteristics and Power Losses of High Speed on/off Valve with Pre-Existing Control Algorithm. Energies. 2021; 14(16):4901. https://doi.org/10.3390/en14164901
Chicago/Turabian StyleZhong, Qi, Xiele Wang, Geng Xie, Huayong Yang, Cheng Yu, Enguang Xu, and Yanbiao Li. 2021. "Analysis of Dynamic Characteristics and Power Losses of High Speed on/off Valve with Pre-Existing Control Algorithm" Energies 14, no. 16: 4901. https://doi.org/10.3390/en14164901
APA StyleZhong, Q., Wang, X., Xie, G., Yang, H., Yu, C., Xu, E., & Li, Y. (2021). Analysis of Dynamic Characteristics and Power Losses of High Speed on/off Valve with Pre-Existing Control Algorithm. Energies, 14(16), 4901. https://doi.org/10.3390/en14164901