Article

The Effectiveness of Energy Cooperatives Operating on the Capacity Market

by
Jakub Jasiński
1,*,
Mariusz Kozakiewicz
2 and
Maciej Sołtysik
3
1
Institute of Rural and Agricultural Development, Polish Academy of Sciences, 72 Nowy Świat St., 00-330 Warsaw, Poland
2
Collegium of Economic Analysis, Warsaw School of Economics, Madalińskiego 6/8 St., 02-513 Warsaw, Poland
3
Faculty of Electrical Engineering, Częstochowa University of Technology, Armii Krajowej St. 17, 42-200 Częstochowa, Poland
*
Author to whom correspondence should be addressed.
Energies 2021, 14(11), 3226; https://doi.org/10.3390/en14113226
Submission received: 26 April 2021 / Revised: 22 May 2021 / Accepted: 27 May 2021 / Published: 31 May 2021
(This article belongs to the Special Issue Energy Sources from Agriculture and Rural Areas)

Abstract

:
The European Green Deal aims to make Europe the world’s first climate-neutral continent by 2050 by shifting to a clean circular economy, combating biodiversity loss and reducing pollution levels. In Poland, whose economy invariably remains one of the most dependent on coal consumption in Europe, institutional responses to the above EU objectives have taken the shape of energy cooperatives aimed at filling the gaps in the development of the civic dimension of energy on a local scale and the use of potential renewable energy sources in rural areas, including in relation to the agricultural sector. This article is a continuation of the authors’ previous research work, which has so far focused on the analysis of the development of profitability of Polish institutions that fit into the European idea of a “local energy community”, which includes energy cooperatives. In this research paper, they present the results of subsequent research work and analyses performed on the basis of it which, on the one hand, complement the previously developed optimization model with variables concerning actual energy storage and, on the other hand, analyze the profitability of the operation of energy cooperatives in the conditions of the “capacity market”. The latter was actually introduced in Poland at the beginning of 2021. The research took account of the characteristics of energy producers and consumers in rural areas of Poland, the legally defined rules for the operation of the capacity market and the institutional conditions for the operation of energy cooperatives that can use the potential of energy storage. A dedicated mathematical model in mixed integer programming technology was used, enriched with respect to previous research, making it possible to optimize the operation of energy cooperative with the use of actual energy storage (batteries). Conclusions from the research and simulation show that the installation of energy storage only partially minimizes the volume of energy drawn from the grid in periods when fees related to the capacity market are in force (which should be avoided due to higher costs for consumers). The analysis also indicates that a key challenge is the proper parameterization of energy storage.

1. Introduction

Decreasing amounts of raw material and constantly increasing pro-environmental pressure make it necessary to look for solutions to increase the efficiency of the use of resources and the optimization of their use [1]. Based on social relationships, the global sharing economy trend is changing fundamental organizational and distribution models and is built on a network of integrated individuals and communities [2]. This phenomenon, which is based on the human tendency to cooperate [3], to share and exchange resources, is beginning to encompass more and more spheres of social life, including the electricity market sector [4,5]. The EU policy imposes a direction for the reorganization of the generating sector by supporting the creation of self-balancing energy areas (regions and communities) [6,7], where energy generation is based on renewable sources (Clean Energy Package (CEP)) [8].
Building local energy independence manifests itself in the creation of cooperatives, enabling benefits to be drawn by cooperating demand and supply side entities. In the EU, creating energy self-sufficiency at the local level is possible on the basis of institutions called energy communities (EC) [9,10]. Their structure and operating model correspond with the guidelines set out in (i) the REDII directive [11], where the focus has been on the Renewable Energy Community [12], and it is also a result of (ii) the “electricity market directive” [13], where the Citizens Energy Community (CEC) is promoted. Creating opportunities for building local energy communities [14] can be of great importance, especially in rural areas. This is where the greatest potential exists in terms of the use of renewable energy sources (including biomass and biogas), as well as potential waste.
The Polish responses [15] to the development of local energy communities promoted in the EU are characterized by energy clusters [16] and the energy cooperatives analyzed in this article, which the creators of this form of energy cooperation intend to be established in rural areas. The object and the scope of activity of energy cooperatives, as well as the conditions affecting their creation and operating profitability, have already been assessed and described by the authors of this research paper [17]. The considerations and analyses carried out earlier focused on illustrating the benefits seen from the perspective of integrating the supply side (producers) and the demand side (consumers) into the structure of a cooperative. However, they did not correspond with the change in energy market activity in Poland from an energy-only market to a capacity market [18]. In Poland, capacity-market mechanisms have been implemented since January 2021, which significantly affect the operating models and market strategies of both power suppliers and consumers, who are the payers of capacity fees [19]. From this perspective, it is reasonable to extend the analyses carried out so far to energy cooperatives, with elements related to their operation in the energy market and the capacity market [20].
The creation of the capacity market in 2018 was one of the largest changes in the Polish power sector in recent years [21]. From 2021 onwards, those in Poland will pay not only for the electricity generated but also for the available capacity of the power system [22]. This means that power plants will be paid both for electricity production and standby capacity, i.e., full availability [23]. On 30 November 2020, Poland’s Energy Regulatory Office (URE) announced the electricity rates for consumers [24] that Poles would have seen on their bills from January 2021 [25]. A new item on the bill for electricity supplies is the capacity fee which, for recipients other than households, will be PLN 76.20/MWh (EUR 1 is around PLN 4.5) [26]. The capacity fee provides financing for the capacity market, i.e., mainly for maintaining capacity in readiness and for modernization and construction of new conventional power plants. This fee will depend on energy consumption between 7 am and 10 pm on weekdays but, given that these are standard working hours, the vast majority of energy consumption will be covered by it [27].
The aim of this paper is to present the results of the research concerning the assessment of the actual impact of energy storage (not only based on the virtual network deposit) on the operating efficiency of energy cooperatives, the increase in the degree of energy independence in the conditions of the capacity market and the minimization of energy consumption during the capacity-fee hours. Thus, an attempt will be made to answer the question: with what production, storage and consumer structure and with what number and configuration of cooperative members does a form of self-organization such as an energy cooperative have a chance to develop and improve its operating efficiency? The models developed by the authors so far [17] will be supplemented by the key element for these considerations—batteries (energy stores) [28]—which may determine not only the character and structure of emerging cooperatives but also, in some cases, become a factor determining their profitability [29,30]. The research objectives set by the authors are the analysis and assessment of: (i) whether, through an appropriate choice of generation sources and an energy storage facility, it is possible to avoid consuming energy from the grid (outside the virtual network deposit) [17,31], which makes it possible to avoid capacity fees; (ii) whether it is worth installing high-capacity energy storage, or whether a measurable effect of improving the optimization target can already be achieved by storage with a lower capacity and power; (iii) to what extent it is possible to estimate the volumetric savings in consuming energy from the virtual network deposit through the use of an actual energy store; and (iv) whether it is reasonable to build an actual store for each cooperative and, if not, which cooperatives it would be reasonable for.
All models of cooperative proposed and studied in this paper, as well as the data on production and energy consumption on farms that are potential members of a cooperative, are anonymized real data obtained from rural areas of Poland. In addition, real data and parameters of energy stores were used in the analyses, so that the conclusions and recommendations from the analyses take on a real and practical dimension.
The paper is structured as follows. The second section provides the main characteristics of the capacity-market model in Poland. The institutional description and legally defined rules for the operation of energy cooperatives can be found in the research team’s previous paper [17]; they have therefore not been reproduced in detail in this article. The next section describes the assumptions for the selection of the research sample, taking into account the formal conditions for the establishment of energy cooperatives and the specific character of farms in rural areas in Poland, the input data and their selection, as well as the optimization method, developed in relation to previous analyses, which was used in the research process. The results of the research are then presented and discussed in the subsequent section of the article. In conclusion, it was possible to summarize all the completed work and research, and potential areas of further research interest to the authors have been indicated.

2. Background—The Capacity Market in Poland

The diagnosis of a permanent and continuously growing power shortage, seen both in the short- and long-term scenario [32], was clearly stated by the Polish Transmission System Operator (TSO) in 2014–2015 [33]. In the context of the problems identified at that time, it became a strategic objective to plan changes in the functional model of the energy market in Poland in such a way as to prioritize the security of electricity supply in the Polish Power System (PPS) [34]. The need for changes was an effect of the situation in the regulatory and market environment, which resulted in the permanent exclusion of some centrally dispatched generating units that are critical from a PPS point of view [35]. Maintaining the energy market as an energy-only market would clearly lead to energy supply disruptions and, consequently, to high costs for the economy for not supplying energy [36]. Two main phenomena that influenced the implementation of capacity mechanisms were diagnosed:
  • Missing money;
  • Missing capacity.
The problem of missing money was due to the fact that the revenues from the units critical to the safety of system operations did not cover their operating and capital costs. An analysis of the short-run marginal cost (SRMC) amounting to about PLN 155–160/MWh (for 2015) for a typical generation system in Poland, i.e., a 200 MW coal-fired power unit, and the average level of wholesale prices on the energy exchange (TGE S.A.) [37], showed that these values were at similar levels. This resulted in the inability to cover the fixed operating costs of the generating unit and a lack of investment impulses for modernization of the existing energy sources and construction of new ones. In 2015, the average operating time of a 200 MW coal-fired power unit was only 3817 h/year (43%).
The phenomena of the low wholesale price and lower volume of energy sold resulted from the conditions of the energy-only market. This model means that the operators of generating units are remunerated based on the production of electricity, which is evaluated on the wholesale market. The valuation of energy is not affected by the type of technology by which it was produced. Low wholesale prices were a consequence of:
  • Supporting renewable energy sources (RES) outside the wholesale market area;
  • RES operating on low variable costs;
  • RES performance characteristics not always ensuring energy security.
The above factors caused the displacement of coal-fired units, the limitation of their operating duration and, consequently, the inability to fully cover the costs of operation and energy production. The forecast of a long-term money-shortage problem clearly indicated a lack of investment incentives over the long term, resulting in a shortfall in capacity.
With the introduction of the capacity market, the “capacity obligation” service was implemented [38]. The generating units covered by this are required to be ready to supply power and to deliver it to the system during a period of threatened shortage, with adequate remuneration. The capacity market is closely related to the development of demand-side response (DSR) services, which consist in the temporary reduction in electricity consumption by consumers or the postponement of its consumption (demand-side management) at the request of the TSO in exchange for remuneration [39].
The need to generate units to remain on standby and supply power to the system during an emergency is related to a cost allocated to all electricity consumers. For households, the cost is of a lump-sum nature and is dependent on the average annual level of energy demand. The rates for this group of consumers range from PLN 1.87/month for consumers with a consumption up to 0.5 MWh/year to PLN 10.46/month for consumers with a consumption above 2.8 MWh/year. Other types of consumers are charged a single rate of PLN 76.20/MWh, calculated for energy consumed on working days between 7 am. and 10 pm. It is worth noting that the capacity fee accounts for approximately 10–15% of the total cost of energy, calculated together with the distribution service [24].
The capacity fee is a component of the distribution fee, and it is therefore related to the energy consumed directly from the grid. In order to reduce the capacity fee, energy consumption from the grid should therefore be reduced. The answer is to find ways to reduce energy consumption or to generate, self-consume and store energy from renewable sources.

3. Materials and Methods (Optimization Model)

3.1. Assumptions for the Creation of a Sample of Energy Cooperatives for Simulation Purposes

An assessment of the impact of capacity-market implementation on the level of consumers’ costs, on consumers’ behavior and on the rationality of building local energy communities required simulations and hypothesis-testing related to simulation scenarios by mapping actual energy cooperatives. For this purpose, real data on electricity production and energy demand in rural areas in Poland was used and five types of energy cooperative were created for simulation purposes. An additional requirement was to represent the diversity of: (i) the locational nature, (ii) the level (scale) of electricity demand, (iii) the nature of economic activity of the cooperative participants, (iv) the electricity consumption profile of each member of the cooperative, (v) the generation potential among the members of the cooperative, (vi) the level of voltage supply from the members of the cooperative, (vii) population size, and (viii) the energy storage capacity.
The selection of members of energy cooperatives took account of locational constraints, i.e., the allocation of members in up to three neighboring rural or rural–urban municipalities. The criteria for the selection of the generation structure by the optimizer took account of at least 70% of the energy demand within the annual billing period, which depended on different types of generation sources and different storage capacities.
The unfavorable hydrological conditions in Poland significantly affect the possibility of using hydro-power for electricity production. For the analyses, it was assumed that a maximum of one hydro-power plant may operate within an energy cooperative, and that there is at least one watercourse that could be adapted for energy generation purposes in the areas of the municipalities where the energy cooperatives were simulated. A practical assumption was adopted, stating that a small hydro-power plant is characterized by low capacity at the level of between several dozen and several hundred kW. The simulation therefore took account of the capacity limits of a single source from 0 to 500 kW, with increments of 50 kW. Discreet increments make the simulation realistic because a source with any continuous capacity cannot be installed.
In Poland, the development of prosumer sources based practically 100% on photovoltaic sources is ongoing and still accelerating. The construction of PV sources is currently the most popular and fastest growing method to achieve energy self-sufficiency in Poland [40]. According to the data from the Ministry of Development, Labor and Technology, at the end of December 2020 [41], there were more than 457,000 micro-systems in Poland (an increase of 28.1% compared to the end of Q3 2020, and as much as 196% more compared to the end of 2019) [42] with a total capacity of about 3006 MW [43]. The dynamics and trends of micro-system growth are influenced by numerous aid programs [44]. In view of the above, for the simulations, it was assumed that at least 25% of energy production of the members of the cooperatives is from solar energy. In addition, capacity limits for an individual PVPP farm from 0 to 1000 kW with increments of 50 kW were adopted, which has a practical justification, since the capacity limit for a micro-system according to the Polish law is 50 kW.
Energy cooperatives can be established in rural and rural–urban areas, i.e., in sparsely urbanized areas [45]. These factors support the construction of low-mast wind sources with low and medium capacity. The efficiency of wind generation is about twice as high for Polish wind conditions as for photovoltaic sources, which makes this type of generation attractive in terms of efficiency and cost [46]. For the analysis and simulation, the ability of cooperative participants to establish sources with a capacity from 0 to 1000 kW with increments of 250 kW was assumed.
Taking account of the location criterion when establishing the cooperative was also intended to take advantage of the agricultural character and potential of the regions, particularly in the context of the stability of the generation profile based on biomass and biogas sources. For the simulation, the capacity limitations of these sources were assumed to be from 0 to 600 kW, with increments of 200 kW. The presence of generation sources of both stochastic (PVPP, wind) and stable (biomass, biogas) generation in energy cooperatives will result in a flattening of the profile and a reduction in generation differences between seasons of the year or times of day.
Additionally, an assumption was adopted indicating that, in the selection of generation sources for the optimal balance of demand in the cooperative, one member has at most two energy generation sources, which does not exclude a situation where not all members have them and are thus energy producers.
The discount nature of the operation of the energy cooperative and its members means that the loss of some energy on its introduction into the distributor’s network and its subsequent consumption should be balanced by a slight increase in the installed capacity of the source. For the simulation, it was assumed that the total annual energy production of each member of the cooperative could not exceed 120% of the annual energy demand. This assumption ensures that each member of the cooperative is fully balanced at an individual level and the surplus that occurs further allows the development of self-sufficiency at an aggregated cooperative level. As energy prosumers, cooperatives benefit from a discount model that allows them to manage temporary energy surpluses and shortages. Improving cooperation with the DSO [30] and the efficiency of this mechanism, as well as and increasing real-time energy self-consumption, are further enabled by real energy storage. The addition of real energy storage (batteries) to the model is one of the key elements of the study described in this paper.

3.2. Characteristics of Energy Cooperatives and Energy Storage Used in the Study

The sample of energy cooperatives used in the study was constructed using actual measurement data and customer and generation profiles for each type of renewable energy source. The purpose of selecting the participants of the cooperative was to reflect:
  • The location character—the simulation was made for participants in two southern voivodeships (administrative divisions) of Poland, Małopolskie and Śląskie, and the selection took account of different locations of municipalities within the voivodeships. The selection of two different voivodeships was also intended to reflect potentially different insulation levels and thus the efficiency of generation.
  • A different level (scale) of electricity demand—this resulted in cooperatives with a demand ranging from 762 MWh/year to 9759 MWh/year. Within this criterion, participants were also selected taking account of the diversity of their individual energy demands. The cooperative consisted of participants with negligible consumption, oscillating around one MWh/year, up to 3.5 GWh.
  • The nature of participants’ business activities—the selection of participants reflected the division in Polish law according to PKD codes (Polish Classification of Activities) relevant to typical agricultural activities, i.e., crop, vegetable, cereal production, raising of poultry, pigs and cattle, as well as services for the agricultural sector. The complete classification is shown in Table 1.
  • The electricity consumption profile of each member of the cooperative—the full range and variety of possible tariffs applicable in Poland for the members of energy cooperatives was taken into account. All analytical scenarios included entities belonging to one-, two- or three-zone tariffs, thus mapping the diverse nature of energy consumption. The affiliation of differently profiled members to specific cooperatives is shown in Table 1.
  • Moreover, for the simulations and research, and in order to generalize the results and reflect the energy effects seen from the perspective of minimizing the sum of energy taken from the network and unused energy within the network storage (virtual network deposit), reference models of one hundred energy cooperatives were constructed, each with a variable population size from 10 to 50 members with increments of 10.
For the simulation and research, sample energy storage facilities (batteries) [47] with real parameters and operation profiles were mapped in the structures of cooperatives. The parameters of a minimum and maximum battery capacity and computational step were selected for each cooperative. For modeling, it was assumed that the change in the nature of the storage operation (charging/discharging) could occur at hourly intervals. Furthermore, it was assumed that unlimited charging and discharging is possible throughout the 24 h period. Recommendations from an energy storage expert were also used in the analyses. The expert selected capacity parameters and charging and discharging powers based on the demand-supply profile of each of the five simulated cooperatives and at the request of the research team. A summary of the parameters is shown in Table 2. This data served as a comparative element for the energy storage (battery) capacities determined during the optimization process, used further in the analysis, and presented in Table 1.

3.3. The Optimization Model

The results presented in this paper were obtained on the basis of data from a simulation of a dedicated mathematical model. The mixed-integer programming technique [48] was used for modeling [49]. GLPK software was used for modeling, particularly the shared high-level GMPL language (this is an open-source software) [50]. COIN-OR/CBC software (also an open-source software) was used to solve the individual optimization tasks [51]. The basic assumptions of the model are discussed below, and parts of the model in the GMPL language are illustrated.
The input data for the model comprised a two-year horizon data in an hourly granulation. The calculation sessions used real data from several dozen consumers from different billing tariffs. The real two-year generation profiles of the following electricity sources were used: a small hydro-power plant, a wind-power plant, a photovoltaic power plant, wastewater- and biomass-based biogas plants.
As the research progressed, the model described in the authors’ earlier joint paper was developed [17] by adding an actual electricity store (battery) to it which, through appropriate parameterization, offered the possibility of being used in two scenarios. The first scenario assumed that the cooperative had no electricity storage (i.e., it had a storage with a maximum capacity of 0 kWh). The task was to select the optimum production mix for the pre-set demand, minimizing the energy not taken from the virtual network deposit and purchased from the network. The energy demand, depending on the calculation scenario, was created by individual consumers or aggregated consumers within predefined cooperatives. The energy mix is to be understood as the vector of discrete factors scaling the generation profiles of the energy producers considered. The coordinates of this vector are fixed during the optimization period. The business process modeled connected the consumers with the sources on a proprietary basis (the consumer was the source owner/prosumer). The first scenario is consistent with that already analyzed in the research team’s previous article [17]. After solving the task without the real storage (with 0 kWh capacity storage), tasks were solved where the use of batteries was possible for the generation structure obtained in the first scenario. Properly produced energy could be a discrete multiple of the profile adopted.
The energy balance equation in the GMPL modeling language is presented in Algorithm 1.
Algorithm 1.
subject to def_EnergyBalance{h in Hours}:
 EnergyDemand[h]
 =
 BuyFromNetwork[h]
 +
 sum{e in EnergySources} Production[e,h]
 +
 PickUpFromNetwork[h] - SendToNetwork[h]
 +
 PickUpFromBattery[h] - SendToBattery[h]
;
EnergyDemand[h] is the energy demand at hour h; BuyFromNetwork[h] is the energy purchase at hour h; Production[h] is the energy production at hour h; SendToNetwork[h] is the energy sending at hour h and PickUpFromNetwork[h] is the energy collected at hour h; SendToBattery[h] is the energy sending at hour h to the real battery; and PickUpFromBattery[h] is the energy collected from the real battery at hour h.
The model assumes that it is not possible to simultaneously send energy to the real battery and collect energy from it in the same hour h. The relevant model equations are in Algorithm 2:
Algorithm 2.
subject to constr_SingleComponentBatteryFlow{h in Hours}:
SendToBatteryIndicator[h] + PickUpFromBatterylndicator[h] < = 1;
The SendToBatteryIndicator[h] and PickUpFromBatterylndicator[h] variables are binary variables indexed by the hours of the optimization horizon, which takes the value 1 for non-zero values of the corresponding real variables and the value 0 for zero flows.
The algorithms modeling the operation of a real storage of energy produced by prosumers are in Algorithm 3:
Algorithm 3.
subject to def_EnergyBattery{h in Hours}:
Battery[h] =
if(h=1) then
   0
else
(
   Battery[h-1]
   -
PickUpFromBattery[h]
   +
SendToBattery[h]
);
In the analyses, it was assumed that, for h = 1, i.e., at the beginning of the optimization, the battery was not charged, i.e., Battery[0] = 0.
The optimization objective function was the sum of two components—energy taken from the network and energy produced but not consumed. In Algorithm 4, the optimization was to minimize the following objective function.
Algorithm 4.
minimize  objective:
sum{h in EndsOfBillingPeriods}
 Storage[h]
+
sum{h in Hours}
 BuyFromNetwork[h]
;
The EndsOfBillingPeriods set covered the last hours of billing periods.
The optimization covered a two-year horizon and the results presented refer to the first year of optimization.

4. Results and Discussion

The effect of energy storage can be considered on multiple levels. Given the availability of the actual metering data, the authors simulated the effect of energy storage separately for the specific five energy cooperatives and five energy cooperatives of different sizes, for which a random selection of members was made to obtain reference scenarios and conclusions. The results of the storage effect were shown in the volumetric dimension. The omission of financial aspects introduces universality into the approach, as it avoids the lack of offer transparency and avoids comparisons with electricity market prices specific to a particular country.

4.1. Simulation Results for Dedicated and Reference Agricultural Energy Cooperatives

A simulation was carried out in which the capacity of the energy storage operating within the cooperative was increased from 0 kWh to 50 MWh, with increments of 100 kWh to 1000 kWh, 500 to 10,000 kWh and 1000 kWh to 50,000 kWh. Each time, the charging power as well as the discharging power was assumed to be equal to 10% of the total capacity expressed in kW.
As a result of the simulations of the behavior of five agricultural energy cooperatives, it is possible to evaluate and analyze the results for specific configurations, taking into account the construction and operation of a real energy storage with the capacity and making it possible to achieve half of the maximum optimization effect. The rationality of choosing the storage capacity, obtaining the desired measurability of the storage effect and the impact on the Demand Side Management (DSM) is also dictated by the results of available studies [52,53]. An illustration of the results is shown in Figure 1.
The results allow the following conclusions to be drawn:
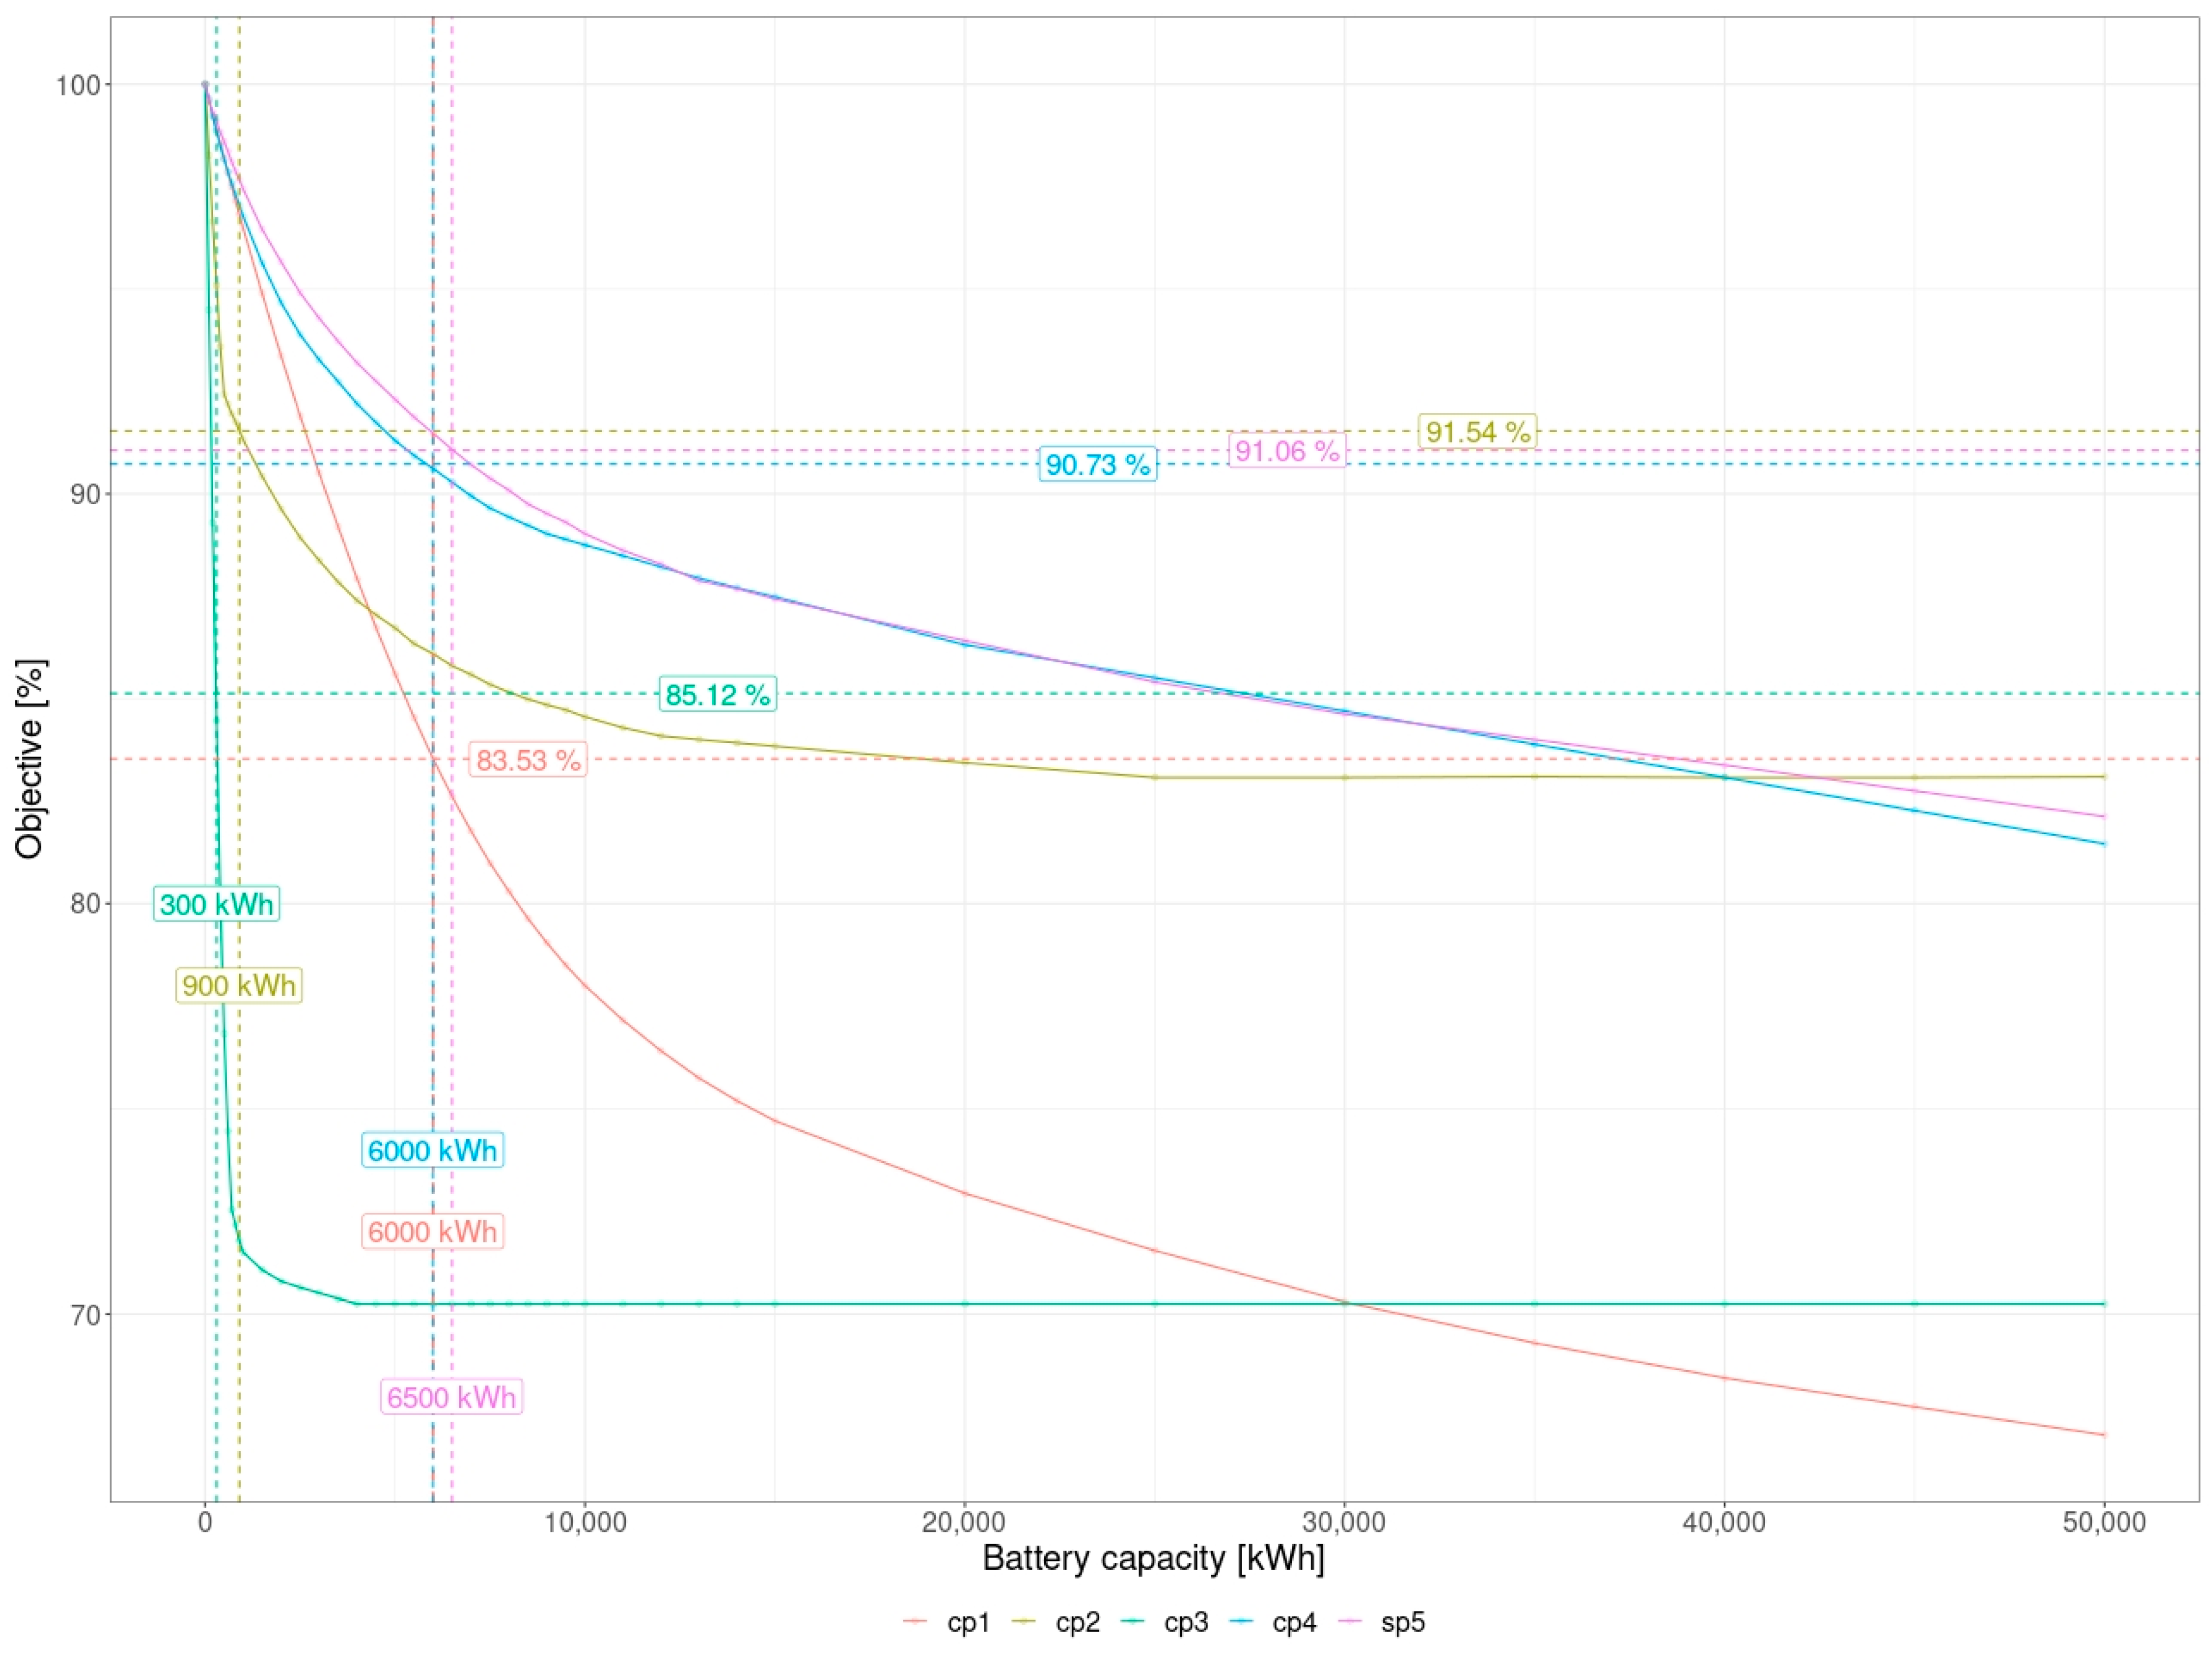
  • As energy storage capacity increases, the optimization product, which is the sum of energy taken from the network and unused energy within the network deposit at the end of the billing period, decreases nonlinearly.
  • The increase in the number of members of the cooperative does not directly relate to the dynamics and profile of dependency of the optimization effect as a function of storage (battery) capacity. This is exemplified by the results for CP1 and CP4, for which the sequence characteristics are very similar, despite differences in cooperative sizes, energy consumption levels and generation-source capacity levels.
  • Noteworthy is the fact of different dynamics of the optimization effect in the context of different structures of energy generation within cooperatives. The highest dynamics of the optimization effect is observed for cooperative CP3, where the generation is based on PV only. As capacity increases in profile-stable generation sources, the dynamics decrease, e.g., CP2.
  • Regardless of the number of cooperative members, it can be observed that, for small storage capacities, the optimization effect increment is the largest. On this basis, it can be concluded that there is no justification for increasing the storage capacity beyond a specified inflection point of the curve, which is particularly evident in the case of CP3 or CP2.
  • The average improvement in the optimization effect relative to the scenario without the energy storage varies and, depending on the size of the cooperative, ranges from about 15% for CP2 to about 35% for CP1.
  • Half of the average optimization effect can be obtained for the following energy storage capacities:
    6000 kWh; CP1; half of the average effect: 16.5%;
    900 kWh; CP2; half of the average effect: 8.5%;
    300 kWh; CP3; half of the average effect: 14.9%;
    6000 kWh; CP4; half of the average effect: 9.3%;
    6500 kWh; CP5; half of the average effect: 8.9%.
The next stage of the analysis assumed a simulation of the effect of a real energy store for reference scenarios reproducing a random drawing of cooperative structures while maintaining the criterion of a specified number of members. For each such reference cooperative, a simulation was carried out in which the capacity of the energy storage within the cooperative was increased from 0 kWh to 50 MWh, with increments of 100 kWh to 1000 kWh, 500 to 10,000 kWh and 1000 kWh to 50,000 kWh. Each time, the charging power, as well as the discharging power, was assumed to be equal to 10% of the total capacity, expressed in kW. The results are shown in Figure 2.
The simulation results are illustrated in Figure 2, which shows the percentage of the cooperative objective function depending on battery capacity. Solid lines represent the average effect of the measurement points obtained. The condition obtained reflects the effect of providing the cooperative with an energy storage relative to the condition before its installation (capacity: 0 kWh, objective function 0%). The results for cooperatives with different numbers of members are marked with points in different colors. The solid line corresponds to the average measurement points for cooperatives with a specified number of members.
The results allow the following conclusions to be drawn:
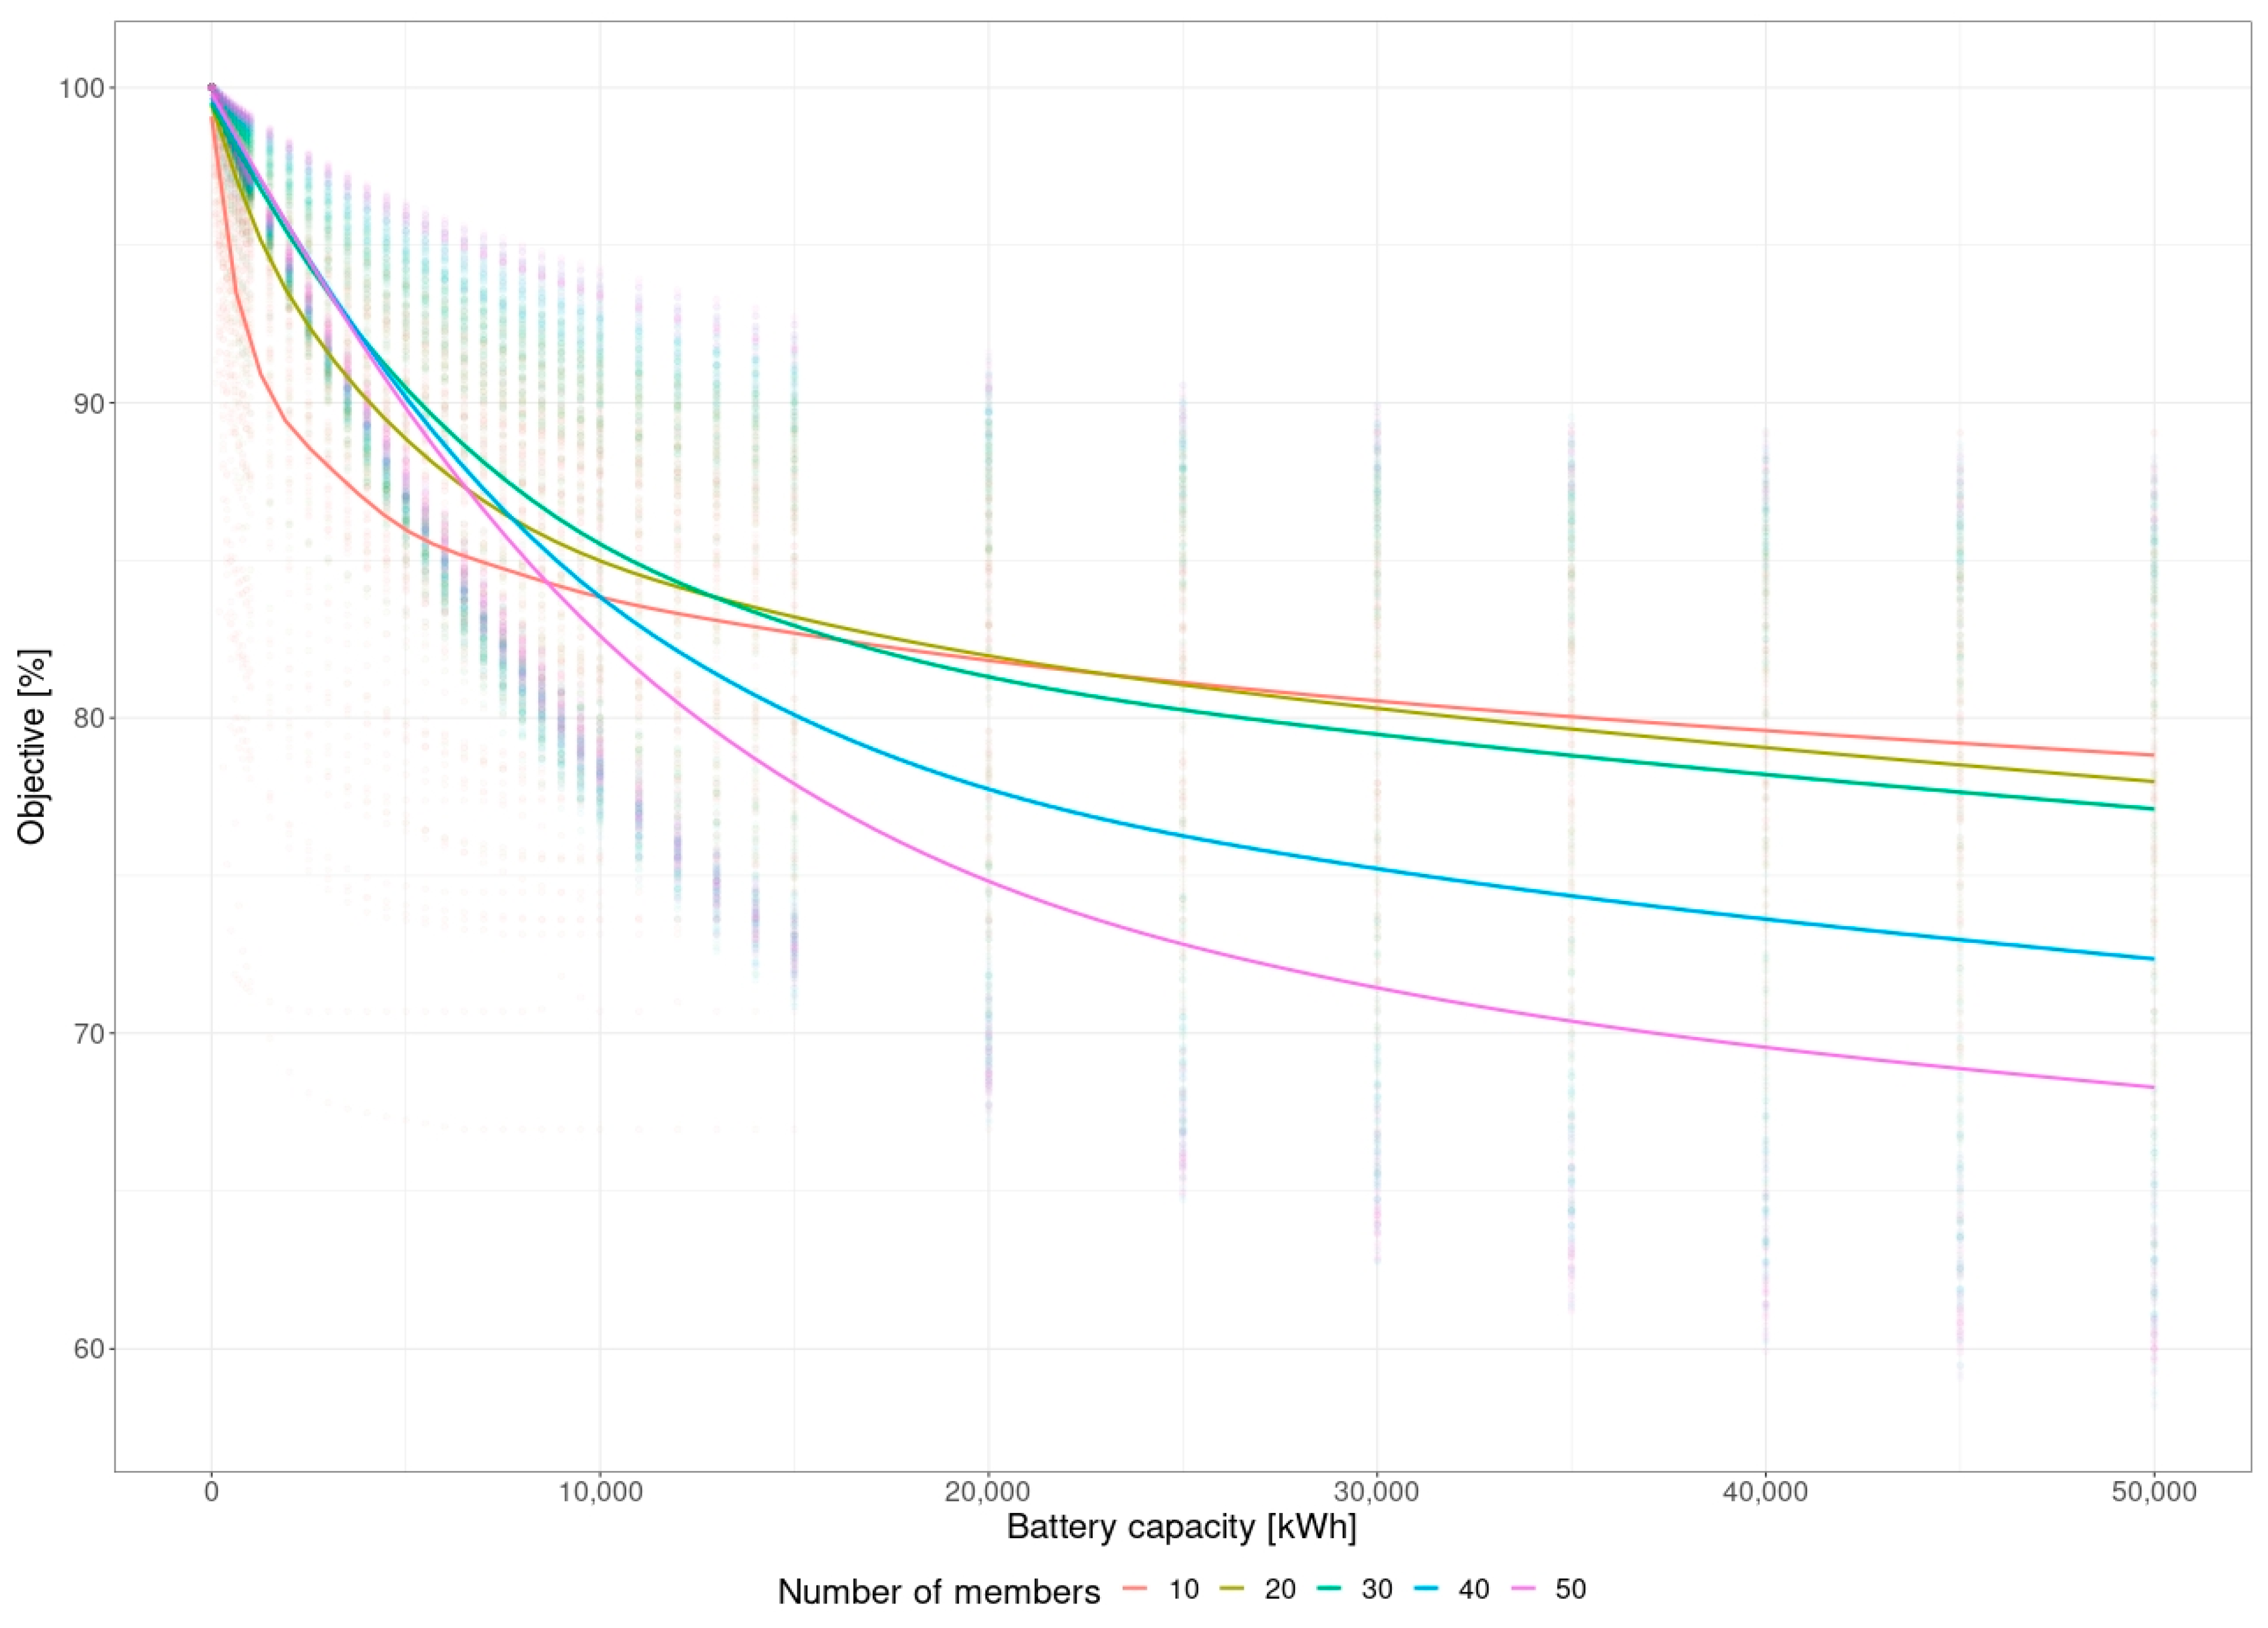
  • As the energy storage capacity increases, the optimization product, which is the sum of energy taken from the network and unused energy within the network deposit at the end of the billing period, decreases nonlinearly.
  • The increase in the number of members of the cooperative affects the dynamics and profile of dependency of the optimization effect as a function of the storage capacity. The higher the number of cooperative members, the milder and shallower is the effect for small capacities and the deeper it is for large storage capacities. The differences between the average level of the optimization effect for the maximum storage capacity analyzed reach 10%.
  • Regardless of the number of cooperative members, it can be observed that, for small storage capacities, the optimization effect increment is the largest. On this basis, it can be concluded that there is no justification for increasing the storage capacity beyond the established inflection point of the curve.
  • The average improvement in the optimization effect relative to the scenario without the energy storage varies and, depending on the size of the cooperative, ranges from about 30% for 50 cooperative members to about 20% for 10 cooperative members.
  • The application of a real energy store makes it possible to limit the sum of energy introduced into the network deposit and the energy lost at the end of the billing period by a value within the range of 10.93% to 41.83%. However, achieving this effect would require the use of storage systems with large power and capacity, which is currently not economically justified. It was therefore assumed that the optimum storage capacity would reflect the achievable half of the maximum optimization effect, and the average benefit values for this scenario are shown in Figure 3.
  • The analyses and simulation results show that the real energy store should only have an on-demand role. The operation of an energy cooperative based on the discount model and the temporary deposition of energy in the operator’s network enables effective volumetric balancing in the long term. Both storage environments, i.e., the real one (energy storage) and the virtual one (virtual deposit) within the operator’s network, are complementary, which makes it possible to significantly improve the volumetric balance that simultaneously burdens the distribution network and maximizes self-consumption. The proposed approach is one of the possible ways to benefit from the storage system. The results of alternative studies show the importance of the predictions made and the optimized target function [54].
In addition, a detailed analysis of the cooperative size scenarios presented in Table 1 and Figure 2 allows the following conclusions:
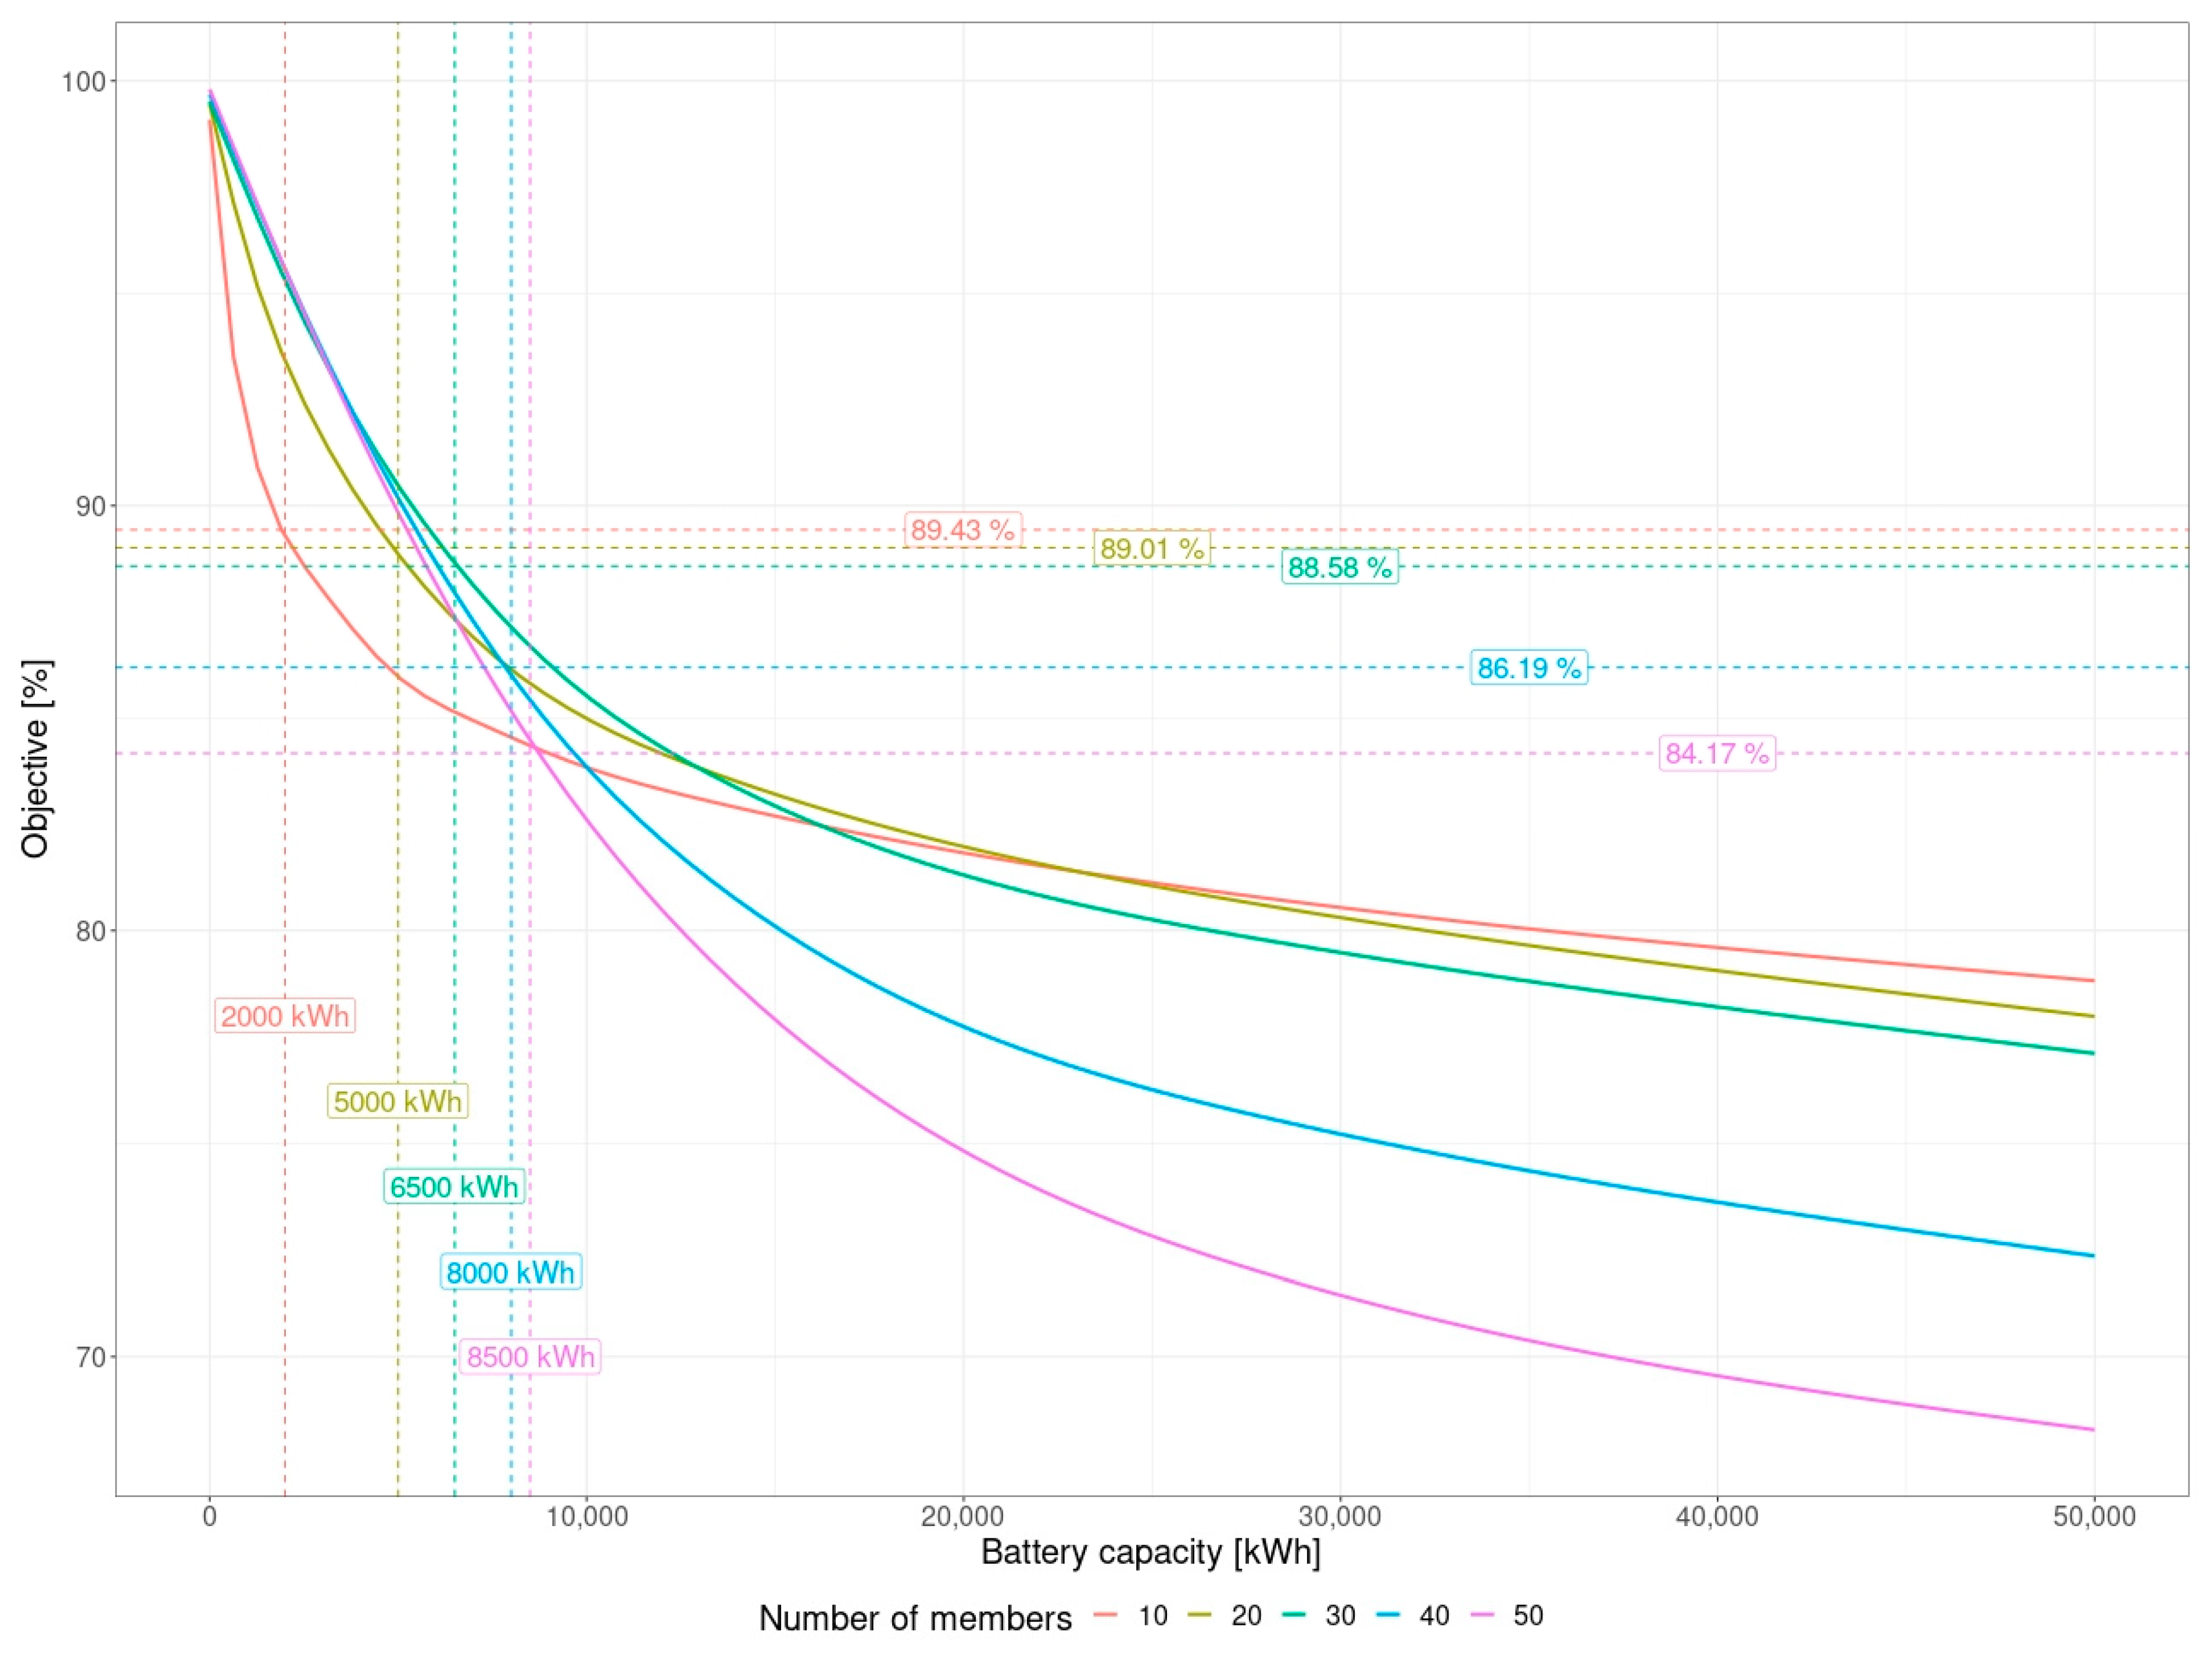
  • Half of the average optimization effect can be obtained for the following energy storage capacities and set size scenarios:
    2000 kWh; size: 10 members; half of the average effect: 10.6%;
    5000 kWh; size: 20 members; half of the average effect: 11.0%;
    6500 kWh; size: 30 members; half of the average effect: 11.4%;
    8000 kWh; size: 40 members; half of the average effect: 13.8%;
    8500 kWh; size: 50 members; half of the average effect: 15.8%.
  • In the context of the potential benefits of energy storage, the use of high-capacity storage systems is not justified. Half of the optimization effect is obtained for storage capacities between 4% (for cooperatives with 10 members) and 17% (for cooperatives with 50 members) of the maximum capacity analyzed.
  • As the number of members of energy cooperatives increases, the average value of the benefit identical to minimizing the sum of the purchase of energy from the network, as well as the condition of the network deposit at the end of the billing period, approaches the maximum possible effects of optimization.
  • The increase in size also results in a smoothing of the dependence profile of the optimization effect as a function of storage capacity. For a cooperative with 50 members, the dynamics of changes in characteristics in a range between 0 and 8500 kWh are significantly lower than for a cooperative with 10 members and a range between 0 and 2000 kWh.
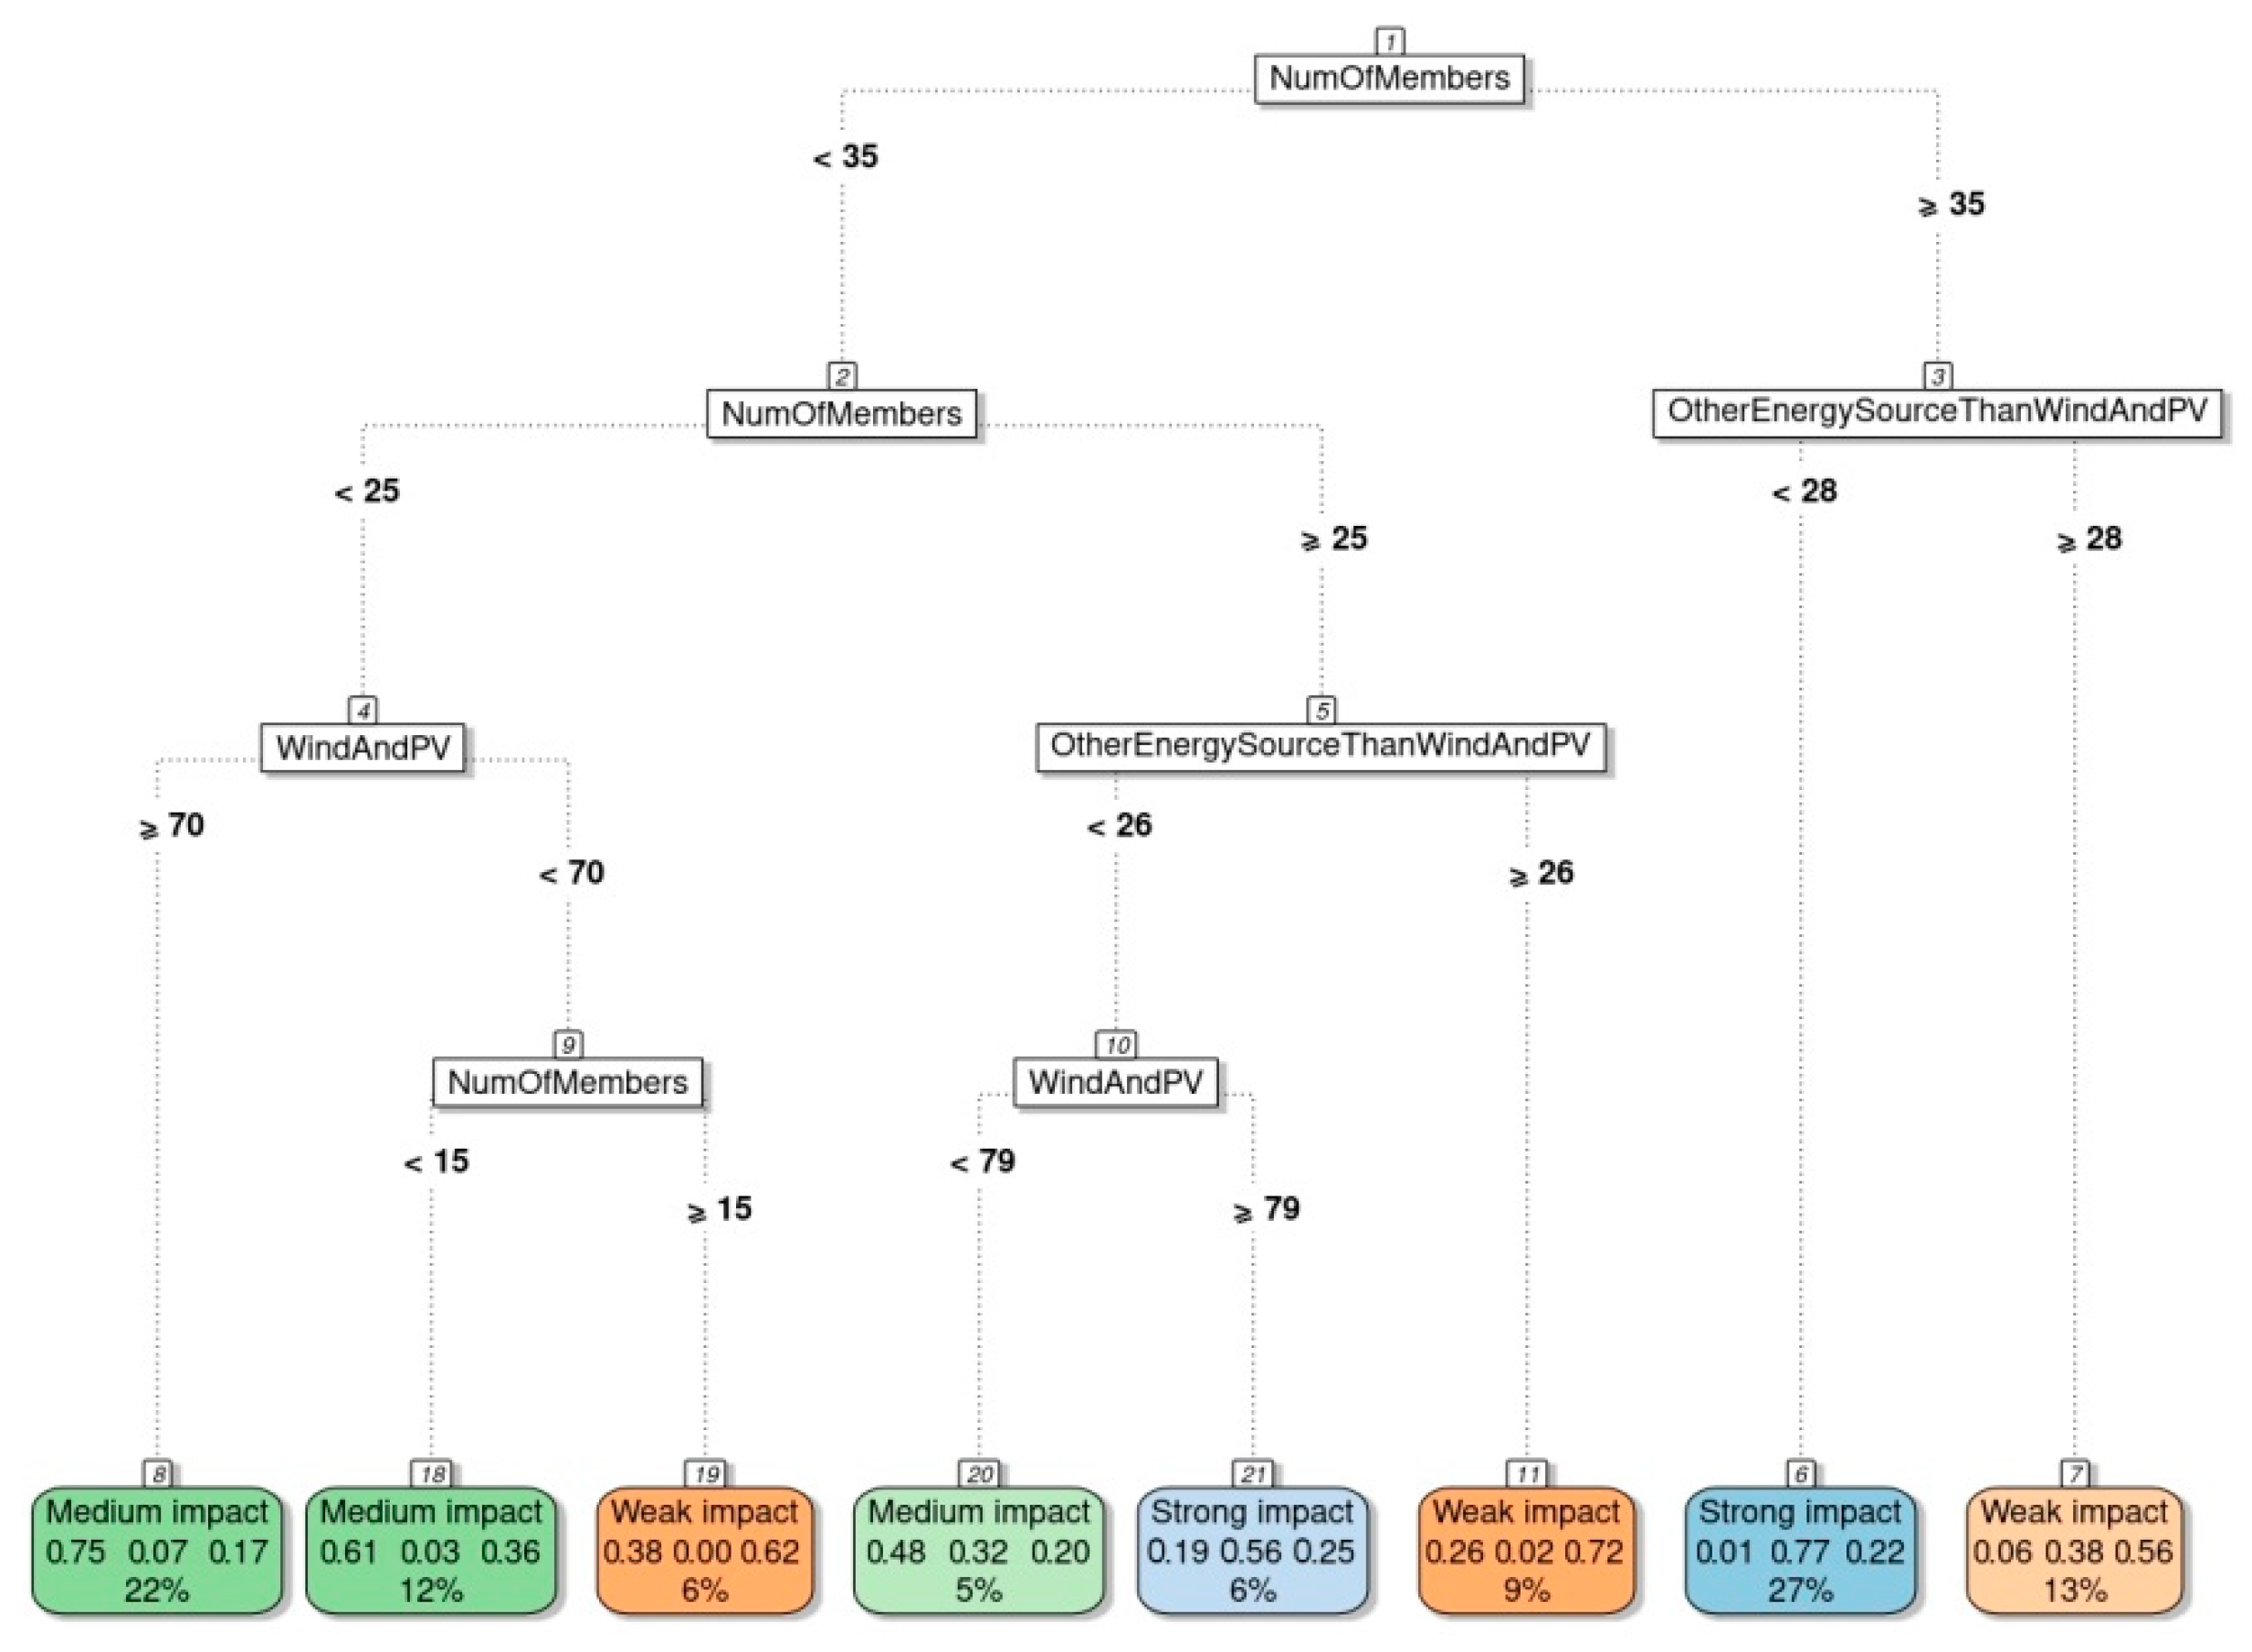
  • The benefit of applying real storage systems is greater in the case of the dominance of wind and PV sources; this conclusion will be justified using data-mining techniques in Section 3 of this article.

4.2. Results and Evaluation of the Volumetric Effect of Energy Storage

The simulation of the energy storage process was carried out according to two scenarios. Respectively, they assumed the evaluation of the impact of real energy storage in CP1 – CP5 agricultural energy cooperatives and reference models of one hundred energy cooperatives with population sizes from 10 to 50 members. Due to the dynamic development of the storage sector and the potential difficulty in rationally estimating the current and appropriate level of capital outlays on storage construction, the analyses focused exclusively on the volumetric effect of storage. The results for both scenarios are presented in Table 3 and Table 4.
The analysis of the results allows the following conclusions to be drawn:
  • The reduction in the average percentage level of energy consumption subject to the capacity fee increases with the size of the reference cooperative from 0.6% for 10 members to 1.0% for 50 members.
  • The increment in the average level of self-consumption increases with the size of the reference cooperative from 1.9% for 10 members to 3.7% for 50 members.
  • The average level of reduction in energy consumption from the network increases with the size of the reference cooperative by 1.3% for 10 members and by 2.5% for 50 members.
  • The maximum difference in reduction levels of energy consumption from the network in relation to demand ranges from 0.5% to 4.7%.
  • The analysis of the results for cooperatives CP1-CP5 does not provide unambiguous conclusions and regularities because it refers to specific, individual cases characterized by a different production and consumption structure and the level of the storage capacities analyzed.

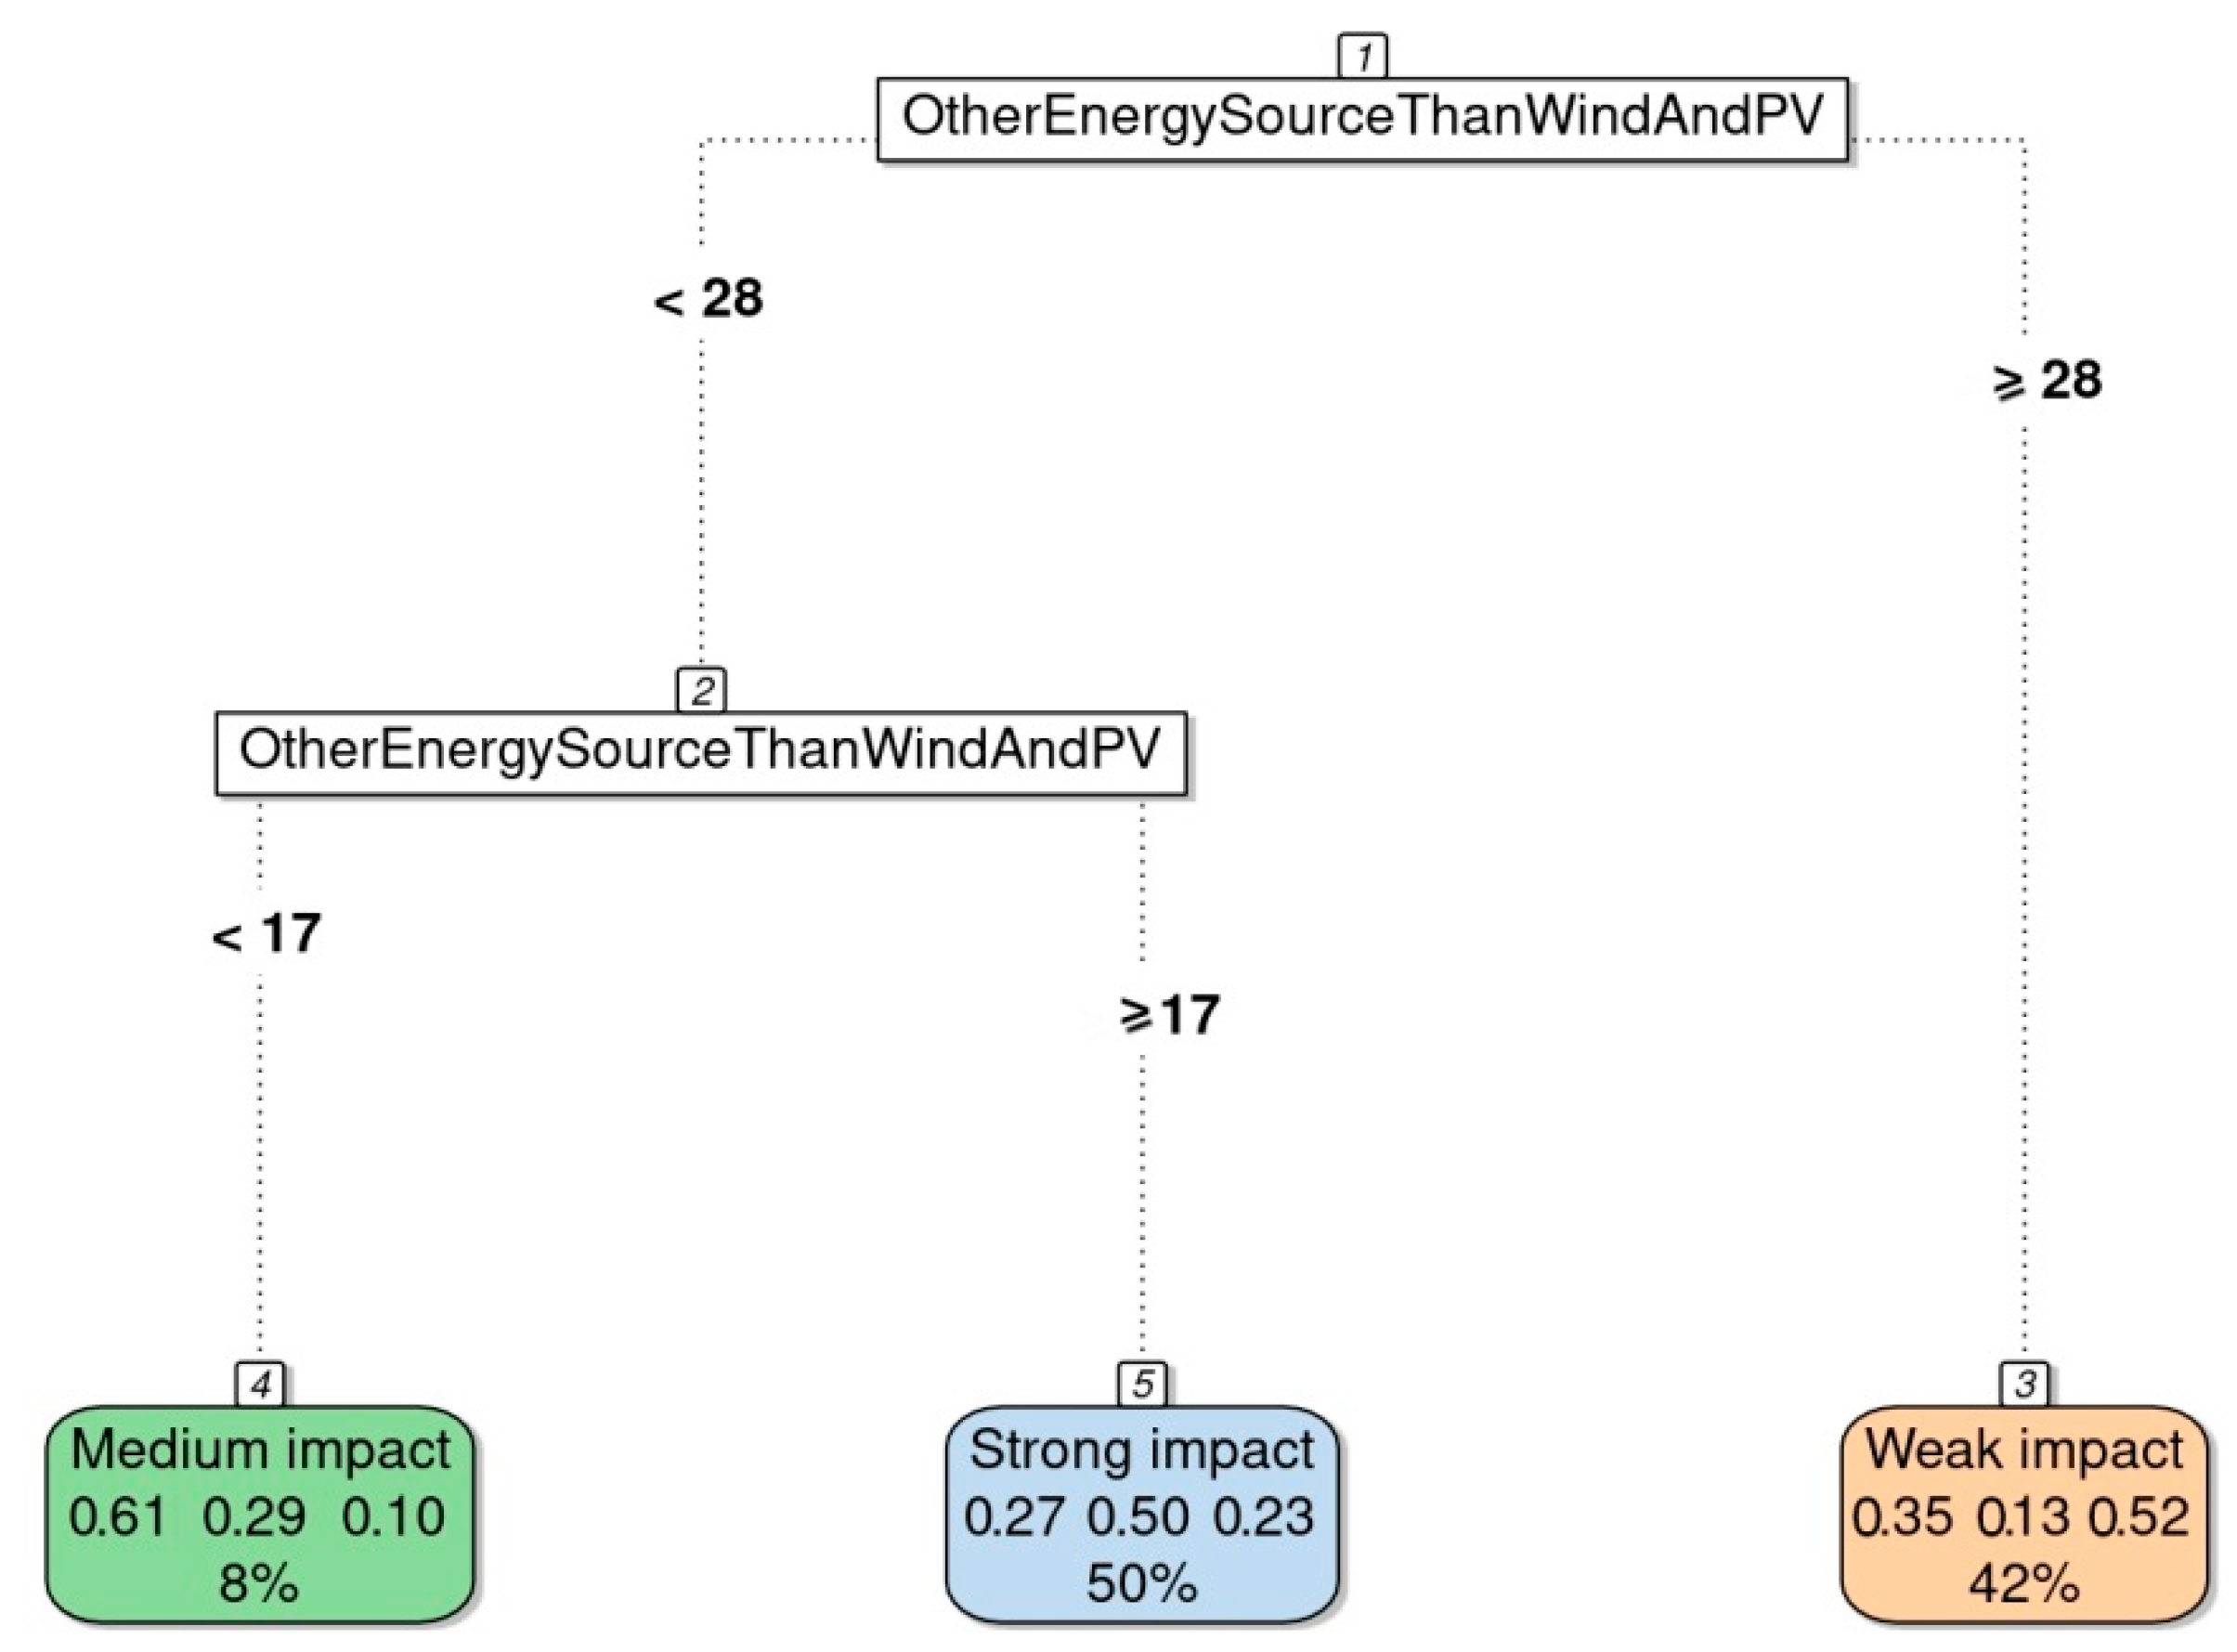
4.3. Application of Decisions Trees to Assess the Effect of Energy Storage

Based on the analysis of the profitability of specific cooperatives CP1-CP5, it was not possible to draw conclusions on regularity. For this reason, the focus was on serial randomized experiments. The results of serial experiments, in which the composition of cooperatives was randomized, were analyzed using decision trees [55] available in the R-Project software [56]. The relevant information was obtained in two modeling scenarios.
The first scenario assumed that the variable modeled was the average effect of the savings achieved after using a battery with a capacity equivalent to the half of the effect, discretized to three values: WeakImpact, MediumImpact and StrongImpact. In the experiment, random cooperatives with varying numbers of members achieved different types of percentage savings. In terms of savings achieved, cooperatives were flagged with the WeakImpact flag if the benefit of the battery use ranked in the lower ⅓ of all possible percentage savings achieved during the series of calculations. The StrongImpact flag was used to designate cooperatives for which ⅓ of the highest savings were achieved, and all others were marked with MediumImpact.
The following variables were used as explanatory variables: the number of members of the cooperative (NumberOfMembers, which could assume one of the following values 10, 20, 30, 40, 50), the percentage total share of wind and photovoltaic sources (marked as WindAndPV) and other sources (marked as OtherEnergySourceThanWindAndPV).
Figure 4 shows a decision tree describing the class of savings size depending on the type of sources used and the number of cooperative members. The set of observations was divided into eight segments by the decision-tree algorithm. The leftmost branch of the tree was considered to explain the reading method. It ends with a green leaf marked MediumImpact. In the classification process, observations for which the number of cooperative members was less than 35 and, at the same time, fewer than 25 were included in this segment. In addition, the share of wind and photovoltaic sources in the production was at least 70%. This leaf accounted for 22% of all observations. In all, 75% of the population of this leaf constitute MediumImpact class elements, and 7% and 17% are StrongImpact and WeakImpact class elements, respectively.
The rightmost leaf was marked WeakImpact. In the classification process, observations for which the number of cooperative members was greater than or equal to 35 and in which the share of sources other than wind and photovoltaic in the production was at least 28% were included in this segment. This leaf accounted for 13% of all observations. The elements of the MediumImpact class constitute 6% of the population of this leaf, and the elements of the StrongImpact and WeakImpact classes constitute 38% and 56%, respectively. The set of decision rules of the tree visualized in Figure 4 is recorded in Table 5.
The second modeling scenario did not include the size of cooperatives in the explanatory variables. Relevant rules are more aggregated than those shown in Figure 4 but are more easily interpretable in business terms. They show that the greatest effect from using a real battery can be obtained if the percentage production from wind and PV sources is in the 72% to 83% range (StrongImpact). This is illustrated in Figure 5. The MediumImpact level is reached when the percentage of production share from wind and PV sources is greater than 83% (other sources generate no more than 17%), and the effect is the lowest when the share of production from wind and PV sources is less than 72% (other sources generate at least 28%).
It seems that a good approximation of the dependencies obtained is the statement that the maximization of the effect from the application of batteries takes place when the production mix is 75% for wind and PV sources and 25% for other sources. This conclusion seems reasonable, given that sources considered other than PV and wind have a more stable generation profile. Thus, the sources with unstable profiles interact more effectively with real energy storage systems.

5. Conclusions

  • Both the analyses of five specific energy cooperatives and the simulations designed to represent the reference nature of cooperatives confirm that, in each case, the installation of real energy storage systems allows only for a partial minimization of the volume of energy taken from the network during the hours and days when the capacity charges are in force. Depending on the scenario analyzed, an improvement in the average level of volume reduction from 0.6% to 1.0% was achieved, and the maximum value was 2.4%.
  • The results confirm that oversizing the storage capacity has no or a negligible effect. Obtaining half of the effect as the aim of optimization was already possible at the capacity of a few or several percentage points of the maximum capacity analyzed.
  • The use of real energy storage systems makes it possible to reduce the level of energy taken from the network and not from one’s own production. The maximum differences of reduction levels of energy consumption from the network in relation to demand range from 0.5% to 4.7%. In addition, the regularity indicating that the increase in this effect corresponds to the increase in the size of the reference cooperative seems to be important.
  • The ability to change the nature of the use of the storage operation in the hourly interval (charging/discharging) further makes it possible to improve the self-consumption rate, which varied between 1.9% and 3.7% for 10 and 50 cooperative members, respectively.
  • Based on the volumetric results, it can be concluded that the construction of a real energy store cannot be treated as a “universal” and appropriate tool for improving the efficiency of cooperatives.
  • The study also makes it possible to evaluate the optimization effect, taking into account both the real energy storage and the nature of generation. The storage effect is maximized when up to 75% of the generation is from wind and photovoltaic sources, and only 25% from hydro, biogas and biomass sources.
  • The real storage of energy within energy cooperatives, integrating the already optimally selected participants, does not result in a significant improvement in the objective function. The reduction in energy intake from the network and the increase in self-consumption always occur but, in the authors’ opinion, the scale of the phenomenon is not satisfactory. The storage analysis should be carried out individually for each configuration of the cooperative. This conclusion indicates that the main purpose of the article, which was to present the results of the assessment of the actual impact of energy storage on operational efficiency, was fairly presented. Energy storage is therefore an interesting area for further in-depth exploration and research, and sensitivity analyses should take into account (i) different charging and discharging time regimes; (ii) mapping investment outlays and operating costs as a function of time; (iii) leveled cost of electricity (LCOE); (iv) predicted improvement in storage efficiency due to advancing technology, quantum batteries [57,58] and propensity to change social behavior [59]; and (v) the fact that effect and prices in the dual market for energy and capacity seem to be particularly valuable. These topics will be the subject of further research by the authors.

Author Contributions

Conceptualization, J.J., M.K. and M.S.; methodology, M.K.; formal analysis, J.J., M.K. and M.S.; investigation, J.J., M.K. and M.S.; resources, M.S.; writing—original draft preparation, J.J., M.K. and M.S.; writing—review and editing, J.J.; visualization, M.K.; supervision, J.J. and M.S. All authors have read and agreed to the published version of the manuscript.

Funding

This research received no external funding.

Institutional Review Board Statement

Not applicable.

Informed Consent Statement

Not applicable.

Data Availability Statement

Data available in a publicly accessible repository that does not issue DOIs. The data presented in this study can be found here: https://drive.google.com/drive/folders/1JKvGCnHBZabmodsTrMUuxp6eXhagI0K0?usp=sharing.

Conflicts of Interest

The authors declare no conflict of interest.

References

  1. European Commission. Communication from the Commission to the European Parliament, the Council, the European Economic and Social Committee and the Committee of the Regions; European Climate Pact—COM(2020) 788 Final; European Commission: Brussels, Belgium, 2020. [Google Scholar]
  2. Wojcik-Jurkiewicz, M.; Lubicz-Posochowska, A.; Czarnecka, M.; Kinelski, G.; Sadowska, B. Legal aspects of sharing economy: The case of games’ platforms. Eur. Res. Stud. J. 2021, 24, 1196–1210. [Google Scholar] [CrossRef]
  3. European Commission. New Circular Economy Action Plan. Available online: https://ec.europa.eu/commission/presscorner/detail/en/ip_20_420 (accessed on 12 April 2021).
  4. Cuenca, J.; Jamil, E.; Hayes, B. Energy communities and sharing economy concepts in the electricity sector: A survey. In Proceedings of the 2020 IEEE International Conference on Environment and Electrical Engineering and 2020 IEEE Industrial and Commercial Power Systems Europe (EEEIC/I&CPS Europe), Madrid, Spain, 9–12 June 2020; pp. 1–6. [Google Scholar]
  5. European Commission. Sustainable Batteries for a Circular and Climate Neutral Economy. Available online: https://ec.europa.eu/commission/presscorner/detail/en/ip_20_2312 (accessed on 12 April 2021).
  6. European Commission. European Green Deal. Available online: https://ec.europa.eu/info/strategy/priorities-2019-2024/european-green-deal_en (accessed on 12 April 2021).
  7. European Commission. State of the Union: Commission Raises Climate Ambition and Proposes 55% Cut in Emissions by 2030. Available online: https://ec.europa.eu/commission/presscorner/detail/en/ip_20_1599 (accessed on 12 April 2021).
  8. Clean Energy for All Europeans Package. Available online: https://ec.europa.eu/energy/topics/energy-strategy/clean-energy-all-europeans_en (accessed on 18 November 2020).
  9. Energy Community. Available online: https://www.emissions-euets.com/internal-electricity-market-glossary/2095-energy-community (accessed on 12 April 2021).
  10. Mucha-Kuś, K.; Sołtysik, M.; Zamasz, K.; Szczepańska-Woszczyna, K. Coopetitive nature of energy communities—The energy transition context. Energies 2021, 14, 931. [Google Scholar] [CrossRef]
  11. The European Parliament and The Council of the European Union. Directive (EU) 2018/2001 of the European Parliament and of the council of 11 December 2018 on the promotion of the use of energy from renewable sources. Off. J. Eur. Union 2018, 328, 82–209.
  12. Lowitzsch, J.; Hoicka, C.E.; van Tulder, F.J. Renewable energy communities under the 2019 European clean energy packae—Governance model for the energy clusters of the future? Renew. Sustain. Energy Rev. 2020, 122, 109489. [Google Scholar] [CrossRef]
  13. The European Parliament and The Council of the European Union. Directive (EU) 2019/944 of the European Parliament and of the Council of 5 June 2019 on common rules for the internal market for electricity and amending directive 2012/27/EU. Off. J. Eur. Union 2018, 158, 125–199. [Google Scholar]
  14. Ghiani, E.; Giordano, A.; Nieddu, A.; Rosetti, L.; Pilo, F. Planning of a smart local energy community: The case of Berchidda municipality (Italy). Energies 2019, 12, 4629. [Google Scholar] [CrossRef] [Green Version]
  15. Kucharska, A.P. “Czysta energia dla wszystkich Europejczyków”—Konsekwencje wdrażania polityk europejskich dla polskich inicjatyw energetycznych (EN: “Clean Energy for All Europeans” package—Consequences of implementing European policies for Polish energy initiatives). Energ. Rozproszona 2020, 2, 37–44. [Google Scholar]
  16. Czarnecka, M. Development of energy clusters in Poland—General remarks. Stud. Prawno Ekon. 2018, 109. [Google Scholar] [CrossRef]
  17. Jasiński, J.; Kozakiewicz, M.; Sołtysik, M. Determinants of energy cooperatives’ development in rural areas—Evidence from Poland. Energies 2021, 14, 319. [Google Scholar] [CrossRef]
  18. Tucki, K.; Orynycz, O.; Wasiak, A.; Świć, A.; Dybaś, W. Capacity market implementation in Poland: Analysis of a survey on consequences for the electricity market and for energy management. Energies 2019, 12, 839. [Google Scholar] [CrossRef] [Green Version]
  19. Ministry of Climate. Poland Polish Implementation Plan (Amended Version). Available online: https://ec.europa.eu/energy/sites/default/files/polish_implementation_plan_final_courtesy_translation.pdf (accessed on 14 February 2021).
  20. Mucha-Kuś, K.; Sołtysik, M.; Zamasz, K. Capacity market in contemporary economic policy. In Capacity Market in Contemporary Economic Policy; Difin: Warsaw, Poland, 2015; ISBN 978-83-7930-967-2. [Google Scholar]
  21. Janosz, A.; Sołtysik, M. Customer in the capacity market in the context of qualitative regulation model. In Capacity Market in Contemporary Economic Policy; Difin: Warsaw, Poland, 2015; ISBN 978-83-7930-967-2. [Google Scholar]
  22. Zamasz, K. Efektywność Ekonomiczna Przedsiębiorstwa Energetycznego w Warunkach Wprowadzenia Rynku Mocy; (Economic Efficiency of an Energy Company in the Conditions of Operation on the Capacity Market); PWN: Warsaw, Poland, 2015; ISBN 978-83-01-18378-3. [Google Scholar]
  23. Gawlikowska-Fyk, A. Capacity Market for Review. Analysis of the Results of Three Auctions. Available online: https://www.forum-energii.eu/en/analizy/rynek-mocy-do-przegladu (accessed on 14 February 2021).
  24. Poland’s Energy Regulatory Office (URE). Electricity Rates in Poland in 2021. Available online: https://www.ure.gov.pl/pl/urzad/informacje-ogolne/aktualnosci/9163,Jak-zmienia-sie-nasze-rachunki-za-energie-elektryczna-w-przyszlym-roku.html (accessed on 14 February 2021).
  25. Dolatowski, M. Capacity Fee: A Significant Increase in Electricity Prices from 2021; Wardyński & Partners: Warsaw, Poland, 2020. [Google Scholar]
  26. Bloomberg: EUR to PLN Exchange Rate. Available online: https://www.bloomberg.com/quote/EURPLN:CUR (accessed on 12 April 2021).
  27. Ministerstwo Klimatu i Środowiska. Rozporządzenie Ministra Klimatu i Środowiska z Dnia 9 Listopada 2020 r. w Sprawie Pobierania Opłaty Mocowej i Wyznaczania Godzin Doby Przypadających Na Szczytowe Zapotrzebowanie Na Moc w Systemie; (Regulation of the Minister of Climate and Environment of 9 November 2020 on Charging the Capacity Fee and Determining the Hours of the Day Corresponding to the Peak Demand for Power in the System); (Dz. U. z 2020 r. Poz. 2009); Ministerstwo Klimatu: Warsaw, Poland, 2020. [Google Scholar]
  28. Andrychowicz, M. RES and ES integration in combination with distribution grid development using MILP. Energies 2021, 14, 383. [Google Scholar] [CrossRef]
  29. Matthiss, B.; Momenifarahani, A.; Binder, J. Storage placement and sizing in a distribution grid with high PV generation. Energies 2021, 14, 303. [Google Scholar] [CrossRef]
  30. Andrychowicz, M. Comparison of the use of energy storages and energy curtailment as an addition to the allocation of renewable energy in the distribution system in order to minimize development costs. Energies 2020, 13, 3746. [Google Scholar] [CrossRef]
  31. Sim, J.; Kim, M.; Kim, D.; Kim, H. Cloud energy storage system operation with capacity P2P transaction. Energies 2021, 14, 339. [Google Scholar] [CrossRef]
  32. PSE S.A. Plan Rozwoju w Zakresie Zaspokojenia Obecnego i Przyszłego Zapotrzebowania Na Energię Elektryczną Na Lata 2021–2030; (Development Plan to Meet the Present and Future Electricity Demand for 2021–2030); Polish Power Grids: Konstancin-Jeziorna, Poland, 2020. [Google Scholar]
  33. PSE S.A. Prognoza Pokrycia Zapotrzebowania Szczytowego Na Moc w Latach 2016–2035; (Forecast of Peak Demand Coverage for Power in 2016–2035); Polish Power Grids: Konstancin-Jeziorna, Poland, 2016. [Google Scholar]
  34. PSE S.A. Polish Power System—General Information. Available online: https://www.pse.pl/obszary-dzialalnosci/krajowy-system-elektroenergetyczny/informacje-o-systemie (accessed on 21 April 2021).
  35. Majchrzak, H.; Kozioł, M. Analysis of various options for balancing power systems’ peak load. Energies 2021, 14, 513. [Google Scholar] [CrossRef]
  36. Stamtsis, G.; Doukas, H. Cooperation or localization in European capacity markets? A coalitional game over graph approach. Energies 2018, 11, 1473. [Google Scholar] [CrossRef] [Green Version]
  37. Towarowa Giełda Energii—Notowania; (Polish Power Exchange—Quotations). Available online: https://tge.pl/en-home (accessed on 21 April 2021).
  38. Ministerstwo Właściwy DS Energii Rada Ministrów. Ustawa z Dnia 8 Grudnia 2017 r. o Rynku Mocy; (The Act of December 8, 2017 on the Capacity Market); (Dz. U. z 2020 r. Poz. 247); Ministerstwo Właściwy DS Energii Rada Ministrów: Warsaw, Poland, 2018. [Google Scholar]
  39. Jeżyna, B.; Lis, M.; Mesjasz-Lech, A. The DSR scheme in the capacity market of industrial enterprises in Poland—Participation determinants. Energies 2020, 13, 5462. [Google Scholar] [CrossRef]
  40. Księżopolski, K.; Drygas, M.; Pronińska, K.; Nurzyńska, I. The economic effects of new patterns of energy efficiency and heat sources in rural single-family houses in Poland. Energies 2020, 13, 6358. [Google Scholar] [CrossRef]
  41. Ministerstwo Rozwoju, Pracy i Technologii. Energetyka Prosumencka i Rozproszona. (Prosumer and Distributed Energy). Available online: https://www.gov.pl/web/rozwoj-praca-technologia/energetyka-prosumencka-i-rozproszona (accessed on 12 November 2020).
  42. Gramwzielone.pl. The Number of Prosumers in Poland Exceeds 357,000. It’s Time for Energy Storage. Available online: https://www.gramwzielone.pl/energia-sloneczna/104268/liczba-prosumentow-w-polsce-przekracza-357-tys-pora-na-magazyny-energii (accessed on 28 December 2020).
  43. Polish Press Agency. Polish Solar Farm Has Exceeded the Level of 3400 MW of Capacity. Available online: https://www.wnp.pl/budownictwo/polska-fotowoltaika-przekroczyla-poziom-3400-mw-mocy,440020.html (accessed on 28 December 2020).
  44. Olczak, P.; Kryzia, D.; Matuszewska, D.; Kuta, M. “My Electricity” program effectiveness supporting the development of PV installation in Poland. Energies 2021, 14, 231. [Google Scholar] [CrossRef]
  45. SEJM. Ustawa z Dnia 4 Października 2018 r. o Spółdzielniach Rolników; (Act of October 4, 2018 on Farmers’ Cooperatives); (Dz. U. Poz. 2073); SEJM: Warsaw, Poland, 2018. [Google Scholar]
  46. Marks-Bielska, R.; Bielski, S.; Pik, K.; Kurowska, K. The importance of renewable energy sources in Poland’s energy mix. Energies 2020, 13, 4624. [Google Scholar] [CrossRef]
  47. Tesvolt—Battery Storage Systems. Available online: https://www.tesvolt.com/en/ (accessed on 21 April 2021).
  48. Williams, H.P. Model Building in Mathematical Programming, 5th ed.; Wiley: Hoboken, NJ, USA, 2013; ISBN 978-1-118-44333-0. [Google Scholar]
  49. Tomlin, J.A. Special ordered sets and an application to gas supply operations planning. Math. Program. 1988, 42, 69–84. [Google Scholar] [CrossRef]
  50. GLPK (GNU Linear Programming Kit). Available online: https://www.gnu.org/software/glpk/ (accessed on 18 November 2020).
  51. COIN-OR/CBC. Available online: https://projects.coin-or.org/Cbc (accessed on 18 November 2020).
  52. Gitizadeh, M.; Fakharzadegan, H. Battery capacity determination with respect to optimized energy dispatch schedule in grid-connected photovoltaic (PV) systems. Energy 2014, 65, 665–674. [Google Scholar] [CrossRef]
  53. Ke, B.-R.; Ku, T.-T.; Ke, Y.-L.; Chuang, C.-Y.; Chen, H.-Z. Sizing the battery energy storage system on a university campus with prediction of load and photovoltaic generation. IEEE Trans. Ind. Appl. 2015, 52, 1136–1147. [Google Scholar] [CrossRef]
  54. Chen, P.; Liu, M.; Chen, C.; Shang, X. A battery management strategy in microgrid for personalized customer requirements. Energy 2019, 189, 116245. [Google Scholar] [CrossRef]
  55. Luger, G.F. Artificial Intelligence: Structures and Strategies for Complex Problem Solving, 6th ed.; Pearson Addison-Wesley: Boston, MA, USA, 2009; ISBN 978-0-321-54589-3. [Google Scholar]
  56. The R Project for Statistical Computing. Available online: https://www.r-project.org/ (accessed on 20 April 2021).
  57. Maksymych, V.; Całus, D.; Ivashchyshyn, F.; Pidluzhna, A.; Chabecki, P.; Shvets, R. Quantum energy accumulation in semiconductor <ionic liquid > layered clathrates. Appl. Nanosci. 2021. [Google Scholar] [CrossRef]
  58. Grygorchak, I.; Całus, D.; Pidluzhna, A.; Ivashchyshyn, F.; Hryhorchak, O.; Chabecki, P.; Shvets, R. Thermogalvanic and local field effects in SiO2 structure. Appl. Nanosci. 2020, 10, 4725–4731. [Google Scholar] [CrossRef]
  59. Colasant, A.; D’Adamo, I.; Marone, P. Nudging for the increased adoption of solar energy? Evidence from a survey in Italy. Energy Res. Soc. Sci. 2021, 74, 101978. [Google Scholar] [CrossRef]
Figure 1. Simulation results of the optimization effect of the sum of energy taken from the network and energy remaining in the virtual network deposit after the billing period, depending on the battery capacity for individual energy cooperatives.
Energies 14 03226 g001
Figure 2. Simulation results of a battery addition effect depending on the battery capacity for reference energy cooperatives. Also seen are measurement points and an average value for cooperatives with a specified number of members.
Energies 14 03226 g002
Figure 3. Simulation results of the optimization effect of the sum of energy taken from the network and energy remaining in the network deposit after the billing period, depending on the battery capacity and the number of cooperative members. Also seen is the average effect and battery capacity per average effect.
Energies 14 03226 g003
Figure 4. Decision tree quantifying the magnitude of potential benefits after the implementation of a battery corresponding to the “half effect” relative to the distribution of sources and number of members.
Energies 14 03226 g004
Figure 5. Simulation results in the regression-tree modeling without a variable specifying the number of cooperative members.
Energies 14 03226 g005
Table 1. Characteristics of each analytical scenario.
Cooperative 1Cooperative 2Cooperative 3Cooperative 4Cooperative 5
VoivodshipŚląskieMałopolskieMałopolskieŚląskieŚląskie
Number of members of the cooperative1115111516
Profile of agricultural activity 1 and number of members (pcs)01.46.Z; (3) 01.13.Z; (3)01.11.Z; (4)01.11.Z; (2)01.13.Z; (4) 01.19.Z; (1)01.11.Z; (2)
01.47.Z; (5)01.13.Z; (1)01.13.Z; (2)01.43.Z; (1)01.13.Z; (2)
01.19.Z; (4) 01.47.Z; (3)01.19.Z; (1) 01.47.Z; (1)01.47.Z; (3)01.19.Z; (3)
01.50.Z; (3)01.50.Z; (5)01.49.Z; (1)01.47.Z; (6)
01.50.Z; (5)01.50.Z; (2)
01.62.Z; (1)
Voltage (LV/MV) and number of members (pcs)LV (4)LV (10)LV (10)LV (8)LV (9)
MV (7)MV (5)MV (1)MV (7)MV (7)
Tariff group 2 and number of members (pcs)C11 (2)C11 (4)C11 (4)C11 (6)C11 (6)
C12 a (1)C12 b (1)C12 a (1)C21 (2)C21 (2)
C22 b (1)C21 (3)C12 b (2)B21 (3)C22 a (1)
B21 (1)C22 a (2)C22 a (2)B23 (4)B21 (1)
B23 (6)B21 (3)C22 b (1) B22 (2)
B23 (2)B11 (1) B23 (4)
Consumption [MWh/year]:9757355976233835922
Total520361
min88723769214328
average3574104531212581542
max
Capacity 3 [kW]:3810181555016352605
PVPP:200200200200200
SWPP3750500010001250
WPP40080004001600
BMPP6002000400600
BGPP
Energy storage 4 [MWh]
min_s 2505050250250
expert level 4660182460812162432
optimal level 600090030060006500
max_s 25,00025,000350015,50015,000
Production [MWh/year]8760351575036356255
1 Agricultural activity profile: 01.11.Z—growing of cereals, leguminous crops and oil plants for seeds, except rice; 01.13.Z—growing of vegetables and melons, roots and tubers; 01.19.Z—growing of other non-perennial crops; 01.43.Z—raising of horses and other equines; 01.46.Z—raising of pigs; 01.47.Z—raising of poultry; 01.50.Z—mixed farming; 01.62.Z—support activities for farm-animal production.2 Tariff group: The first character (C, B) refers to the tariff type, C—low voltage, B—medium voltage; the second character (1 or 2) refers to the installed capacity level, 1—up to 40 kW, 2—above 40 kW; the third character (1, 2 or 3) indicates the number of time zones; the fourth character, if any, indicates how to account for the time zones, a—division into peak and off-peak, b—division into day and night. 3 PVPP—photovoltaic power plant; SHPP—small hydro power plant; WPP—wind power plant; BMPP—biomass power plant; BGPP—biogas power plant. 4 min_s—minimum energy storage capacity; expert level—energy storage capacity —expert recommendation; optimal level—energy storage capacity — optimal value; max_s—maximum energy storage capacity.
Table 2. Energy storage parameters.
Designation of the CooperativeStorage TypeCapacity [kWh]Charging Power [kW]Discharging Power [kW]
CP1TPS-E4660540675
CP2TS HV 701824360450
CP3TS HV 70608120150
CP4TS HV 701216240300
CP5TS HV 702432480600
Table 3. Volumetric effects of real energy storage in cooperatives (CP).
CP1CP2CP3CP4CP5
Consumption [MWh/year]:9757355976233835922
Capacity [kW]:3810181555016352605
Production [MWh/year]:8760351575036356255
Energy storage—optimal level of capacity [kWh]600090030060006500
Volumetric storage effect [MWh/year]
Reduction in energy consumption from the network348.741.323.33138.6
Reduction in energy consumption subject to the capacity fee151.123.713.820.619.7
Increase in self-consumption522.461.63546.157
in relation to consumption [%]
Reduction in energy consumption from the network3.61.23.10.90.7
Reduction in energy consumption subject to the capacity fee1.50.71.80.60.3
Increase in self-consumption5.41.74.61.41
Table 4. Volumetric effects of real energy storage in reference cooperatives with varying numbers of members (Mxx).
CP_M10CP_M20CP_M30CP_M40CP_M50
Consumption [MWh/year]:
Min51225674561844011,810
Average27926248974313,44016,569
Max621711,22416,92018,92020,122
Reduction in energy consumption from the network [MWh/year]:23.92452.665.761.7
Min36.3122188.7314.8411.5
Average114.2301.3425.1519.4556.8
Max
In relation to consumption [%]:4.70.91.20.80.5
Min1.321.92.32.5
Average1.82.72.52.72.8
Max
Reduction in energy consumption subject to the capacity fee [MWh/year]:12.513.922.943.935
Min16.745.770.4123.7172.1
Average30.2128147.2176.5277.3
Max
In relation to consumption [%]:2.40.50.50.50.3
Min0.60.70.70.91
Average0.51.10.90.91.4
Max
Increase in self-consumption [MWh/year]:38.9112.2444.5545.8694.9
Min54.4182.4282.4470.3615.2
Average85.6260.9288.6250.3337.6
Max
In relation to consumption [%]:7.64.49.76.55.9
Min1.92.92.93.53.7
Average1.42.31.71.31.7
Max
Table 5. Decision-tree rules quantifying the magnitude of potential benefits after the implementation of a battery corresponding to the “half effect” relative to the distribution of sources and number of members. The color scheme used in column two corresponds to that of the leaves in Figure 4.
NumOfMembers < 35 and NumOfMembers ≥ 25 and
OtherEnergySourceThanWindAndPV ≥ 25.5
Weak Impact
NumOfMembers < 35 and NumOfMembers < 25 and
WindAndPV < 69.5 and NumOfMembers ≥15
Weak Impact
NumOfMembers ≥ 35 and OtherEnergySourceThanWindAndPV > = 27.5Weak Impact
NumOfMembers < 35 and NumOfMembers ≥ 25 and
OtherEnergySourceThanWindAndPV < 25.5 and WindAndPV ≥ 78.5
Medium Impact
NumOfMembers ≥35 and OtherEnergySourceThanWindAndPV < 27.5Medium Impact
NumOfMembers < 35 and NumOfMembers < 25 and
WindAndPV < 69.5 and NumOfMembers < 15
Strong Impact
NumOfMembers < 35 and NumOfMembers ≥ 25 and
OtherEnergySourceThanWindAndPV < 25.5 and WindAndPV < 78.5
Strong Impact
NumOfMembers < 35 and NumOfMembers < 25 and
WindAndPV ≥ 69.5
Strong Impact
Publisher’s Note: MDPI stays neutral with regard to jurisdictional claims in published maps and institutional affiliations.

