
Decision-Making Processes in Controlling Exposure to Sunlight Supported by Simulation Tools: A Case Study in Warm Weather

 , and
, and
Abstract
1. Introduction
1.1. Controlling Sunlight
1.2. Evaluation of Comfort
2. Objectives
3. Bibliography Analysis
4. Methodology
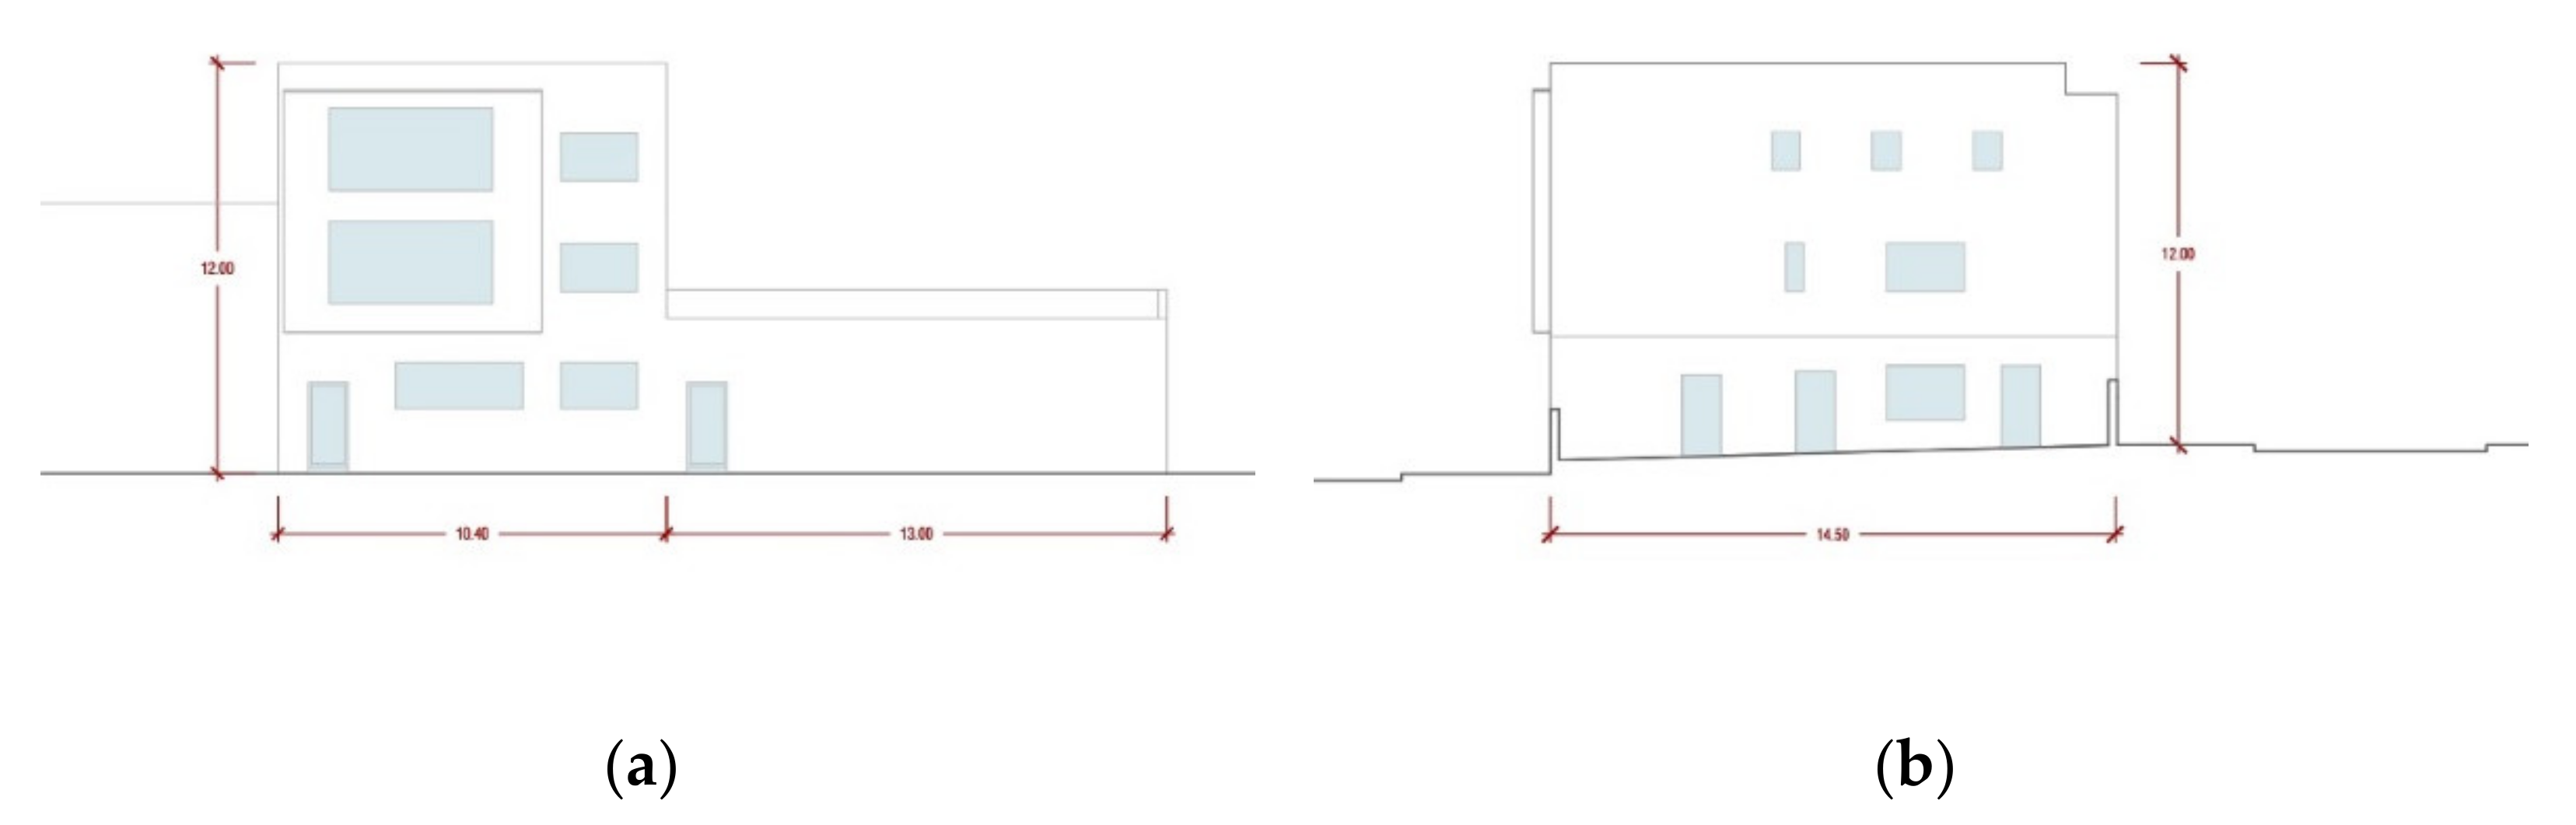
4.1. Definition of the Case Study
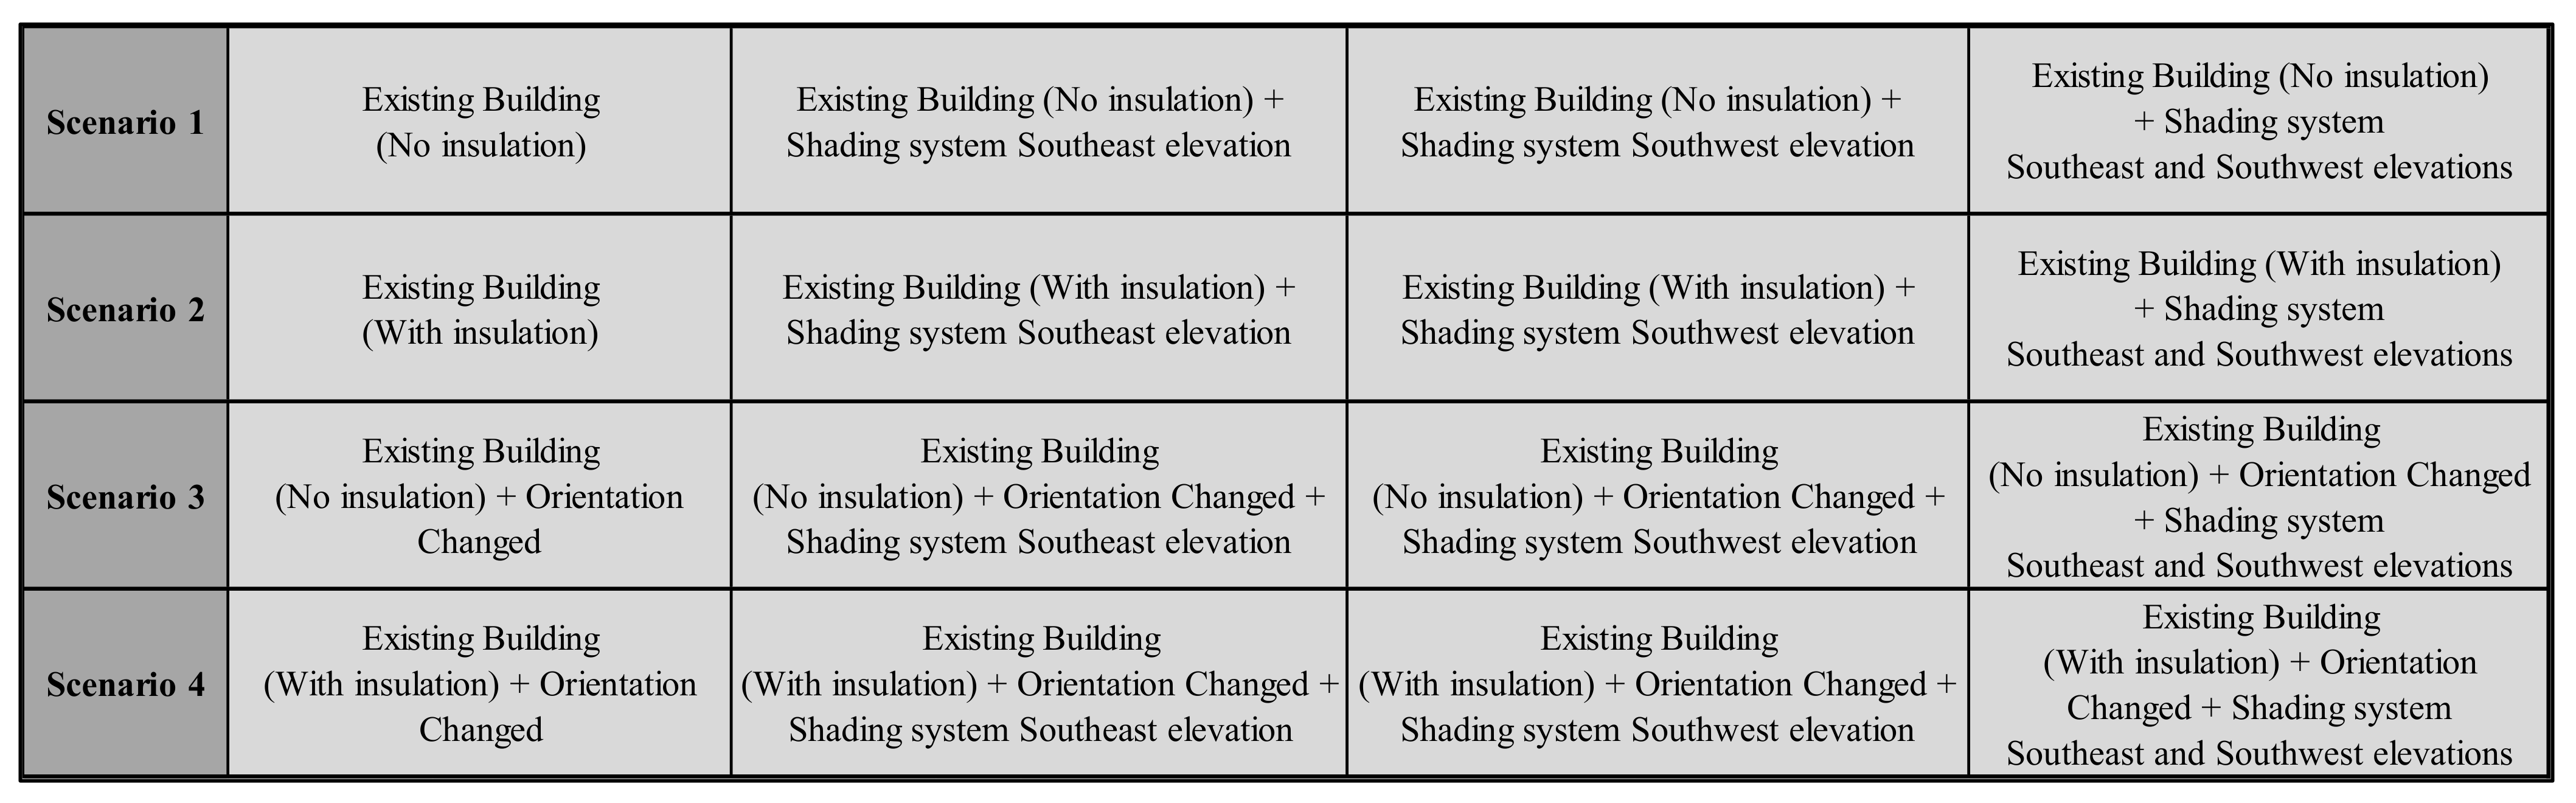
4.2. Definition of the Simulated Scenarios
4.3. Energy Performance: Simulation Tools and Comfort Assesments
4.4. Comparison with Real Energy Performance and Illumination Data
5. Research
5.1. Calculations of the Building Energy Performance
5.1.1. Calculations with HULC
5.1.2. Calculations with CYPETHERM HE Plus
5.1.3. Calculations with DesignBuilder
5.2. Comfort Calculation
5.2.1. Fanger´s Method and Givoni’s Bioclimatic Charts
5.2.2. Illuminance Caused by Daylight
5.3. Real Data Analysis
6. Discussion of Results and Validation of Results
7. Conclusions
Author Contributions
Funding
Acknowledgments
Conflicts of Interest
References
- Munarim, U.; Ghisi, E. Environmental feasibility of heritage buildings rehabilitation. Renew. Sustain. Energy Rev. 2016, 58, 235–249. [Google Scholar] [CrossRef]
- Bajenaru, N.; Damian, A.; Frunzulica, R. Evaluation of the Energy Performance for a NZEB Office Building under Specific Climatic Conditions. Energy Procedia 2016, 85, 26–34. [Google Scholar] [CrossRef]
- Sigmund, Z. Sustainability in architectural heritage: Review of policies and practices. Organ. Technol. Manag. Constr. Int. J. 2016, 8, 1411–1421. [Google Scholar] [CrossRef][Green Version]
- Domínguez Martín, A. Concerted Action Energy Performance of Buildings. EPBD implementation in Spain. 2018. Available online: https://epbd-ca.eu/wp-content/uploads/2018/08/CA-EPBD-IV-Spain-2018.pdf (accessed on 2 May 2021).
- Andaloro, A.P.; Salomone, R.; Ioppolo, G.; Andaloro, L. Energy Certification of Buildings: A Comparative Analysis of Progress towards Implementation in European Countries. Energy Policy 2010, 38, 5840–5866. [Google Scholar] [CrossRef]
- Krygiel, E.; Nies, B. Green BIM: Successful Sustainable Design with Building Information Modeling; John Wiley & Sons: Hoboken, NJ, USA, 2008. [Google Scholar]
- European Parliament; Council of the European Union. EPBD European Directive for Energy Performance in Buildings; European Parliament: Strasbourg, France; Council of the European Union: Strasbourg, France, 2002. [Google Scholar]
- Government of Spain. CTE—Technical Building Code—(CTE- Código Técnico de la Edificación); Government of Spain: Madrid, Spain, 2006.
- Government of Spain. Law 38/1999 of 5 November, on Building Management Regulation—(Ley 38/1999, de 5 de Noviembre, de Ordenación de la Edificación); Government of Spain: Madrid, Spain, 1999.
- Government of Spain. CTE—Technical Building Code—Basic Document, Energy Saving DB-HE—(Código Técnico de La Edificación—Documento Básico Ahorro de Energía DB-HE); Government of Spain: Madrid, Spain, 2019.
- Ministry of the Presidency and Territorial Administrations. Royal Decree 564/2017, of 2 June, amending Royal Decree 235/2013, of 5 April, Approving the Basic Procedure for the Certification of Energy Efficiency in Buildings. (Real Decreto 564/2017, de 2 de Junio, Por El Que Se Modifica El Real Decreto 235/2013, de 5 de Abril, Por El Que Se Aprueba El Procedimiento Básico Para La Certificación de La Eficiencia Energética de Los Edificios); Ministry of the Presidency and Territorial Administrations: Madrid, Spain, 2017.
- International Standard Organization. EN ISO 13790. Energy Performance of Buildings—Calculation of Energy Use for Space Heating and Cooling; International Standard Organization: Geneva, Switzerland, 2011. [Google Scholar]
- García Casals, X. Analysis of building energy regulation and certification in Europe: Their role, limitations and differences. Energy Build. 2006, 38, 381–392. [Google Scholar] [CrossRef]
- Government of Spain. Royal Decree 235/2013, of 5 April, Approving the Basic Procedure for the Certification of the Energy Performance of Buildings—(Real Decreto 235/2013, de 5 de Abril, por el Que se Aprueba el Procedimiento Básico para la Certificación de la Eficiencia Energética de los Edificios); Government of Spain: Madrid, Spain, 2013.
- García Casals, X. Issues of Variable References Certification and Energy Regulation of Buildings (Problemática de Las Referencias Variables Certificación y Regulación Energética de Edificios). Era Sol. Energías Renov. 2009, 148, 46–56. [Google Scholar]
- Aguilar Sánchez, A.P. Comparative Study between the Energy Certification Programs Unified Tool Lider Calender and Cypetherm HE Plus Using Real Data from a Tertiary Building; Polytechnic University of Valencia: Valencia, Spain, 2020. [Google Scholar]
- Bamdad, K.; Cholette, M.E.; Omrani, S.; Bell, J. Future Energy-Optimised Buildings—Addressing the Impact of Climate Change on Buildings. Energy Build. 2021, 231, 110610. [Google Scholar] [CrossRef]
- Rodrigues, E.; Fernandes, M.S. Overheating risk in Mediterranean residential buildings: Comparison of current and future climate scenarios. Appl. Energy 2020, 259, 114110. [Google Scholar] [CrossRef]
- Darula, S.; Christoffersen, J.; Malikova, M. Sunlight and Insolation of Building Interiors. Energy Procedia 2015, 78, 1245–1250. [Google Scholar] [CrossRef]
- Blanco, J.M.; Buruaga, A.; Rojí, E.; Cuadrado, J.; Pelaz, B. Energy Assessment and Optimization of Perforated Metal Sheet Double Skin Façades through Design Builder; A Case Study in Spain. Energy Build. 2016, 111, 326–336. [Google Scholar] [CrossRef]
- Givoni, B. Man, Climate, and Architecture; Elsevier Publishing Company Limited: London, UK, 1969. [Google Scholar]
- Fanger, P.O. Calculation of Thermal Comfort: Introduction of a Basic Comfort Equation. ASHRAE Trans. 1967, 73, 10007970240. [Google Scholar]
- Olgyay, V.W.; Olgyay, A.; Lyndon, D.; Reynolds, J.; Yeang, K. Design with Climate; Princeton University Press: Princeton, NJ, USA, 2015. [Google Scholar] [CrossRef]
- ASHRAE. Standard 55—Thermal Environmental Conditions for Human Occupancy; American Society of Heating, Refrigerating and Air-Conditioning Engineers (ASHRAE): Atlanta, GA, USA, 2020. [Google Scholar]
- International Standard Organization. EN 16798-1:2020 Energy Performance of Buildings. Ventilation for Buildings (Eficiencia Energética de Los Edificios. Ventilación de Los Edificios); International Standard Organization: Geneva, Switzerland, 2020. [Google Scholar]
- D’Ambrosio Alfano, F.R.; Olesen, B.W.; Palella, B.I.; Riccio, G. Thermal comfort: Design and assessment for energy saving. Energy Build. 2014, 81, 326–336. [Google Scholar] [CrossRef]
- Escandón, R.; Sendra, J.J.; Suarez, R. Energy and climate simulation in the Upper Lawn Pavilion, an experimental laboratory in the architecture of the Smithsons. Build. Simul. 2014, 8, 99–109. [Google Scholar] [CrossRef]
- Ochoa, C.; Capeluto, I.G. Advice tool for early design stages of intelligent facades based on energy and visual comfort approach. Energy Build. 2009, 41, 480–488. [Google Scholar] [CrossRef]
- Pedrini, A.; Szokolay, S. The Architects Approach to the Project of Energy Efficient Office Buildings in Warm Climate and the Importance of Design methods. In Proceedings of the 9th International IBPSA Conference, Montreal, Canada, 15–18 August 2005; International Building Performance Simulation Association: Bruges, Belgium, 2005; pp. 937–944. [Google Scholar]
- Erhorn, H.; Mroz, T.; Mørck, O.; Schmidt, F.; Schoff, L.; Thomsen, K.E. The Energy Concept Adviser—A tool to improve energy efficiency in educational buildings. Energy Build. 2008, 40, 419–428. [Google Scholar] [CrossRef]
- Baloch, A.A.; Shaikh, P.H.; Shaikh, F.; Leghari, Z.H.; Mirjat, N.H.; Uqaili, M.A. Simulation Tools Application for Artificial Lighting in Buildings. Renew. Sustain. Energy Rev. 2018, 82, 3007–3026. [Google Scholar] [CrossRef]
- Tartarini, F.; Schiavon, S.; Cheung, T.; Hoyt, T. CBE Thermal Comfort Tool: Online tool for thermal comfort calculations and visualizations. SoftwareX 2020, 12, 100563. [Google Scholar] [CrossRef]
- Anand, P.; Deb, C.; Alur, R. A Simplified Tool for Building Layout Design Based on Thermal Comfort Simulations. Front. Archit. Res. 2017, 6, 218–230. [Google Scholar] [CrossRef]
- Raviselvam, S.; Al-Megren, S.; Keane, K.; Hölttä-Otto, K.; Wood, K.L.; Yang, M.C. Simulation Tools for Inclusive Design Solutions. In Universal Design 2021: From Special to Mainstream Solutions; IOS Press: Amsterdam, The Netherlands, 2021; pp. 210–218. [Google Scholar] [CrossRef]
- Martinaitis, V.; Zavadskas, E.K.; Motuziene, V.; Vilutienė, T. Importance of occupancy information when simulating energy demand of energy efficient house: A case study. Energy Build. 2015, 101, 64–75. [Google Scholar] [CrossRef]
- Raji, B.; Tenpierik, M.J.; Dobbelsteen, A.V.D. Early-Stage Design Considerations for the Energy-Efficiency of High-Rise Office Buildings. Sustainability 2017, 9, 623. [Google Scholar] [CrossRef]
- Mahdavi, A.; Doppelbauer, E.-M. A performance comparison of passive and low-energy buildings. Energy Build. 2010, 42, 1314–1319. [Google Scholar] [CrossRef]
- Gaujena, B.; Borodinecs, A.; Zemitis, J.; Prozuments, A. Influence of Building Envelope Thermal Mass on Heating Design Temperature. IOP Conf. Ser. Mater. Sci. Eng. 2015, 96, 012031. [Google Scholar] [CrossRef]
- Zabalza Bribián, I.; Aranda Usón, A.; Scarpellini, S. Life cycle assessment in buildings: State-of-the-art and simplified LCA methodology as a complement for building certification. Build. Environ. 2009, 44, 2510–2520. [Google Scholar] [CrossRef]
- Annebicque, D.; Robert, B.; Henry, J.-F.; Randrianalisoa, J.; Popa, C. A Multidisciplanary Approach to Improve Energetic Performance in Smart Buildings. IFAC PapersOnLine 2016, 49, 313–317. [Google Scholar] [CrossRef]
- Khemlani, L. GENWIN: A generative computer tool for window design in energy-conscious architecture. Build. Environ. 1995, 30, 73–81. [Google Scholar] [CrossRef]
- Hensen, J.L.M.; Lamberts, R. (Eds.) Building Performance Simulation for Design and Operation; Routledge: London, UK; Routledge: New York, NY, USA, 2019. [Google Scholar]
- Kim, J.B.; Jeong, W.; Clayton, M.J.; Haberl, J.S.; Yan, W. Developing a physical BIM library for building thermal energy simulation. Autom. Constr. 2015, 50, 16–28. [Google Scholar] [CrossRef]
- Yi, Y.K.; Malkawi, A.M. Optimizing building form for energy performance based on hierarchical geometry relation. Autom. Constr. 2009, 18, 825–833. [Google Scholar] [CrossRef]
- Evangelisti, L.; Battista, G.; Guattari, C.; Basilicata, C.; Vollaro, R.D.L. Influence of the Thermal Inertia in the European Simplified Procedures for the Assessment of Buildings’ Energy Performance. Sustainability 2014, 6, 4514–4524. [Google Scholar] [CrossRef]
- Domínguez, S.; Sendra, J.J.; León, A.L.; Esquivias, P.M. Towards Energy Demand Reduction in Social Housing Buildings: Envelope System Optimization Strategies. Energies 2012, 5, 2263–2287. [Google Scholar] [CrossRef]
- Konis, K.; Gamas, A.; Kensek, K. Passive performance and building form: An optimization framework for early-stage design support. Sol. Energy 2016, 125, 161–179. [Google Scholar] [CrossRef]
- Lou, J.; Xu, J.; Wang, K. Study on Construction Quality Control of Urban Complex Project Based on BIM. Procedia Eng. 2017, 174, 668–676. [Google Scholar] [CrossRef]
- Tronchin, L.; Fabbri, K. Energy performance building evaluation in Mediterranean countries: Comparison between software simulations and operating rating simulation. Energy Build. 2008, 40, 1176–1187. [Google Scholar] [CrossRef]
- Larsen, K.E.; Lattke, F.; Ott, S.; Winter, S. Surveying and digital workflow in energy performance retrofit projects using prefabricated elements. Autom. Constr. 2011, 20, 999–1011. [Google Scholar] [CrossRef]
- Wang, C.; Cho, Y.K.; Gai, M. As-Is 3D Thermal Modeling for Existing Building Envelopes Using a Hybrid LIDAR System. J. Comput. Civ. Eng. 2013, 27, 645–656. [Google Scholar] [CrossRef]
- Chua, K.J.; Chou, S. A performance-based method for energy efficiency improvement of buildings. Energy Convers. Manag. 2011, 52, 1829–1839. [Google Scholar] [CrossRef]
- Tian, Z.; Chen, W.; Tang, P.; Wang, J.; Shi, X. Building Energy Optimization Tools and Their Applicability in Architectural Conceptual Design Stage. Energy Procedia 2015, 78, 2572–2577. [Google Scholar] [CrossRef]
- Vangimalla, P.R.; Olbina, S.J.; Issa, R.R.; Hinze, J. Validation of Autodesk EcotectTM Accuracy for Thermal and Daylighting Simulations. In Proceedings of the 2011 Winter Simulation Conference, Phoenix, AZ, USA, 11–14 December 2011; IEEE: Toulouse, France, 2011; pp. 3383–3394. [Google Scholar] [CrossRef]
- Jalaei, F.; Jrade, A. Integrating Building Information Modeling (BIM) and Energy Analysis Tools with Green Building Certification System to Conceptually Design Sustainable Buildings. J. Inf. Technol. Constr. 2014, 19, 494–519. [Google Scholar] [CrossRef]
- Duarte, J.G.C.d.L.M.; Zemero, B.R.; de Souza, A.C.D.B.; Tostes, M.E.D.L.; Bezerra, U.H. Building Information Modeling Approach to Optimize Energy Efficiency in Educational Buildings. J. Build. Eng. 2021, 43, 102587. [Google Scholar] [CrossRef]
- Turner, W.J.; Kinnane, O.; Basu, B. Demand-side Characterization of the Smart City for Energy Modelling. Energy Procedia 2014, 62, 160–169. [Google Scholar] [CrossRef][Green Version]
- Natephra, W.; Yabuki, N.; Fukuda, T. Optimizing the evaluation of building envelope design for thermal performance using a BIM-based overall thermal transfer value calculation. Build. Environ. 2018, 136, 128–145. [Google Scholar] [CrossRef]
- El Sayary, S.; Omar, O. Designing a BIM energy-consumption template to calculate and achieve a net-zero-energy house. Sol. Energy 2021, 216, 315–320. [Google Scholar] [CrossRef]
- Peruzzi, L.; Salata, F.; Vollaro, R.D.L. The reliability of technological systems with high energy efficiency in residential buildings. Energy Build. 2014, 68, 19–24. [Google Scholar] [CrossRef]
- Pérez-Lombard, L.; Ortiz, J.; Pout, C. A review on buildings energy consumption information. Energy Build. 2008, 40, 394–398. [Google Scholar] [CrossRef]
- De Lieto Vollaro, R.; Guattari, C.; Evangelisti, L.; Battista, G.; Carnielo, E.; Gori, P. Building energy performance analysis: A case study. Energy Build. 2015, 87, 87–94. [Google Scholar] [CrossRef]
- Ham, Y.; Golparvar-Fard, M. Mapping actual thermal properties to building elements in gbXML-based BIM for reliable building energy performance modeling. Autom. Constr. 2015, 49, 214–224. [Google Scholar] [CrossRef]
- Motawa, I.; Carter, K. Sustainable BIM-based Evaluation of Buildings. Procedia Soc. Behav. Sci. 2013, 74, 419–428. [Google Scholar] [CrossRef]
- Pulselli, R.M.; Simoncini, E.; Marchettini, N. Energy and emergy based cost–benefit evaluation of building envelopes relative to geographical location and climate. Build. Environ. 2009, 44, 920–928. [Google Scholar] [CrossRef]
- Méndez Echenagucia, T.; Capozzoli, A.; Cascone, Y.; Sassone, M. The early design stage of a building envelope: Multi-objective search through heating, cooling and lighting energy performance analysis. Appl. Energy 2015, 154, 577–591. [Google Scholar] [CrossRef]
- Tzempelikos, A.; Athienitis, A.K. The impact of shading design and control on building cooling and lighting demand. Sol. Energy 2007, 81, 369–382. [Google Scholar] [CrossRef]
- Ne’Eman, E. Visual aspects of sunlight in buildings. Light. Res. Technol. 1974, 6, 159–164. [Google Scholar] [CrossRef]
- Soares, N.; Pereira, L.D.; Ferreira, J.; Conceição, P.; da Silva, P.P. Energy efficiency of higher education buildings: A case study. Int. J. Sustain. High. Educ. 2015, 16, 669–691. [Google Scholar] [CrossRef]
- Nabil, A.; Mardaljevic, J. Useful daylight illuminances: A replacement for daylight factors. Energy Build. 2006, 38, 905–913. [Google Scholar] [CrossRef]
- Papadakis, G.; Tsamis, P.; Kyritsis, S. An experimental investigation of the effect of shading with plants for solar control of buildings. Energy Build. 2001, 33, 831–836. [Google Scholar] [CrossRef]
- Alpuche, M.G.; Esaiy, V.; Ochoa, J.M.; Marincic, I.; Clemente, B. Influence of Vegetation and Solar Control Elements on Mechanically Retrofitted Buildings in Hot-Dry Climates; Universida de Sonora: Sonora, México, 2015. [Google Scholar]
- Wu, Y.; Kämpf, J.H.; Scartezzini, J.-L. Daylighting simulation for external Venetian blinds based on HDR sky luminance monitoring with matrix algebraic approach. Energy Procedia 2019, 158, 2677–2682. [Google Scholar] [CrossRef]
- Khamporn, N.; Chaiyapinunt, S. Effect of installing a venetian blind to a glass window on human thermal comfort. Build. Environ. 2014, 82, 713–725. [Google Scholar] [CrossRef]
- Elgheznawy, D.; Eltarabily, S. The impact of sun sail-shading strategy on the thermal comfort in school courtyards. Build. Environ. 2021, 202, 108046. [Google Scholar] [CrossRef]
- Pacheco-Torres, R.; Ordóñez, J.; Martínez, G. Energy efficient design of building: A review. Renew. Sustain. Energy Rev. 2012, 16, 3559–3573. [Google Scholar] [CrossRef]
- Liu, Y.; Liu, T.; Ye, S.; Liu, Y. Cost-benefit analysis for Energy Efficiency Retrofit of existing buildings: A case study in China. J. Clean. Prod. 2018, 177, 493–506. [Google Scholar] [CrossRef]
- Athienitis, A.K.; Tzempelikos, A. A Methodology for Simulation of Daylight Room Illuminance Distribution and Light Dimming for a Room with a Controlled Shading Device. Sol. Energy 2002, 72, 271–281. [Google Scholar] [CrossRef]
- Valladares-Rendón, L.; Schmid, G.; Lo, S.-L. Review on energy savings by solar control techniques and optimal building orientation for the strategic placement of façade shading systems. Energy Build. 2017, 140, 458–479. [Google Scholar] [CrossRef]
- Jain, N.; Burman, E.; Mumovic, D.; Davies, M.; Tindale, A. Comparative Analysis of Protocols Used in Measurement and Verification of Energy Performance: Dealing with Practical Issues of Data Availability and Granularity in a UK School Building. In Proceedings of the 2018 Building Simulation and Optimization Conference, Cambridge, UK, 11–12 September 2018; International Building Performance Simulation Association: Bruges, Belgium, 2018. [Google Scholar]
- Zhang, S.; Birru, D. An open-loop venetian blind control to avoid direct sunlight and enhance daylight utilization. Sol. Energy 2012, 86, 860–866. [Google Scholar] [CrossRef]
- Alwetaishi, M.; Al-Khatri, H.; Benjeddou, O.; Shamseldin, A.; Alsehli, M.; Alghamdi, S.; Shrahily, R. An Investigation of Shading Devices in a Hot Region: A Case Study in a School Building. Ain Shams Eng. J. 2021. [Google Scholar] [CrossRef]
- Marsh, A. Psychrometric Chart. Available online: http://andrewmarsh.com/software/psychro-chart-web/ (accessed on 10 June 2021).
- Diego-Mas, J.A. Thermal Comfort Evaluation Using Fanger’s Method (Evaluación Del Confort Térmico Con El Método de Fanger); Ergonautas, Unviersidad Politecnica de Valencia: Valencia, Spain, 2015. [Google Scholar]
- Ghose, A.; McLaren, S.; Dowdell, D.; Phipps, R. Environmental assessment of deep energy refurbishment for energy efficiency-case study of an office building in New Zealand. Build. Environ. 2017, 117, 274–287. [Google Scholar] [CrossRef]
- Azhar, S.; Brown, J. Bim for Sustainability Analyses. Int. J. Constr. Educ. Res. 2009, 5, 276–292. [Google Scholar] [CrossRef]
- Yılmaz, Z. Evaluation of energy efficient design strategies for different climatic zones: Comparison of thermal performance of buildings in temperate-humid and hot-dry climate. Energy Build. 2007, 39, 306–316. [Google Scholar] [CrossRef]


| Existing Building (kWh/m2 Year) | Shading System South-East Elevation | Shading System South-West Elevation | Shading System South-East + South-West Elevations | |||||
|---|---|---|---|---|---|---|---|---|
| Energy Need for Heating | Energy Need for Cooling | Heating (%) | Cooling (%) | Heating (%) | Cooling (%) | Heating (%) | Cooling (%) | |
| Scenario 1 (No insulation) | 39.13 | 30.46 | −4.14 | +4.40 | −17.58 | +21.41 | −20.85 | +25.34 |
| Scenario 2 (With insulation) | 9.95 | 34.89 | −45.33 | +13.38 | −56.68 | +30.87 | −73.77 | +36.46 |
| Scenario 3 (No insulation + Orientation Changed) | 44.06 | 25.65 | −2.11 | +4.91 | −5.63 | +10.49 | −7.85 | +15.13 |
| Scenario 4 (With insulation + Orientation Changed) | 14.79 | 25.39 | −5.81 | +7.76 | −15.15 | +16.31 | −21.77 | +23.71 |
| Existing Building (kWh/m2 Year) | Shading System South-East Elevation | Shading System South-West Elevation | Shading System South-East + South-West Elevations | |||||
|---|---|---|---|---|---|---|---|---|
| Energy Need for Heating | Energy Need for Cooling | Heating (%) | Cooling (%) | Heating (%) | Cooling (%) | Heating (%) | Cooling (%) | |
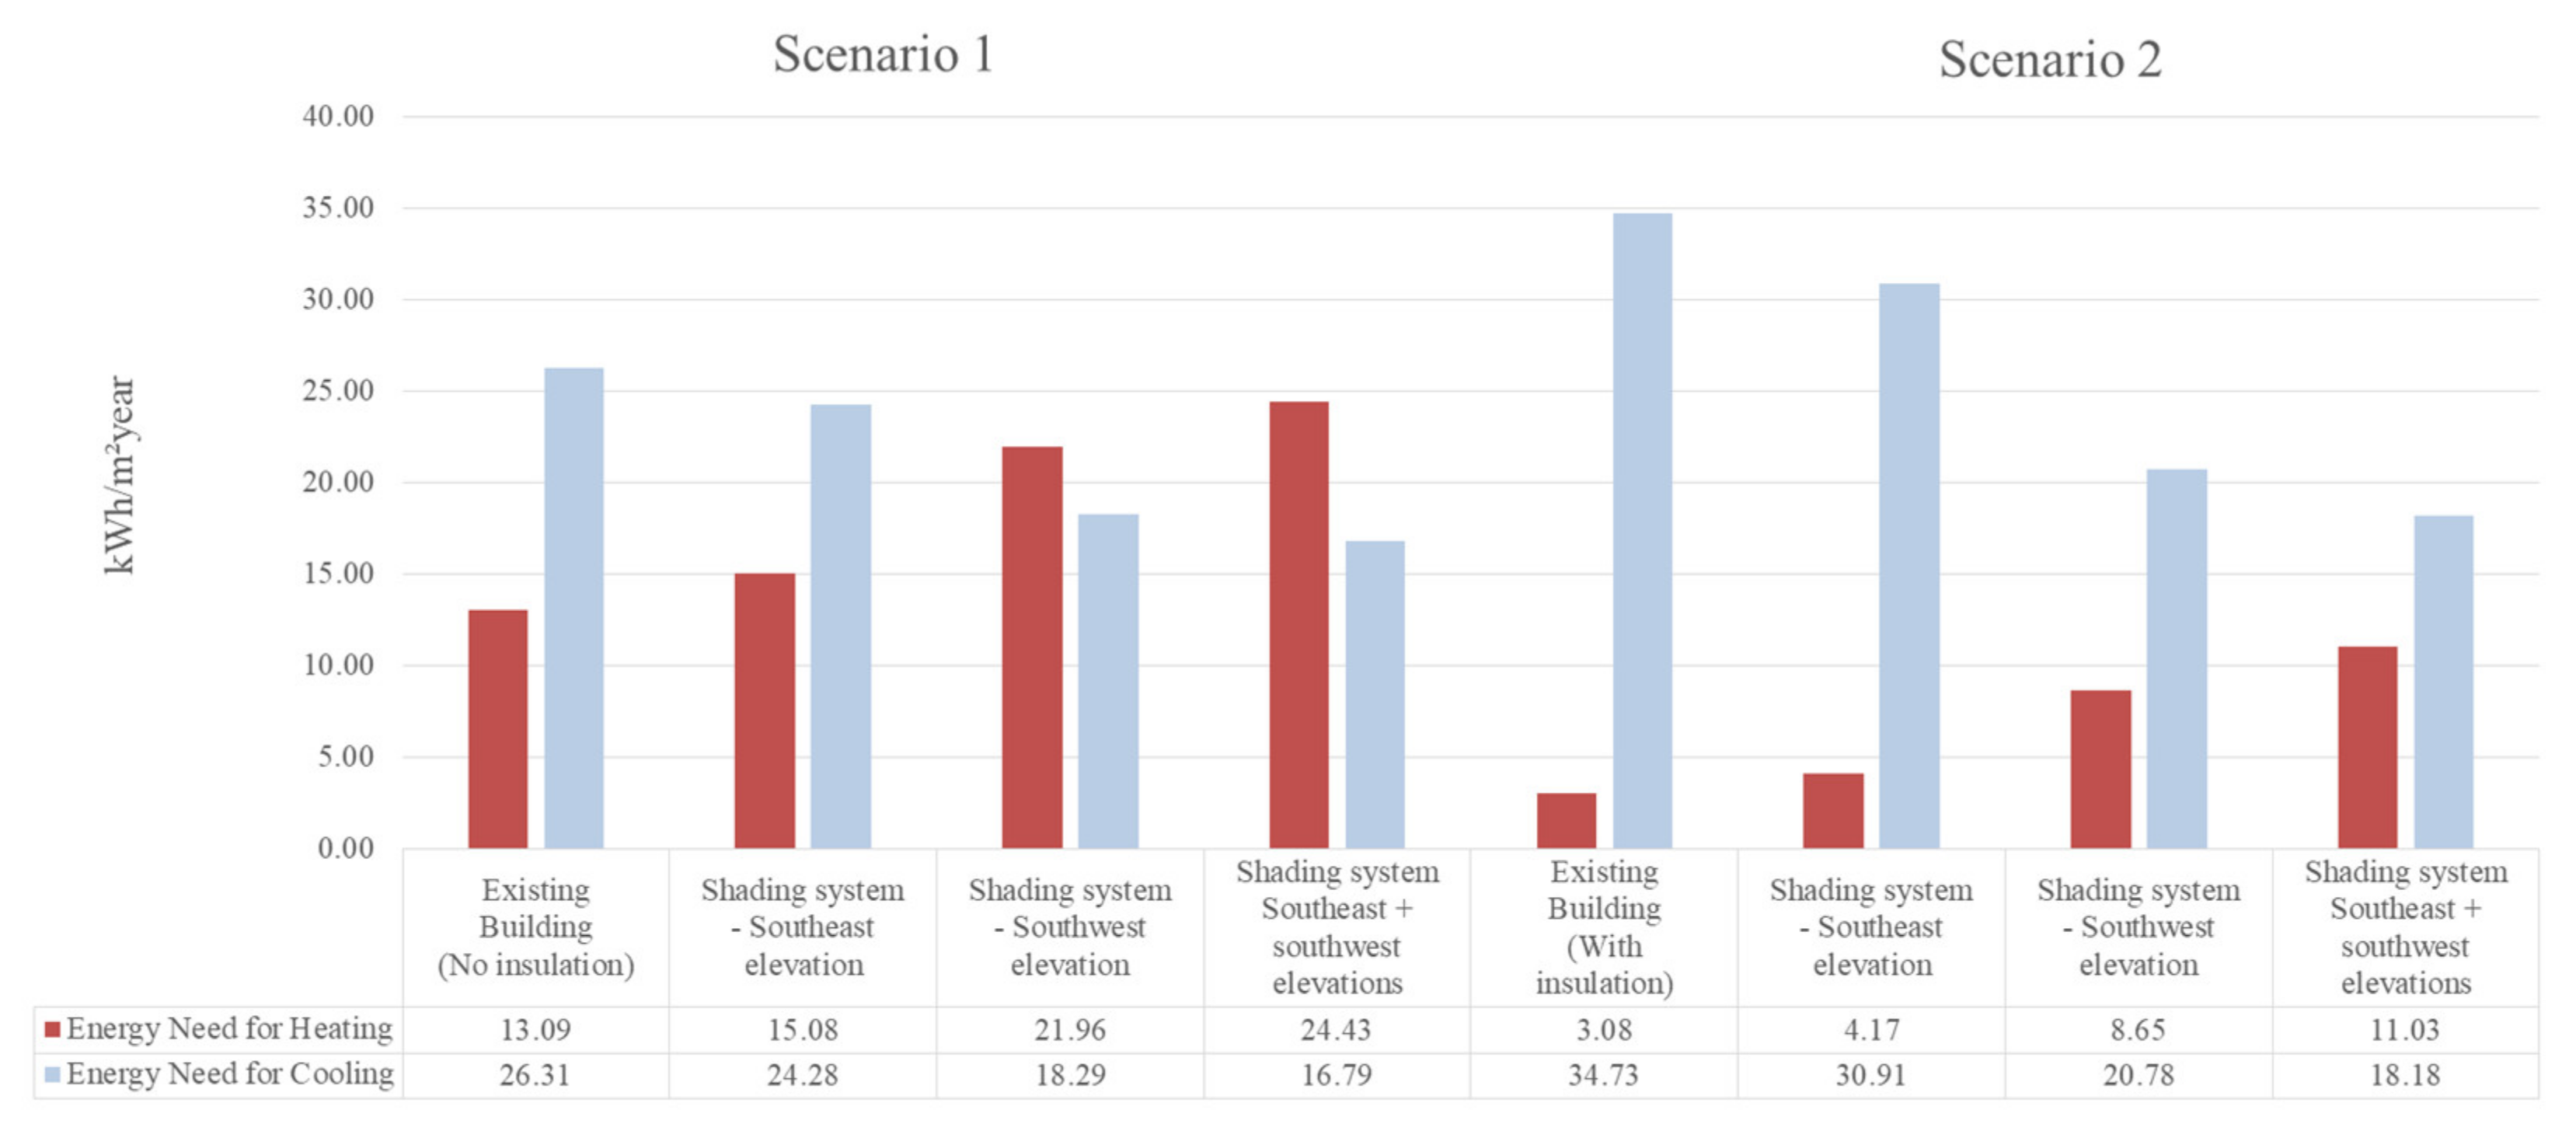
| Scenario 1 (No insulation) | 13.09 | 26.31 | −15.20 | +7.72 | −67.76 | +30.48 | −86.63 | +36.18 |
| Scenario 2 (With insulation) | 3.08 | 34.73 | −35.39 | +11.00 | −64.39 | +40.17 | −72.08 | +47.65 |
| Scenario 3 (No insulation + Orientation Changed) | 22.23 | 20.28 | −6.39 | +7.89 | −12.28 | +15.24 | −19.43 | +22.58 |
| Scenario 4 (With insulation + Orientation Changed) | 8.80 | 23.38 | −12.05 | +10.27 | −24.20 | +19.12 | −39.20 | +28.44 |
| Existing Building (kWh/m2 Year) | Shading System South-East Elevation | Shading System South-West Elevation | Shading System South-East + South-West Elevations | |||||
|---|---|---|---|---|---|---|---|---|
| Energy Need for Heating | Energy Need for Cooling | Heating (%) | Cooling (%) | Heating (%) | Cooling (%) | Heating (%) | Cooling (%) | |
| Group 1 (No insulation) | 104.74 | 124.37 | +4.46 | +3.92 | +23.25 | +21.66 | +27.65 | +25.61 |
| Group 2 (With insulation) | 110.11 | 101.49 | +2.30 | +1.37 | +9.27 | +4.96 | +11.59 | +6.35 |
| Group 3 (No insulation + Orientation Changed) | 122.36 | 106.04 | +4.41 | +3.79 | +19.36 | +9.03 | +12.32 | +9.22 |
| Group 4 (With insulation + Orientation Changed) | 98.61 | 88.74 | +1.73 | +0.99 | +2.62 | +1.14 | +4.33 | +2.13 |
| Real Data | Simulations: Existing Building + Shading System on South-East Elevation (No Insulation) | ||||
|---|---|---|---|---|---|
| Current State | Reform State: Shading System onSouth-East Elevation | HULC | CYPETHERM HE Plus | DesignBuilder | |
| January | 2100.00 | 1722.00 | 3201.92 | 4002.40 | 2116.11 |
| February | 2949.00 | 2506.65 | 3492.96 | 3040.20 | 1743.01 |
| March | 2146.00 | 1802.64 | 2255.27 | 3717.20 | 1424.62 |
| April | 1742.00 | 1411.02 | 2382.43 | 3706.70 | 1796.75 |
| May | 1280.00 | 1075.20 | 2451.84 | 2814.80 | 1884.68 |
| June | 1401.00 | 1162.83 | 1989.90 | 2156.50 | 1536.74 |
| July | 1333.00 | 1133.05 | 1365.73 | 1018.50 | 1625.41 |
| August | 489.00 | 405.87 | 617.52 | 916.10 | 69.79 |
| September | 1538.00 | 1307.30 | 1214.24 | 1296.50 | 1623.16 |
| October | 1638.00 | 1359.54 | 1947.14 | 2927.10 | 1627.28 |
| November | 2461.00 | 2091.85 | 1596.06 | 2072.80 | 1995.59 |
| December | 1652.00 | 1404.20 | 1879.45 | 3685.20 | 1746.52 |
| TOTAL | 20,729.00 | 17,382.15 | 24,394.45 | 31,353.90 | 19,189.66 |
| Existing Building (No Insulation) | Existing Building + Shading System on South-East Elevation (No Insulation) | |||||||
|---|---|---|---|---|---|---|---|---|
| Real Data | Simulations | Real Data | Simulations | |||||
| Illum. Min. | Illum. Max. | Average n° of Lux | Illum. Min. | Illum. Max. | Average n° of Lux | |||
| Autumn equinox | 1100.00 | 34.47 | 2896.21 | 1465.34 | 505.89 | 9.89 | 795.24 | 402.57 |
| Winter solstice | 942.10 | 35.56 | 2878.65 | 1457.11 | 194.21 | 9.11 | 677.73 | 343.42 |
| Spring equinox | 3999.00 | 35.2 | 2912.76 | 1473.98 | 499.90 | 10.02 | 922.55 | 466.29 |
| Summer solstice | 4058.90 | 87.47 | 2961.83 | 1524.65 | 505.89 | 26.49 | 1061.37 | 543.93 |
Publisher’s Note: MDPI stays neutral with regard to jurisdictional claims in published maps and institutional affiliations. |
© 2021 by the authors. Licensee MDPI, Basel, Switzerland. This article is an open access article distributed under the terms and conditions of the Creative Commons Attribution (CC BY) license (https://creativecommons.org/licenses/by/4.0/).
Share and Cite
Huskinson, M.; Galiano-Garrigós, A.; González-Avilés, Á.B.; Pérez-Millán, M.I. Decision-Making Processes in Controlling Exposure to Sunlight Supported by Simulation Tools: A Case Study in Warm Weather. Energies 2021, 14, 4100. https://doi.org/10.3390/en14144100
Huskinson M, Galiano-Garrigós A, González-Avilés ÁB, Pérez-Millán MI. Decision-Making Processes in Controlling Exposure to Sunlight Supported by Simulation Tools: A Case Study in Warm Weather. Energies. 2021; 14(14):4100. https://doi.org/10.3390/en14144100
Chicago/Turabian StyleHuskinson, Mariana, Antonio Galiano-Garrigós, Ángel Benigno González-Avilés, and M. Isabel Pérez-Millán. 2021. "Decision-Making Processes in Controlling Exposure to Sunlight Supported by Simulation Tools: A Case Study in Warm Weather" Energies 14, no. 14: 4100. https://doi.org/10.3390/en14144100
APA StyleHuskinson, M., Galiano-Garrigós, A., González-Avilés, Á. B., & Pérez-Millán, M. I. (2021). Decision-Making Processes in Controlling Exposure to Sunlight Supported by Simulation Tools: A Case Study in Warm Weather. Energies, 14(14), 4100. https://doi.org/10.3390/en14144100