
Evaluation of Integrated Concepts with CO2 for Heating, Cooling and Hot Water Production

Abstract
:1. Introduction
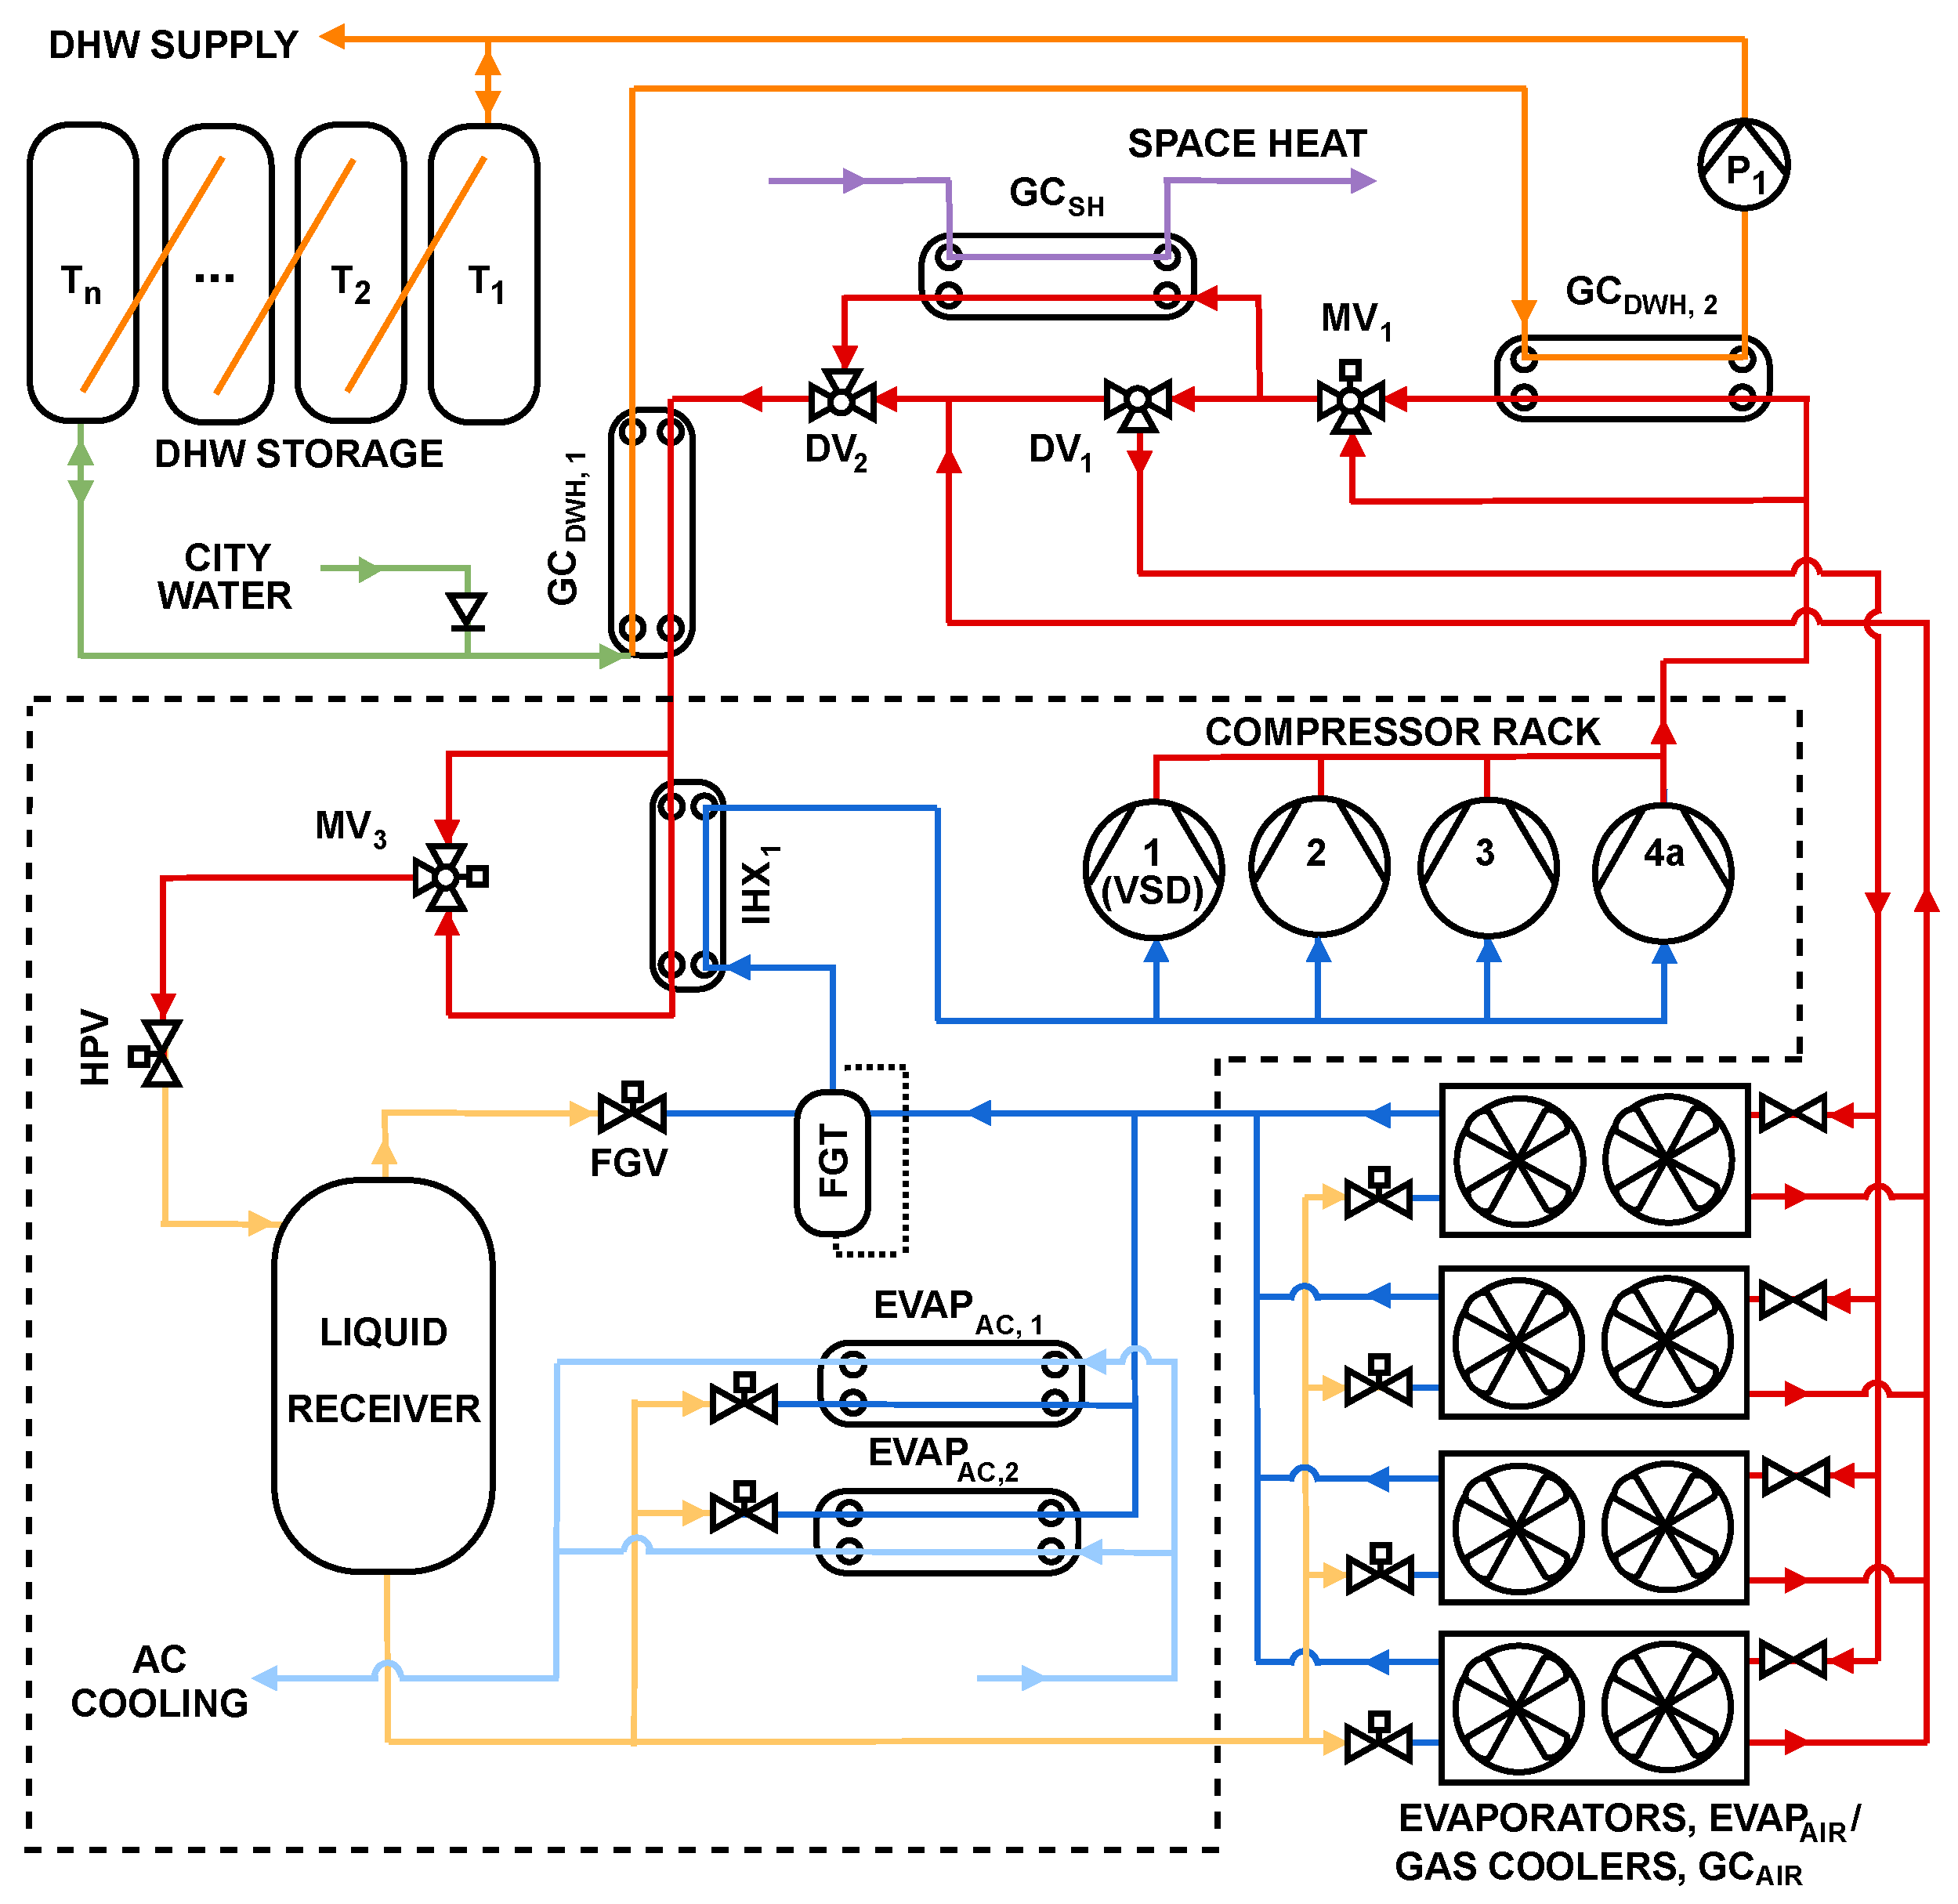
2. System Description
2.1. Design and Operation
2.2. Alternative System Configurations
2.3. Operational Modes
2.3.1. Winter Mode
2.3.2. Summer Mode
3. Methodology
3.1. Numerical Model
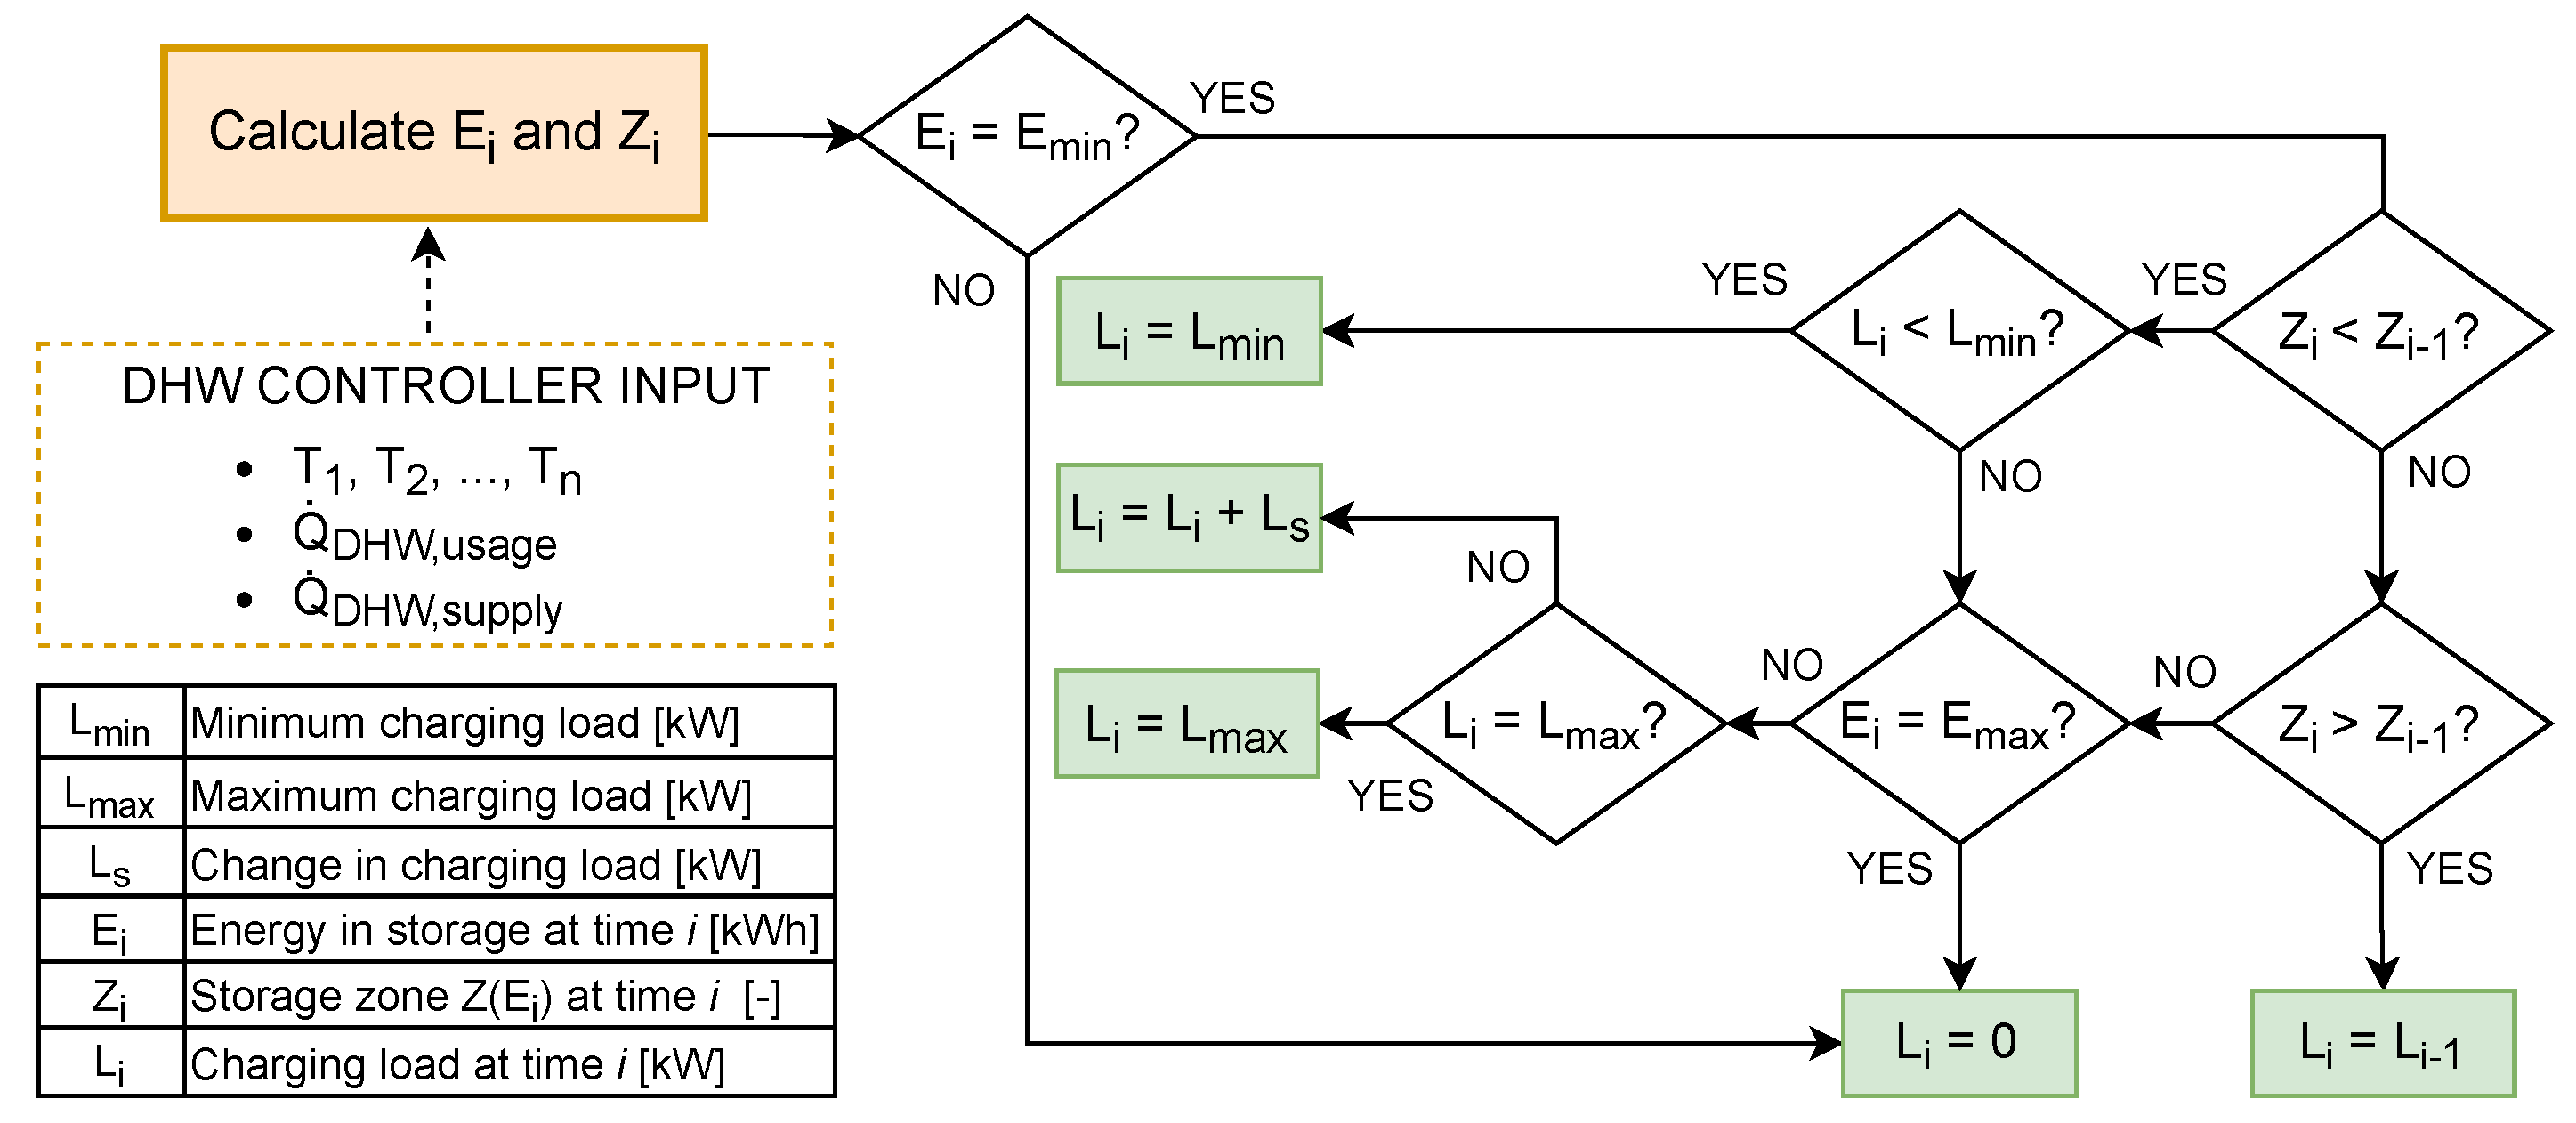
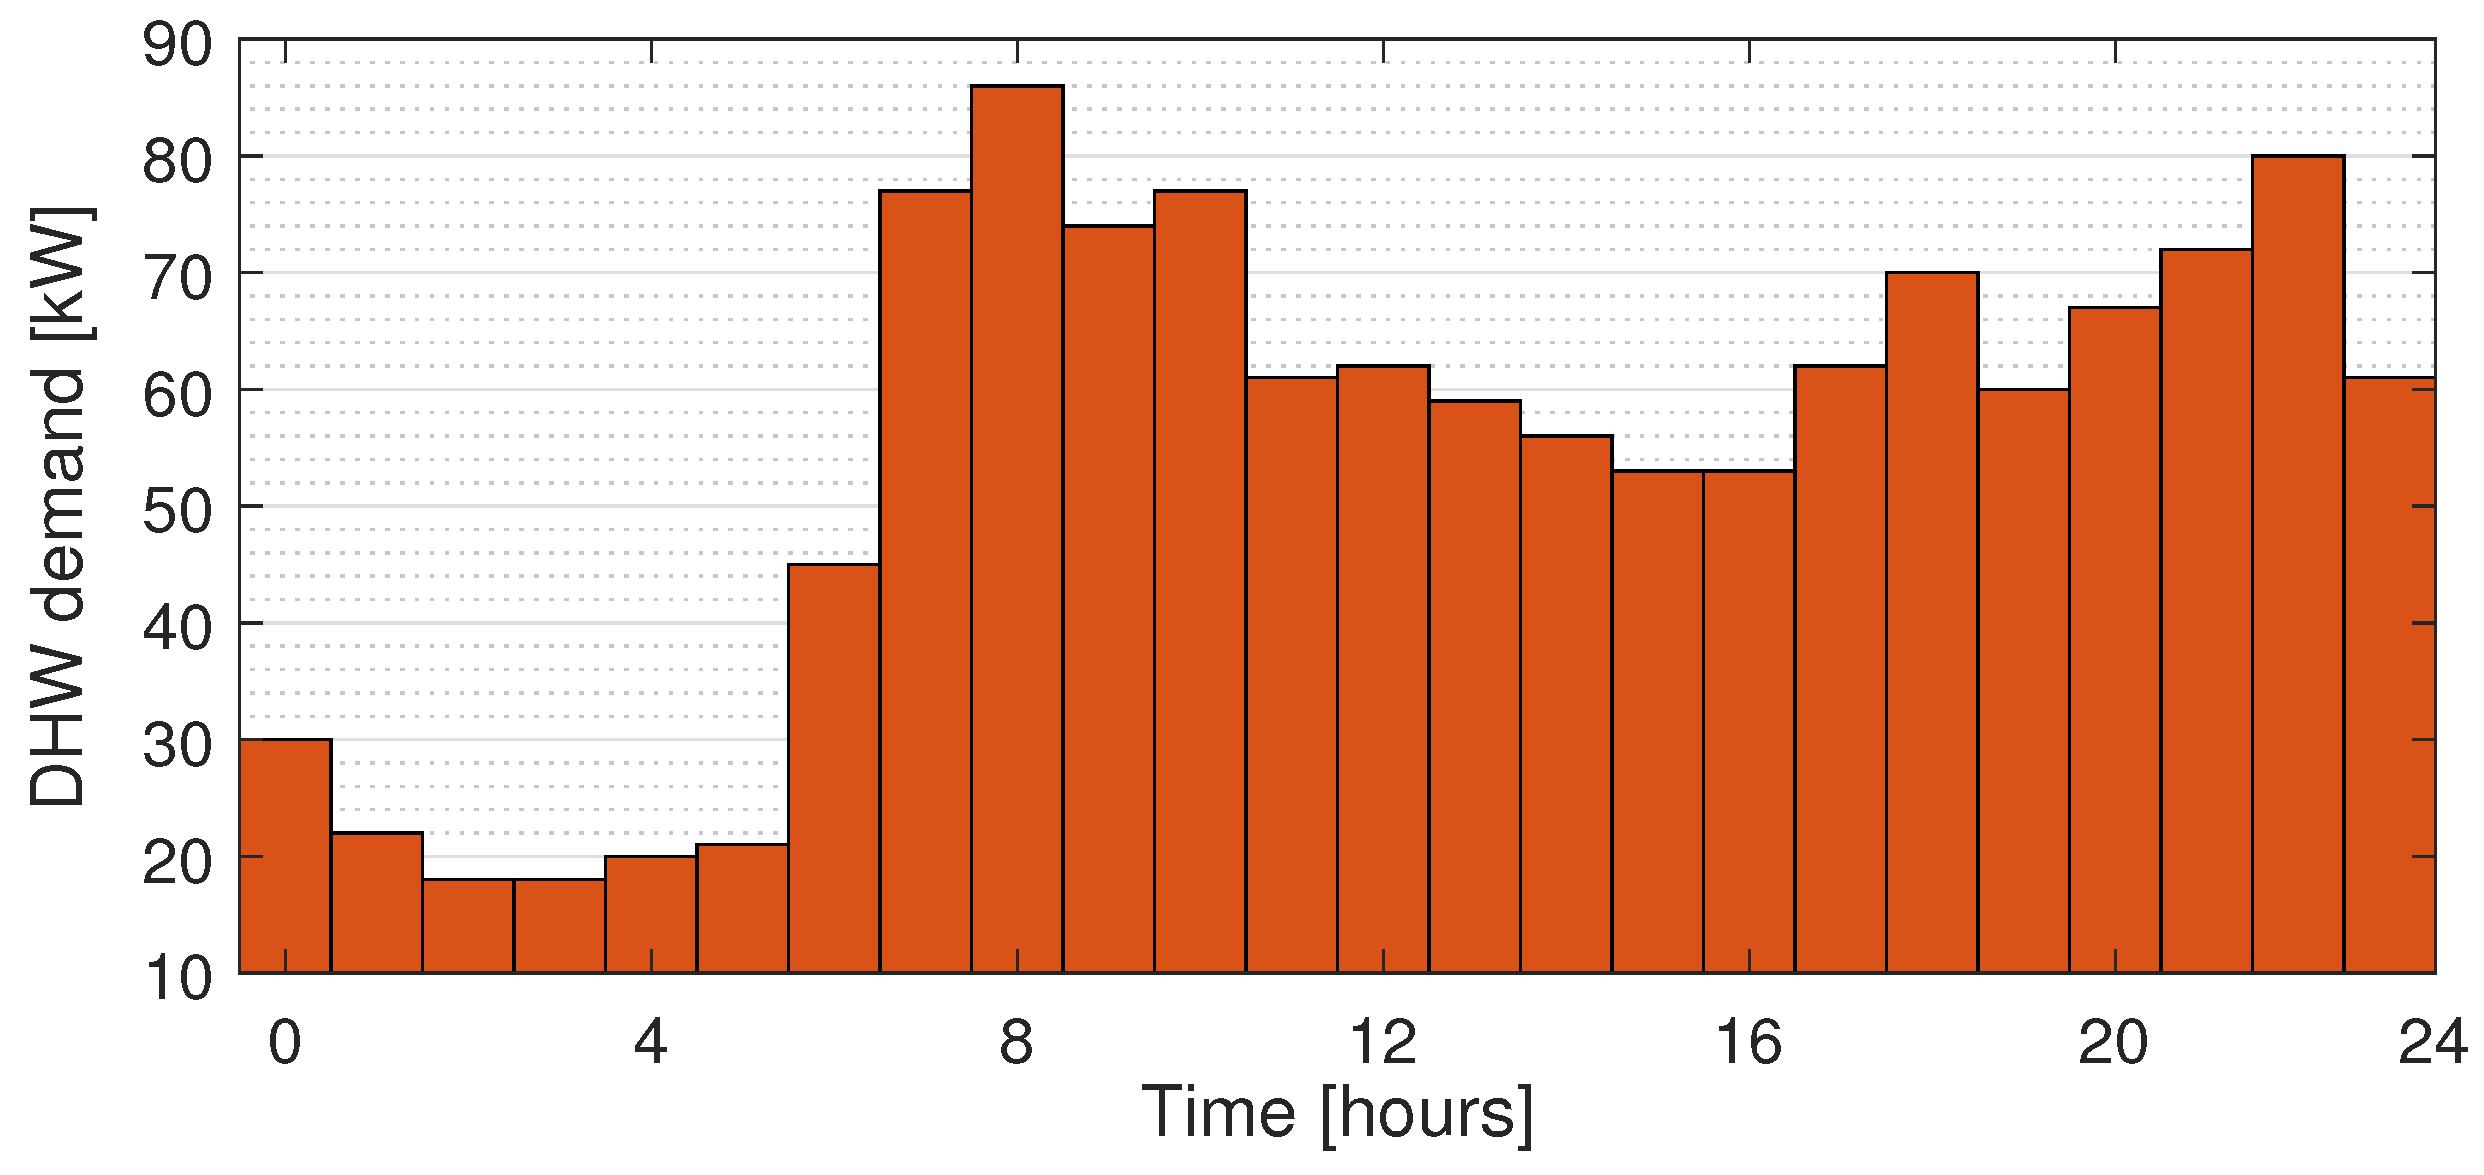
3.2. DHW Charging Strategy
3.2.1. Leveled Charging
3.2.2. Aggressive Charging
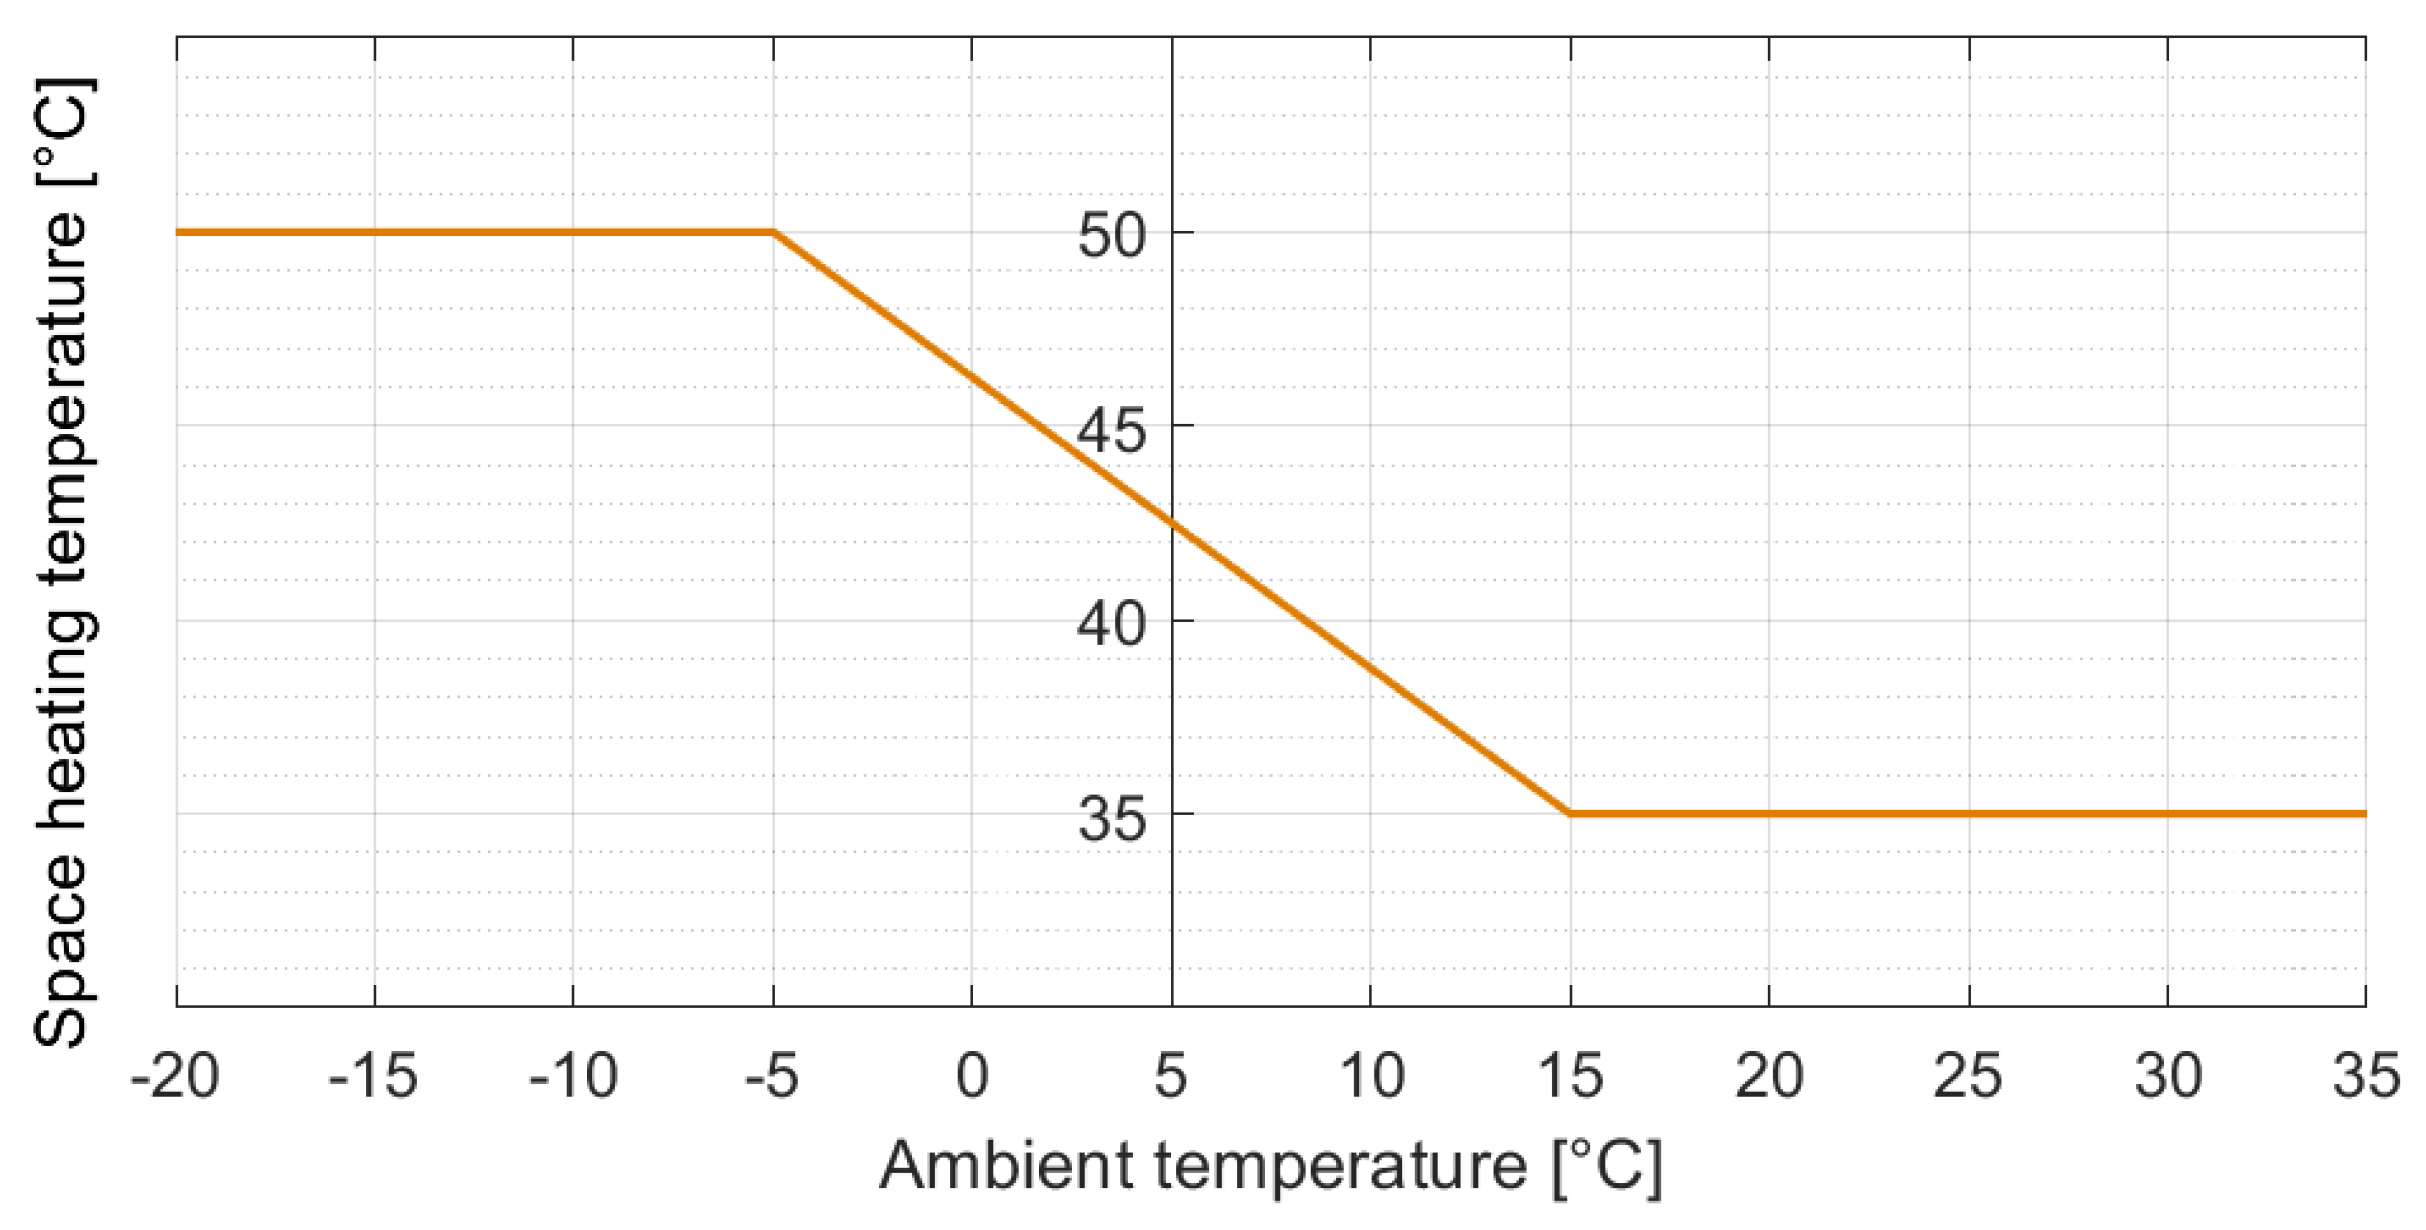
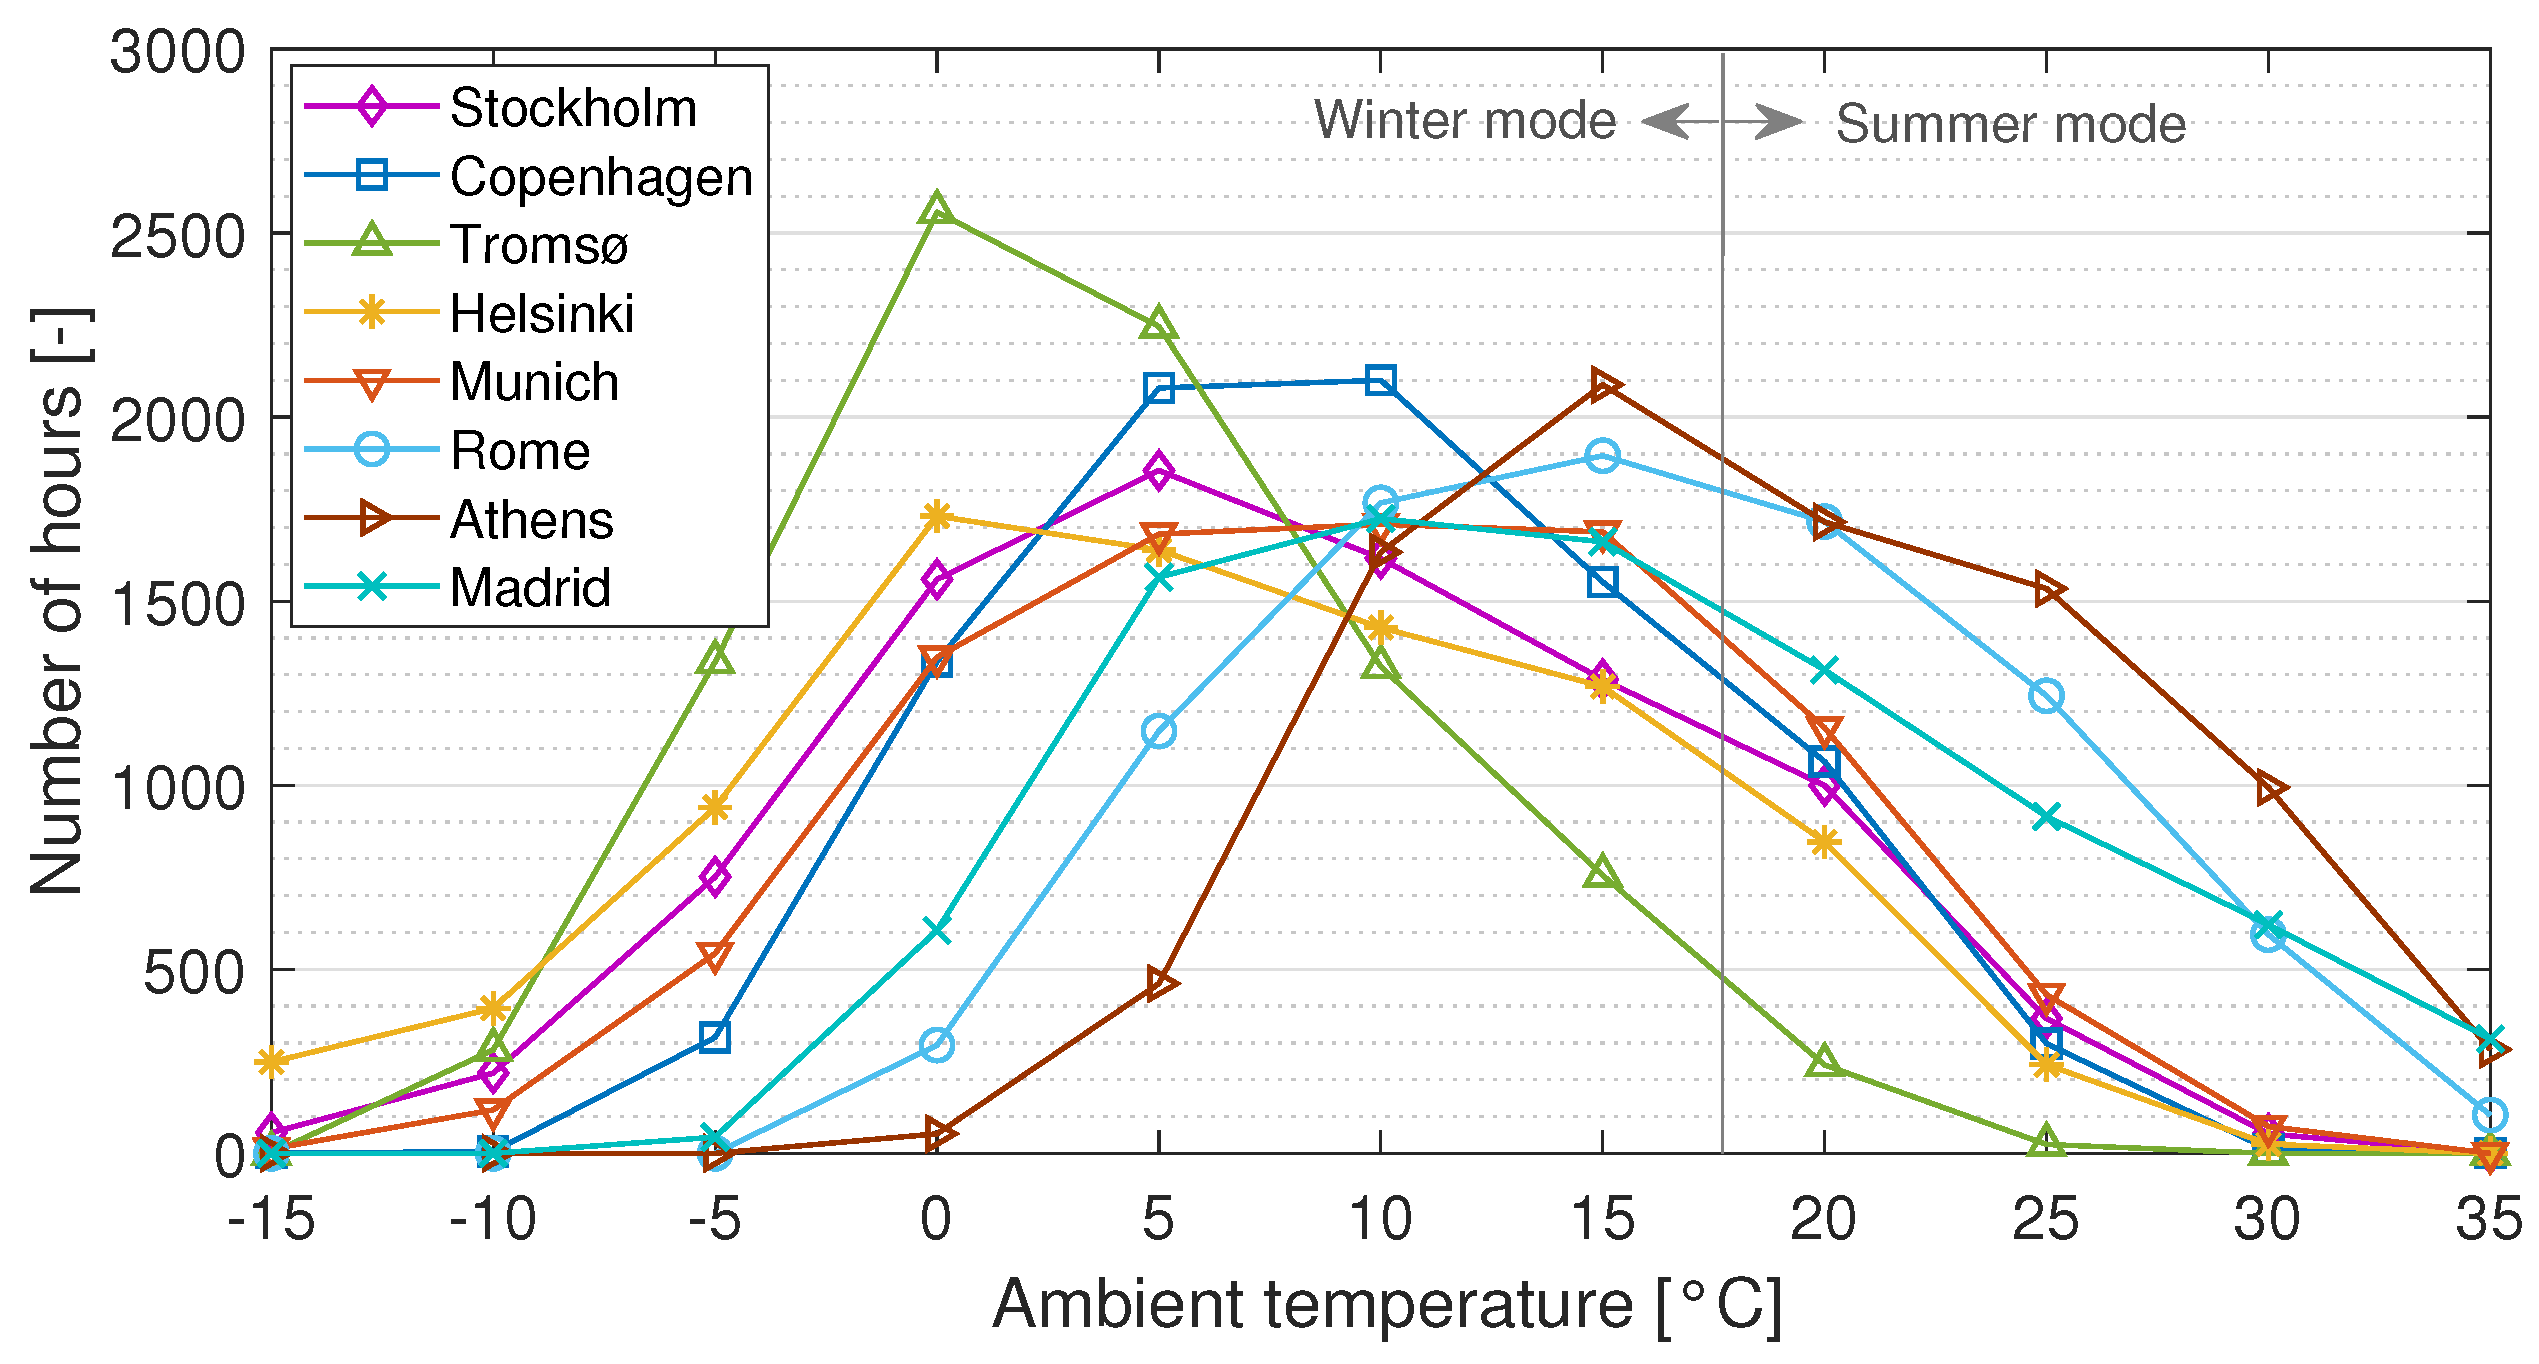
3.3. Operating Range
3.4. Performance Evaluation
3.5. Environmental Impact Evaluation
- GWP of CO2 = 1. GWP of existing R134a AC system = 1430 [47].
- Annual leakage rate is assumed 15% of refrigerant charge for all systems [48].
- The charge of the CO2 systems is assumed to be 300 kg. The charge of the R134a system is assumed to be 2 kg134a·kWAC,max−1 [48].
- Emissions associated with electricity generation at each location is given according to country values (2019) as Stockholm = 12, Copenhagen = 112, Tromsø = 19, Helsinki = 89, Munich = 350, Rome = 233, Athens = 606 and Madrid = 210 [49].
3.6. Economic Evaluation
4. Results and Discussion
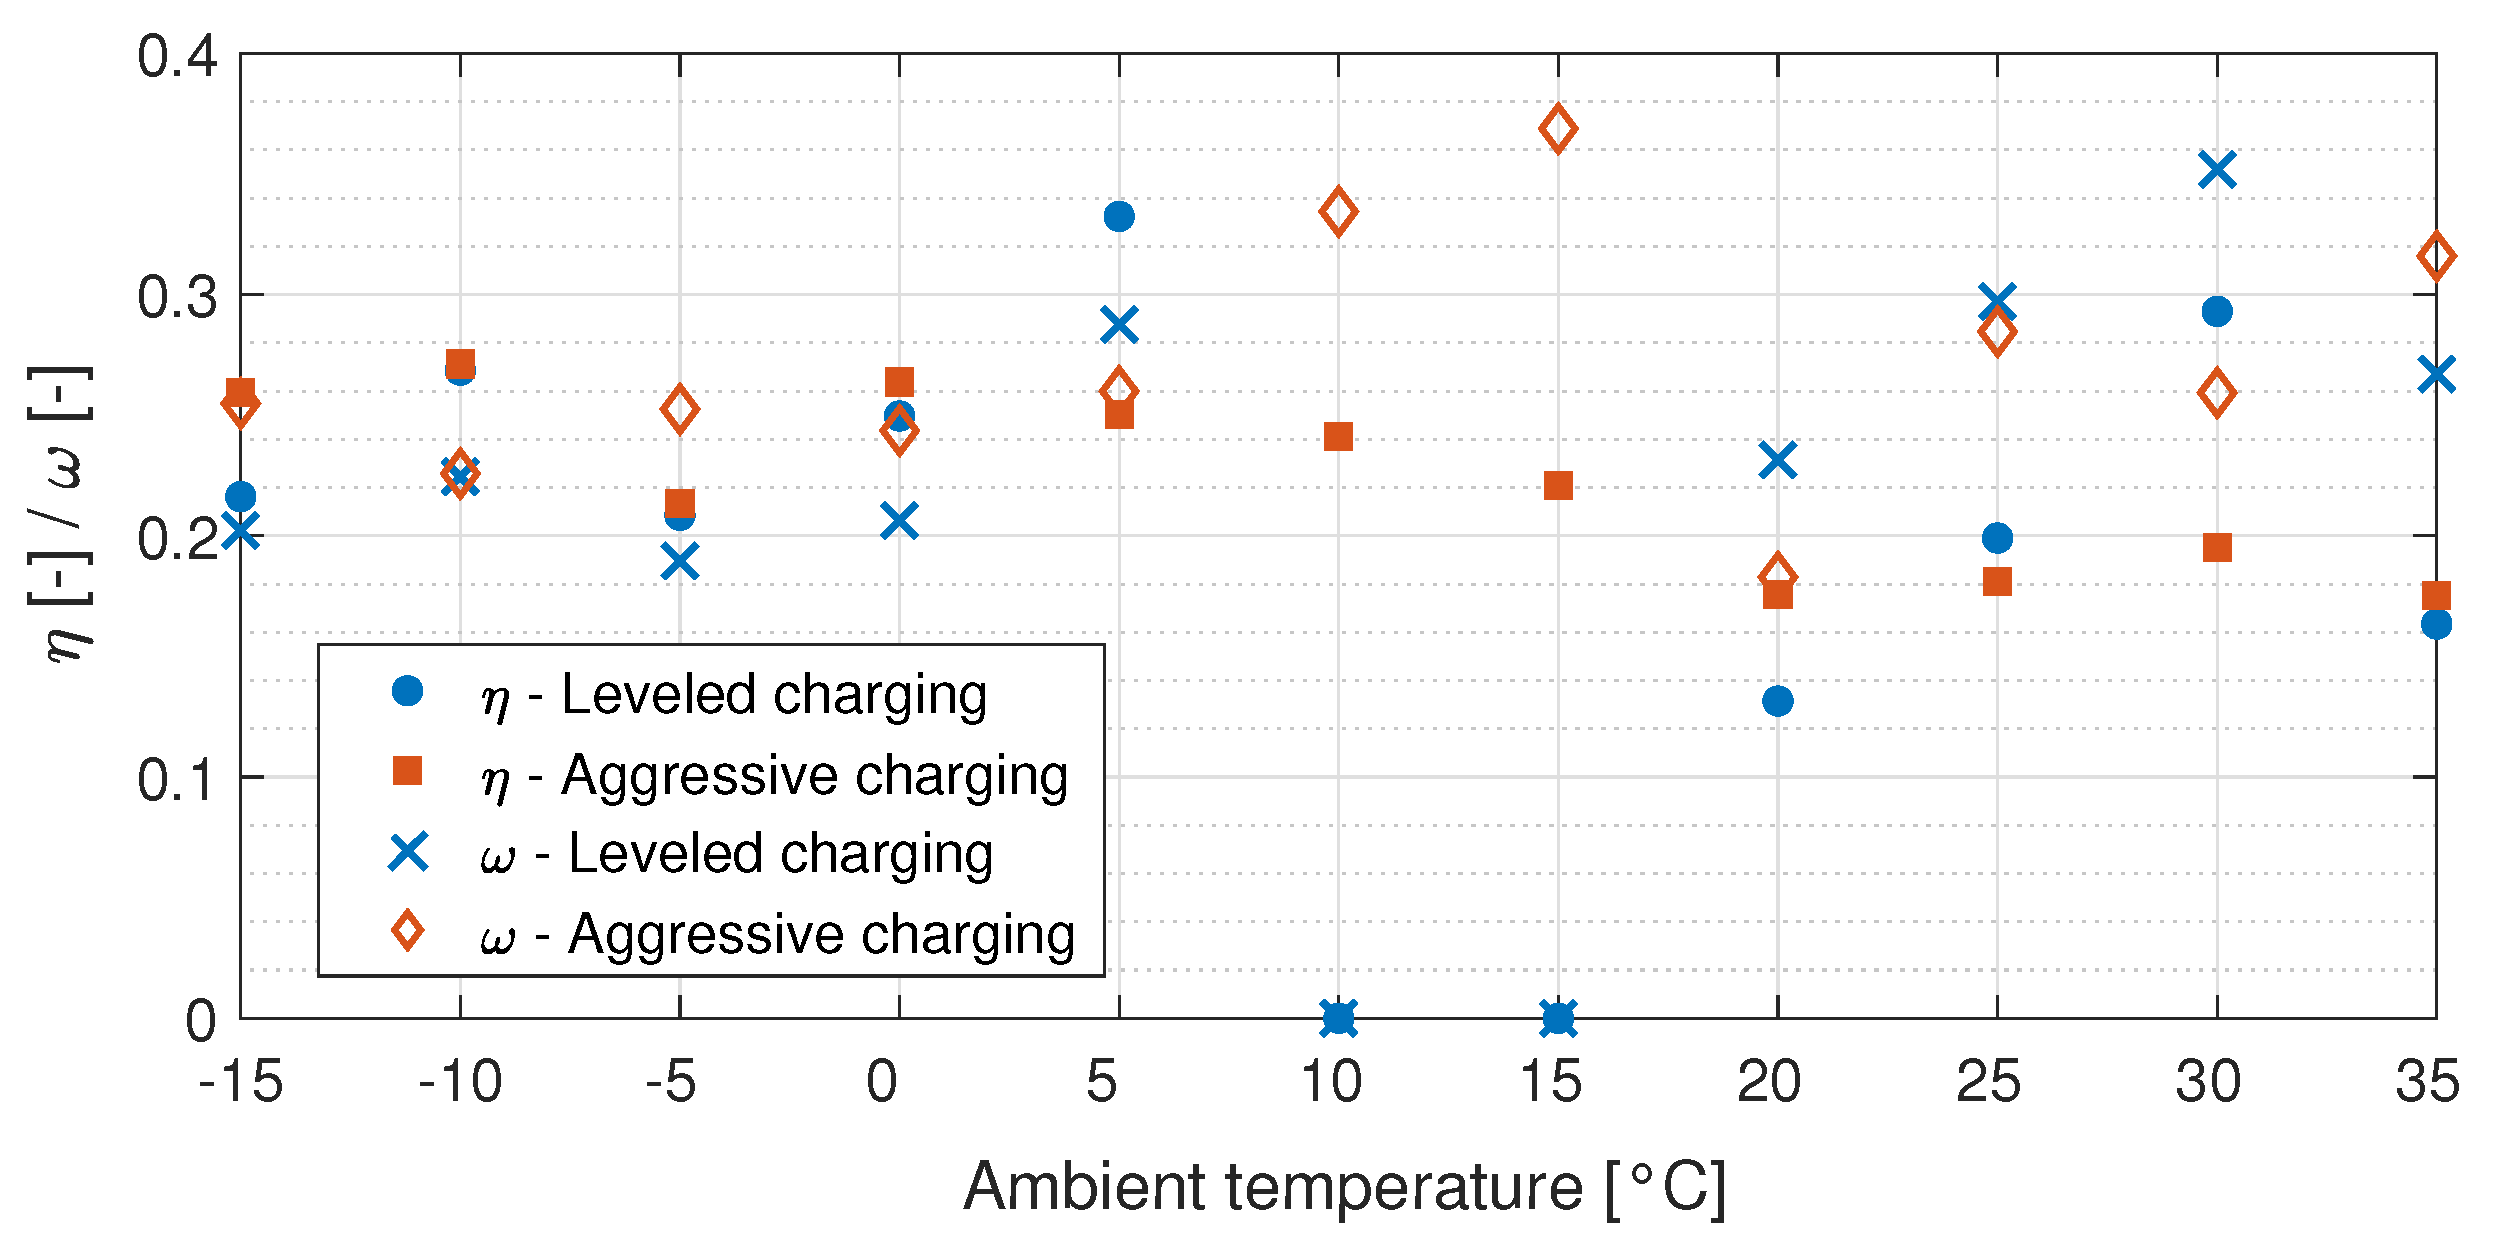
4.1. System Performance and Operation
4.2. Annual Energy Consumption and Environmental Impact
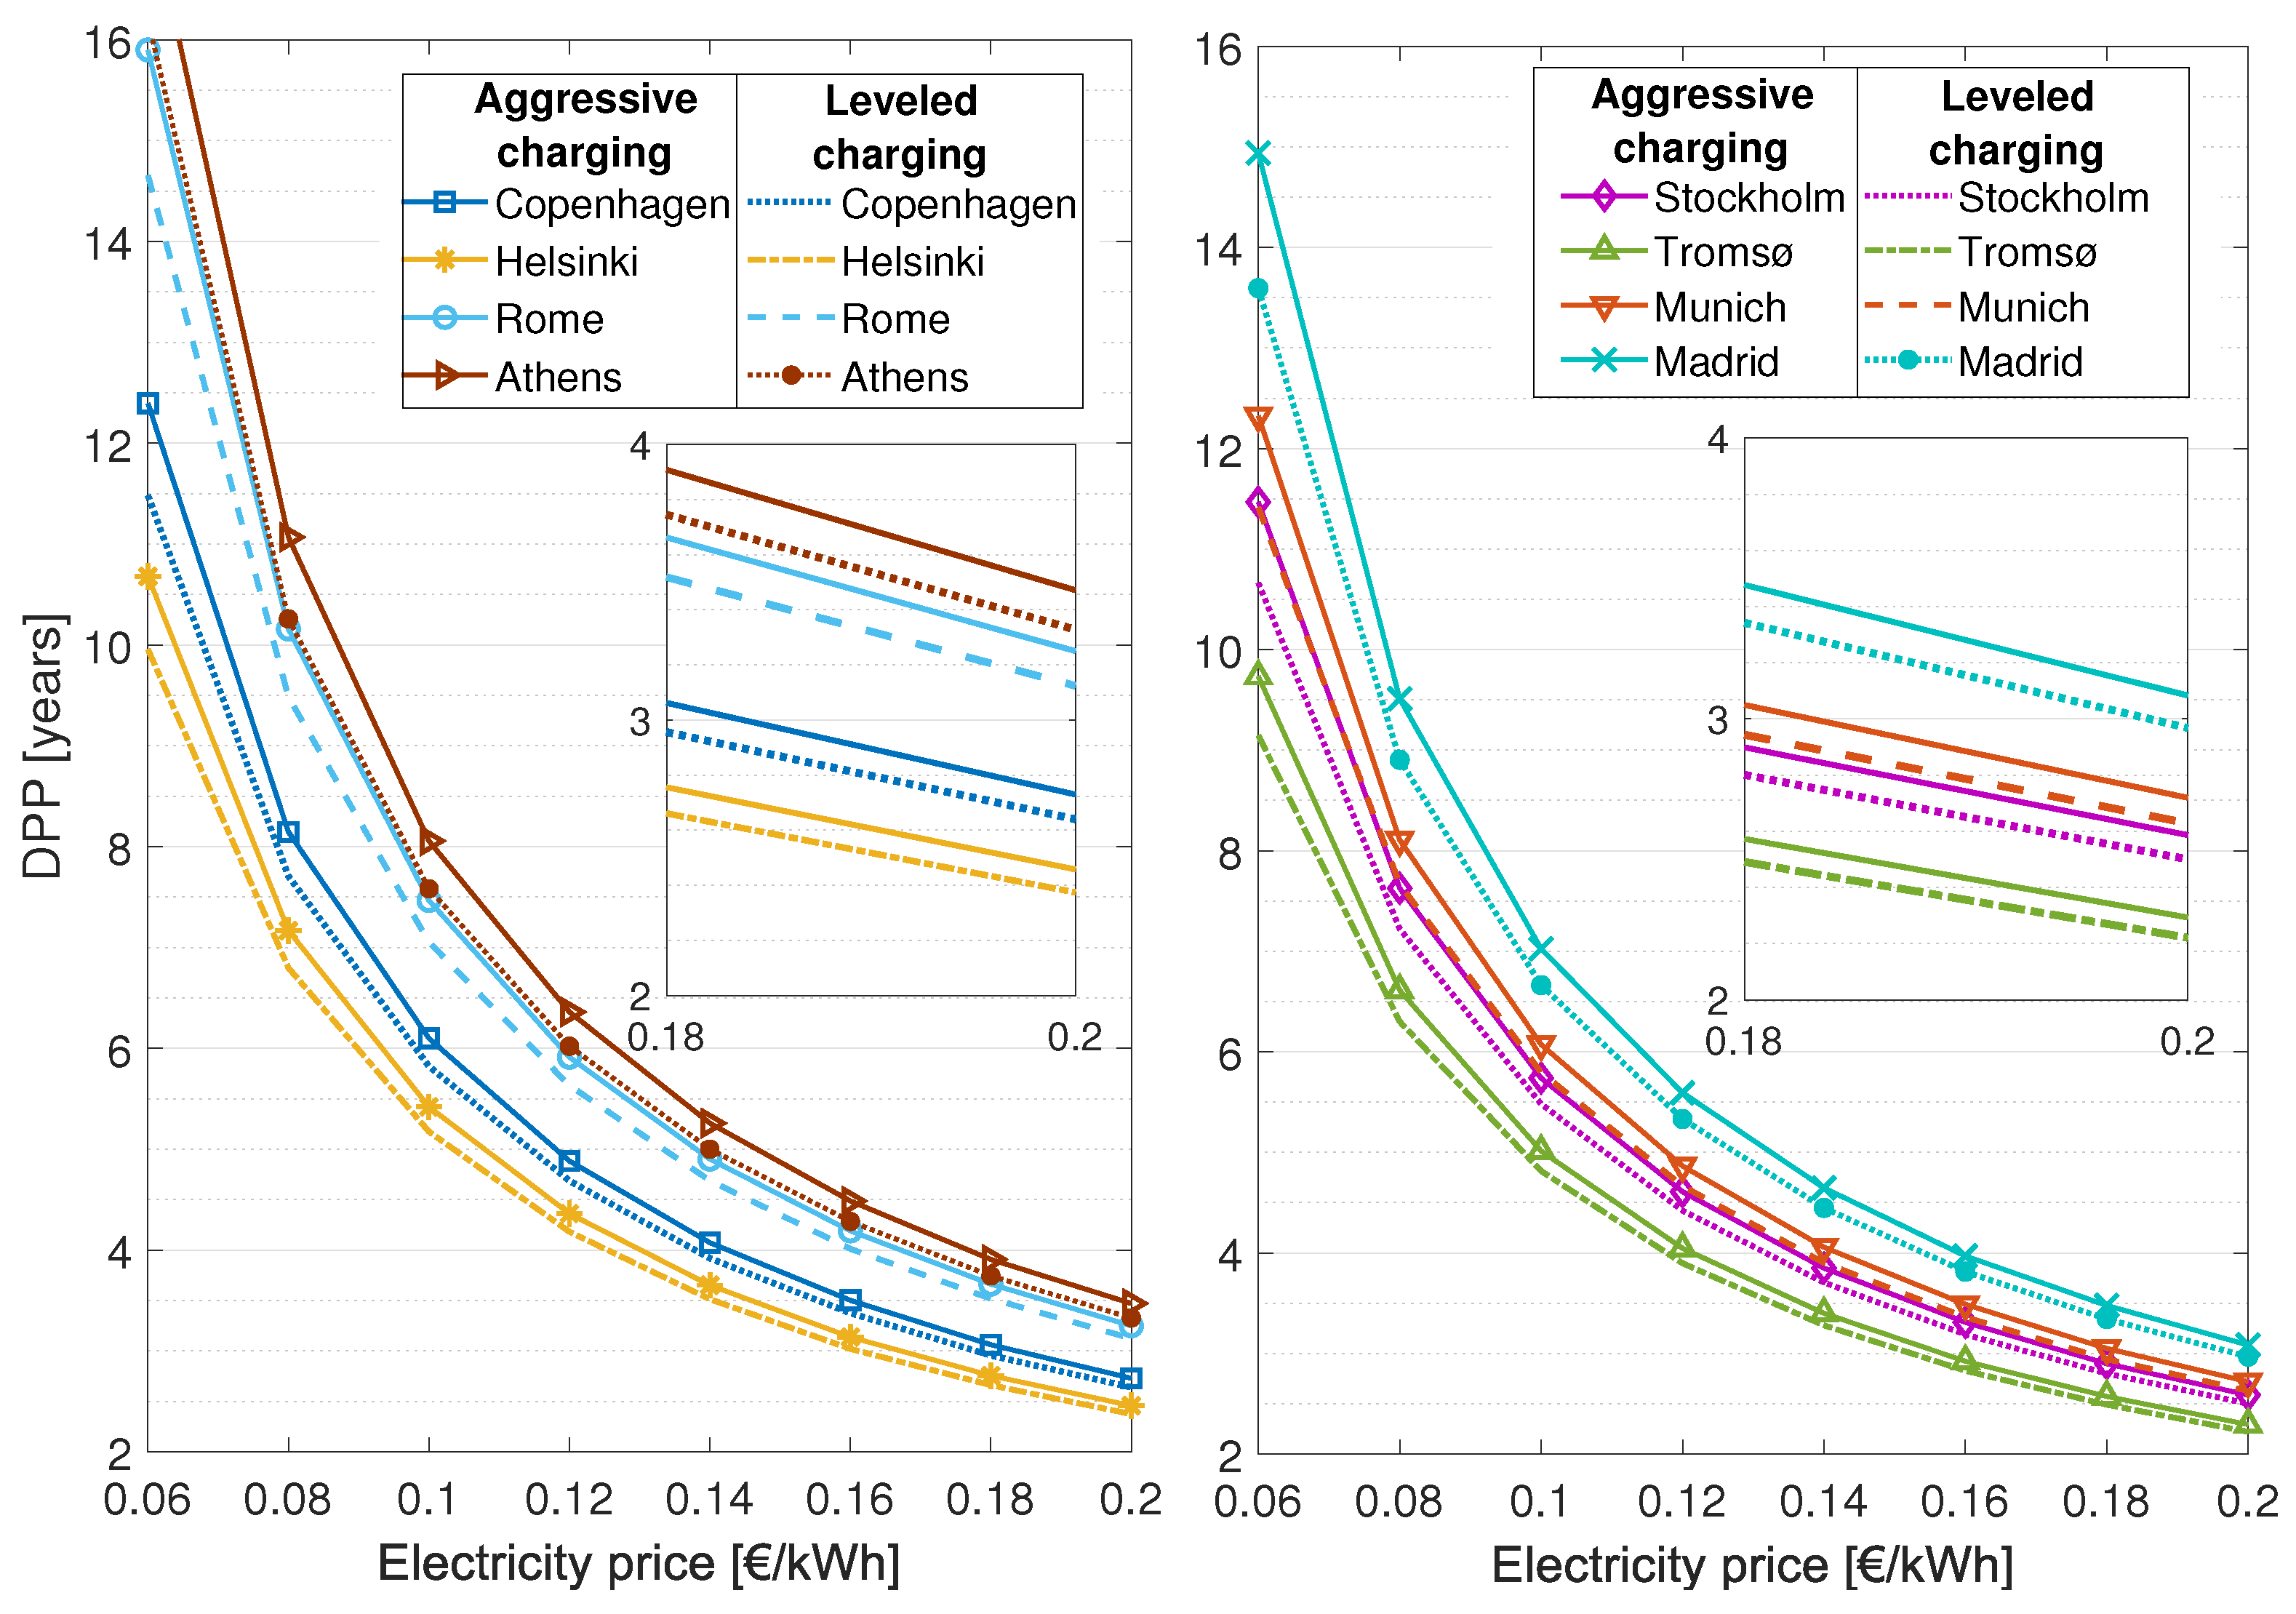
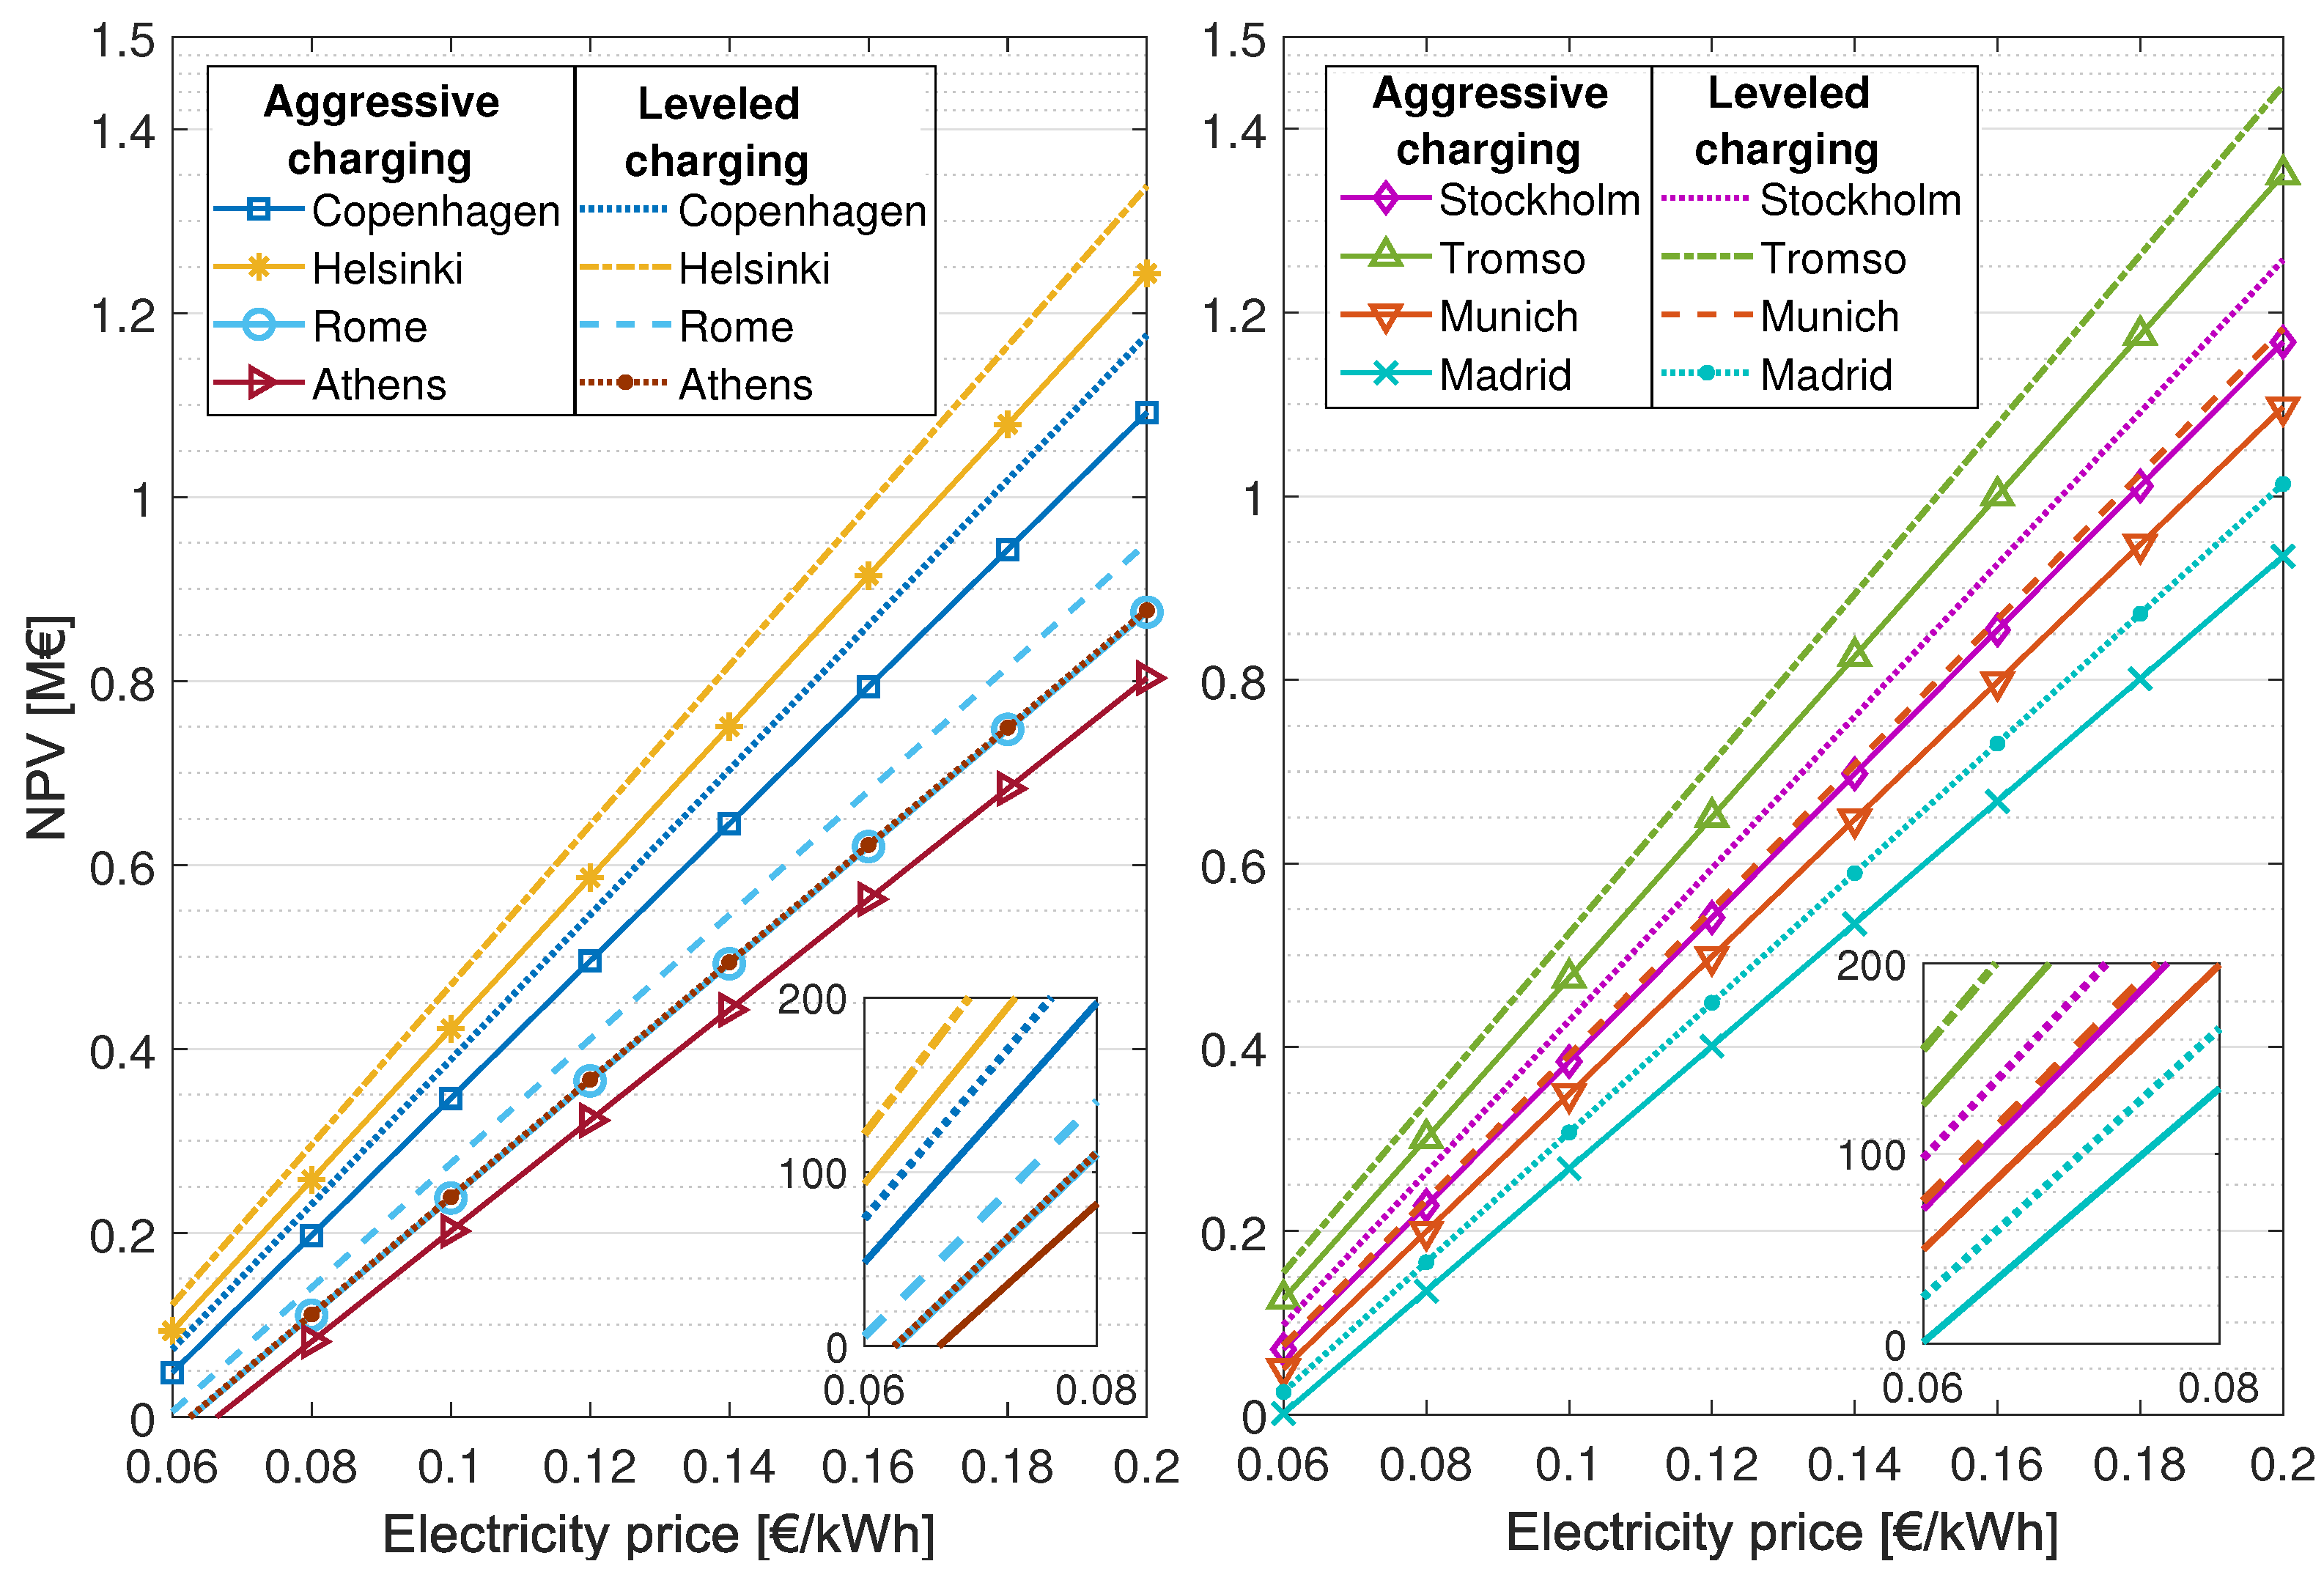
4.3. Economical Analysis
5. Conclusions
- The EJ design demonstrated enhanced annual performance, followed by PC and SC, at all locations independent of charging strategy. Annual COPs of 4.27 to 5.03 were achieved at the location in central Europe and Scandinavia. In the Mediterranean locations, Annual COPs in the range of 5.40 to 5.70 were obtained. Considerable reductions in both related emissions and energy consumption were achieved at all locations.
- The highest annual COPs were achieved when applying the leveled charging strategy, independent of design. An increase in COPs of up to 7.3% was attained compared to the aggressive charging strategy. Thus, control of the DHW charging is a larger influencing factor on performance than system designs.
- DPP and NPV for the Scandinavian locations were found to be between 6.3 to 7.7 years and 0.23 to 0.34 M€ at typical Scandinavian electricity prices. Hotels in temperate and Mediterranean climates obtained DPPs of approximately 3 and 4.5 to 7.5 years, respectively, and NPVs in the range of 0.25 to 0.95 M€. Thus, integrated heating and cooling systems with CO2 can be an efficient, cost-effective and environmentally friendly solution for hotels located in temperate and Mediterranean locations.
Author Contributions
Funding
Institutional Review Board Statement
Informed Consent Statement
Conflicts of Interest
Nomenclature
| Symbols | |
| CO emission factors [g CO2-eq·kWh-1] | |
| efficiency [-] | |
| C | cost [€] |
| E | energy [kWh] |
| L | leakage rate [%] |
| N | plant economic life [years] |
| P | pressure [bar] |
| p | electricity price [€·kWh] |
| heat [kW] | |
| r | rate [%] |
| T | temperature [C] |
| Subscript | |
| AC | air-conditioning |
| al | alternative |
| corr | corrected |
| d | discount |
| DHW | domestic hot water |
| e | electricity |
| el | electric boiler |
| eq | equivalent |
| i | investment |
| lift | pressure lift |
| m | motive |
| SH | space heating |
| Abbreviations | |
| AC | air-conditioning |
| CFC | chlorofluorocarbons |
| CO | carbon dioxide |
| COP | coefficient of performance |
| DHW | domestic hot water |
| DPP | discounted payback period |
| DV | directional valve |
| EJ | ejector-supported parallel compression |
| ESEER | European seasonal energy efficiency ratio |
| EVAP | Evaporator |
| FGT | flash gas tank |
| GC | gas cooler |
| GWP | global warming potential |
| HCFC | hydrochlorofluorocarbons |
| HFC | hydrofluorocarbons |
| HFO | hydrofluoroolefins |
| HX | heat exchanger |
| IHX | internal heat exchanger |
| INT | intermediate temperature |
| LT | low temperature |
| MV | modulating valve |
| NCF | net cash flow |
| NPV | net present value |
| PC | parallel compression |
| PI | proportional–integral |
| SC | single-stage compression |
| SH | space heating |
| TEWI | total equivalent warming impact |
| TFA | trifluoroacetic acid |
| VSD | variable speed drive |
Appendix A

| Strategy | Variable/Location | Annual Energy Savings [MWh· y] | Annual Emission Reduction [Tonne CO2-eq· y] | ||
|---|---|---|---|---|---|
| PC | EJ | PC | EJ | ||
| Stockholm | 901.97 | 908.64 | 101.83 | 102.02 | |
| Copenhagen | 856.32 | 861.78 | 163.26 | 164.69 | |
| Tromsø | 1005.47 | 1014.84 | 107.14 | 107.55 | |
| Leveled | Helsinki | 947.00 | 954.30 | 151.16 | 152.67 |
| charging | Munich | 860.54 | 866.28 | 307.12 | 311.84 |
| Rome | 735.52 | 739.52 | 217.81 | 220.14 | |
| Athens | 697.00 | 701.46 | 389.25 | 396.15 | |
| Madrid | 770.38 | 776.34 | 206.61 | 209.66 | |
| Stockholm | 884.03 | 896.07 | 101.46 | 101.77 | |
| Copenhagen | 839.85 | 850.18 | 160.10 | 162.64 | |
| Tromsø | 987.30 | 1002.01 | 106.53 | 107.14 | |
| Aggressive | Helsinki | 927.71 | 941.19 | 148.15 | 150.76 |
| charging | Munich | 843.74 | 854.70 | 297.05 | 305.47 |
| Rome | 718.33 | 727.00 | 211.12 | 215.68 | |
| Athens | 679.56 | 688.63 | 371.81 | 384.47 | |
| Madrid | 753.48 | 763.76 | 200.68 | 205.58 | |
| Strategy | Variabl/Locatione | NPV at Selected Electricity Prices [M€] | DPP at Selected Electricity Prices [years] | ||||||||||||||
|---|---|---|---|---|---|---|---|---|---|---|---|---|---|---|---|---|---|
| 0.06 | 0.08 | 0.10 | 0.12 | 0.14 | 0.16 | 0.18 | 0.20 | 0.06 | 0.08 | 0.10 | 0.12 | 0.14 | 0.16 | 0.18 | 0.20 | ||
| Stockholm | 0.10 | 0.26 | 0.43 | 0.60 | 0.77 | 0.93 | 1.10 | 1.27 | 10.8 | 7.3 | 5.5 | 4.5 | 3.7 | 3.2 | 2.8 | 2.5 | |
| Copenhagen | 0.07 | 0.23 | 0.39 | 0.55 | 0.71 | 0.86 | 1.02 | 1.18 | 11.7 | 7.8 | 5.9 | 4.8 | 4.0 | 3.4 | 3.0 | 2.7 | |
| Tromsø | 0.15 | 0.34 | 0.53 | 0.72 | 0.90 | 1.09 | 1.28 | 1.46 | 9.2 | 6.4 | 4.9 | 3.9 | 3.3 | 2.9 | 2.5 | 2.2 | |
| Leveled | Helsinki | 0.12 | 0.30 | 0.47 | 0.65 | 0.82 | 1.00 | 1.18 | 1.35 | 10.1 | 6.9 | 5.2 | 4.2 | 3.5 | 3.0 | 2.7 | 2.4 |
| charging | Munich | 0.07 | 0.23 | 0.39 | 0.55 | 0.71 | 0.87 | 1.03 | 1.19 | 11.6 | 7.8 | 5.9 | 4.7 | 3.9 | 3.4 | 3.0 | 2.7 |
| Rome | 0.00 | 0.14 | 0.27 | 0.41 | 0.55 | 0.68 | 0.82 | 0.96 | 14.9 | 9.6 | 7.1 | 5.7 | 4.7 | 4.1 | 3.6 | 3.2 | |
| Athens | <0 | 0.11 | 0.24 | 0.37 | 0.50 | 0.63 | 0.76 | 0.89 | 15< | 10.4 | 7.7 | 6.1 | 5.0 | 4.3 | 3.8 | 3.4 | |
| Madrid | 0.02 | 0.17 | 0.31 | 0.45 | 0.59 | 0.74 | 0.88 | 1.02 | 13.8 | 9.0 | 6.7 | 5.4 | 4.5 | 3.8 | 3.4 | 3.0 | |
| Stockholm | 0.07 | 0.23 | 0.39 | 0.55 | 0.71 | 0.87 | 1.03 | 1.19 | 11.50 | 7.6 | 5.7 | 4.6 | 3.9 | 3.3 | 2.9 | 2.6 | |
| Copenhagen | 0.05 | 0.20 | 0.35 | 0.50 | 0.65 | 0.81 | 0.96 | 1.11 | 12.50 | 8.2 | 6.1 | 4.9 | 4.1 | 3.5 | 3.1 | 2.7 | |
| Tromsø | 0.13 | 0.31 | 0.49 | 0.67 | 0.84 | 1.02 | 1.20 | 1.38 | 9.70 | 6.6 | 5.0 | 4.0 | 3.4 | 2.9 | 2.6 | 2.3 | |
| Aggressive | Helsinki | 0.10 | 0.26 | 0.43 | 0.60 | 0.77 | 0.94 | 1.10 | 1.27 | 10.70 | 7.2 | 5.4 | 4.4 | 3.6 | 3.1 | 2.8 | 2.5 |
| charging | Munich | 0.05 | 0.20 | 0.36 | 0.51 | 0.66 | 0.81 | 0.97 | 1.12 | 12.40 | 8.1 | 6.1 | 4.9 | 4.1 | 3.5 | 3.1 | 2.7 |
| Rome | <0 | 0.11 | 0.24 | 0.37 | 0.50 | 0.63 | 0.76 | 0.89 | 15< | 10.2 | 7.5 | 5.9 | 4.9 | 4.2 | 3.7 | 3.3 | |
| Athens | <0 | 0.08 | 0.21 | 0.33 | 0.45 | 0.58 | 0.70 | 0.82 | 15< | 11.1 | 8.0 | 6.4 | 5.3 | 4.5 | 3.9 | 3.5 | |
| Madrid | 0.00 | 0.14 | 0.27 | 0.41 | 0.55 | 0.68 | 0.82 | 0.96 | 14.90 | 9.5 | 7.0 | 5.6 | 4.6 | 4.0 | 3.5 | 3.1 | |
| Strategy | Variable/Location | NPV at Selected Electricity Prices [M€] | DPP at Selected Electricity Prices [years] | ||||||||||||||
|---|---|---|---|---|---|---|---|---|---|---|---|---|---|---|---|---|---|
| 0.06 | 0.08 | 0.10 | 0.12 | 0.14 | 0.16 | 0.18 | 0.20 | 0.06 | 0.08 | 0.10 | 0.12 | 0.14 | 0.16 | 0.18 | 0.20 | ||
| Stockholm | 0.10 | 0.27 | 0.43 | 0.60 | 0.77 | 0.93 | 1.10 | 1.27 | 10.5 | 7.1 | 5.4 | 4.4 | 3.7 | 3.2 | 2.8 | 2.5 | |
| Copenhagen | 0.08 | 0.23 | 0.39 | 0.55 | 0.71 | 0.87 | 1.02 | 1.18 | 11.4 | 7.6 | 5.8 | 4.6 | 3.9 | 3.3 | 2.9 | 2.6 | |
| Tromsø | 0.16 | 0.34 | 0.53 | 0.72 | 0.90 | 1.09 | 1.27 | 1.46 | 9.0 | 6.2 | 4.8 | 3.9 | 3.2 | 2.8 | 2.5 | 2.2 | |
| Leveled | Helsinki | 0.13 | 0.30 | 0.48 | 0.65 | 0.83 | 1.00 | 1.18 | 1.35 | 9.8 | 6.7 | 5.1 | 4.1 | 3.5 | 3.0 | 2.6 | 2.3 |
| charging | Munich | 0.08 | 0.24 | 0.40 | 0.56 | 0.71 | 0.87 | 1.03 | 1.19 | 11.3 | 7.6 | 5.7 | 4.6 | 3.9 | 3.3 | 2.9 | 2.6 |
| Rome | 0.01 | 0.15 | 0.28 | 0.42 | 0.55 | 0.67 | 0.82 | 0.96 | 14.4 | 9.4 | 7.0 | 5.6 | 4.6 | 4.0 | 3.5 | 3.1 | |
| Athens | <0 | 0.12 | 0.25 | 0.37 | 0.50 | 0.63 | 0.76 | 0.89 | 15< | 10.1 | 7.5 | 5.9 | 4.9 | 4.2 | 3.7 | 3.3 | |
| Madrid | 0.03 | 0.17 | 0.31 | 0.46 | 0.60 | 0.74 | 0.88 | 1.02 | 13.4 | 8.8 | 6.6 | 5.3 | 4.4 | 3.8 | 3.3 | 2.9 | |
| Stockholm | 0.08 | 0.23 | 0.39 | 0.55 | 0.71 | 0.87 | 1.02 | 1.18 | 11.3 | 7.5 | 5.7 | 4.5 | 3.8 | 3.3 | 2.9 | 2.6 | |
| Copenhagen | 0.05 | 0.20 | 0.35 | 0.50 | 0.65 | 0.80 | 0.95 | 1.10 | 12.2 | 8.0 | 6.0 | 4.8 | 4.0 | 3.5 | 3.0 | 2.7 | |
| Tromsø | 0.13 | 0.31 | 0.48 | 0.66 | 0.84 | 1.01 | 1.19 | 1.37 | 9.6 | 6.5 | 4.9 | 4.0 | 3.4 | 2.9 | 2.5 | 2.3 | |
| Aggressive | Helsinki | 0.10 | 0.26 | 0.43 | 0.60 | 0.76 | 0.93 | 1.09 | 1.26 | 10.5 | 7.0 | 5.3 | 4.3 | 3.6 | 3.1 | 2.7 | 2.4 |
| charging | Munich | 0.05 | 0.21 | 0.36 | 0.51 | 0.66 | 0.81 | 0.96 | 1.12 | 12.1 | 8.0 | 6.0 | 4.8 | 4.0 | 3.4 | 3.0 | 2.7 |
| Rome | <0 | 0.12 | 0.24 | 0.37 | 0.50 | 0.63 | 0.76 | 0.89 | 15< | 10.0 | 7.4 | 5.8 | 4.8 | 4.1 | 3.6 | 3.2 | |
| Athens | <0 | 0.09 | 0.21 | 0.33 | 0.45 | 0.57 | 0.70 | 0.82 | 15< | 10.9 | 7.9 | 6.3 | 5.2 | 4.4 | 3.9 | 3.4 | |
| Madrid | 0.01 | 0.14 | 0.28 | 0.41 | 0.54 | 0.69 | 0.81 | 0.95 | 14.6 | 9.3 | 6.9 | 5.5 | 4.6 | 3.9 | 3.4 | 3.0 | |
References
- UNFCCC. The Paris Agreement, 2021 United Nations Framework Convention on Climate Change. Available online: https://unfccc.int/process-and-meetings/the-paris-agreement/the-paris-agreement (accessed on 23 June 2021).
- Ritchie, H. Sector by Sector: Where Do Global Greenhouse Gas Emissions Come from? Our World in Data: Oxford, UK, 2020; Available online: https://ourworldindata.org/ghg-emissions-by-sector#licence (accessed on 23 June 2021).
- Eurostat. Final Energy Consumption by Sector. 2017. Available online: https://ec.europa.eu/eurostat/databrowser/view/ten00124/default/table?lang=en (accessed on 20 June 2021).
- Economidou, M.; Atanasiu, B.; Despret, C.; Maio, J.; Nolte, I.; Rapf, O. Europe’s Buildings under the Microscope. A Country-by-Country Review of the Energy Performance of Buildings; Buildings Performance Institute Europe (BPIE): Brussels, Belgium, 2011; pp. 35–36. [Google Scholar]
- European Commission (EC). Action Plan for Energy Efficiency: Realising the Potential, Communication from the Commission, COM (2006) 545 Final. 2006. Available online: https://eur-lex.europa.eu/legal-content/EN/TXT/PDF/?uri=CELEX:52006DC0545&from=EN (accessed on 23 June 2021).
- UNWTO. Baseline Report on the Integration of Sustainable Consumption and Production Patterns into Tourism Policies; Technical Report; United Nations World Tourism Organization: Madrid, Spain, 2019; Available online: https://www.e-unwto.org/ (accessed on 24 June 2021).
- Dalton, G.; Lockington, D.; Baldock, T. Feasibility analysis of stand-alone renewable energy supply options for a large hotel. Renew. Energy 2008, 33, 1475–1490. [Google Scholar] [CrossRef]
- Werner, S. District heating and cooling in Sweden. Energy 2017, 126, 419–429. [Google Scholar] [CrossRef]
- Lund, H.; Möller, B.; Mathiesen, B.V.; Dyrelund, A. The role of district heating in future renewable energy systems. Energy 2010, 35, 1381–1390. [Google Scholar] [CrossRef]
- Smitt, S.; Tolstorebrov, I.; Gullo, P.; Pardiñas, A.; Hafner, A. Energy use and retrofitting potential of heat pumps in cold climate hotels. J. Clean. Prod. 2021, 298, 126799. [Google Scholar] [CrossRef]
- Bolaji, B.; Huan, Z. Ozone depletion and global warming: Case for the use of natural refrigerant—A review. Renew. Sustain. Energy Rev. 2013, 18, 49–54. [Google Scholar] [CrossRef]
- Frank, T. Impact of Fluorinated Refrigerants and Their Degradation Products on the Environment and Health; Technical Report; Refolution Industrielkälte GmbH: Karlsruhe, Germany, 2021. [Google Scholar]
- Koronen, C.; Tedesco, R. One Step Forward, Two Steps Back—A Deep Dive into the Climate Impact of Modern Fluorinated Refrigerants; Technical Report; Environmental Coalition on Standards (ECOS): Brussels, Belgium, 2021. [Google Scholar]
- Mota-Babiloni, A.; Makhnatch, P. Predictions of European refrigerants place on the market following F-gas regulation restrictions. Int. J. Refrig. 2021, 127, 101–110. [Google Scholar] [CrossRef]
- Zolcer Skačanová, K.; Battesti, M. Global market and policy trends for CO2 in refrigeration. Int. J. Refrig. 2019, 107, 98–104. [Google Scholar] [CrossRef]
- Lorentzen, G. Revival of carbon dioxide as a refrigerant. Int. J. Refrig. 1994, 17, 292–301. [Google Scholar] [CrossRef]
- Lorentzen, G.; Pettersen, J. A new, efficient and environmentally benign system for car air-conditioning. Int. J. Refrig. 1993, 16, 4–12. [Google Scholar] [CrossRef]
- Nekså, P.; Rekstad, H.; Zakeri, G.; Schiefloe, P.A. CO2-heat pump water heater: Characteristics, system design and experimental results. Int. J. Refrig. 1998, 21, 172–179. [Google Scholar] [CrossRef]
- Nekså, P. CO2 heat pump systems. Int. J. Refrig. 2002, 25, 421–427. [Google Scholar] [CrossRef]
- Stene, J. Residential CO2 heat pump system for combined space heating and hot water heating. Int. J. Refrig. 2005, 28, 1259–1265. [Google Scholar] [CrossRef] [Green Version]
- Tosato, G.; Artuso, P.; Minetto, S.; Rossetti, A.; Allouche, Y.; Banasiak, K. Experimental and numerical investigation of a transcritical CO2 air/water reversible heat pump: Analysis of domestic hot water production. In Proceedings of the 14th IIR-Gustav Lorentzen Conference on Natural Refrigerants, Kyoto, Japan, 6–9 December 2020; IIR: Paris, France, 2020. [Google Scholar]
- Dai, B.; Qi, H.; Liu, S.; Zhong, Z.; Li, H.; Song, M.; Ma, M.; Sun, Z. Environmental and economical analyses of transcritical CO2 heat pump combined with direct dedicated mechanical subcooling (DMS) for space heating in China. Energy Convers. Manag. 2019, 198, 111317. [Google Scholar] [CrossRef]
- Byrne, P.; Miriel, J.; Lenat, Y. Design and simulation of a heat pump for simultaneous heating and cooling using HFC or CO2 as a working fluid. Int. J. Refrig. 2009, 32, 1711–1723. [Google Scholar] [CrossRef] [Green Version]
- Diaby, A.T.; Byrne, P.; Maré, T. Simulation of heat pumps for simultaneous heating and cooling using CO2. Int. J. Refrig. 2019, 106, 616–627. [Google Scholar] [CrossRef]
- Liu, Y.; Groll, E.A.; Yazawa, K.; Kurtulus, O. Theoretical analysis of energy-saving performance and economics of CO2 and NH3 heat pumps with simultaneous cooling and heating applications in food processing. Int. J. Refrig. 2016, 65, 129–141. [Google Scholar] [CrossRef]
- Adriansyah, W. Combined air conditioning and tap water heating plant using CO2 as refrigerant. Energy Build. 2004, 36, 690–695. [Google Scholar] [CrossRef]
- Farsi, A.; Mohammadi, S.; Ameri, M. An efficient combination of transcritical CO2 refrigeration and multi-effect desalination: Energy and economic analysis. Energy Convers. Manag. 2016, 127, 561–575. [Google Scholar] [CrossRef]
- Singh, S.; Hafner, A.; Banasiak, K.; Seshadri, S.; Maiya, P.; Smitt, S.; Gabrielii, C.H. Heat pump/chiller system for centralized kitchens in India. In Proceedings of the 14th IIR-Gustav Lorentzen Conference on Natural Refrigerants, Kyoto, Japan, 7–9 December 2020; IIR: Paris, France, 2020. [Google Scholar]
- Smitt, S.; Tolstorebrov, I.; Hafner, A. Integrated CO2 system with HVAC and hot water for hotels: Field measurements and performance evaluation. Int. J. Refrig. 2020, 116, 59–69. [Google Scholar] [CrossRef]
- Smitt, S.; Tolstorebrov, I.; Hafner, A. Performance improvement of integrated CO2 systems with HVAC and hot water for hotels. Therm. Sci. Eng. Prog. 2021, 23, 100869. [Google Scholar] [CrossRef]
- Tosato, G.; Girotto, S.; Minetto, S.; Rossetti, A.; Marinetti, S. An integrated CO2 unit for heating, cooling and DHW installed in a hotel. Data from the field. J. Phys. Conf. Ser. 2020, 1599, 012058. [Google Scholar] [CrossRef]
- Hafner, A.; Girotto, S.; Tosato, G. CO2 Heat Pump Water Chillers; Eurammon Symposium/Webinar: Frankfurt, Germany, 2020. [Google Scholar]
- Pardiñas, Á.Á.; Hafner, A.; Banasiak, K. Novel integrated CO2 vapour compression racks for supermarkets. Thermodynamic analysis of possible system configurations and influence of operational conditions. Appl. Therm. Eng. 2018, 131, 1008–1025. [Google Scholar] [CrossRef]
- Dassault Systems. DYMOLA Systems Engineering: Multi-Engineering Modeling and Simulation based on Modelica and FMI. 2019. Available online: https://www.3ds.com/products-services/catia/products/dymola/ (accessed on 1 May 2021).
- TLK-Thermo GmbH. TIL Suite—Simulates Thermal Systems. 2020. Available online: https://www.tlk-thermo.com/index.php/en/software/til-suite (accessed on 1 May 2021).
- TLK-Thermo GmbH. TILMedia Suite—Software Package for Calculating the Properties of Thermophysical Substances. 2020. Available online: https://www.tlk-thermo.com/index.php/en/software/tilmedia-suite (accessed on 1 May 2021).
- Wagner, W. Strömung und Druckverlust (Flow and Pressure Drop); Vogel: Höchberg, Germany, 2008; p. 67. [Google Scholar]
- Haaf, S. Wärmeübertragung in luftkühlern (Heat transfer in air coolers). In Wärmeaustauscher (Heat Exchangers); Springer: Berlin/Heidelberg, Germany, 1988; pp. 435–491. [Google Scholar]
- Schmidt, T.E. Heat transfer calculations for extended surfaces. Refrig. Eng. 1949, 57, 351–357. [Google Scholar]
- Huang, D.; Wu, Z.; Sunden, B. Pressure drop and convective heat transfer of Al2O3/water and MWCNT/water nanofluids in a chevron plate heat exchanger. Int. J. Heat Mass Transf. 2015, 89, 620–626. [Google Scholar] [CrossRef]
- Gullo, P.; Elmegaard, B.; Cortella, G. Advanced exergy analysis of a R744 booster refrigeration system with parallel compression. Energy 2016, 107, 562–571. [Google Scholar] [CrossRef] [Green Version]
- Brennen, C.E. Fundamentals of Multiphase Flow; Cambridge University Press: Cambridge, UK, 2005. [Google Scholar] [CrossRef] [Green Version]
- Elbel, S.; Hrnjak, P. Experimental validation of a prototype ejector designed to reduce throttling losses encountered in transcritical R744 system operation. Int. J. Refrig. 2008, 31, 411–422. [Google Scholar] [CrossRef]
- Gullo, P.; Hafner, A.; Banasiak, K. Transcritical R744 refrigeration systems for supermarket applications: Current status and future perspectives. Int. J. Refrig. 2018, 93, 269–310. [Google Scholar] [CrossRef]
- Norwegian Standard (NS). NS-EN 14825:2018 (English Translation). Air Conditioners, Liquid Chilling Packages and Heat Pumps, with Electrically Driven Compressors, for Space Heating and Cooling: Testing and Rating at Part Load Conditions and Calculation of Seasonal Performance; Norwegian Council for Building Standardization: Oslo, Norway, 2018. [Google Scholar]
- Meteotest AG. Meteonorm Software—Worldwide Irradiation Data. 2021. Available online: https://meteonorm.meteotest.ch/en/ (accessed on 1 May 2021).
- United States Environmental Protection Agency. Refrigerant Transition & Environmental Impacts. 2020. Available online: https://www.epa.gov/mvac/refrigerant-transition-environmental-impacts (accessed on 23 June 2021).
- EMERSON Climate Technologies. Refrigerant Choices for Commercial Refrigeration—Finding the Right Balance. Technical report No.: TGE124-091/E. 2010. Available online: https://climate.emerson.com/ (accessed on 18 June 2021).
- European Environment Agency. Greenhouse Gas Emission Intensity of Electricity Generation. 2020. Available online: https://www.eea.europa.eu/data-and-maps/indicators/overview-of-the-electricity-production-3/assessment-1 (accessed on 23 June 2021).
- Rezayan, O.; Behbahaninia, A. Thermoeconomic optimization and exergy analysis of CO2/NH3 cascade refrigeration systems. Energy 2011, 36, 888–895. [Google Scholar] [CrossRef]
- Sanaye, S.; Shirazi, A. Thermo-economic optimization of an ice thermal energy storage system for air-conditioning applications. Energy Build. 2013, 60, 100–109. [Google Scholar] [CrossRef]
- Gullo, P.; Elmegaard, B.; Cortella, G. Energetic, exergetic and exergoeconomic analysis of CO2 refrigeration systems operating in hot climates. In Proceedings of the 28th International Conference on Efficiency, Cost, Optimization, Simulation and Environmental Impact of Energy Systems, Pau, France, 30 June–3 July 2015. [Google Scholar]
- Fazelpour, F.; Morosuk, T. Exergoeconomic analysis of carbon dioxide transcritical refrigeration machines. Int. J. Refrig. 2014, 38, 128–139. [Google Scholar] [CrossRef]
- Garrett, D.E. Chemical Engineering Economics; Springer Science & Business Media: Berlin/Heidelberg, Germany, 2012. [Google Scholar]
- Wang, Y.; Ye, Z.; Song, Y.; Yin, X.; Cao, F. Energy, exergy, economic and environmental analysis of refrigerant charge in air source transcritical carbon dioxide heat pump water heater. Energy Convers. Manag. 2020, 223, 113209. [Google Scholar] [CrossRef]
- Blarke, M.B. Towards an intermittency-friendly energy system: Comparing electric boilers and heat pumps in distributed cogeneration. Appl. Energy 2012, 91, 349–365. [Google Scholar] [CrossRef]
- Pardiñas, Á.Á.; Contiero, L.; Hafner, A.; Banasiak, K.; Larsen, L.F. Attaining a higher flexibility degree in CO2 compressor racks. In Proceedings of the 14th IIR-Gustav Lorentzen Conference on Natural Refrigerants, Kyoto, Japan, 6–9 December 2020; IIR: Paris, France, 2020. [Google Scholar]
- Eurostat. Electricity Prices for Non-Household Consumers. 2020. Available online: https://ec.europa.eu/eurostat/statistics-explained/index.php?title=Electricity_price_statistics (accessed on 1 June 2021).


| Label | Heat Exchanger | Type | Secondary Fluid | Heat Transfer Area [m2] |
|---|---|---|---|---|
| GCSH | Gas cooler | Plate | Water | 16.87 |
| GCDHW,1 | Gas cooler | Plate | Water | 5.07 |
| GCDHW,2 | Gas cooler | Plate | Water | 2.73 |
| GCAIR | Gas cooler | Fin and tube | Air | 4 × 297.60 * |
| EVAPAC,1 | Evaporator | Plate | Glycol | 9.61 |
| EVAPAC,2 | Evaporator | Plate | Glycol | 7.67 |
| EVAPAIR | Evaporator | Fin and tube | Air | 4 × 297.60 * |
| IHX1 | Internal heat exchanger | Plate | CO2 | 0.85 |
| IHX2 | Internal heat exchanger | Plate | CO2 | 1.75 |
| (Equation (1)) | (Equation (2)) |
|---|---|
| Ambient temperature [C] | −15 | −10 | −5 | 0 | 5 | 10 | 15 | 20 | 25 | 30 | 35 |
| Space heating load [kW] | 180 | 180 | 140 | 100 | 80 | 60 | 40 | 0 | 0 | 0 | 0 |
| AC cooling load [kW] | 0 | 0 | 0 | 0 | 0 | 0 | 0 | 40 | 80 | 150 | 220 |
| Component | Capital Cost Function |
|---|---|
| Compressors with electrical motor | 10,167.5 × Ẇ0.46 a |
| Plate HX | 1397 × A0.89 a |
| Fin-and-tube HXs | 119,500 b,* |
| Valves | 114.5 × ṁ a |
| Receiver | 1000 b |
| Ejector | 9000 b,* |
| Strategy | Variable/Location | Annual COP [-] | Annual Energy Usage [MWh· y] | Annual Emissions [Tonne CO2-eq· y] | ||||||
|---|---|---|---|---|---|---|---|---|---|---|
| SC | PC | EJ | SC | PC | EJ | SC | PC | EJ | ||
| Stockholm | 4.68 | 4.75 | 4.85 | 278.65 | 277.19 | 268.32 | 3.39 | 3.37 | 3.26 | |
| Copenhagen | 4.86 | 4.92 | 5.01 | 240.64 | 240.90 | 233.61 | 27.00 | 27.02 | 26.21 | |
| Tromsø | 4.12 | 4.16 | 4.27 | 333.56 | 331.32 | 319.54 | 6.38 | 6.34 | 6.11 | |
| Leveled | Helsinki | 4.48 | 4.55 | 4.64 | 311.25 | 308.52 | 298.82 | 27.74 | 27.50 | 26.64 |
| charging | Munich | 4.86 | 4.93 | 5.03 | 253.35 | 252.57 | 244.84 | 88.72 | 88.44 | 85.73 |
| Rome | 5.49 | 5.61 | 5.71 | 206.74 | 205.60 | 199.60 | 48.21 | 47.95 | 46.55 | |
| Athens | 5.62 | 5.76 | 5.85 | 213.01 | 210.34 | 203.40 | 129.18 | 127.51 | 123.30 | |
| Madrid | 5.19 | 5.30 | 5.40 | 237.44 | 235.76 | 227.15 | 49.91 | 49.55 | 47.75 | |
| Stockholm | 4.43 | 4.45 | 4.64 | 293.56 | 290.39 | 276.11 | 3.57 | 3.53 | 3.36 | |
| Copenhagen | 4.50 | 4.61 | 4.80 | 254.05 | 252.64 | 240.35 | 28.50 | 28.34 | 26.96 | |
| Tromsø | 3.88 | 3.96 | 4.14 | 349.94 | 345.25 | 328.18 | 6.69 | 6.61 | 6.28 | |
| Aggressive | Helsinki | 4.17 | 4.28 | 4.46 | 327.84 | 323.07 | 307.26 | 29.22 | 28.80 | 27.39 |
| charging | Munich | 4.51 | 4.65 | 4.82 | 267.18 | 264.57 | 251.45 | 93.56 | 92.64 | 88.05 |
| Rome | 5.03 | 5.20 | 5.40 | 218.57 | 217.10 | 206.23 | 50.97 | 92.64 | 88.05 | |
| Athens | 5.19 | 5.34 | 5.55 | 224.95 | 221.68 | 209.86 | 136.36 | 134.38 | 127.22 | |
| Madrid | 4.82 | 4.94 | 5.15 | 250.07 | 247.09 | 234.02 | 52.56 | 51.94 | 49.19 | |
| Investment | Capital Cost [k€] | ||
|---|---|---|---|
| SC | PC | EJ | |
| Compressors | 174.6 | 169.2 | 169.2 |
| Heat exchangers | 171.7 | 174.2 | 174.2 |
| Valves/receiver/ejector | 2.3 | 2.4 | 11.2 |
| Installation and additional equipment (15%) | 50.6 | 51.9 | 53.2 |
| Total | 399.2 | 397.7 | 407.8 |
| Strategy | Variable/Location | NPV at Selected Electricity Prices [M€] | DPP at Selected Electricity Prices [years] | ||||
|---|---|---|---|---|---|---|---|
| 0.06 | 0.14 | 0.20 | 0.06 | 0.14 | 0.20 | ||
| Stockholm | 0.10 | 0.77 | 1.27 | 10.5 | 3.7 | 2.5 | |
| Copenhagen | 0.08 | 0.71 | 1.18 | 11.4 | 3.9 | 2.6 | |
| Tromsø | 0.16 | 0.90 | 1.46 | 9.0 | 3.2 | 2.2 | |
| Leveled | Helsinki | 0.13 | 0.83 | 1.35 | 9.8 | 3.5 | 2.3 |
| charging | Munich | 0.08 | 0.71 | 1.19 | 11.3 | 3.9 | 2.6 |
| Rome | 0.01 | 0.55 | 0.96 | 14.4 | 4.6 | 3.1 | |
| Athens | <0 | 0.50 | 0.89 | 15< | 4.9 | 3.3 | |
| Madrid | 0.03 | 0.60 | 1.02 | 13.4 | 4.4 | 2.9 | |
| Stockholm | 0.08 | 0.71 | 1.18 | 11.3 | 3.8 | 2.6 | |
| Copenhagen | 0.05 | 0.65 | 1.10 | 12.2 | 4.0 | 2.7 | |
| Tromsø | 0.13 | 0.84 | 1.37 | 9.6 | 3.4 | 2.3 | |
| Aggressive | Helsinki | 0.10 | 0.76 | 1.26 | 10.5 | 3.6 | 2.4 |
| charging | Munich | 0.05 | 0.66 | 1.11 | 12.1 | 4.0 | 2.7 |
| Rome | <0 | 0.50 | 0.89 | 15< | 4.8 | 3.2 | |
| Athens | <0 | 0.45 | 0.82 | 15< | 5.2 | 3.4 | |
| Madrid | 0.01 | 0.54 | 0.95 | 14.6 | 4.6 | 3.0 | |
| Strategy | Variable/Location | NPV at Selected Electricity Prices [k€] | DPP at Selected Electricity Prices [years] | ||||
|---|---|---|---|---|---|---|---|
| 0.06 | 0.14 | 0.20 | 0.06 | 0.14 | 0.20 | ||
| Stockholm | 0.10 | 0.77 | 1.27 | 10.8 | 3.7 | 2.5 | |
| Copenhagen | 0.07 | 0.71 | 1.18 | 11.7 | 4.0 | 2.7 | |
| Tromsø | 0.15 | 0.90 | 1.46 | 9.2 | 3.3 | 2.2 | |
| Leveled | Helsinki | 0.12 | 0.82 | 1.35 | 10.1 | 3.5 | 2.4 |
| charging | Munich | 0.07 | 0.71 | 1.19 | 11.6 | 3.9 | 2.7 |
| Rome | 0.00 | 0.55 | 0.96 | 14.9 | 4.7 | 3.2 | |
| Athens | <0 | 0.50 | 0.89 | 15.0 | 5.0 | 3.4 | |
| Madrid | 0.02 | 0.59 | 1.02 | 13.8 | 4.5 | 3.0 | |
| Stockholm | 0.07 | 0.71 | 1.19 | 11.5 | 3.9 | 2.6 | |
| Copenhagen | 0.05 | 0.65 | 1.11 | 12.5 | 4.1 | 2.7 | |
| Tromsø | 0.13 | 0.84 | 1.38 | 9.7 | 3.4 | 2.3 | |
| Aggressive | Helsinki | 0.10 | 0.77 | 1.27 | 10.7 | 3.6 | 2.5 |
| charging | Munich | 0.05 | 0.66 | 1.12 | 12.4 | 4.1 | 2.7 |
| Rome | <0 | 0.50 | 0.89 | 15.0 | 4.9 | 3.3 | |
| Athens | <0 | 0.45 | 0.82 | 15.0 | 5.3 | 3.5 | |
| Madrid | 0.00 | 0.55 | 0.96 | 14.9 | 4.6 | 3.1 | |
Publisher’s Note: MDPI stays neutral with regard to jurisdictional claims in published maps and institutional affiliations. |
© 2021 by the authors. Licensee MDPI, Basel, Switzerland. This article is an open access article distributed under the terms and conditions of the Creative Commons Attribution (CC BY) license (https://creativecommons.org/licenses/by/4.0/).
Share and Cite
Smitt, S.; Pardiñas, Á.; Hafner, A. Evaluation of Integrated Concepts with CO2 for Heating, Cooling and Hot Water Production. Energies 2021, 14, 4103. https://doi.org/10.3390/en14144103
Smitt S, Pardiñas Á, Hafner A. Evaluation of Integrated Concepts with CO2 for Heating, Cooling and Hot Water Production. Energies. 2021; 14(14):4103. https://doi.org/10.3390/en14144103
Chicago/Turabian StyleSmitt, Silje, Ángel Pardiñas, and Armin Hafner. 2021. "Evaluation of Integrated Concepts with CO2 for Heating, Cooling and Hot Water Production" Energies 14, no. 14: 4103. https://doi.org/10.3390/en14144103
APA StyleSmitt, S., Pardiñas, Á., & Hafner, A. (2021). Evaluation of Integrated Concepts with CO2 for Heating, Cooling and Hot Water Production. Energies, 14(14), 4103. https://doi.org/10.3390/en14144103