
Energy Self-Subsistence of Agriculture in EU Countries

 ,
, 
 ,
, 
 , and
, and
Abstract
1. Introduction
2. Literature Review
3. Materials and Methods
- n—number of observations,
- —value of the “i-th” observation,
- —the average value of all observations, i.e., .
- —the level of the phenomenon in a certain period,
- —level of the phenomenon during the reference period.
- N—sample size.
- di—differences between the ranks of the corresponding features xi and feature yi (i = 1, 2, …, n).
4. Results
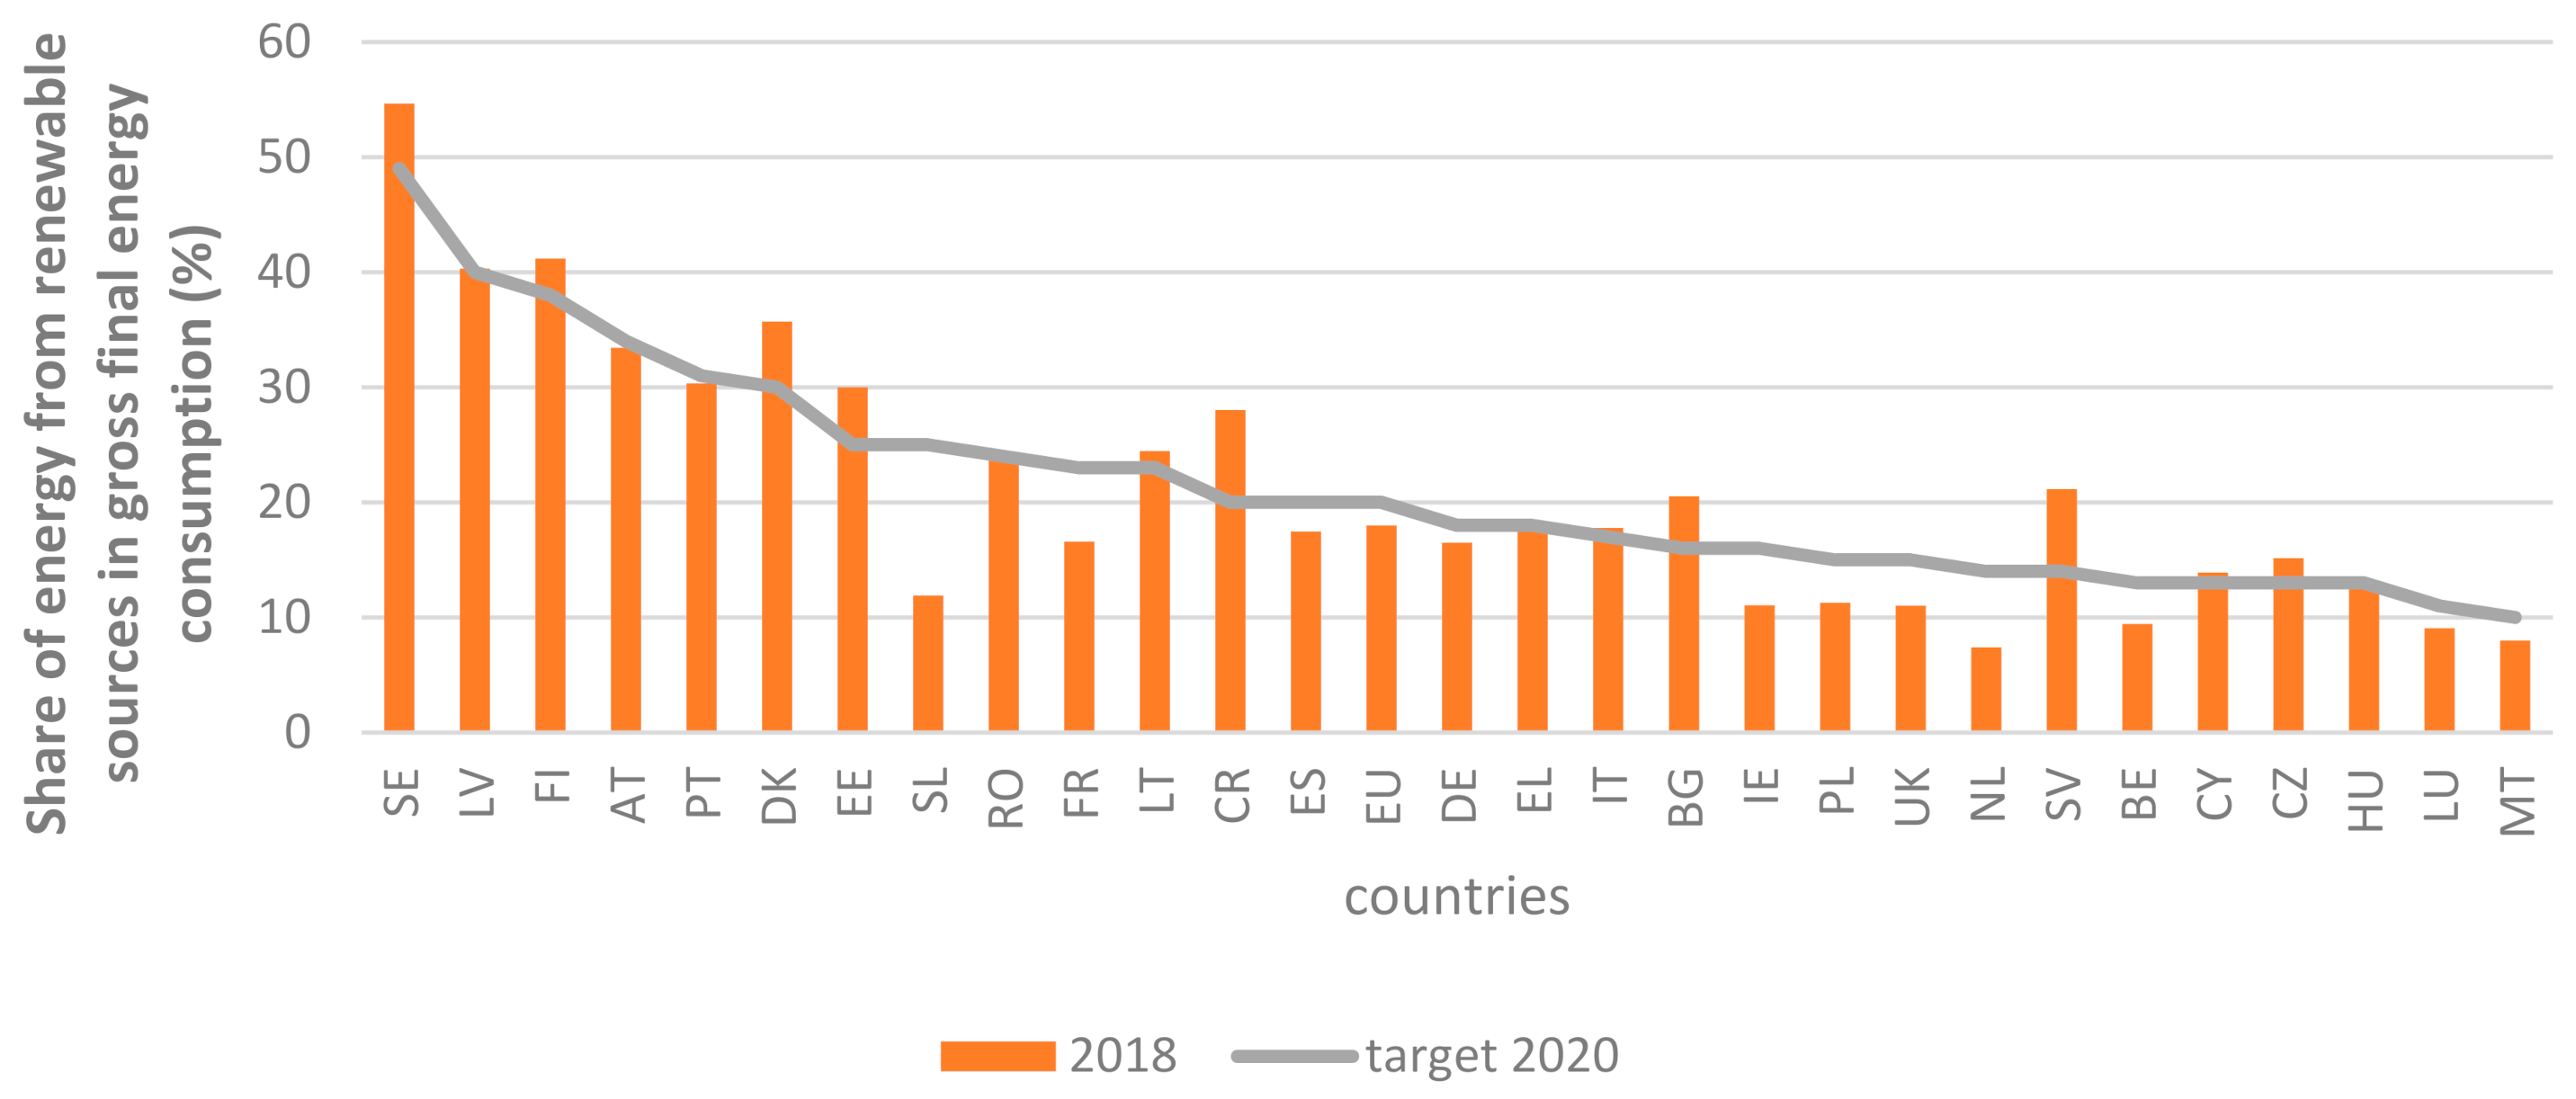
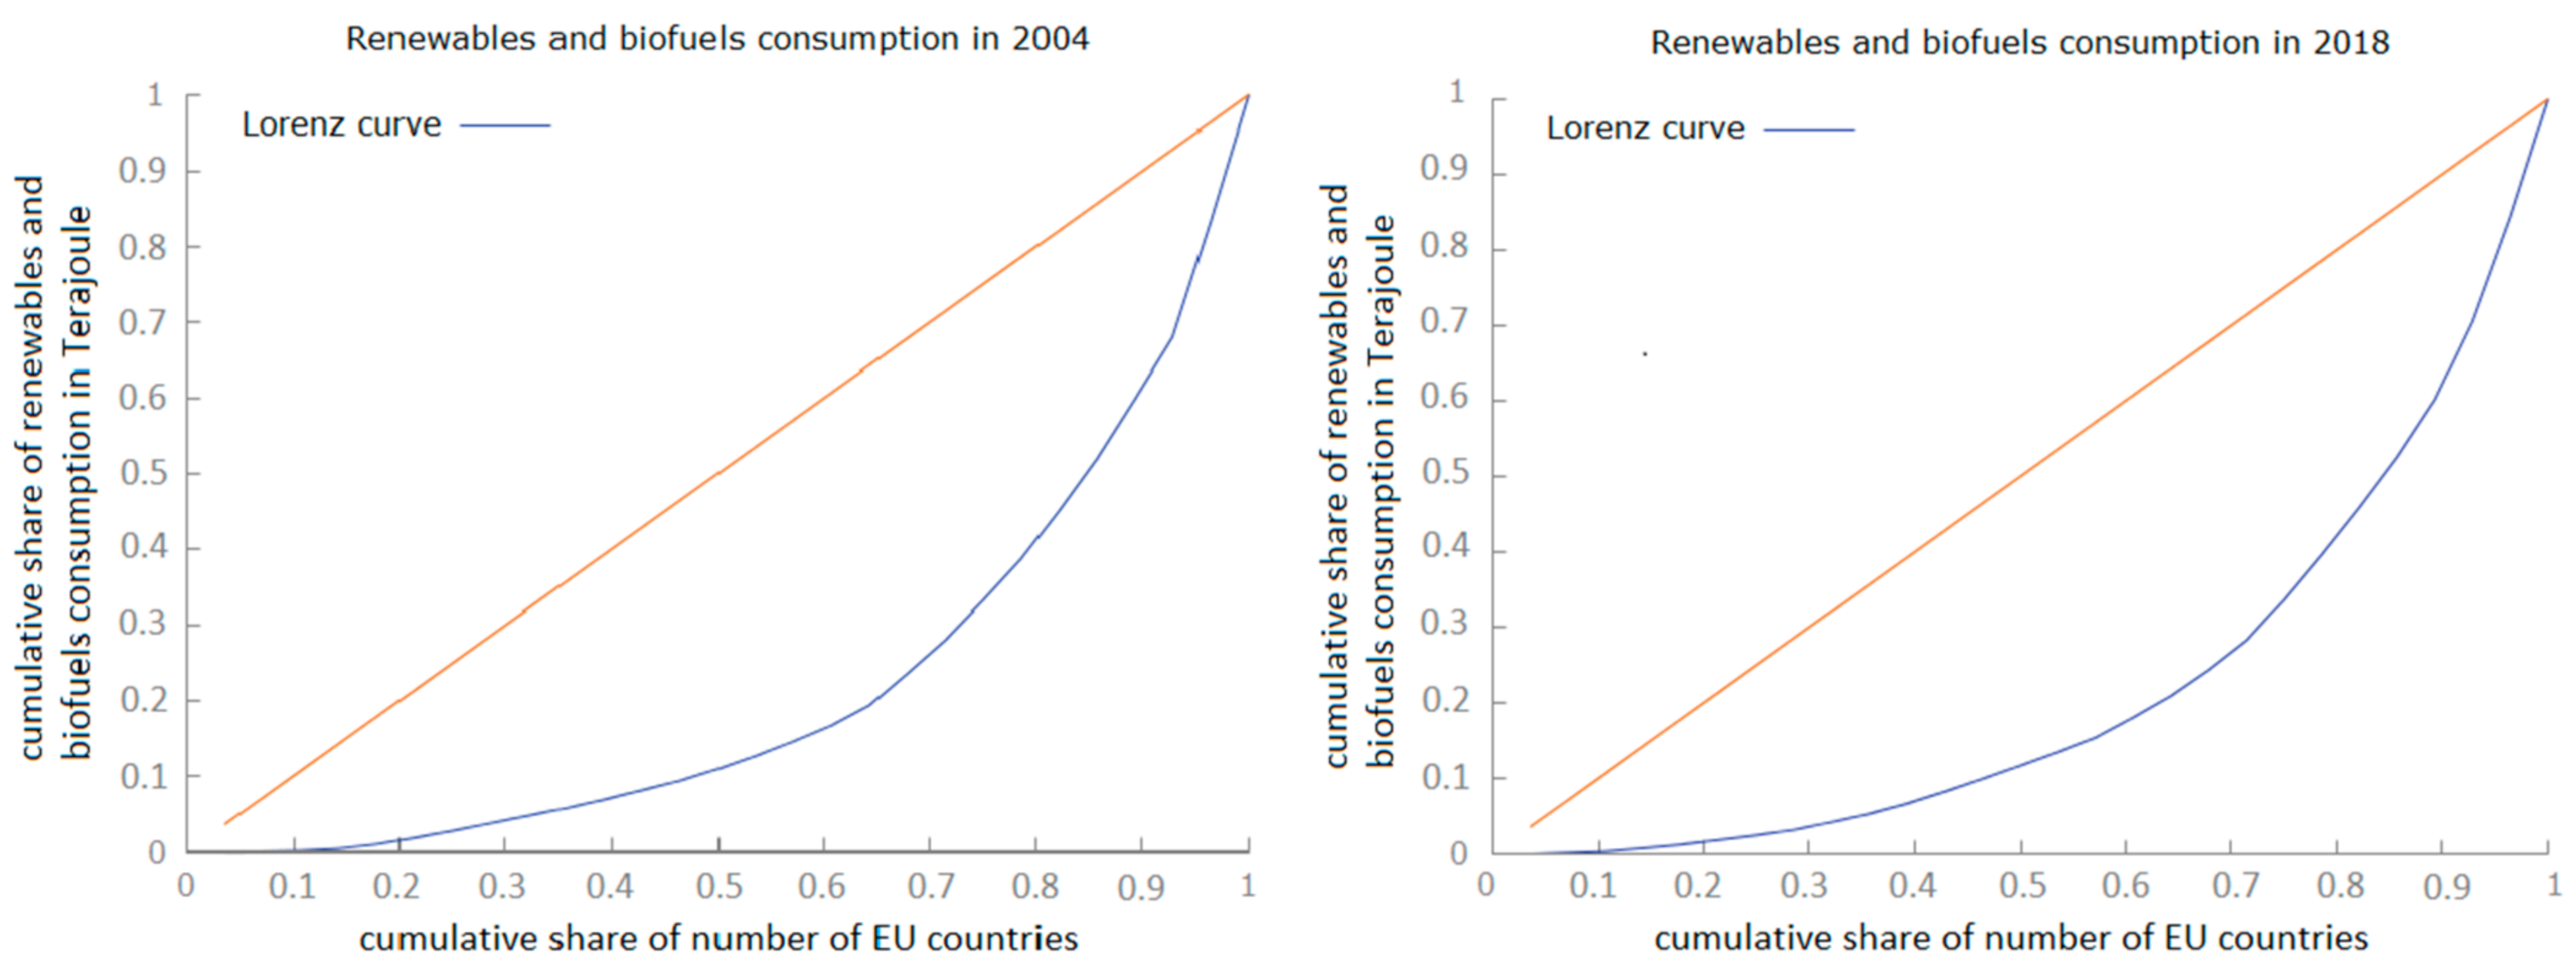
4.1. Renewable Energy in EU Countries
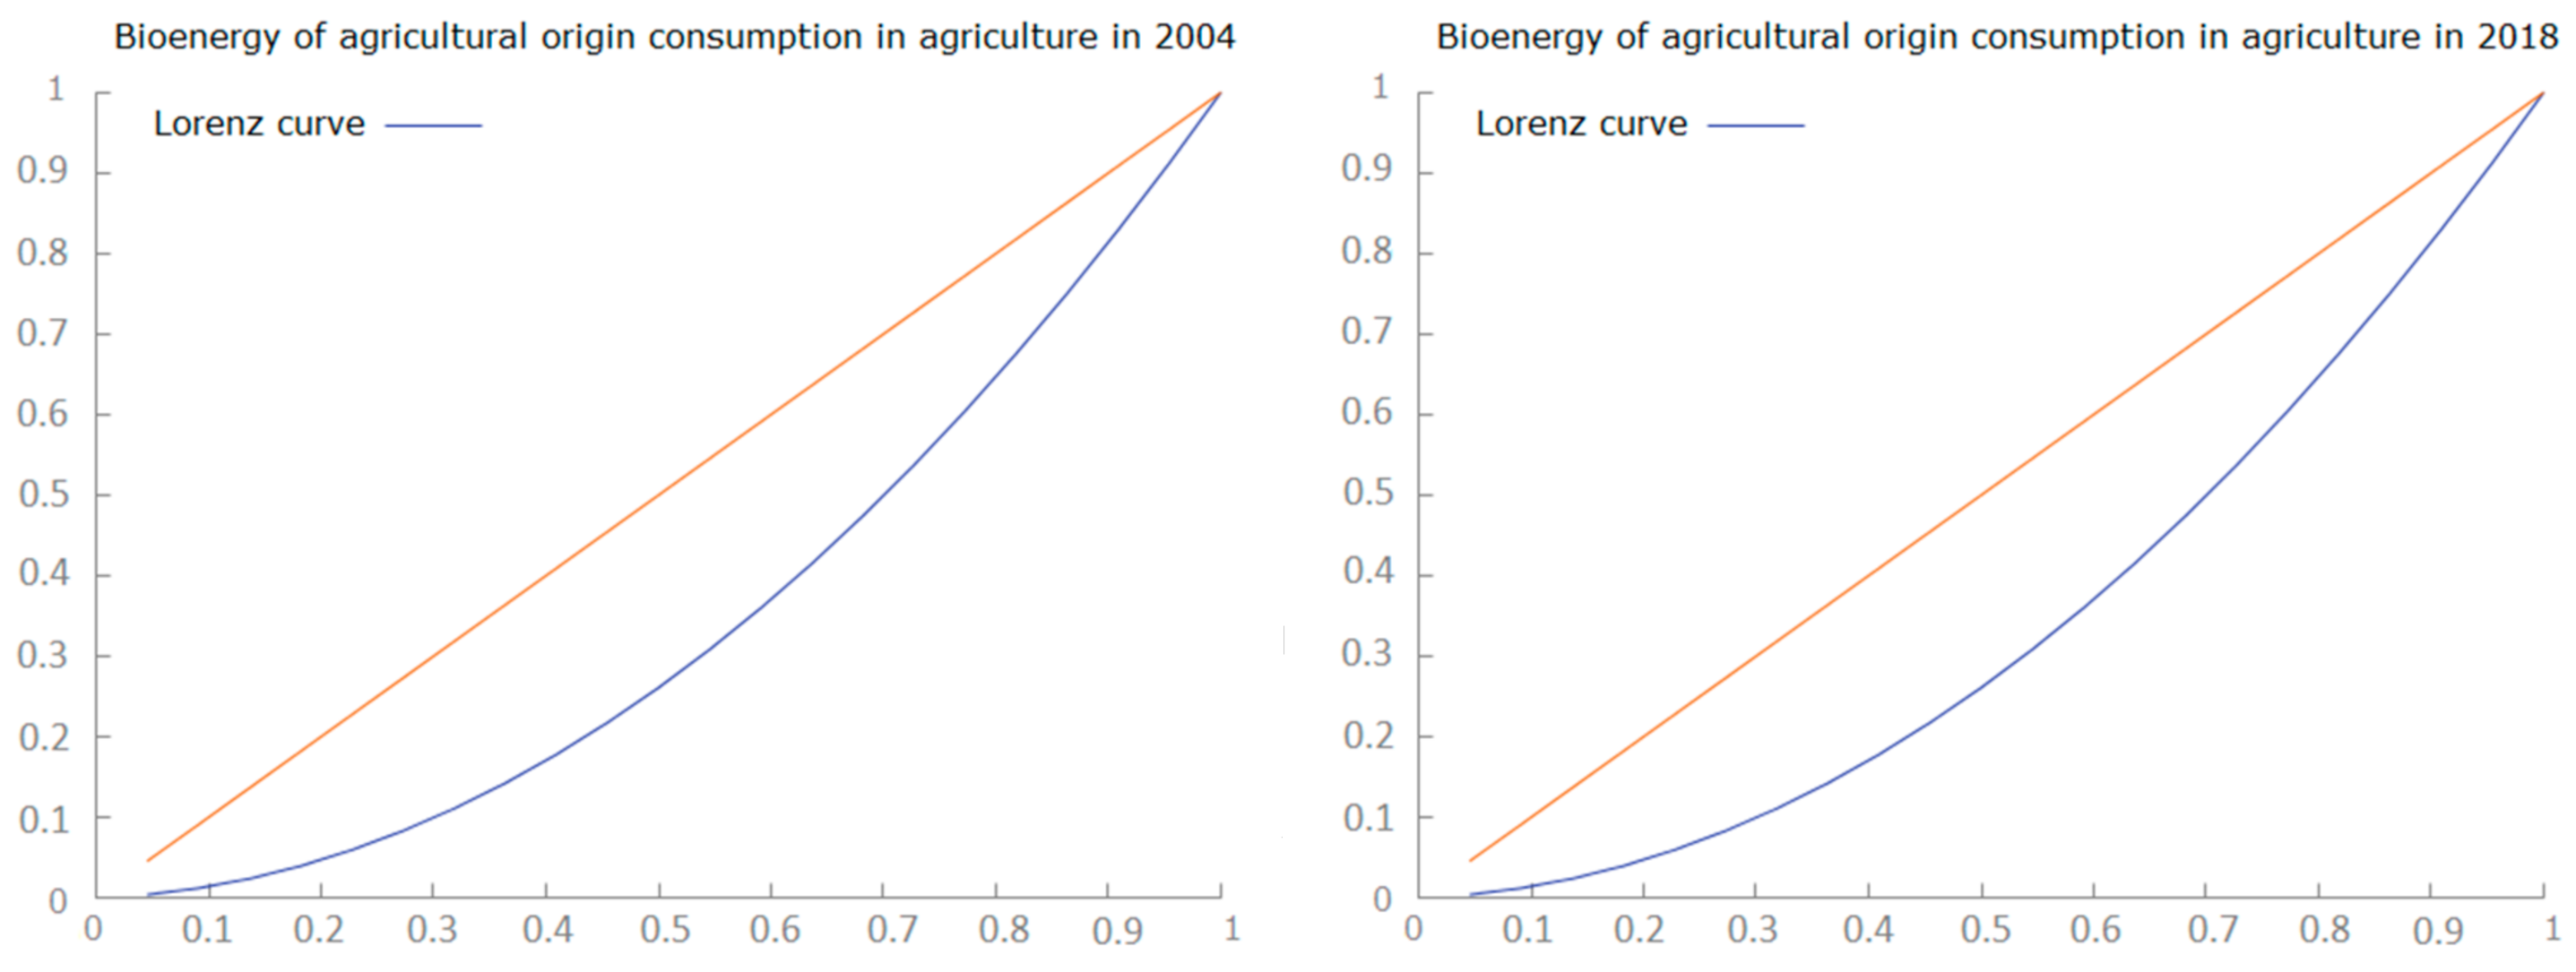
4.2. Consumption of Bioenergy of Agricultural Origin in Agriculture
5. Discussion
6. Conclusions
Author Contributions
Funding
Institutional Review Board Statement
Informed Consent Statement
Data Availability Statement
Conflicts of Interest
References
- Le, T.H.; Nguyen, C.P. Is energy security a driver for economic growth? Evidence from a global sample. Energy Policy 2019, 129, 436–451. [Google Scholar] [CrossRef]
- Le, T.H.; Nguyen, C.P.; Su, T.D.; Tran-Nam, B. The Kuznets curve for export diversification and income inequality: Evidence from a global sample. Econ. Anal. Policy 2020, 65, 21–39. [Google Scholar] [CrossRef]
- Fang, D.; Shi, S.; Yu, Q. Evaluation of sustainable energy security and an empirical analysis of China. Sustainability 2018, 10, 1685. [Google Scholar] [CrossRef]
- International cooperation to accelerate sustainable development in developing countries and related domestic policies. In Proceedings of the Report of the United Nations Conference on Environment and Development, Rio de Janeiro, Brazil, 3–14 June 1992; United Nations: New York, NY, USA, 1993; Volume 1.
- Tuxworth, B. From environment to sustainability: Surveys and analysis of Local Agenda 21 process development in UK local authorities. Local Environ. 1996, 1, 277–297. [Google Scholar] [CrossRef]
- Biermann, F. Earth System Governance-Beyond Traditional Environmental Policy. GAIA Ecol. Perspect. Sci. Soc. 2018, 27, 337. [Google Scholar] [CrossRef]
- Fouquet, D.; Johansson, T.B. European renewable energy policy at crossroads—Focus on electricity support mechanisms. Energy Policy 2008, 36, 4079–4092. [Google Scholar] [CrossRef]
- Jacobsson, S.; Bergek, A.; Finon, D.; Lauber, V.; Mitchell, C.; Toke, D.; Verbruggen, A. EU renewable energy support policy: Faith or facts? Energy Policy 2009, 37, 2143–2146. [Google Scholar] [CrossRef]
- Directive 2009/28/EC of the European Parliament and of the Council of 23 April 2009 on the Promotion of the Use of Energy from Renewable Sources and Amending and Subsequently Repealing Directives 2001/77/EC and 2003/30/EC. Off. J. Eur. Union 2009, 140, 16–62.
- Klessmann, C.; Held, A.; Rathmann, M.; Ragwitz, M. Status and perspectives of renewable energy policy and deployment in the European Union—What is needed to reach the 2020 targets? Energy Policy 2011, 39, 7637–7657. [Google Scholar] [CrossRef]
- European Commission. Green Paper A 2030 Framework for Climate and Energy Policies; EC European Commission: Brussels, Belgium, 2013. [Google Scholar]
- Klessmann, C. The evolution of flexibility mechanisms for achieving European renewable energy targets 2020—ex-ante evaluation of the principle mechanisms. Energy Policy 2009, 37, 4966–4979. [Google Scholar] [CrossRef]
- Paska, J.; Surma, T. Electricity generation from renewable energy sources in Poland. Renew. Energy 2014, 71, 286–294. [Google Scholar] [CrossRef]
- The European Green Deal. Communication from The Commission to The European Parliament, The European Council, The Council, The European Economic and Social Committee and The Committee of The Regions. COM/2019/640 Final. Available online: https://ec.europa.eu/info/sites/info/files/european-green-deal-communication_en.pdf (accessed on 31 March 2021).
- Sanz-Casado, E.; Lascurain-Sánchez, M.L.; Serrano-Lopez, A.E.; Larsen, B.; Ingwersen, P. Production, consumption and research on solar energy: The Spanish and German case. Renew. Energy 2014, 68, 733–744. [Google Scholar] [CrossRef]
- Meyer, N.I. Learning from wind energy policy in the EU: Lessons from Denmark, Sweden and Spain. Eur. Environ. 2007, 17, 347–362. [Google Scholar] [CrossRef]
- Brook, B.W.; Alonso, A.; Meneley, D.A.; Misak, J.; Blees, T.; van Erp, J.B. Why nuclear energy is sustainable and has to be part of the energy mix. Sustain. Mater. Technol. 2014, 1, 8–16. [Google Scholar] [CrossRef]
- Flamos, A.; Georgallis, P.G.; Doukas, H.; Psarras, J. Using biomass to achieve European Union Energy Targets—A review of biomass status, potential, and supporting policies. Int. J. Green Energy 2011, 8, 411–428. [Google Scholar] [CrossRef]
- Hashemi, H.; Safari, M.; Ebrahimi, A.; Samaei, M.R.; Khodabakhshi, A. Feasibility of large amounts biogas production from garbage bioliquid. Int. J. Health Syst. Disaster Manag. 2015, 3, 147–150. [Google Scholar]
- Owusu, P.A.; Asumadu-Sarkodie, S. A review of renewable energy sources, sustainability issues and climate change mitigation. Cogent Eng. 2016, 3, 1167990. [Google Scholar] [CrossRef]
- Liang, X. Emerging power quality challenges due to integration of renewable energy sources. IEEE Trans. Ind. Appl. 2016, 53, 855–866. [Google Scholar] [CrossRef]
- Tareen, W.U.K.; Anjum, Z.; Yasin, N.; Siddiqui, L.; Farhat, I.; Malik, S.A.; Aamir, M. The prospective non-conventional alternate and renewable energy sources in Pakistan—A focus on biomass energy for power generation, transportation, and industrial fuel. Energies 2018, 11, 2431. [Google Scholar] [CrossRef]
- Rodríguez-Monroy, C.; Mármol-Acitores, G.; Nilsson-Cifuentes, G. Electricity generation in Chile using non-conventional renewable energy sources—A focus on biomass. Renew. Sustain. Energy Rev. 2018, 81, 937–945. [Google Scholar]
- Khan, K.A.; Hasan, M.; Islam, M.A.; Alim, M.A.; Asma, U.; Hassan, L.; Ali, M.H. A study on conventional energy sources for power production. Int. J. Adv. Res. Innov. Ideas Educ. 2018, 4, 214–228. [Google Scholar]
- Shahzad, U. The need for renewable energy sources. Energy Int. J. Inf. Technol. Electr. Eng. 2012, 2, 16–18. [Google Scholar]
- Inglesi-Lotz, R. The impact of renewable energy consumption to economic growth: A panel data application. Energy Econ. 2016, 53, 58–63. [Google Scholar] [CrossRef]
- Gradziuk, P.; Gradziuk, B. Renewable energy sources as a development opportunity for peripheral areas. Econ. Reg. Stud. 2020, 13, 184–198. [Google Scholar] [CrossRef]
- Timmons, D.; Harris, J.M.; Roach, B. The Economics of Renewable Energy; Global Development and Environment Institute; Tufts University: Medford, MA, USA, 2014; Volume 52, pp. 1–52. [Google Scholar]
- Ray, P. Renewable energy and sustainability. Clean Technol. Environ. Policy 2019, 21, 1517–1533. [Google Scholar] [CrossRef]
- Gradziuk, P.; Gradziuk, B. Employment impacts of renewable energy in UE. In Proceedings of the 2018 International Scientific Conference Economic Sciences for Agribusiness and Rural Economy, Warsaw, Poland, 7–8 June 2018; Warsaw University of Life Sciences–SGGW Faculty of Economic Sciences: Warsaw, Poland, 2018; Volume 1, pp. 259–267. [Google Scholar]
- Gradziuk, P.; Bańkowska, K. Renewable Energy–Implications for Agriculture and Rural Development in Poland. Wieś Rol. 2017, 3, 121–146. [Google Scholar]
- Malek, A.A.; Hasanuzzaman, M.; Abd Rahim, N. Prospects, progress, challenges and policies for clean power generation from biomass resources. Clean Technol. Environ. Policy 2020, 22, 1–25. [Google Scholar]
- Saha, S.; Ruslan, A.R.M.; Morshed, A.M.; Hasanuzzaman, M. Global prospects and challenges of latent heat thermal energy storage: A review. Clean Technol. Environ. Policy 2020, 23, 1–29. [Google Scholar]
- Roy, N.K.; Das, A. Prospects of renewable energy sources. In Renewable Energy and the Environment; Springer: Singapore, 2018; pp. 1–39. [Google Scholar]
- Eckstein, D.; Künzel, V.; Schäfer, L.; Winges, M. Global Climate Risk Index. Germanwatch. 2020. Available online: https://germanwatch.org/sites/germanwatch.org/files/20-2-01e%20Global,20 (accessed on 17 March 2021).
- Uğurlu, E. Renewable Energy Strategies for Sustainable Development in the European Union. In Renewable Energy; Palgrave Macmillan: Cham, Switzerland, 2019; pp. 63–87. [Google Scholar]
- Uğurlu, E. Greenhouse gases emissions and alternative energy in the Middle East. In Climate Change and Energy Dynamics in the Middle East; Springer: Cham, Switzerland, 2019; pp. 259–291. [Google Scholar]
- Renewables Information. 2020 Edition, Database Documentation. IEA. Available online: https://iea.blob.core.windows.net/assets/a1bd577e-14d0-4d4c-8b01-4e20ae1ded07/REN_Documentation1.pdf (accessed on 17 March 2021).
- Correa, D.F.; Beyer, H.L.; Fargione, J.E.; Hill, J.D.; Possingham, H.P.; Thomas-Hall, S.R.; Schenk, P.M. Towards the implementation of sustainable biofuel production systems. Renew. Sustain. Energy Rev. 2019, 107, 250–263. [Google Scholar] [CrossRef]
- Rodionova, M.V.; Poudyal, R.S.; Tiwari, I.; Voloshin, R.A.; Zharmukhamedov, S.K.; Nam, H.G.; Zayadan, B.K.; Bruce, B.D.; Hou, H.J.M.; Allakhverdiev, S.I. Biofuel production: Challenges and opportunities. Int. J. Hydrog. Energy 2017, 42, 8450–8461. [Google Scholar] [CrossRef]
- Raud, M.; Kikas, T.; Sippula, O.; Shurpali, N.J. Potentials and challenges in lignocellulosic biofuel production technology. Renew. Sustain. Energy Rev. 2019, 111, 44–56. [Google Scholar] [CrossRef]
- Sutherland, L.A.; Peter, S.; Zagata, L. Conceptualising multi-regime interactions: The role of the agriculture sector in renewable energy transitions. Res. Policy 2015, 44, 1543–1554. [Google Scholar] [CrossRef]
- Pigford, A.A.E.; Hickey, G.M.; Klerkx, L. Beyond agricultural innovation systems? Exploring an agricultural innovation ecosystems approach for niche design and development in sustainability transitions. Agric. Syst. 2018, 164, 116–121. [Google Scholar] [CrossRef]
- El Bilali, H. The Multi-Level Perspective in Research on Sustainability Transitions in Agriculture and Food Systems: A Systematic Review. Agriculture 2019, 9, 74. [Google Scholar] [CrossRef]
- Melchior, I.C.; Newig, J. Governing Transitions towards Sustainable Agriculture—Taking Stock of an Emerging Field of Research. Sustainability 2021, 13, 528. [Google Scholar] [CrossRef]
- Zambon, I.; Cecchini, M.; Mosconi, E.M.; Colantoni, A. Revolutionizing Towards Sustainable Agricultural Systems: The Role of Energy. Energies 2019, 12, 3659. [Google Scholar] [CrossRef]
- Fortunati, S.; Morea, D.; Mosconi, E.M. Circular economy and corporate social responsibility in the agricultural system: Cases study of the Italian agri-food industry. Agric. Econ. 2020, 66, 489–498. [Google Scholar]
- Ruiz-Fuensanta, M.J.; Gutiérrez-Pedrero, M.-J.; Tarancón, M.-Á. The Role of Regional Determinants in the Deployment of Renewable Energy in Farms. The Case of Spain. Sustainability 2019, 11, 5937. [Google Scholar] [CrossRef]
- Pérez-Neira, D.; Soler-Montiel, M.; Gutiérrez-Peña, R.; Mena-Guerrero, Y. Energy Assessment of Pastoral Dairy Goat Husbandry from an Agroecological Economics Perspective. A Case Study in Andalusia (Spain). Sustainability 2018, 10, 2838. [Google Scholar] [CrossRef]
- Saganeiti, L.; Pilogallo, A.; Faruolo, G.; Scorza, F.; Murgante, B. Territorial Fragmentation and Renewable Energy Source Plants: Which Relationship? Sustainability 2020, 12, 1828. [Google Scholar] [CrossRef]
- Morea, D.; Poggi, L.A. An innovative model for the sustainability of investments in the wind energy sector: The use of green sukuk in an Italian case study. Int. J. Energy Econ. Policy 2017, 7, 53–60. [Google Scholar]
- Chodkowska-Miszczuk, J.; Szymańska, D. Update of the review: Cultivation of energy crops in Poland against socio-demographic factors. Renew. Sustain. Energy Rev. 2011, 15, 4242–4247. [Google Scholar] [CrossRef]
- Chodkowska-Miszczuk, J.; Szymańska, D. Agricultural biogas plants—A chance for diversification of agriculture in Poland. Renew. Sustain. Energy Rev. 2013, 20, 514–518. [Google Scholar] [CrossRef]
- Monforti, F.; Bódis, K.; Scarlat, N.; Dallemand, J.F. The possible contribution of agricultural crop residues to renewable energy targets in Europe: A spatially explicit study. Renew. Sustain. Energy Rev. 2013, 19, 666–677. [Google Scholar] [CrossRef]
- Avcıoğlu, A.O.; Dayıoğlu, M.A.; Türker, U. Assessment of the energy potential of agricultural biomass residues in Turkey. Renew. Energy 2019, 138, 610–619. [Google Scholar] [CrossRef]
- Kour, D.; Rana, K.L.; Yadav, N.; Yadav, A.N.; Rastegari, A.A.; Singh, C.; Negi, P.; Singh, K.; Saxena, A.K. Technologies for biofuel production: Current development, challenges, and future prospects. In Prospects of Renewable Bioprocessing in Future Energy Systems; Springer: Cham, Switzerland, 2019; pp. 1–50. [Google Scholar]
- Ahorsu, R.; Medina, F.; Constantí, M. Significance and challenges of biomass as a suitable feedstock for bioenergy and biochemical production: A review. Energies 2018, 11, 3366. [Google Scholar] [CrossRef]
- Voloshin, R.A.; Rodionova, M.V.; Zharmukhamedov, S.K.; Veziroglu, T.N.; Allakhverdiev, S.I. Biofuel production from plant and algal biomass. Int. J. Hydrog. Energy 2016, 41, 17257–17273. [Google Scholar] [CrossRef]
- Eckert, C.T.; Frigo, E.P.; Albrecht, L.P.; Albrecht, A.J.P.; Christ, D.; Santos, W.G.; Berkembrock, E.; Egewarth, V.A. Maize ethanol production in Brazil: Characteristics and perspectives. Renew. Sustain. Energy Rev. 2018, 82, 3907–3912. [Google Scholar] [CrossRef]
- Manochio, C.; Andrade, B.R.; Rodriguez, R.P.; Moraes, B.S. Ethanol from biomass: A comparative overview. Renew. Sustain. Energy Rev. 2017, 80, 743–755. [Google Scholar] [CrossRef]
- Bajwa, D.S.; Peterson, T.; Sharma, N.; Shojaeiarani, J.; Bajwa, S.G. A review of densified solid biomass for energy production. Renew. Sustain. Energy Rev. 2018, 96, 296–305. [Google Scholar] [CrossRef]
- Alvira, P.; Tomás-Pejó, E.; Ballesteros, M.; Negro, M.J. Pretreatment technologies for an efficient bioethanol production process based on enzymatic hydrolysis: A review. Bioresour. Technol. 2010, 101, 4851–4861. [Google Scholar] [CrossRef] [PubMed]
- Chisti, Y. Biodiesel from microalgae beats bioethanol. Trends Biotechnol. 2008, 26, 126–131. [Google Scholar] [CrossRef] [PubMed]
- Hu, Q.; Sommerfeld, M.; Jarvis, E.; Ghirardi, M.; Posewitz, M.; Seibert, M.; Darzins, A. Microalgal triacylglycerols as feedstocks for biofuel production: Perspectives and advances. Plant J. 2008, 54, 621–639. [Google Scholar] [CrossRef] [PubMed]
- Gouveia, L.; Oliveira, A.C. Microalgae as a raw material for biofuels production. J. Ind. Microbiol. Biotechnol. 2009, 36, 269–274. [Google Scholar] [CrossRef]
- Lardon, L.; Hélias, A.; Sialve, B.; Steyer, J.-P.; Bernard, O. Life-Cycle Assessment of Biodiesel Production from Microalgae. Environ. Sci. Technol. 2009, 43, 6475–6481. [Google Scholar] [CrossRef]
- Dragone, G.; Fernandes, B.; Vicente, A.; Teixeira, J. Third generation biofuels from microalgae. Curr. Res. Technol. Educ. Top. Appl. Microbiol. Microb. Biotechnol. 2010, 1355–1366. [Google Scholar]
- Hays, S.G.; Ducat, D.C. Engineering cyanobacteria as photosynthetic feedstock factories. Photosynth. Res. 2015, 123, 285–295. [Google Scholar] [CrossRef]
- Berla, B.M.; Saha, R.; Immethun, C.M.; Maranas, C.D.; Moon, T.S.; Pakrasi, H.B. Synthetic biology of cyanobacteria: Unique challenges and opportunities. Front. Microbiol. 2013, 4, 1–14. [Google Scholar] [CrossRef]
- Scaife, M.A.; Nguyen, G.T.D.T.; Rico, J.; Lambert, D.; Helliwell, K.E.; Smith, A.G. Establishing Chlamydomonas reinhardtii as an industrial biotechnology host. Plant J. 2015, 82, 532–546. [Google Scholar] [CrossRef] [PubMed]
- Liu, J.; Mooney, H.; Hull, V.; Davis, S.J.; Gaskell, J.; Hertel, T.; Li, S. Systems integration for global sustainability. Science 2015, 347, 1258832. [Google Scholar] [CrossRef]
- Xu, Z.; Chen, X.; Liu, J.; Zhang, Y.; Chau, S.; Bhattarai, N.; Li, Y. Impacts of irrigated agriculture on food–energy–water–CO2 nexus across metacoupled systems. Nat. Commun. 2020, 11, 1–12. [Google Scholar] [CrossRef] [PubMed]
- Pandey, V.C.; Bajpai, O.; Singh, N. Energy crops in sustainable phytoremediation. Renew. Sustain. Energy Rev. 2016, 54, 58–73. [Google Scholar] [CrossRef]
- Liguras, D.K.; Verykios, X.E. A novel, highly efficient and environmentally friendly process for combined heat and power production from biomass. In Proceedings of the 8th International Conference on Environmental Science and Technology, Lemnos Island, Greece, 8–10 September 2003. [Google Scholar]
- Martinho, V.J.P.D. Interrelationships between renewable energy and agricultural economics: An overview. Energy Strategy Rev. 2018, 22, 396–409. [Google Scholar] [CrossRef]
- Chel, A.; Kaushik, G. Renewable energy for sustainable agriculture. Agron. Sust. Dev. 2011, 31, 91–118. [Google Scholar] [CrossRef]
- Martinho, V.J.P.D. Agricultural entrepreneurship in the European Union: Contributions for a sustainable development. Appl. Sci. 2020, 10, 2080. [Google Scholar] [CrossRef]
- Bayrakcı, A.G.; Koçar, G. Utilization of renewable energies in Turkey’s agriculture. Renew. Sustain. Energy Rev. 2012, 16, 618–633. [Google Scholar] [CrossRef]
- Koçar, G.; Civaş, N. An overview of biofuels from energy crops: Current status and future prospects. Renew. Sustain. Energy Rev. 2013, 28, 900–916. [Google Scholar] [CrossRef]
- Igliński, B.; Buczkowski, R.; Iglińska, A.; Cichosz, M.; Piechota, G.; Kujawski, W. Agricultural biogas plants in Poland: Investment process, economical and environmental aspects, biogas potential. Renew. Sustain. Energy Rev. 2012, 16, 4890–4900. [Google Scholar] [CrossRef]
- Mekhilef, S.; Faramarzi, S.Z.; Saidur, R.; Salam, Z. The application of solar technologies for sustainable development of agricultural sector. Renew. Sustain. Energy Rev. 2013, 18, 583–594. [Google Scholar] [CrossRef]
- Nacer, T.; Hamidat, A.; Nadjemi, O. A comprehensive method to assess the feasibility of renewable energy on Algerian dairy farms. J. Clean. Prod. 2016, 112, 3631–3642. [Google Scholar] [CrossRef]
- Goncalves, F.A.; dos Santos, E.S.; de Macedo, G.R. Use of cultivars of low cost, agroindustrial and urban waste in the production of cellulosic ethanol in Brazil: A proposal to utilization of microdistillery. Renew. Sustain. Energy Rev. 2015, 50, 1287–1303. [Google Scholar] [CrossRef]
- Paramati, S.R.; Ummalla, M.; Apergis, N. The effect of foreign direct investment and stock market growth on clean energy use across a panel of emerging market economies. Energy Econ. 2016, 56, 29–41. [Google Scholar] [CrossRef]
- Paramati, S.R.; Apergis, N.; Ummalla, M. Financing clean energy projects through domestic and foreign capital: The role of political cooperation among the EU, the G20 and OECD countries. Energy Econ. 2017, 61, 62–71. [Google Scholar] [CrossRef]
- Lee, J.W. The contribution of foreign direct investment to clean energy use, carbon emissions and economic growth. Energy Policy 2013, 55, 483–489. [Google Scholar] [CrossRef]
- Sbia, R.; Shahbaz, M.; Hamdi, H. A contribution of foreign direct investment, clean energy, trade openness, carbon emissions and economic growth to energy demand in UAE. Econ. Model. 2014, 36, 191–197. [Google Scholar] [CrossRef]
- Dixon, P.M.; Weiner, J.; Mitchell-Olds, T.; Woodley, R. Erratum to ’Bootstrapping the Gini Coefficient of Inequality. Ecology 1988, 69, 1307. [Google Scholar] [CrossRef]
- Dagum, C. The Generation and Distribution of Income, the Lorenz Curve and the Gini Ratio. Econ. Appliquée 1980, 33, 327–367. [Google Scholar]
- Starzyńska, W. Statystyka Praktyczna; Wydawnictwo Naukowe PWN: Warszawa, Poland, 2002. [Google Scholar]
- Kendall, M.G. Rank Correlation Methods; Griffin: London, UK, 1955; Volume 19. [Google Scholar]
- Spearman, C. The proof and measurement of association between two things. Am. J. Psychol. 1904, 15, 72–101. [Google Scholar] [CrossRef]
- Statistical Review of World Energy 2020; 69th ed. Available online: https://www.bp.com/content/dam/bp/business-sites/en/global/corporate/pdfs/energy-economics/statistical-review/bp-stats-review-2020-full-report.pdf (accessed on 19 December 2020).
- Statistical Review of World Energy. Available online: https://www.bp.com/en/global/corporate/energy-economics/statistical-review-of-world-energy.html (accessed on 19 December 2020).
- Kazar, G.; Kazar, A. The renewable energy production-economic development nexus. Int. J. Energy Econ. Policy 2014, 4, 312–319. [Google Scholar]
- Apergis, N.; Payne, J.E. Renewable energy consumption and economic growth: Evidence from a panel of OECD countries. Energy Policy 2010, 38, 656–660. [Google Scholar] [CrossRef]
- Sadorsky, P. Renewable energy consumption and income in emerging economies. Energy Policy 2009, 37, 4021–4028. [Google Scholar] [CrossRef]
- Pao, H.T.; Fu, H.C. Renewable energy, non-renewable energy and economic growth in Brazil. Renew. Sustain. Energy Rev. 2013, 25, 381–392. [Google Scholar] [CrossRef]
- Lin, B.; Moubarak, M. Renewable energy consumption–economic growth nexus for China. Renew. Sustain. Energy Rev. 2014, 40, 111–117. [Google Scholar] [CrossRef]
- Shahbaz, M.; Loganathan, N.; Zeshan, M.; Zaman, K. Does renewable energy consumption add in economic growth? An application of auto-regressive distributed lag model in Pakistan. Renew. Sustain. Energy Rev. 2015, 44, 576–585. [Google Scholar] [CrossRef]
- Khoshnevis Yazdi, S.; Shakouri, B. The globalization, financial development, renewable energy, and economic growth. Energy Sourcespart. B Econ. Plan. Policy 2017, 12, 707–714. [Google Scholar] [CrossRef]
- Leitão, N.C. Economic growth, carbon dioxide emissions, renewable energy and globalization. Int. J. Energy Econ. Policy 2014, 3, 391–399. [Google Scholar]
- Bhattacharya, M.; Paramati, S.R.; Ozturk, I.; Bhattacharya, S. The effect of renewable energy consumption on economic growth: Evidence from top 38 countries. Appl. Energy 2016, 162, 733–741. [Google Scholar] [CrossRef]
- Saidi, K.; Omri, A. The impact of renewable energy on carbon emissions and economic growth in 15 major renewable energy-consuming countries. Environ. Res. 2020, 186, 109567. [Google Scholar] [CrossRef]
- Menegaki, A.N. Growth and renewable energy in Europe: A random effect model with evidence for neutrality hypothesis. Energy Econ. 2011, 33, 257–263. [Google Scholar] [CrossRef]
- Busu, M. Analyzing the impact of the renewable energy sources on economic growth at the EU level using an ARDL model. Mathematics 2020, 8, 1367. [Google Scholar] [CrossRef]
- Armeanu, D.Ş.; Vintilă, G.; Gherghina, Ş.C. Czy energia odnawialna napędza trwały wzrost gospodarczy? Wielowymiarowe dowody danych panelowych dla krajów UE-28. Energies 2017, 10, 381. [Google Scholar] [CrossRef]
- Rokicki, T.; Perkowska, A.; Klepacki, B.; Bórawski, P.; Bełdycka-Bórawska, A.; Michalski, K. Changes in Energy Consumption in Agriculture in the EU Countries. Energies 2021, 14, 1570. [Google Scholar] [CrossRef]
- Rokicki, T.; Perkowska, A. Diversity and Changes in the Energy Balance in EU Countries. Energies 2021, 14, 1098. [Google Scholar] [CrossRef]
- Rokicki, T.; Perkowska, A. Changes in Energy Supplies in the Countries of the Visegrad Group. Sustainability 2020, 12, 7916. [Google Scholar] [CrossRef]
- Rokicki, T.; Perkowska, A.; Klepacki, B.; Szczepaniuk, H.; Szczepaniuk, E.K.; Bereziński, S.; Ziółkowska, P. The Importance of Higher Education in the EU Countries in Achieving the Objectives of the Circular Economy in the Energy Sector. Energies 2020, 13, 4407. [Google Scholar] [CrossRef]
- Inumula, K.M.; Singh, S.; Solanki, S. Energy Consumption and Agricultural Economic Growth Nexus: Evidence from India. Int. J. Energy Econ. Policy 2020, 10, 545–552. [Google Scholar] [CrossRef]
- Alola, A.A.; Alola, U.V. Agricultural land usage and tourism impact on renewable energy consumption among Coastline Mediterranean Countries. Energy Environ. 2018, 29, 1438–1454. [Google Scholar] [CrossRef]
- Ben Jebli, M.; Ben Youssef, S. Renewable energy consumption and agriculture: Evidence for cointegration and Granger causality for Tunisian economy. Int. J. Sustain. Dev. World Ecol. 2017, 24, 149–158. [Google Scholar] [CrossRef]
- Jebli, M.B.; Youssef, S.B. Renewable Energy, Arable Land, Agriculture, CO2 Emissions, and Economic Growth in Morocco. MPRA Paper No. 767980. 2017. Available online: https://mpra.ub.uni-muenchen.de/76798/1/MPRA_paper_76798.pdf (accessed on 31 March 2021).
- Jebli, M.B.; Youssef, S.B. The role of renewable energy and agriculture in reducing CO2 emissions: Evidence for North Africa countries. Ecol. Indic. 2017, 74, 295–301. [Google Scholar] [CrossRef]
- Khan, M.T.I.; Ali, Q.; Ashfaq, M. The nexus between greenhouse gas emission, electricity production, renewable energy and agriculture in Pakistan. Renew. Energy 2018, 118, 437–451. [Google Scholar] [CrossRef]
- Rehman, A.; Ozturk, I.; Zhang, D. Związek przyczynowy między emisjami CO2 a wydajnością rolnictwa w Pakistanie: Dowody empiryczne z autoregresywnego podejścia do testowania granic opóźnienia. Appl. Sci. 2019, 9, 1692. [Google Scholar] [CrossRef]
- Ali, S.; Ying, L.; Shah, T.; Tariq, A.; Ali Chandio, A.; Ali, I. Analysis of the Nexus of CO2 Emissions, Economic Growth, Land under Cereal Crops and Agriculture Value-Added in Pakistan Using an ARDL Approach. Energies 2019, 12, 4590. [Google Scholar] [CrossRef]
- Ali, S.; Gucheng, L.; Ying, L.; Ishaq, M.; Shah, T. The Relationship between Carbon Dioxide Emissions, Economic Growth and Agricultural Production in Pakistan: An Autoregressive Distributed Lag Analysis. Energies 2019, 12, 4644. [Google Scholar] [CrossRef]
- Aydoğan, B.; Vardar, G. Evaluating the role of renewable energy, economic growth and agriculture on CO2 emission in E7 countries. Int. J. Sustain. Energy 2020, 39, 335–348. [Google Scholar] [CrossRef]
- Liu, X.; Zhang, S.; Bae, J. The impact of renewable energy and agriculture on carbon dioxide emissions: Investigating the environmental Kuznets curve in four selected ASEAN countries. J. Clean. Prod. 2017, 164, 1239–1247. [Google Scholar] [CrossRef]
- Jebli, M.B.; Youssef, S.B. Investigating the interdependence between non-hydroelectric renewable energy, agricultural value added, and arable land use in Argentina. Environ. Modeling Assess. 2019, 24, 533–546. [Google Scholar] [CrossRef]
- Al-Mulali, U.; Solarin, S.A.; Sheau-Ting, L.; Ozturk, I. Does moving towards renewable energy cause water and land inefficiency? An empirical investigation. Energy Policy 2016, 93, 303–314. [Google Scholar] [CrossRef]
- Destek, M.A.; Sinha, A. Renewable, non-renewable energy consumption, economic growth, trade openness and ecological footprint: Evidence from organisation for economic Co-operation and development countries. J. Clean. Prod. 2020, 242, 118537. [Google Scholar] [CrossRef]
- Destek, M.A.; Ulucak, R.; Dogan, E. Analyzing the environmental Kuznets curve for the EU countries: The role of ecological footprint. Environ. Sci. Pollut. Res. 2018, 25, 29387–29396. [Google Scholar] [CrossRef]
- Solarin, S.A.; Al-Mulali, U.; Gan, G.G.G.; Shahbaz, M. The impact of biomass energy consumption on pollution: Evidence from 80 developed and developing countries. Environ. Sci. Pollut. Res. 2018, 25, 22641–22657. [Google Scholar] [CrossRef]
- Wang, Z. Does biomass energy consumption help to control environmental pollution? Evidence from BRICS countries. Sci. Total Environ. 2019, 670, 1075–1083. [Google Scholar]
- Thrän, D.; Schaubach, K.; Majer, S.; Horschig, T. Governance of sustainability in the German biogas sector—adaptive management of the Renewable Energy Act between agriculture and the energy sector. Energy Sustain. Soc. 2020, 10, 1–18. [Google Scholar] [CrossRef]
- Gan, J.; Stupak, I.; Smith, C.T. Integrating policy, market, and technology for sustainability governance of agriculture-based biofuel and bioeconomic development in the US. Energy. Sustain. Soc. 2019, 9, 1–25. [Google Scholar]
- Piwowar, A. Biogaz rolniczy—ważny element okrężnego i niskoemisyjnego rozwoju w Polsce. Energies 2020, 13, 1733. [Google Scholar] [CrossRef]
- O’Connor, S.; Ehimen, E.; Pillai, S.C.; Power, N.; Lyons, G.A.; Bartlett, J. An Investigation of the Potential Adopment of Anaerobic Digestion for Energy Production in Irish Farms. Environments 2021, 8, 8. [Google Scholar] [CrossRef]
- O’Connor, S.; Ehimen, E.; Pillai, S.C.; Black, A.; Tormey, D.; Bartlett, J. Biogas production from small-scale anaerobic digestion plants on European farms. Renew. Sustain. Energy Rev. 2021, 110580. [Google Scholar] [CrossRef]


| Type of Coefficient | Gini Coefficients in Years | ||||
|---|---|---|---|---|---|
| 2004 | 2008 | 2011 | 2014 | 2018 | |
| from the sample | 0.57 | 0.58 | 0.56 | 0.56 | 0.56 |
| estimated | 0.59 | 0.60 | 0.58 | 0.58 | 0.58 |
| Countries | Average | Median | Minimal | Maximal | Range | Standard Deviation | Coefficient of Variation | Skewedness | Curtosis |
|---|---|---|---|---|---|---|---|---|---|
| Austria | 30.65 | 32.11 | 22.55 | 33.81 | 11.25 | 3.58 | 11.70 | −1.08 | −0.11 |
| Belgium | 6.16 | 6.68 | 1.89 | 9.92 | 8.03 | 2.76 | 44.76 | −0.25 | −1.39 |
| Bulgaria | 14.88 | 14.99 | 9.10 | 21.56 | 12.47 | 4.50 | 30.24 | −0.08 | −1.51 |
| Croatia | 25.73 | 26.07 | 21.99 | 28.97 | 6.98 | 2.50 | 9.71 | −0.21 | −1.53 |
| Cyprus | 7.48 | 6.70 | 3.07 | 13.90 | 10.83 | 3.51 | 46.96 | 0.43 | −0.81 |
| Czechia | 11.70 | 11.88 | 6.77 | 16.24 | 9.47 | 3.41 | 29.11 | −0.18 | −1.55 |
| Denmark | 25.05 | 24.43 | 14.84 | 37.20 | 22.36 | 7.53 | 30.07 | 0.18 | −1.35 |
| Estonia | 24.11 | 25.33 | 15.97 | 31.89 | 15.92 | 5.13 | 21.29 | −0.27 | −1.24 |
| Finland | 34.90 | 33.50 | 28.81 | 43.08 | 14.27 | 4.88 | 13.99 | 0.25 | −1.44 |
| France | 12.95 | 12.97 | 9.34 | 17.22 | 7.88 | 2.63 | 20.34 | 0.05 | −1.32 |
| Germany | 12.37 | 13.00 | 6.21 | 17.35 | 11.15 | 3.34 | 26.97 | −0.34 | −0.92 |
| Greece | 12.45 | 12.45 | 7.16 | 19.68 | 12.52 | 4.35 | 34.92 | 0.13 | −1.48 |
| Hungary | 11.76 | 12.68 | 4.36 | 16.21 | 11.84 | 3.50 | 29.78 | −0.71 | −0.69 |
| Ireland | 6.76 | 6.79 | 2.38 | 11.98 | 9.61 | 3.09 | 45.68 | 0.10 | −1.22 |
| Italy | 13.79 | 14.23 | 6.32 | 18.27 | 11.95 | 4.11 | 29.78 | −0.49 | −1.15 |
| Latvia | 34.99 | 35.01 | 29.62 | 40.98 | 11.36 | 3.77 | 10.78 | 0.01 | −1.33 |
| Lithuania | 21.24 | 20.69 | 16.48 | 26.04 | 9.56 | 3.61 | 17.00 | 0.04 | −1.54 |
| Luxembourg | 3.85 | 3.02 | 0.90 | 8.97 | 8.07 | 2.19 | 56.98 | 0.82 | 0.01 |
| Malta | 3.14 | 2.36 | 0.10 | 8.49 | 8.39 | 3.10 | 99.00 | 0.47 | −1.28 |
| The Netherlands | 4.73 | 4.59 | 2.03 | 8.77 | 6.74 | 1.81 | 38.22 | 0.55 | −0.18 |
| Poland | 9.74 | 10.66 | 6.89 | 12.16 | 5.28 | 2.07 | 21.22 | −0.39 | −1.54 |
| Portugal | 25.64 | 24.59 | 19.21 | 30.87 | 11.66 | 4.21 | 16.42 | −0.02 | −1.39 |
| Romania | 21.88 | 22.83 | 16.81 | 25.03 | 8.22 | 2.98 | 13.63 | −0.63 | −1.14 |
| Slovenia | 20.68 | 20.93 | 18.37 | 22.86 | 4.49 | 1.40 | 6.75 | −0.40 | −0.82 |
| Slovakia | 10.07 | 10.24 | 6.36 | 16.89 | 10.53 | 2.81 | 27.88 | 0.60 | 0.26 |
| Spain | 13.71 | 14.07 | 8.34 | 18.35 | 10.01 | 3.49 | 25.48 | −0.31 | −1.31 |
| Sweden | 48.45 | 49.08 | 38.68 | 56.39 | 17.71 | 5.46 | 11.27 | −0.32 | −1.09 |
| United Kingdom | 5.47 | 4.43 | 1.10 | 12.34 | 11.24 | 3.69 | 67.32 | 0.49 | −1.05 |
| European Union | 13.93 | 14.03 | 8.56 | 18.88 | 10.32 | 3.35 | 24.06 | −0.18 | −1.27 |
| Type of Coefficient | Gini Coefficients in Years | ||||
|---|---|---|---|---|---|
| 2004 | 2008 | 2011 | 2014 | 2018 | |
| from the sample | 0.32 | 0.32 | 0.32 | 0.32 | 0.32 |
| estimated | 0.33 | 0.33 | 0.33 | 0.33 | 0.33 |
| Countries | Dynamics of Changes in the Years | ||||
|---|---|---|---|---|---|
| 2004–2008 | 2011–2008 | 2014–2011 | 2018–2014 | 2004–2018 | |
| Austria | 92.24 | 110.50 | 109.34 | 100.19 | 103.54 |
| Belgium | 1357.14 | 188.27 | 155.99 | 90.83 | 170.31 |
| Bulgaria | 63.38 | 166.67 | 192.00 | 71.18 | 139.96 |
| Czechia | 86.98 | 280.73 | 235.99 | 110.42 | 428.73 |
| Denmark | 110.72 | 94.34 | 97.35 | 101.83 | 526.89 |
| Estonia | 118.75 | 107.24 | 151.53 | 88.26 | 348.70 |
| Finland | 103.35 | 108.93 | 126.80 | 98.04 | 132.86 |
| France | 271.62 | 122.21 | 108.55 | 118.98 | 6230.43 |
| Germany | 212.08 | 164.10 | 136.15 | 111.19 | 182.64 |
| Greece | 176.81 | 189.51 | 89.45 | 116.34 | 190.09 |
| Hungary | 91.84 | 124.22 | 68.69 | 169.53 | 232.91 |
| Italy | 113.04 | 273.08 | 1259.15 | 160.29 | 7594.44 |
| Latvia | 56.04 | 123.23 | 138.52 | 190.93 | 286.50 |
| Lithuania | 124.02 | 127.12 | 95.05 | 126.85 | 335.38 |
| Luxembourg | 245.57 | 87.11 | 63.91 | 170.37 | 1674.32 |
| The Netherlands | 2238.89 | 157.77 | 138.88 | 154.81 | 540.69 |
| Poland | 260.00 | 126.34 | 81.30 | 107.27 | 39.85 |
| Romania | 863.08 | 35.47 | 129.65 | 84.50 | 212.90 |
| Slovakia | 154.05 | 730.70 | 28.57 | 520.59 | 228.95 |
| Spain | 237.96 | 208.21 | 112.82 | 96.74 | 103.54 |
| Sweden | 104.30 | 46.87 | 91.97 | 88.64 | 170.31 |
| United Kingdom | 189.99 | 112.14 | 291.59 | 34.27 | 139.96 |
| EU 22 | 158.40 | 118.28 | 123.25 | 99.15 | 428.73 |
| Countries | Average | Median | Minimal | Maximal | Range | Standard Deviation | Coefficient of Variation | Skewedness | Curtosis |
|---|---|---|---|---|---|---|---|---|---|
| Austria | 5.05 | 5.13 | 4.37 | 6.24 | 1.88 | 0.48 | 9.47 | 0.85 | 1.43 |
| Belgium | 2.37 | 2.81 | 0.21 | 3.77 | 3.56 | 1.26 | 53.30 | −0.80 | −0.77 |
| Bulgaria | 0.62 | 0.48 | 0.29 | 1.73 | 1.44 | 0.38 | 60.89 | 2.14 | 5.06 |
| Czechia | 3.24 | 2.53 | 1.01 | 5.99 | 4.98 | 1.99 | 61.31 | 0.18 | −1.96 |
| Denmark | 5.01 | 4.94 | 4.03 | 6.87 | 2.84 | 0.73 | 14.58 | 1.10 | 1.84 |
| Estonia | 1.00 | 0.90 | 0.25 | 2.50 | 2.25 | 0.51 | 51.10 | 1.81 | 5.35 |
| Finland | 3.13 | 3.13 | 2.63 | 3.91 | 1.29 | 0.37 | 11.85 | 0.38 | −0.36 |
| France | 1.51 | 1.51 | 0.47 | 2.03 | 1.57 | 0.40 | 26.29 | −1.21 | 2.25 |
| Germany | 4.18 | 4.06 | 1.79 | 6.71 | 4.92 | 1.75 | 41.83 | 0.17 | −1.38 |
| Greece | 2.14 | 2.15 | 0.89 | 3.37 | 2.48 | 0.81 | 37.85 | −0.07 | −1.39 |
| Hungary | 0.86 | 0.86 | 0.43 | 1.89 | 1.45 | 0.34 | 39.64 | 1.88 | 5.62 |
| Italy | 0.17 | 0.02 | 0.01 | 0.52 | 0.52 | 0.23 | 133.36 | 0.87 | −1.35 |
| Latvia | 1.50 | 1.44 | 0.76 | 3.01 | 2.25 | 0.59 | 39.11 | 1.28 | 1.92 |
| Lithuania | 1.63 | 1.70 | 0.92 | 2.43 | 1.51 | 0.44 | 27.04 | 0.08 | −0.06 |
| Luxembourg | 7.78 | 7.92 | 4.75 | 11.71 | 6.96 | 1.85 | 23.74 | 0.02 | 0.34 |
| The Netherlands | 11.36 | 12.01 | 0.44 | 20.56 | 20.12 | 6.26 | 55.13 | −0.44 | −0.83 |
| Poland | 10.75 | 11.13 | 4.52 | 12.67 | 8.15 | 1.92 | 17.82 | −2.65 | 8.72 |
| Romania | 0.30 | 0.18 | 0.05 | 1.16 | 1.11 | 0.34 | 112.68 | 2.21 | 3.77 |
| Slovakia | 3.11 | 1.52 | 0.54 | 7.87 | 7.33 | 2.94 | 94.54 | 0.70 | −1.36 |
| Spain | 1.32 | 1.67 | 0.38 | 1.95 | 1.57 | 0.59 | 44.98 | −0.77 | −1.34 |
| Sweden | 4.41 | 3.86 | 1.90 | 7.31 | 5.41 | 2.07 | 47.02 | 0.12 | −2.03 |
| United Kingdom | 9.67 | 9.74 | 3.38 | 16.72 | 13.35 | 4.56 | 47.15 | −0.05 | −1.25 |
| EU 22 | 3.25 | 3.34 | 1.63 | 4.06 | 2.43 | 0.63 | 19.55 | −1.28 | 1.89 |
| Tested Parameters | Kendall’s Tau Correlation Coefficient | Spearman’s Rank Correlation Coefficient | ||
|---|---|---|---|---|
| τ | p-Value | rs | p-Value | |
| Correlation coefficients between bioenergy of agricultural origin consumption in agriculture and | ||||
| Value of GDP | 0.810 | 0.001 | 0.925 | 0.001 |
| Final consumption expenditure of households | 0.810 | 0.001 | 0.925 | 0.001 |
| Export of goods and services | 0.810 | 0.001 | 0.929 | 0.001 |
| Import of good and services | 0.771 | 0.001 | 0.911 | 0.001 |
| GDP per capita | 0.790 | 0.001 | 0.914 | 0.001 |
| Final consumption expenditure of households per capita | 0.790 | 0.001 | 0.914 | 0.001 |
| Total energy consumption | −0.771 | 0.001 | −0.925 | 0.001 |
| Total renewables and biofuels consumption | 0.867 | 0.001 | 0.932 | 0.001 |
| Total energy consumption in agriculture | −0.105 | 0.553 | −0.136 | 0.010 |
| Gross value added of agriculture, forestry and fishing | 0.657 | 0.001 | 0.821 | 0.001 |
| Area of agricultural crops | −0.733 | 0.001 | −0.857 | 0.001 |
| Area of grain sowing | −0.505 | 0.008 | −0.686 | 0.001 |
| Raw cows’ milk delivered to dairies | 0.829 | 0.001 | 0.946 | 0.001 |
Publisher’s Note: MDPI stays neutral with regard to jurisdictional claims in published maps and institutional affiliations. |
© 2021 by the authors. Licensee MDPI, Basel, Switzerland. This article is an open access article distributed under the terms and conditions of the Creative Commons Attribution (CC BY) license (https://creativecommons.org/licenses/by/4.0/).
Share and Cite
Rokicki, T.; Ratajczak, M.; Bórawski, P.; Bełdycka-Bórawska, A.; Gradziuk, B.; Gradziuk, P.; Siedlecka, A. Energy Self-Subsistence of Agriculture in EU Countries. Energies 2021, 14, 3014. https://doi.org/10.3390/en14113014
Rokicki T, Ratajczak M, Bórawski P, Bełdycka-Bórawska A, Gradziuk B, Gradziuk P, Siedlecka A. Energy Self-Subsistence of Agriculture in EU Countries. Energies. 2021; 14(11):3014. https://doi.org/10.3390/en14113014
Chicago/Turabian StyleRokicki, Tomasz, Marcin Ratajczak, Piotr Bórawski, Aneta Bełdycka-Bórawska, Barbara Gradziuk, Piotr Gradziuk, and Agnieszka Siedlecka. 2021. "Energy Self-Subsistence of Agriculture in EU Countries" Energies 14, no. 11: 3014. https://doi.org/10.3390/en14113014
APA StyleRokicki, T., Ratajczak, M., Bórawski, P., Bełdycka-Bórawska, A., Gradziuk, B., Gradziuk, P., & Siedlecka, A. (2021). Energy Self-Subsistence of Agriculture in EU Countries. Energies, 14(11), 3014. https://doi.org/10.3390/en14113014