1. Introduction
Climate change is widely considered as the greatest challenge facing humanity and growing emissions, especially from the energy sector, are the main drivers of global climate change [
1]. Although the use of renewable energy sources globally has grown dramatically, the continued reliance on fossil fuels has resulted in emission increase of nearly 2% to 33.1 Gtons of CO
2 in 2018 [
1].
In view of these facts, specialists and governments around the world have become increasingly aware of the importance of addressing climate change through the use of renewable energy sources (RES) and efficient energy management. Renewable energies are also becoming increasingly competitive as they are clean and inexhaustible sources with marked differences from fossil fuels, mainly because of their diversity, abundance, potential for use anywhere on the planet and, above all, they do not produce greenhouse gases. The global weighted-average levelized cost of electricity (LCOE) of utility-scale solar photovoltaics (PV) decreased by 82% between 2010 and 2019 and onshore wind by 39% according International Renewable Energy Agency (IRENA). The same trend is likely to continue in the short-term and out to 2030 [
2]. Just in 2018 the share of electricity produced from renewables grew by over 7% [
1]. The increased use of renewable energy sources is facilitating new economic opportunities and access to energy for millions of people who still live without electricity services. According to the United Nations, in 2018 11% of the world’s population has no access to electricity [
3]. The amount of population without access continued to decrease in 2019 from 860 million in 2018 to 770 million in 2019 [
3,
4]. Achieving a universal access to affordable, reliable, sustainable and modern energy for all is one of the Sustainable Development Goals (SDGs) set by the United Nations. [
5]
In line with the efforts made worldwide, Cuba adopted a new program in 2011 to modernize and strengthen the electricity sector, promoting the use of different renewable energy sources, mainly biogas, wind, hydro, biomass and solar energy [
6]. This led, in 2017, to a policy for the “development of renewable energy sources and energy efficiency”. The main objective of this policy is to increase generation by renewable sources of energy to 24% of the primary energy sources by 2030 through:
At the end of 2018 the Cuban energy production was highly dependent on fossil fuels, with around 95.5% of production coming from fossil fuels and only 4.5% from renewable energy sources [
8]. The national electrical power system has been structured through a combination of condensing power plants and combined heat and power (CHP) baseload, diesel and fuel oil decentralized power generation, bioenergy from sugarcane bagasse and small amounts of power from biogas, hydro, solar and wind sources. In total, in 2013 renewables accounted only for 4.3% of the total electricity production of the country [
8].
Cuba has a vast renewable energy potential to be harnessed. According to IRENA, Cuba has a good potential in both solar and wind resources with an average solar irradiance of 223.8 W/m
2 (5.4 kWh/m
2/day) and average wind speed at around 5.7 m/s, and in the southeast above 7 m/s [
8,
9].
The Cuban government estimates that
$3.5–4.0 billion in investments is needed to achieve their 2030 renewable energy targets with a significant share of foreign direct investments. The investments are foreseen in the wind and solar photovoltaic production. However, the government promotes investments in other renewable energy sources such as biogas, forestry biomass, agro-industrial residues and municipal solid waste [
10].
Although transition to more renewable based energy systems are becoming more desirable, there are various technical challenges to overcome. Vazquez et al. argue that “
increased share of RES in future electrical power system brings several challenges to system planning and operation. Weather dependence of wind power and solar PV generation increases uncertainty in the premises of system design, which should be taken into account in decision making about required generation capacity and reserves, need of energy storages, control strategy and flexibility capacity of the system” [
11].
The study case, Isla de la Juventud, is the second largest island in Cuba, located in the southwestern part of the country, with an area of 2419 km
2 and a population of approximately 89,000 (35.73 persons/km
2). Isla de la Juventud has similar characteristics to the electric power system around Cuba although on a smaller scale, making it an ideal case to examine behavior of the radial electricity system with 100% distributed generation, made up of five main 34.5 kV circuits that supply energy to the distribution substations. The electrical power system under study is isolated from the National Electrical Power System (NEPS), operating autonomously. The generation of the system is made up by 11 diesel and fuel oil generators with an installed capacity of 35.44 MW and three solar parks (La Fe (0.8 MW), Universidad (2.4 MW) and Los Colonos (1 MW)) with 4.2 MW; a biomass plant (La Melvis) with 0.5 MW and one wind farm (Los Canarreos) with 1.65 MW of capacity. Currently 16% of installed capacity is from RES. The system is made up of fossil fuel-based generators with installed capacities up to 3.9 MW each, with similar maximum and minimum active power, power factor, ramp rates and fuel consumption in g/kWh (four MAN generators with capacity of 3.85 MW each, four BAZAN generators with a capacity of 3.6 MW each and three MTU generators with a capacity of 1.88 MW each). For this reason, the load share served by each generator is quite similar, and any of these generators, which act as the base load generation, can be used in the normal operation of the power system. The MAN type generators represent the basic generation system, with the BAZAN type for the reserve and MTU generators supporting the maximum peaks [
12,
13].
A desk review of RES utilization on islands globally shows that different approaches and tools have been employed e.g., to evaluate the situation of the existing electricity generation mix [
14,
15], to analyze the potential of energy efficiency to reduce electricity demand [
16], to determine the existing barriers to the RES projects considering financial, and institutional, social or political aspects [
17].
An implementation of long-range development analysis is crucial to achieving Cuba’s energy and climate goals. The long-term planning analysis identifies overall transmission needs for a future timeframe, given demand growth, the targeted energy mix, interconnection policies and RES locations, among other factors [
18]. In particular, alternative forecasting with existing renewable energy potentials, economic and technological variables is needed to decide the best alternatives. Long-term energy planning models are used to define investment paths and to inform long-term strategic decision making over the development of a national energy system. Long term planning models and tools have been used widely for generation expansion planning with a long (15–40+ years) planning horizon [
19].
Internationally, a wide range of diverse energy planning tools are available based on the objectives they fulfil, the technologies they consider, and the time-steps they analyze. Connolly et al. suggest that to generate a long-term ‘storyline’ for implementing 100% renewable energy-systems, Invert simulation tool, EnergyPlan and the Low Emissions Analysis Platform (LEAP) may be the most suitable due to their lengthy scenario-timeframe [
19]. Similarly, according to IRENA tools such as e.g., MESSAGE, TIMES, MARKAL, OSeMOSYS, WASP and BALMORE can be suitable tools for 20–40 year timescale in similar analysis [
18].
IRENA found that most developing and emerging economies suffer from a lack of data availability and technical know-how that pose serious challenges to focus on ensuring solid capacity, flexibility, transmission capacity and—in certain contexts—stability, which can also compromise the use certain tools. In the end, there are no ideal tools to suit all purposes but data availability, specific objectives and purpose of the study and the conditions of the site define the choice of the right tool [
18]. In this article the criteria in selecting the most appropriate tool considered the accessibility to the tool (free open access), the type of tool, future orientation, and previous studies carried out with the tool. Thus, this research utilizes the Long-range Integrated Development Analysis (LINDA) model to project future scenarios for Isla de la Juventud. LINDA is an Excel-based tool used for energy systems analysis and building future scenarios. It has been used to model future energy systems e.g., in Cambodia and Lao PDR [
20], Thailand [
21], China [
22], Barbados [
23] and Cuba [
24].
This article provides the technical basis for integrated development roadmap analysis that helps Cuba to achieve best RES penetration composition. We analyze two alternative scenarios for future development in accordance with existing renewable energy potentials and technological variables with Isla de la Juventud as a case study. The results can be applied to model provincial and national level power electric systems as Isla de la Juventud has similar characteristics to the electric power system around Cuba. The analysis can provide direction on how the Cuban national system would behave with high levels of renewable energy sources integration, and point out solutions for different shares of RES in the national grid in the future.
2. Materials and Methods
This article utilizes The LINDA (Long-range Integrated Development Analysis) model which is based on intensity approach, building on the Extended Kaya Identity, which is used for the calculation of CO
2 emissions as depicted in equation below:
where,
CO2 is carbon dioxide emissions (e.g., ton, kton) from fuel combustion;
TPES is total primary energy supply (e.g., ktoe) (including all fuels and other forms of primary energy, before the combustion process and transfer and distribution of electricity or heat);
FEC is final energy consumption (e.g., ktoe), meaning consumption of energy carriers such as district heat and electricity, and fuels used in residential heating and transport;
GDP is gross domestic product in real prices (e.g., USD); and
POP is the amount of population (e.g., person).
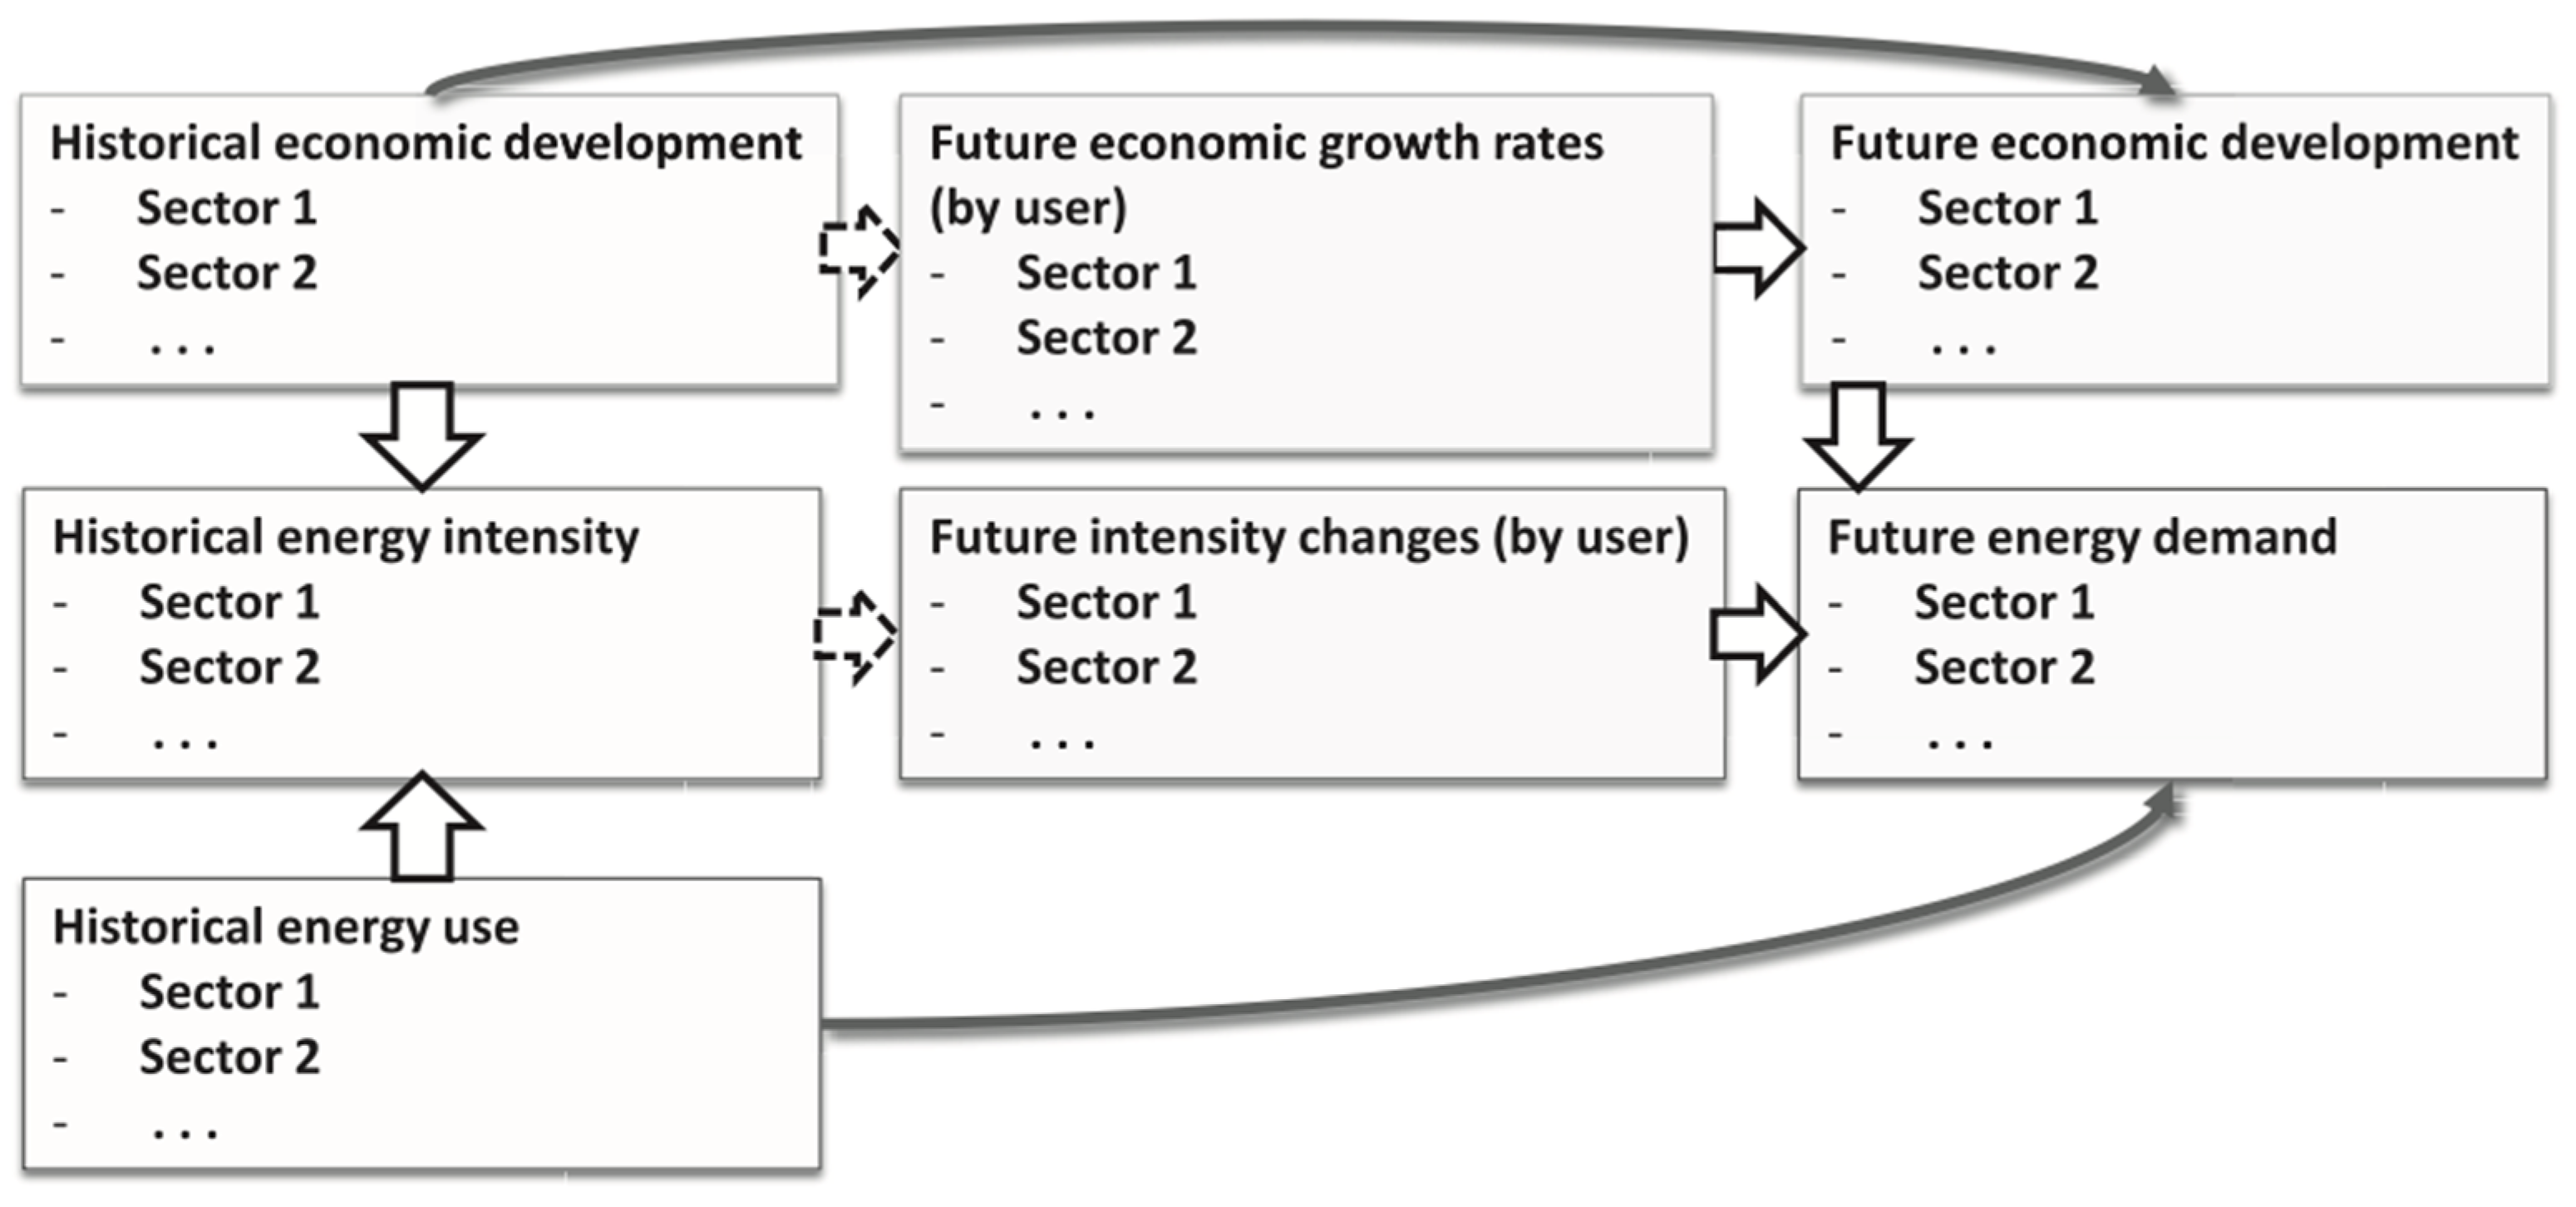
LINDA is a so-called ‘Accounting Framework’ type of model which allows the user to construct various economic scenarios by choosing different economic growth rates for different sectors including agriculture, industry, transportation and services as shown in
Figure 1. Here, the energy use is divided into fuels and electricity, with energy intensity defining how much economic output is generated with a certain amount of energy used. Economic structures will affect the energy demand as intensities differ by economic sectors. By changing the energy intensities in the scenarios, the user can have an impact on the final energy demand. The energy intensity of a sector can decrease due to the introduction of a more efficient technology or shift to less energy intensive products or production structure [
20,
22,
24].
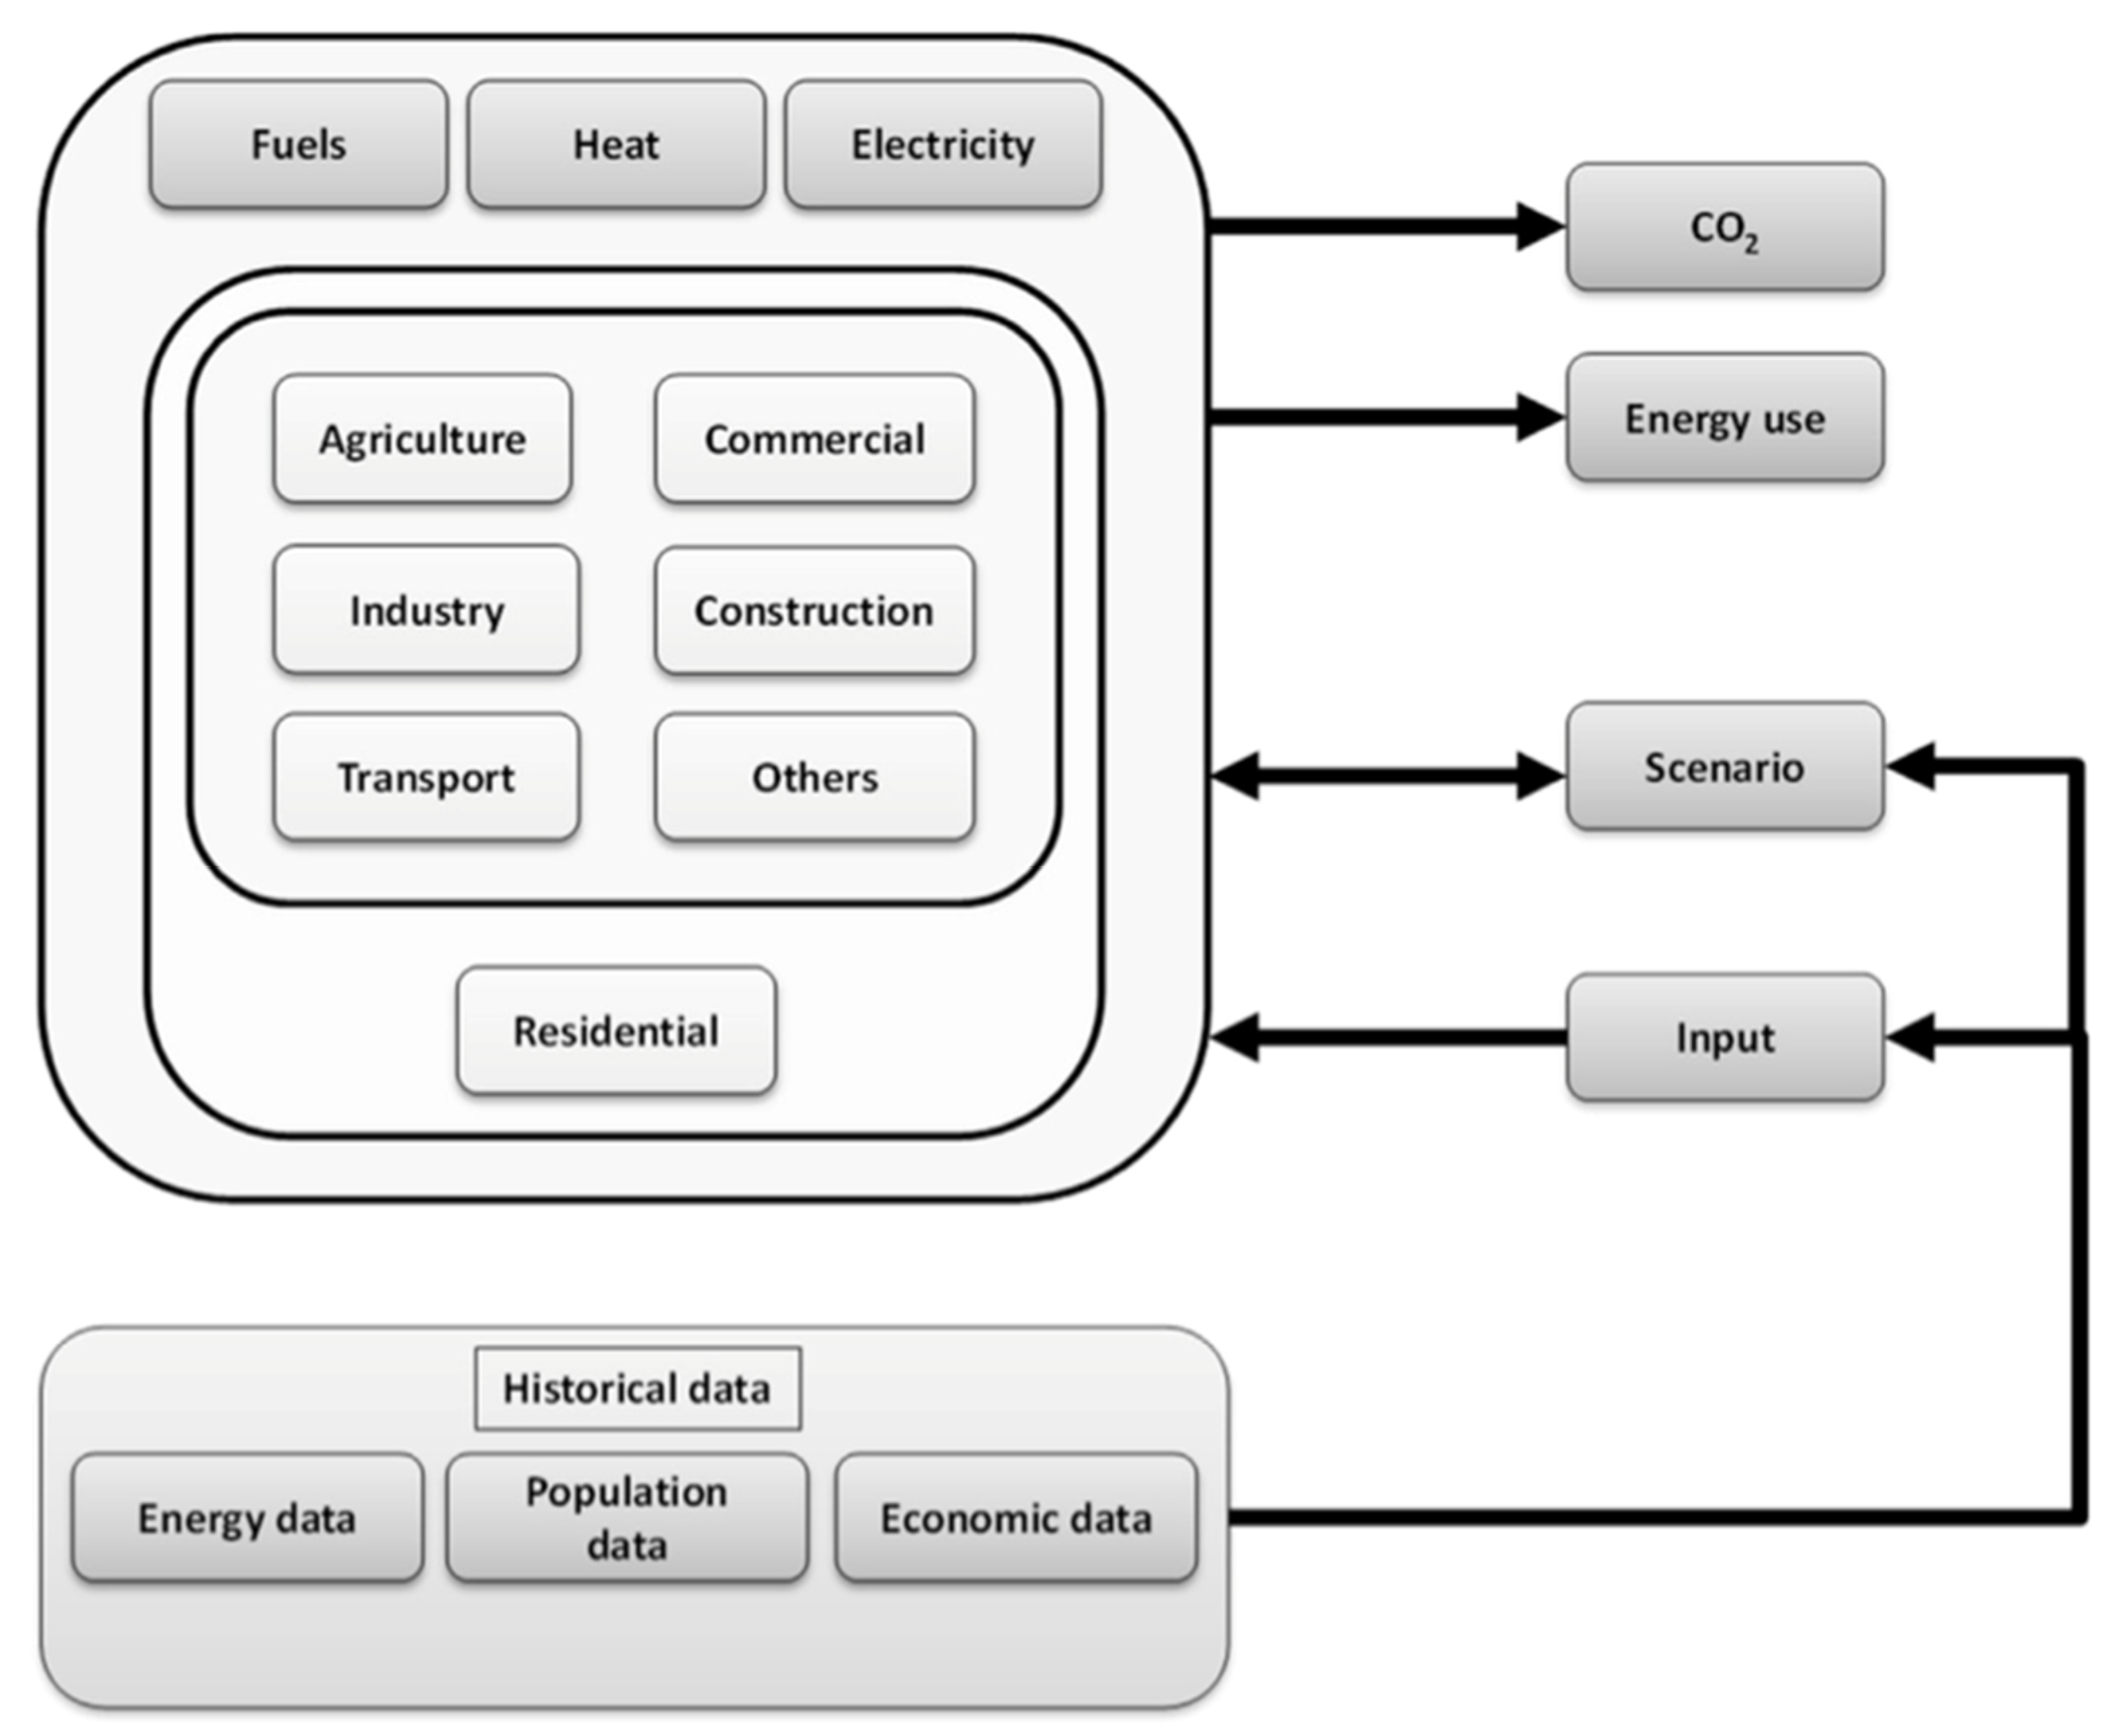
The scenario construction process with the LINDA model starts with the decision of annual future economic growth level for different sectors and the future changes in the sectoral energy intensities. These provide data for annual future energy demand in different sectors. The load curve and its future changes for different consumer sectors for weekdays and weekends as well as different months are given to construct hourly consumption scenarios based on the yearly demand data. The yearly investments in electricity production capacity by power plant type are given and the model balances the production and consumption every hour by calculating the supply from variable renewable sources (wind and solar) and subtracting this from the total demand to get the residual load which is produced with the other power plants based on their given priority order. The model calculates the CO2 emissions based on the characteristics of different fuel and the used amounts. The calculation linkages between different modules are shown above in
Figure 2.
The data used in the modeling for the scenario analysis are taken from the International Energy Agency (IEA) World Energy Statistics [
25], National Statistics Office of Cuba (ONEI) [
26] and the electric company of Isla de la Juventud [
27]. For the percentages and estimates on future growth, experts from the UNE were consulted, who provided sensitive information on investments that would be made in the Isla de la Juventud in renewable sources, as well as the real load curve of the power system. The information was further processed to create an annual load curve for 2019 and cross checked with published data on the ONEI website. The historical data from ONEI provides statistical information on all sectors, divided by provinces. From the classification of the obtained information, the LINDA model allows a sectoral analysis on:
GDP based on industry, agriculture and forestry, transportation and commercial sectors; and
Electricity use in industrial, agriculture and forestry, transportation and residential sectors.
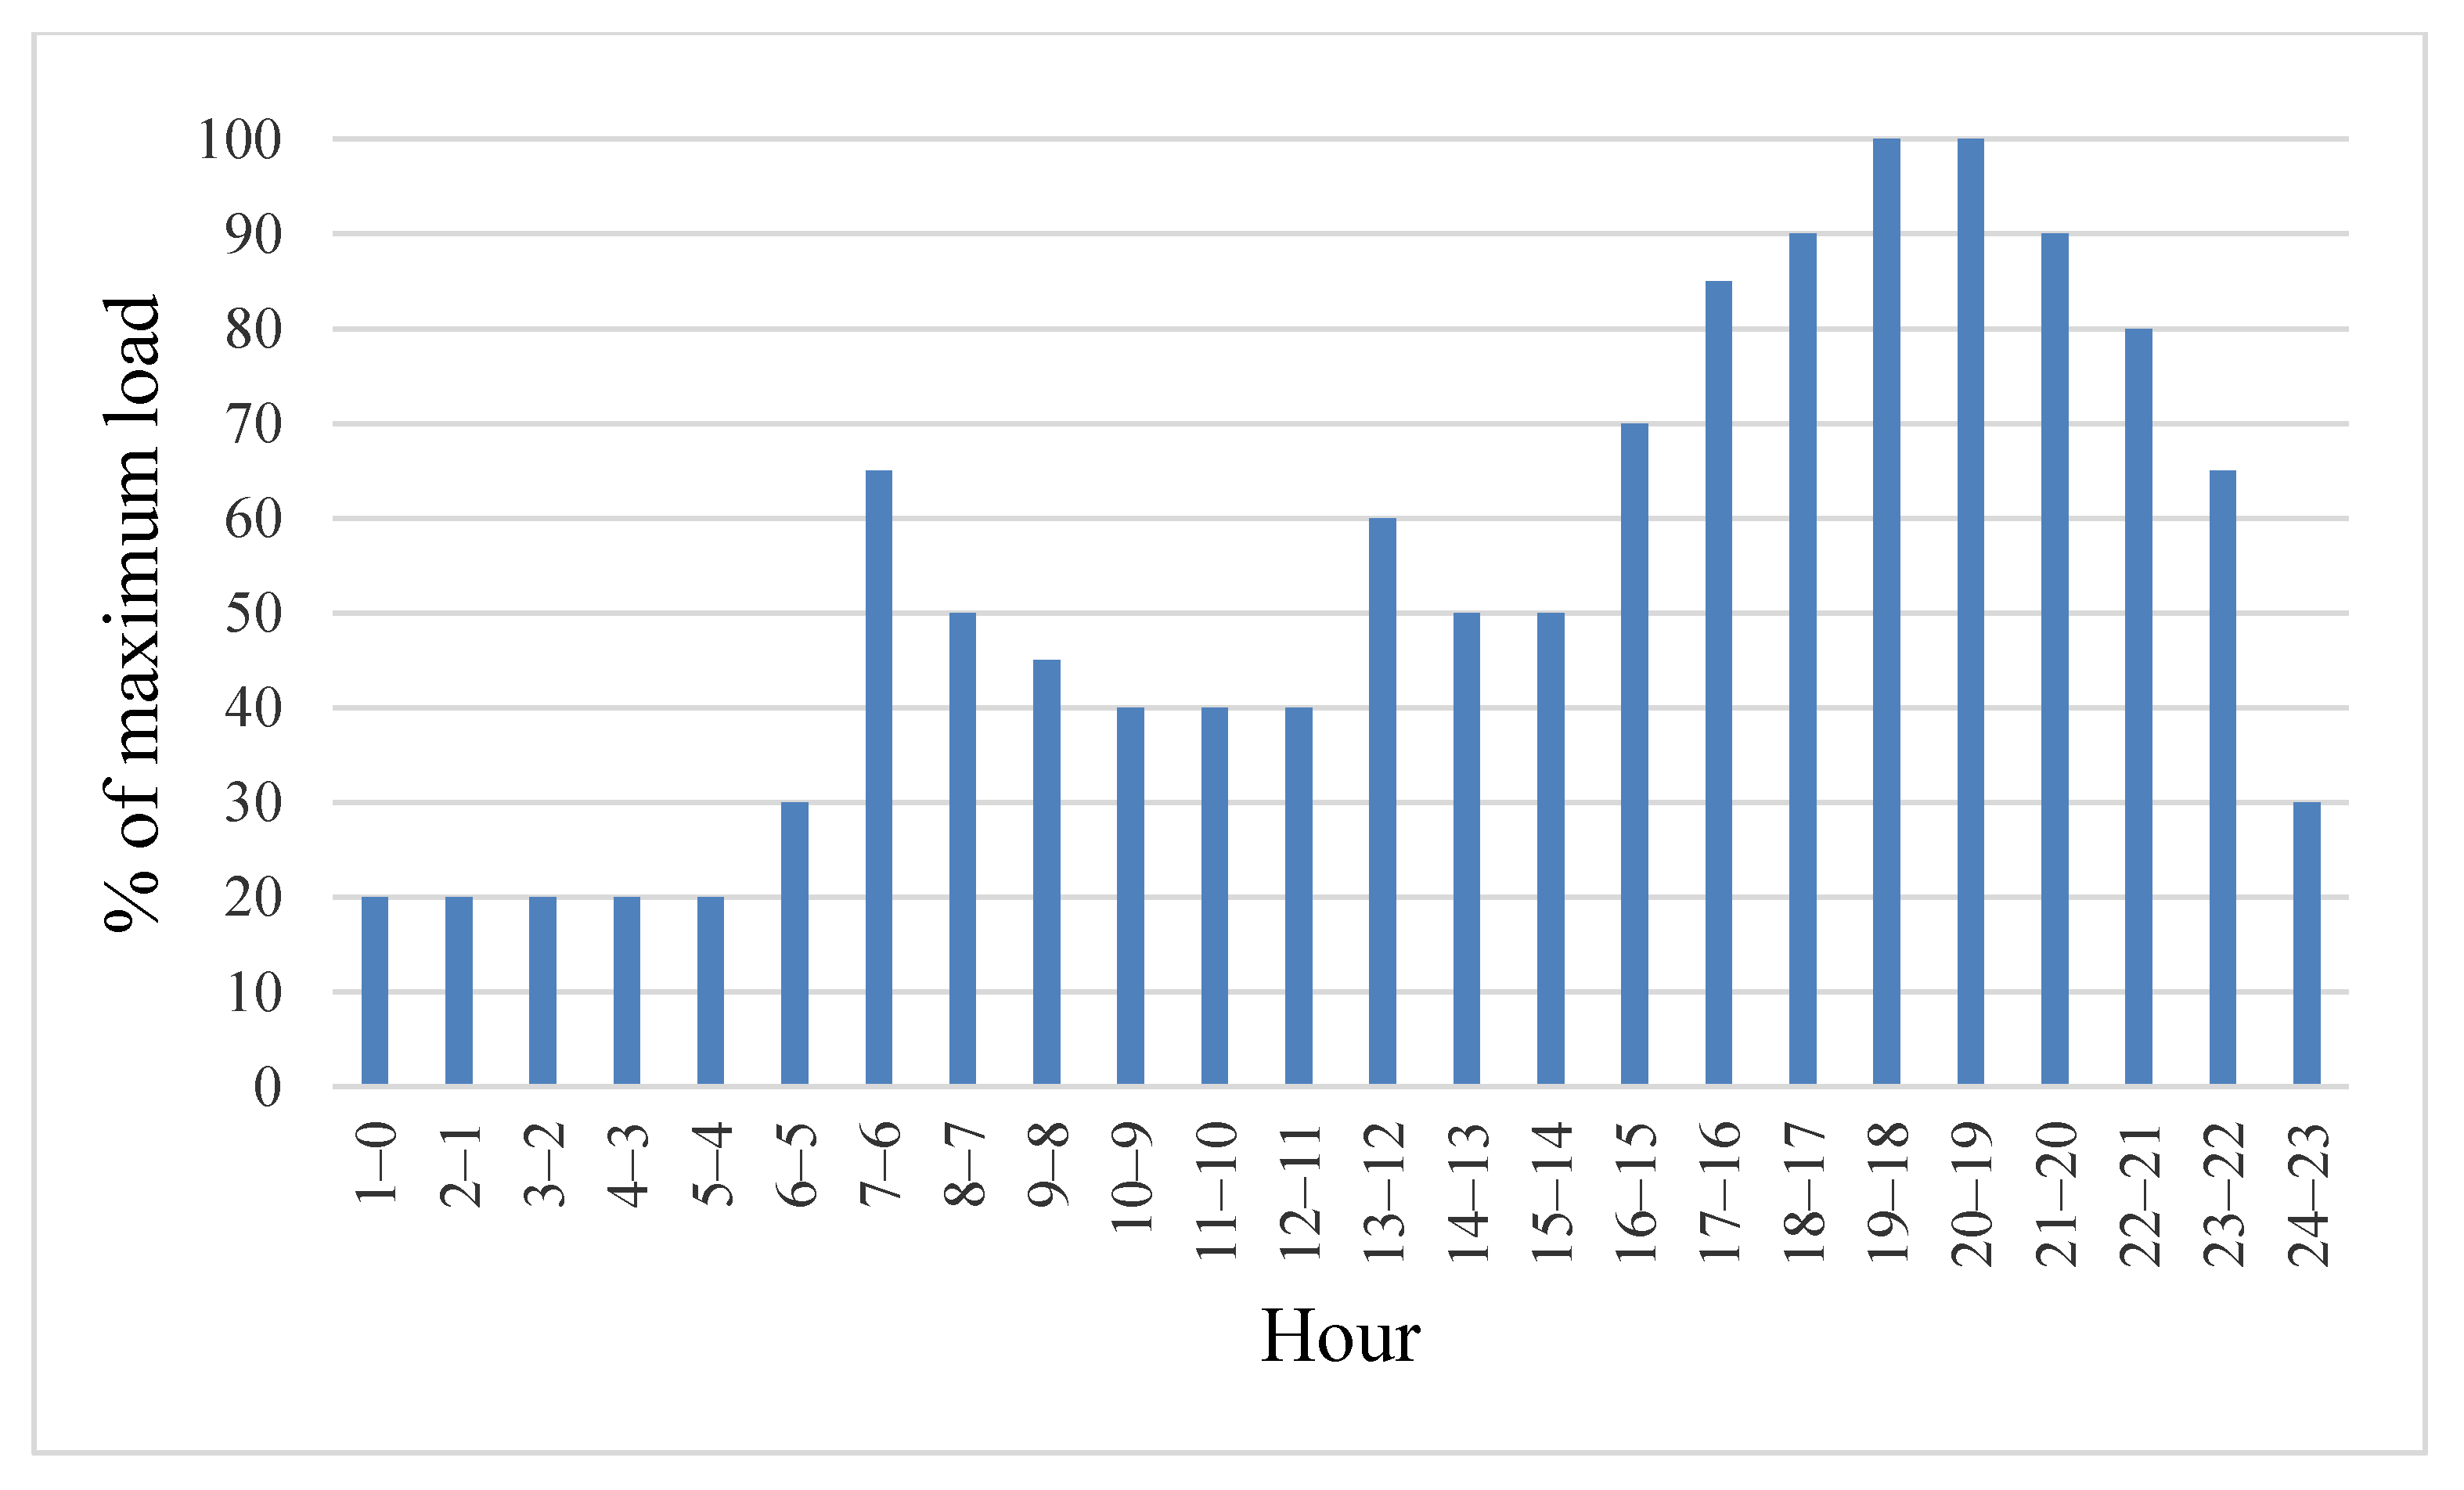
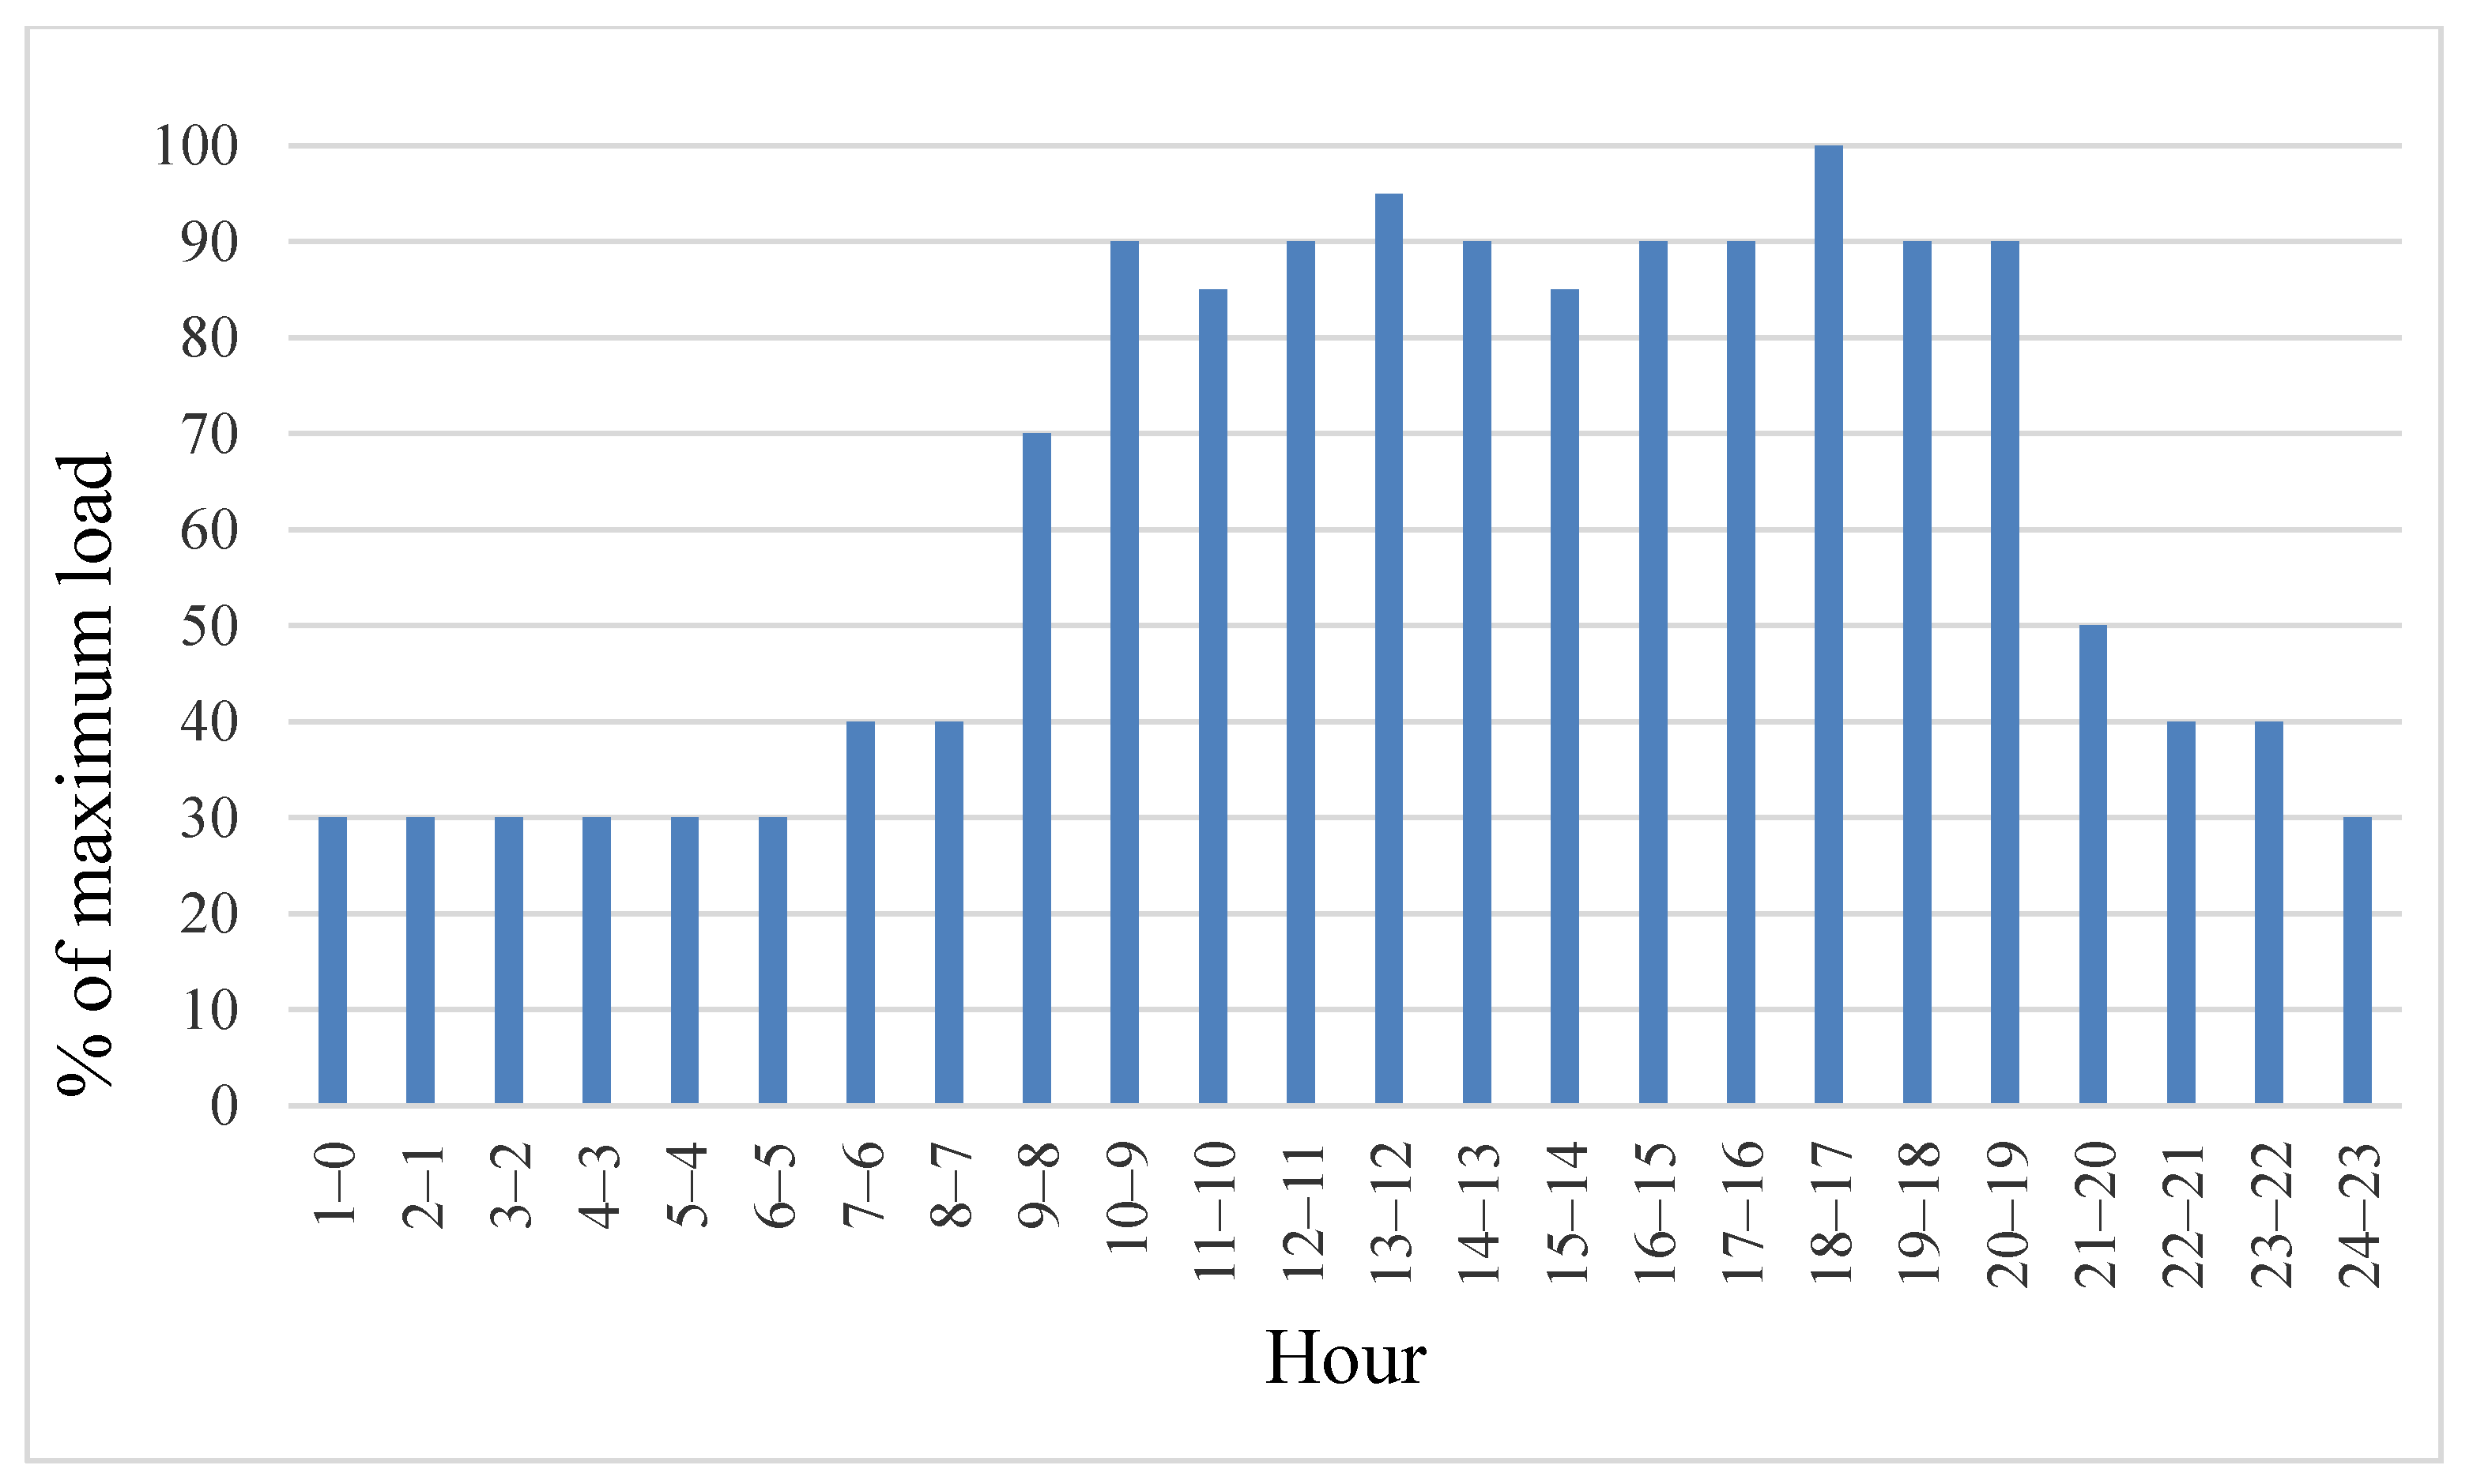
On the growth projections the authors defined sectoral growth rates for the future based on the historical data available and in relation to the projections of the electricity demand growth and electricity intensity. The LINDA model utilizes hourly load curves for different sectors of the economy to analyze future sectoral and total electricity demand. The model user inputs the hourly load curves for weekdays and weekends and for different months for one year for different sectors of the economy as well as future projected load curves for all the future years of the scenario. The estimations of the future growth in electricity consumption are based on the views of experts including the UNE.
Figure 3 and
Figure 4 illustrate the examples of a typical weekday in January in household and commercial sectors.
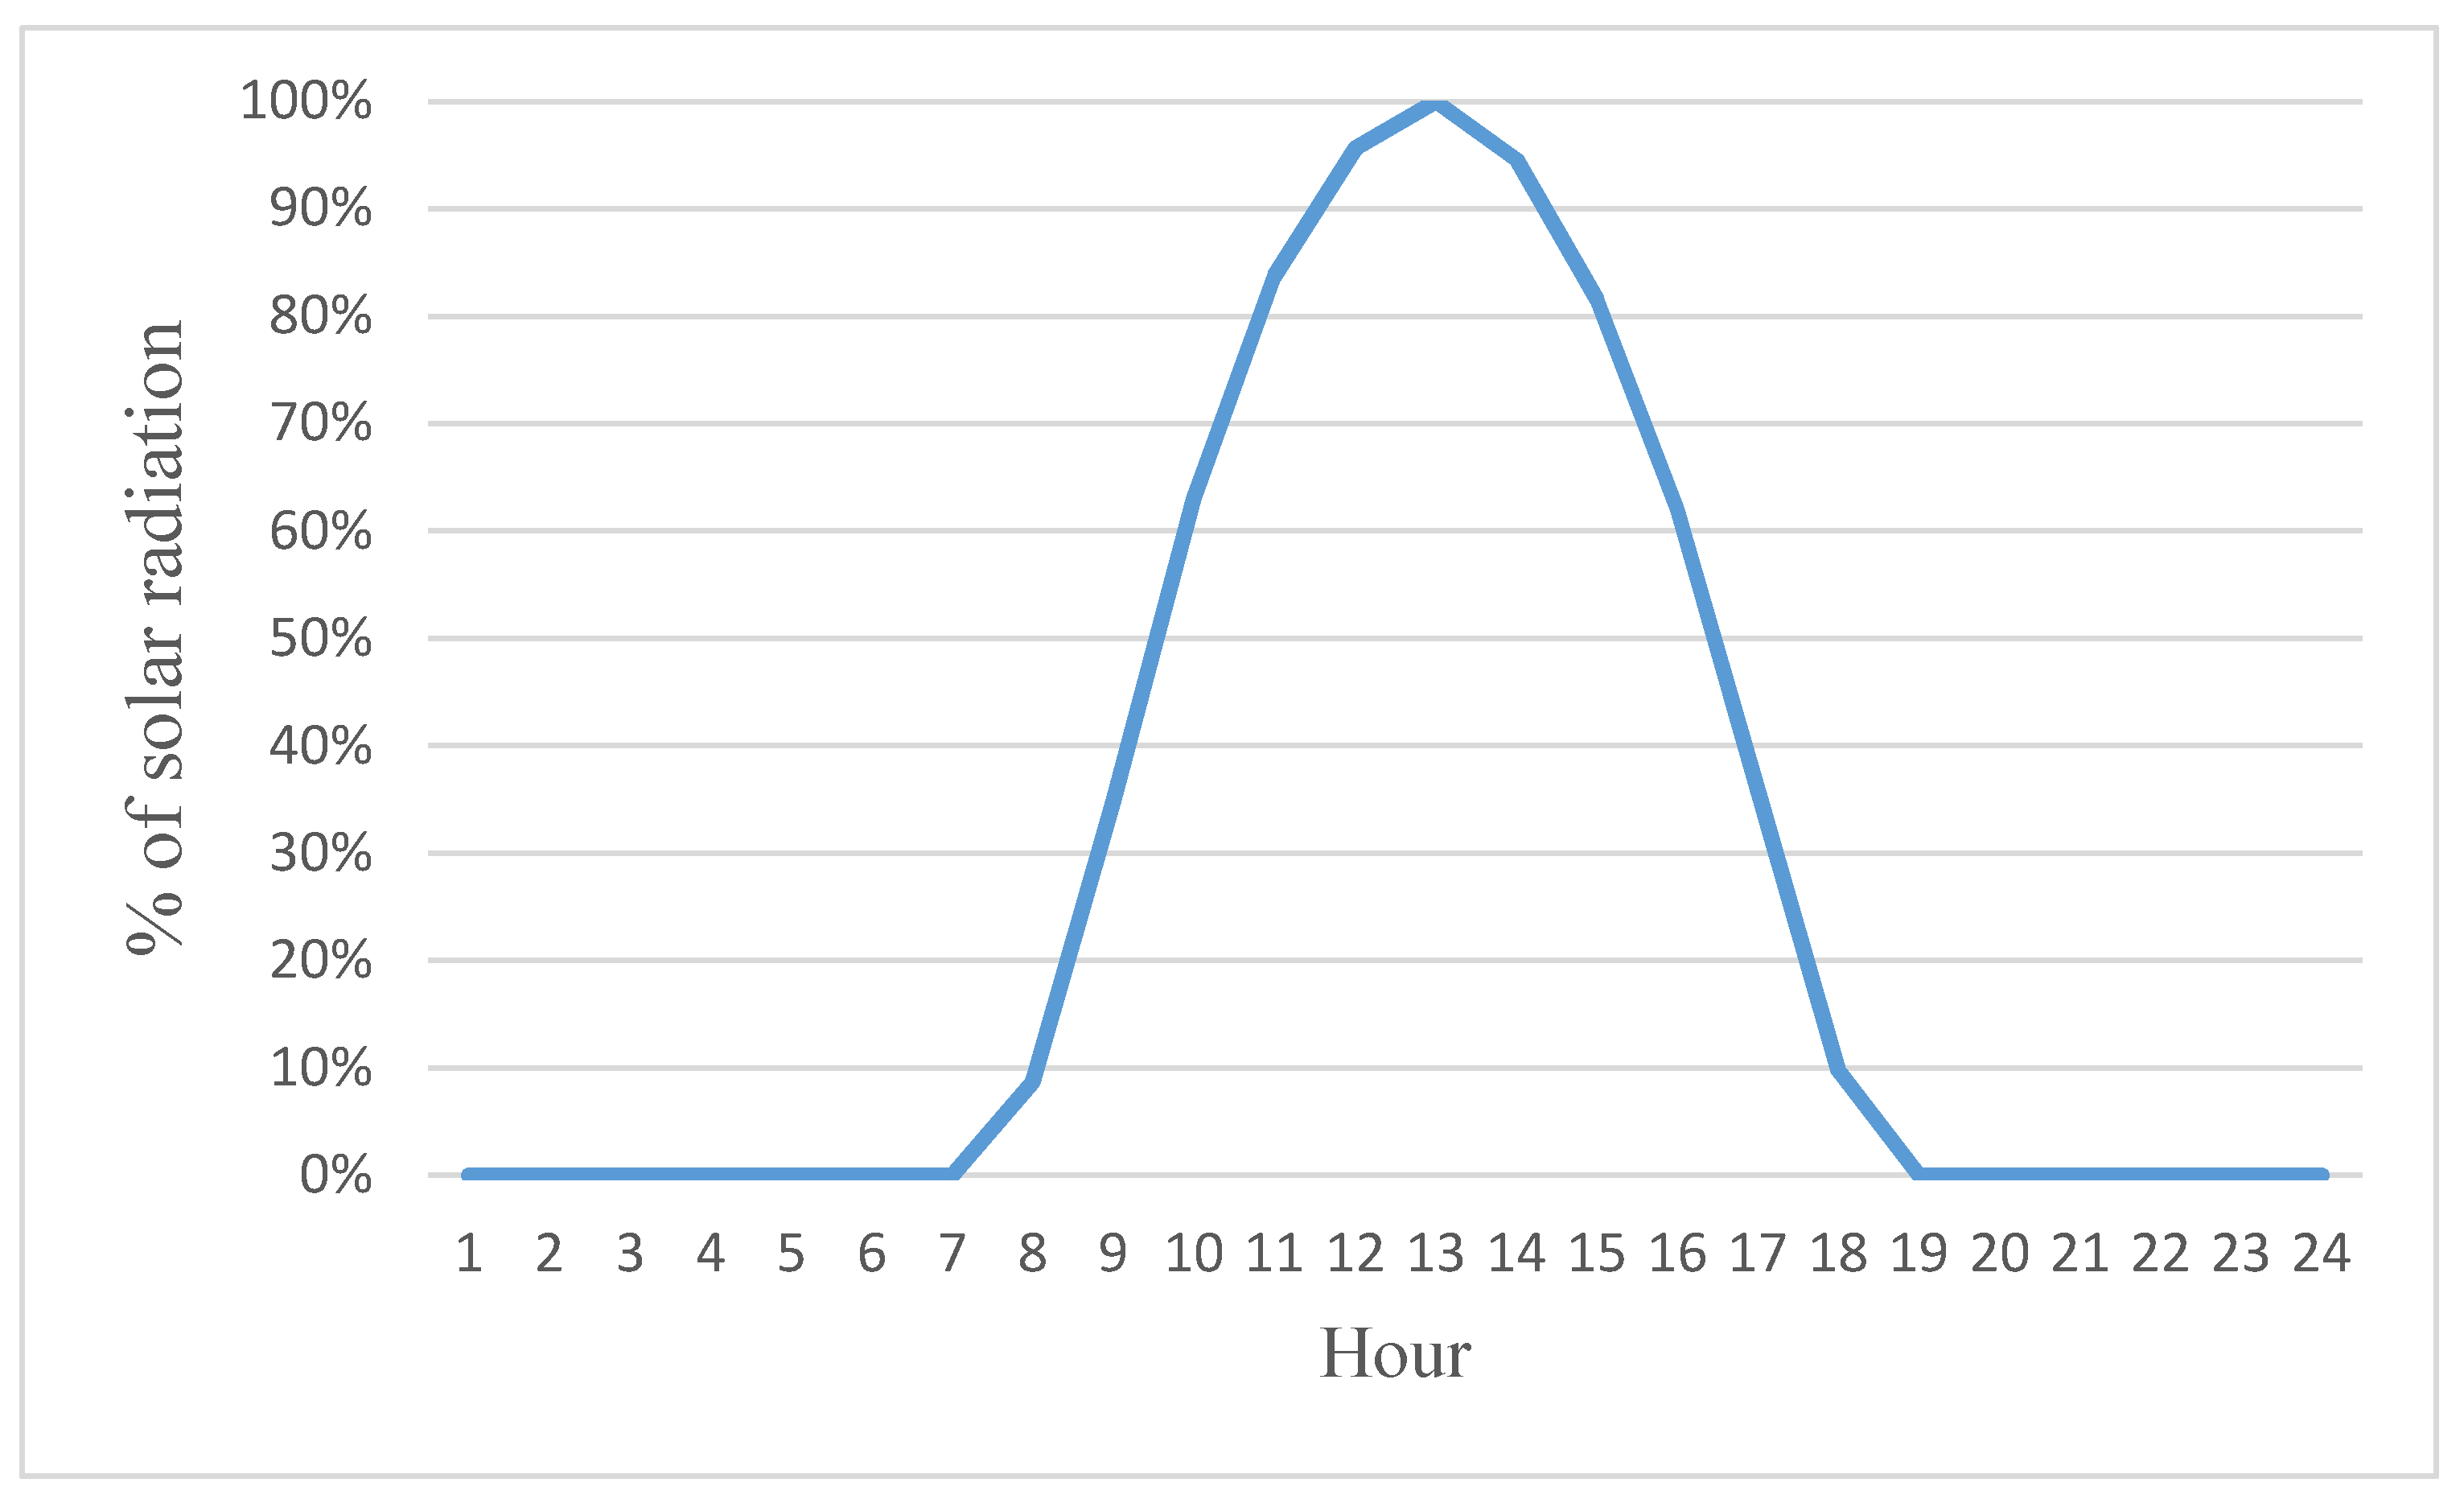
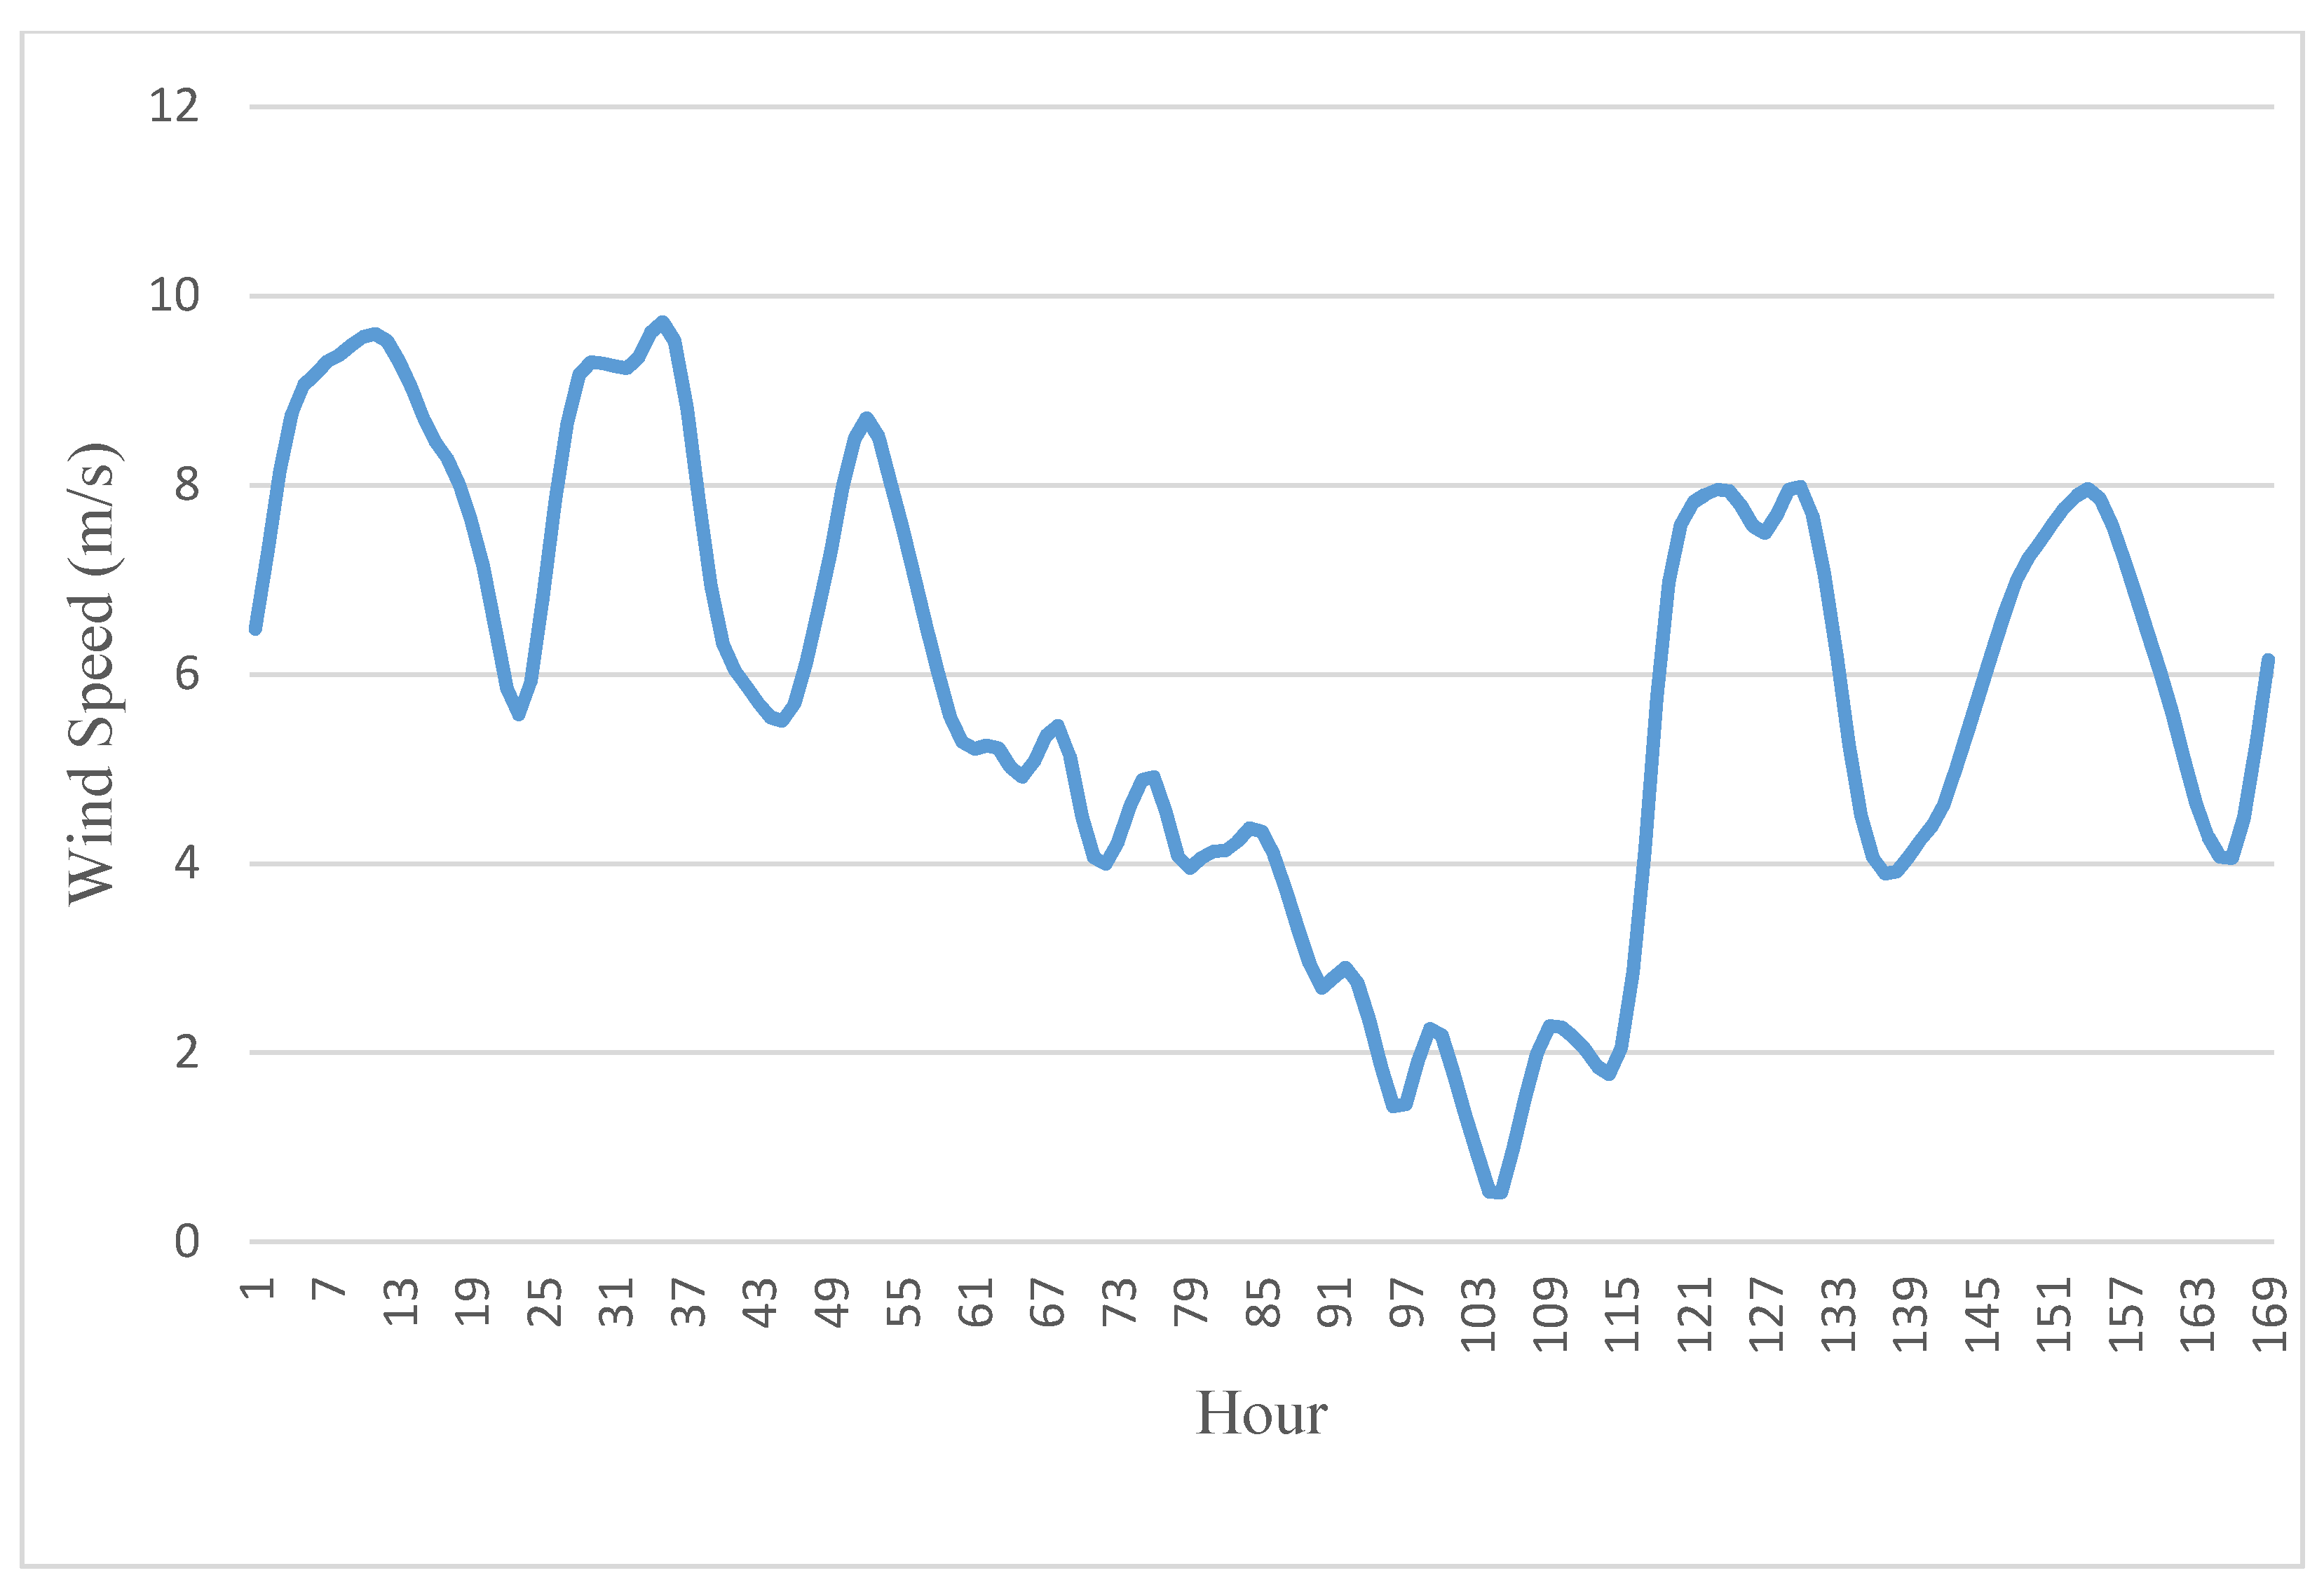
Data on solar radiation and wind are obtained from The Modern-Era Retrospective analysis version 2 (MERRA 2) databases [
28,
29] and are shown in
Figure 5 and
Figure 6.
In the electrical power system, the demand and supply have to be in the balance every hour of the year. LINDA calculates the electricity demand for every hour of the year and matches supply with the demand. The residual load is first calculated for different types of production. This residual load is the hourly demand minus the hourly production by the intermittent renewable energy sources, in this case, wind and solar. The calculation is illustrated in the below equation.
where,
The production of the residual load has to be carried out with power plants that can be controlled such as fossil fuel condensing power plants, diesel power plants, biomass power plants or hydro power plants (or using storage if it exists). In Cuba, the hydro capacity is so small that it cannot solve the problem of grid balancing.
LINDA allocates the residual load for the fossil fuel based power plants and the user can give them a priority order to define which type of power plants produce and how big share of the residual load. In addition, the model calculates the required ramping rate for residual load production. The ramping rate is calculated for the required 1 to 6 h maximum (increase) and minimum (decrease) changes in residual power production as well as average increase and decrease of residual power production.
3. Results
The results are organized into sections to introduce the current situation: base year situation in 2019 in 3.1, renewable energy scenario (RENES) in 3.2, 100% renewable energy scenario with (MAXRES) in 3.3 and a comparison of results in 3.4. The authors used the data of the historical economic growth rates of Isla de la Juventud [
25,
26]. The inputs introduced in the model consider the country’s policies to achieve a 30% penetration (of installed capacity, 24% of electricity generation) of renewable sources by 2030 [
6] and a total growth of user defined GDP growth of 11.7% until 2030. For the different scenarios we have assumed that the installed capacities for RES increase in a renewable scenario (RENES) for solar PV up to 19 MW (34% of the total installed capacity) with biomass remaining the same (1% of the total installed capacity) and in the maximum use of renewable sources (MAXRES) scenario solar PV is increased up to 19 MW (31% of the total installed capacity), wind to 6.65 MW (11% of the total installed capacity) combined with a fuel switch from diesel and heavy-fuel oil to biofuels up to 35.94 MW (58% of the total installed capacity). Furthermore, in both scenarios, 10 MW in batteries are installed to store excess energy.
3.1. Base Year (2019)
The LINDA model utilizes the information provided by the national statistics office in its annual summary of the development of each province and its historical rates of economic growth. [
26] The historical data from 2012 to 2019 is used for each sector of the economy.
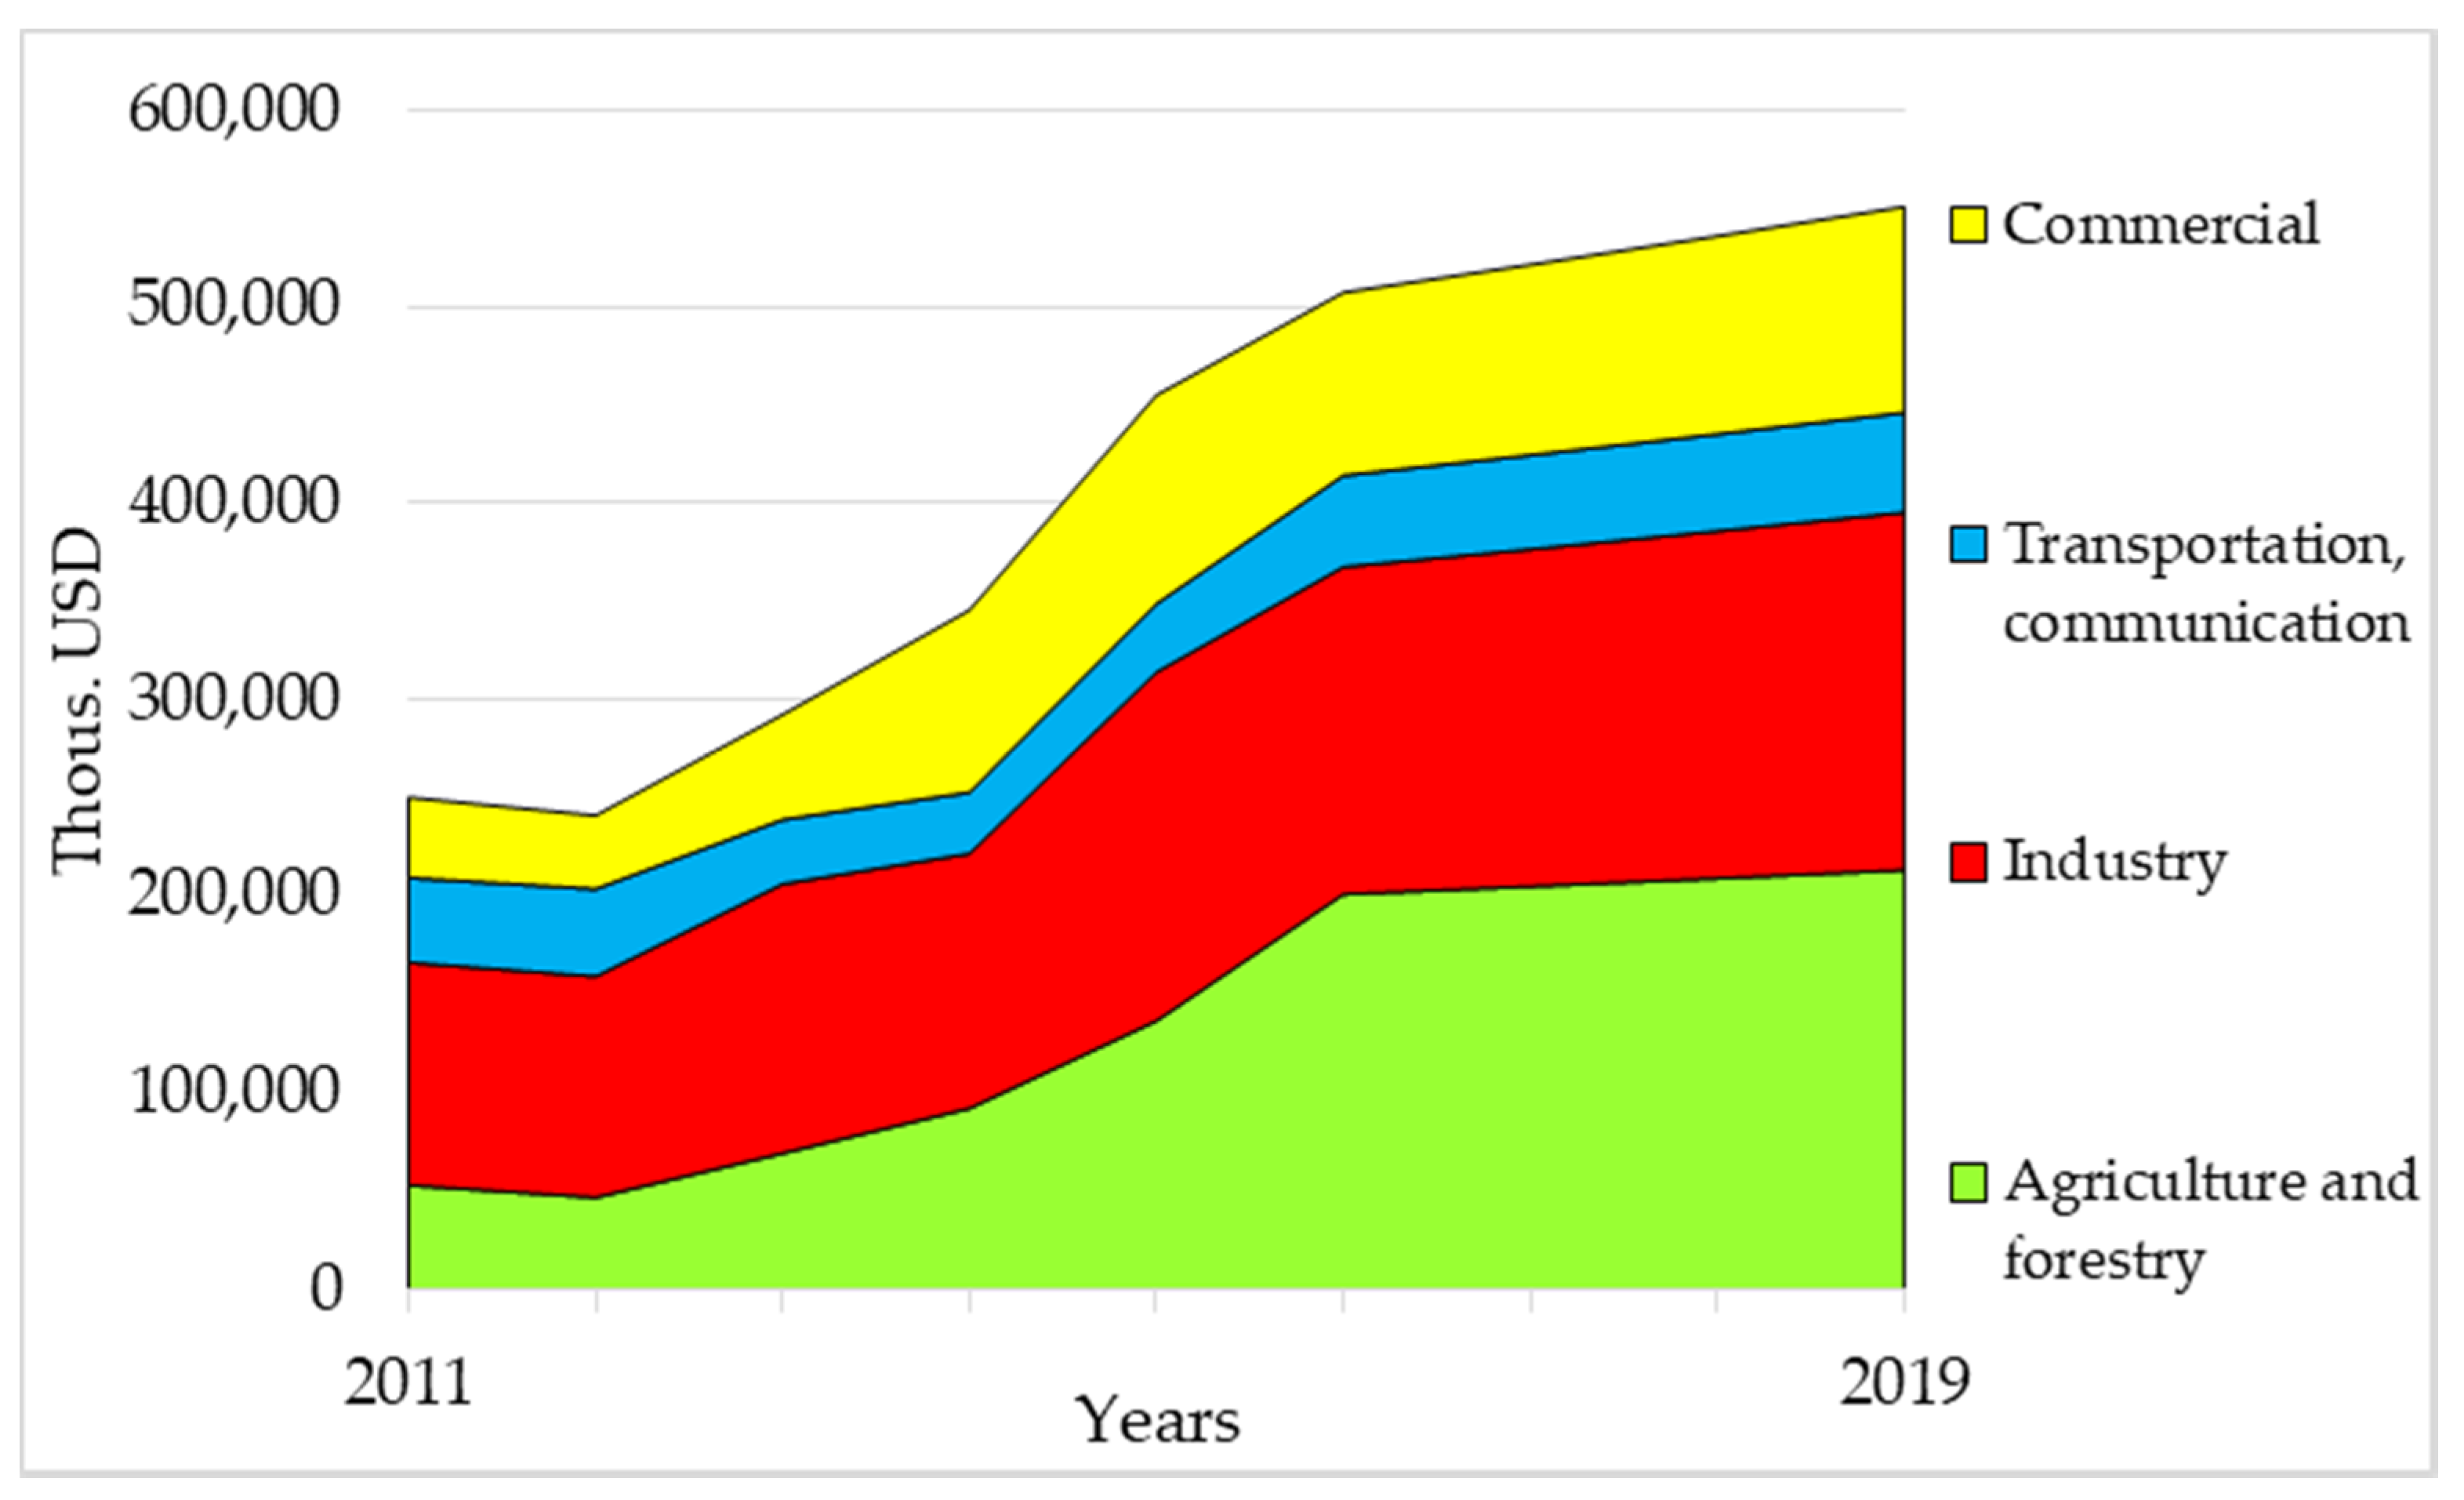
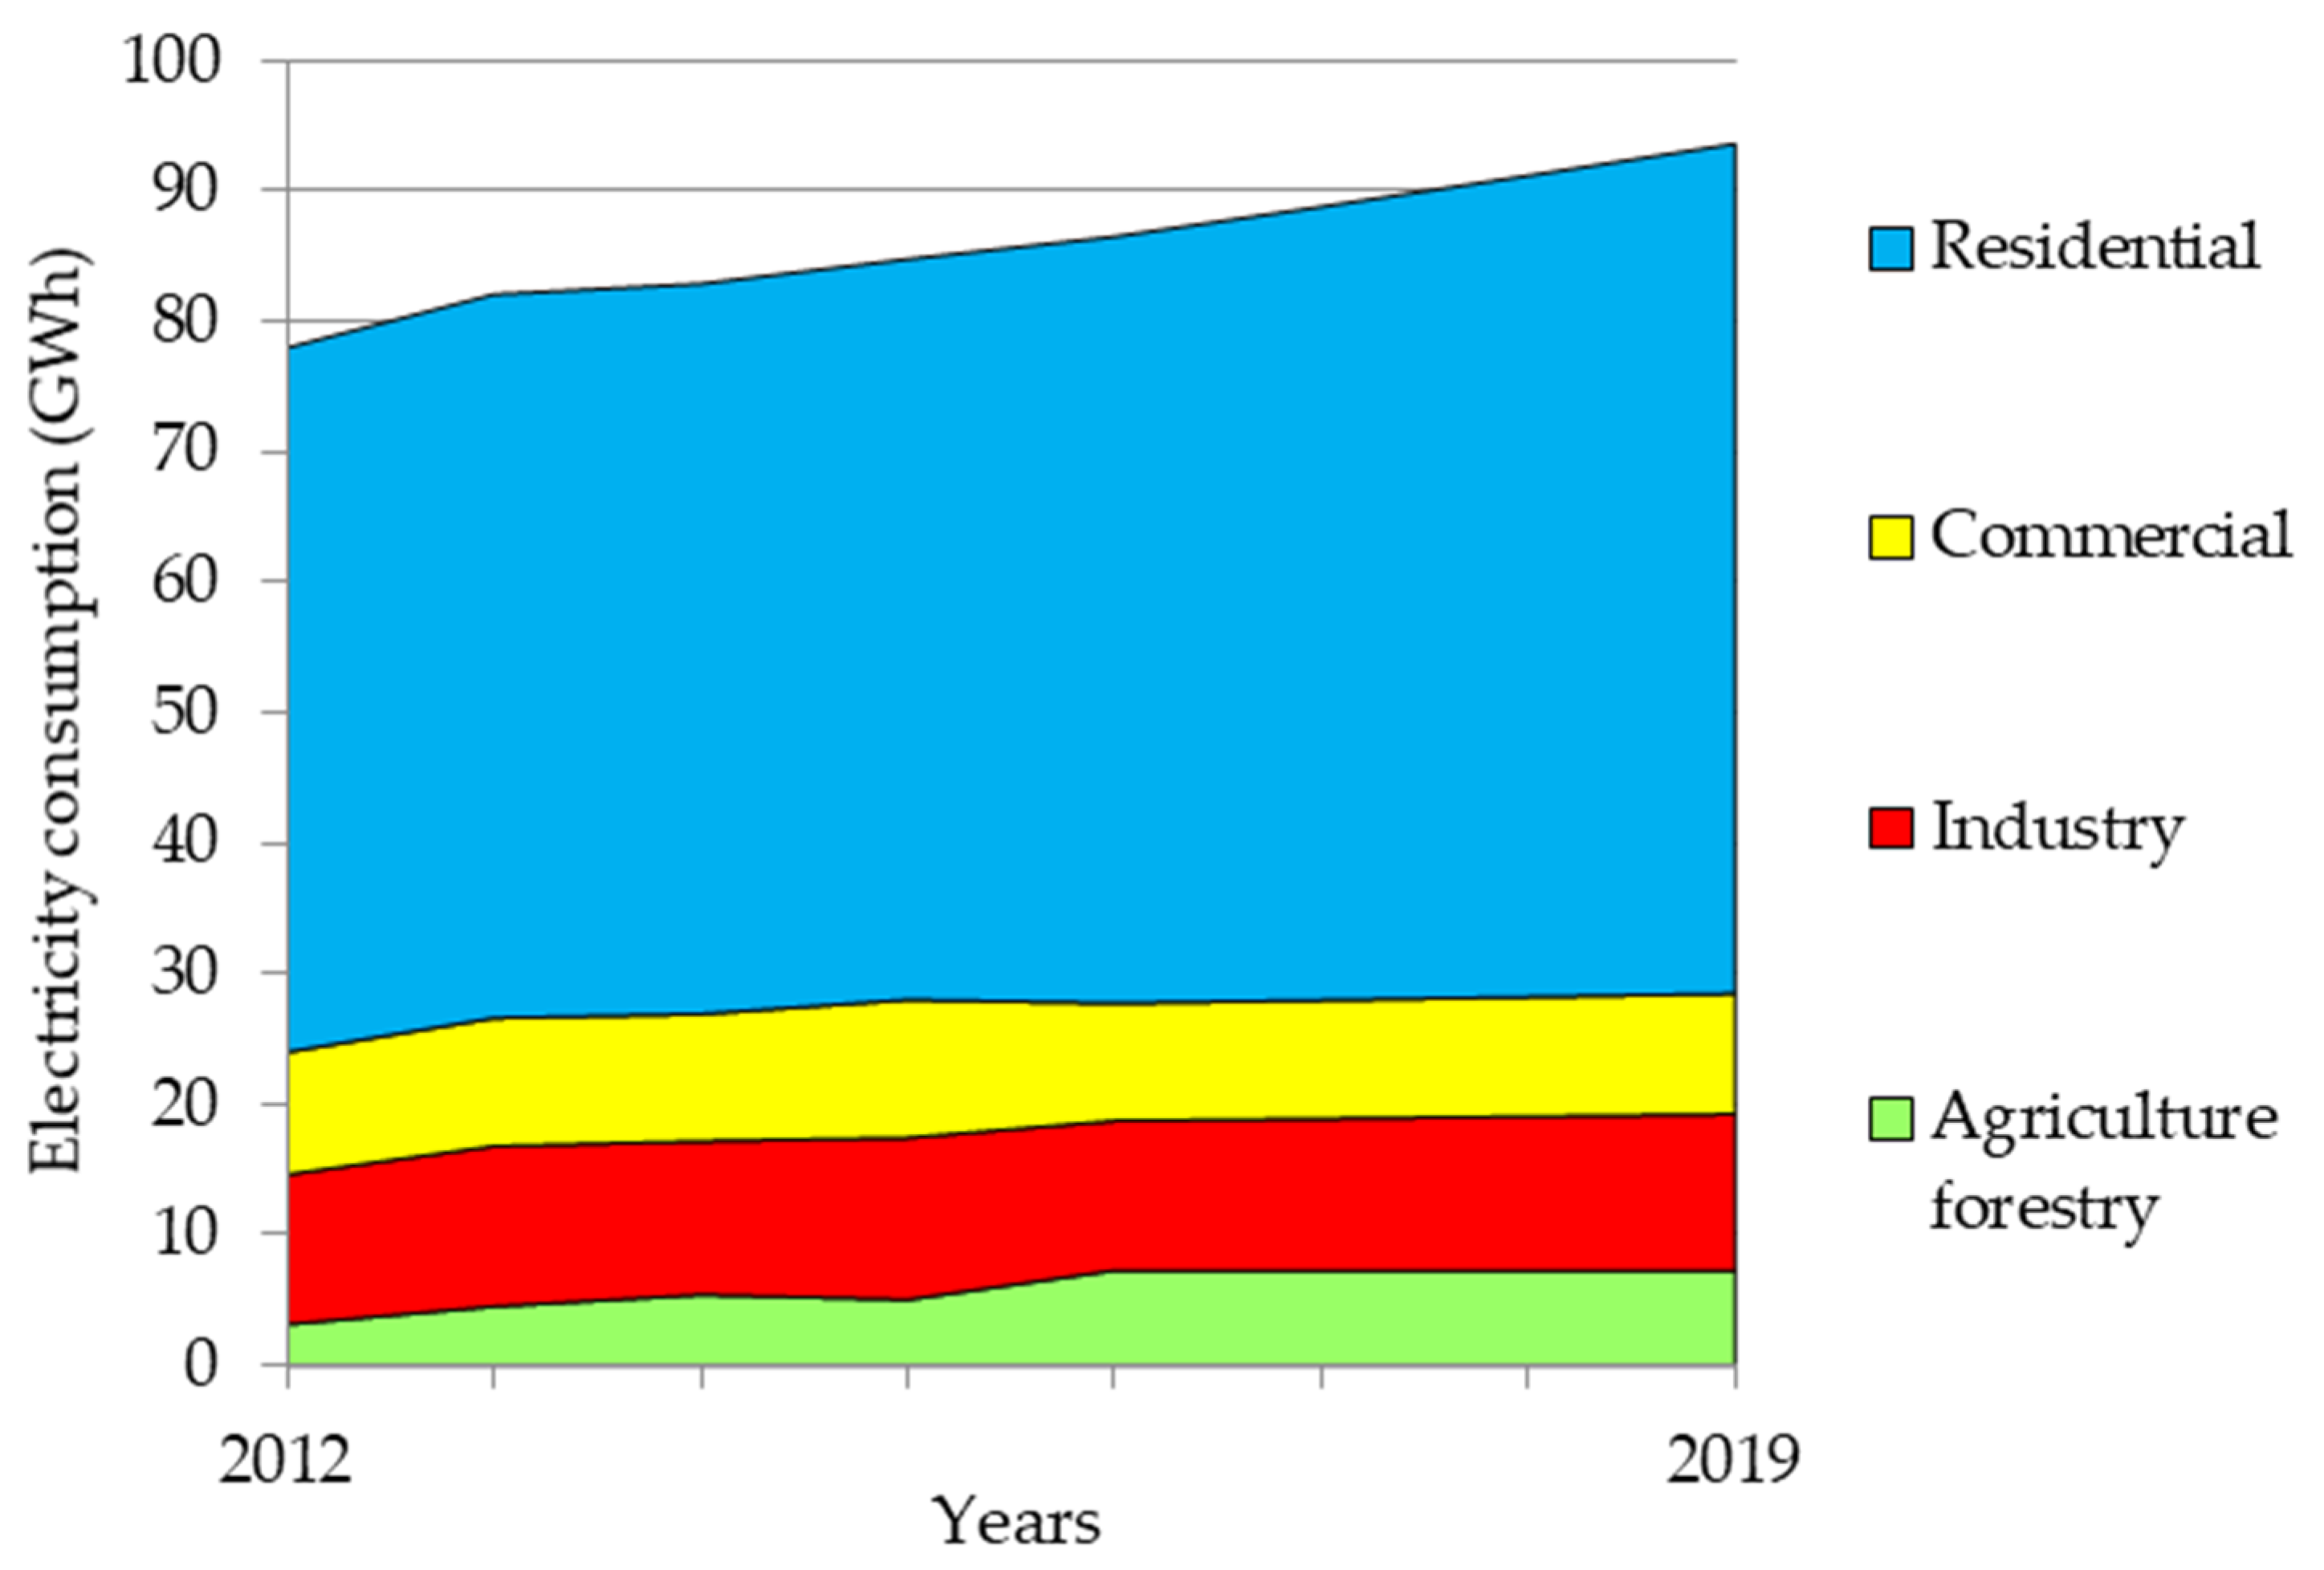
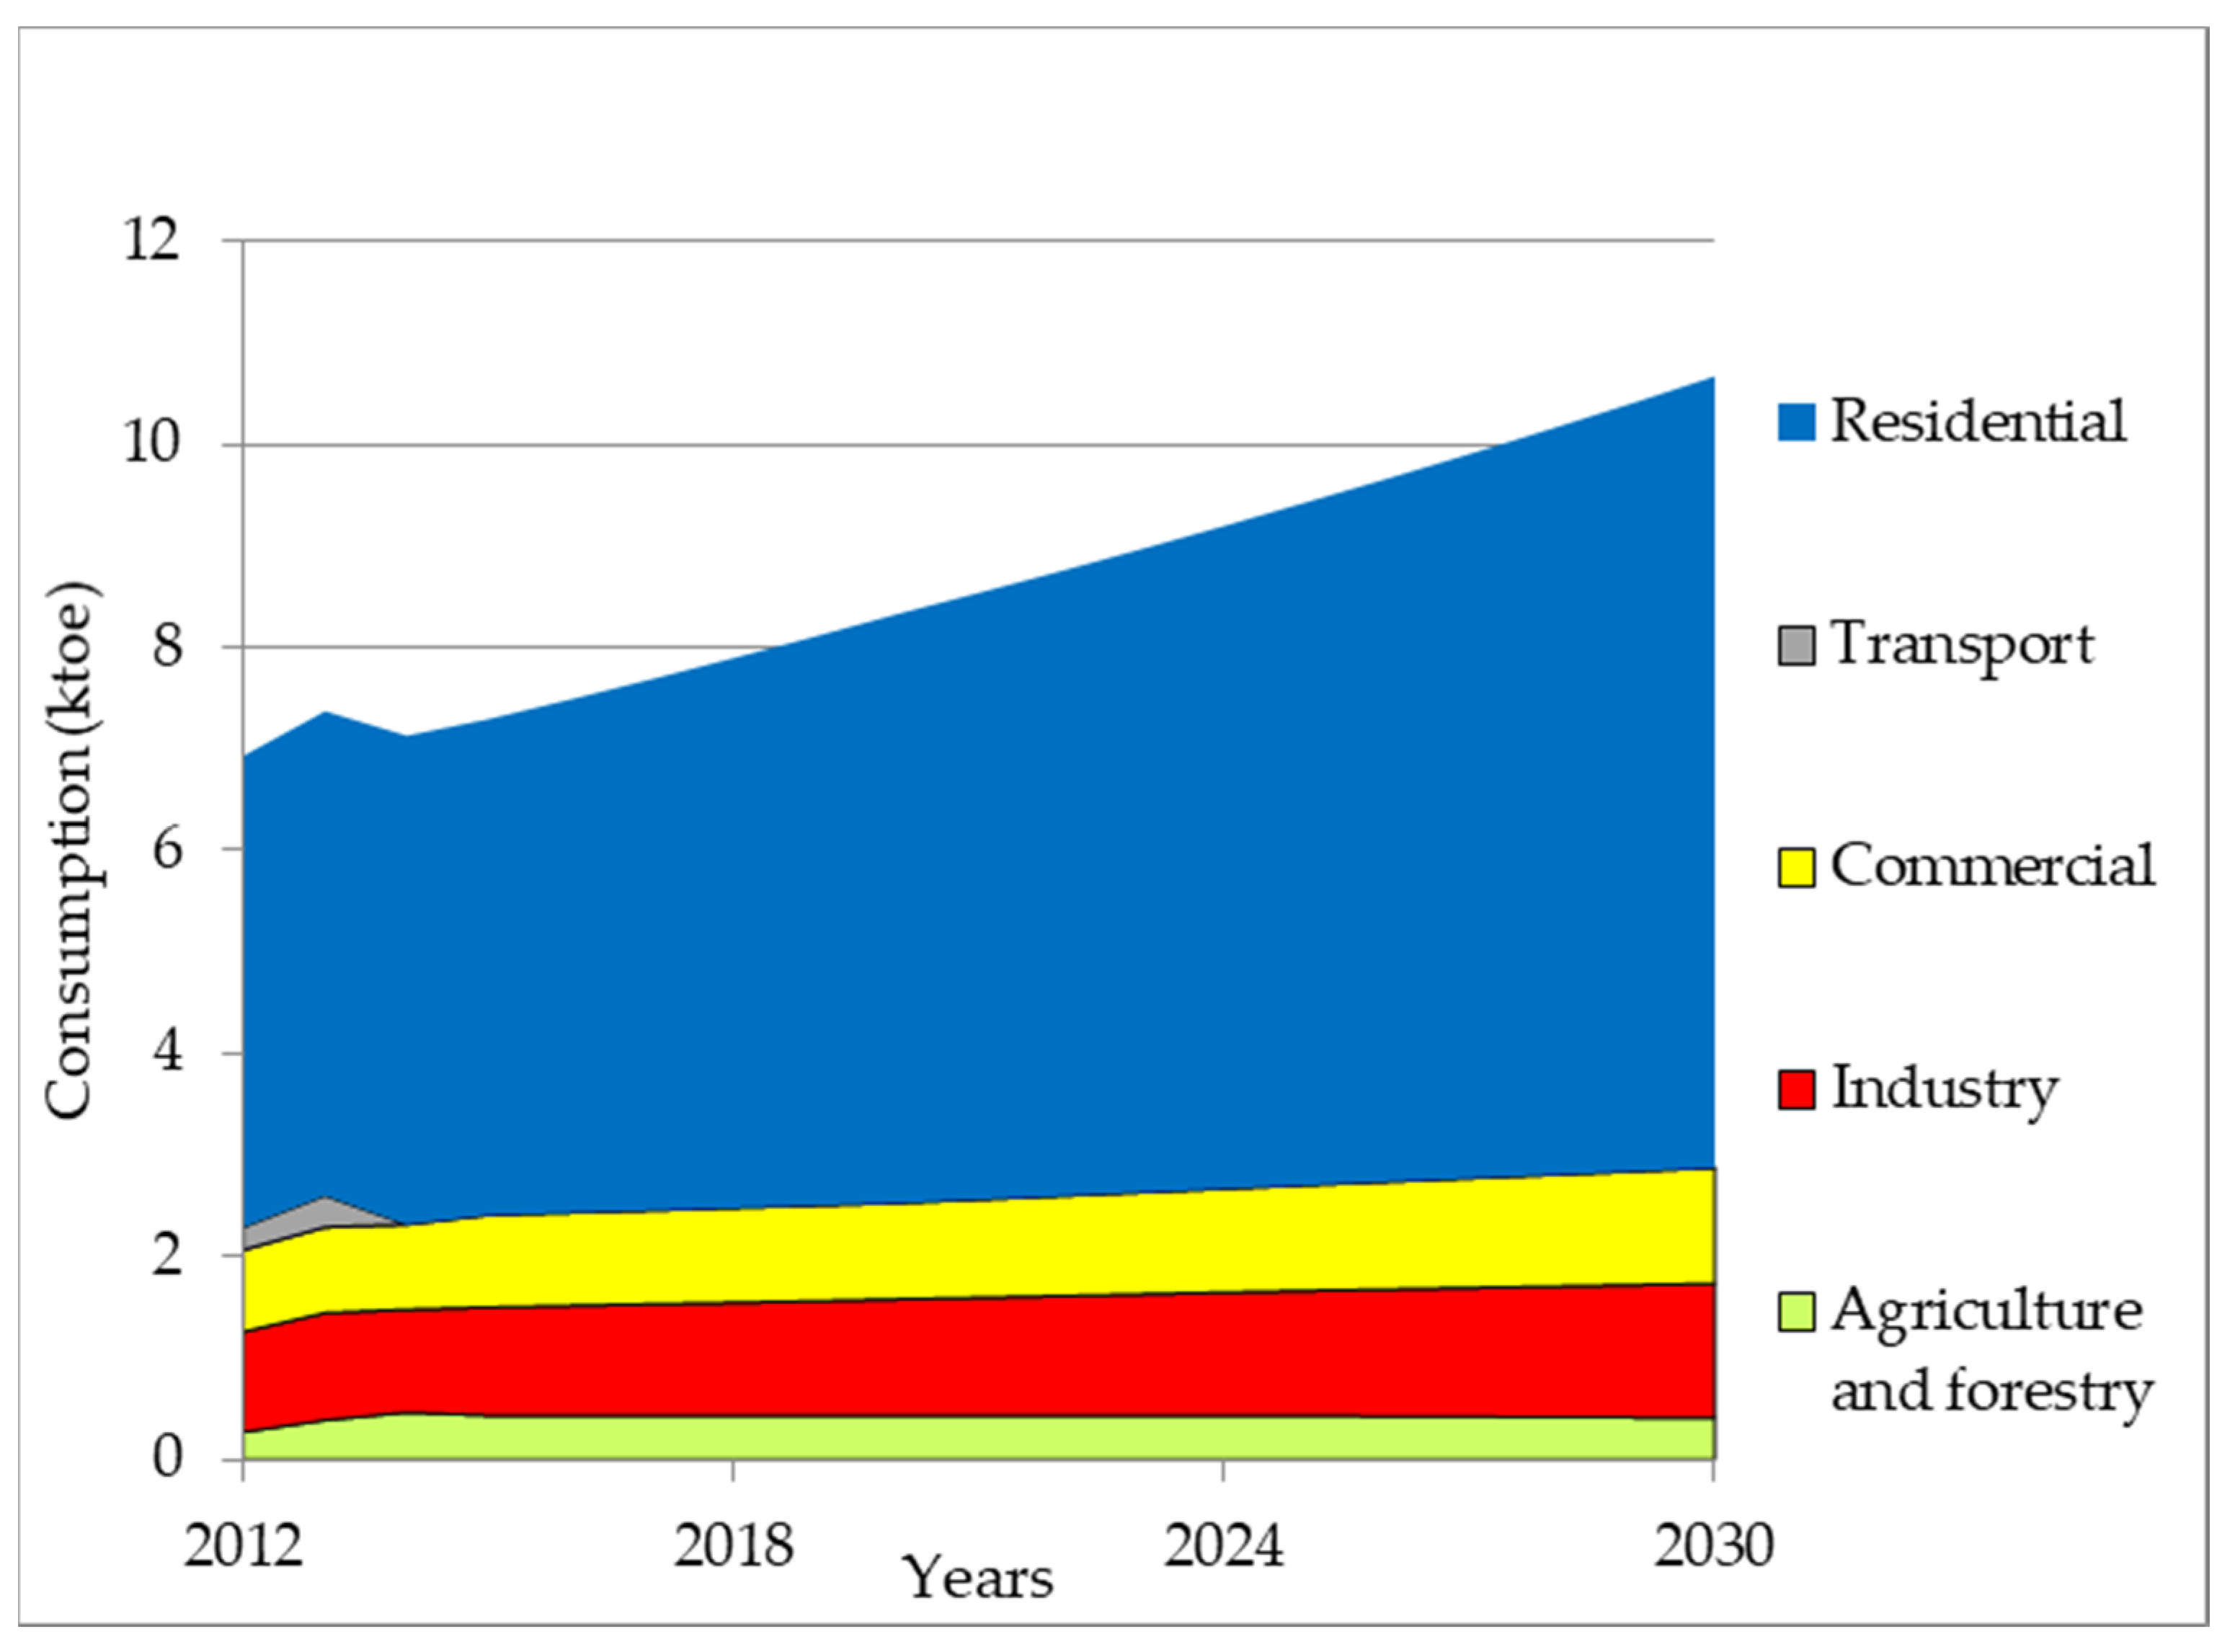
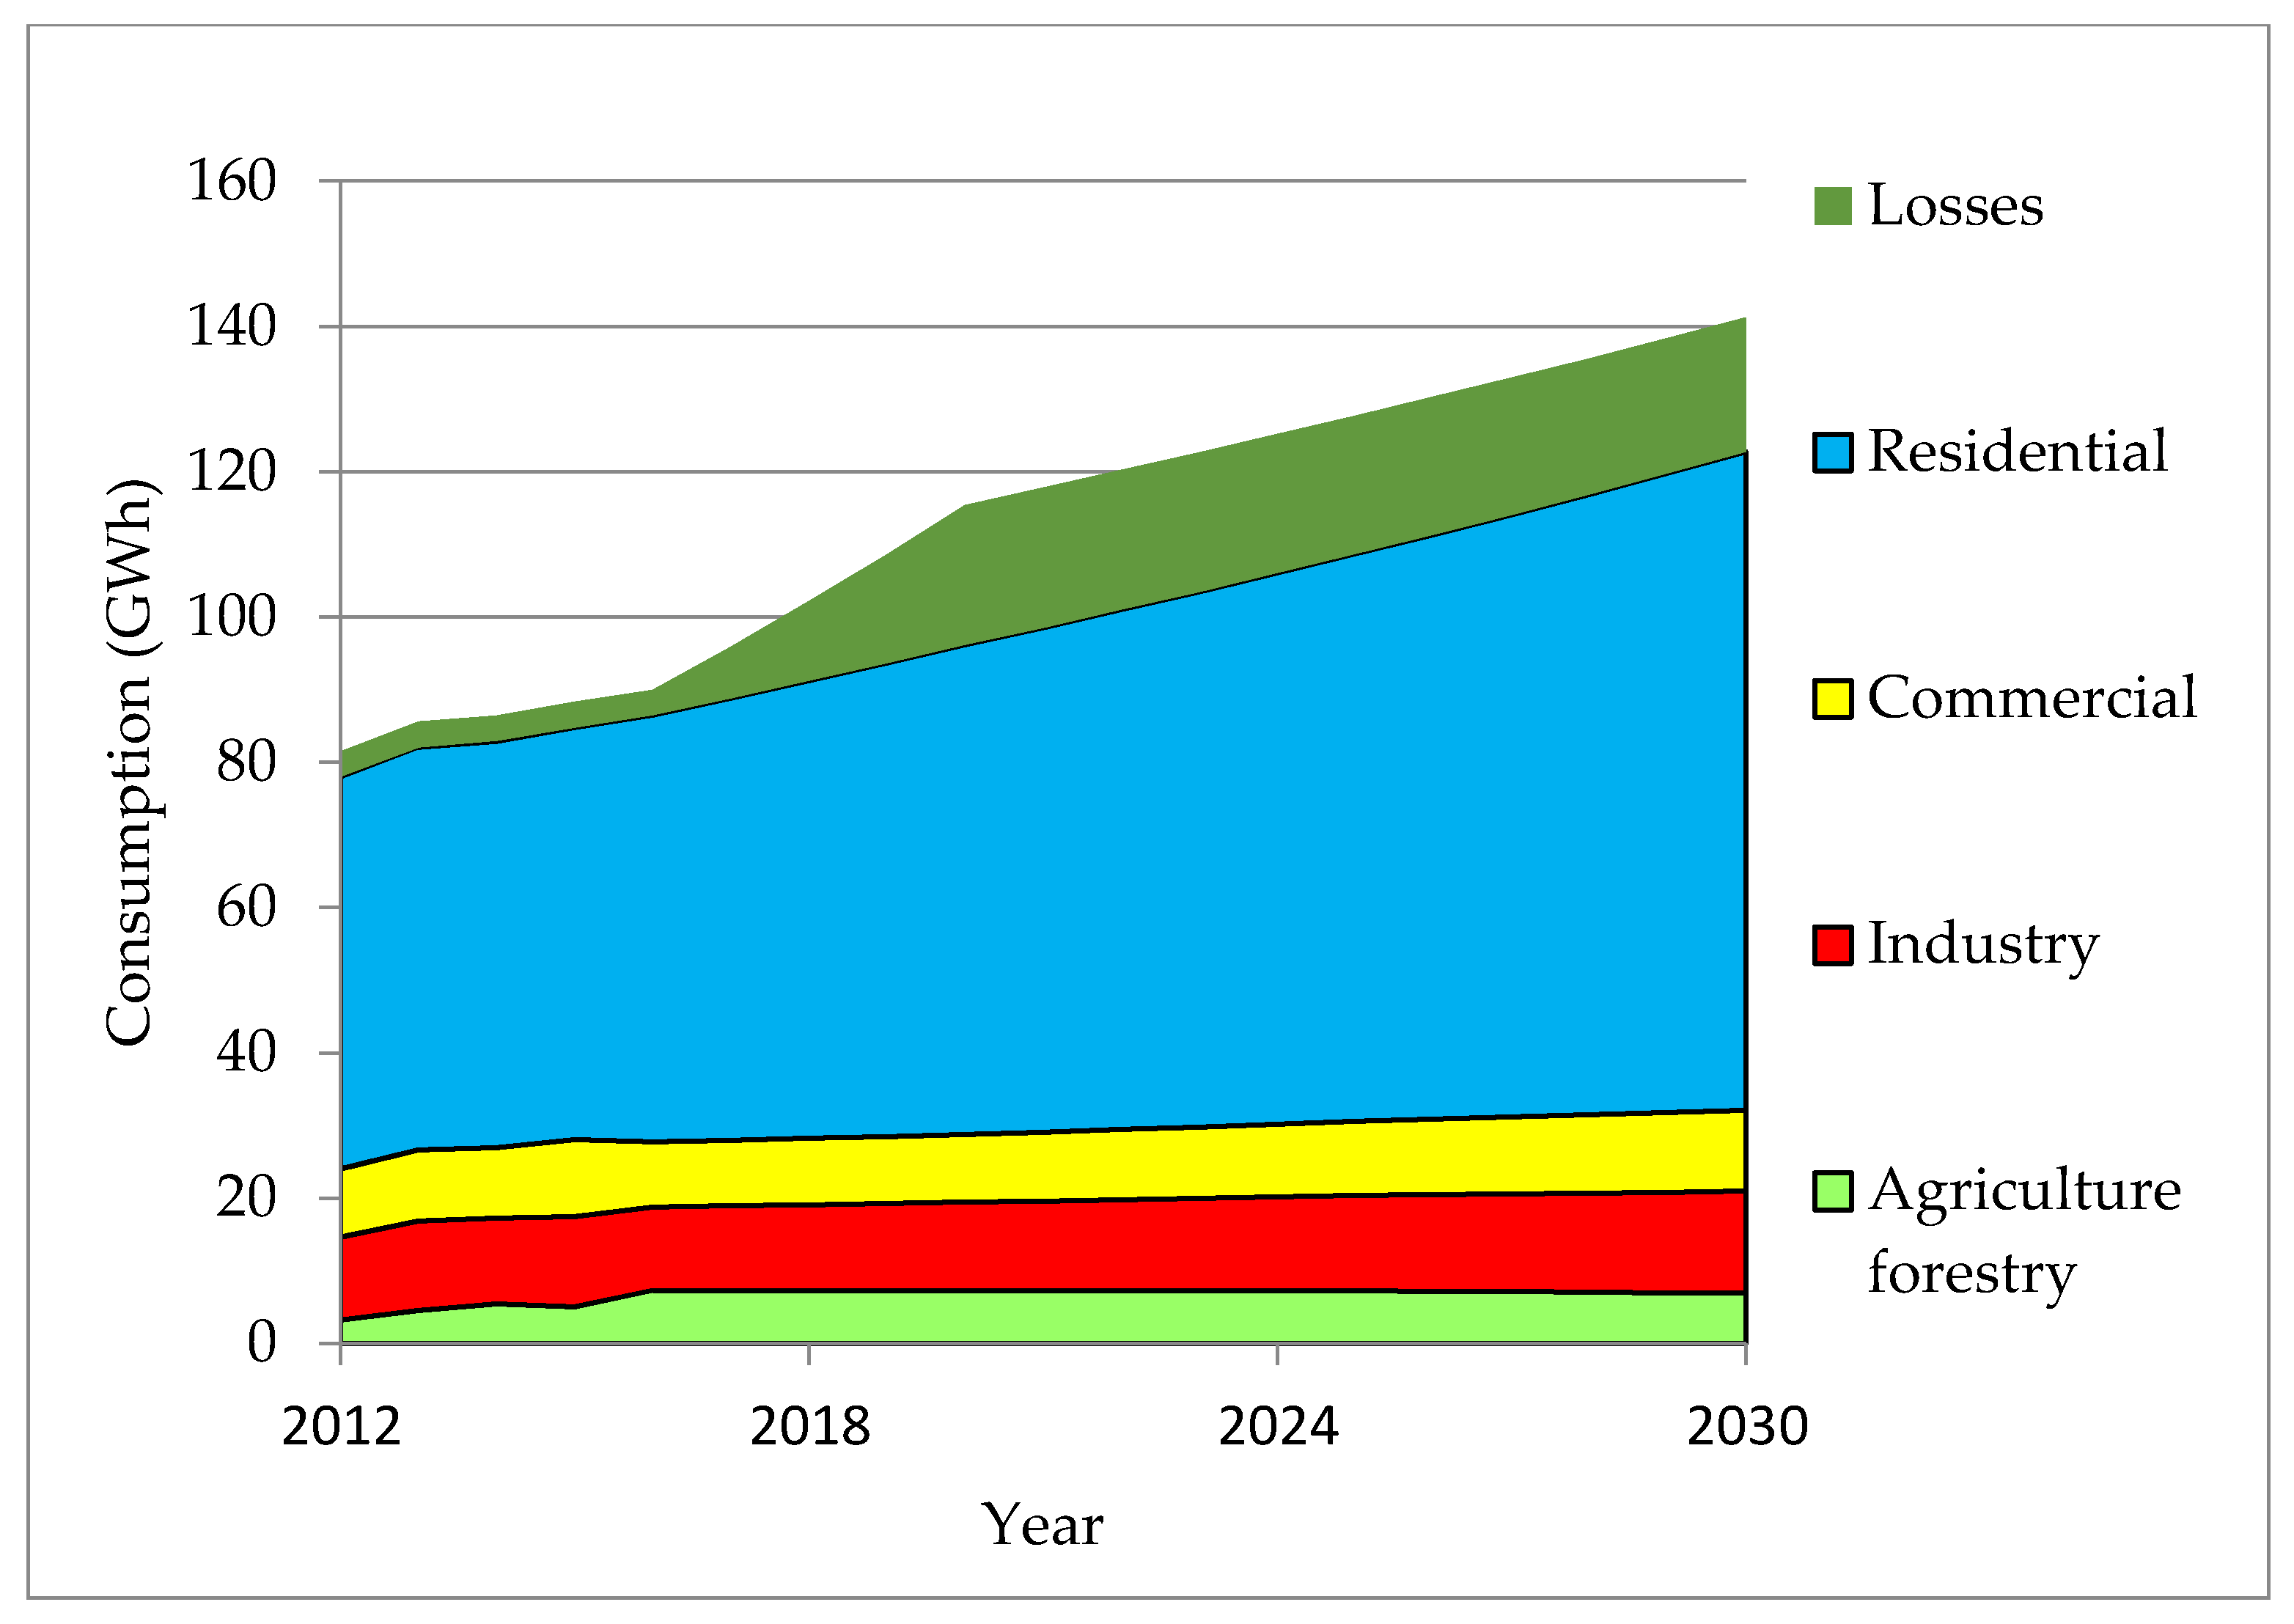
Figure 7 and
Figure 8 show the economic growth and historical energy use for the different sectors for the period from 2012 to 2019. The gradual growth can be seen in both the value added and electricity consumption. The analysis indicates that the residential sector is historically the largest consumer in the system under study [
26].
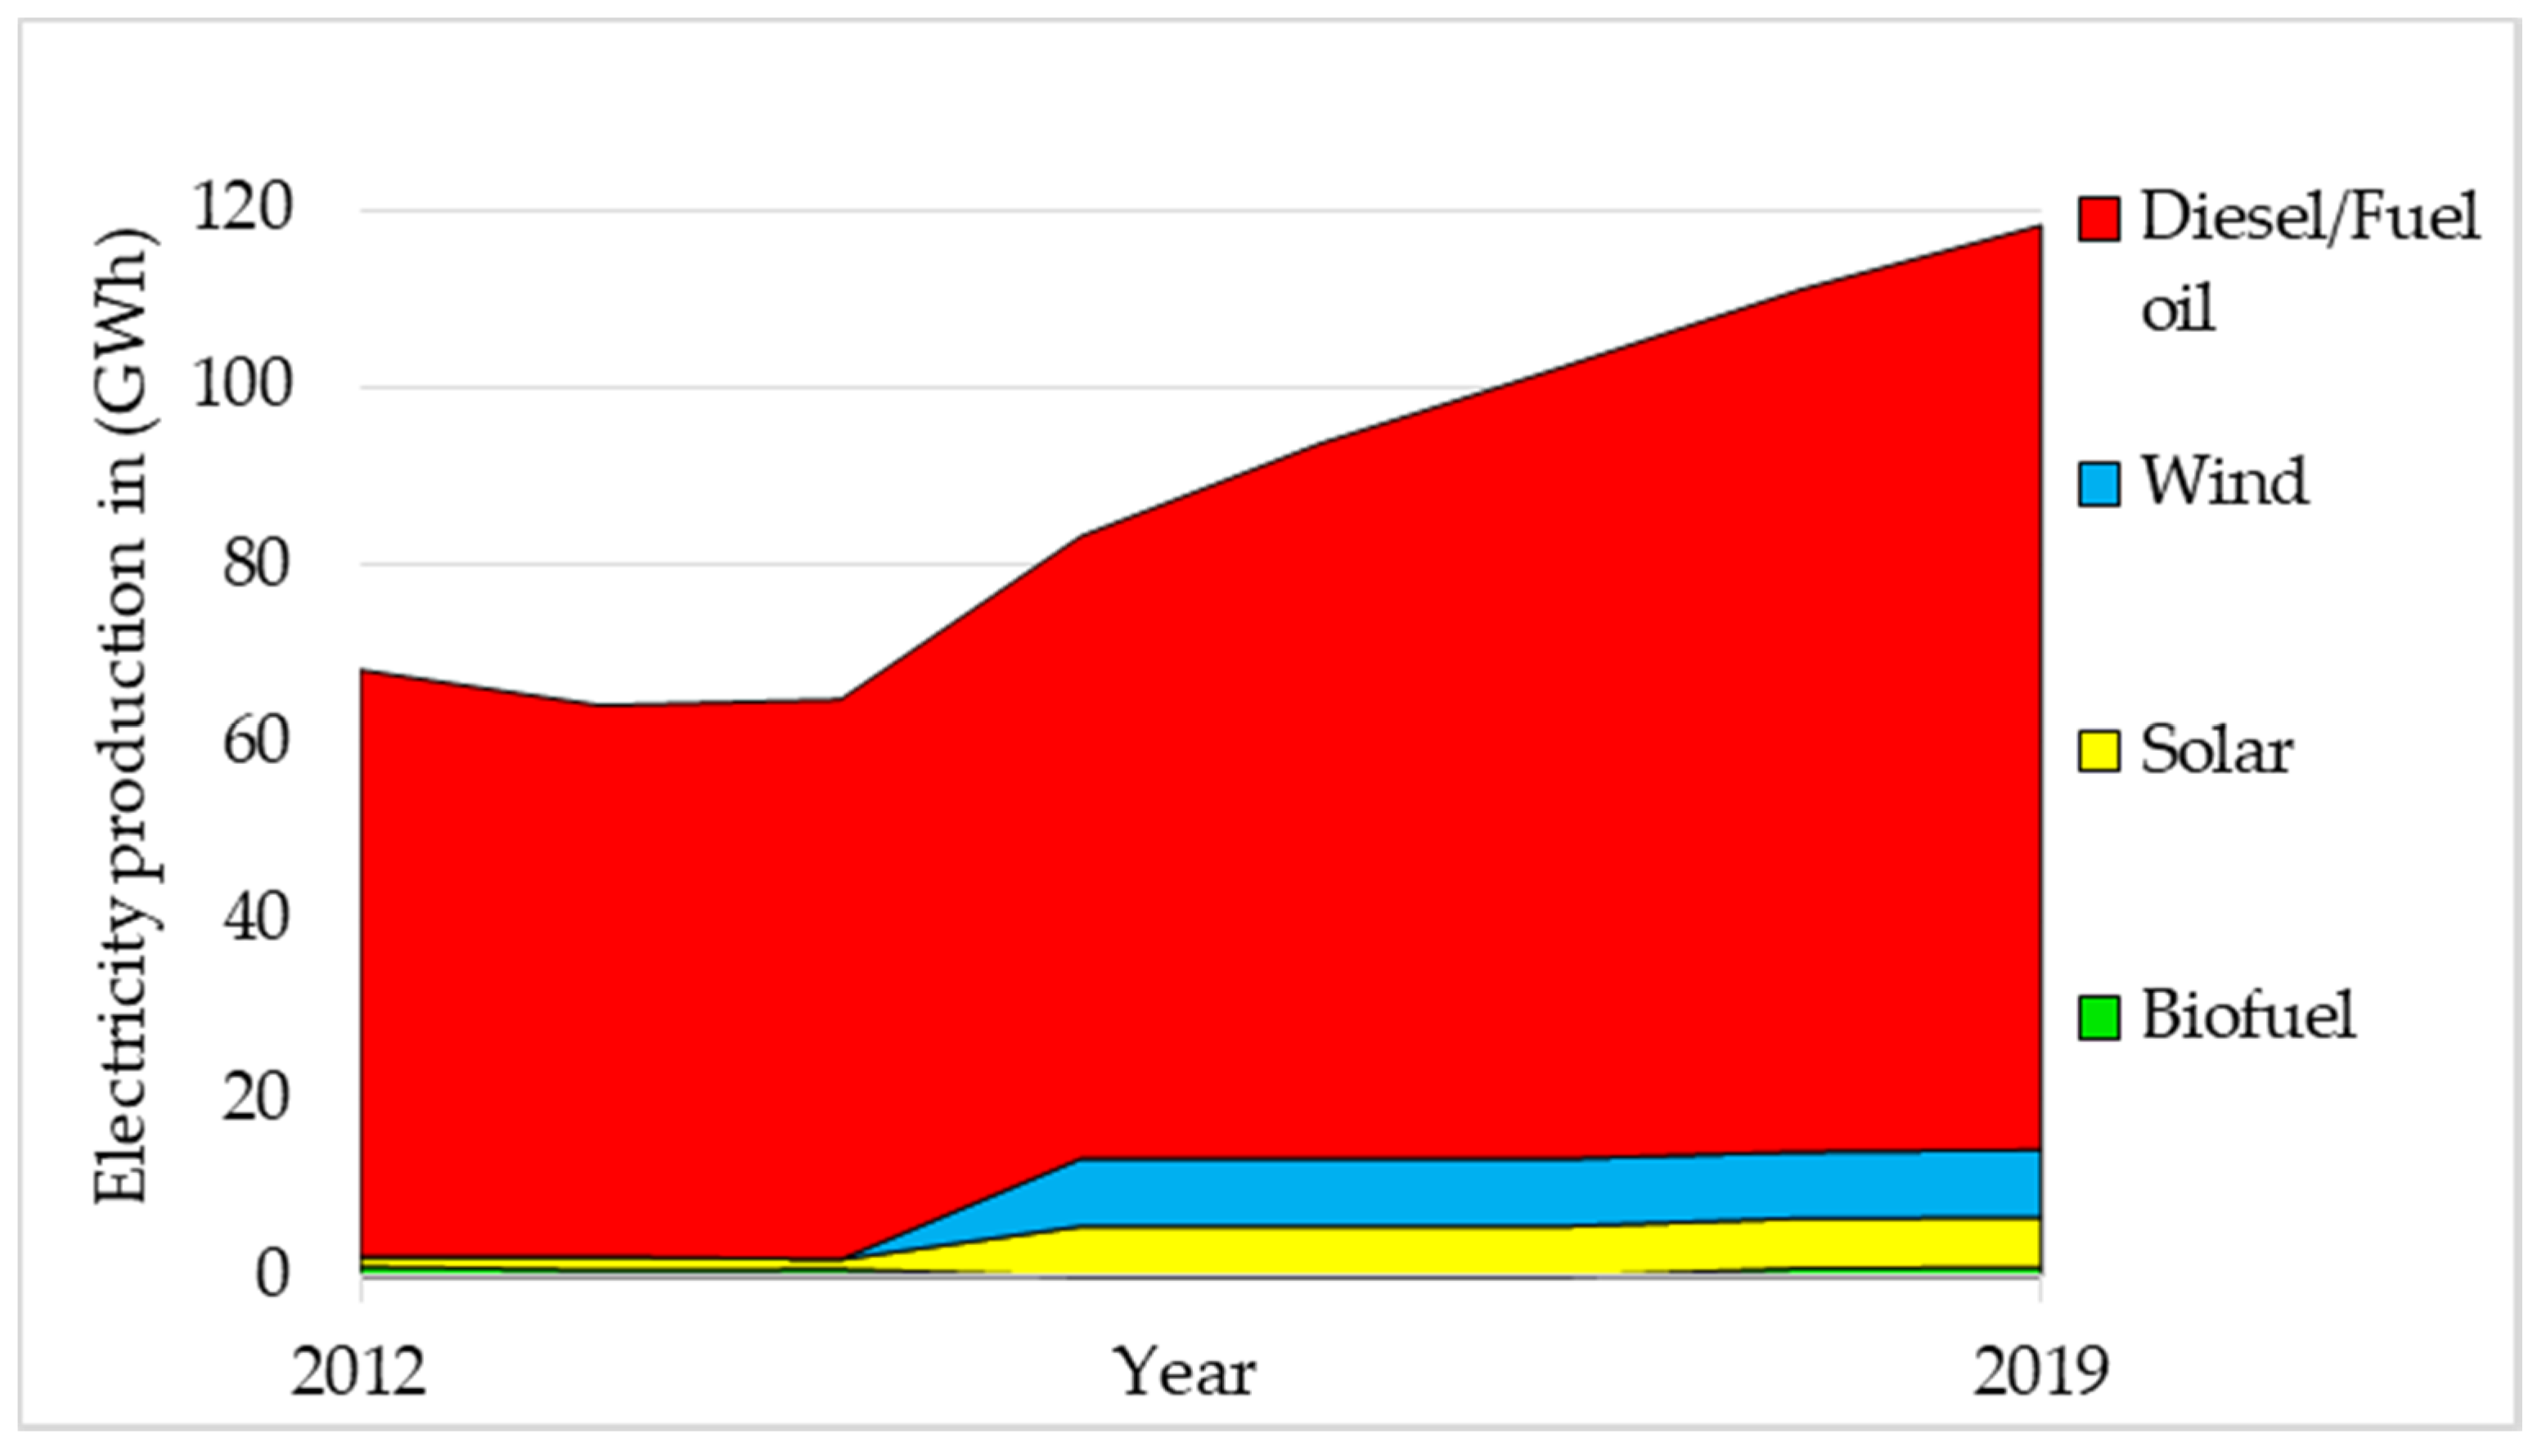
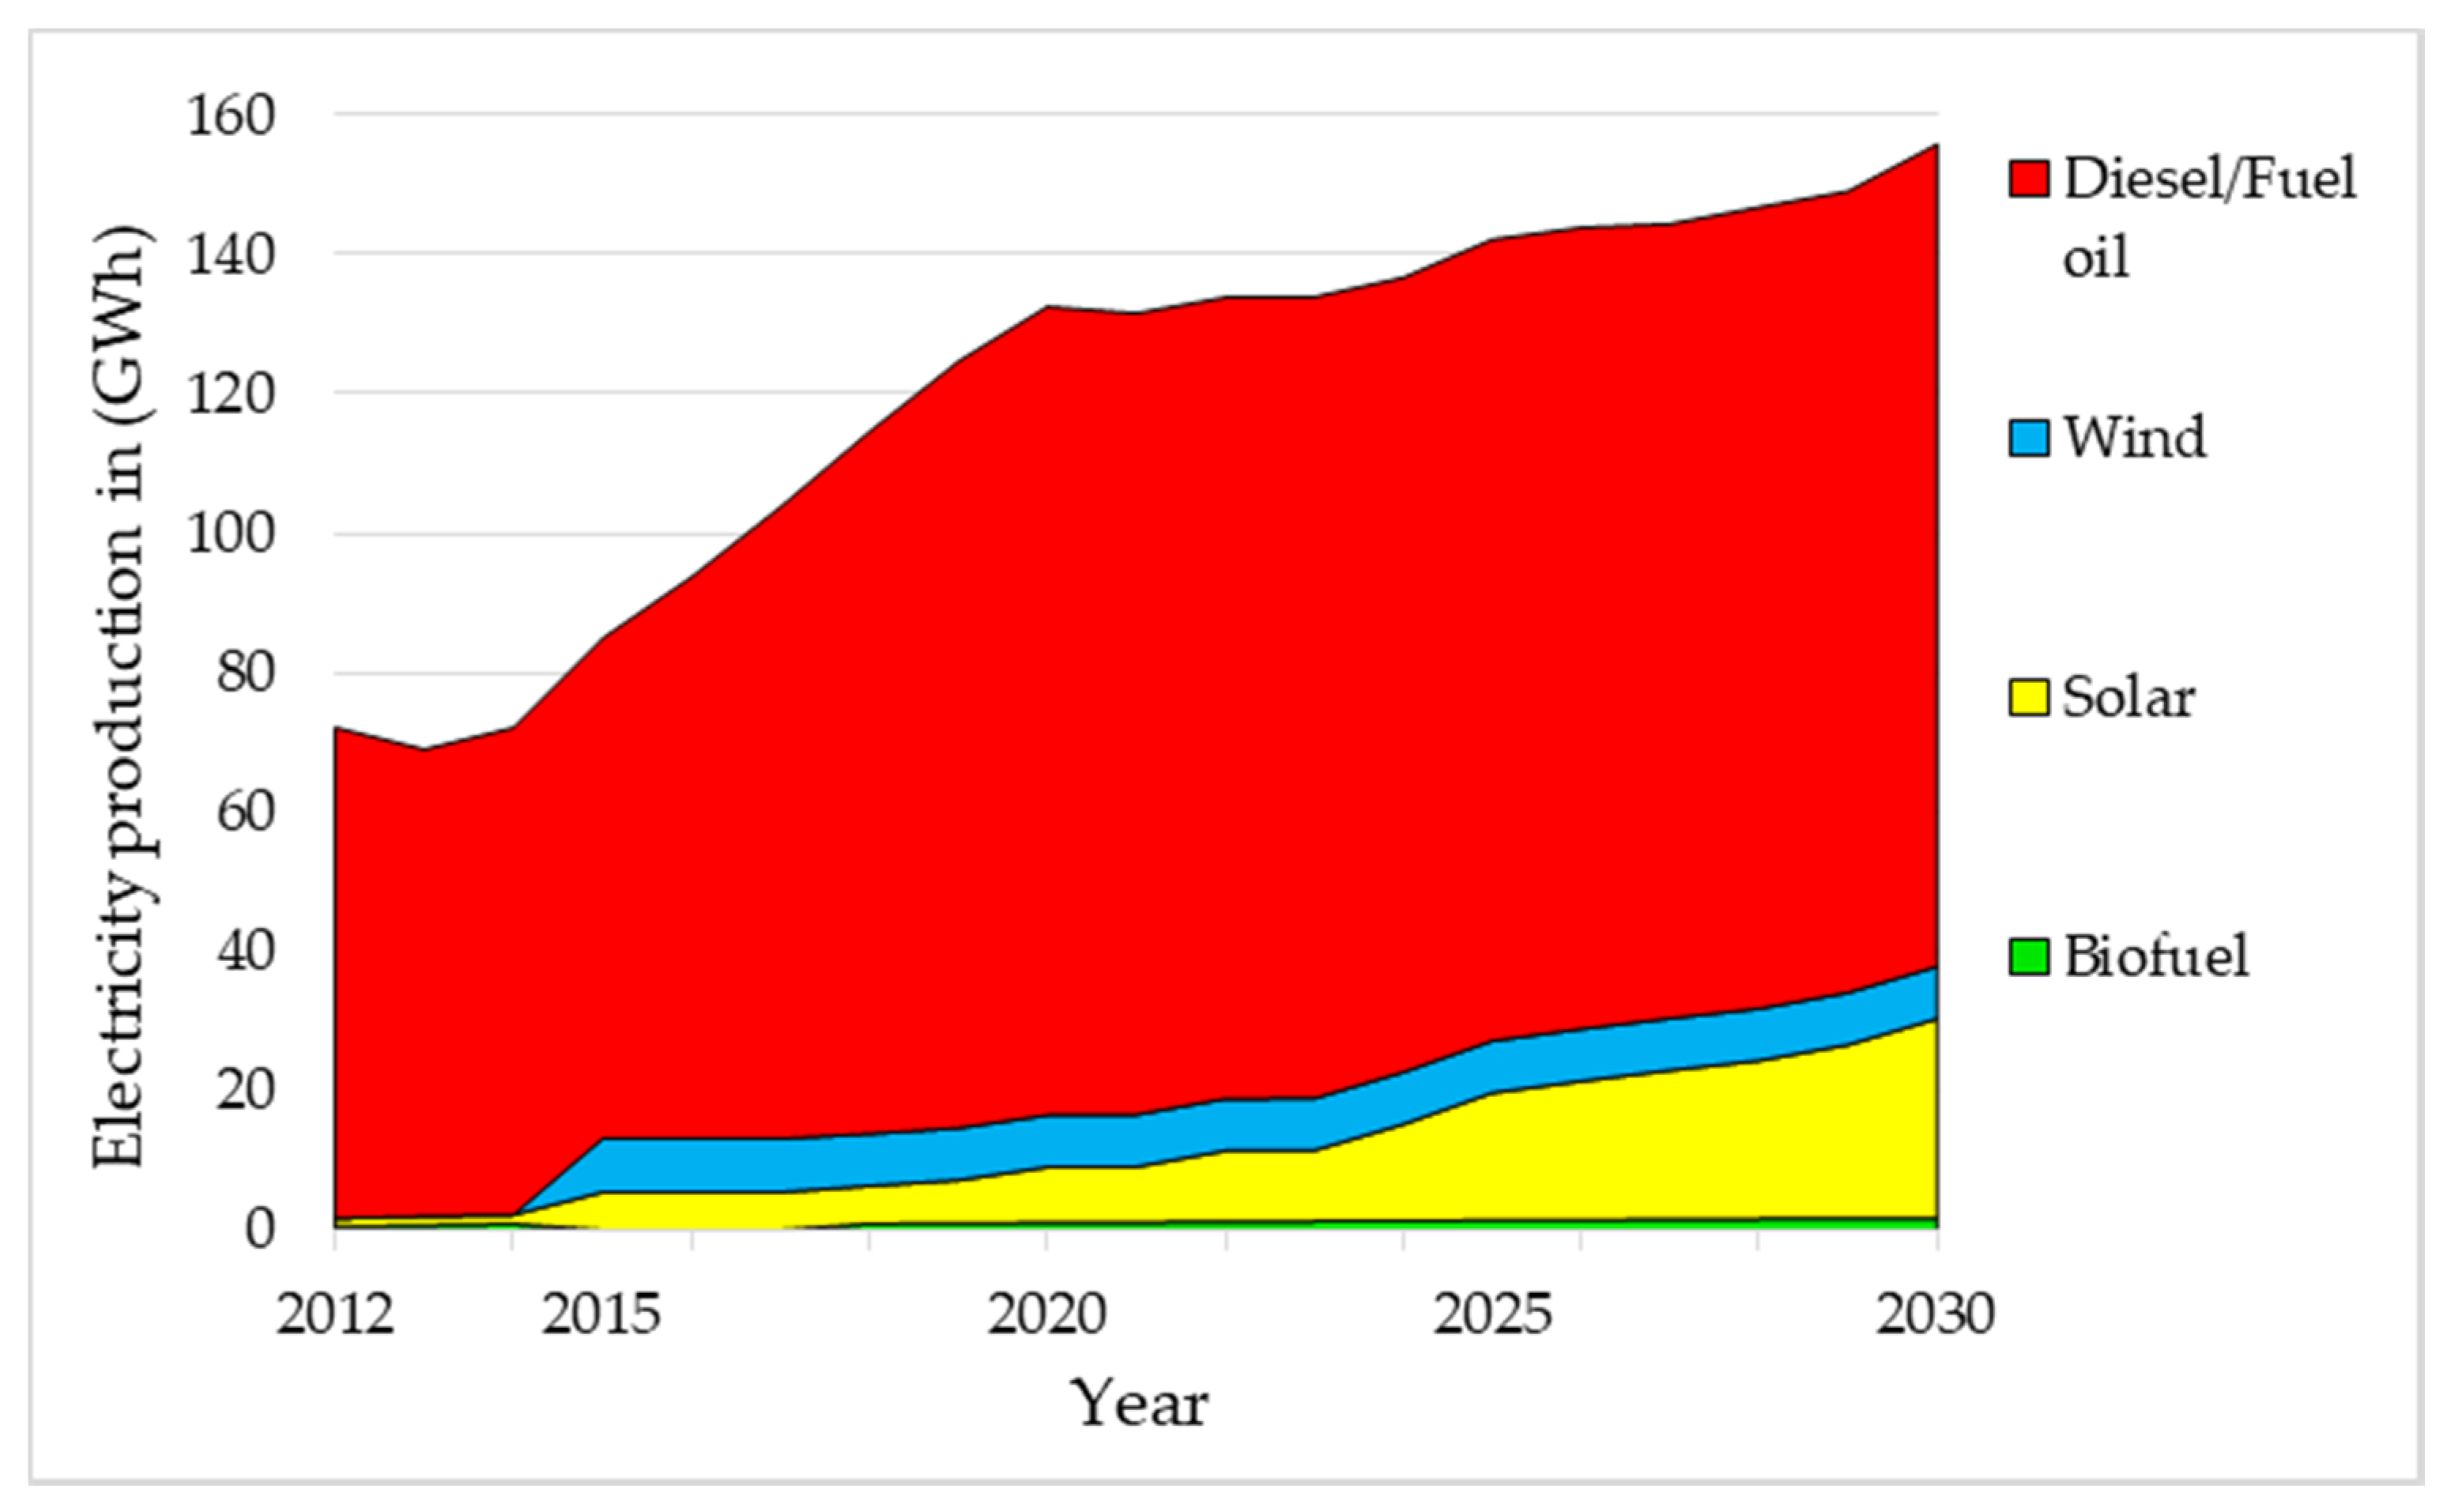
This is due to the low activity in the service, industry and agriculture sectors, similar to the structural behavior on the main island of Cuba. As electricity production is dominated by generators fueled by petroleum products as primary energy sources (
Figure 9) in 2019, the base year, total CO
2 emissions were 82 Mt.
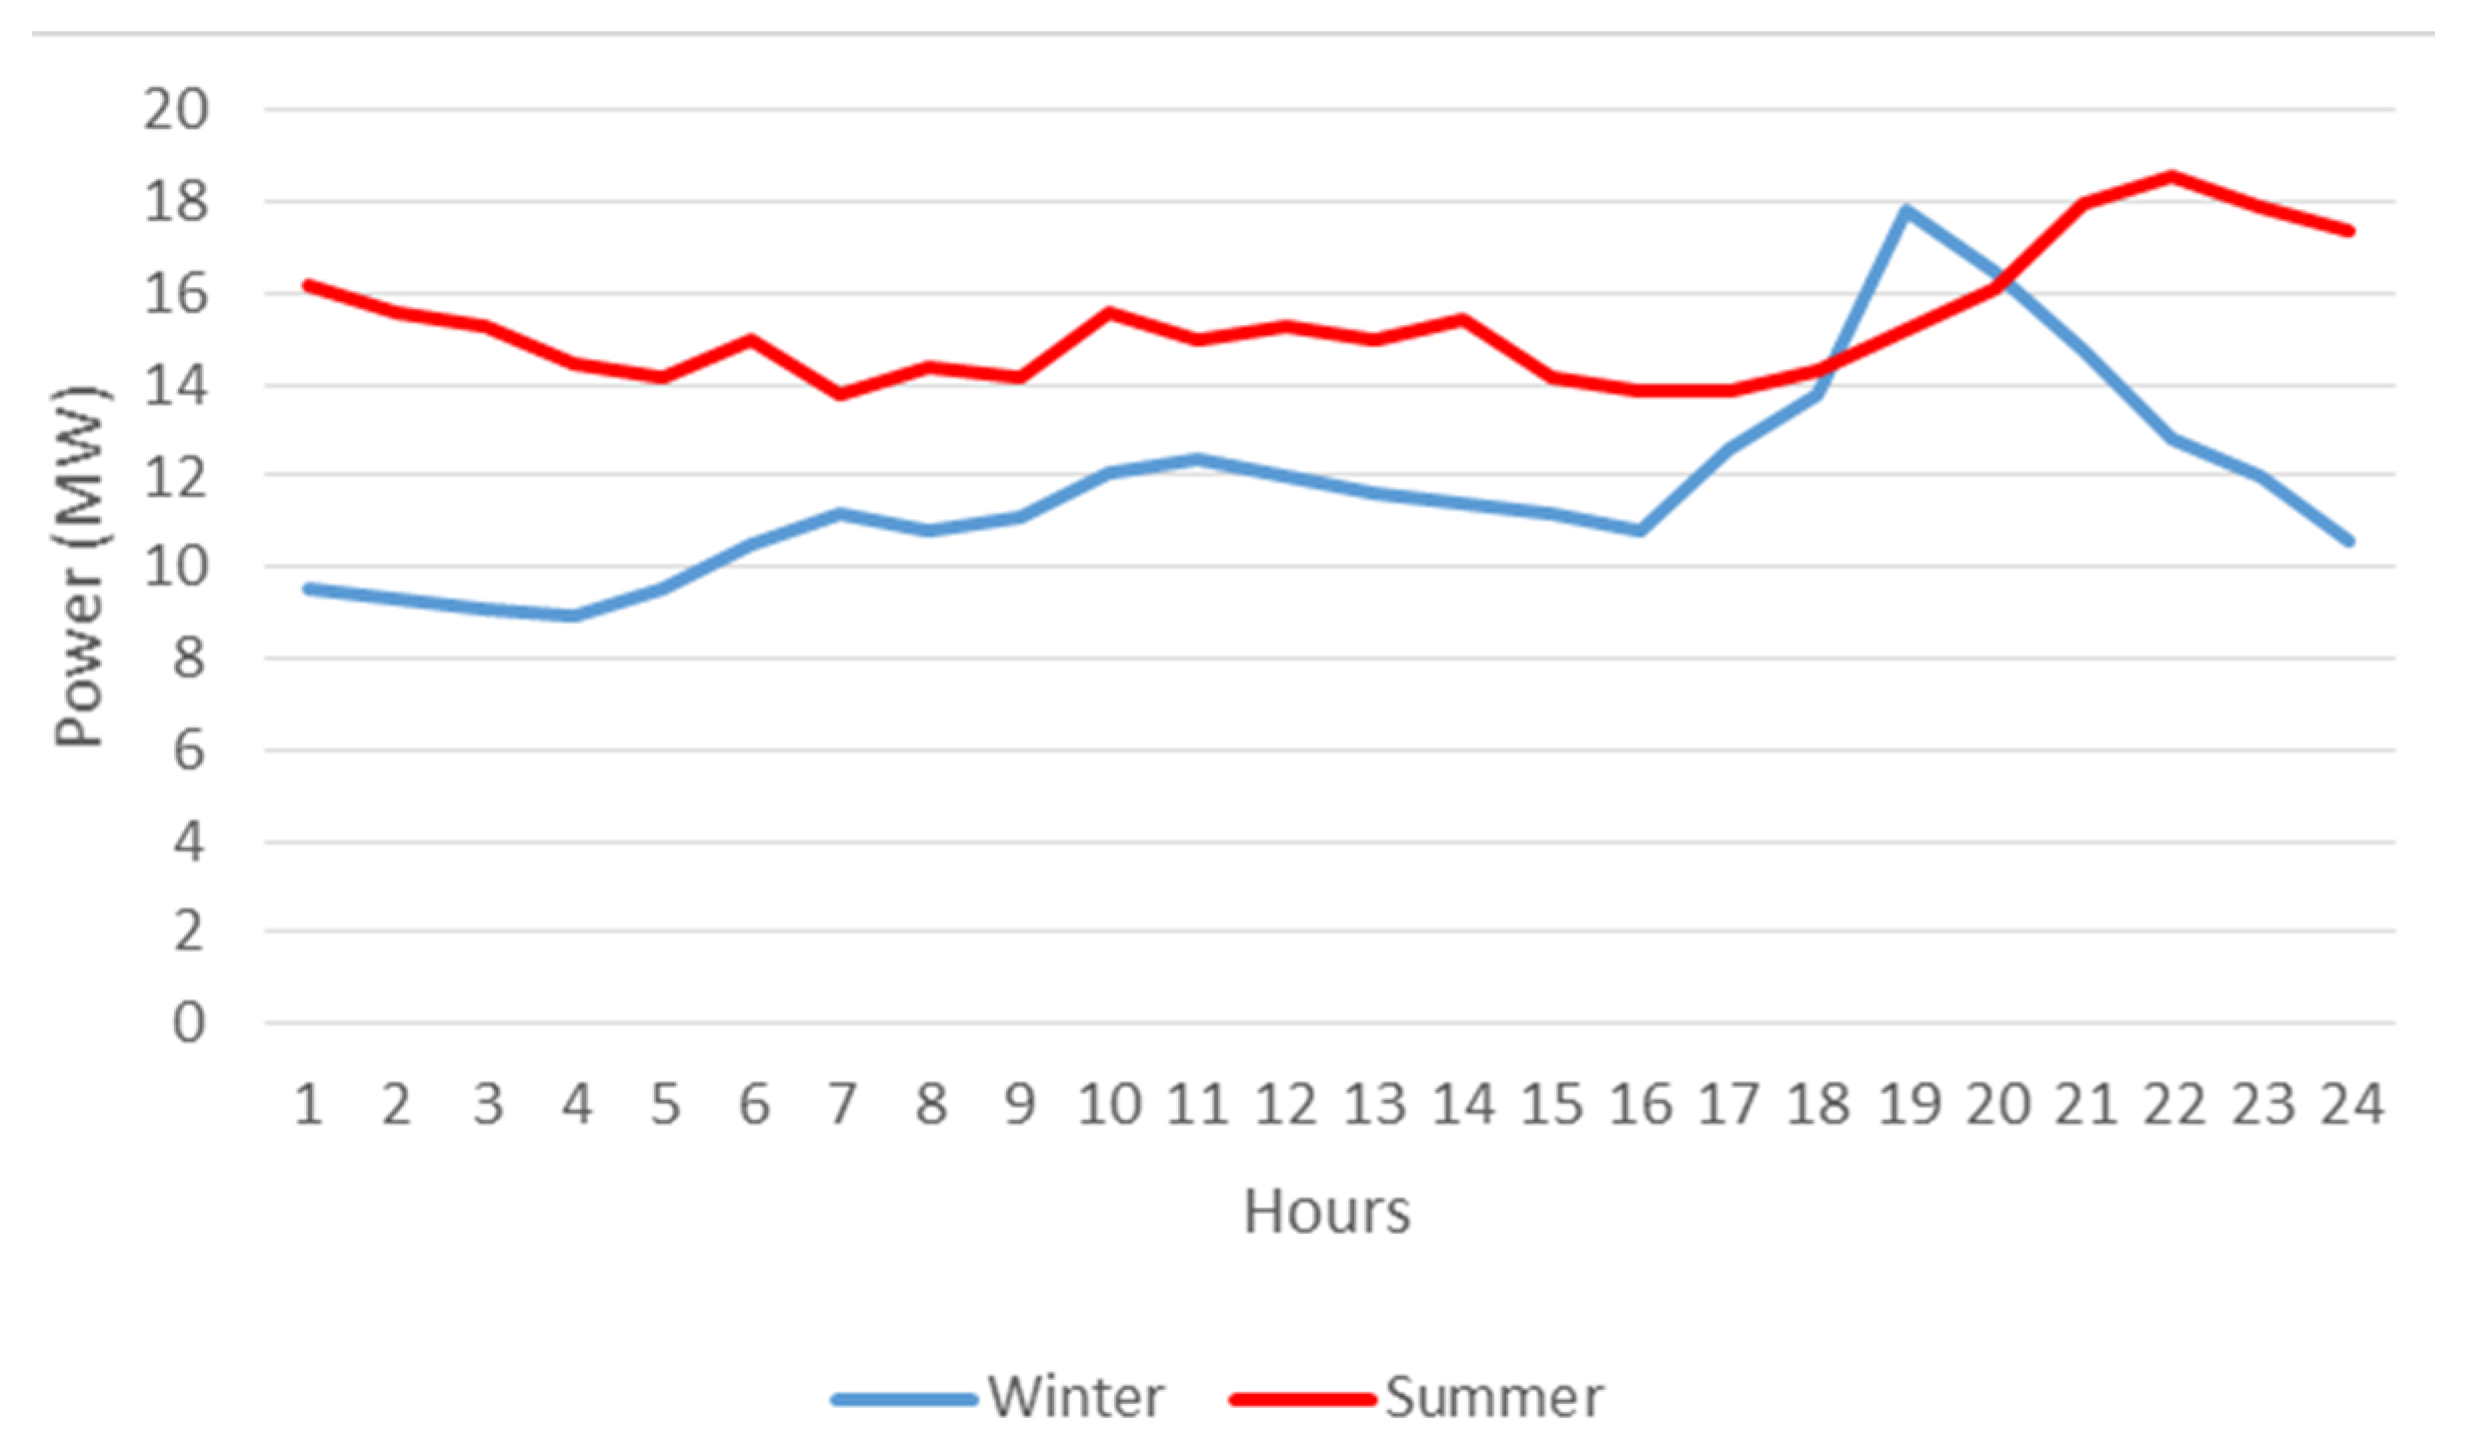
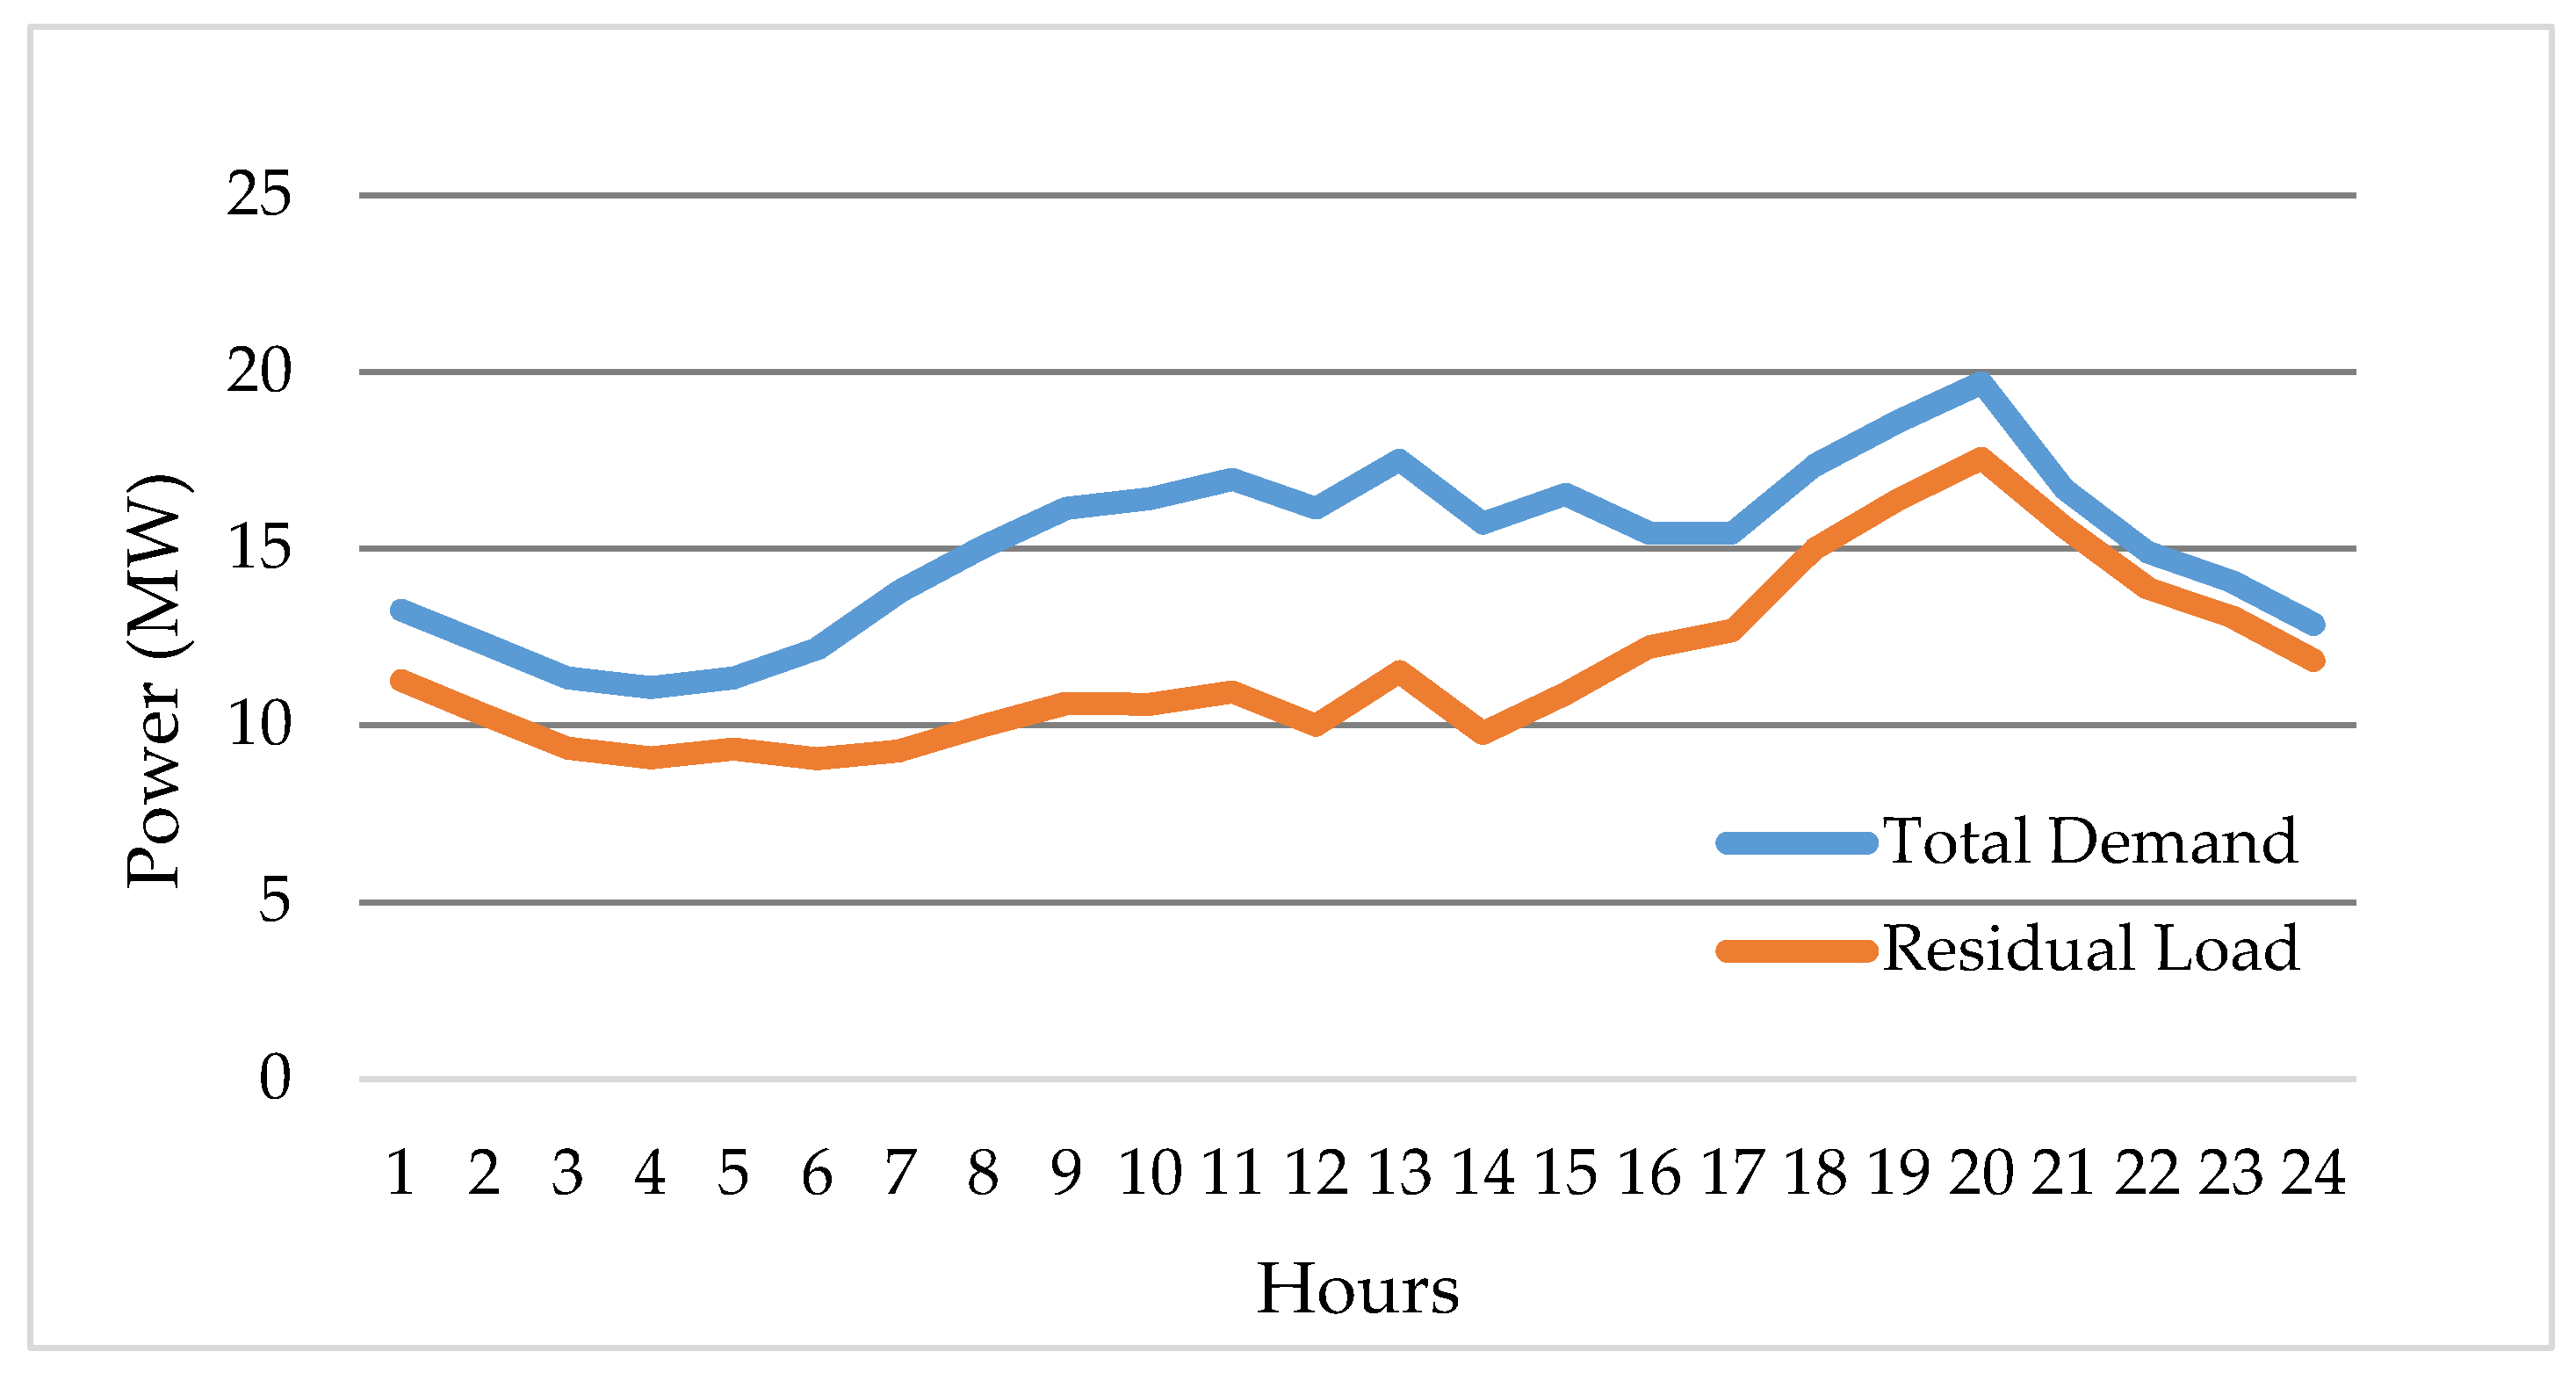
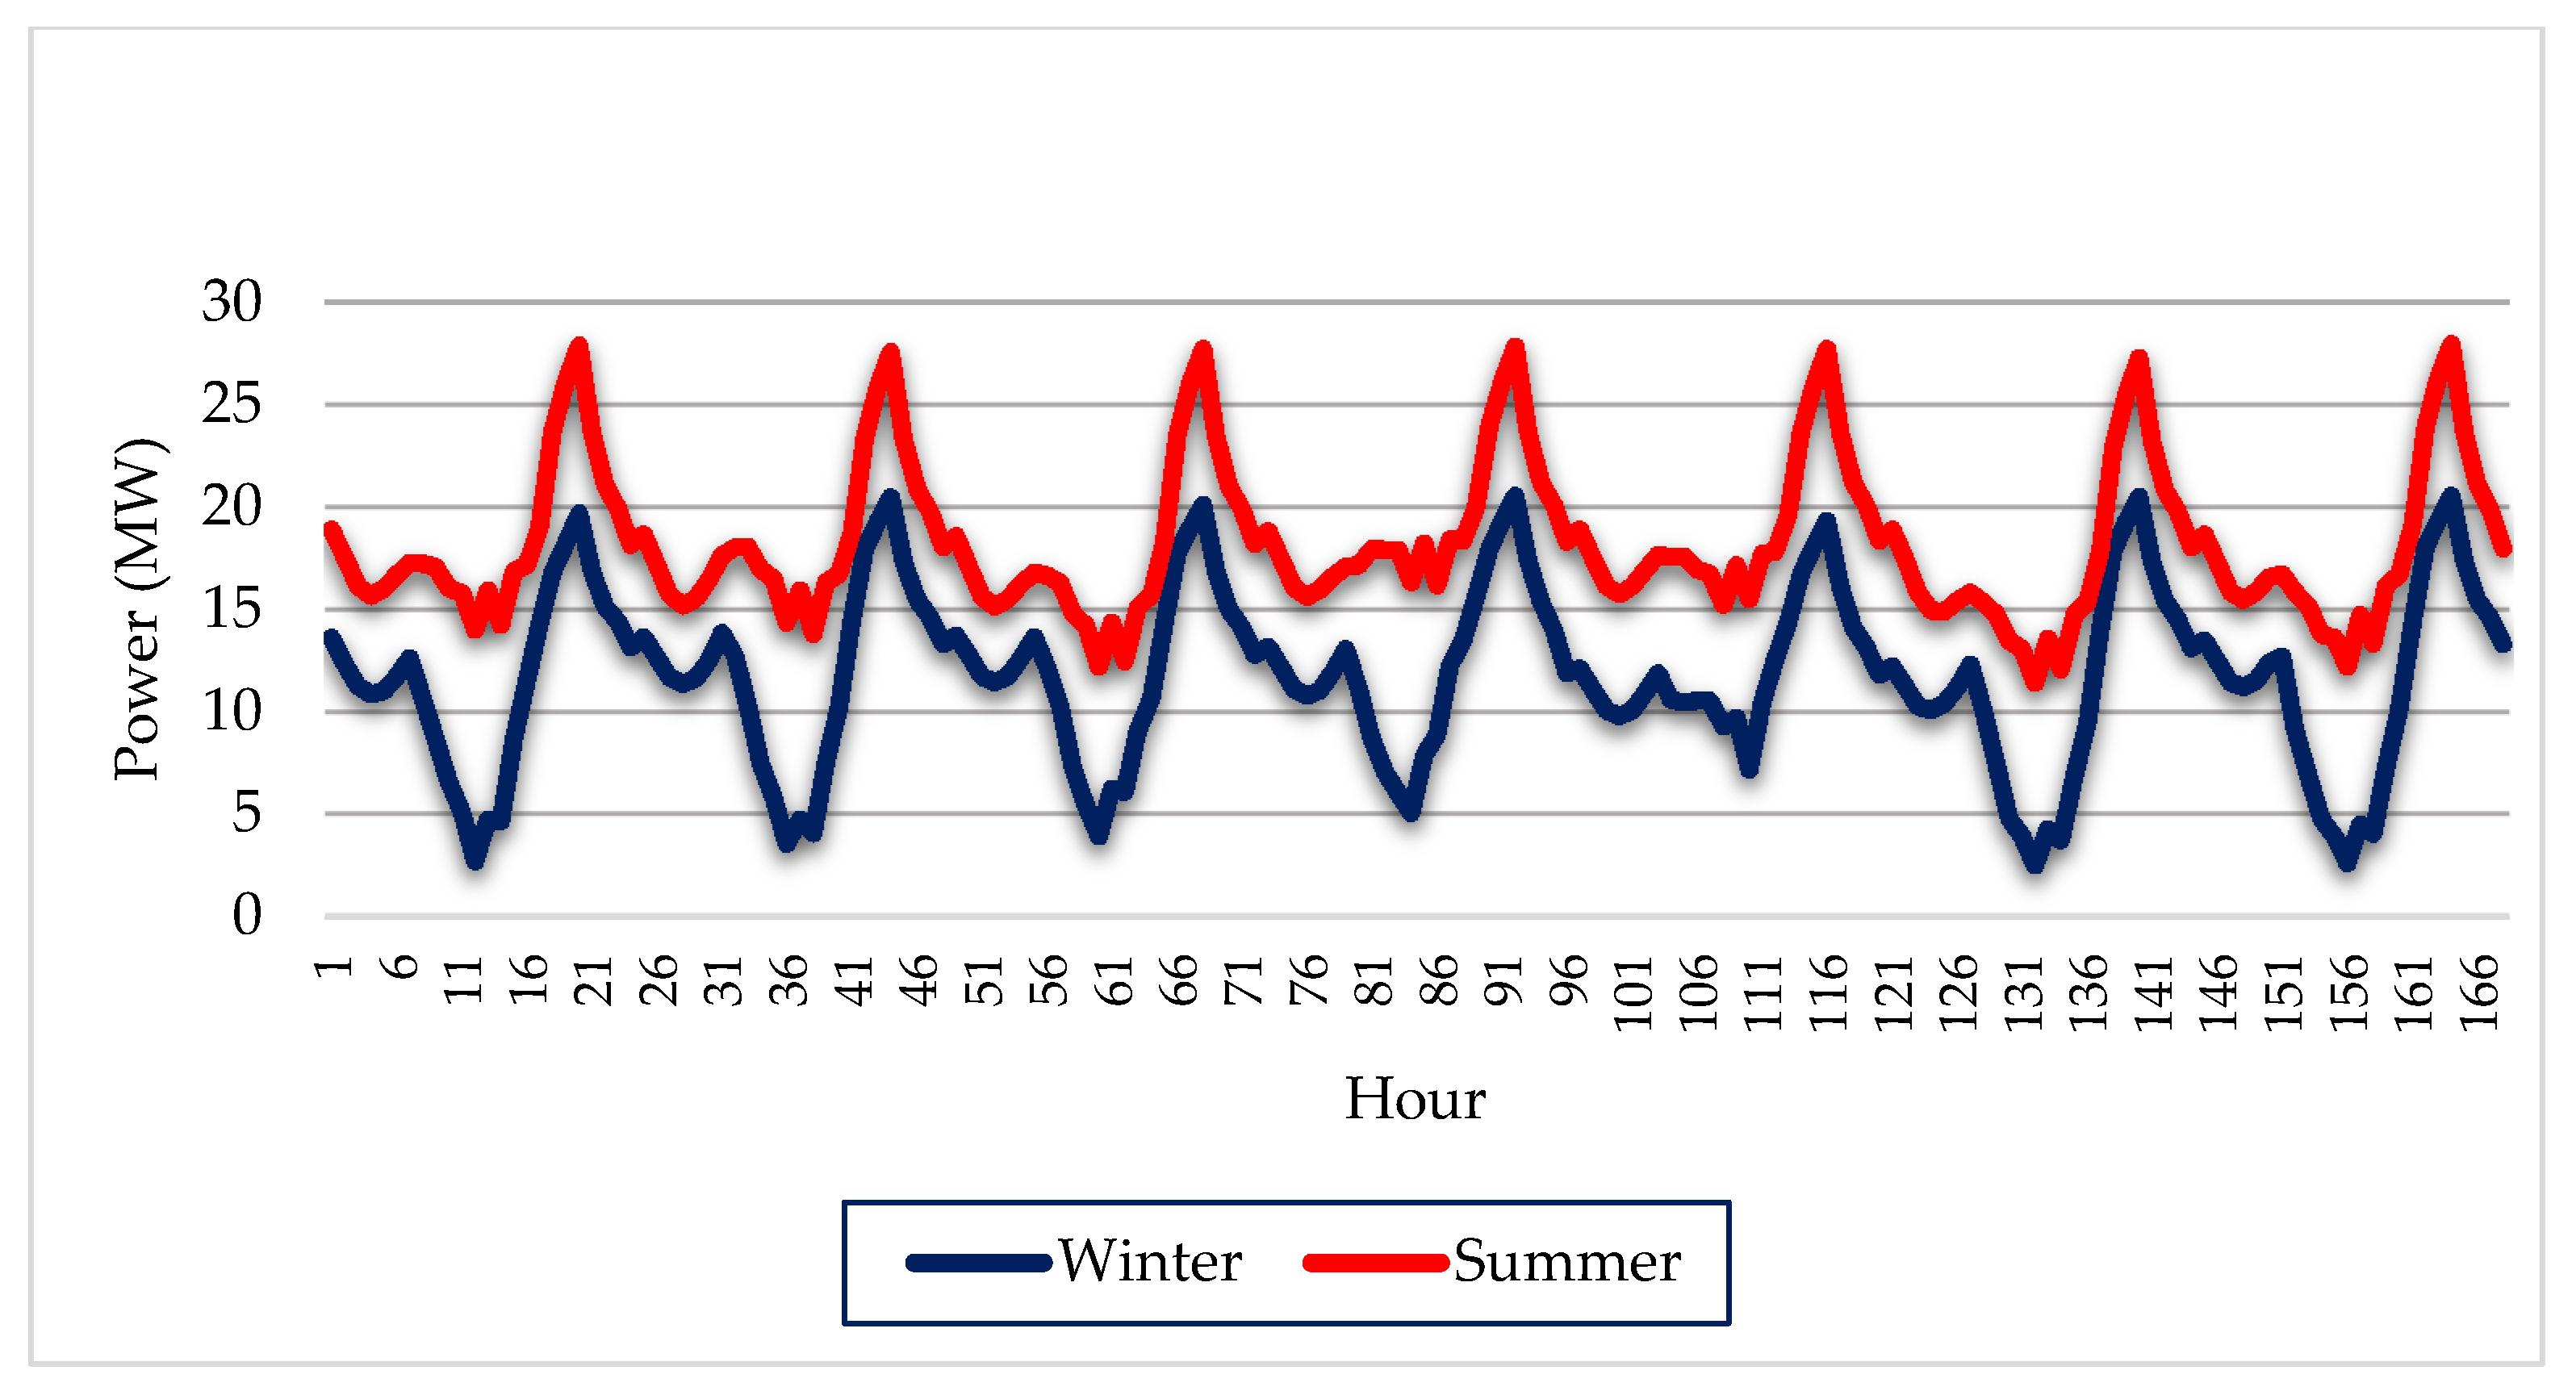
Figure 10 shows the behavior of a typical winter day versus a summer day, showing that the system is predominantly residential with similar characteristics to the Cuban electro-energetic system. The main characteristics of the system under study reveal the following details:
Residential sector electricity consumption defines the overall load profile of the total demand with maximum peak taking place in the evening from 18:00–22:00 during both winter and summer season.
The peak in the summer occurs around 22: 00, reaching around 20 MW
The peak in winter occurs around 19:00, reaching around 18 MW
In the summer curve, the difference between maximum and minimum consumption is around 5 MW, and the load is more uniformly balanced during the day
In the winter curve the difference between the maximum (peak) and minimum consumption is around 9 MW, showing larger variation in the load profile.
When comparing the winter and summer curves there is a difference of around 10 MW between the summer peak and the winter minimum
These aspects are crucial in planning demand and supply, as well as the reserve capacity to perform a cost effective economic operation of the system, without jeopardizing the stability of the electric power system.
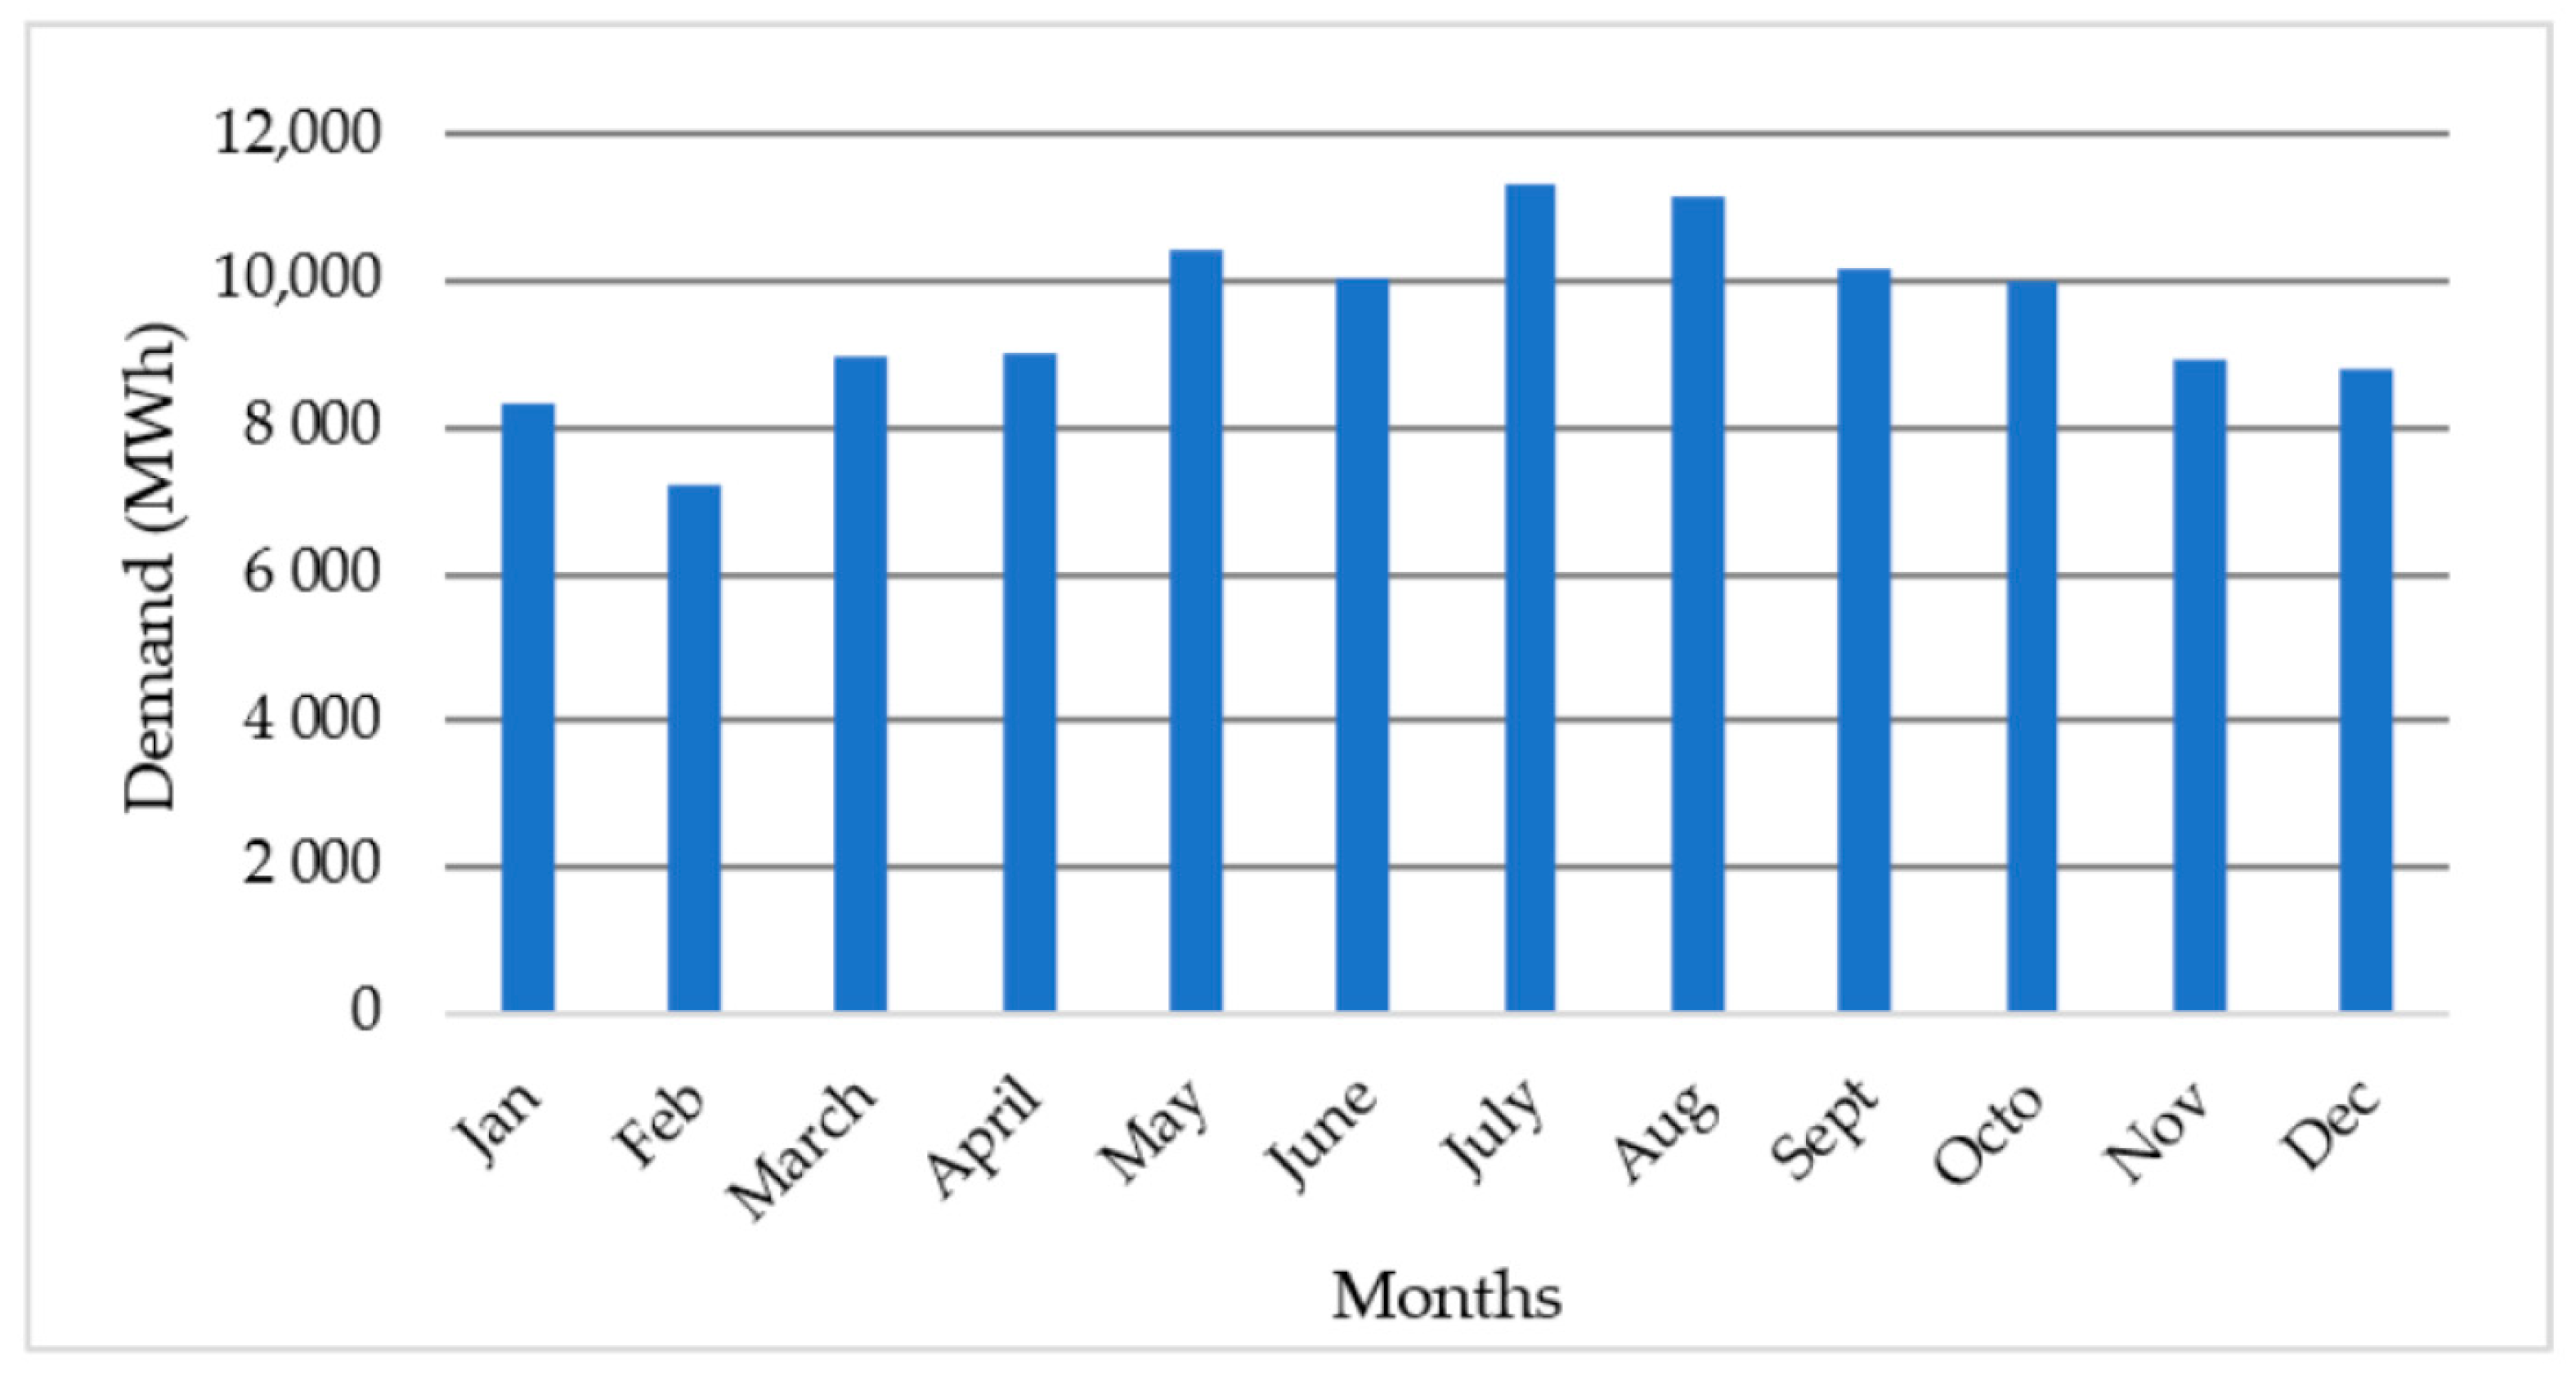
Figure 11 shows total monthly energy consumption in Isla de la Juventud in 2019. [
27]. It can be seen that summer months, mainly July and August, are the months with the highest energy consumption, with over 10,000 MWh. In the winter months, this consumption decreases considerably, with just over 7000 MWh consumed in February. In February, electricity consumption is 36% less than in July. The annual demand of the system under study in 2019 was 114,548 MWh [
27].
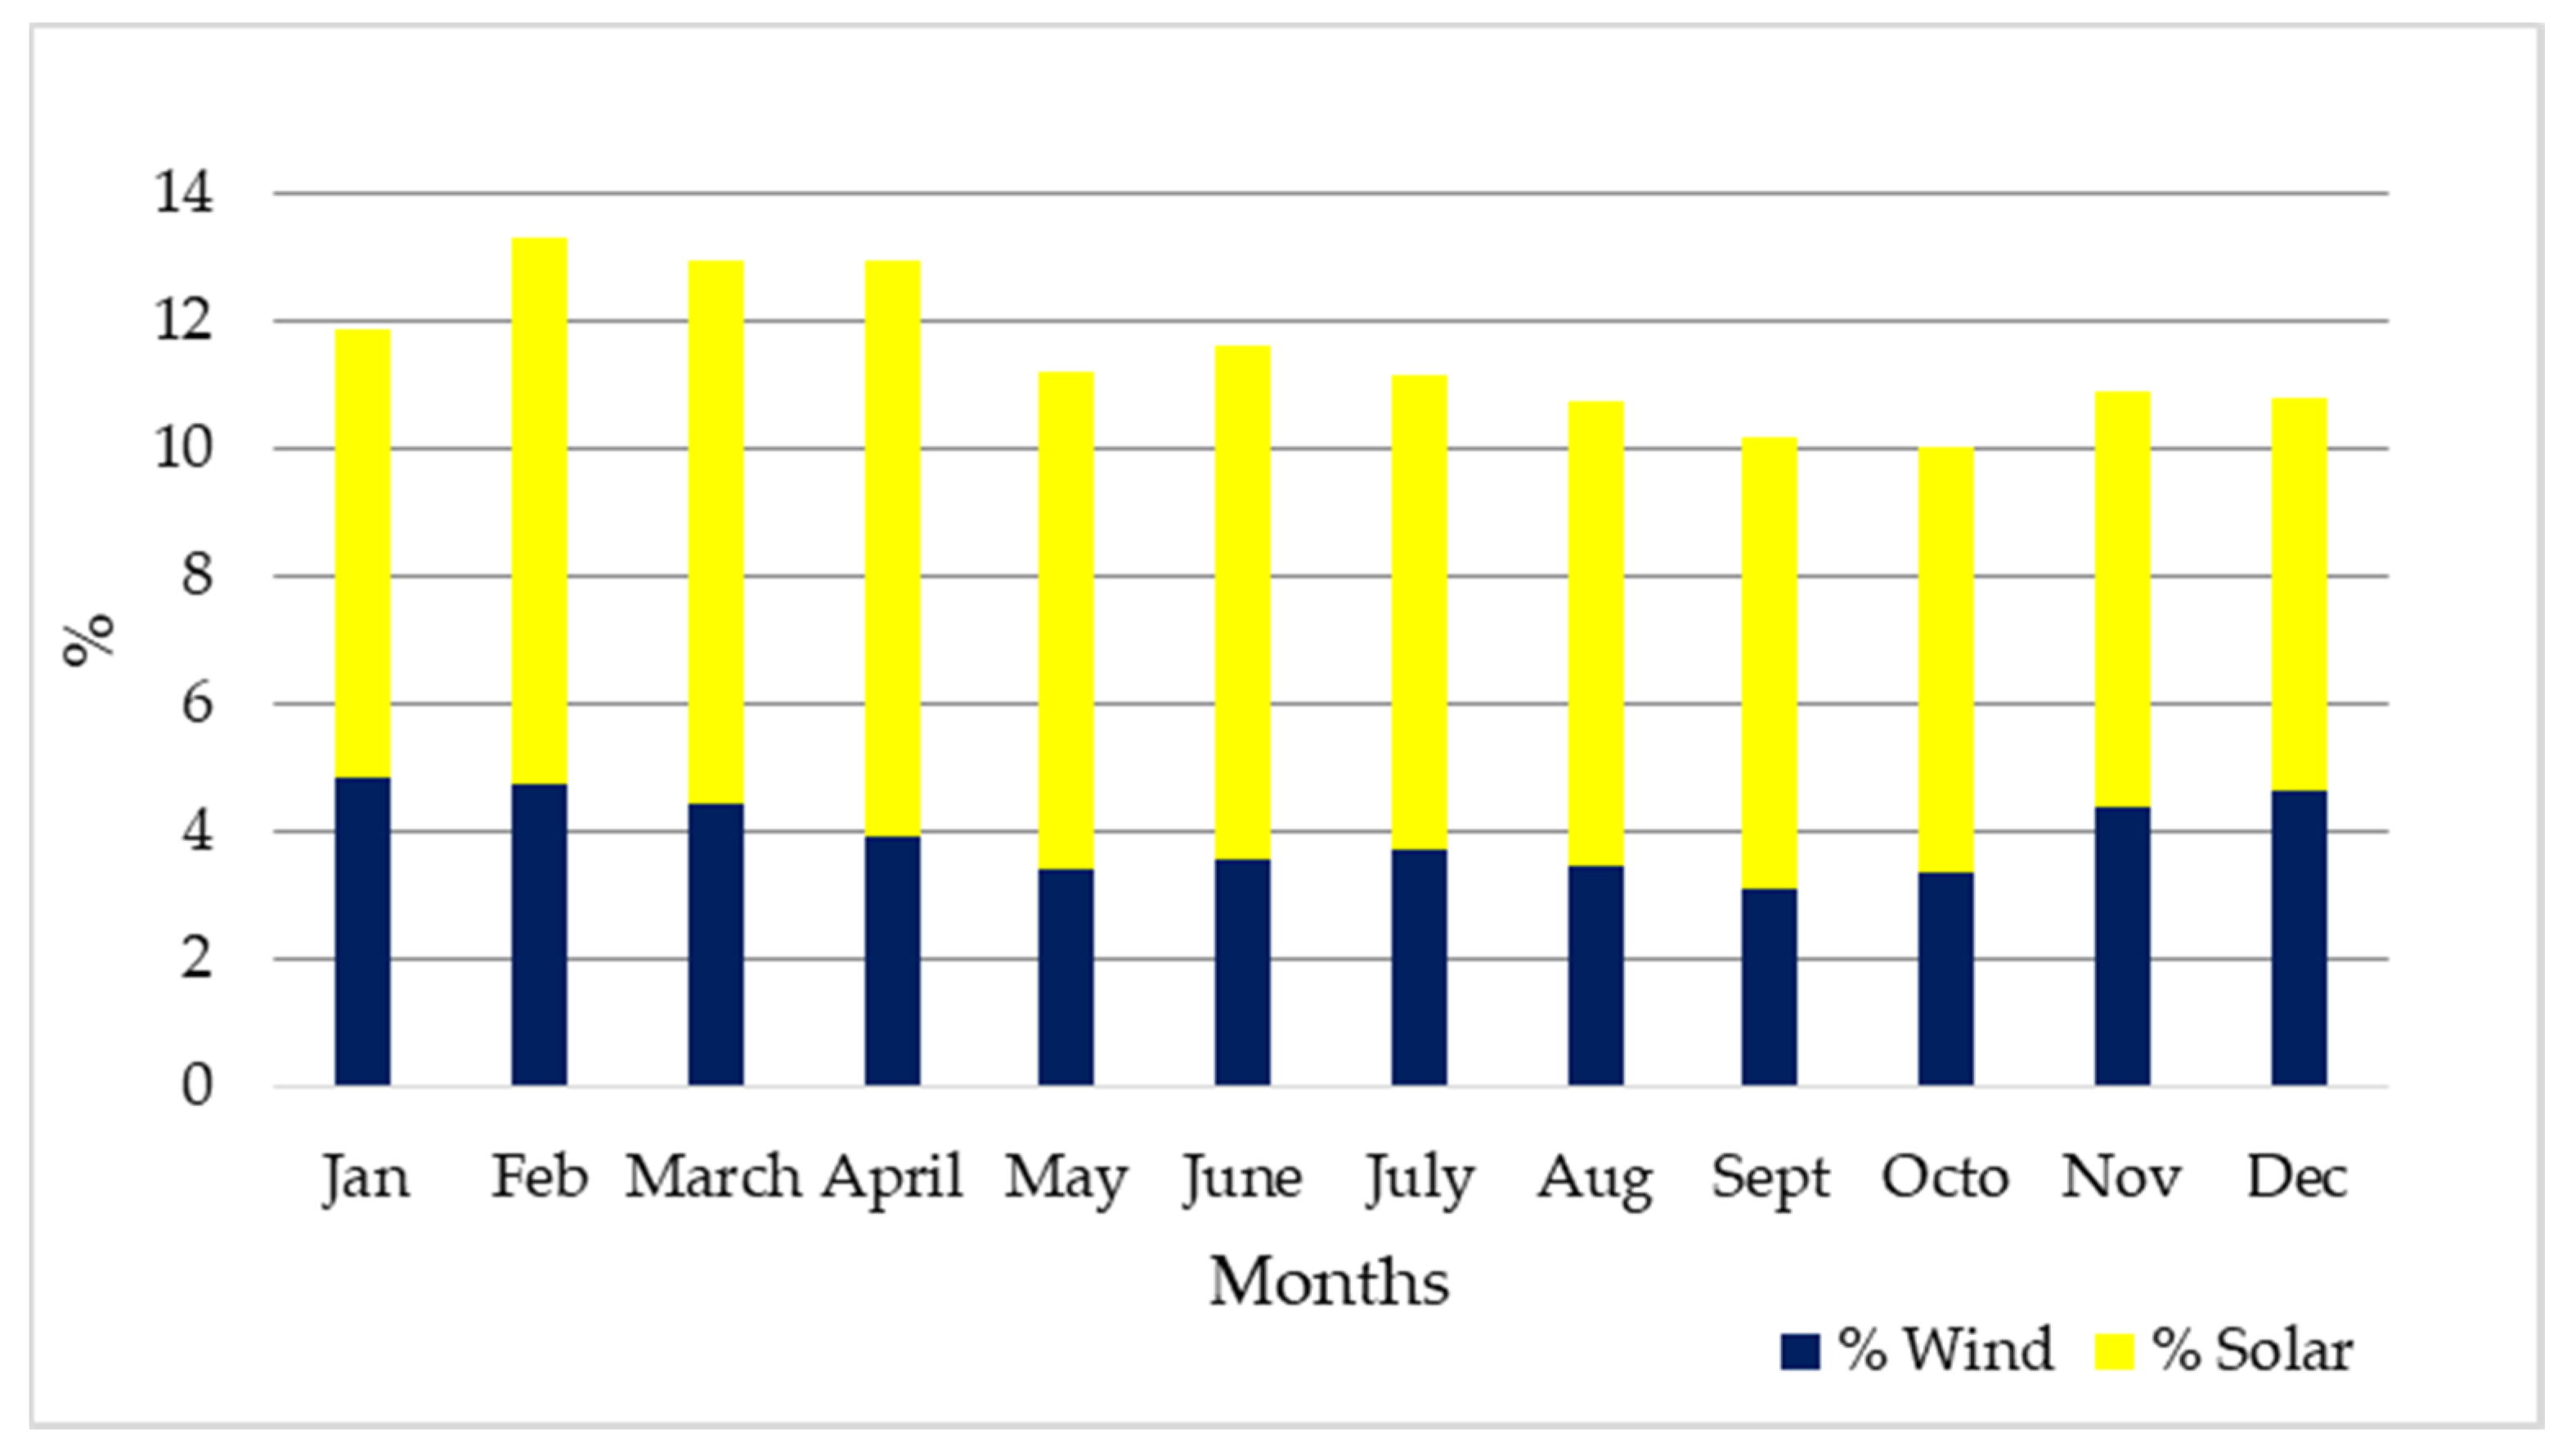
In Isla de la Juventud, by the end of 2019, there was around 10–13% of penetration of renewable energy into the electrical system.
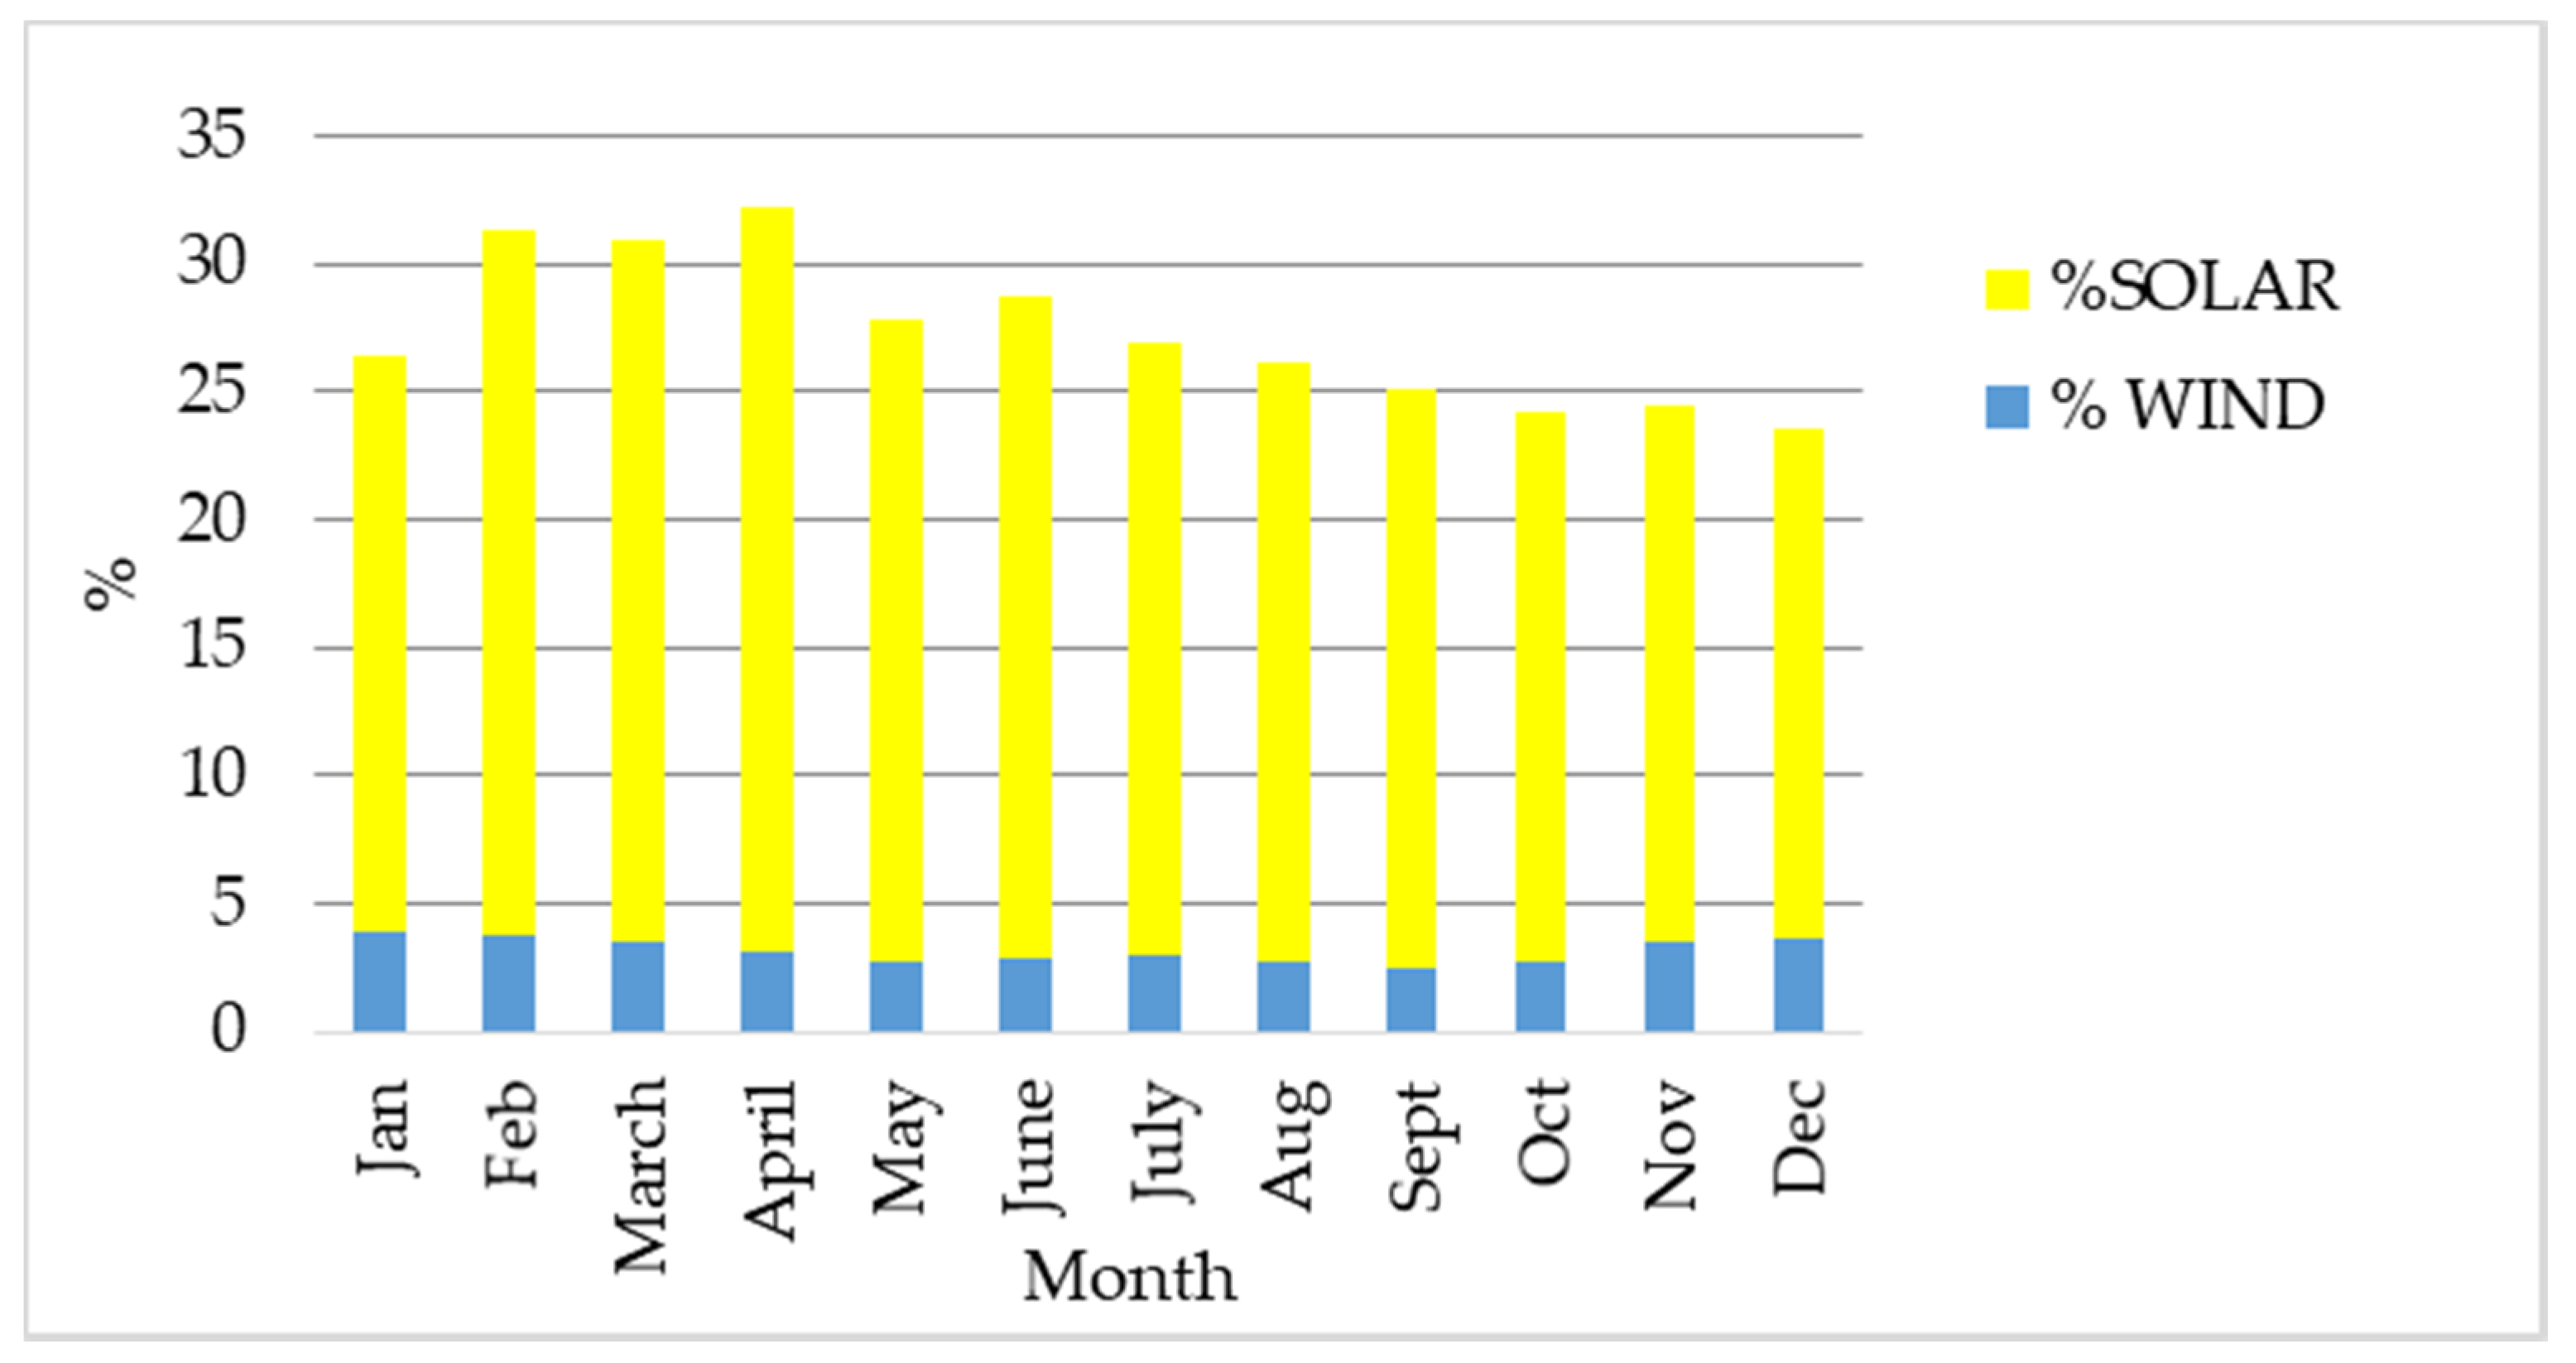
Figure 12 shows the contribution to electricity generation by different renewable energy sources, mainly wind and solar (biomass use for electricity production is minimal) and the total penetration in 2019. The results show a maximum penetration of just under 14% in total for all the RES. During the months from February to April RES provide a larger share of the energy of the total demand because of more solar production. February has the highest RES penetration rate, covering more than 13% of electricity demand. Solar energy has the highest penetration in the months from February to April with more than 8%, and at least 6% in all months of the year.
The share of wind energy does not exceed 5% of monthly consumption. During the months from August to October, wind power production has the lowest share and from December to February, the penetration is higher.
An important aspect for the analysis is to compare the penetration of renewable energy sources and hourly demand with the residual load curve. The behavior of the system has been analyzed against the influence of variable renewable sources. From the point of view of operation, it is necessary to observe the part of consumption to be covered by conventional generation each hour of the year.
Figure 13 illustrates the demand versus residual load on a typical summer day. A further analysis shows that the greatest influence of renewable sources occurs during 9:00–16:00, mainly due to solar energy production. The biggest difference between the load curve and the residual load curve is at midday due to the peak of solar production. The difference is smaller at night and at dawn, because solar energy production reaches zero and only wind energy contributes to the generation and is proportionally reflected on the residual load curve. The difference between the load curve and the residual load curve is around 6 MW at maximum.
3.2. Modeling Renewable Scenario Analysis (RENES) in 2030
This scenario is based on the historical growth rates of previous years and the assumed future growth rates. The installed capacity in solar energy increases to 19.2 MW (34% of total installed capacity), wind power capacity remains at 1.65 MW (3% of total installed capacity), as well as 0.5 MW (1% of total installed capacity) of biomass. The renewable share reaches 38% of the total installed capacity by the year 2030. The assumptions in increase of solar and wind reflect the government plans and user defined inputs. With the assumed GDP growth of 11.7% in the different sectors the final energy consumption of the residential sector is expected growth by 10.5%, and industry and commerce, by 8% and 7.5% respectively.
The growth behavior is shown in
Figure 14 with the residential sector clearly dominating. Similarly, in
Figure 15 we can see the dominance of residential sector in the electricity consumption.
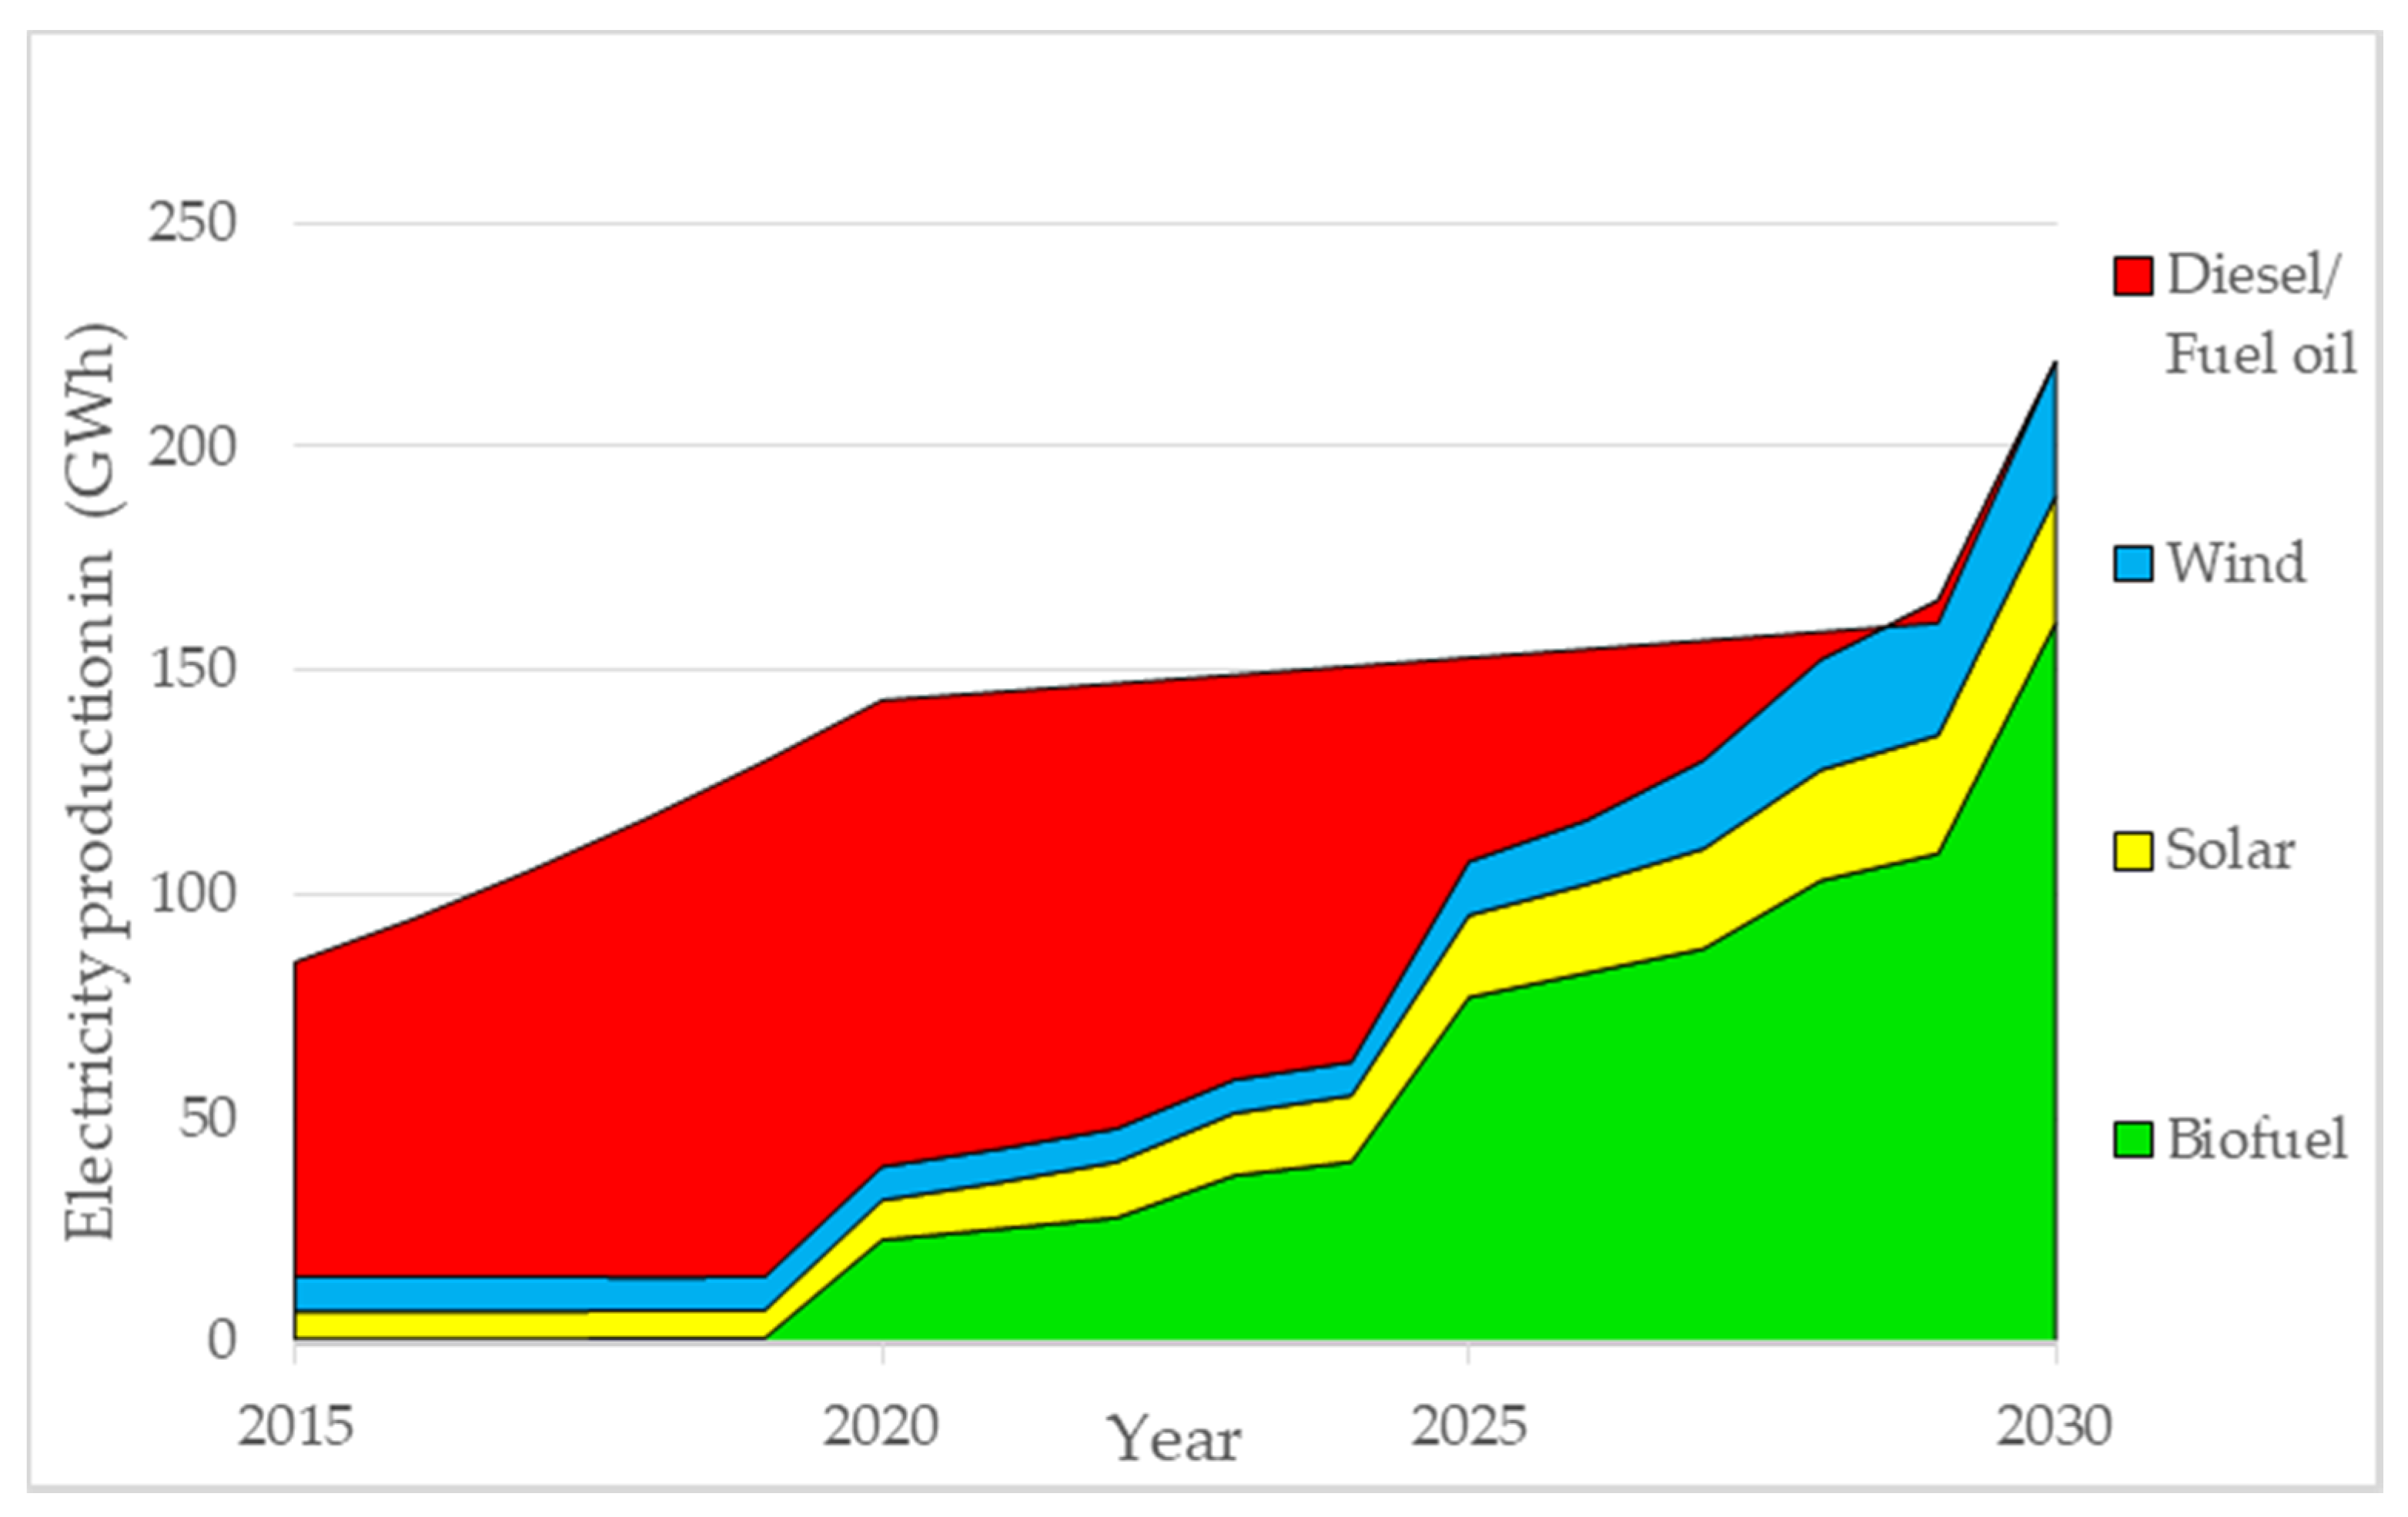
Figure 16 shows that despite the increase in the installed capacities of RES into the system under study, fossil fuel consumption dominates the electricity production for the period from 2015 to 2030. These results show that the electric power system remains highly dependent on fossil fuels in the scenario with RES production at covering around 25% of the total electricity generated in a year as can be seen in
Figure 17. The greatest contribution from renewable energy sources can be observed from February to April, as solar power capacity increases, its contribution grows considerably, with monthly penetration values of over 30%, and an annual average penetration of 28.5%. These values are in line with the Cuban energy sector targets 24% by 2030.
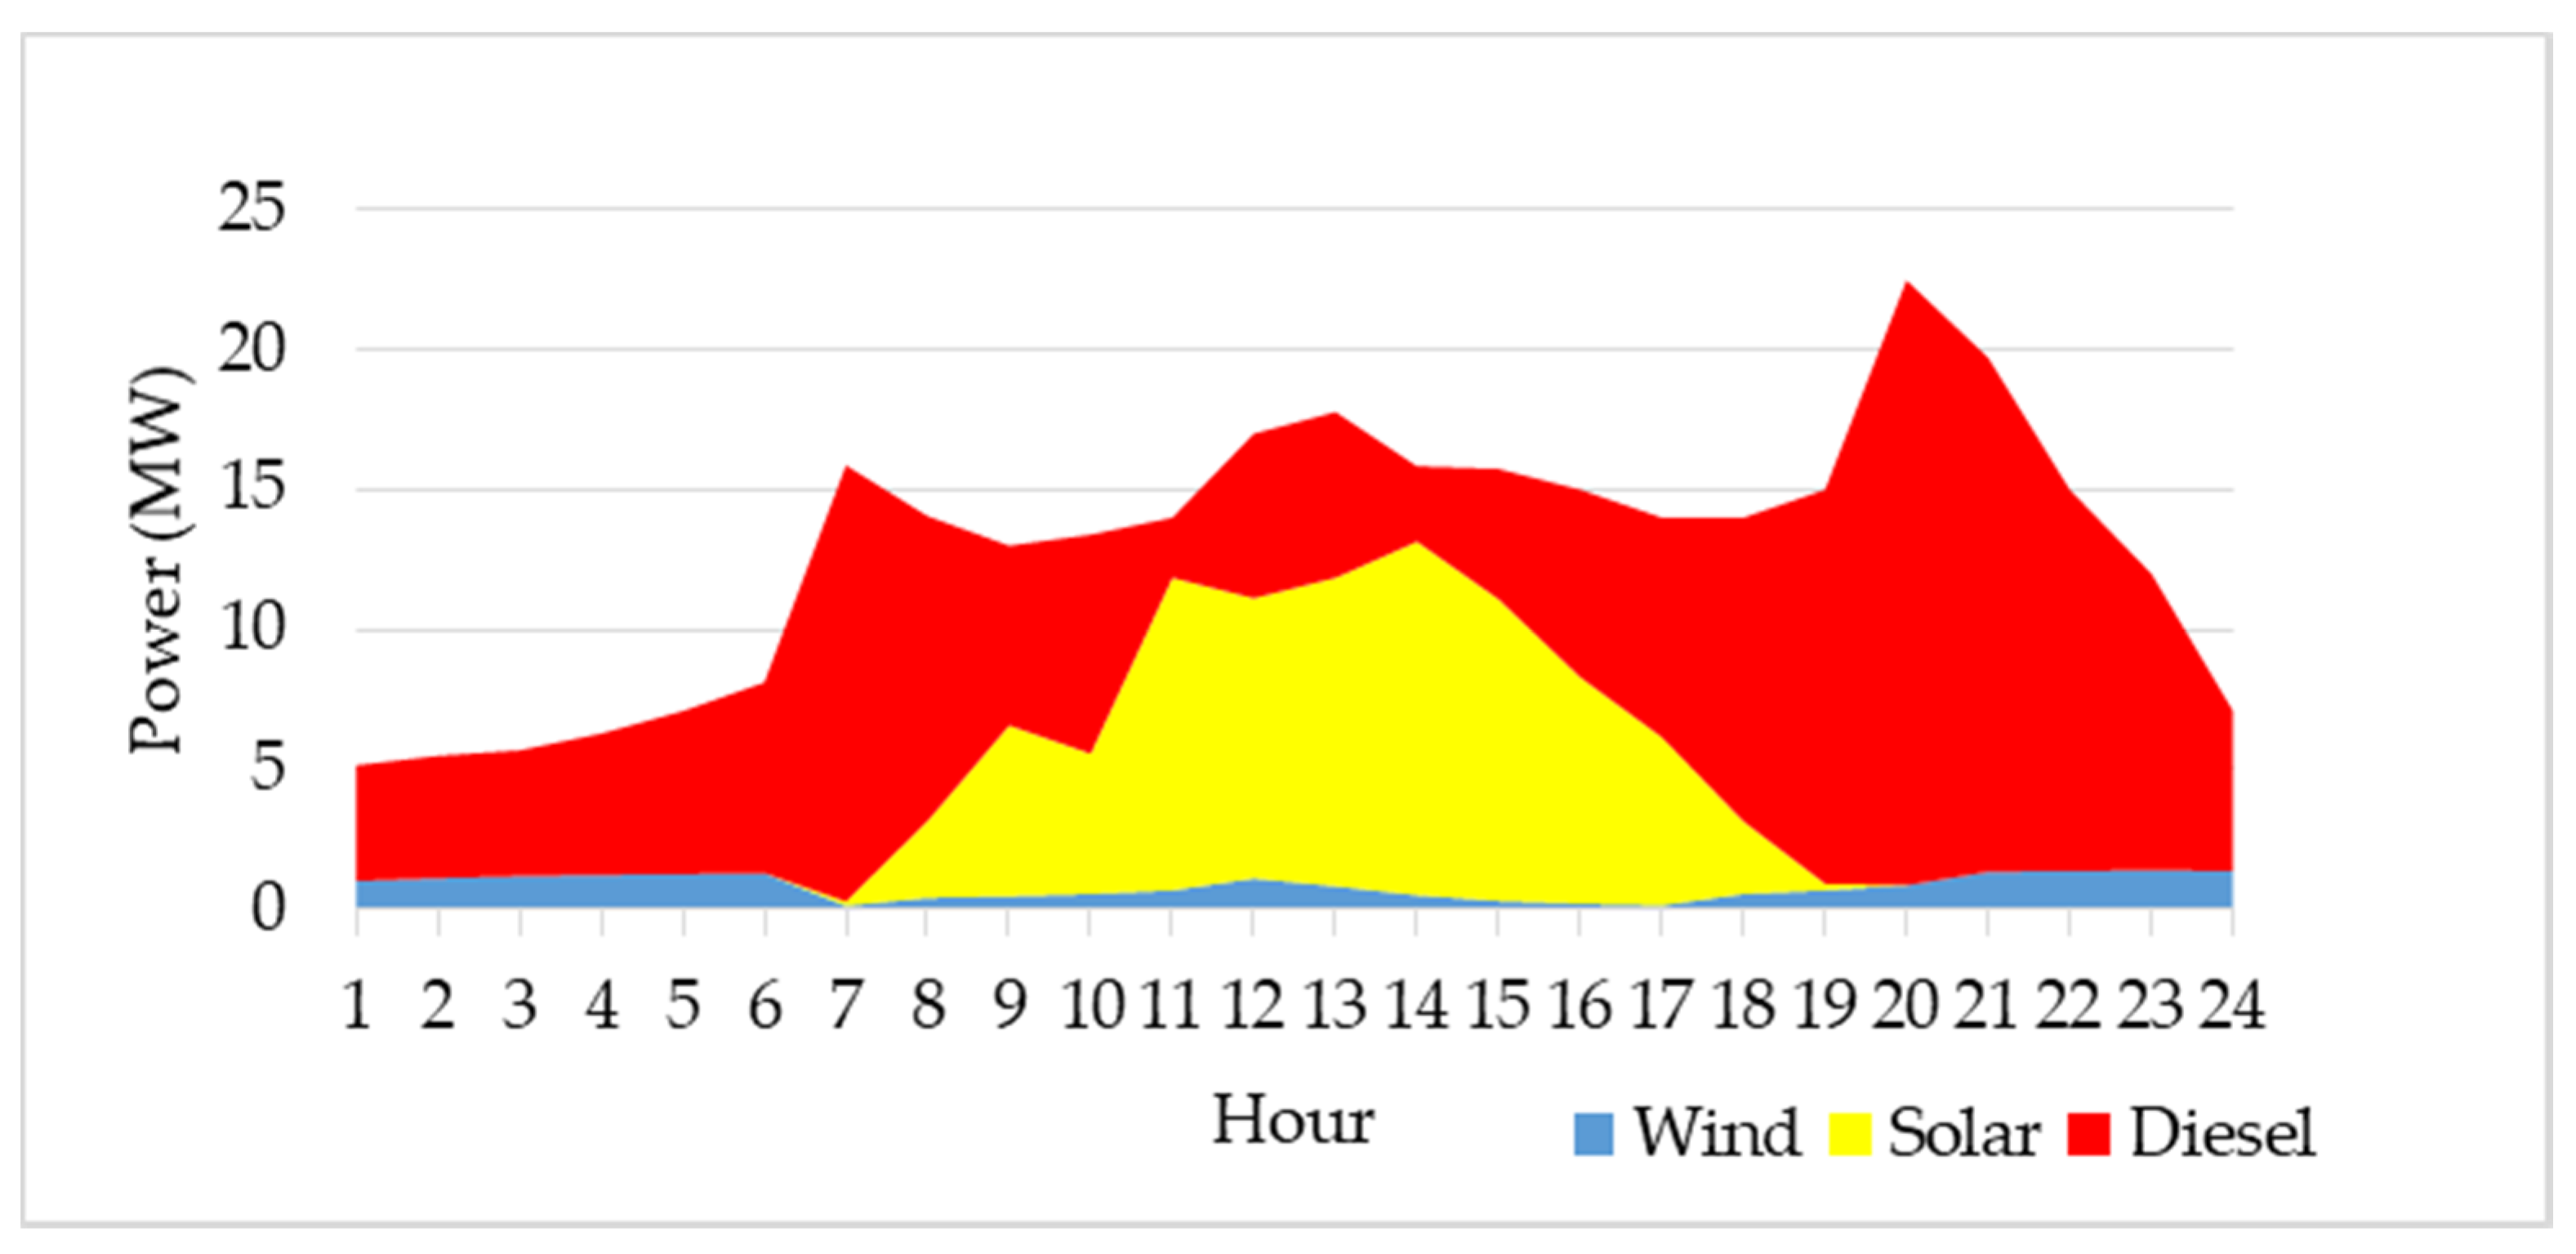
Figure 18 shows coverage of demand by different energy sources for one day in April and
Figure 19 one week in April 2030. The contribution from solar is highest during the day hours while in the early mornings and night time the most contribution is from diesel. Solar energy reaches a maximum of about 12 MW during the midday hours and wind energy with a maximum occurring mainly at night and early in the morning.
As shown in
Figure 17 the winter months have the highest contribution of RES to the system; during the winter months there is an excess of solar production which could be stored in battery systems. On the contrary, in the summer months the consumption is higher and the contribution of the RES cannot cover the demand. In
Figure 19 we can observe the residual load during a winter and summer week in 2030, showing the residual load to be less in the winter and more in the summer. The residual load shows that the batteries would be an alternative to take advantage of the hours of maximum solar production by storing the energy to give the electrical power system a backup during the hours of maximum generation
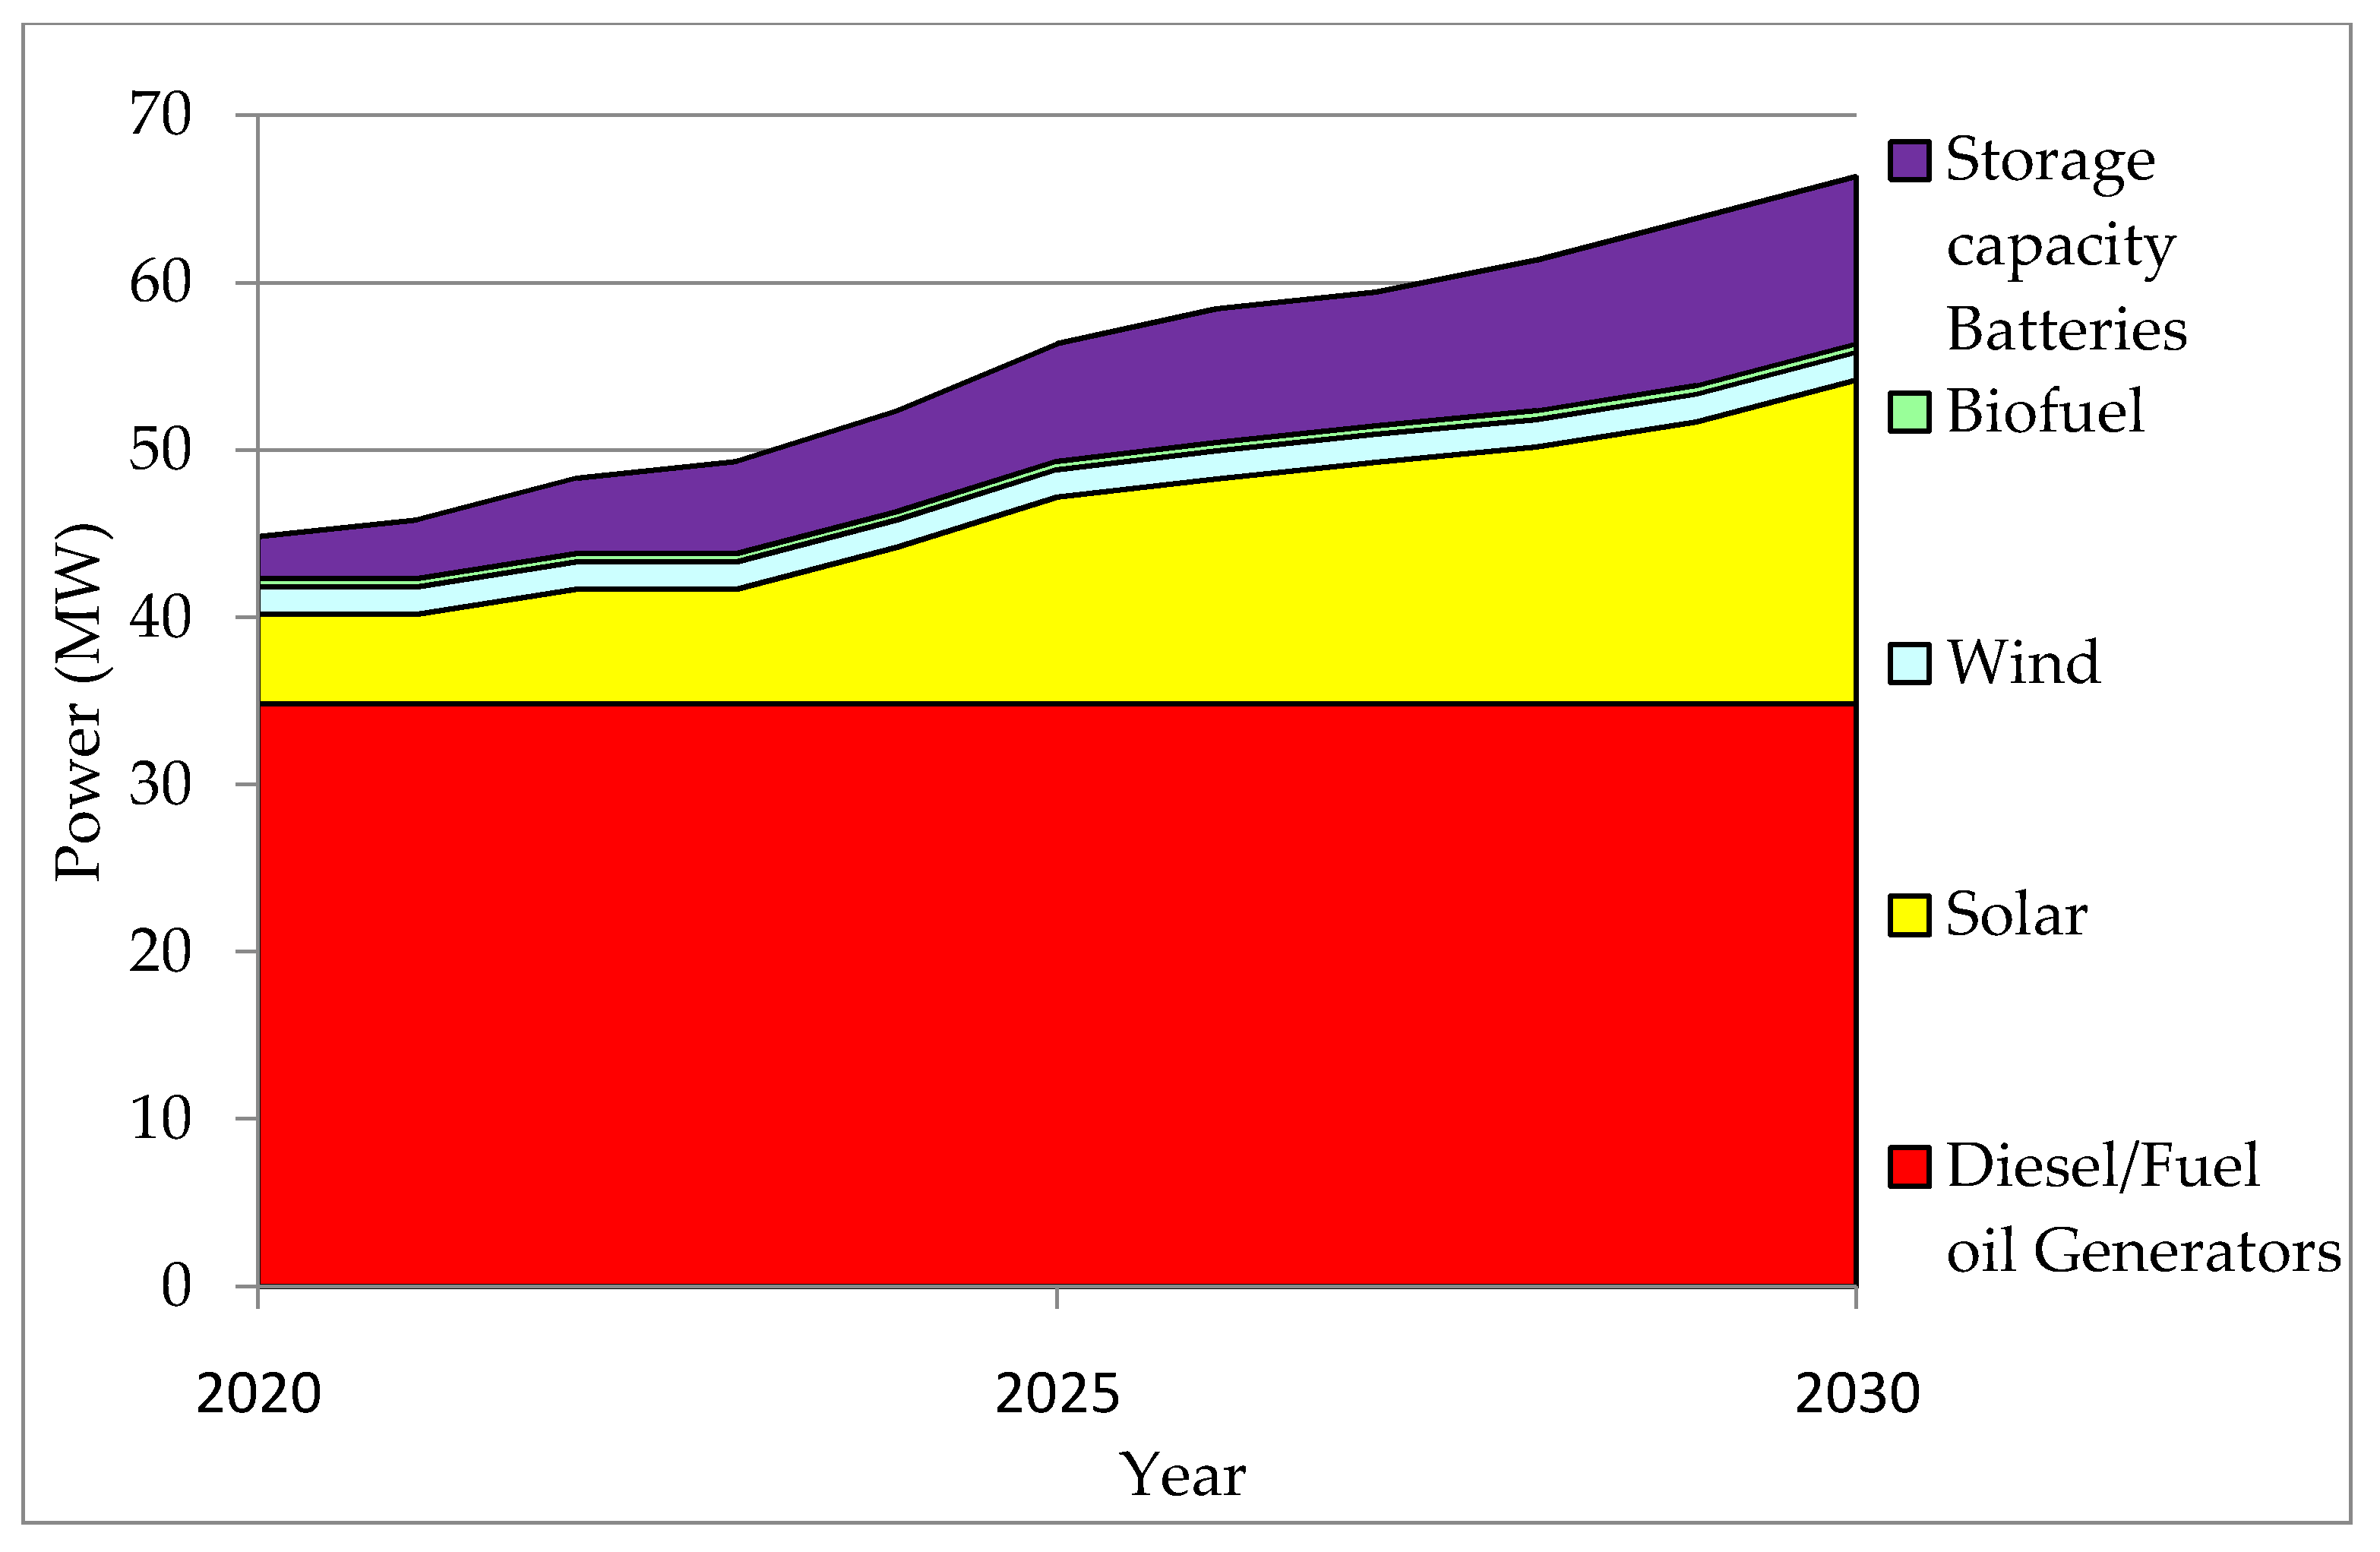
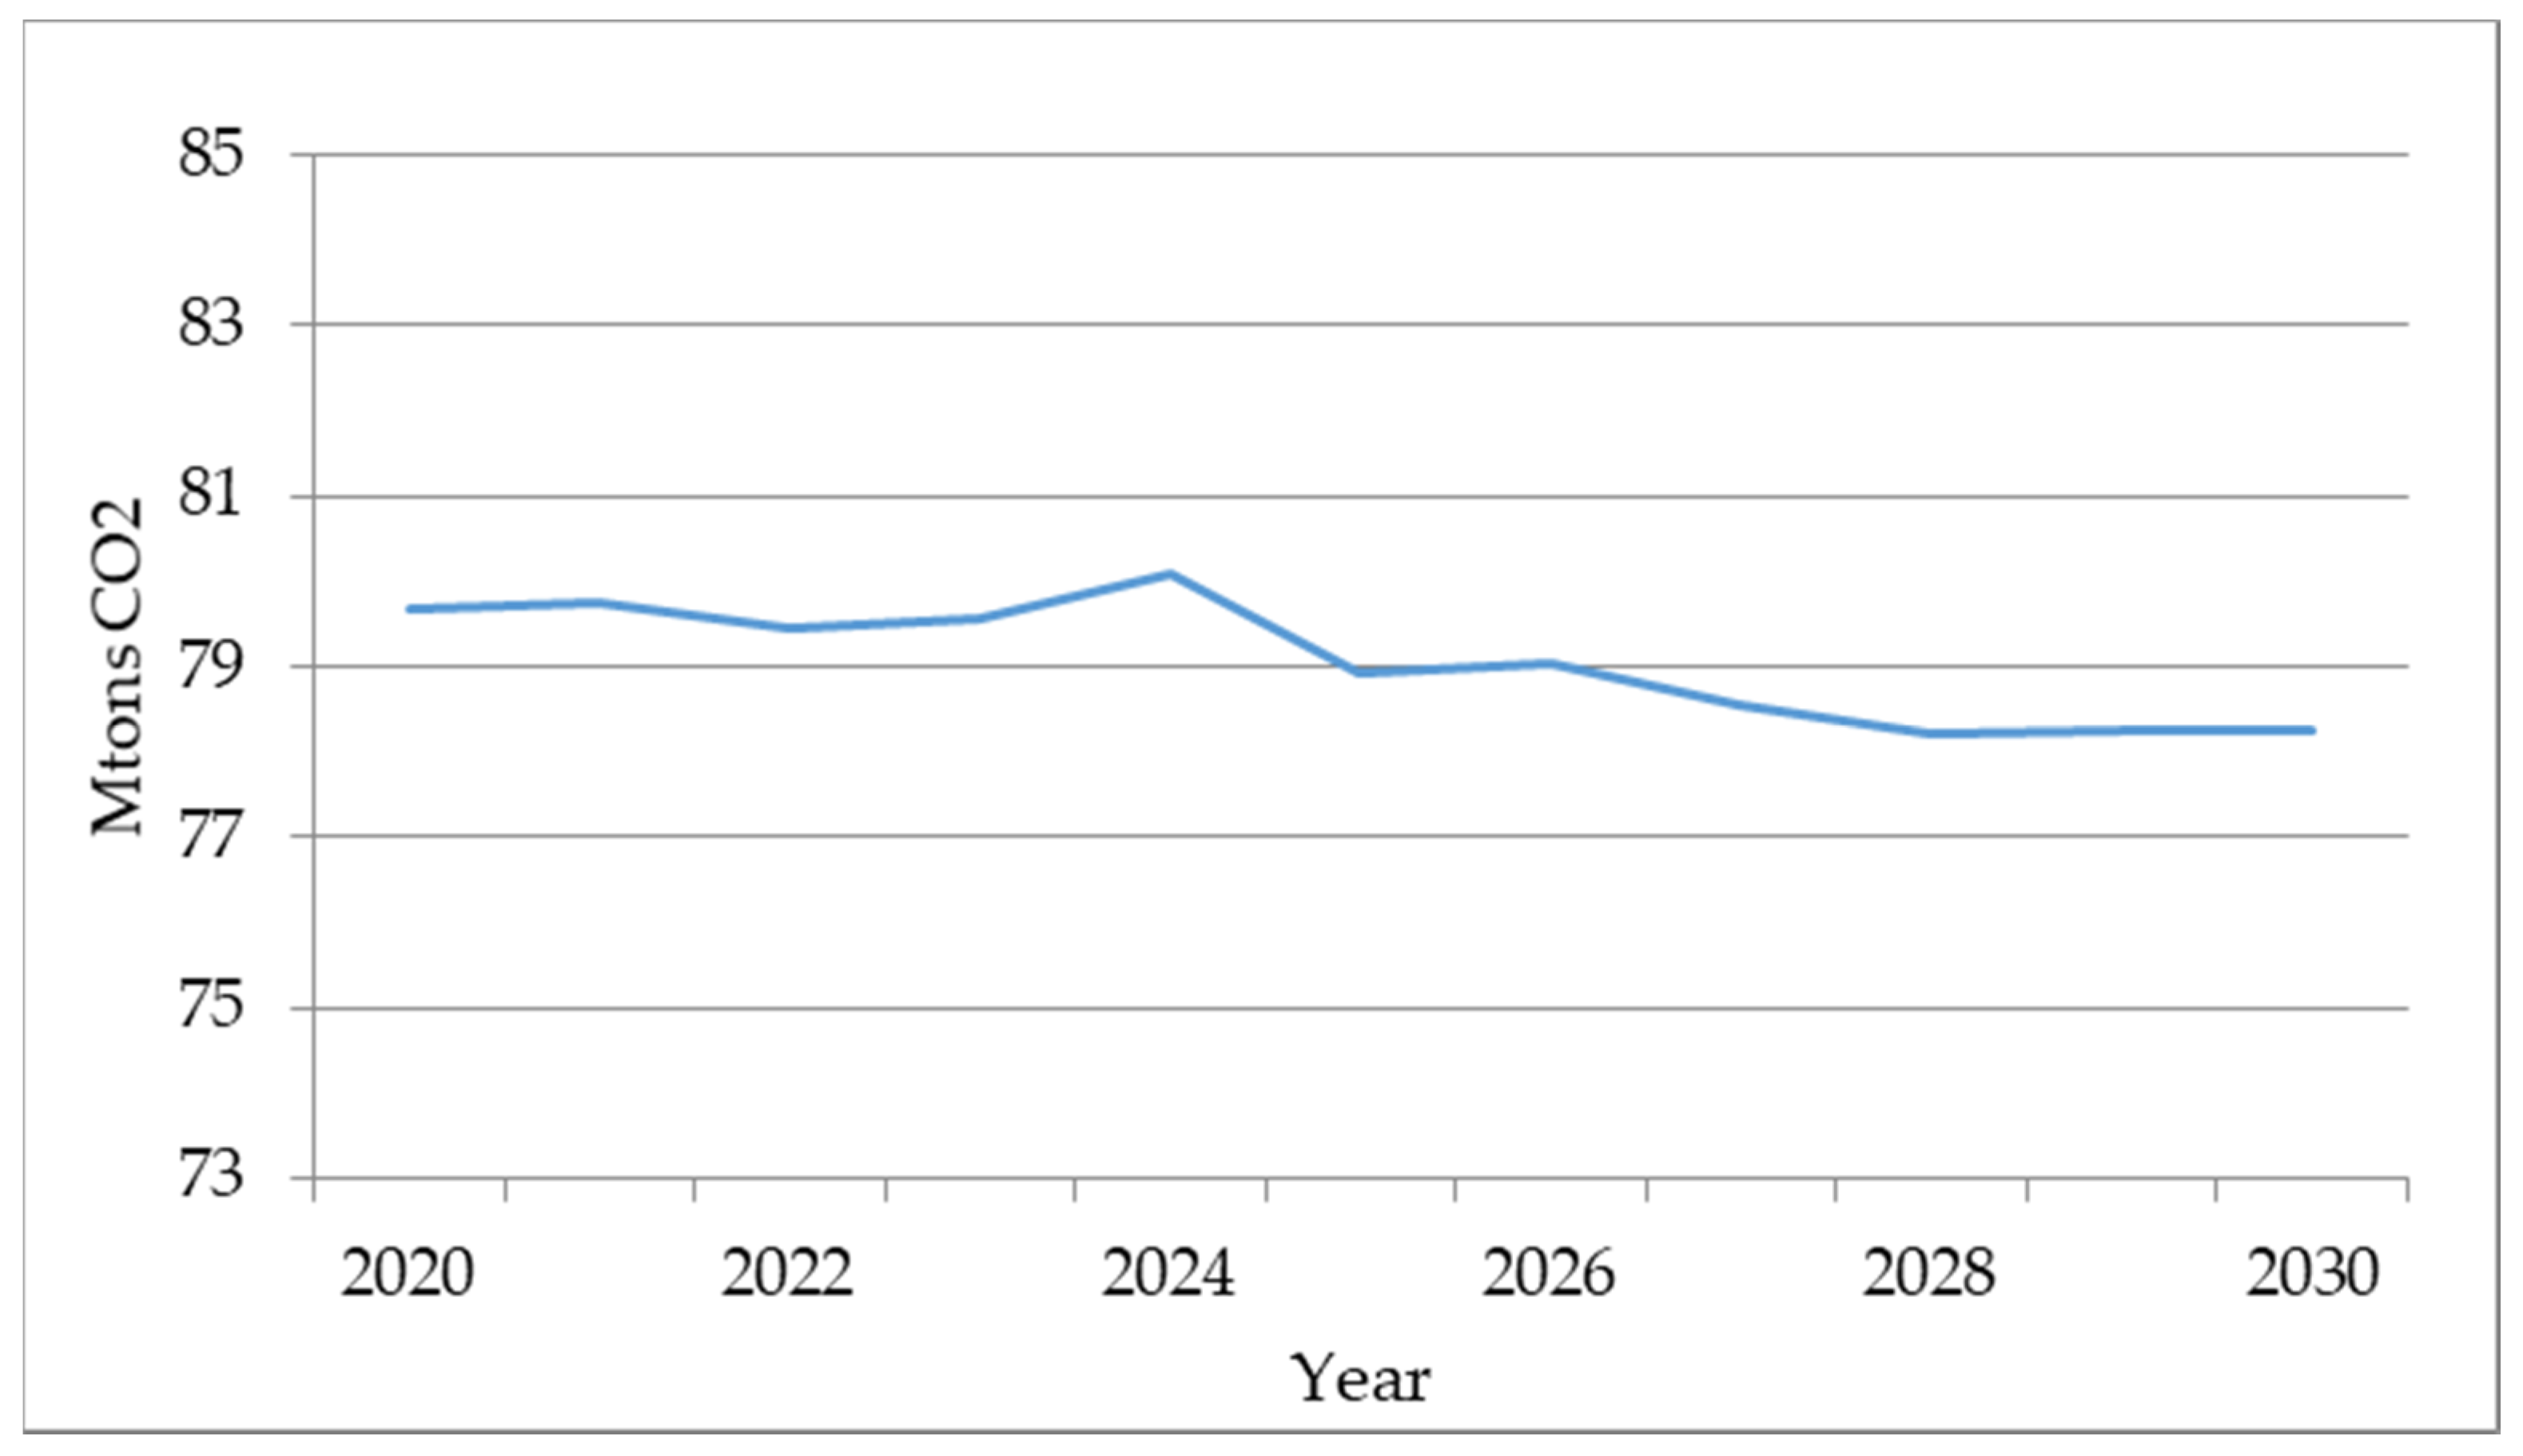
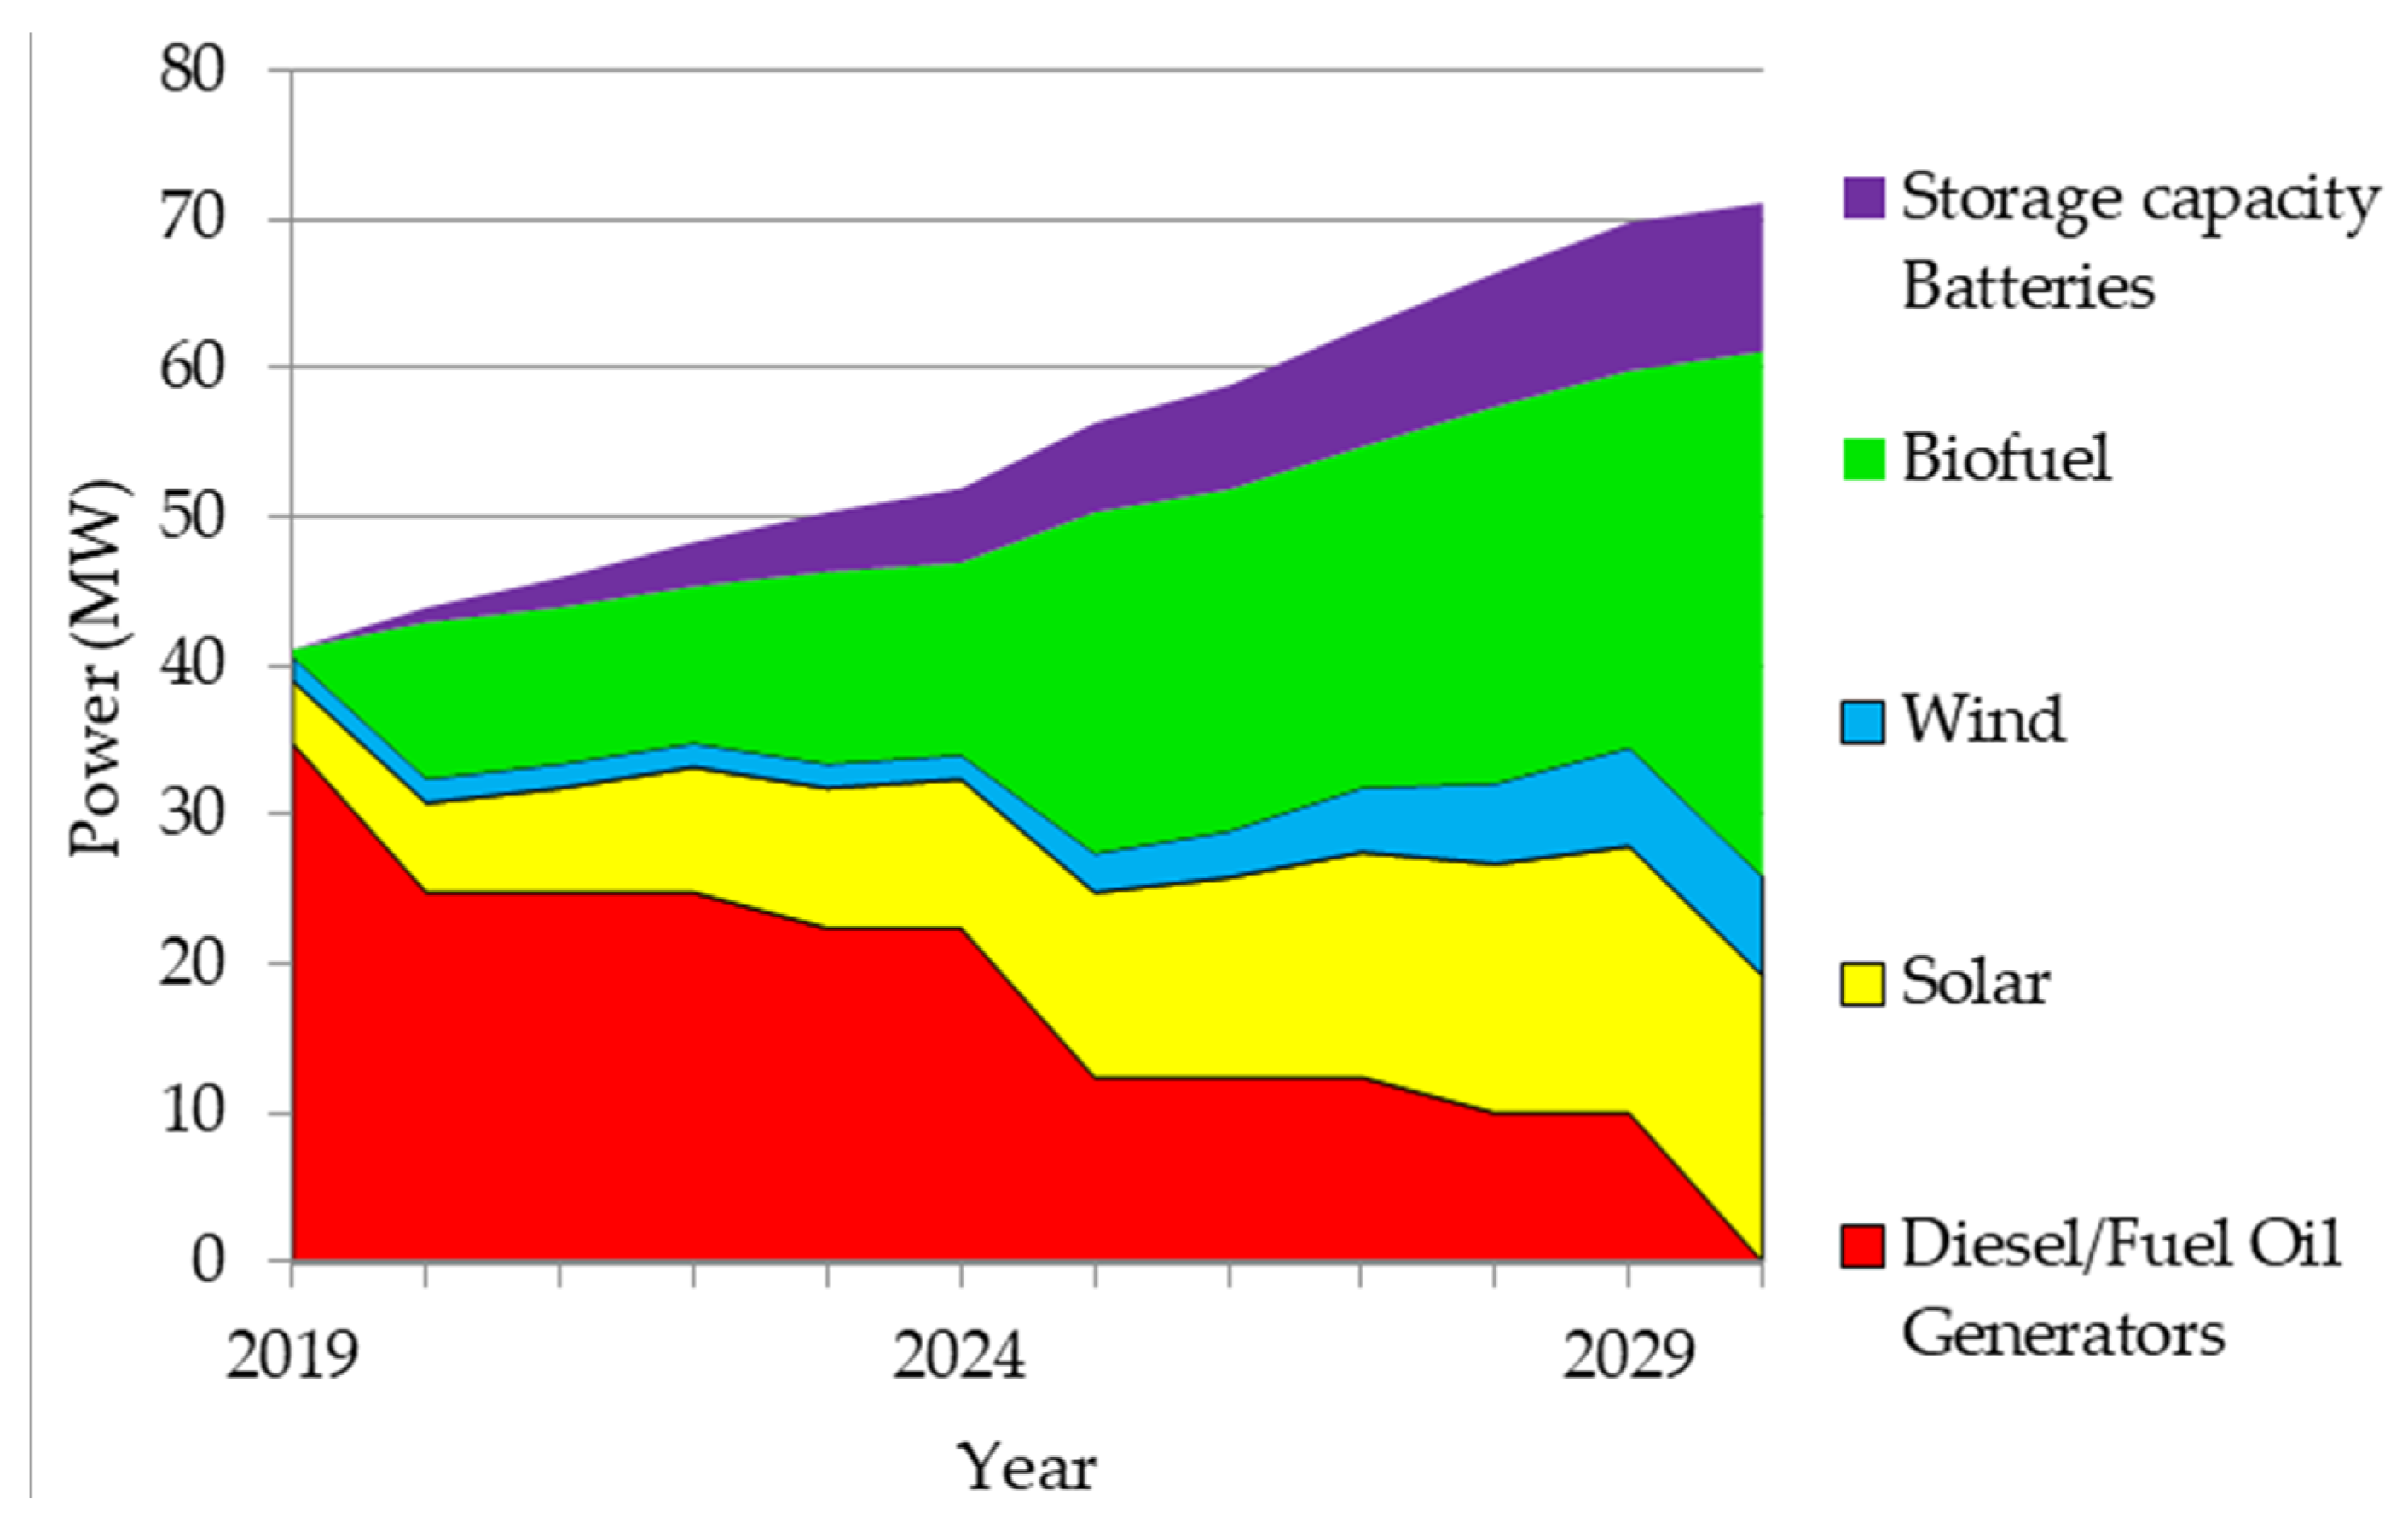
The introduction of batteries as shown in
Figure 20 would increase the installed capacity in the system under study by 10 MW and therefore the penetration of the RES in this simulation would reach over 40% giving the system more independence. As solar energy generation capacity increases, it is noticeable that the demand for fuels (oil and its derivatives) decreases by 5% in the period from 2020 to 2030.
Figure 21 shows the CO
2 emissions to the atmosphere from 2020 to 2030. Firstly, an increase in emissions is observed, due to the increase in demand and the use of diesel and fuel generators to cover this increase. However, after installing the 19 MW of solar energy according to the plan, a decrease in emissions is observed, reaching 78.2 Mtons in 2030.
3.3. Modeling Scenario for Maximizing the Use of Renewable Energy Sources (MAXRES) by 2030
In this scenario we maintain the growth rates of RENES and increase the solar capacity to 19.2 MW, wind capacity up to 6.2 MW and 10 MW in energy storage. In addition, fuel switch from fuel oil and diesel to biofuels is realized with a total of 35.94 MW of biofuel generators. This significantly increases the penetration of renewable energy sources gradually up to 100% in electricity generation on Isla de la Juventud with the fuel switch from a non-renewable to renewable fuels (
Figure 22 and
Figure 23).
In this scenario, the newly installed wind energy capacity results in an increase of 50 GWh annually more than in the RENES scenario. This extra energy, added to that of solar energy, is stored in the batteries to be used as a backup in case of emergency or during peak demand hours, thus avoiding generation losses in the system.
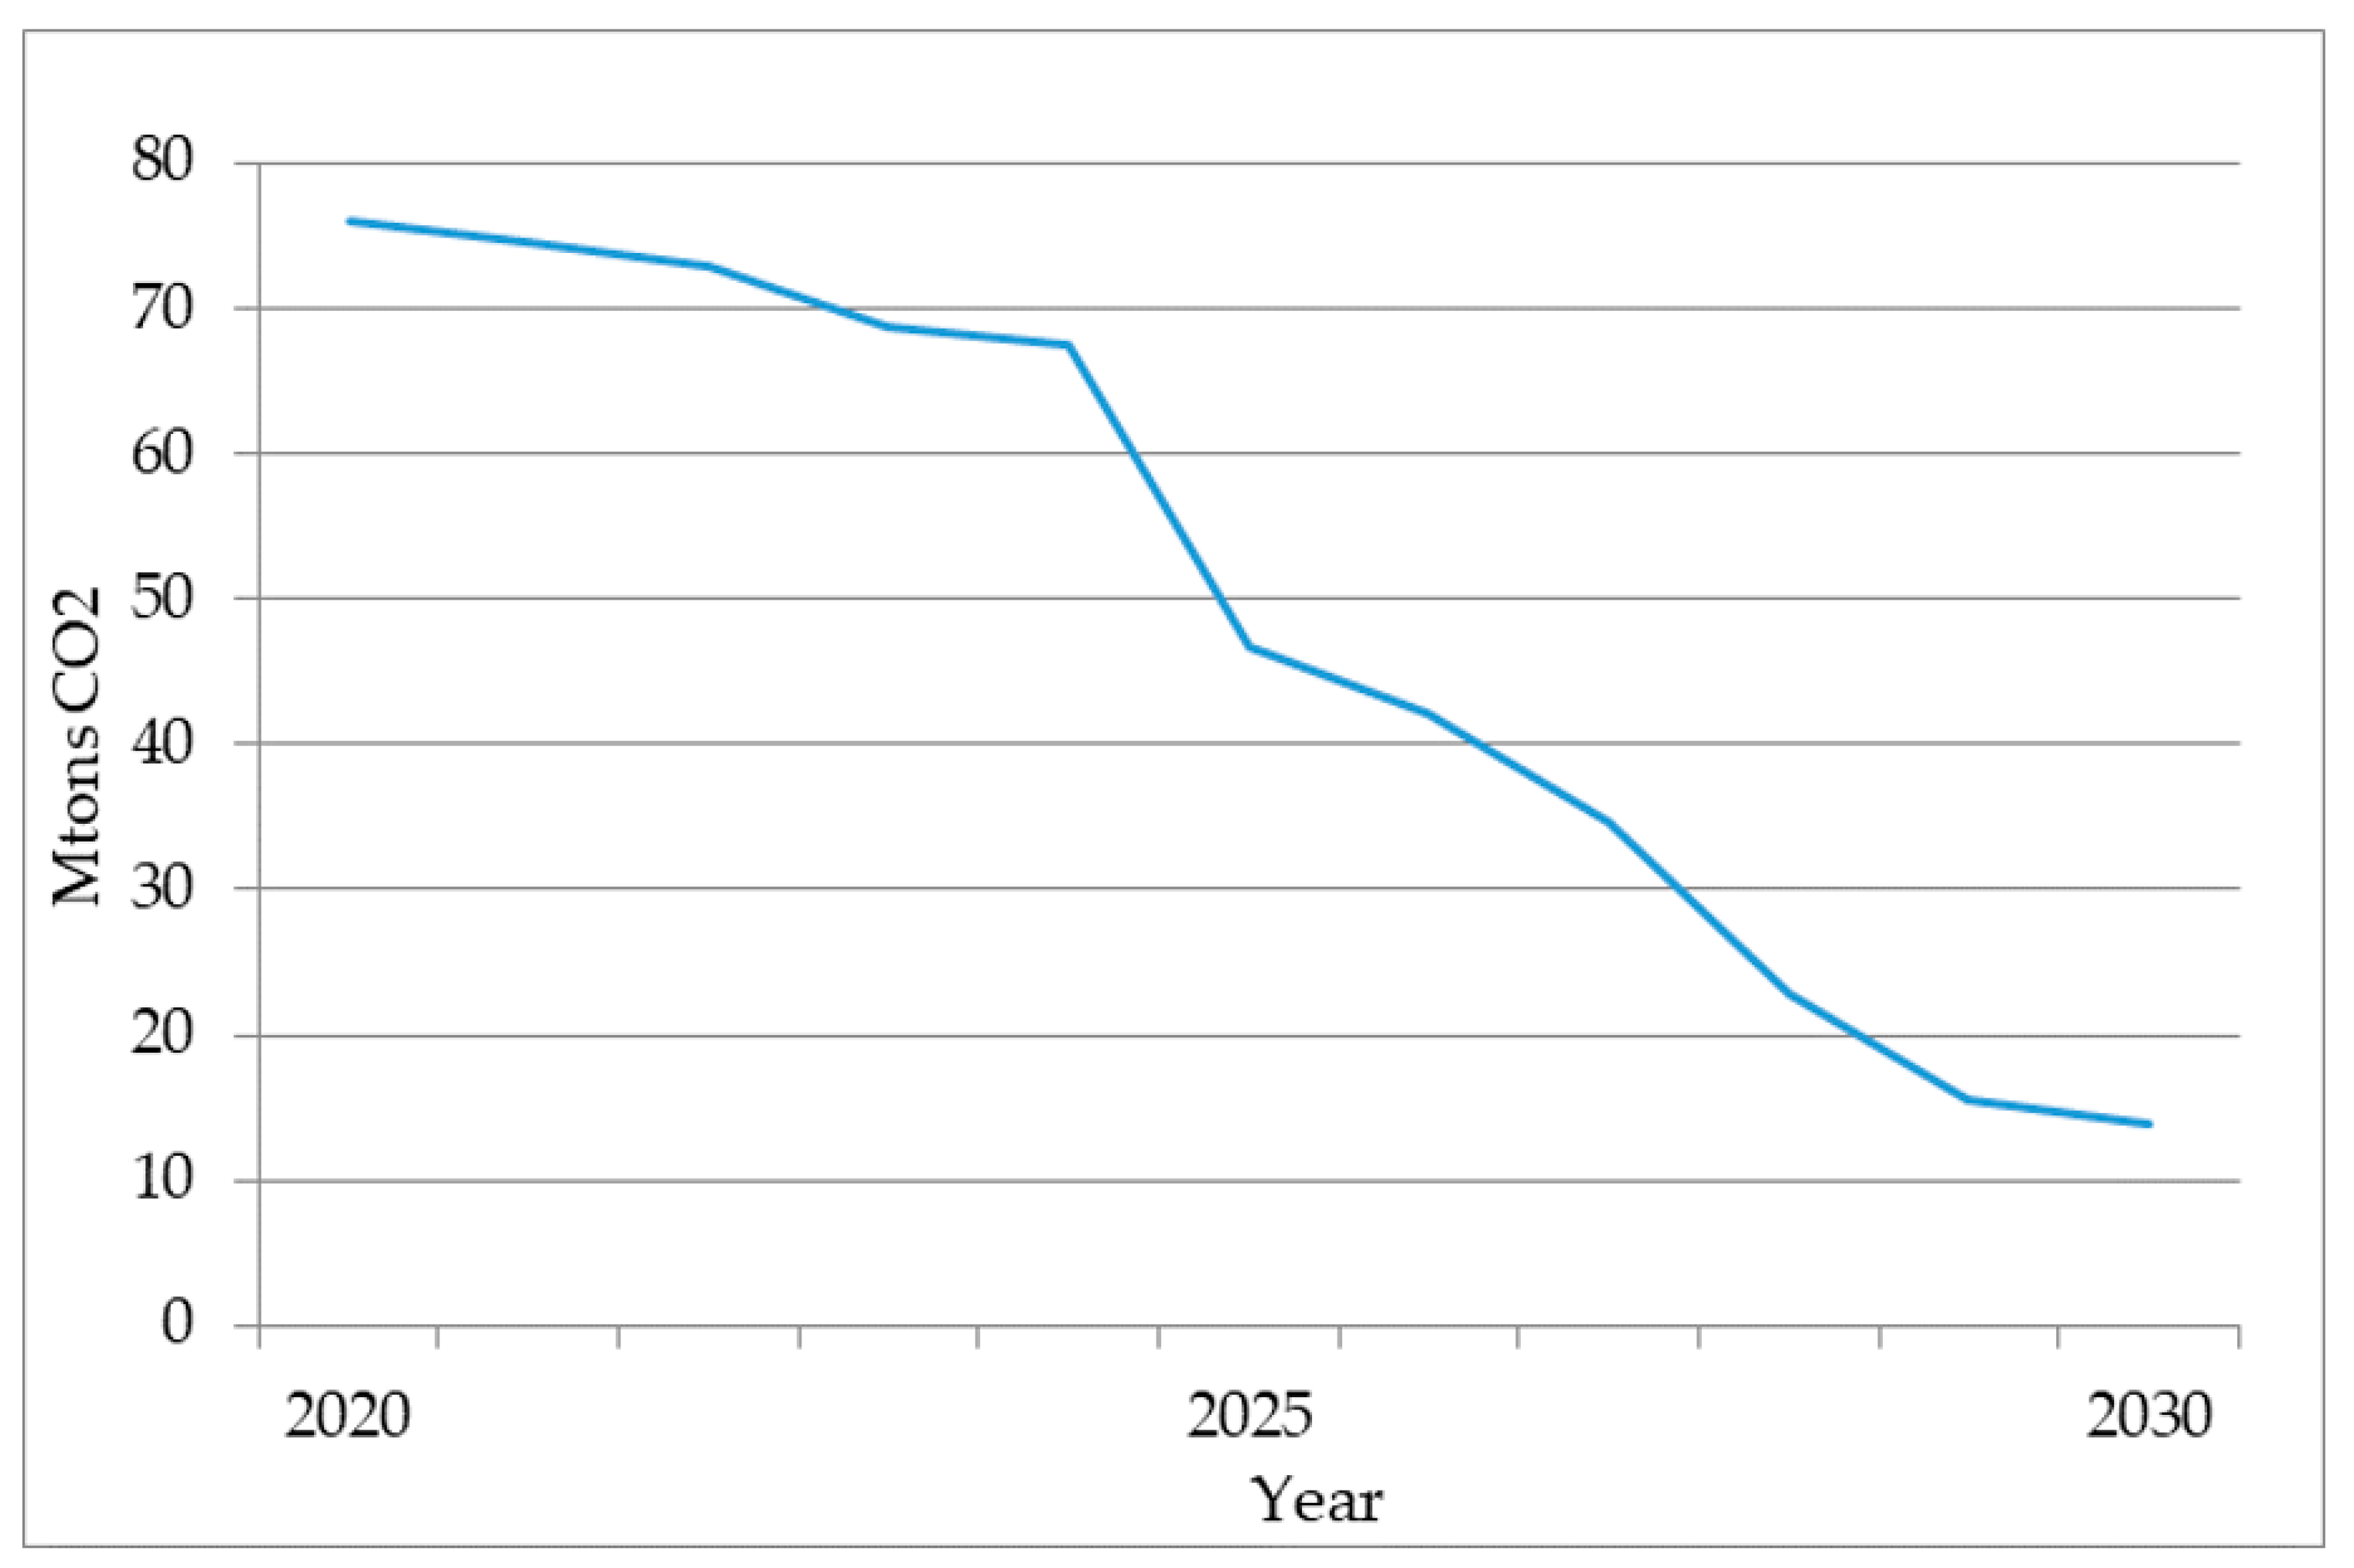
With the transformation of the energy matrix to 100% RES based for 2030, the amounts of CO
2 emitted to the atmosphere in this period gradually achieve a 100% reduction of emissions as shown in
Figure 24.
3.4. Comparison of the Scenarios
The results show that both the RENES and MAXRES scenario comply with the country’s energy policy targets for 2030, reaching a minimum of 30% of renewable sources in the total installed capacity. The residual load shows that in RENES scenario, photovoltaic solar energy makes the greatest contribution during the midday hours with the possibility to be used as a backup with the battery storage. Moreover, in the case of MAXRES scenario wind complements the demand requirements with biofuels and provides additional potential for storage especially during the night time. In terms of CO2 emission from electricity generation, we see the gradual decrease from RENES and a reduction to 13.9 in the MAXRES scenario compared to base year.
The comparison of results in different scenarios is shown in
Table 1 based on:
- (1)
Growth in GDP by the year 2030;
- (2)
The installed capacities of renewable energy sources are shown for the different scenarios, with base year 6.35 MW, the RENES 21.35 MW and a 10 MW Battery storage and MAXRES 61.79 MW and a battery storage of 10 MW;
- (3)
Percentage of RES of total installed capacity with base year accounting to 16%, the RENES to 43% and MAXRES to 100% of utilization of RES accordingly;
- (4)
Influence of the residual load
- (5)
CO2 emissions; 82 Mtons in base year 78.2 Mtons in RENES scenario and 13.9 Mtons of CO2, in MAXRES scenario respectively
- (6)
Electricity production: With the energy mix changes from one scenario to another and increases in installed capacity electricity production results in RENES scenarios at 155 GWh and MAXRES scenario at 210 GWh;
- (7)
Electricity consumption: in the base year at 95 GWh, RENES scenario at 140 GWh and MAXRES scenario at 160 GWh
4. Discussion
The objective of this study was to question the dependence on fossil fuels in the future electricity system in Cuba. Isla de la Juventud provides an excellent case study for power system modeling due to its size and because it is an island system with similar characteristics to the Cuban main island power system.
The Cuban government has applied a very stimulating strategy to deployment his policy to development RES within the country: (1) to open the foreign investment to achieve RES technologies and financial capital, even with 100% of the foreign investment, (2) to increase the interaction with international organizations in order to develop “absorptive capacity” on RES and technologies (3) to give autonomy for the local government to decide their development strategy for increasing penetration with RES, (4) to develop a program to prepare the local governments to be involved with RES, (5) to involve universities with the local governments in order to enhance opportunities for different stakeholders to support the use of RES in local conditions, (6) to incentive private sector using RES. Consequently, the government needs to identify and raise awareness of key policy questions and their implications for the long term development of the Cuban electric power systems means “to quantitatively calculate the direction of future energy policy and the implications of taking one pathway of energy sector development instead of others” [
30].
It has been recognized in literature that desirable generation expansion scenarios or renewable energy targets depend mostly on policy priorities and on economic resources, rather than on technical grounds [
15,
16,
18,
31,
32]. At the same time, the particular characteristics of a given isolated power system influences its capability to safely integrate increasing shares of RES. Although this analysis is mainly based on planning alternatives, some technical and operational aspects of the system were considered for the selection of the scenarios. These include aspects such as generation capacity and technology, maximums and minimums of power by conventional generators, ramp rate, load share, generation dispatch, grid congestion and stability issues.
The system is made up of fuel generators with installed capacities up to 3.9 MW each, with similar maximum and minimum active power, power factor, ramp rates and fuel consumption in g/kWh. For this reason, the share of load served by each generator is quite similar, and any of these generators, which act as the base load generation, are used in the normal operation of the power system. It is important to highlight that even when flexibility analysis for stability control and other parameters need further analysis, some stability and operational conditions were considered. A stability study carried out in the power system of Isla de la Juventud (by the authors) consider certain operating conditions that should not be violated under any circumstances, although these results are sensitive and are not described in this article, they served as authors criteria constraint to reject certain results that did not meet these conditions. Thus, only the technically valid scenarios for the local conditions were prioritized in the analysis.
As a particular characteristic of the electric power system of Isla de la Juventud, residential sector is the largest consumer in the system due to the low activity in the service, industry and agriculture sectors. Consequently, today the peak demand is about 20 MW around 22:00 during a summer day, exceeding the demand for a winter day by 2 MW. In Isla de la Juventud, by the end of 2019, there was 15% of penetration by renewable energy into the electrical system, with a significant participation of PV (66.14% of RES) [
27]. Until 2030, UNE has projected an increase with PV up to 15 MWp. Therefore, the difference between the load curve and the residual load curve is around 6 MW at maximum.
The analysis of the scenario RENES confirmed that the batteries would be an alternative to take advantage of the hours of maximum solar production by storing the energy to give the electrical power system a backup during the hours of maximum demand. Moreover, it is possible to increase the share of intermittent renewable power generation with the use of energy storages, such as electric batteries, as has been concluded in several studies of island isolated power system [
33,
34]. The results show the scope of RES introduction to the electric power system is technically possible and abundant solar, wind and availability to biomass can provide a transition up to 100% RES based systems, similarly to other islands in the Caribbean [
35]. The MAXRES scenario supports the government plan to increase the use of biomass for electricity production as Cuba has plans on promoting biofuel production nationally [
7].
The growing concern about global climate change also drives the transition to non-fossil-based electricity production and the study shows that with increased RES the potential for climate mitigation is realized. The advantages of biomass utilization in the energy sector also support Cuba’s sustainable development goals as stated by e.g., Bravo Hidalgo [
36,
37,
38]. Similarly, decreasing costs, especially for wind and solar power, now offer a competitive alternative to conventional energy sources. Reducing the consumption of conventional sources towards zero decreases import dependence and supports sustainable energy transition necessary in Cuba to promote economic development [
23].
The approach of the LINDA model enables the economic analysis of different scenarios in the view of future demand of the Isla de la Juventud power system and achieving different coverage with renewable sources. The LINDA model inputs include characteristics of the generation mix (also maximum and minimum required capacity of the fuel and diesel generators); sectoral economic development and sectoral energy intensity development; future growth rate for economy; future energy demand; installed and future power plant capacity and their respective load factors. The used Linda model version calculates the electricity consumption and production on an hourly basis and requires modifications if 15-min interval data is needed. The constructed model for Isla de la Juventud has only four economic sectors due to the data availability and can deal with structural changes within the industrial sector only by modifying the whole sector intensity and growth figures. In this case the data availability is the problem because more detailed subsector data was not available. The model itself can include as many sub-sectors as needed.
For the scenarios constructed, however, subsequent flexibility studies are necessary e.g., to study if the transmission lines of the power system have the necessary capacity to transmit the energy from renewable sources and to avoid possible blackouts or curtailments. In addition, a stability analysis linked to system operation analysis is important to guarantee voltage and frequency stability, either in normal operating conditions or in the occurrence of a fault. The priority order of the power plants for producing the residual load is not using optimisation algorithms in LINDA model because information of the ramping rates and ramping costs of the different power plants was not available. The LINDA model does not include the transmission and distribution network and hence the distribution costs and potential bottlenecks are neither considered in the modelling.
The temporal and spatial resolution of the applied LINDA model ensures an adequate quality and validity of the results compared with other models. The temporal resolution of LINDA limits its scope to the evaluation of hourly demand and generation balancing by the sectors of the economy. The evaluation of the results indicates the study findings are quite accurate to real situation currently, although the data is incomplete and at times estimations of the parameters were used due to lack of accurate data. The sensitivity analysis or optimisation could not be carried out comprehensively due to availability or confidentiality of the data. Unlike other similar studies with LINDA, e.g., [
22,
23,
24] the optimisation (especially least cost options) studies was found challenging due to complex trade agreements, heavily subsidized oil products and other factors that may distort sensitivity analysis and finding the “correct optimisation” results in Cuba.
This study with a LINDA model does not fully reflect operational restrictions, because it is based on a simplified technology representation to determine generation scheduling and reserve sizing. More detailed models need to be applied to reinforce the results of this work. The authors suggest further analysis of e.g., Flextool to study the reliability, resilience and stability of the system, as the main challenges in integrating high shares of RES into the electrical system. Furthermore, the economic analysis of the lowest cost systems is an essential part of the analysis and equally important to the technological analysis of the modeling of the electric power system based on RES. This article focused on a set of technological possibilities, hence the authors recommend that further studies be carried out on the economics of the system on Isla de la Juventud. Only in this way will it be possible to identify the most suitable and lowest cost systems. An economic analysis of biofuel production was not carried out in this study, which provides another interesting area to examine the food-energy nexus: the costs and benefits of growing biomass for energy production versus food.
5. Conclusions
The aim of the article was to first see how Cuban policy goal with 24% penetration of renewable sources is possible. The electrical system of Isla de la Juventud has important similarities with the electrical system of Cuba and the economic, social and energy related data used by the model allowed analysis of different factors to showcase results that serve as an important evidence in the context of Cuba.
Secondly, geographical, economic and social conditions make Isla de la Juventud an ideal test scenario for Cuba, and the results of this work will help to understand the path that must be followed to achieve a power system with 100% of generation based on renewable energy, obtain maximum reduction on the use of fossil fuel and greenhouse gas emissions.
The use of the LINDA model allowed construction of different scenarios for the introduction of renewable sources in Isla de la Juventud. In the analyzed scenarios, solar energy (19.2 MW of installed capacity) coupled with energy storage systems play a fundamental role in meeting the demand and allowing up to 38% penetration from renewable sources in RENES reducing greenhouse gas emissions to 78.2 Mton of CO2 equivalent. If wind energy and biofuel are added to the generation mix, it is possible to achieve energy independence (also from fossil fuels with 100% RES based electric system) and reduce the emission of greenhouse gases only 13.9 Mton CO2 equivalent per year. Both scenarios show, in comparison with the base year 2019 of with 120 GWh of production and 82 Mton CO2 equivalent, a significant decrease in the emissions especially as the future estimated production increases to 129% in RENES and 175% in MAXRES compared to base year.
These results show transitioning towards sustainable energy and electric power systems is evidently possible in Cuba with the results shown in RENES and MAXRES scenarios. The analysis of the electrical power system for the different sectors of the economy offers the possibility to model the energy mix in the long term as well as to see the impact on the emissions and the influence of new installed RES capacities in Isla de la Juventud. Here open source tools such as Long-range Integrated Development Analysis (LINDA) can provide critical information on the different development trajectories.
The current policy aims are within reach and even exceeding the targets is also well within realism. This, however, requires robust analysis regarding the technical and economic possibilities in Cuba. Until recently, access to resources, mainly equipment and financing, has by far been the most limiting factor. Furthermore, enabling aspects such as legal and regulatory framework, investment incentives, pricing mechanisms and motivation of stakeholders are crucially important in meeting the challenge in moving towards 100% RES based electricity system. Drafting a clear roadmap on how to realize the transition is thus a priority that should be addressed adequately.


 ,
, 


