
Taking into Consideration the Inclusion of Wind Generation in Hybrid Microgrids: A Methodology and a Case Study


Abstract
:1. Introduction
2. Materials and Methods
2.1. Methods: Methodology to Account for Small Wind Turbines Barriers during the Design Process
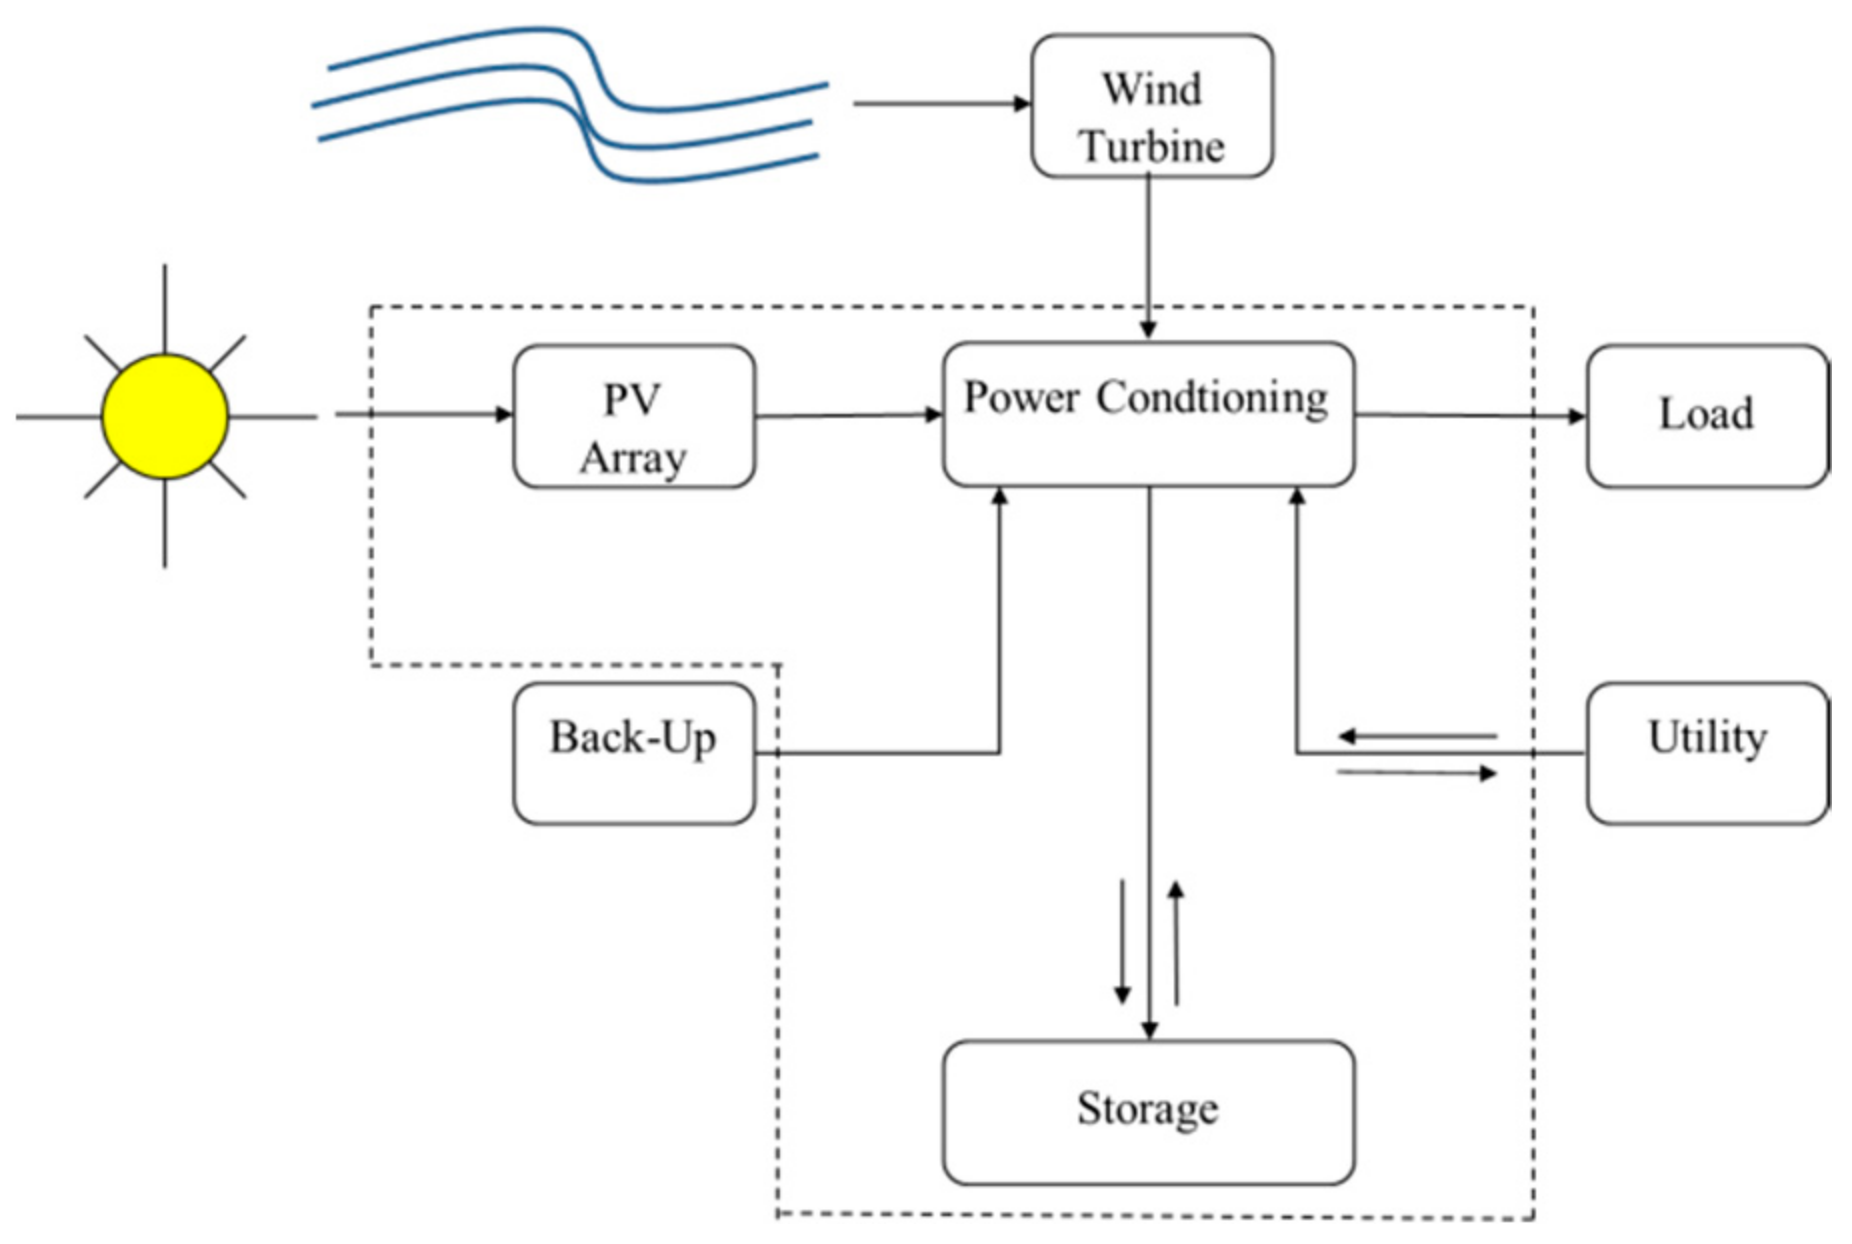
2.1.1. Selection of the Configuration of REDPS to Be Designed
- Diesel dominated hybrid systems.
- Inverter dominated hybrid systems.
2.1.2. Description of the Design Process
2.1.3. Differences Arising from the Presence of Wind Generation in PV-Wind REDPS
- (a)
- Characterization of Wind Resource
- ○
- Wind Resource Assessment Methods
- ○
- Using Reanalysis Data
- CFSR: This is the Climate Forecast System Reanalysis. Based on the Climate Forecast System, the NCEP global forecast model spans from 1979 to the present year. Most parameters are available every 6 h, whereas selected variables are available every hour. CFSRv2 provides wind speed and wind direction at 10 m above surface, with a horizontal resolution of 38 km.
- MERRA: MERRA is the Modern-Era Retrospective Analysis for Research and Applications, Version 2, based on the National Aeronautics and Space Administration (NASA) global data assimilation system (GEOS-5). MERRA-2 provides wind speed and direction at 50 m above surface. It holds one hourly values in a period from 1992 until present and a horizontal resolution of 50 km (0.5° latitude and 0.625° longitude). Hourly data for solar irradiation and wind speed can be accessed freely in the web service [19].
- ERA5: ERA5 is the fifth generation European Center for Medium-Range Prediction (ECMWF) atmospheric reanalysis of the global climate. It is a set of climate reanalysis data from 1979 to the present year developed by the Copernicus Climate Change Service (C3S) and processed by the ECMWF. ERA5 provides wind speed and wind direction at 10 m and 100 m above surface, with a special resolution of 31 km [20]. In the case of ERA5, data assimilation is performed every 12 h. However, it provides hourly estimations because the assimilation method takes into account the exact moment of the observations and the evolution of the model within the assimilation window.
- ○
- Small Wind Resource Assessment
- (b)
- Existing Technology
- (c)
- Availability of Design Tools
- Level of detail of the design, which is also related to the stage of the design of the project. When little detail is necessary, such as in the concept design phase, simple spreadsheet-type tools can be used, whereas dedicated tools are needed for a more detailed analysis, such as in the feasibility study stage. HOMER Pro is an international reference covering most of the levels of detail up to the feasibility study.
- Technologies involved: For example, whereas DPS are usually designed as a function of maximum and minimum power in the loads, REDPS usually takes into account the energy balance for their sizing, covering of course the power needs.
- Spatial resolution: Centralized REDPS can be designed with a unique profile for each RE resources and even a unique load profile (even if there are distributed loads, the generating system can be designed with a unique load and design the distribution lines), whereas distributed REDPS may require different profiles if distances are long enough. In this case, particular tools may be needed, including some Geographical Information System.
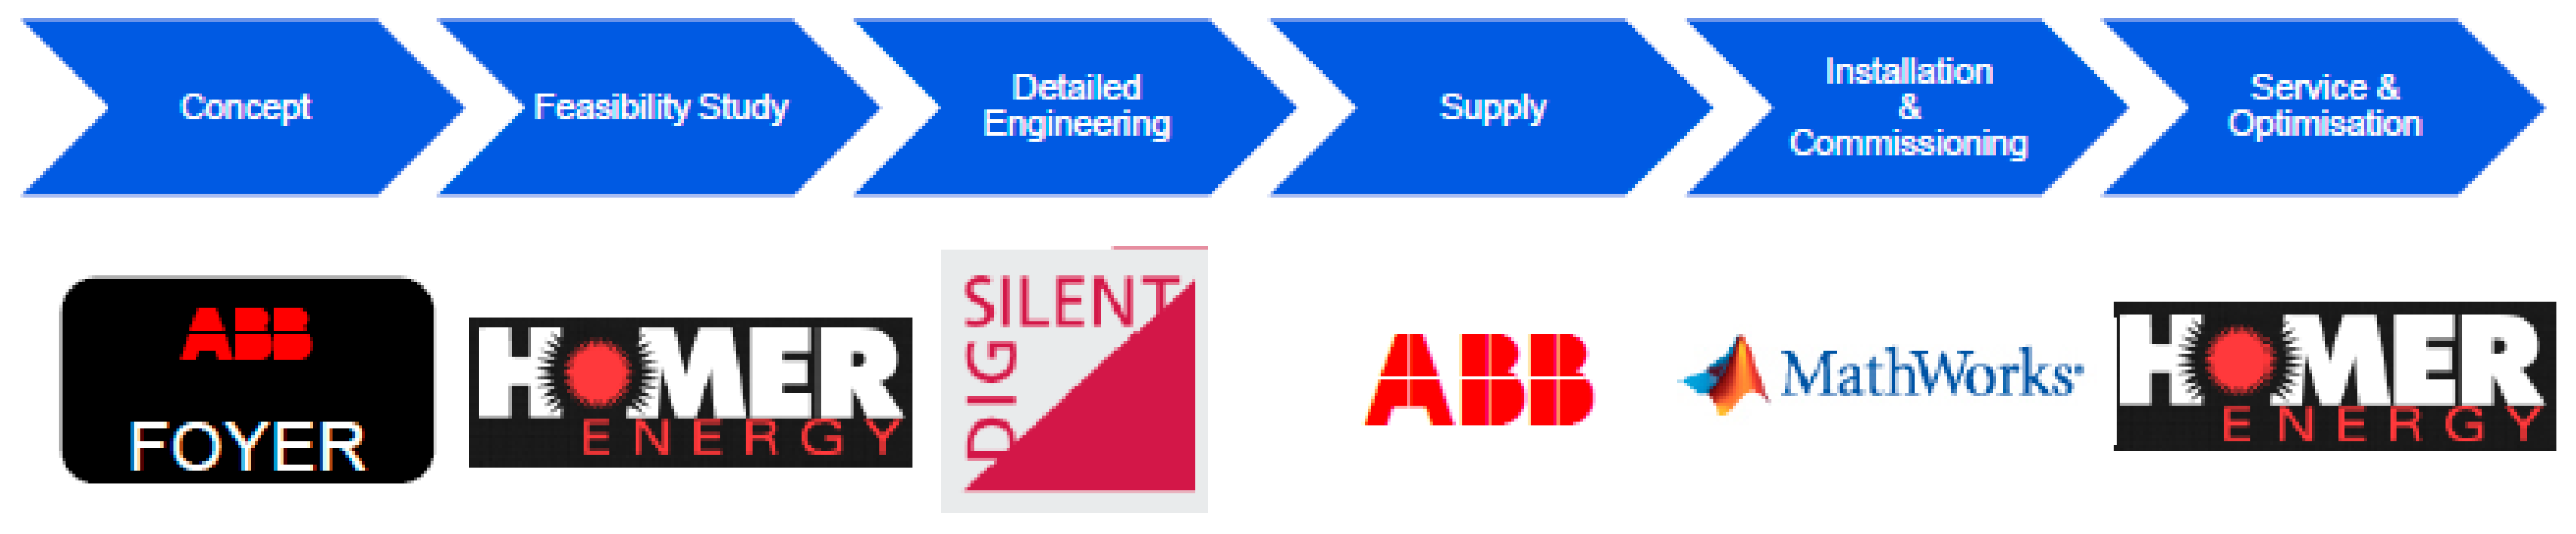
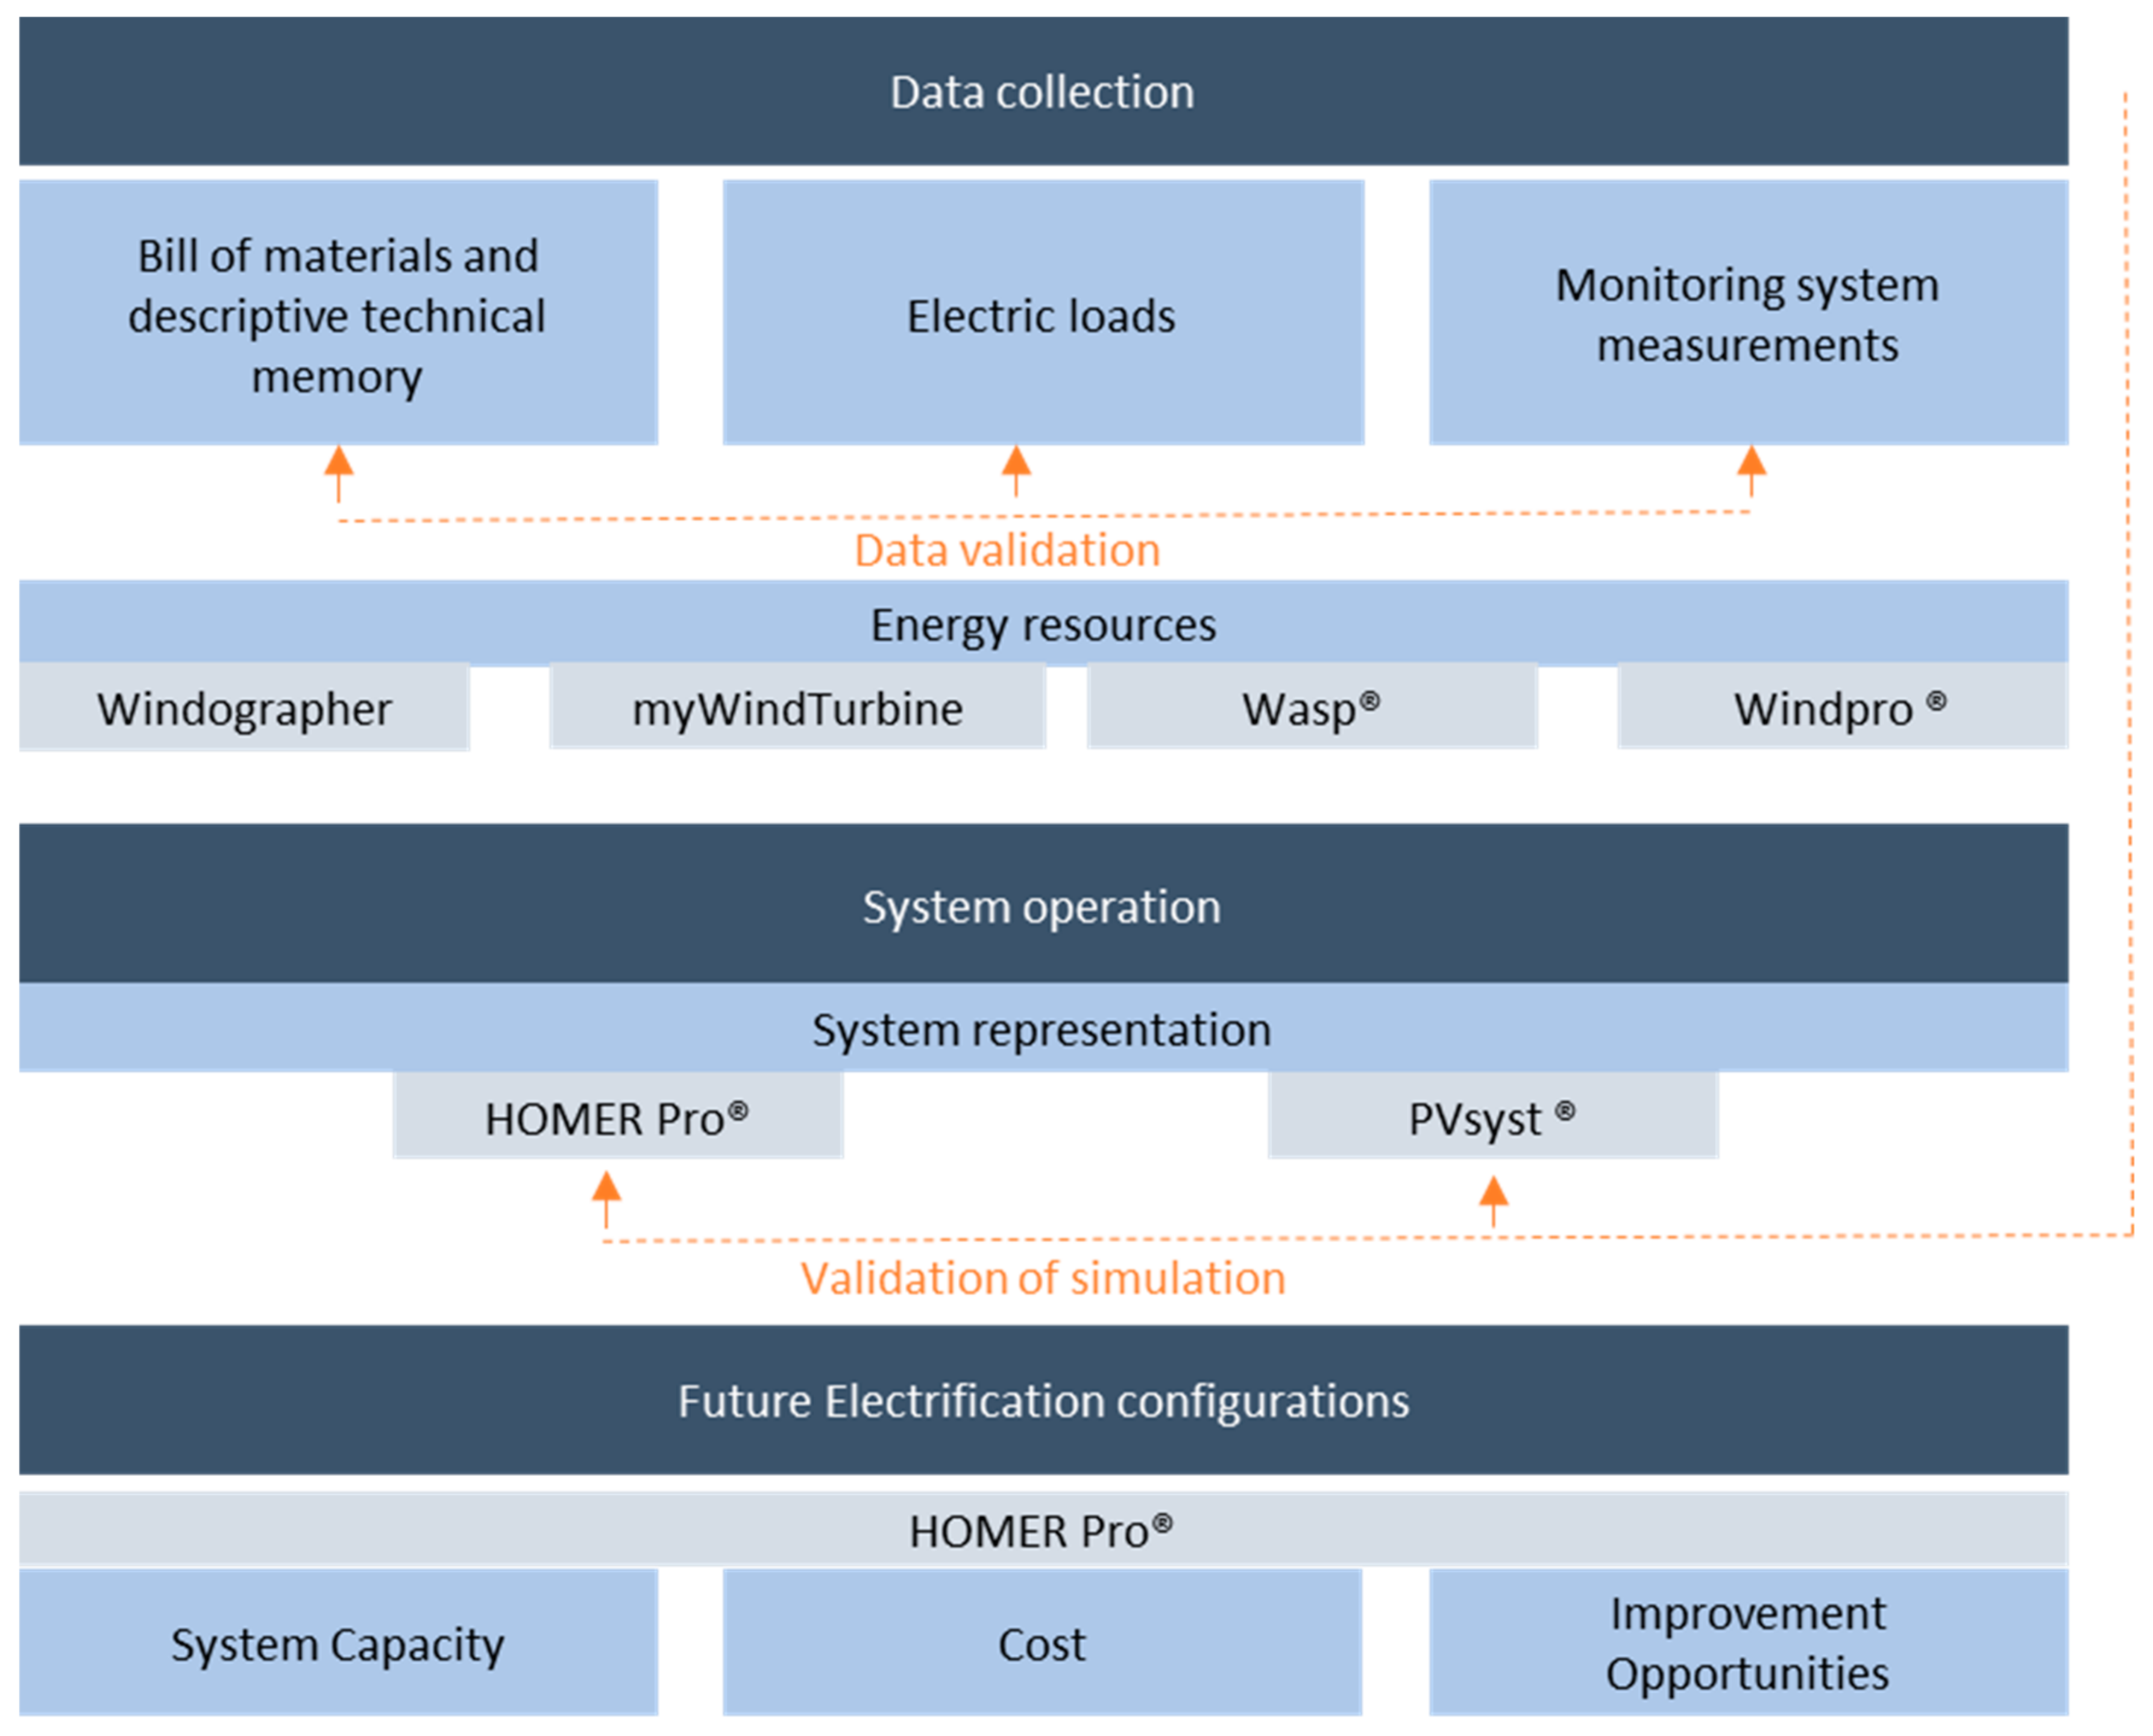
- Time resolution: different configurations of REDPS (see Section 2.1.2) require different time resolutions analysis. All of them require energy balance analysis, which are minimum monthly and preferably in a hourly time resolution, for the optimization design. Furthermore, diesel dominated architectures require dynamic analysis in the case of medium and high percentage RE systems. An example of used tools for a WDPS with high RE percentage is shown in Figure 2.
2.1.4. Methodology to Account for Small Wind Turbines Barriers during the Design Process
- (a)
- Data Collection
- (b)
- Sizing study
- (c)
- Implementation Project
- Installation issues: foundation design; need and availability of a crane (which is related to the height and type of tower); available space. Manufacturer/installer should help with (or perform) this part.
- Electrical equipment: decide whether to use AC or DC coupling; power converter availability for the selected SWT and for the specific use; voltage and frequency (nominal value and range).
- Control issues: communication with the system control; dump load regulation (high temperatures), compatibility with Li-ion batteries (if present).
- Quality assurance: as it was described in Section 2.1.3 (b), all the related issues (guarantees and warranties, O and M, …) should be established.
2.2. Materials: Case Study
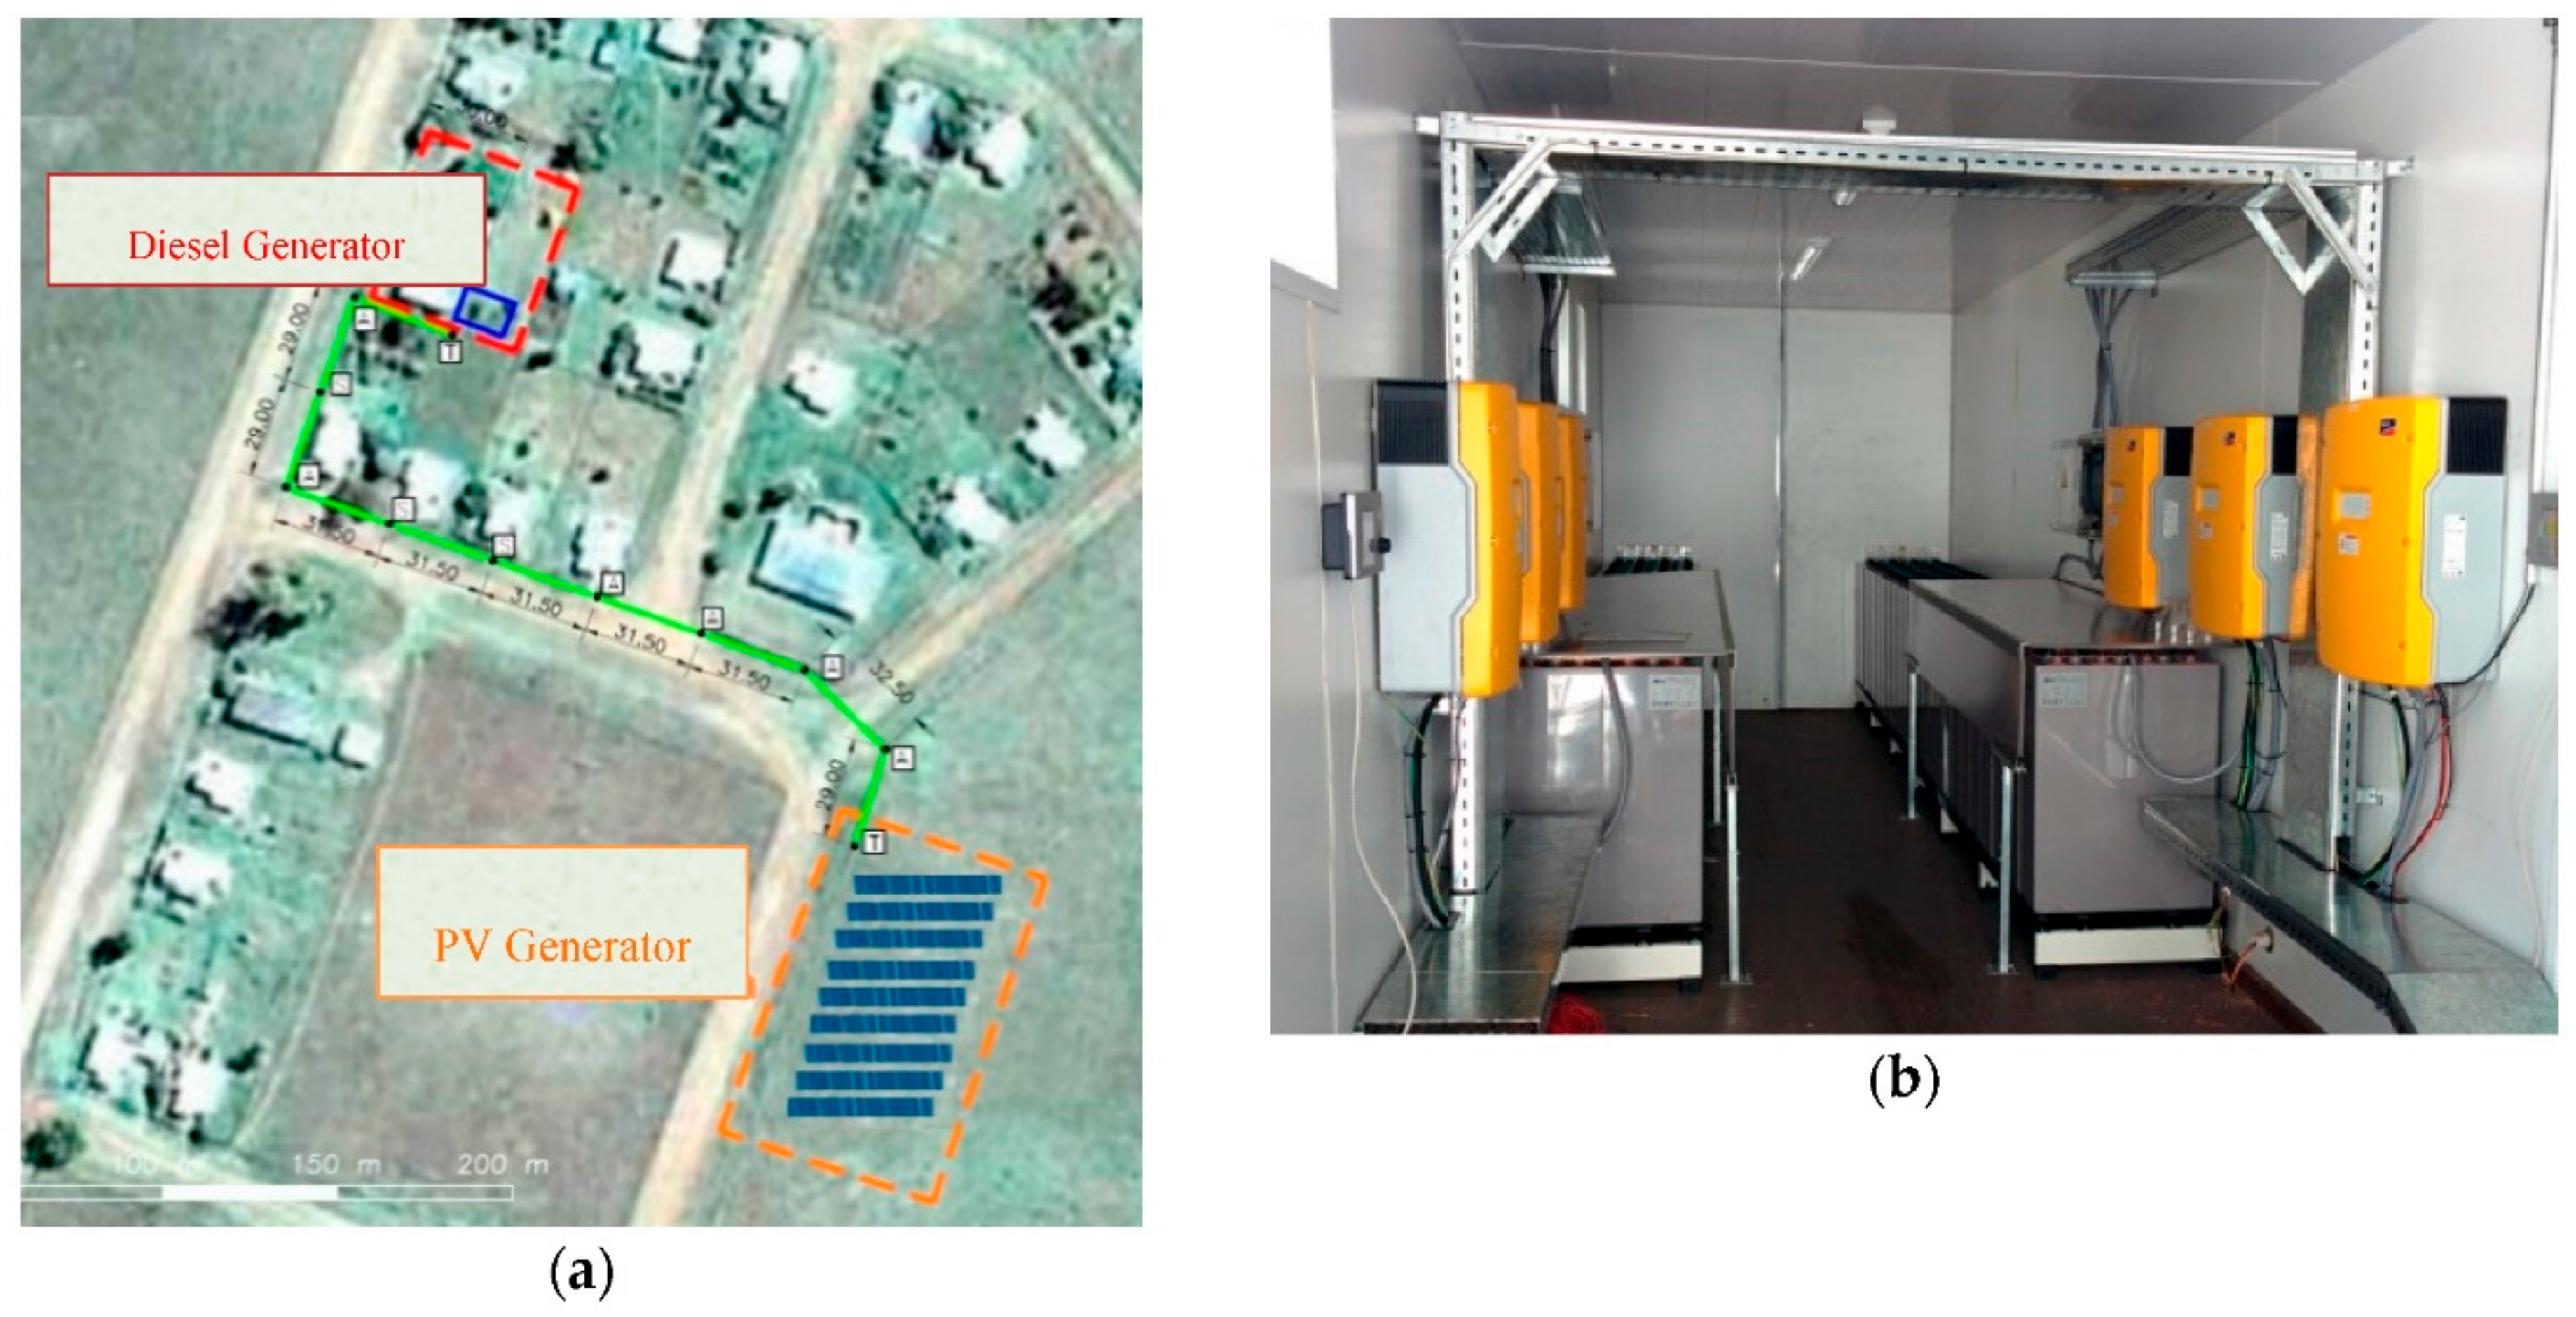
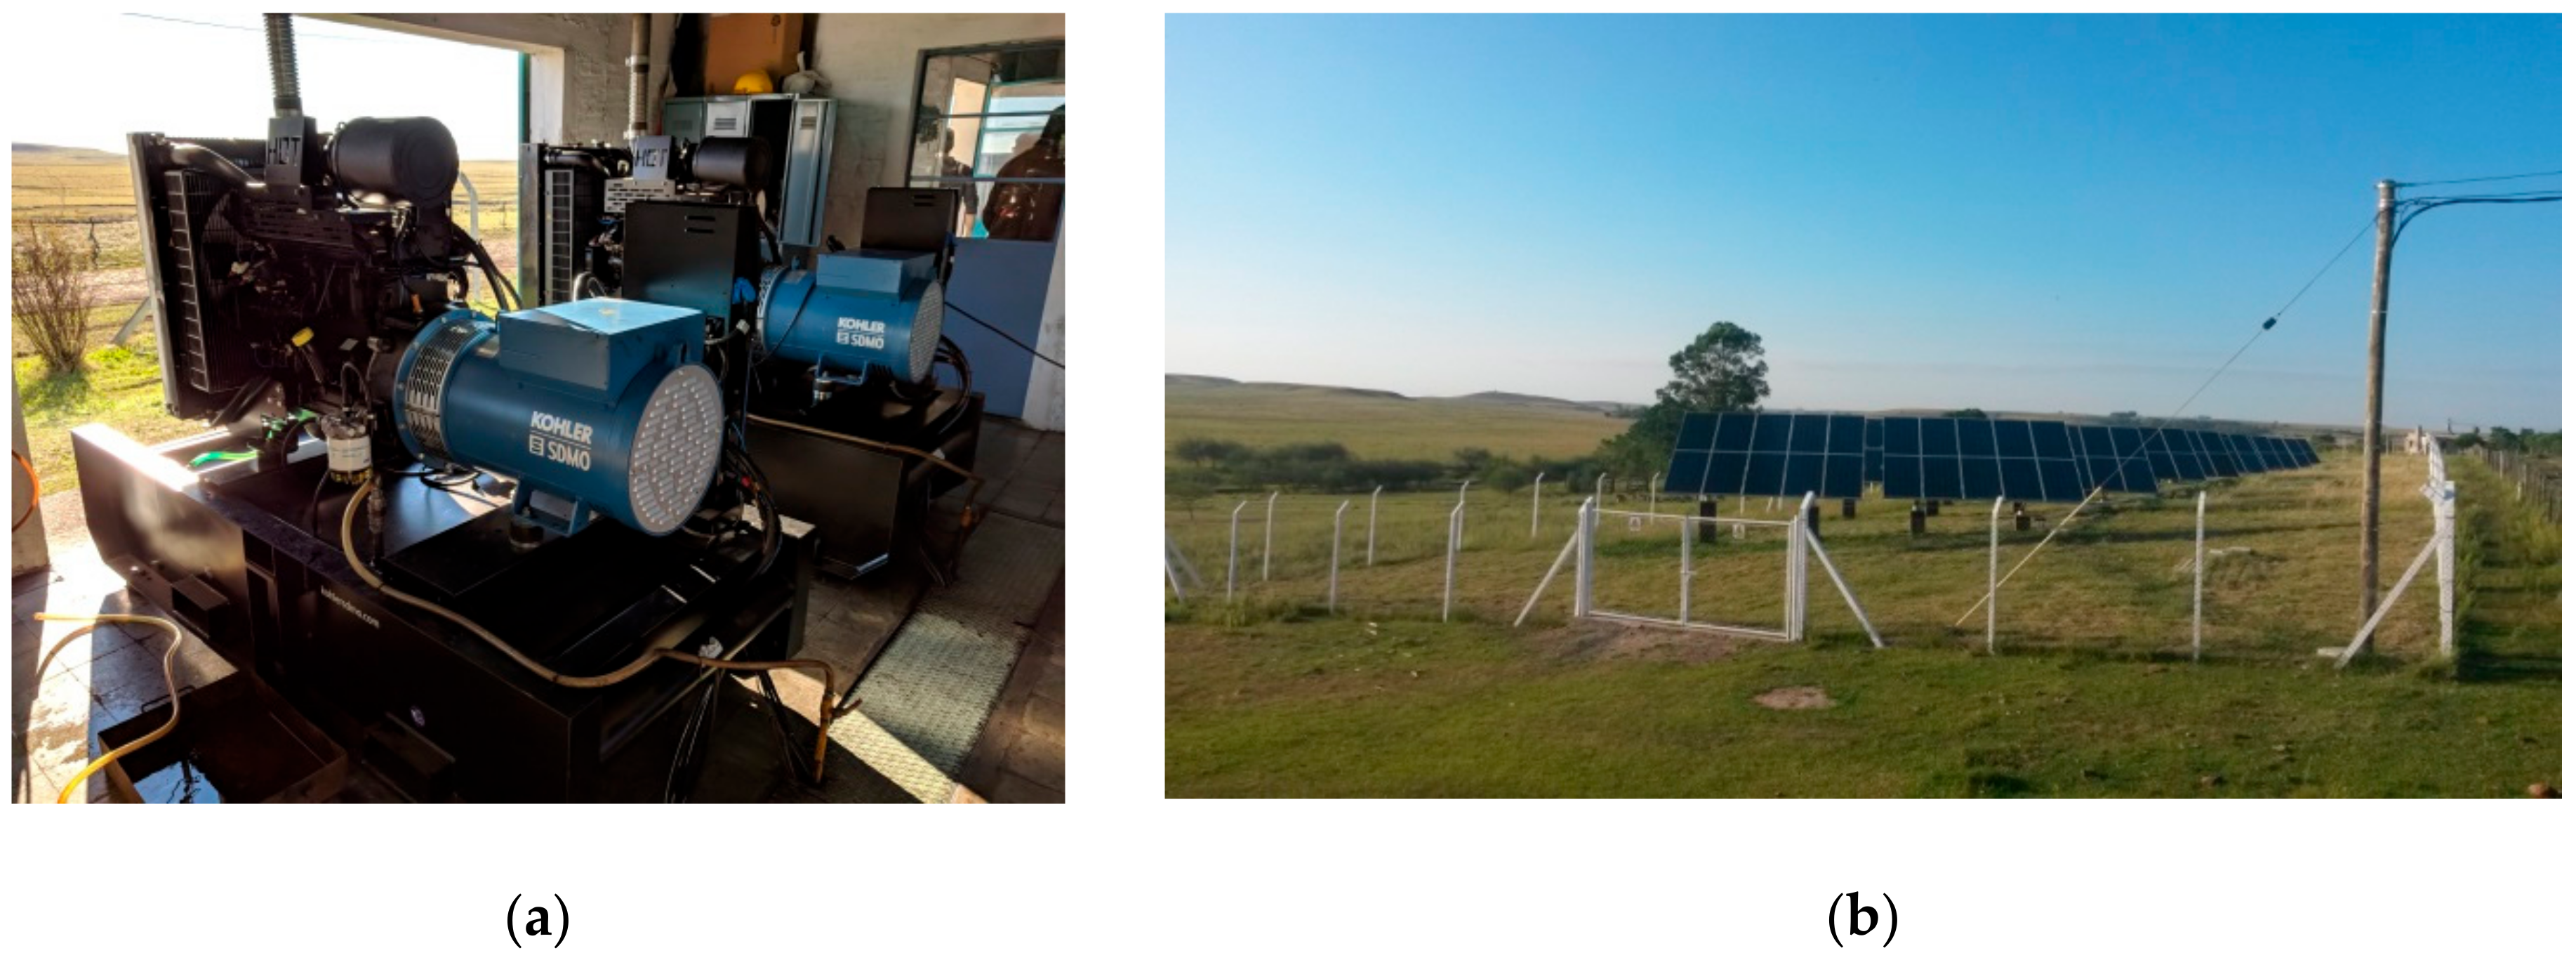
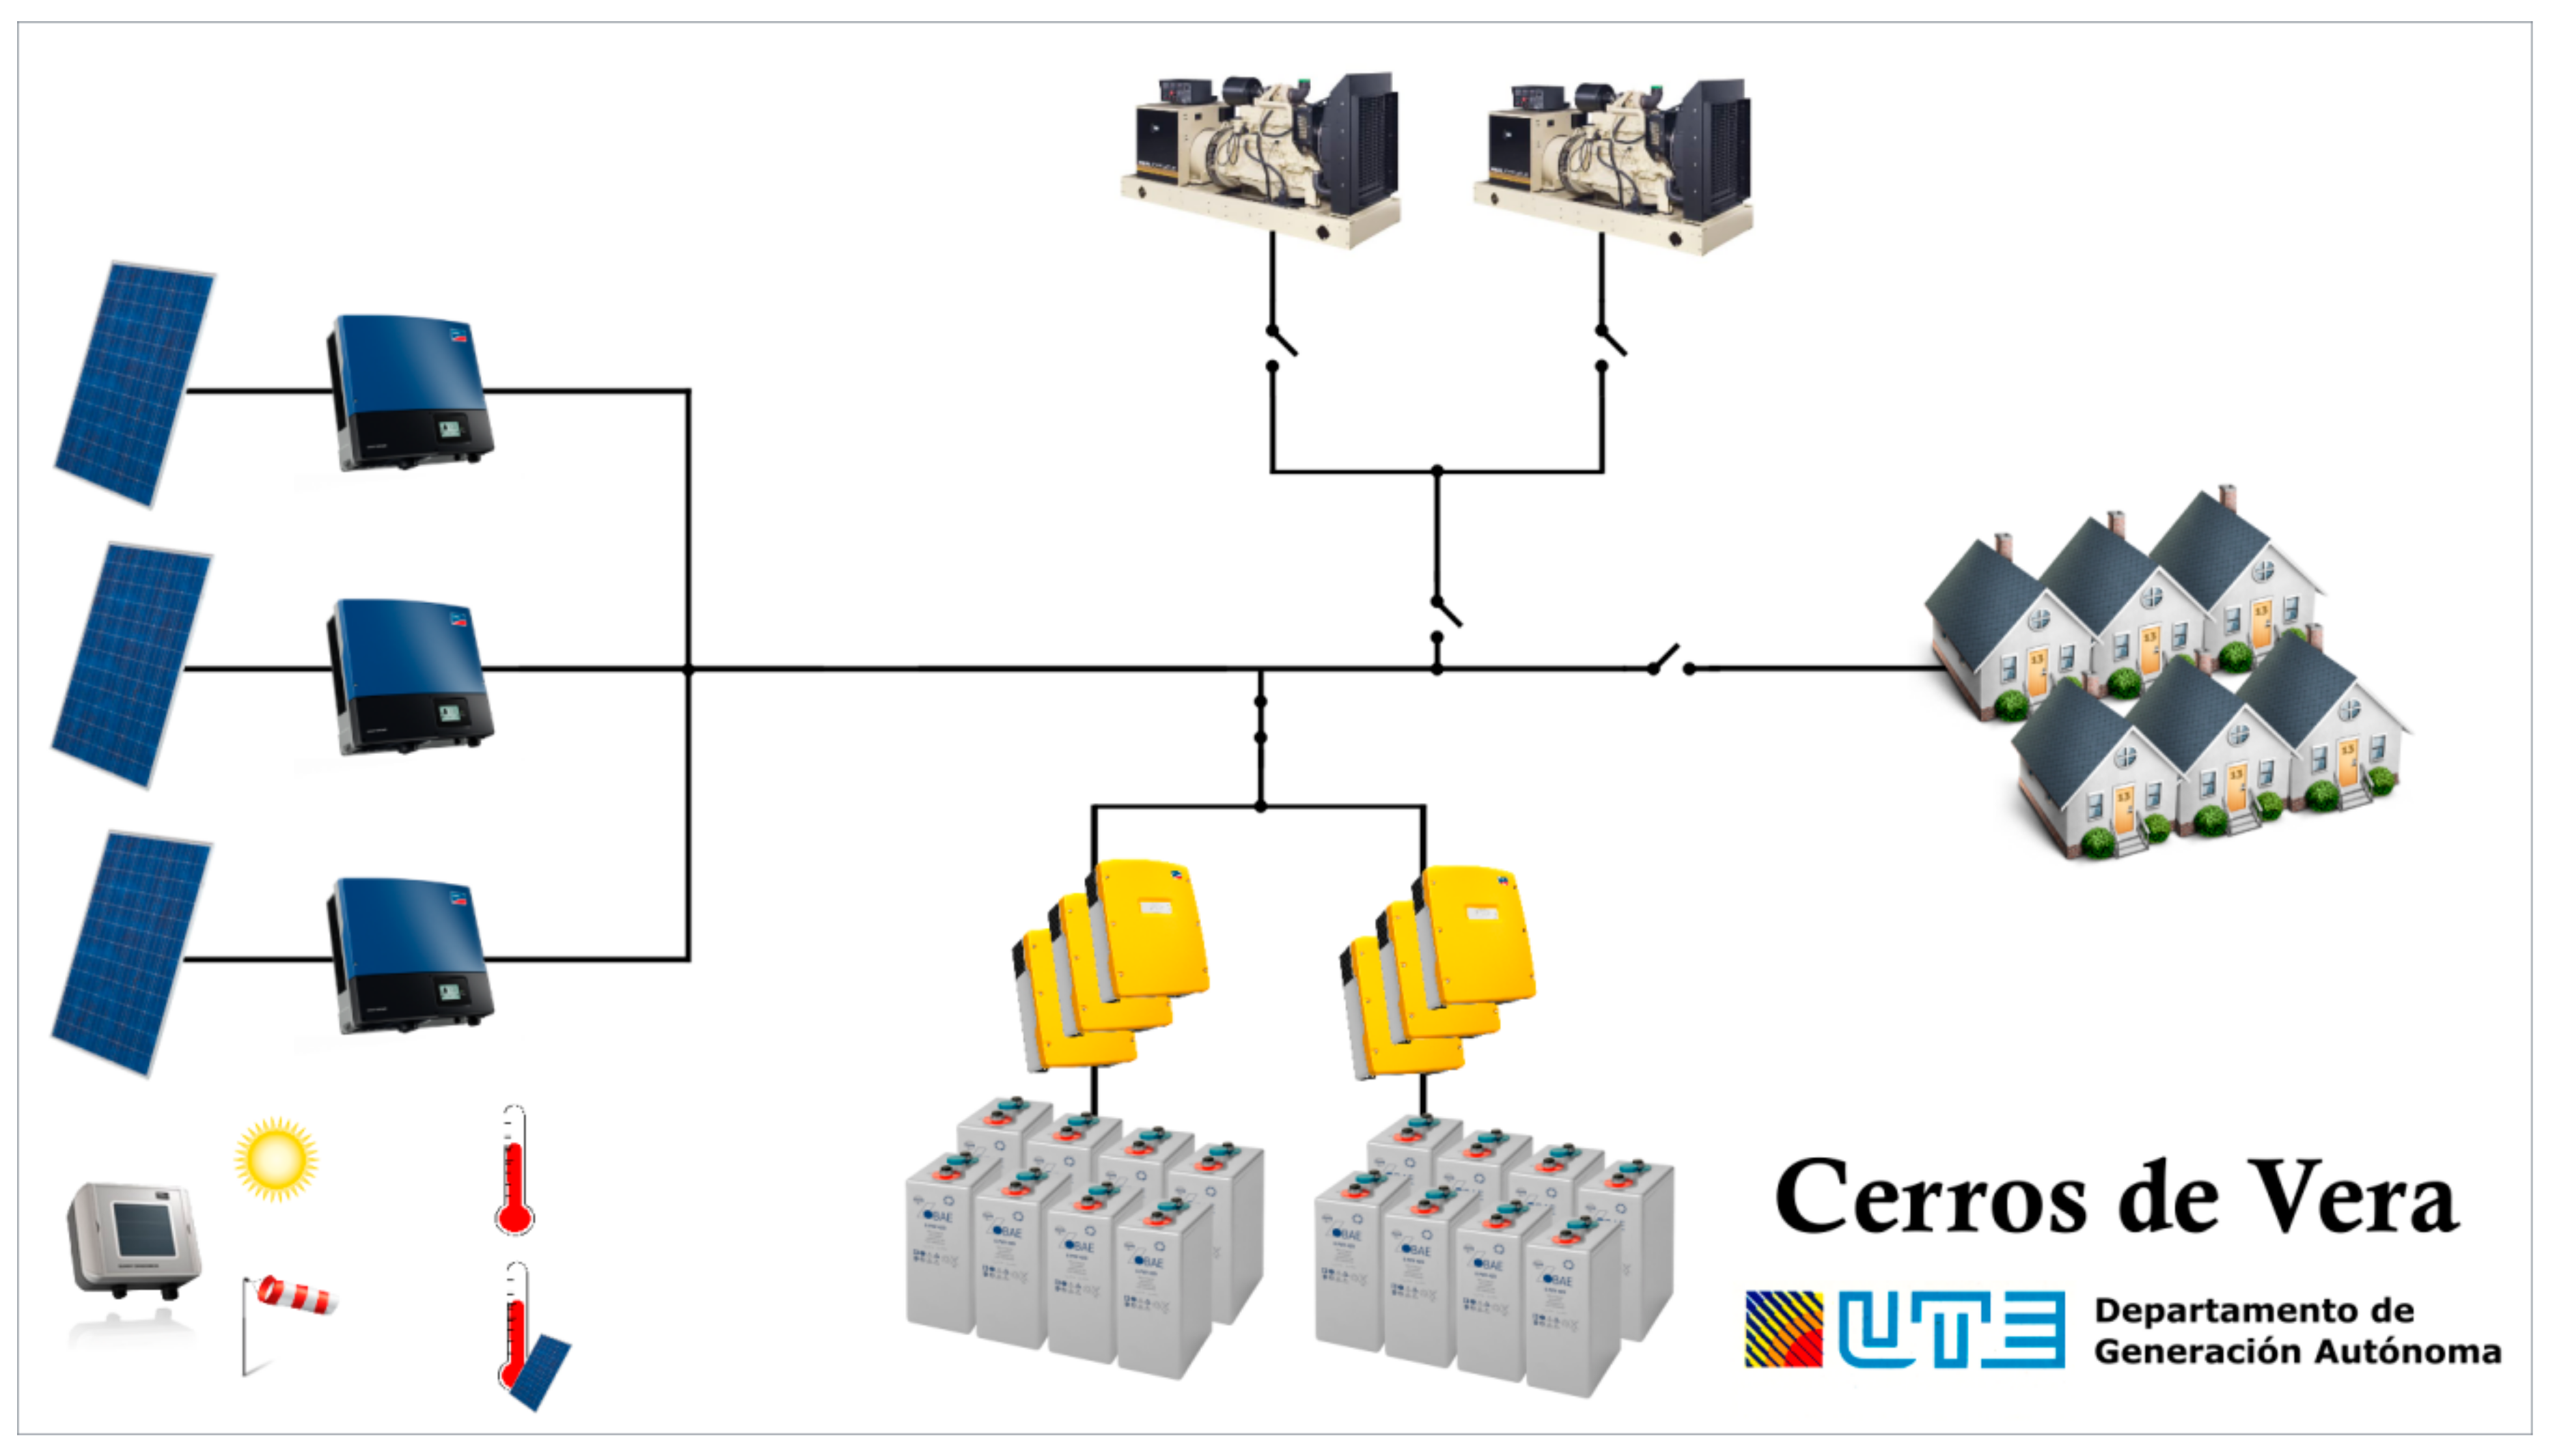
2.2.1. Description of the Case Study: An Existing PVDPS in Cerros de Vera, Uruguay
2.2.2. Description of the Operation of the Existing System
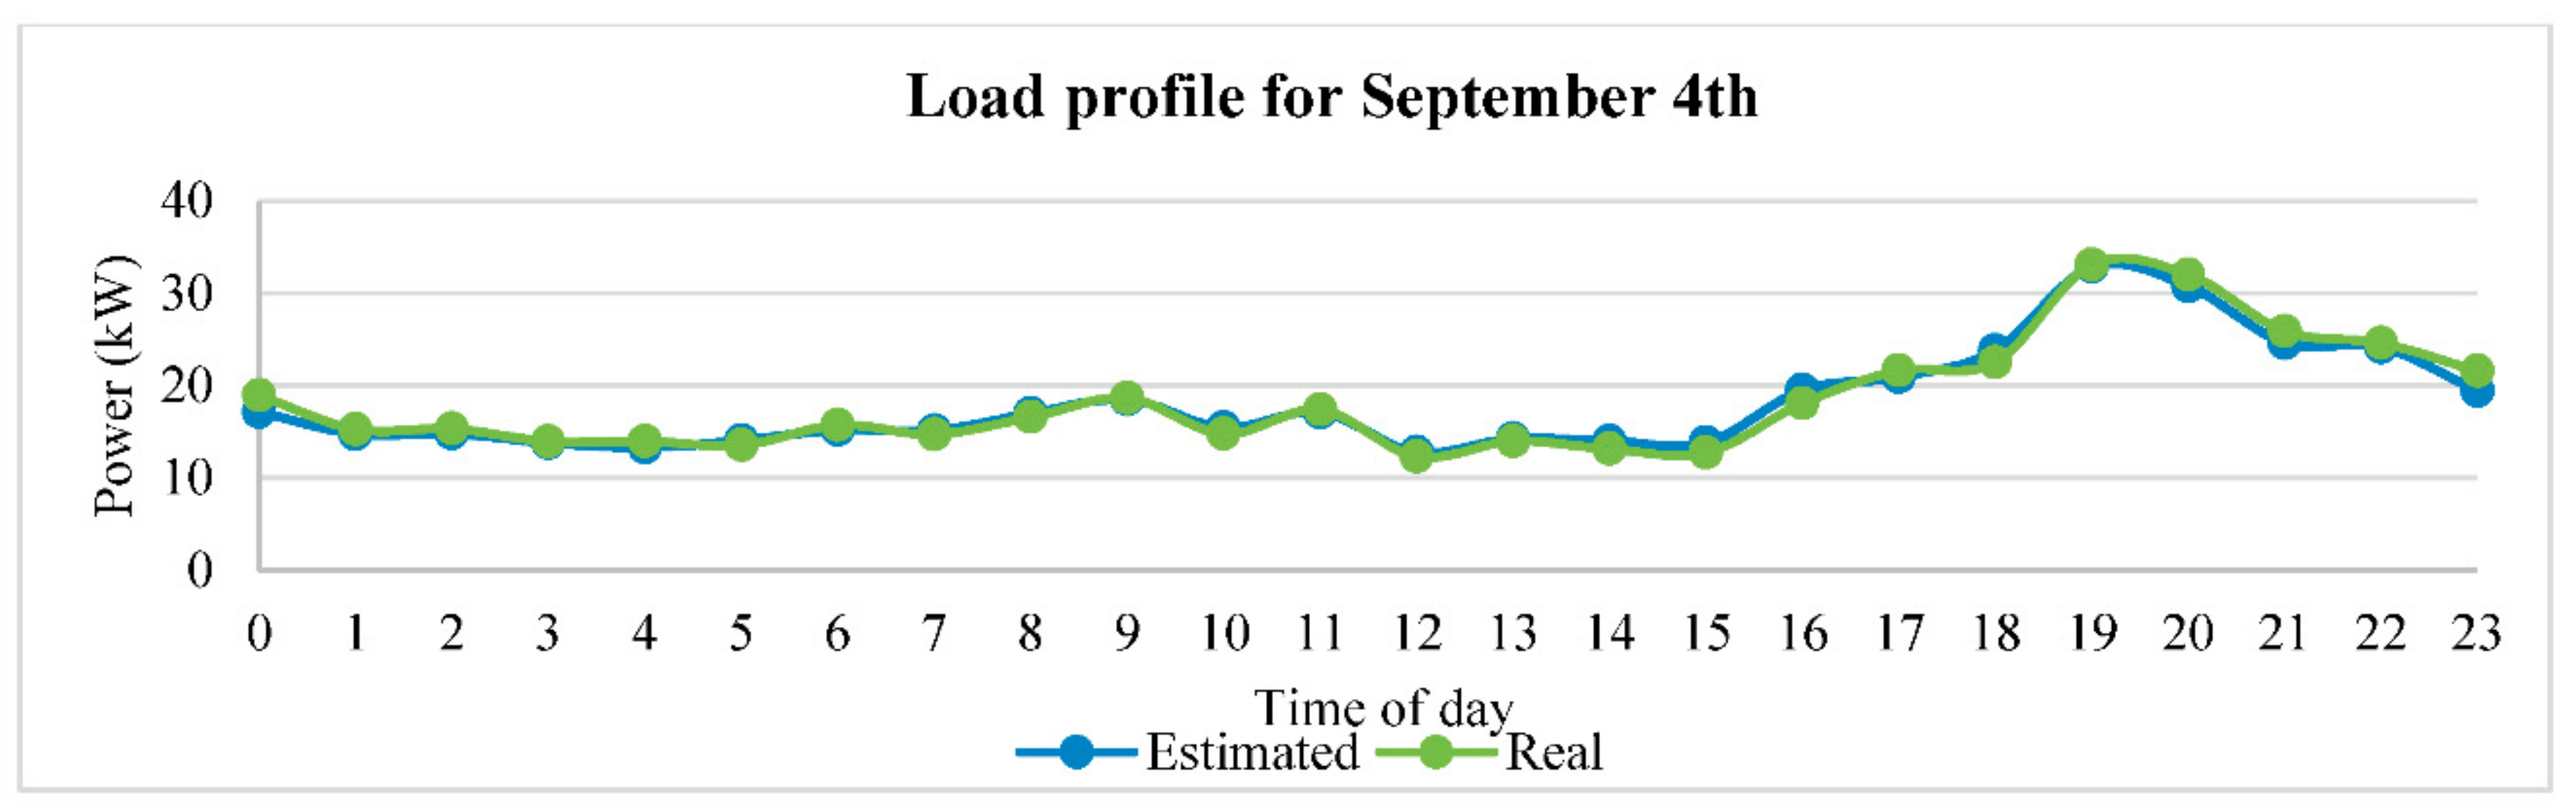
- Load Characterization.
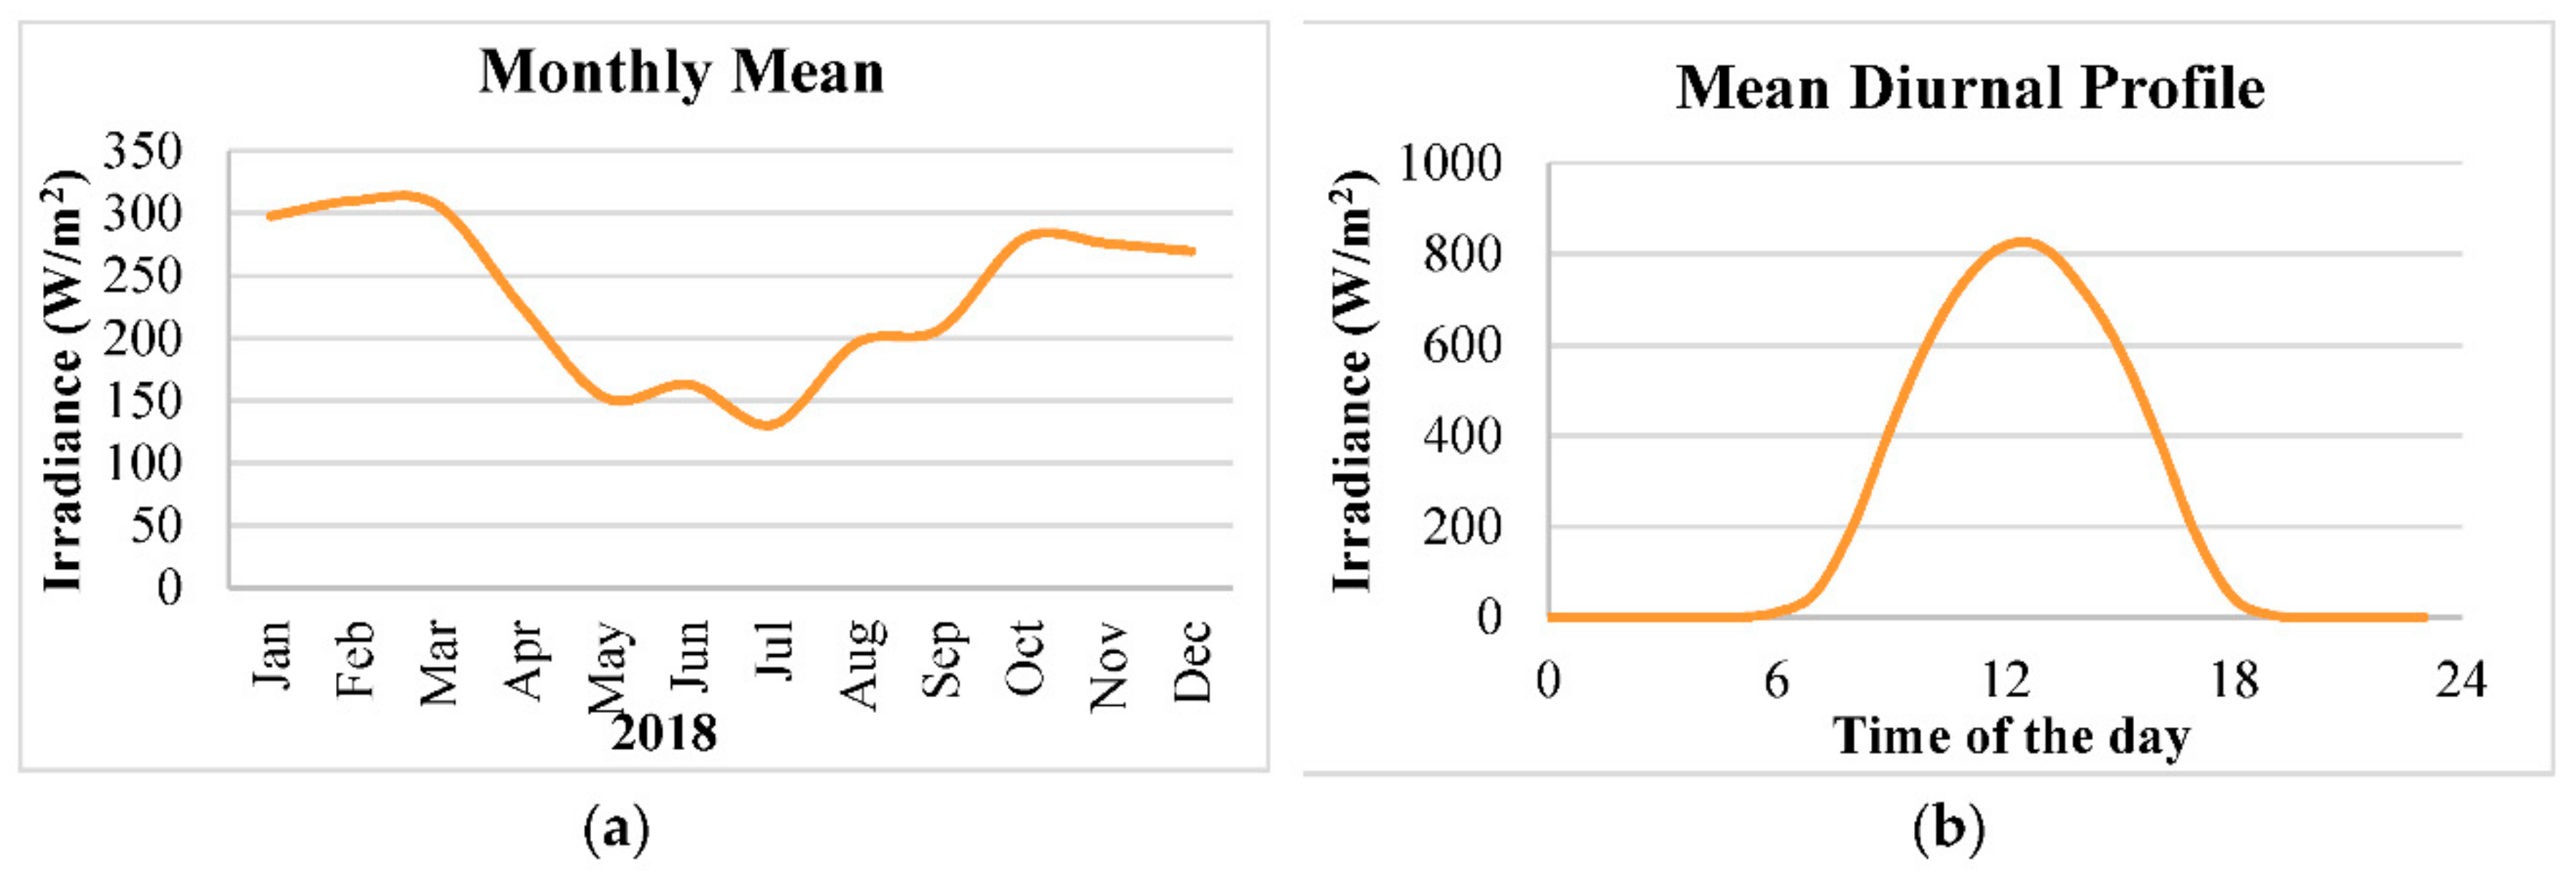
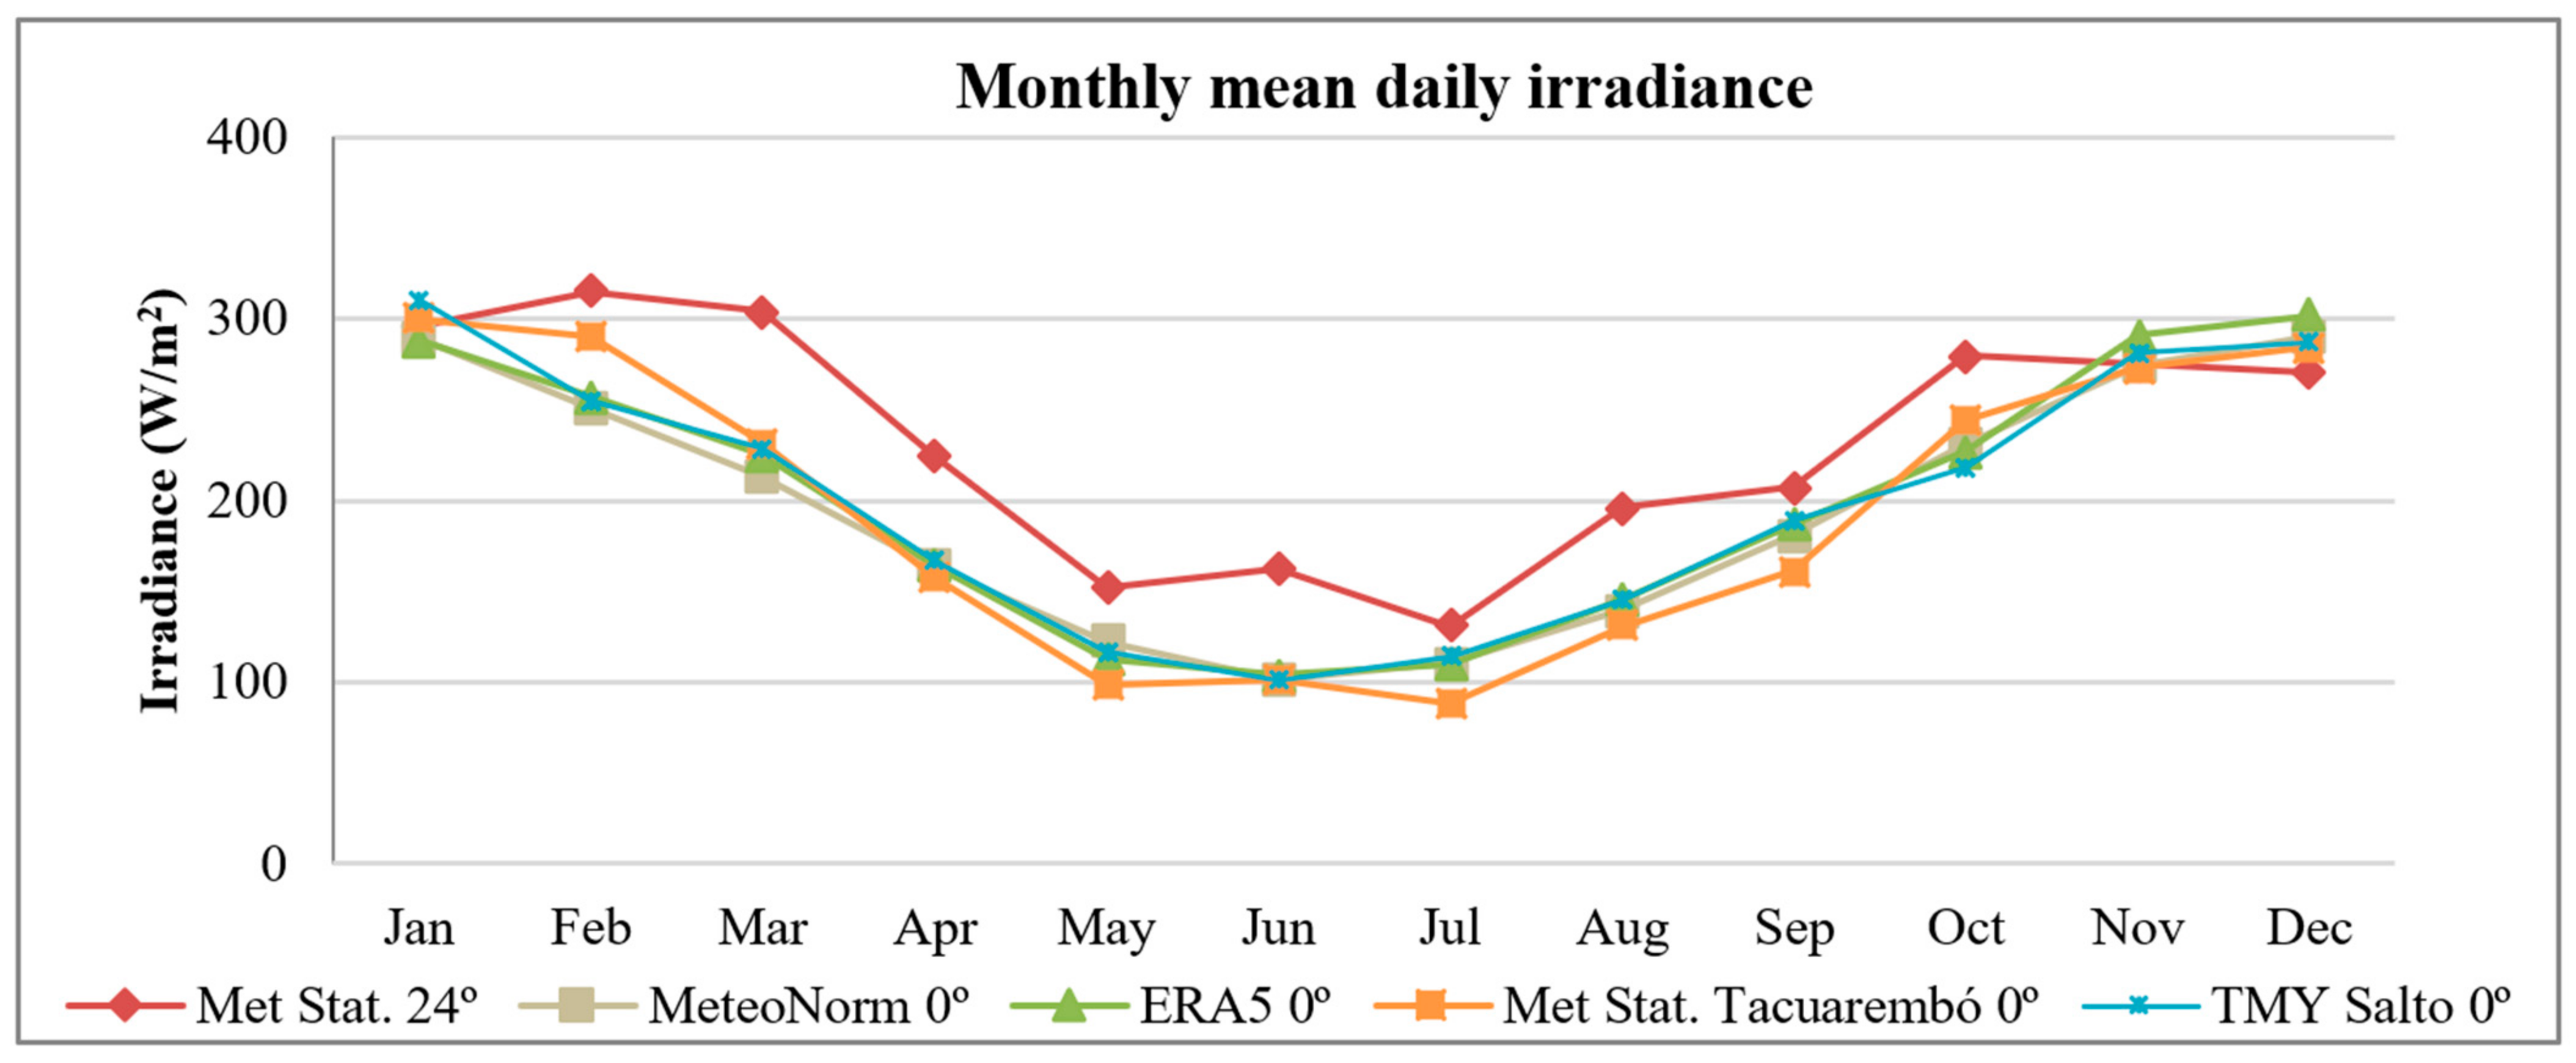
- Solar resource.
- Wind Resource.
- Photovoltaic system.
- Converters.
- Batteries.
- Diesel generator.
3. Results: Application of the Proposed Methodology to the Case Study
3.1. Data Collection
- Load demand data.
- Solar resource.
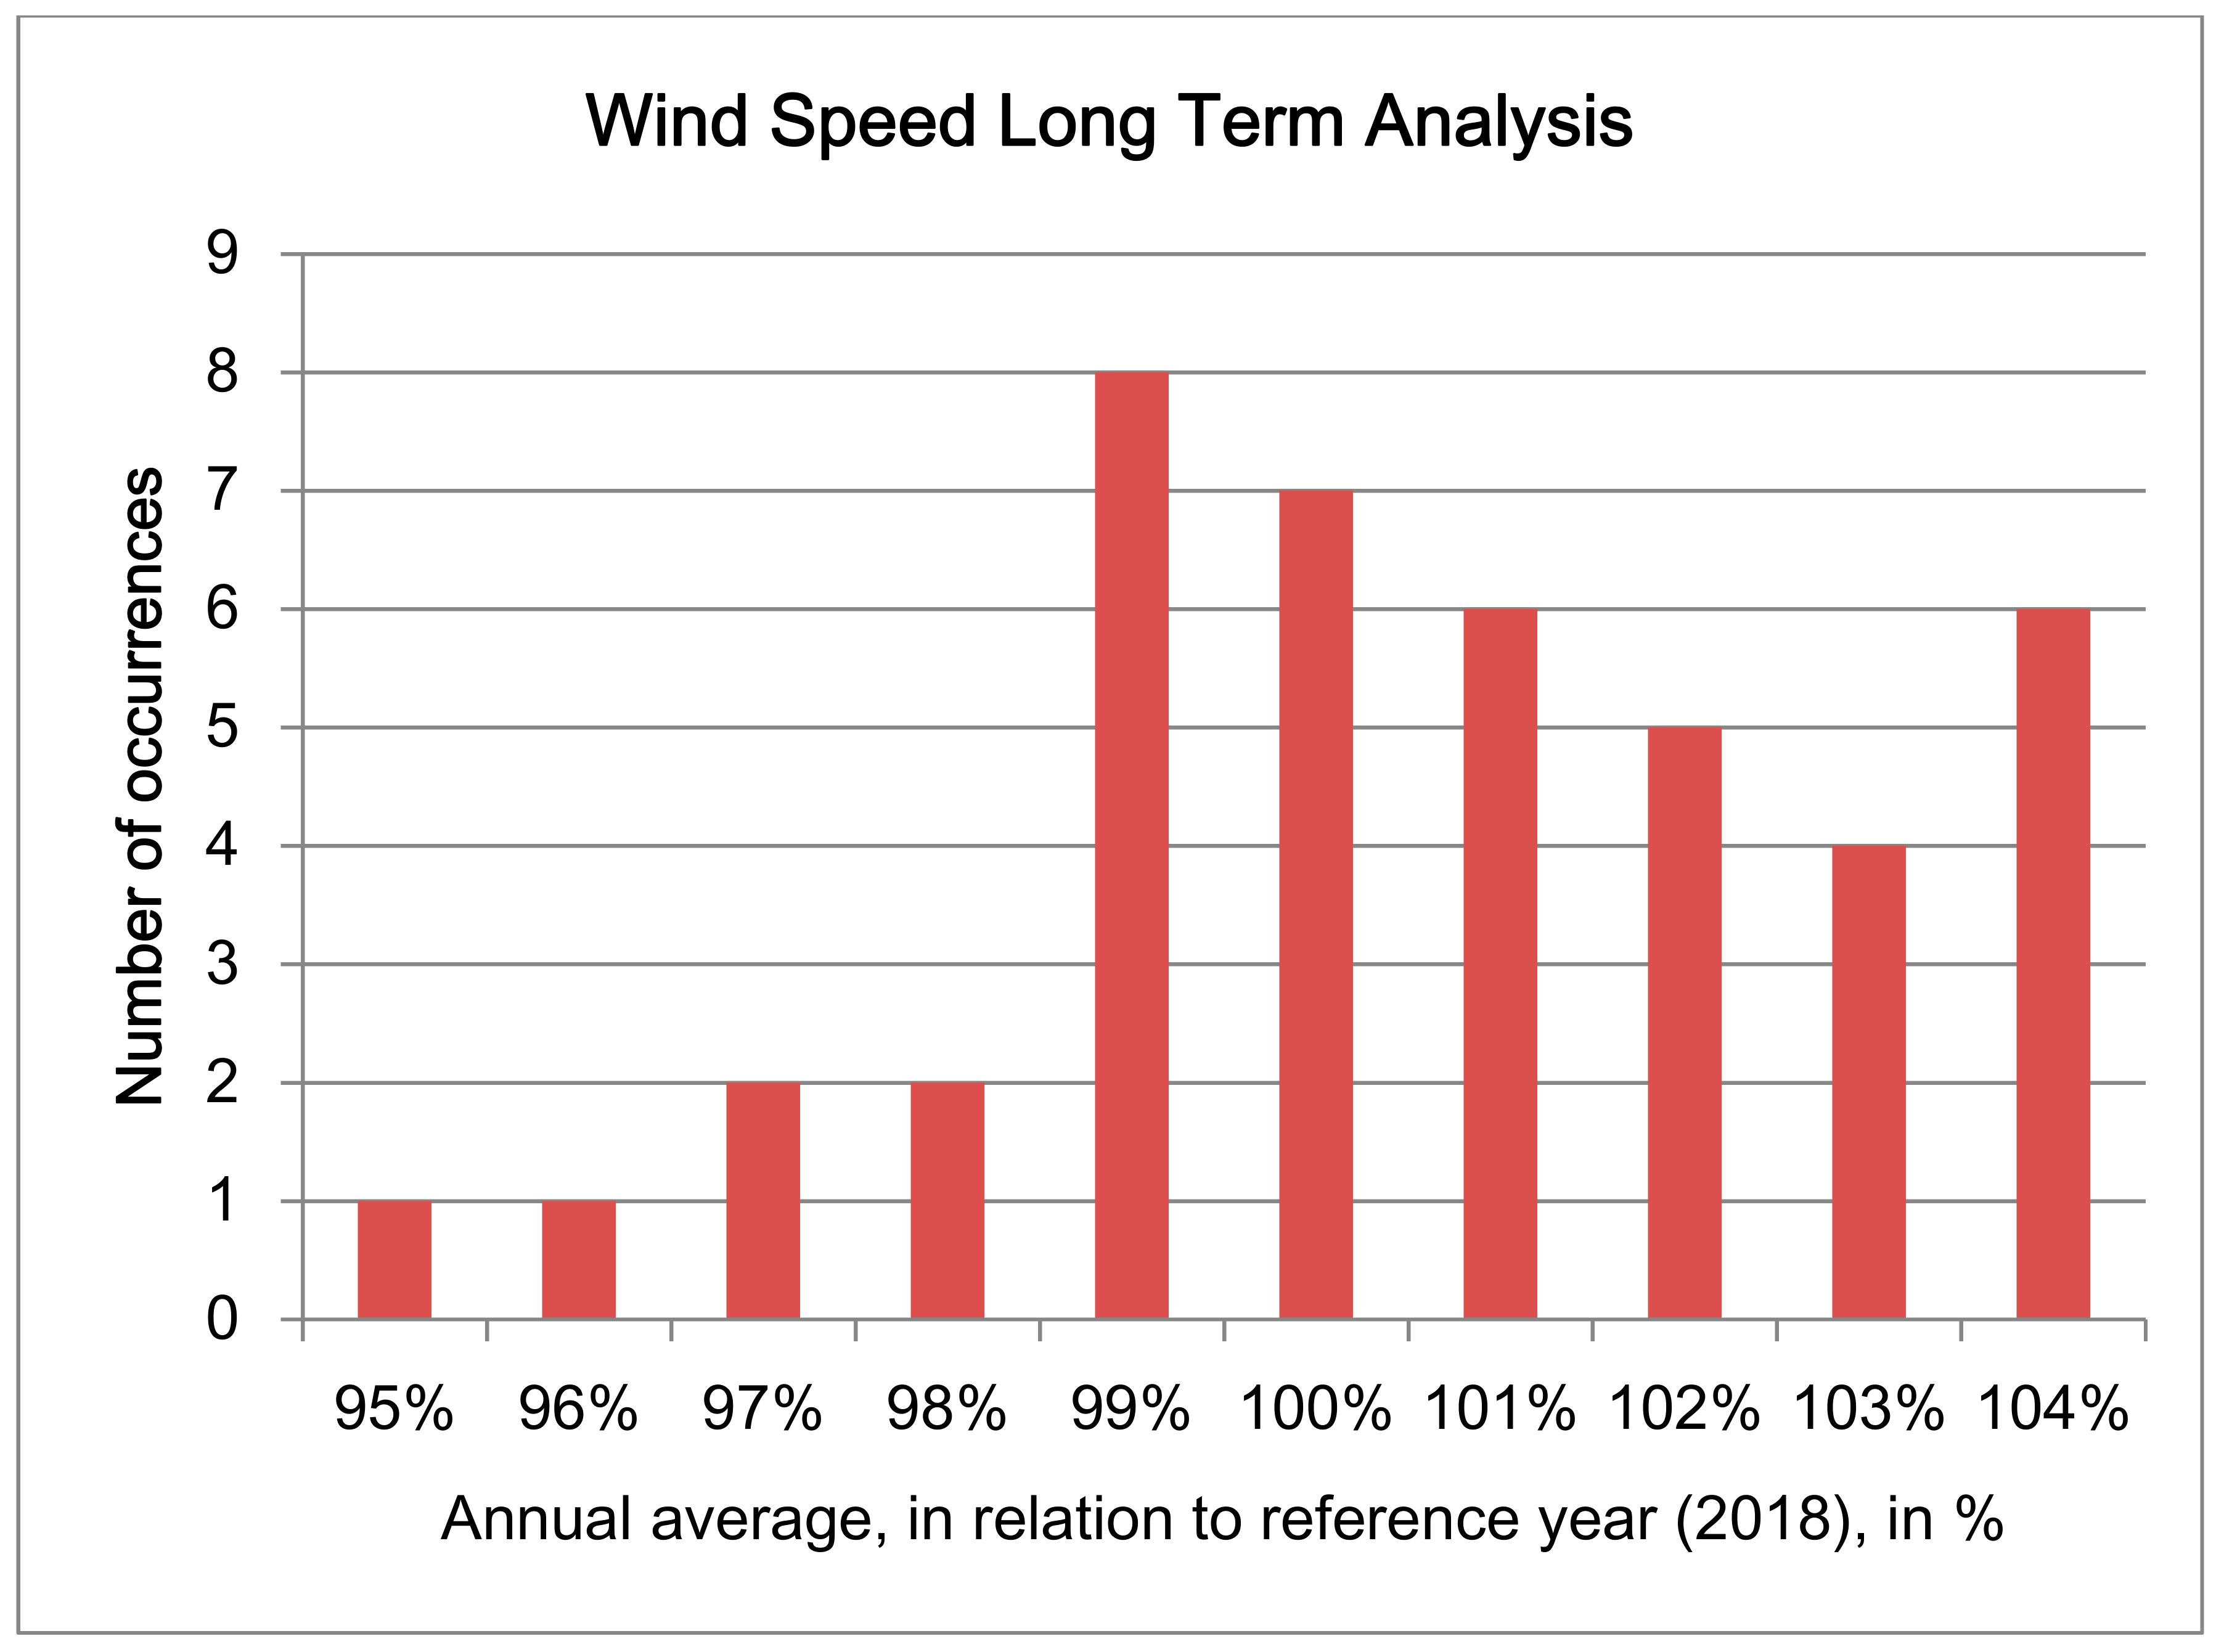
- Wind resource.
- Temperature: obtained from ERA5 database along with wind data;
- Digital Elevation Model: obtained from SRTM 3 NASA database [45]. The downloaded map has an area of 40 × 40 km, with a 90 m spatial resolution. Additionally, a distance between contour lines of 5 m has been selected;
- Roughness: obtained from GlobalCover2009 −300 m database [46]. As for the orography, a 40 × 40 km map was downloaded. As well as the ERA5 wind data, the orography and roughness have been downloaded through Windpro. These outputs have been considered as the input for the creation of the resource grid;
- Technical aspects of the current electrification system.
3.2. Simulation of the Operation of the Current Electrification System
- General considerations.
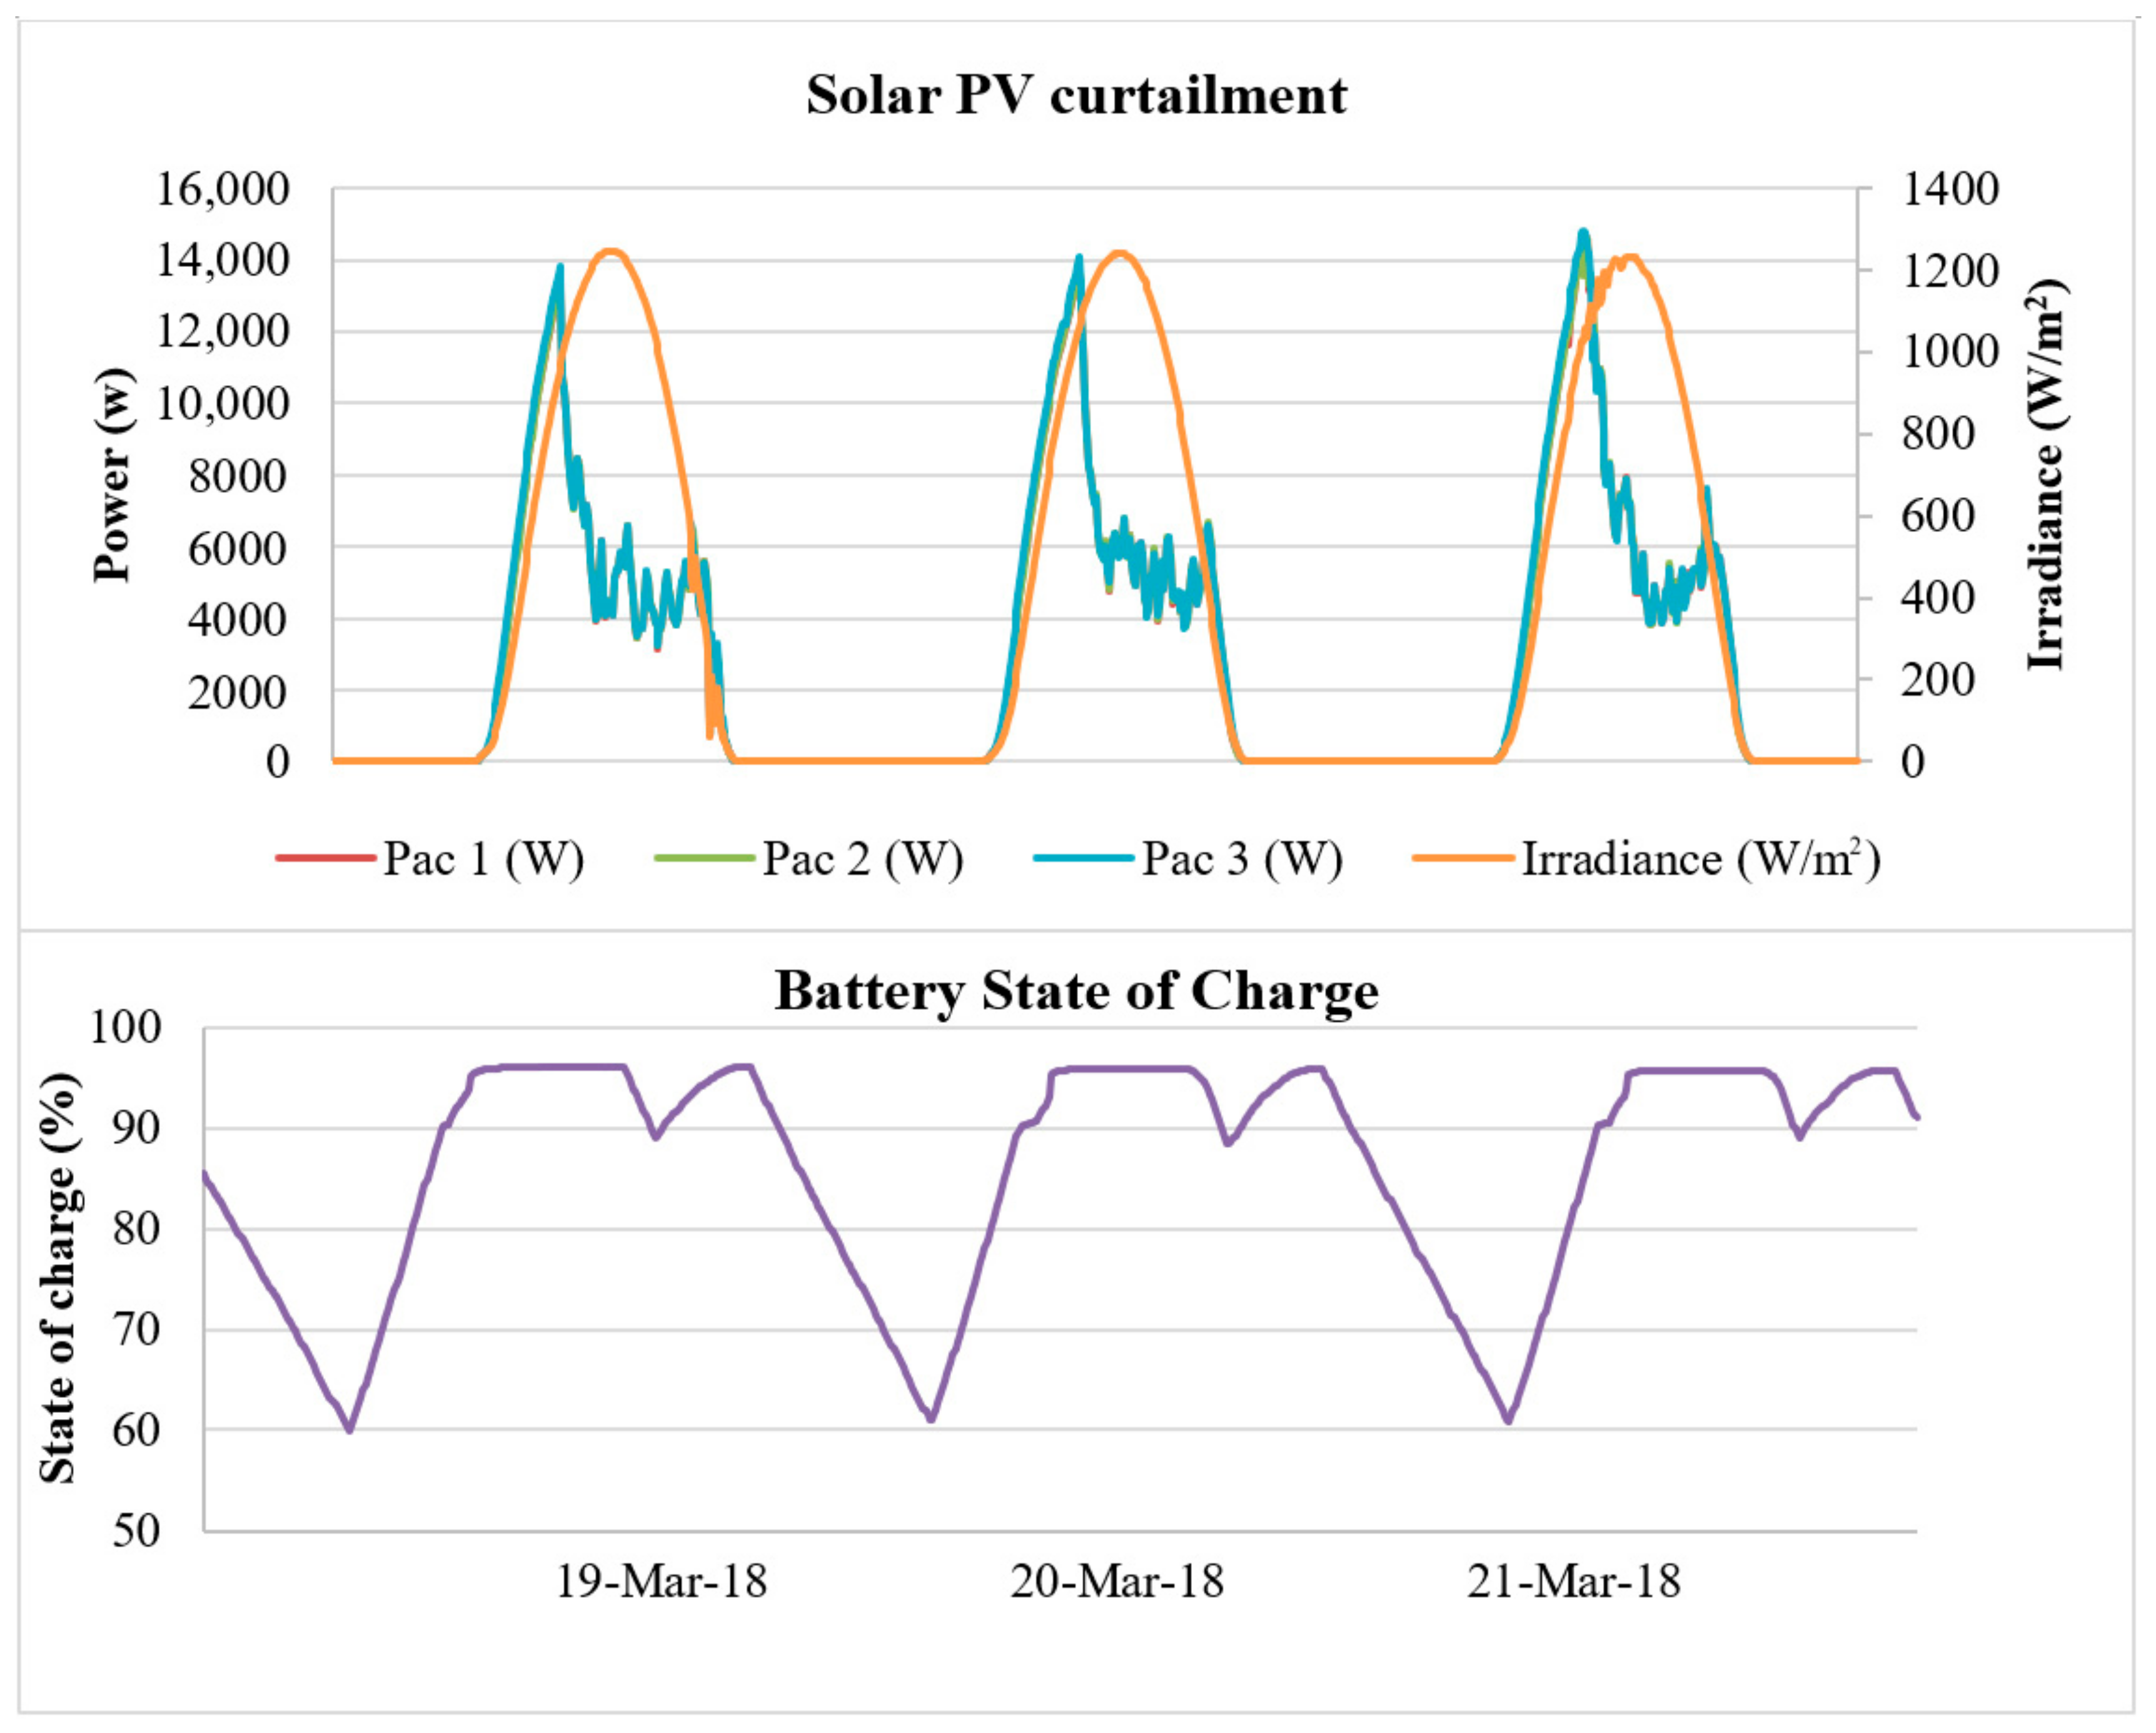
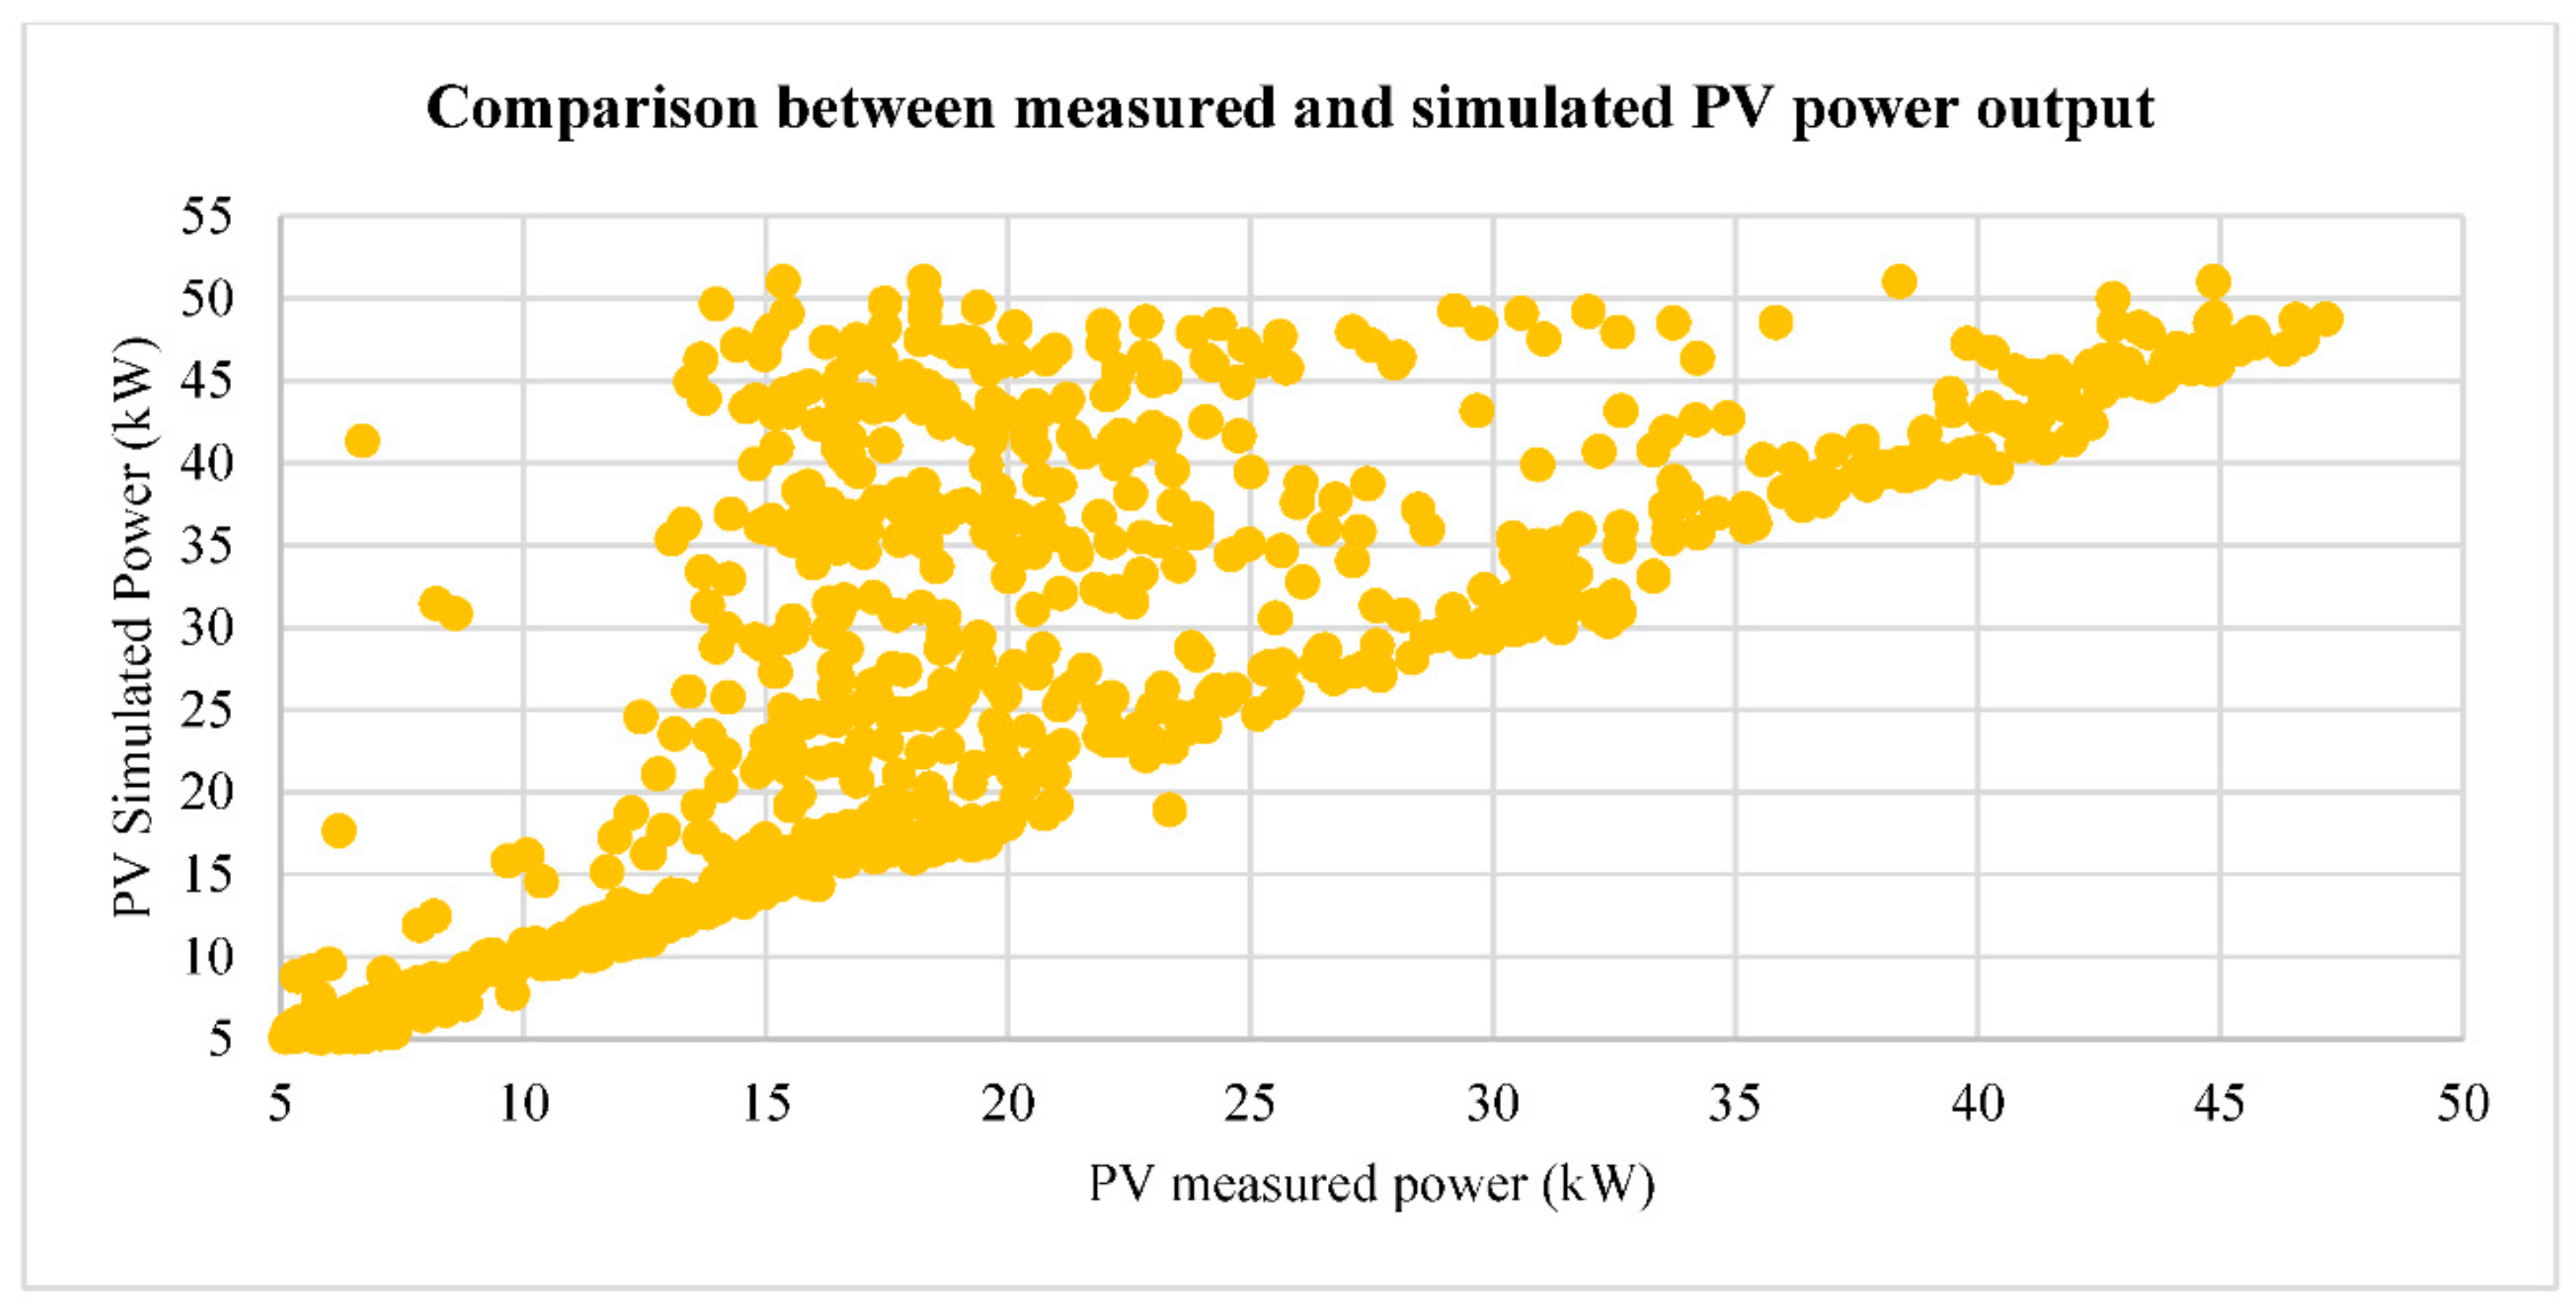
- Photovoltaic system.
- Converters.
- Batteries.
- Diesel Generators.
3.3. Analysis of Future Alternatives: Wind Generation
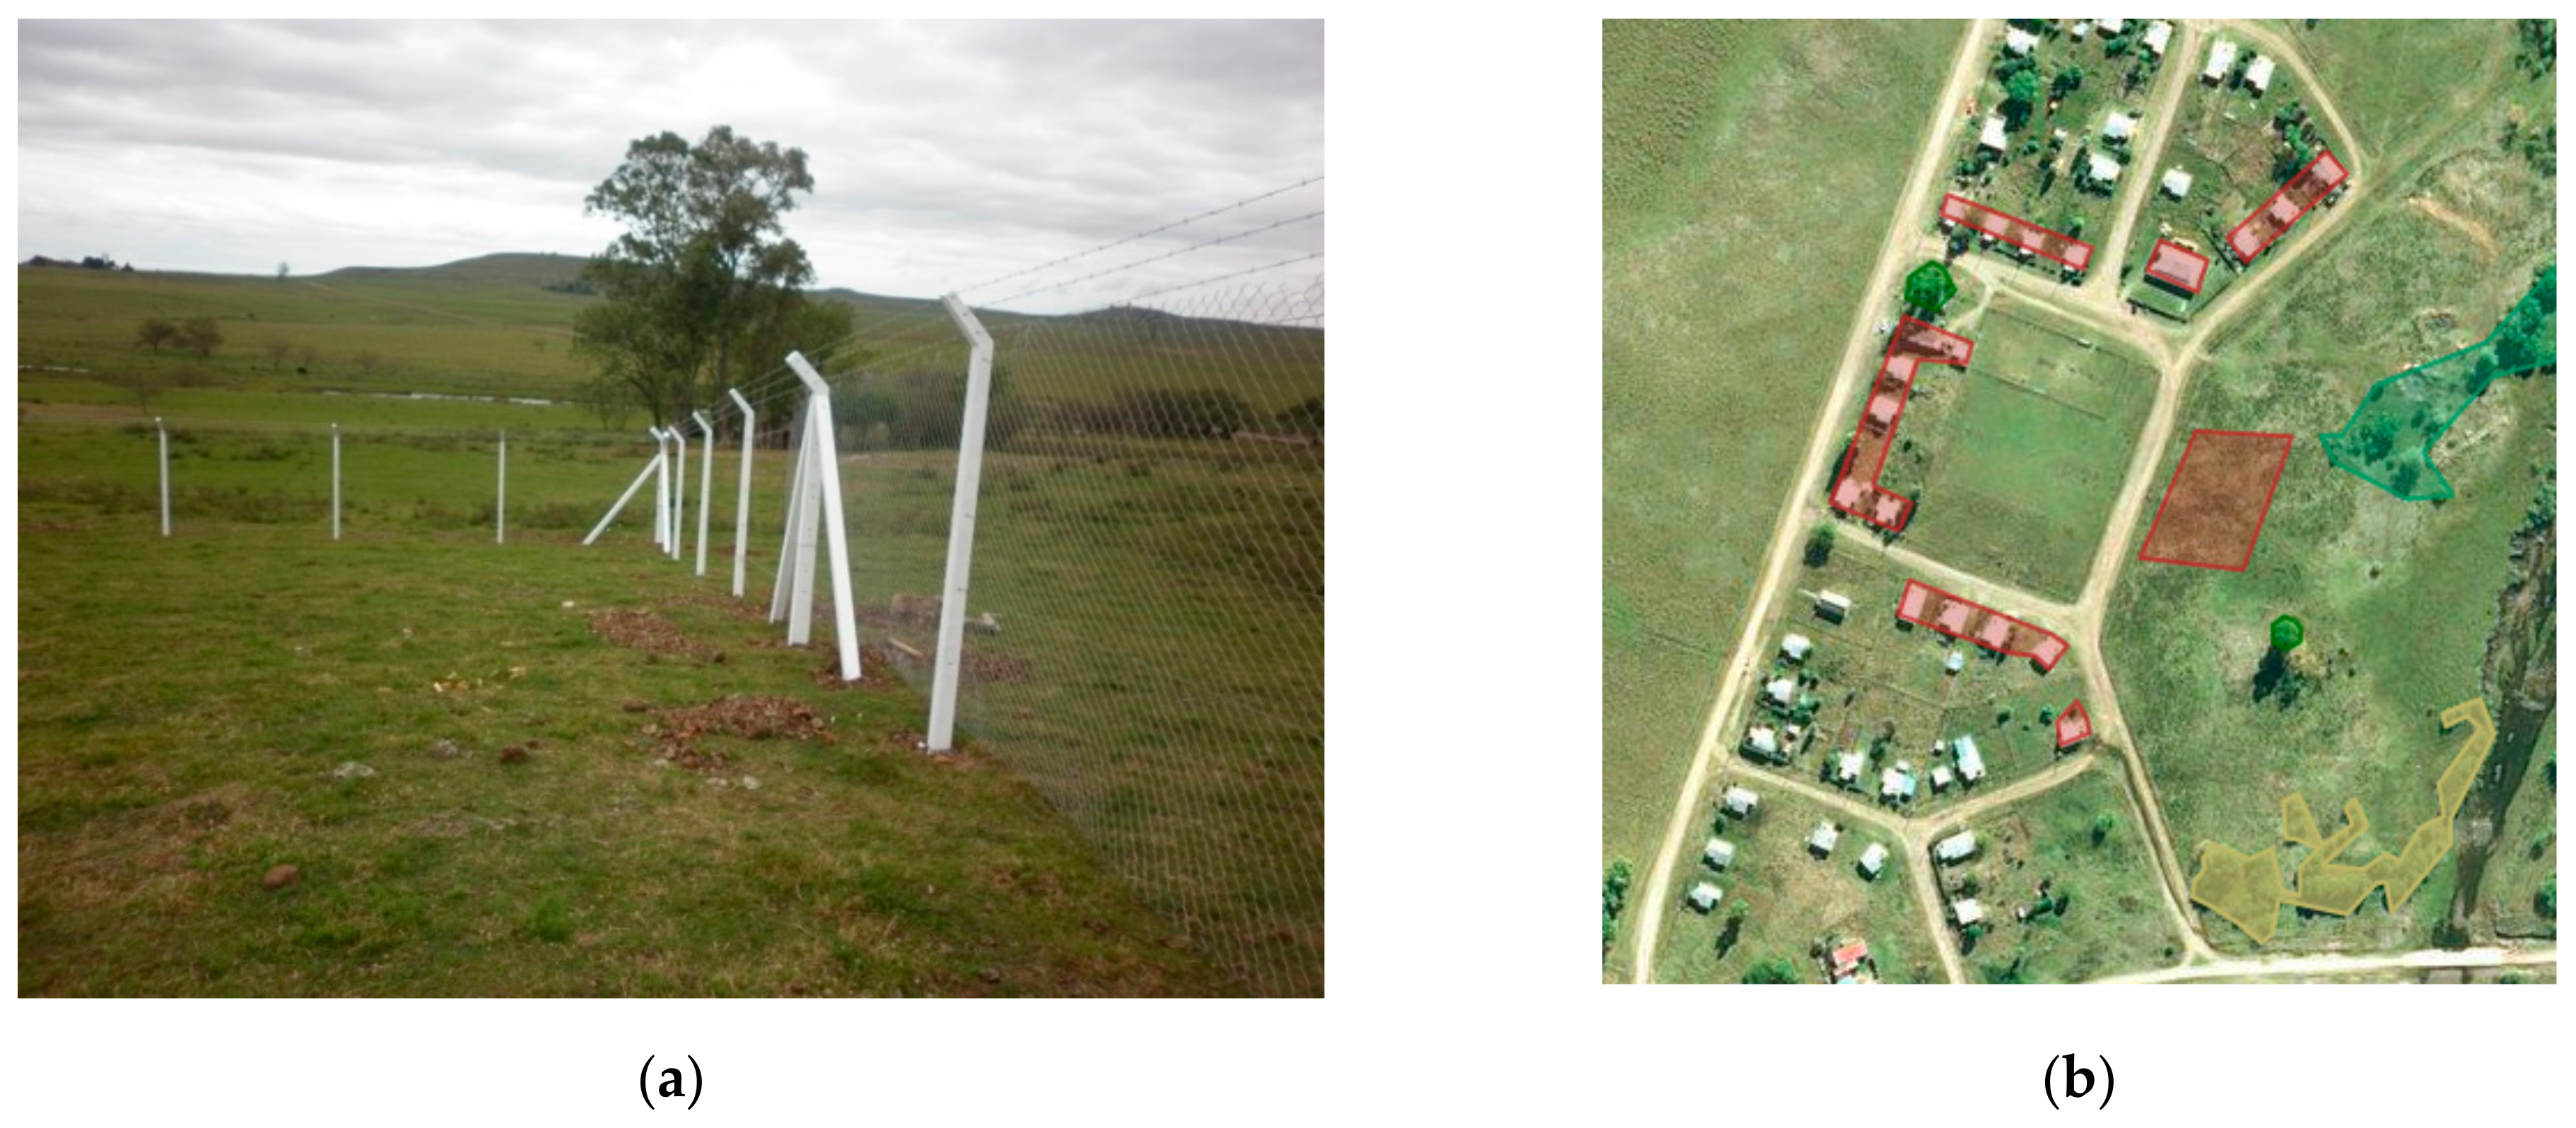
- Wind Turbine Site.
- Influence of Obstacles.
- Wind Resource.
- Wind Turbine.
- -
- Initial capital of 5000 EUR/kW for 10 kW turbines, 4000 EUR/kW for 30 kW turbines, and the costs are interpolated for the remaining sizes;
- -
- Replacement cost: it has been defined as 85% of the initial capital value;
- -
- Operation and Maintenance cost: a value of 45.5 EUR/kW has been assumed for 10 kW turbines and a value of 35.6 EUR/kW for 30 kW turbines. For the remaining sizes, it was obtained through interpolation.
- Results of the Simulation.
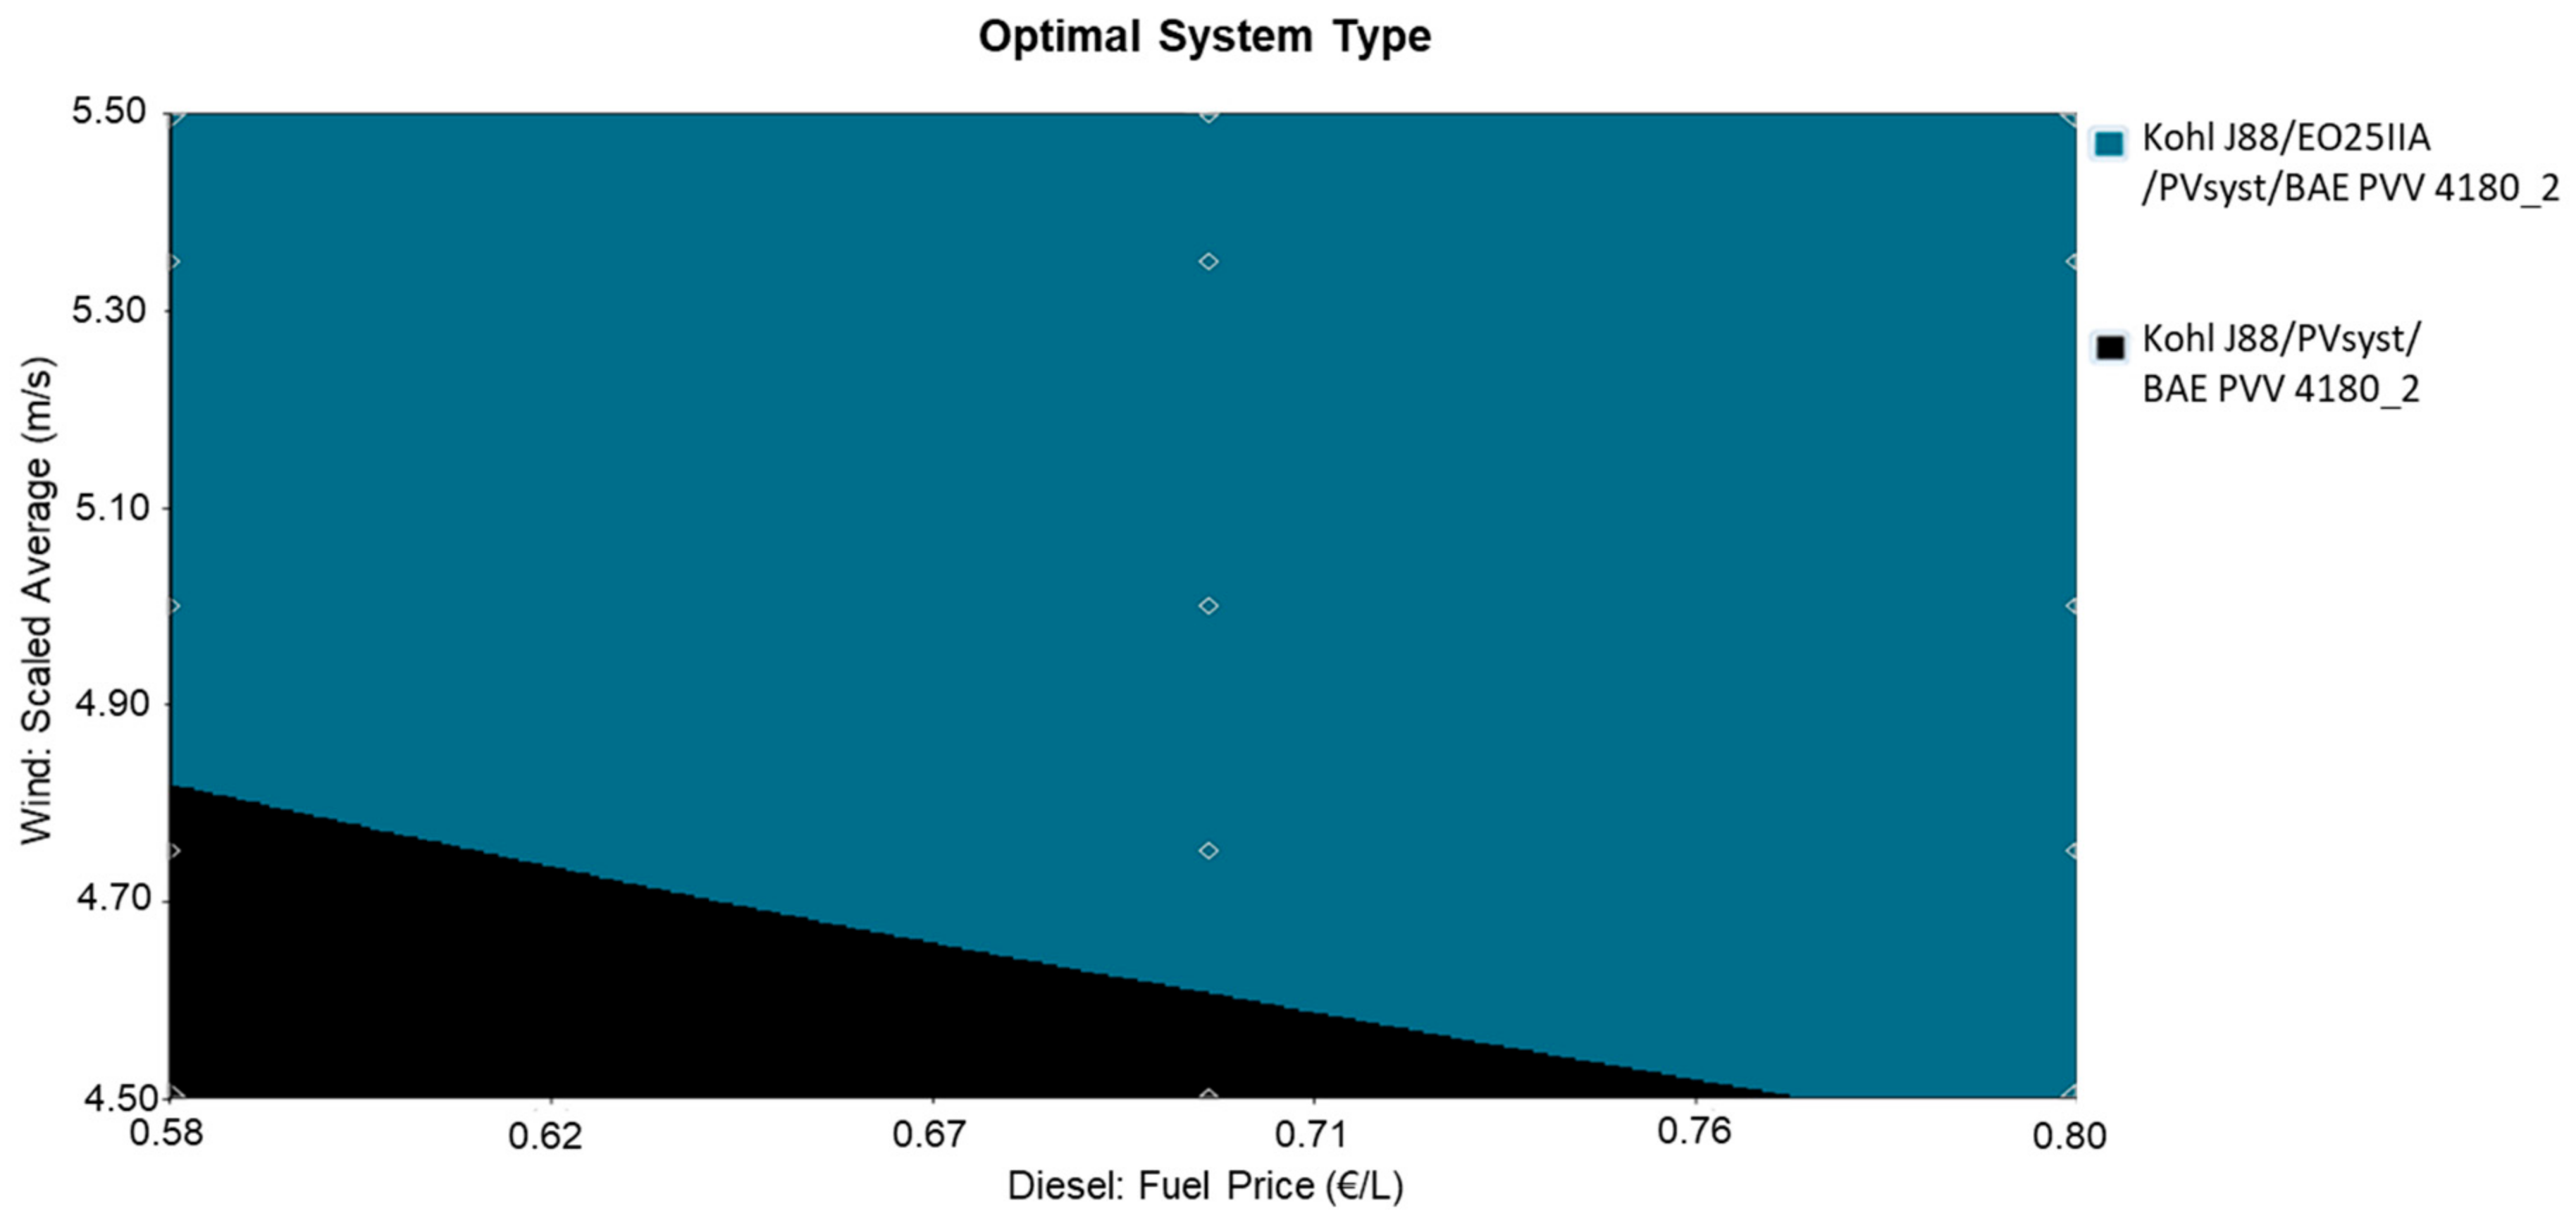
- A Sensibility Analysis.
4. Discussion
5. Conclusions
Author Contributions
Funding
Institutional Review Board Statement
Informed Consent Statement
Data Availability Statement
Acknowledgments
Conflicts of Interest
Appendix A. Pictures from the System under Study
References
- Baring-Gould, E.I.; Dabo, M. Technology, performance, and market report of wind-diesel applications for remote and island communities. In Proceedings of the European Wind Energy Conference, Marseille, France, 16–19 March 2009. [Google Scholar]
- Mazzeo, D.; Matera, N.; De Luca, P.; Baglivo, C.; Congedo, P.M.; Oliveti, G. A literature review and statistical analysis of photovoltaic-wind hybrid renewable system research by considering the most relevant 550 articles: An upgradable matrix literature database. J. Clean. Prod. 2021, 126070. [Google Scholar] [CrossRef]
- Lian, J.; Zhang, Y.; Ma, C.; Yang, Y.; Chaima, E. A review on recent sizing methodologies of hybrid renewable energy systems. Energy Convers. Manag. 2019, 199, 112027. [Google Scholar] [CrossRef]
- Bloomberg and SEforALL, 2020. State of the Global Mini-grids Market Report 2020. Available online: https://www.seforall.org/system/files/2020-06/MGP-2020-SEforALL.pdf (accessed on 3 July 2021).
- Empresa de Pesquisa Energética (EPE). Planejamento do Atendimento dos Sistemas Isolados; Empresa de Pesquisa Energética: Brasília, Brazil, 2014. (In Portuguese)
- ESMAP. Mini Grids for Half a Billion People: Market Outlook and Handbook for Decision Makers; World Bank: Washington, DC, USA, 2019. [Google Scholar]
- Johannsen, R.M.; Østergaard, P.A.; Hanlin, R. Hybrid photovoltaic and wind mini-grids in Kenya: Techno-economic assessment and barriers to diffusion. Energy Sustain. Dev. 2020, 54, 111–126. [Google Scholar] [CrossRef]
- Micangeli, A.; Del Citto, R.; Kiva, N.; Santori, G.; Gambino, V.; Kiplagat, J.; Viganò, D.; Fioriti, D.; Poli, D. Energy Production Analysis and Optimization of Mini-Grid in Remote Areas: The Case Study of Habaswein, Kenya. Energies 2017, 10, 2041. [Google Scholar] [CrossRef] [Green Version]
- Lopes, L.; Mauch, K.; Katiraie, F.; Arribas. L. PV Hybrid Mini-Grids: Applicable Control Methods for Various Situations; Report IEA-PVPS T11-07:2012. 2012. Available online: https://iea-pvps.org/wp-content/uploads/2020/01/rep11_07.pdf (accessed on 27 September 2020).
- International Electrotechnical Commission IEC 61724. Photovoltaic System Performance Monitoring—Guidelines for Measurement, Data Exchange and Analysis; Edition 1.0; International Electrotechnical Commission: Geneva, Switzerland, 1998. [Google Scholar]
- Hunter, R.; Elliot, G. Wind-Diesel Systems—A Guide to the Technology and its Implementation; Cambridge University Press: Cambridge, UK, 1994. [Google Scholar] [CrossRef]
- International Electrotechnical Commission IEC 62257-3. Recommendations for Small Renewable Energy and Hybrid Systems for Rural Electrification—Part 3: Project Development and Management; Draft Technical Specification Edition 1; International Electrotechnical Commission: Geneva, Switzerland, 2004. [Google Scholar]
- Baring-Gould, I. Successful Project Development. In Proceedings of the Wind-Diesel Workshop, Ottawa, ON, Canada, 1–2 June 2009. [Google Scholar]
- Clausen, N.E.; Bindner, H.; Frandsen, S.; Hansen, J.C.; Hansen, L.H.; Lundsager, P. Isolated Systems with Wind Power An Implementation Guideline; Risoe National Laboratory: Roskilde, Denmark, 2001. [Google Scholar]
- Small Wind Guidebook. Available online: https://windexchange.energy.gov/small-wind-guidebook (accessed on 27 September 2020).
- Bechmann, A.; Conti, D.; Davis, N.; Hansen, B.O.; Kelly, M.C.; Mortensen, N.G.; Nielsen, M.; Badger, J.; Pena Diaz, A. MyWindTurbine—Energy Yield Calculations; DTU Wind Energy: Roskilde, Denmark, 2016. [Google Scholar]
- IEA Wind. Task 27 Micro-Siting Small Wind Turbines for Highly Turbulent Sites; Expert Group Report on Recommended Practices, International Energy Agency: Paris, France, 2018. [Google Scholar]
- Brower, M.C.; Barton, M.S.; Lledó, L.; Dubois, J. Study of Wind Speed Variability Using Global Reanalysis Data. 2013. Available online: https://aws-dewi.ul.com/assets/A-Study-of-Wind-Speed-Variability-Using-Global-Reanalysis-Data1.pdf (accessed on 3 July 2021).
- Renewables Ninja Web Tool. Available online: www.renewables.ninja (accessed on 3 July 2021).
- ECMWF—Climate Reanalysis Web Page. Available online: https://www.ecmwf.int/en/research/climate-reanalysis (accessed on 30 September 2020).
- WAsP Homepage. Available online: https://www.wasp.dk/ (accessed on 29 September 2020).
- Weather Research and Forecasting Model. WRF Homepage. Available online: https://www.mmm.ucar.edu/weather-research-and-forecasting-model (accessed on 3 July 2021).
- EMD International. EMD-WRF Global On-demand Mesoscale Services ERA5, ERA-Interim, MERRA2 and CFSR. Technical note. 2017. Available online: http://help.emd.dk/knowledgebase/content/TechNotes/TechNote_6_EMD-WRF_On-Demand.pdf (accessed on 3 July 2021).
- Cruz, I.; Arribas, L. Small Wind Turbines. In Wind Energy THE FACTS; Routledge: London, UK, 2009. [Google Scholar]
- IRENA. Quality Infrastructure for Renewable Energy Technologies Small Wind Turbines. 2015. Available online: https://irena.org/-/media/Files/IRENA/Agency/Publication/2015/IRENA_QI_2_SWTs_2015.pdf (accessed on 3 July 2021).
- World Wind Energy Association. Quality Web Page. Available online: https://smallwind.wwindea.org/quality/ (accessed on 29 September 2020).
- Arribas, L.; Barquero, C.; Cruz, I.; Avia, F. The Small Wind Turbines Market in Spain. Available online: http://www.ciemat.es/portal.do?TR=A&IDR=1&identificador=852 (accessed on 3 July 2021). (In Spanish).
- myWindTurbine Homepage. Available online: https://www.mywindturbine.com/ (accessed on 29 September 2020).
- HOMER Energy. HOMER (Hybrid Optimization of Multiple Energy Resources) Homepage. Available online: https://www.homerenergy.com (accessed on 29 September 2020).
- Folkecenter; 2016 Small Wind Catalogue. Available online: http://folkecenter.eu/pages/Small-wind-turbine-catalogue.html (accessed on 3 July 2021).
- Orrell, A.C.; Rhoads-Weaver, H.E.; Flowers, L.T.; Jenkins, J.O.; Gagne, M.N.; Sahl, K.M.; Pro, B.H.; Baranowski, R.E. 2012 Market Report on U.S. Wind Technologies in Distributed Applications. Available online: https://www.pnnl.gov/main/publications/external/technical_reports/PNNL-22537.pdf (accessed on 30 September 2020).
- Woofenden, I. 2014 Wind Turbine Buyer’s Guide. In Home Power Magazine 161; Oregon, USA, 2014. Available online: https://www.scribd.com/document/481612016/hp-161-pdf (accessed on 30 September 2020).
- Sigrin, B.; Gleason, M.; Preus, R.; Baring-Gould, I.; Margolis, R. Distributed Generation Market Demand Model (dGen): Documentation; NREL/TP--6A20-65231; National Renewable Energy Laboratory: Golden, CO, USA, 2016. [Google Scholar]
- Zimmermann, J. Case study for CORAL BAY Energy modelling for a WIND DIESEL and stabilization hybrid system. In Proceedings of the Microgrid Deployment Workshop Fall, Barcelona, Spain, 20 September 2014. [Google Scholar]
- Arribas, L.; Bopp, G.; Lippkau, A.; Mauch, K. World-Wide Overview of Design and Simulation Tools for Hybrid PV Systems. Report IEA-PVPS T11-01:2011. 2011. Available online: https://iea-pvps.org/wp-content/uploads/2020/01/rep11_01.pdf (accessed on 27 September 2020).
- The World Bank. Designing Sustainable Off-Grid Rural Electrification Projects: Principles and Practices; The World Bank: Washington, DC, USA, 2008. [Google Scholar]
- Jacquin, P.; Ortiz, B.; Vallvé, X. Social, Economic and Organizational Framework for Sustainable Operation of PV Hybrid Systems within Mini-Grids. IEA PVPS Task 11, Report IEA-PVPS T11-05:2011. 2011. Available online: https://iea-pvps.org/wp-content/uploads/2020/01/rep11_05.pdf (accessed on 27 September 2020).
- UNDP. Wind Diesel Generation Systems for 10 Islands in the Chiloe Archipelago. UNDP International call for Proposals 023/2007. 2007. Available online: http://procurement-notices.undp.org/view_notice.cfm?notice_id=1193 (accessed on 3 July 2021). (In Spanish).
- MEASNET. Evaluation of Site-Specific Wind Conditions. MEASNET Procedure. Version 2. April 2016. Available online: https://www.measnet.com/wp-content/uploads/2016/05/Measnet_SiteAssessment_V2.0.pdf (accessed on 3 July 2021).
- Olsen, T.; Preus, R. Small Wind Site Assessment Guidelines. Technical Report NREL/ TP-5000-63696. September 2015. Available online: https://www.nrel.gov/docs/fy15osti/63696.pdf (accessed on 3 July 2021).
- Global Wind Atlas Homepage. Available online: https://globalwindatlas.info/ (accessed on 29 September 2020).
- POWER Project Homepage. Available online: https://power.larc.nasa.gov/ (accessed on 29 September 2020).
- Wind Navigator Homepage. Available online: https://aws-dewi.ul.com/software/windographer/windnavigator/ (accessed on 29 September 2020).
- Arribas, L.; Cano, L.; Cruz, I.; Mata, M.; Llobet, E. PV–wind hybrid system performance: A new approach and a case study. Renew. Energy 2010, 35, 128–137. [Google Scholar] [CrossRef]
- Shuttle Radar Topography Mission. WindPro Knowledgebase. Available online: https://help.emd.dk/mediawiki/index.php?title=Shuttle_Radar_Topography_Mission (accessed on 23 June 2021).
- Global Land Cover Characteristics. WindPro Knowledgebase. Available online: https://help.emd.dk/mediawiki/index.php?title=Global_Land_Cover_Characteristics (accessed on 23 June 2021).
- Eoclycle. EO25 Class IIA Wind Turbine. Specification Sheet. 2020. Available online: http://energieclub.weebly.com/uploads/1/1/6/7/11670442/eocycle-data-sheet-eo2512-may13.pdf (accessed on 30 September 2020).


| Barrier | Explanation | Comment |
|---|---|---|
| Wind resource quality | Wind resource is perceived to be insufficient. | See Section 2.1.3 (a), Section 2.1.4, Section 3.1 and Section 3.3. |
| Technological knowledge | Knowledge of wind technology and capacity for development is low. | See Section 2.1.3 (b) and Section 3.3. |
| Governance and regulation | Lack of framework for implementation of wind power. Additional regulatory requirements for wind projects. | Yes, it is misunderstood. That is why benefits must be clearly understood. |
| Cost of wind projects | The cost of wind power is perceived to be higher than PV. | It may reduce the system LCOE. |
| Community acceptance | Understanding and acceptance of wind technology varies. Issues related to noise, bird incidents, and sickness as a result of turbines. | In general, these issues are much more critical in large scale wind: Information campaigns might help. |
| Complexity wind projects | Wind projects are seen as more complex. Necessary data are not available. | See Section 2.1.3 (a) and (c), Section 2.1.4, Section 3.1 and Section 3.3. |
| Suitable technology | No suitable wind turbine exists. Low presence of local distributors or manufacturers. | See Section 2.2.1 (b). |
| Rated Power (kW) | Rotor Swept Area (m2) | Sub-Category |
|---|---|---|
| Prated < 1 kW | A < 4.9 m2 | Pico wind |
| 1 kW < Prated< 7 kW | A < 40 m2 | Micro wind |
| 7 kW < Prated< 50 kW | A < 200 m2 | Mini wind |
| 50 kW < Prated< 100 kW | A < 300 m2 | (No clear definition adopted yet) |
| Component | Difference (%) |
|---|---|
| Photovoltaic system | 4.8% |
| Converters + Batteries | 1.96% charge/2.94% discharge |
| Diesel Generators | 6.41% |
| Month | Jan | Feb | Mar | Apr | May | Jun | Jul | Aug | Sep | Oct | Nov | Dec | Annual Avg |
|---|---|---|---|---|---|---|---|---|---|---|---|---|---|
| Wind Speed (m/s) | 5.43 | 4.84 | 5.23 | 4.91 | 5.22 | 5.44 | 5.48 | 6.03 | 5.45 | 6.07 | 5.34 | 4.65 | 5.35 |
| Wind Turbine | Power (kW) | Hh (m) | Initial Capital (EUR) | Replacement Cost (EUR) | O and M (EUR/year) | System LCOE (EUR/kWh) |
|---|---|---|---|---|---|---|
| Bergey Excel 10 | 10 | 30 | 50,000 | 42,500 | 445.00 | 0.373 |
| Gaia Wind 15 | 15 | 30 | 67,500 | 57,375 | 600.75 | 0.353 |
| Eocycle E20 | 20 | 23 | 80,000 | 68,000 | 712.00 | 0.322 |
| Ecocycle 25 | 25 | 23 | 87,500 | 74,375 | 823.25 | 0.320 |
| PitchWind | 30 | 30 | 90,000 | 76,500 | 801.00 | 0.332 |
| Case | NPC (%) | LCOE (EUR/kWh) | Fuel Consumption (L/year) | Renewable Fraction (%) |
|---|---|---|---|---|
| Existing | 100% | 0.370 | 33,812 | 27.6 |
| With wind | 94.9% | 0.320 | 16,717 | 64.2 |
Publisher’s Note: MDPI stays neutral with regard to jurisdictional claims in published maps and institutional affiliations. |
© 2021 by the authors. Licensee MDPI, Basel, Switzerland. This article is an open access article distributed under the terms and conditions of the Creative Commons Attribution (CC BY) license (https://creativecommons.org/licenses/by/4.0/).
Share and Cite
Arribas, L.; Bitenc, N.; Benech, A. Taking into Consideration the Inclusion of Wind Generation in Hybrid Microgrids: A Methodology and a Case Study. Energies 2021, 14, 4082. https://doi.org/10.3390/en14144082
Arribas L, Bitenc N, Benech A. Taking into Consideration the Inclusion of Wind Generation in Hybrid Microgrids: A Methodology and a Case Study. Energies. 2021; 14(14):4082. https://doi.org/10.3390/en14144082
Chicago/Turabian StyleArribas, Luis, Natalia Bitenc, and Andreo Benech. 2021. "Taking into Consideration the Inclusion of Wind Generation in Hybrid Microgrids: A Methodology and a Case Study" Energies 14, no. 14: 4082. https://doi.org/10.3390/en14144082
APA StyleArribas, L., Bitenc, N., & Benech, A. (2021). Taking into Consideration the Inclusion of Wind Generation in Hybrid Microgrids: A Methodology and a Case Study. Energies, 14(14), 4082. https://doi.org/10.3390/en14144082